
Submitted:
27 February 2023
Posted:
28 February 2023
You are already at the latest version
Abstract
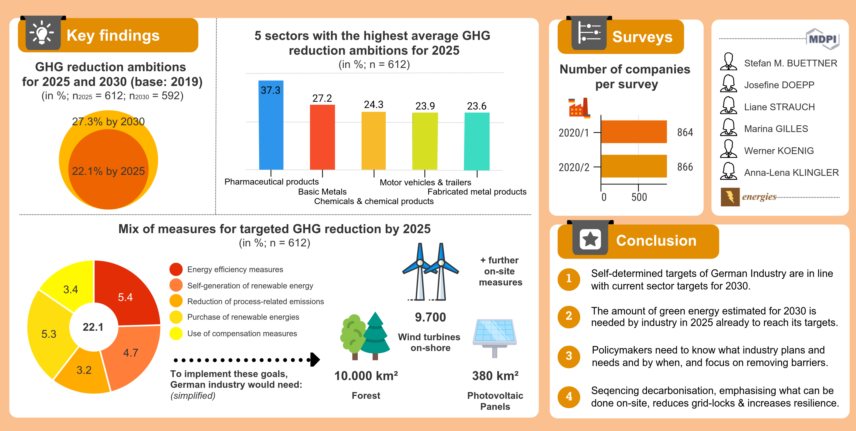
The quickest and easiest way to avoid greenhouse gas (GHG) emissions is to purchase renewable electricity and offset the remaining emissions. However, the industrial sector’s electricity needs already exceed renewable electricity generation. Moreover, electricity accounts for only one third of the industry’s energy needs. Simultaneously, the advance of sectoral coupling and the decarbonisation of industrial processes, as well as the desire to rapidly decrease dependence on fossil fuels, are creating significant additional demand for renewable energy. Neither existing nor planned generation and transmission infrastructure will suffice to meet the expected short-term demand. Based on survey data from the German Industry Energy Efficiency Index, this article therefore examines the share of GHG savings that companies intend to achieve on- and off-site. Understanding how much additional generation and transmission capacity is needed by the industry to decarbonise and by when is crucial to identify and address the extent of excess demand. On average, companies plan to avoid 22 % of their 2019 emissions by 2025 and 27 % by 2030, primarily through on-site measures. In combination with the extrapolation of the entire industry’s needs for off-site capacity, the data calls for a rapid expansion of planning authority and green generation capacities.
Keywords:
decarbonisation
; energy supply security
; energy demand
; energy systems
; industry
; capacity planning
1. Introduction
1.1. Background
Over the past few years, an increasing number of countries and non-state actors, such as local authorities, cities, financial institutions and companies have declared their intention to eliminate their carbon (CO2) or even Greenhouse Gas (GHG) footprint to an extent at which they have reached “net-zero”, a state where remaining, respectively unavoidable emissions are balanced out with means of compensation or removal [1-4]. Back in 2015, numerous initiatives formed on all levels to coincide with the Paris Climate Agreement [5]. More than 2000 companies, for instance, allied in the Science Based Target Initiative (SBTi) to strive for the 1.5° C goal [2]. Simultaneously, the European Commission launched the Horizon 2020 funding Programme. Among other projects, the programme enabled the creation of the NetZeroCities (NZC) initiative to assist cities in their transformation to climate neutrality [6] and, more recently, also the Covenant of Companies for Climate and Energy (CCCE) “seeking to help European companies to transition to the net zero economy”[7].
For the process of decarbonisation, a variety of measures can be applied to achieve the goal set (i.e. net-zero GHG emissions = climate neutrality). Decarbonisation strategies are quite individual in their composition, as they largely depend on the specific circumstances, decision criteria, the envisaged scope and timelines, as well as the underlying motivation. Furthermore, they also often depend on geographical aspects [8].
The types of measures at hand can be divided in three major categories: Reduction measures (energy efficiency, resource and material efficiency, process emission reduction), substitution measures (self-generation or purchase of renewable energies) and compensatory measures (emission allowances, certified emission reductions (CERs), climate protection projects; Carbon Capture, Storage and Use (CCUS), as well as, Direct Air Carbon Capture and Storage (DACCS))[9].
Buettner and Wang [9] (pp. 5-10, 14-15) assess each category of measures in respect to their one-off, and ongoing effects, both in relation to economic (investment and operational costs), energy-related (effect on energy-demand, need to acquire energy from external sources), and emission-related matters (effect on emissions output). They come to the conclusion that, in the short-term, it only appears quickest, easiest and cheapest to focus on the purchase of clean energy and compensate all remaining emissions [9](p. 12). Recent data from the 2021/2022 winter survey of the Energy Efficiency Index of German Industry (EEI)[10] indicates that 78 % of manufacturing companies want to decarbonise their Scope 2 emissions (in-direct emissions from the energy purchased). Moreover, 77 % of companies want to address their Scope 1 emissions (direct emissions arising from their vehicles and activities on their premises, energy- and process related) and 75 % also want to address their Scope 3 emissions (in-direct emissions of the up- and downstream supply chains)[11]. Considering that, if each part of the supply chain addressed its Scope 1 and 2 emissions, there would be hardly any Scope 3 emissions left, and given the large risk of double counting of emissions [11], this article is focussing on Scope 1 and 2 emissions only. As the EEI data points out, not merely more companies are opting for a Scope 2 emission reduction, but they are also more advanced in the implementation process. However, one must also acknowledge the industry’s overall electricity and energy demand in conjunction with Germany’s green/clean energy generation capacities [12], as well as the current price hikes [13,14]. In addition, supply uncertainties [15] along with warnings of a potential gas rationing [16-23] and of electricity demand overshoots in the industrial centres [24] make it quite clear that simply switching to another energy tariff might be easier said than done. What would be the price and how would it impact companies’ resilience?
For several years, the primary path pursed in context of the energy transition was the integration of power sectors, meaning the gradual electrification of all energy-users and their supply with green (or clean) energy [25]. Where not feasibly, power-to-x (P2X) should not only be applied to store electricity but also, for instance, to convert it into hydrogen, allowing one to substitute natural gas needs [25-27]. Nonetheless, the issue with this proposition is that with each conversion there are conversion losses [28], making the clean substitute fuel much pricier and less efficient than the status quo – on top of an insufficient renewable electricity generation capacity.
To put this in context, in 2019, the German Industry consumed about 35 % of its energy in the form of natural gas, 10 % in coal and 6 % in oil products. Combined about 1.5 times as much as the industry’s electricity consumption (34 %). Nevertheless, already back then, industry accounted for 45 % of Germany’s final electricity demand (as well as for 35 % of Natural gas, 4 % of Oil products and 88 % of Coal, peat and oil shale consumption) [12]. Another obstacle is that each source of energy has its “sweet spot”, which refers to a purpose for which it is the most effective energy carrier [28]. For example, if one compares E10 fuel to standard fuel, the amount needed to cover a distance of 100km is usually higher due to the difference in the calorific values of the fuels (as ethanol provides a bit less energy than pure petroleum)[29]. Similar to this, depending on the type of process and the temperature needed, a combustion may achieve the desired outcome with less energy input (or the other way around). If one uses a P2X gas or hydrogen, the energy balance may be even worse (due to the conversion losses in its creation from green electricity), which is why, at present, electricity that could otherwise not be fed into the grid and would be lost is the “best energy source” for P2X gas or hydrogen. This example underlines that there is no easy solution to decarbonising the industry’s energy needs, particularly considering that about two thirds of it are process heat (and cold) [30].
The expansion of renewable energy generation is much behind schedule and far away from (i.e.) providing 80 % of Germany’s electricity via renewable sources in 2030 [31,32]. An important reason for this situation is that it takes on average 6 – 8 years for a wind turbine to go online from planning to energy generation, due to bureaucratic planning rules and processes as well as capacity issues. Additionally, disputes with individuals and initiatives, long-lasting court cases and similar obstacles contribute to the much too slow progress on expanding the capacity and number of transmission lines and interconnectors [32]. Apart from increasing capacity, the latter expansion would also increase the robustness, resilience and effectiveness of the overall grid and avoid surplus generation from being wasted and surplus loads from being shed. Essentially, these efforts have the potential to also lower spot market prices as demands could be served easier and with less barriers.
1.2. Are the forecasted needs realistic?
Another issue concerns how the required energy, notably the electricity baseline, is actually determined and on what basis. If the 2019 configuration was to serve as a baseline, increasing efficiency measures would reduce the overall electricity demand and therefore automatically lead to an increase of the share of renewable energy in the mix. However, if one intends to simultaneously switch substantial parts from the transport sector (share of electricity in 2019: 2 % [12]) to for instance 15 million electric vehicles, the electricity needs for the transport sector would increase fivefold (from 12 to approx. 60 Terawatt hours TWh [33]) and could already eat up much of the energy efficiency savings across all sectors. If, at the same time, heat pumps were replacing gas, oil and coal based heating systems, the electricity demand would grow by another 10 % (from 270 to 298 TWh) [33]. EWI estimates that the electricity needs of industry would grow by 21 % (from 218 TWh to 263 TWh) and the envisaged electrolyser capacity (10 GW to produce 20 TWhth Hydrogen) for 2030 would require about 29 TWhel [33](p. 5).
In late 2019, the chemical industry giant BASF estimated that decarbonisation of operations at their German Ludwigshafen site via electrification would probably triple its annual electricity demand (6.4 TWh), which already represents 1 % of Germanys overall electricity demand [34]. The chemical industry overall would need four times as much electricity as before [35]. In 2020, BASF announced the assessment of the CO2-footprint of all its sales products [36]. Moreover, in2022 it first participated in tenders for offshore windfarms to support its goal of switching its 2021 power needs to fully renewable electricity by 2030, allowing them to reduce their GHG footprint by 25 % by 2030 [37]. Next, BASF started construction of the “first demonstration plant for large-scale electrically heated steam cracker furnaces” that would allow it to reduce the emissions of one of the most energy-intensive processes (and foundation of many basic chemicals) by about 90 % [38]. Nevertheless, this emission reduction would come at the cost of additional electricity needs (as indicated). Not all close to 200.000 manufactures pace ahead with this speed, but what would happen if this was the case? Even though BASF is a large company in one of the most energy intensive sectors [30], there is also the steel industry, which estimates that about 12,000 wind turbines would be necessary to generate sufficient electricity to produce hydrogen for green steel [39,40]. Also, further companies in this and other sectors, i.e., ArcelorMittal (steel), Covestro (chemicals), Opterra (cement), are taking a lead to ensure “their” green power needs en route to net zero emissions are served [41-43].
Assessing the required additional renewable energy capacities to switch from fossil fuels to renewables is one thing, another to switch it to the right form (i.e. gas to electricity) and yet another to decarbonise process-related emissions. The latter may require a completely different process technology that by itself may emit less, but could need different amounts of energy. Therefore, assessing the required clean energy needs gets harder layer by layer. It is thus essential to gain an understanding of how much renewable energies are actually needed, where, and roughly when to sync the capacity planning with the decarbonisation progress.
These roadmaps, however, do not necessarily reflect what is actually planned by energy consumers, where, and by when. Considering the industry accounts for nearly half of Germany’s 2019 electricity consumption, this article therefore proposes that an estimation of short to medium-term renewable energy demands should be made on the basis of what companies plan to do (cf. the 78 % of manufacturers that are planning to decarbonise their energy-demand). To illustrate and facilitate such an estimation, this article will analyse data from about 850 manufacturing companies, after the beginning of the COVID-19 pandemic in 2020 and explain (1) what share of their 2019 greenhouse gas (GHG) emissions companies aim to decarbonise by 2025 and (2) by which means. Further, it will introduce (3) the concept of the “decarbonisability-factor”, (4) showcase what additional savings ambitions are envisaged for 2030 and (5) explain what implications arise from this for policymakers, financiers, the energy-sector as well as for society. Hence, the article will also (6) provide an estimation of the impact and associated needs if companies were to implement their 2025 ambitions as indicated in the EEI and, (7) lastly, it will provide a mechanism that could ease the energy system and decarbonisation capacity planning in respect to the industrial sector and thus “increase the voltage – through sequencing decarbonisation with green power and energy efficiency”.
2. Materials and Methods - Methodology
The observations and ideas presented in this article originate from a combination of quantitative and qualitative data. The qualitative elements are drawn from professional interactions with manufacturing companies in Germany in the context of decarbonisation. In conjunction with professional press and work on committees, they highlight potential weaknesses and oversights concerning energy efficiency and decarbonisation, as well as companies’ resiliency in the energy- and climate crisis. The assumptions arising from this were then consecutively tested within the framework of the Energy Efficiency Index of German Industry (EEI). The EEI was introduced in 2013 and focuses on views, needs, opinions, observations and experiences of all kinds (size, sector, energy intensity) of manufacturing companies in Germany [44].
The EEI data this article draws from is comprised of 864 observations gathered in May 2020 [45], which was in-midst of the first wave of the COVID-19 pandemic in Germany, and 866 observations gathered in November 2020 [46].
Each of the EEI’s semi-annual data collections has a specific focus on selected current issues. The 1st and 2nd data collection in 2020 looked at a series of issues around the topics of decarbonisation and energy, notably in regard of Germany’s climate and energy goals [32]. In total, around 20 questions were posed to participants of the EEI. They survey requested information on, for instance, their sector, revenue, number of employees and energy consumption, but also on a half-dozen thematic questions, such as the intended GHG reduction goals for 2025 and 2030, as well as on with which proportions of measures they aim to achieve these self-determined goals. The data collection was carried out using a mixed methods approach, combining online (7 %) and telephone surveys (93 %). Achieving an even distribution across the 27 manufacturing sectors that represent 198,000 companies was desired, but difficult to achieve. ‘Core industries’[1] were defined to aid focusing the telephone survey. The target was to recruit at least 24 companies per core industry for participation. The automotive sector and the machinery & equipment sector are two of a total of eleven core sectors of the German industry. For the sectoral analyses in this paper, only sectors are taken into account in which at least 20 companies provided answers to the respective question(s) [44] (p. 4).
Table 1 depicts what percentage of a sector's total population (number of companies) participated. The percentage may seem to be greater than 100 % in very small sectors, such the “crude petroleum and natural gas” sector (06). In this case, all 13 responses refer to specific sites instead of each representing an entire company.
The results of micro sectors (N < 10) are considered (‘**’) if more than 50 % of the sector participated in this study, while the results of small sectors (10 ≤ N < 100) are taken into account (‘*’) if at least 15% of the sector participated [44] (p. 4).
3. Results
The wish to take decarbonisation actions has increased considerable since 2019 [44]. The reasons why stakeholders are pursuing decarbonisation efforts are plentiful: increasing emission pricing, skyrocketing energy prices following the war in Ukraine, as well as severe weather events that threaten both the resilience and the output of the energy system. Along with other shocks, such as disrupted or vulnerable supply chains, they further feed the desire to increase the resilience of a company. [9,47]. Decreasing dependence on these risk factors or diversifying risks can help reduce pressure on either a systems level (i.e., energy generation and grid infrastructure, origin of fuels) or on an individual level (i.e., reducing the demand, circularity thinking, local sourcing, self-generation of energy, energy storage)[9] (pp. 12-15). Since decarbonisation roadmaps are based on an initial assessment of the status quo and shape the path to achieve a certain outcome at a certain point in time, they are (a) often linear in their growth plan. Moreover, they (b) may lose their predictive power if some foundational factors change, demonstrating the difficulty of forecasting on the basis of past development patterns (i.e., technology disruption or fundamental change of process technology), and they are (c) dependent on the appropriate framework conditions being in place to facilitate the transformation (i.e., planning permission, legal framework, time from decision to going operational). Nevertheless, despite the value of technology roadmaps and system scenarios, what the end users actually plan to do, where, and by when, as well as what they may need to “pull it off” or which possibly marginal bottleneck is in the way of achieving this goal remains a black box. Hence, this article aims to assist in turning on the light in this black box.
Based on data of the 2nd Energy Efficiency Index of German Industry, Buettner et al. [44] found that already in late 2019, ahead of the COVID-19 pandemic, the war and the energy crisis, there was a strong ambition to pursue the path of decarbonisation. Nearly 60 % of the participating companies (of all sizes, sectors and energy-intensities) indicated to work towards net-zero emissions (p. 13). Of these, about two thirds indicated that they target achieving net-zero by 2025 (about a third of these in 2025 alone), which is equivalent to about 40 % of all participating companies. Further target year peaks were found for the semi-decades 2030, 2035, 2040, 2045 and 2050 (pp. 15-16). Simultaneously, the concern rose that this desire would most likely be cooled off by insufficient capacities in various areas needed for the implementation of companies’ plans. Alerted by this situation, the first iteration of the Energy Efficiency Index of German Industry in 2020 (EEI) was tasked to establish:
- a)
- Whether industry indeed structures decarbonisation in 5-year plans (or in short-term plans “to get it over with”),
- b)
- what motives companies to decarbonise,
- c)
- on which basis they take their decarbonisation decisions and most importantly,
- d)
- by how much they plan to reduce their Greenhouse Gas emissions by 2025 and
- e)
- by which means (in respect to 2019 as the last full business year, which today often serves as base year, given that it was the last “normal” year before the pandemic and the war hit).
In consideration of the research question, this article will focus on addressing (a), (d) and (e). (b) and (c) are addressed in detail by Buettner et. al [48] and Buettner and König [49].
3.1 What are companies’ ambitions for this decade?
As the industry is very diverse there cannot be a one-size-serves-all approach [44]. The range of possible interventions in different areas is vast and quite likely much broader than in other parts of the economy [9]. Sometimes commonalities can be found across company size, sometimes in respect to the level of energy-intensity, or most intuitively in respect of the sector. Therefore, this section zooms in on these perspectives, while also providing insights on the overall average outcome of the sample. A drop in ambition levels compared to the 2nd data set of EEI in 2019 was expected, primarily because of the impact of the COVID-19 pandemic, but also because of the difference between asking for a net-zero year and asking for a specific GHG reduction level (distinguishing between marketing goal and estimate by when what can be achieved).
3.1.1. What is the bandwidth of ambitions?
The largest differences can be observed when looking at the targets of sectors from which sufficient amounts of companies participated in this question. It stands out, that the wood, cork (16) and furniture (31) industries set the least ambitious targets, while many companies of the pharmaceutical industry (21) and the basic metals industry (24) set more ambitious targets. Nonetheless, the spread of companies’ goals is also the widest in these sectors (cf. Figure 1).
Due to the increasing pressures imposed on the supply-chain to also “do their part” and reduce
the embedded emission footprint of pre-products [8] (pp. 11-12), it is not surprising that the more
ambitious half of companies, set themselves more ambitious goals (cf. Figure 1, area to the right of/
above the median). Specifically, the upper whisker of the basic metals industry is 15 %-points higher.
However, the less ambitious half of all companies is nearly on the same level. This dynamic holds
true to some extent (unless otherwise stated) for most dimensions showcased so far, meaning that
most differences can be seen among the more ambitious halves of companies in their respective
dimensions (above the median).
Buettner et al. further analyse how the GHG reduction ambitions vary depending on what
primarily motivates a company and based on which determinants the decarbonisation mix is decided
upon [8,48].
The question that arises (and which was mentioned earlier) is whether companies have, in
principle, picked up their pace in pursuing decarbonisation, which would be reflected in a steadily
growing decarbonisation goal. Thus, one must observe whether the growth rate of ambition increases
further or flattens after meeting the short-term goals. To facilitate answering this question, the 2nd
iteration of the EEI in 2020 asked for companies’ GHG reduction targets for 2030. Even though panel
data would have been preferred to get the answers for both dates from the same (set of) companies,
the situation should be sufficiently homogenous to permit the comparison within their subcategories.
3.1.2. How do the targets for 2025 and 2030 differ?
Looking at Table 2, the data confirms the assumption that average GHG reduction goals of companies differ considerably depending on their sector. Only sectors with at least 20 companies responding to this question in both data collections are listed in the table to limit random outcomes. Although the data sets are not equivalent to panel data, the share of returning participants was about 38 % in both data collections. With a 22.1 % reduction, the sample’s average overall GHG savings ambition for the year 2025 appears quite considerable. However, looking at the sample’s goal for 2030, one can observe that within the “first” half of the 2020s (2021-2025), companies aim to achieve an average of 4.4 % GHG savings per year, but for the second half of the 2020s (2026-2030) the additional ambition only amounts to another 1.1 % GHG savings per year
This highlights two possible explanations: Companies either want to address the issue heads-on and then put it on the back burner or their planning horizon does not permit them to estimate precise percentage goals for a year further ahead in time. Furthermore, there are also substantial differences on a sectoral basis. The goals of the rubber & plastics, automotive and oil & natural gas industries increase substantially for the second half of the decade. Perhaps this divergence is due to the timespan required for sophisticated changes in process technology and for arising benefits to kick-in. On the other end of the spectrum, the ambitions of the pulp & paper, chemical and basic metals sectors remain on roughly the same levels also for 2030. One possible explanation for the latter point is that all three sectors are among the most energy intensive ones, depending largely on gas. Subsequently, they may require a sufficient and reliable supply of hydrogen to achieve higher GHG savings. As for these sectors, the biggest gains appear to be only feasible via green hydrogen. For all sectors listed (apart from rubber & plastics), it is true that the growth of their decarbonisation ambitions appears to follow a limited growth function.
While, from a political perspective, it may be challenging to imagine how an almost 5 % GHG reduction per year could be at all feasible, from a company viewpoint such a target figure is not unheard-of: The Science-based Target Initiative reported, for instance, that 338 companies in their analysis “collectively reduced their annual emissions by 25% between 2015 and 2019 – a difference of 302 million tonnes, which is equivalent to the annual emissions of 78 coal-fired power plants. This is true leadership and differs markedly from the global trend: over the same five-year period, global emissions from energy and industrial processes increased by around 3.4%.”[50]
3.2. What mix of measures do companies plan to apply to achieve their 2025 goals?
To serve the overall goal of this article – to assess what is needed by when and by whom – this section is factoring in the mix of measures with which companies would like to achieve their GHG reduction targets for 2025.
Buettner and Wang [9] illustrate in detail the merits of different measure types for decarbonisation. These can, in principle, be sorted into two dimensions:
- What the measures “do”: reduction measures save energy, resources and process emissions; substitution measures replace fossil energy sources with renewable energy sources; compensation measures do not avoid the emission but prevent them either from causing harm or compensate their effect by alternative means.
- Where the measures “take place”: Measures that can be implemented on-site (energy efficiency measures, self-generation of renewables or process decarbonisation) give the company more control and also address the desire for resilience from hikes in energy, resource and emission price. Off-site measures refer to the purchase of renewable energy and any type of off-site compensation. Off-site measures have in common that the company depends on someone else in respect to availability and prices. They cement the status quo in terms of resiliency or, in terms of compensation, increase dependence on a steady stream of viable compensation projects at a potentially increasing price and also the risk of bad press [51].
Figure 2 highlights how the 22.1 % average savings ambition is disaggregated by measure type. It emerges that at the time of the data collection, companies embraced the notion of “efficiency first” (5.4 % percentage points of goal), yet this was closely followed by the notion “purchase of renewable energy” (5.3 %) and “self-generation of renewable energy” (4.7 %). This illustrates that renewable energy is supposed to contribute 10 % points overall to achieving the target. Considering that process decarbonisation can be quite complex and does not necessarily lead to energy savings, it is not surprising that a slightly higher proportion is attributed to compensatory measures (3.4 % vs. 3.2 %). In summary, companies intend to achieve on average 60 % of their targets through measures implemented on site (highlighted bold in Figure 2).
Irrespective of a company’s sector, the average proportion of intended on-site measures is between 55 – 67 % of the company’s envisaged goal (cf. Figure 3. GHG reduction target for 2025, broken down by measure option [in %], by sector (n ≥ 20). However, depending on the specifics of the sectors, the proportions may differ. For instance, the role of energy efficiency measures is smaller in the oil & gas as well as the mining sector, while renewable energy sources play a much larger role there. This is quite likely due to the type of machinery and vehicles used and due to the savings, that can be achieved via these activities in terms of emissions.
3.3. Putting industry’s GHG saving goals in political context
The previous sections have provided insights on the spread and the average GHG reduction ambition. They also highlighted in general terms with which overall types of measures companies aim to achieve their goals. From other studies, we have learnt that the set goals are not unrealistic to achieve from a company perspective [2,50]. What we have not yet established is what these 22.1 % and 27.3 % targets actually mean. While using a recent “normal” business year (often 2019) as a basis makes sense from a business perspective, political targets usually refer back to another base year, 1990 [52].
In order to compare political and industry targets, it is necessary to identify the amount of GHG emissions the companies in the sample emitted in 2019. For the moment we take the simplifying assumption that the sample is fairly representative of the industrial sector in Germany. In 2019, the German industry emitted circa 187 million tonnes of CO2-equivalents. In 1990, the industry’s emissions where at 284 million tonnes [53]. If the percentage goals for 2025 and 2030 were to be applied, the 187 million tonnes emitted in 2019 would be reduced by 22.1 / 27.3 %, which corresponds to 41 / 51 million tonnes (cf. Table 3). Subtracting these reductions from the 2019 emission leads to the remaining emissions for 2025 and 2030 respectively. The prospected 2025 and 2030 emissions then allow one to determine the targeted percentage reductions compared to the common policy base year of 1990. It is remarkable that this percentage is almost on the same level as Germany’s overall emission reduction target for 2030 at the time of data collection, which was - 55 %[54]. Nevertheless, the goal has since been increased to 65 % [32]. If this goal was applied across the board, it would lead to a reduction down to 99 million tonnes by 2030. However, as of mid-2021, the sector targets under the climate protection act list 140 million tonnes of remaining emissions as the target for the industrial sector. In other words, if the industry reached its self-determined targets for 2030, it would already meet Germany’s current sector targets for 2030 (cf. Table 3).
The implications from this are considerable for two reasons: Firstly, numerous articles and studies have highlighted that the climate change targets will be difficult to meet at the current pace of action [32]. With the goals determined, industry sets a strong-self-determined signal. Accordingly, policymakers should focus on ensuring that the industry is able to fully reach its targets. Such a course of action would necessitate policymaker to engage with industry to identify potential prohibitors and to clear the path – in contrast to prescriptive efforts to push industry to “try harder”. The second reason is much more concerning. In Section 3.1.2. we have established that industry plans to accomplish 80 % of its decarbonisation efforts (contributing to the figures presented in Table 3) within the first half of the decade, which means by 2025. However, the problem is that due to the difficulties explained in Section 1, the average planning time, building and commissioning times for generation infrastructure as well as wind parks is beyond a half decade. Accordingly nothing that is not already in the pipeline will be ready by 2025, unless planning processes, capacities, etc. are improved in the immediate future [32]. To get a better understanding of how and where potential shortages might appear, it is necessary to apply the simplified procedure used to estimate the overall saving ambitions (cf. Table 3) on the subdivision of the savings targets as well.
In this regard, it is important to note that some measures can (only) impact energy-consumption and energy-related emissions. Conversely, other types of emissions can only be tackled with process decarbonisation, CCUS or compensatory projects. Offsetting GHG emissions is the only measure that can compensate for any type of emission (however it cannot prevent emissions). As a result, a proportion of the emissions is energy-related and can only be addressed through the described means, and another proportion are process-related emissions. While the process-related proportion can be quite different across sectors, applying the general ratio, valid for industry as a whole, will be sufficient for the simplified estimation: Of the 187 million tonnes of GHG emissions of industry, two thirds are energy-related and one third is process related. According to destatis, industry’s total final energy consumption (energetic) in 2019 was 3336 Petajoule (PJ), which is equivalent to 926.67 Terawatt hours (TWh). In the same year, industry’s energy-related GHG emissions were at 125 million tonnes [55]. Dividing the emissions by the energy consumed leads to the industry’s average emission factor of 0.1349 tonnes GHG emissions per TWh energy consumption. If this factor is applied to the energy-related decarbonisation-measures (energy-efficiency, renewable energy), one finds the approximate amount of energy-generation / savings needed to meet the proclaimed 2025 savings goal. It has to be noted that with each step taken in this estimation process the deviation from reality may increase. Particularly in context of final energy consumption, comparatively small deviations across data sources can lead to a substantial change of the emission factor. Executing the operation suggests the need for 138 TWh in renewable energy capacity (not necessarily electricity), and 65 TWh in savings from energy efficiency measures. While keeping in mind that companies may wish to make use of a broad range of renewable energies, the estimated amounts are converted into on-shore wind turbines and photovoltaic panels for illustrative purposes. A modern wind turbine can generate 5-10 GWh per year. Using 7.5 GWh as factor, this translates into 9.700 wind turbines. For an average photovoltaic panel, the annual electricity generation is about 0.17 MWh/m² [56] and a forest stores approximately 6 tonnes of GHG emissions per hectare per year [57], leading to the figures in Table 4
The EWI estimates that meeting the wind energy growth targets and the ambition of serving 80% of electricity demand in 2030 with renewable sources will require on average 5.8 wind turbines going online per day between 2023-2029 [33]. Between 2010-2021, on average 3.5 wind turbines went online per day [32]. If the estimated 9.700 wind turbines to meet industry’s target were to be installed within five years (from the point of the data collection in 2020), 5.3. turbines would need to go online per day. The EWI estimates additional electricity needs for industry of 45 TWh. To produce 20 TWh of green hydrogen for industry, it estimates that a further 29 TWh of electricity from renewable energy sources is required [33]. Putting EWI’s depiction of the goals set out in the coalition agreement in the context of our estimate shows that the additional green energy needs of industry estimated by the EEI for 2025 would be on par with EWI’s numbers – however: only if all energy efficiency measures are applied, the 138 TWh are reduced to about half and if it all happens within half the time. This is as the needs estimated by EEI are for 2025 and EWIs for 2030.
4. Discussion and Conclusion
As underlined before, the estimations provided in the previous section suffer from a number of limitations due to the simplifications and assumptions, which had to be made along the way. To improve the estimate, the following steps promise to increase its accuracy: (a) Firstly, one defines the proportion of a sector’s energy consumption compared to the industry as a whole and expresses this ratio as a weighting factor to be applied to each individual observation. (b) Secondly, one expresses the ratio of MSMEs in each sector with a weighting factor and applies them on the goals set (as preliminary data shows relevant differences in ambition levels depending on company size).
However, even if the figures provided are off by up to 50 %, the forecasted generation capacities are quite likely not sufficient and, more importantly, come too late.
In order to reduce suffering from such supply risks, companies are well advised to undertake those measures, which are within their “control” – the on-site measures. Particularly, the common saying that the best unit of energy is the one not used holds true in this context. The more efficient end users become, the more impact each additional wind turbine, each photovoltaics or solar thermal energy panel will have. Moreover, planning permissions and shortages in installers, equipment and energy experts all take their toll and constitute a potential, often a real, bottleneck in companies’ resilience and net-zero plans. This dynamic further underscores the importance of efficiency, if not in general then in terms of the timeline (and the cost increases over time).
Given the risks and obstacles to companies’ resilience and net-zero plans, it would be beneficial to determine each company’s decarbonisability factor [44]. The latter describes the proportion of emission reduction that cannot be satisfied through on-site measures for technical and space reasons, instead requiring off-site means. Awareness of decarbonisability factors would equip policymakers with a certain degree of plannability in terms of required capacity growths (similar to a shopping list in some way).
To improve the accuracy of transformation plans, policymakers should further complement their estimations, basing them not only on technology roadmaps but also on bottom-up information to gain an actual understanding of what exactly is needed when by whom. This can either be done in a survey format, such as the EEI, provided a more precise estimation approach, or a full data collection, similar to a census. For the latter, each company would be asked to fill-in a confidential online-questionnaire providing company-size, sector, federal state, composition and amount of energy use (for larger companies also energy- and process-related emissions). Further one would enquire how the company intends to contribute to the country’s GHG target (in % by 2030). Information on the scopes in which the company pursues emission reductions, how advanced the company is in its decarbonisation and where it needs help can further make such tool serve as a two-way facilitator. Firstly, policymakers acquire a better understanding of the required infrastructure and the progress towards decarbonisation. Secondly, companies have a chance to indicate what they need to help achieve the societal climate goals. Policymakers can then address these with specific measures.
To improve the accuracy of the estimates in this article and to benefit from the additional viewpoint, it would be valuable to complement the present analysis, which focuses on industry sectors, with the perspective of different energy intensities and company sizes. With sufficient participation, the questionnaire could be useful to assess from a demand-side perspective what is needed, when, by whom and where. To master the climate and energy crisis successfully, all stakeholders, particularly policymakers, but also companies need to “up their game” and quickly push ahead with decarbonisation. Particularly through the application of energy efficiency measures and the parallel expansion of self-generation capacities.
Author Contributions
Conceptualization, S.M.B.; methodology, L.S., J.D., S.M.B. and W.K.; validation, L.S. and S.M.B.; formal analysis, L.S., S.M.B., J.D.; investigation, J.D. and S.M.B.; data curation, L.S., J.D., and. S.M.B.; writing—original draft preparation, S.M.B. and J.D.; writing—review and editing, S.M.B., M.G., J.D., L.S., W.K., A.-L.K.; visualization, S.M.B., J.D., L.S.; project administration, S.M.B.; funding acquisition, S.M.B. All authors have read and agreed to the published version of the manuscript.
Funding
The article processing charge was funded by the German Research Foundation (DFG) grant "Open Access Publication Funding / 2023-2024 / University of Stuttgart" (512689491).
Data Availability Statement
The data presented in this study are available on request from the corresponding author. The data are not publicly available due to privacy issues.
The underlying research in form of the Energy Efficiency Index of German Industry (EEI, #EEIndex) would not have been possible without the continuous support of the Karl-Schlecht-Foundation and the Heinz und Heide Dürr Foundation, as well as the about 850 companies participating, and those reviewing this paper, particularly Ali Kara. All conclusions, errors or oversights are solely the responsibility of the authors.
Conflicts of Interest
The authors declare no conflict of interest.
| 1 | ‘Core industries’ are the eleven sectors that have most economic weight in Germany (NACE code in brakets, sorted by Code): leather- (15), wood & cork- (16), paper- (17), chemical- (20) rubber & plastics- (22), non-metallic minerals- (23), basic metals- (24), fabricated metals- (25), electrical equipment- (27), machinery & equipment- (28) and motor vehicle (29) industries |
References
- United Nations Framework Convention on Climate Change. Global Climate Action - NAZCA. Available online: https://climateaction.unfccc.int/ (accessed on 28 December 2022).
- Science Based Targets initiative (SBTi) Companies taking action Available online:. Available online: https://sciencebasedtargets.org/companies-taking-action (accessed on 28 December 2022).
- Net Zero Tracker. Net Zero Tracker Beta. Available online: https://zerotracker.net/ (accessed on 28 December 2022).
- Climate Action Tracker. CAT net zero target evaluations. Available online: https://climateactiontracker.org/global/cat-net-zero-target-evaluations/ (accessed on 28 December 2022).
- United Nations Framework Convention on Climate Change, Paris Agreement; (2015). Available online: https://unfccc.int/sites/default/files/english_paris_agreement.pdf (accessed on 28 December 2022).
- Net Zero Cities. The NZC Project. Available online: https://netzerocities.eu/the-nzc-project/ (accessed on 28 December 2022).
- European Commission. Covenant of Companies for Climate and Energy. Available online: https://covenant-of-companies.ec.europa.eu/about_en (accessed on 28 December 2022).
- Buettner, S.M. Roadmap to Neutrality - What Foundational Questions Need Answering to Determine One's Ideal Decarbonisation Strategy. Energies 2022, 15, 3126. [Google Scholar] [CrossRef]
- Buettner, S.M.; Wang, D. An approach to reducing the greenhouse gas footprint in the manufacturing industry: Determinants for an economic assessment of industrial decarbonisation measures; University of Stuttgart: Stuttgart, Germany, 21 December 2022; Available online: https://doi.org/10.18419/opus-12615 (accessed on 17 May 2022). [CrossRef]
- EEP Energy Efficiency Index winter survey 2021/22 - 70 percent of companies want to offer their products in a climate-neutral way (23 February 2022). Institute for Energy Efficiency in Production, University of Stuttgart. 2022. Available online: https://www.eep.uni-stuttgart.de/en/institute/news/news/Energy-Efficiency-Index-winter-survey-2021-22---70-percent-of-companies-want-to-offer-their-products-in-a-climate-neutral-way/ (accessed on 27 December 2022).
- World Resources Institute. Greenhouse Gas Protocol. FAQ. Available online: https://ghgprotocol.org/sites/default/files/standards_supporting/FAQ.pdf (accessed on 12 November 2022).
- IEA. World Energy Balances Highlights. Available online: https://www.iea.org/data-and-statistics/data-product/world-energy-balances-highlights# (accessed on 13 November 2022).
- Stratmann, K. Erste Unternehmen kapitulieren vor hohen Gas- und Strompreisen – Was die Politik nun tun will. Handelsblatt. 01 January 2022. Available online: https://www.handelsblatt.com/politik/international/energie-nach-der-gasknappheit-droht-die-stromknappheit-wie-die-duerre-europas-versorgung-gefaehrdet/28600886.html (accessed on 25 December 2022).
- Olk, J.; Stratmann, K. Warum deutsche Firmen jetzt vor der Deindustrialisierung warnen. Handelsblatt. 07 September 2022. Available online: https://www.handelsblatt.com/politik/deutschland/energiekrise-warum-deutsche-firmen-jetzt-vor-der-deindustrialisierung-warnen/28662604.html (accessed on 22 December 2022).
- Blume, J.; Herwartz, C.; Kuchenbecker, T.; Stratmann, K.; Wermke, C.; Witsch, K. Nach der Gasknappheit droht die Stromknappheit – Wie die Dürre Europas Versorgung gefährdet. Handelsblatt. 15 August 2022. Available online: https://www.handelsblatt.com/politik/international/energie-nach-der-gasknappheit-droht-die-stromknappheit-wie-die-duerre-europas-versorgung-gefaehrdet/28600886.html (accessed on 22 December 2022).
- Möglicher Gaslieferstopp: Wie sich die Industrie auf den Worst Case vorbereitet. Handelsblatt. 28 April 2022. Available online: https://www.handelsblatt.com/unternehmen/industrie/energie-moeglicher-gaslieferstopp-wie-sich-die-industrie-auf-den-worst-case-vorbereitet/28282380.html (accessed on 22 December 2022).
- Wer bekommt noch Gas im Ernstfall: Privathaushalte oder Industrie? WDR. 29 April 2022. Available online: https://www1.wdr.de/nachrichten/gasmangel-industrie-privathaushalte-prioritaet-100.html (accessed on 22 December 2022).
- Bücker, T. Notfallplan bei Lieferstopp: Wer als Erstes auf Gas verzichten müsste. tagesschau.de. 30 March 2022. Available online: https://www.tagesschau.de/wirtschaft/verbraucher/gas-notfallplan-bundesnetzagentur-101.html (accessed on 22 December 2022).
- Hennes, W. Gefährliche Energieabhängigkeit. Erdgas: Was Deutschlands Industrie droht, wenn Russland nicht mehr liefert. aktiv-online. 07 April 2022. Available online: https://www.aktiv-online.de/news/erdgas-was-deutschlands-industrie-droht-wenn-russland-nicht-mehr-liefert-16774 (accessed on 22 December 2022).
- Käckenhoff, T.; Eckert, V.; Steitz, C. As German gas rationing looms, industry begs exemptions. Reuters. 9 August 2022. Available online: https://www.reuters.com/business/energy/german-gas-rationing-looms-industry-begs-exemptions-2022-08-09/ (accessed on 22 December 2022).
- Noé, M. Multiaufsichtsrat Karl-Ludwig Kley "Gas erst bei den Privaten abschalten, dann bei der Industrie". manager magazin 5/2022. 27 April 2022. Available online: https://www.manager-magazin.de/unternehmen/industrie/karl-ludwig-kley-von-eon-und-lufthansa-ueber-gas-embargo-russland-und-handel-mit-china-a-2519cd38-0002-0001-0000-000201341036 (accessed on 22 December 2022).
- Roider, H. Gas: Empörung über Eon-Aussagen zum Gas-Vorrang. Energie & Management. 28 April 2022. Available online: https://www.energie-und-management.de/nachrichten/gas/detail/empoerung-ueber-eon-aussagen-zum-gas-vorrang-152812 (accessed on 22 December 2022).
- Schneider, J. Falls zu wenig im Speicher ist - Wem wird zuerst das Gas abgestellt? zdf heute. 02 July 2022. Available online: https://www.zdf.de/nachrichten/politik/gas-versorgungsengpass-ukraine-krieg-russland-100.html (accessed on 22 December 2022).
- Dürr, F.; Stromnetz am Anschlag: App warnt und ruft Baden-Württemberg zum Stromsparen auf. Stuttgarter Zeitung. 07 December 2022. Available online: https://www.stuttgarter-zeitung.de/inhalt.stromnetz-am-anschlag-app-warnt-und-ruft-baden-wuerttemberg-zum-stromsparen-auf.283685b8-3789-443c-b626-5da57cee3e22.html (accessed on 26 December 2022).
- Wissenschaftliche Dienste. Dekarbonisierung und Sektorkopplung; Dokumentation WD 8 - 3000 - 064/18; Deutscher Bundestag: Berlin, Germany, 18 June 2018 2018; p. 28. Available online: https://www.bundestag.de/resource/blob/565028/e7ff379935a919e8dd0d80b522b2352a/WD-8-064-18-pdf-data.pdf (accessed on 28 December 2022).
- Wissenschaftliche Dienste. Aktueller Begriff: Power to Gas; Nr. 10/12 (16. Mai 2012) aktualisierte Fassung vom 11. Dezember 2012; Deutscher Bundestag: Berlin, Germany, 2012; p. 2. Available online: http://www.bundestag.de/blob/192428/c2cf809dd7287c6e8096c23caee03210/power_to_gas-data.pdf (accessed on 28 December 2022).
- Federal Ministry of Education and Research. How the Kopernikus project P2X converts renewable electricity into plastics and fuels, gases and heat. Available online: https://www.kopernikus-projekte.de/en/projects/p2x (accessed on 28 December 2022).
- Kasten, P.; Heinemann, C. Oeko-Institut e.V. Electricity-based fuels: the future of PtX. Available online: https://www.oeko.de/en/research-consultancy/issues/mobility-and-transport/electricity-based-fuels-the-future-of-ptx (accessed on 28 December 2022).
- NSW Government. Do I get the same fuel economy out of E10 as regular unleaded petrol? E10 facts. Available online: https://www.nsw.gov.au/driving-boating-and-transport/e10-fuel/e10-facts#toc-do-i-get-the-same-fuel-economy-out-of-e10-as-regular-unleaded-petrol (accessed on 28 December 2022).
- Statistisches Bundesamt (destatis). Industrie, Verarbeitendes Gewerbe: Bedeutung der energieintensiven Industriezweige in Deutschland. Available online: https://www.destatis.de/DE/Themen/Branchen-Unternehmen/Industrie-Verarbeitendes-Gewerbe/produktionsindex-energieintensive-branchen.html (accessed on 23 December 2022).
- Zajonz, M.; Wolff, K. Daten-Überblick: Vom fossilen zum Ökostrom. ZDF. 21 December 2022. Available online: https://www.zdf.de/nachrichten/wirtschaft/erdgas-oekostrom-erneuerbare-energien-deutschland-daten-100.html (accessed on 26 December 2022).
- Stratmann, K.; Witsch, K. Stromlücke droht: Deutschland muss ab sofort bis 2029 täglich sechs neue Windräder errichten. Handelsblatt. 28 December 2022. Available online: https://www.handelsblatt.com/unternehmen/energie/erneuerbare-energien-stromluecke-droht-deutschland-muss-ab-sofort-bis-2029-taeglich-sechs-neue-windraeder-errichten/28881822.html (accessed on 28 December 2022).
- Sprenger, T.; Schäfer, F. EWI-Analyse: Implikationen des geplanten Zubaus erneuerbarer Energien gemäß Osterpaket und EEG 2023; Energiewirtschaftliches Institut an der Universität zu Köln (EWI) gGmbH: Köln, Germany, 28 December 2022; p. 14. Available online: https://www.ewi.uni-koeln.de/cms/wp-content/uploads/2022/12/221228_EWI-Analyse-Implikationen_Osterpaket_und_EEG_2023.pdf (accessed on 28 December 2022).
- Dekarbonisierung bei BASF würde Strombedarf verdreifachen. Energie & Management. 04 November 2019. Available online: https://www.energie-und-management.de/nachrichten/handel/emission/detail/dekarbonisierung-bei-basf-wuerde-strombedarf-verdreifachen-133689 (accessed on 28 December 2022).
- Lenné, D. BASF-Chef zur Dekarbonisierung: Strombedarf wird sich vervierfachen. piqd. 13 December 2020. Available online: https://www.piqd.de/klimawandel/basf-chef-zur-dekarbonisierung-strombedarf-wird-sich-vervierfachen (accessed on 28 December 2022).
- Haupt, C. BASF Ermittelt CO2-Fußabdruck aller Verkausprodukte (28 July 2020). BASF. 2020. Available online: https://www.basf.com/global/de/media/news-releases/2020/07/p-20-260.html (accessed on 28 December 2022).
- Joint News Release: Vattenfall and BASF participate in offshore wind farm tender Hollandse Kust West (22 April 2022). BASF. 2022. Available online: https://www.basf.com/global/en/media/news-releases/2022/04/p-22-209.html (accessed on 13 November 2022).
- BASF, SABIC and Linde start construction of the world’s first demonstration plant for large-scale electrically heated steam cracker furnaces (01 September 2022). BASF. 2022. Available online: https://www.basf.com/global/en/who-we-are/sustainability/whats-new/sustainability-news/2022/basf-sabic-and-linde-start-construction-of-the-worlds-first-demonstration-plant-for-large-scale-electrically-heated-steam-cracker-furnaces.html (accessed on °13 November 2022).
- Die Herstellung von Stahl. Futura. 06 March 2021. Available online: https://www.futura-sciences.com/de/die-herstellung-von-stahl_1776/ (accessed on 28 December 2022).
- Wille, J. Wie Stahl grün wird.klimareporter. 18 November 2019. Available online: https://www.klimareporter.de/finanzen-wirtschaft/wie-stahl-gruen-wird (accessed on 28 December 2022).
- RWE and ArcelorMittal intend to jointly build and operate offshore wind farms and hydrogen facilities, for low-emissions steelmaking (22 June 2022). Arcelor Mittal. 2022. Available online: https://corporate.arcelormittal.com/media/news-articles/rwe-and-arcelormittal-intend-to-jointly-build-and-operate-offshore-wind-farms-and-hydrogen-facilities-for-low-emissions-steelmaking-1 (accessed on 13 November 2022).
- Covestro and ENGIE sign supply agreement for green power in Belgium (24 March 2021). covestro. 2021. Available online: https://www.covestro.com/investors/news/covestro-and-engie-sign-supply-agreement-for-green-power-in-belgium/ (accessed on 13 November 2022).
- Statkraft supplies a further 300 GWh of green power to cement manufacturer OPTERRA since beginning of April (20 April 2022). Statkraft. 2022. Available online: https://www.statkraft.com/newsroom/news-and-stories/archive/2022/statkraft-supplies-Opterra-with-renewable-energy/ (accessed on13 November 2022).
- Buettner, S.M.; Schneider, C.; König, W.; Mac Nulty, H.; Piccolroaz, C.; Sauer, A. How do German manufacturers react to the increasing societal pressure for decarbonisation? Applied Sciences 2022, 12, 543. [Google Scholar] [CrossRef]
- EEP Der Energieeffizienz-Index der Deutschen Industrie. Umfrageergebnisse 1. Halbjahr 2020 Institut für Energieeffizienz in der Produktion, Universität Stuttgart. 2020. Available online: https://www.eep.uni-stuttgart.de/eei/archiv-aeltere-erhebungen/ (accessed on 31 December 2022).
- EEP Der Energieeffizienz-Index der Deutschen Industrie. Umfrageergebnisse 2. Halbjahr 2020 Institut für Energieeffizienz in der Produktion, Universität Stuttgart. 2020. Available online: https://www.eep.uni-stuttgart.de/eei/archiv-aeltere-erhebungen/ (accessed on 31 December 2022).
- Building Resilient Energy Systems: Technical Considerations and Actions for Achieving Greater Energy Security, Affordability and Net-zero in the ECE Region. United Nations Economic Commission for Europe. Committee on Sustainable Energy. 31st Session. CSE-31/2022/INF.2 2022. Available online: https://unece.org/sed/documents/2022/08/informal-documents/building-resilient-energy-systems-technical-considerations (accessed on: 25 December 2022).
- Buettner, S.M.; König, W.; Vierhub-Lorenz, F.; Gilles, M. What Motivates Companies to Take the Decision to Decarbonise? Preprints 2022, 2022100395. [Google Scholar] [CrossRef]
- Buettner, S.M.; König, W. Determining the ideal mix — (finding out) what range of measures is best for one’s business. In Proceedings of the ACEEE Summer Study, digital; Washington D.C., USA, 13–15 July 2021. Available online: https://www.aceee.org/sites/default/files/pdfs/ssi21/panel-2/Buettner.pdf (accessed on 12 November 2022).
- From Ambition to impact: How companies are reducing emissions at scale with science-based targets; Science Based Targets: 2020. Available online: https://sciencebasedtargets.org/resources/files/SBTiProgressReport2020.pdf (accessed on 21 March 2022).
- Schneider, J.; Negativpreis von Foodwatch: Goldener Windbeutel geht an Rewe-Produkt. ZDF. 14 December 2021. Available online: https://www.zdf.de/nachrichten/wirtschaft/goldener-windbeutel-2021-rewe-klimaneutral-100.html (accessed on 27 November 2022).
- Umweltbundesamt. Indicator: Greenhouse gas emissions. Available online: https://www.umweltbundesamt.de/en/data/environmental-indicators/indicator-greenhouse-gas-emissions#at-a-glance (accessed on 27 December 2022).
- Umweltbundesamt. Entwicklung der Treibhausgasemissionen in Deutschland 2010–2019. Available online: https://www.umweltbundesamt.de/sites/default/files/medien/421/bilder/1_entwicklung_der_treibhausgasemissionen_in_deutschland_0.jpg (accessed on 23 August 2022).
- The Federal Government of Germany. Climate Action Programme 2030. Available online: https://www.bundesregierung.de/breg-en/issues/climate-action (accessed on 27 December 2022).
- Drosihn, D. Übersicht zur Entwicklung der energiebedingten Emissionen und Brennstoffeinsätze in Deutschland 1990 – 2020; Umweltbundesamt: Dessau-Roßlau, Germany, May 2022; p. 9. Available online: https://www.umweltbundesamt.de/publikationen/uebersicht-zur-entwicklung-der-energiebedingten (accessed on 26 December 2022).
- eon. Durchschnittliche Photovoltaik-Leistung & PV-Erträge in Deutschland. Available online: https://www.eon.de/de/pk/solar/kwp-bedeutung-umrechnung.html (accessed on 31 December 2022).
- Stiftung Unternehmen Wald. Wie viel Kohlendioxid (CO2) speichert der Baum bzw. der Wald. Available online: https://www.wald.de/waldwissen/wie-viel-kohlendioxid-co2-speichert-der-wald-bzw-ein-baum/ (accessed on 31 December 2022).
Figure 1.
GHG reduction target for 2025 [in %], by sector ( n ≥ 20 ).
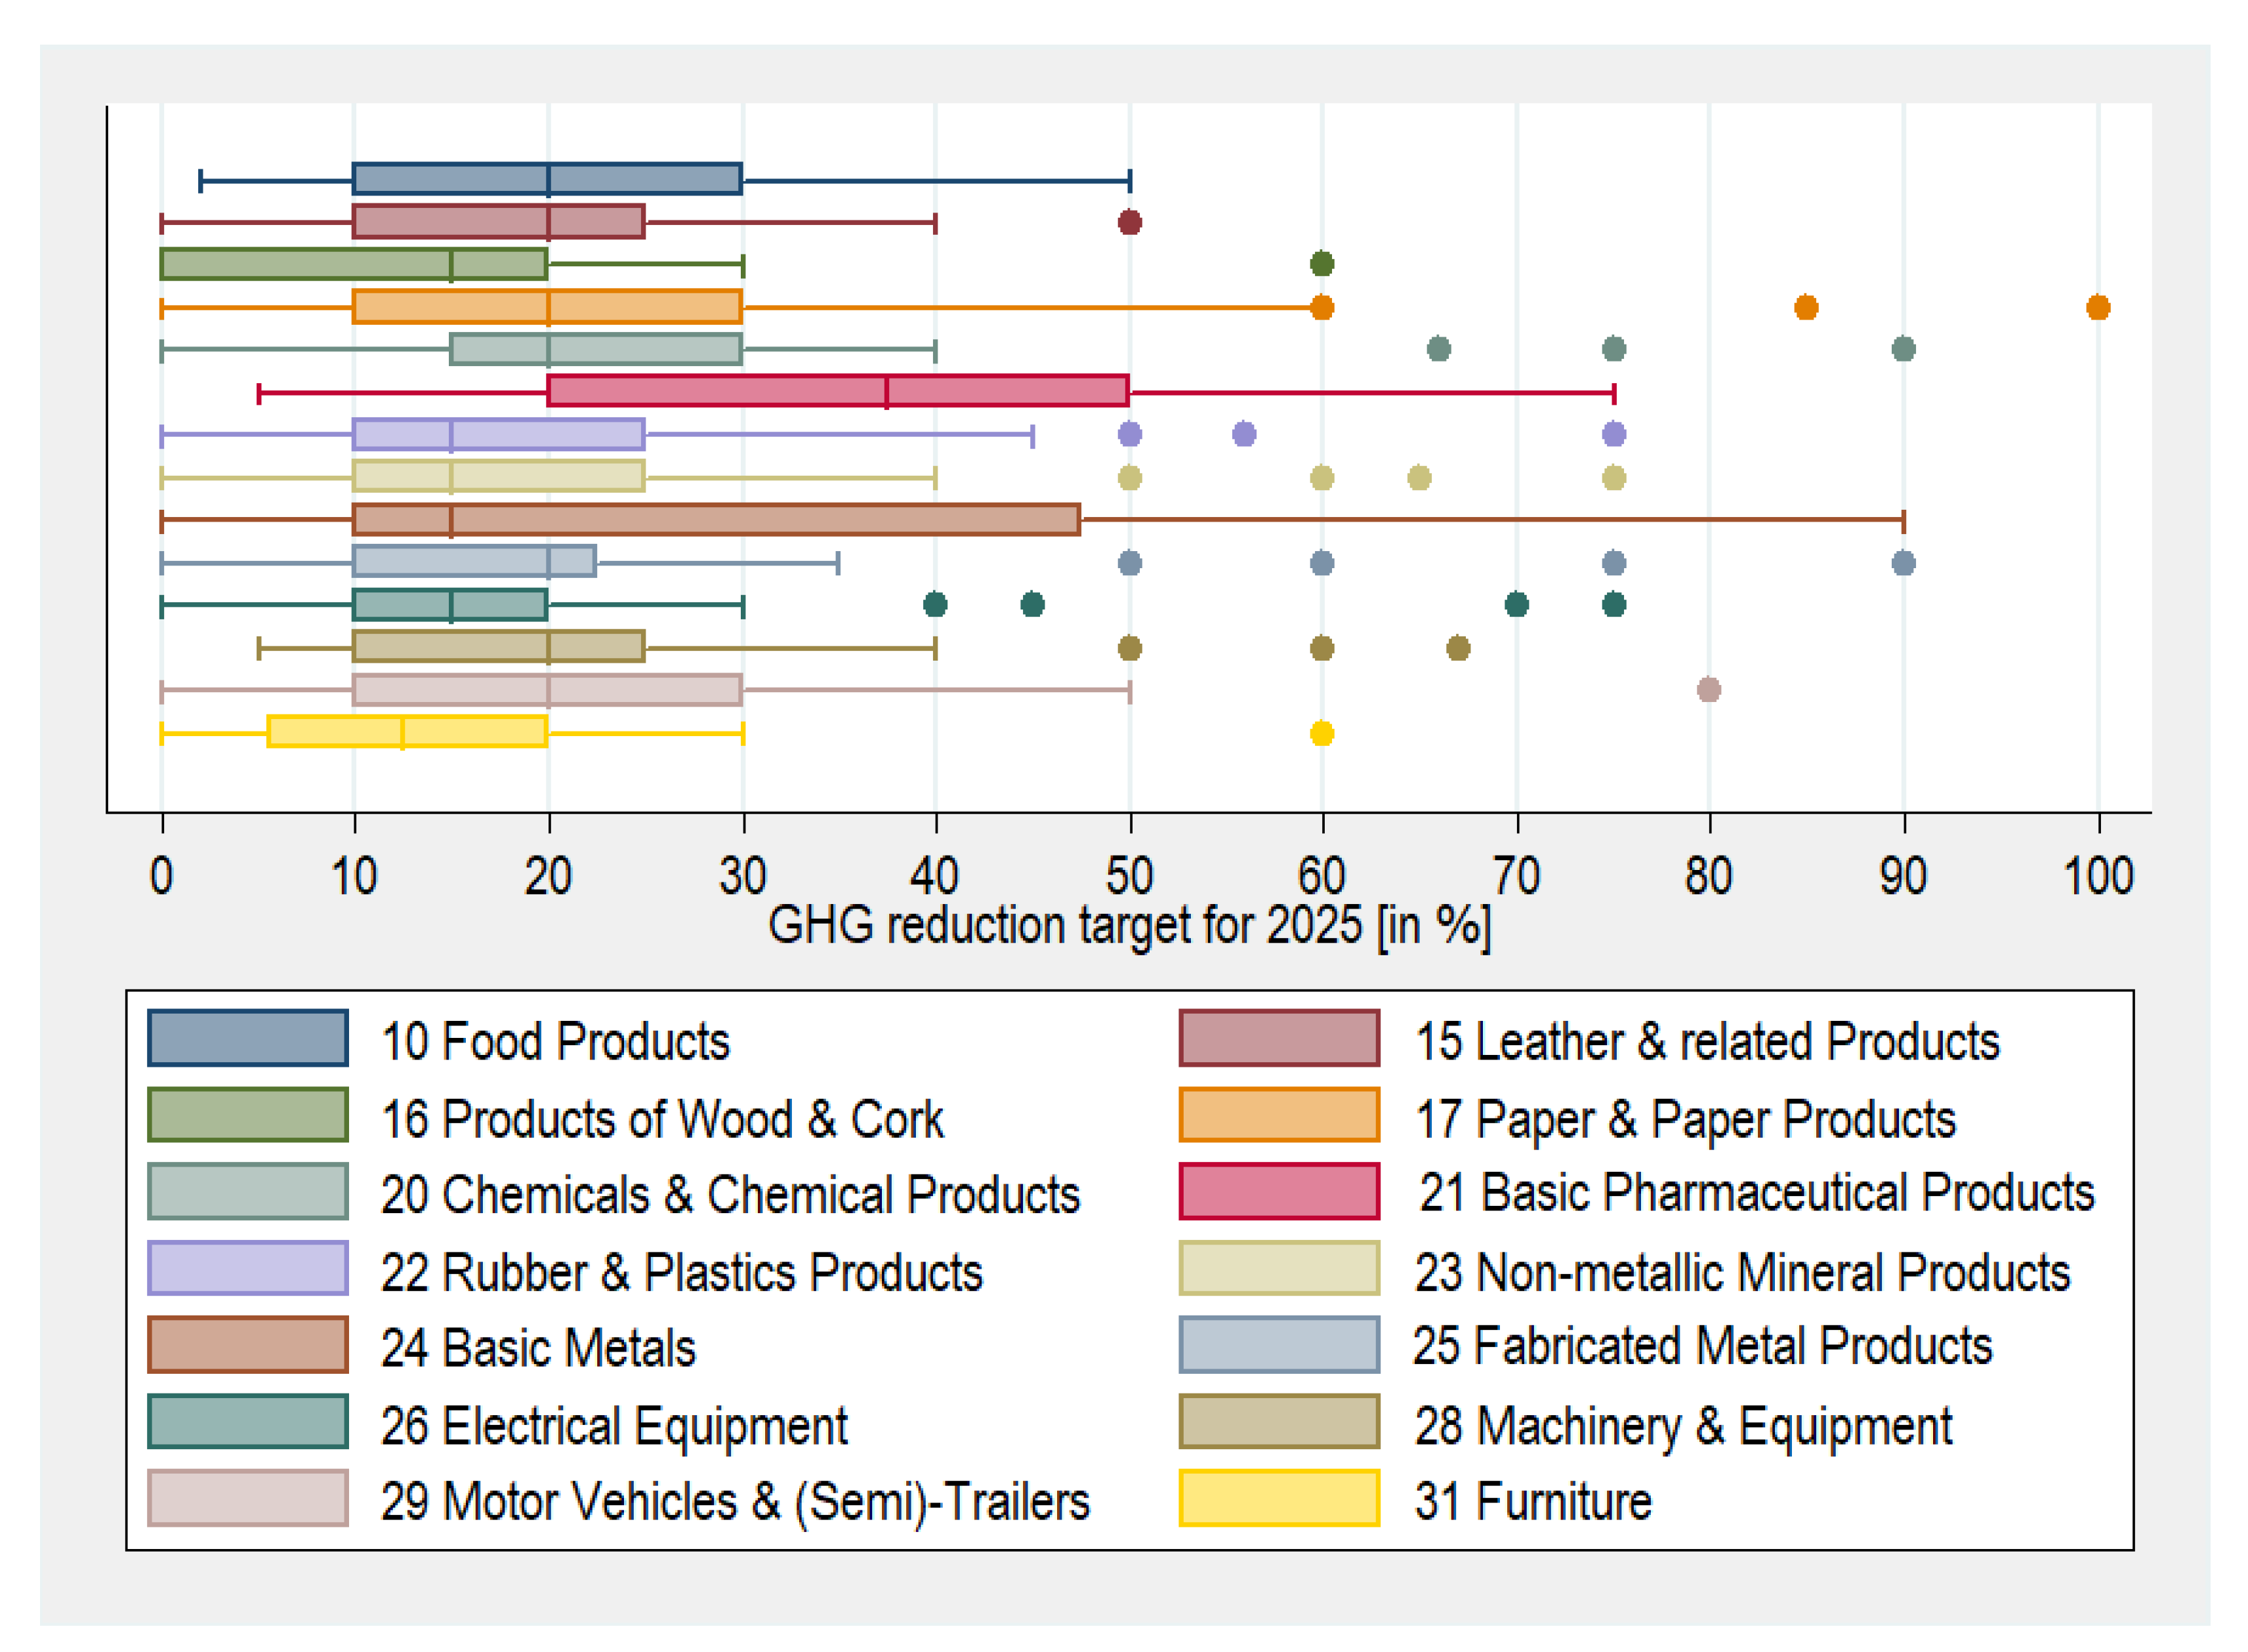
Figure 2.
GHG reduction target for 2025, broken down by measure option [in %].
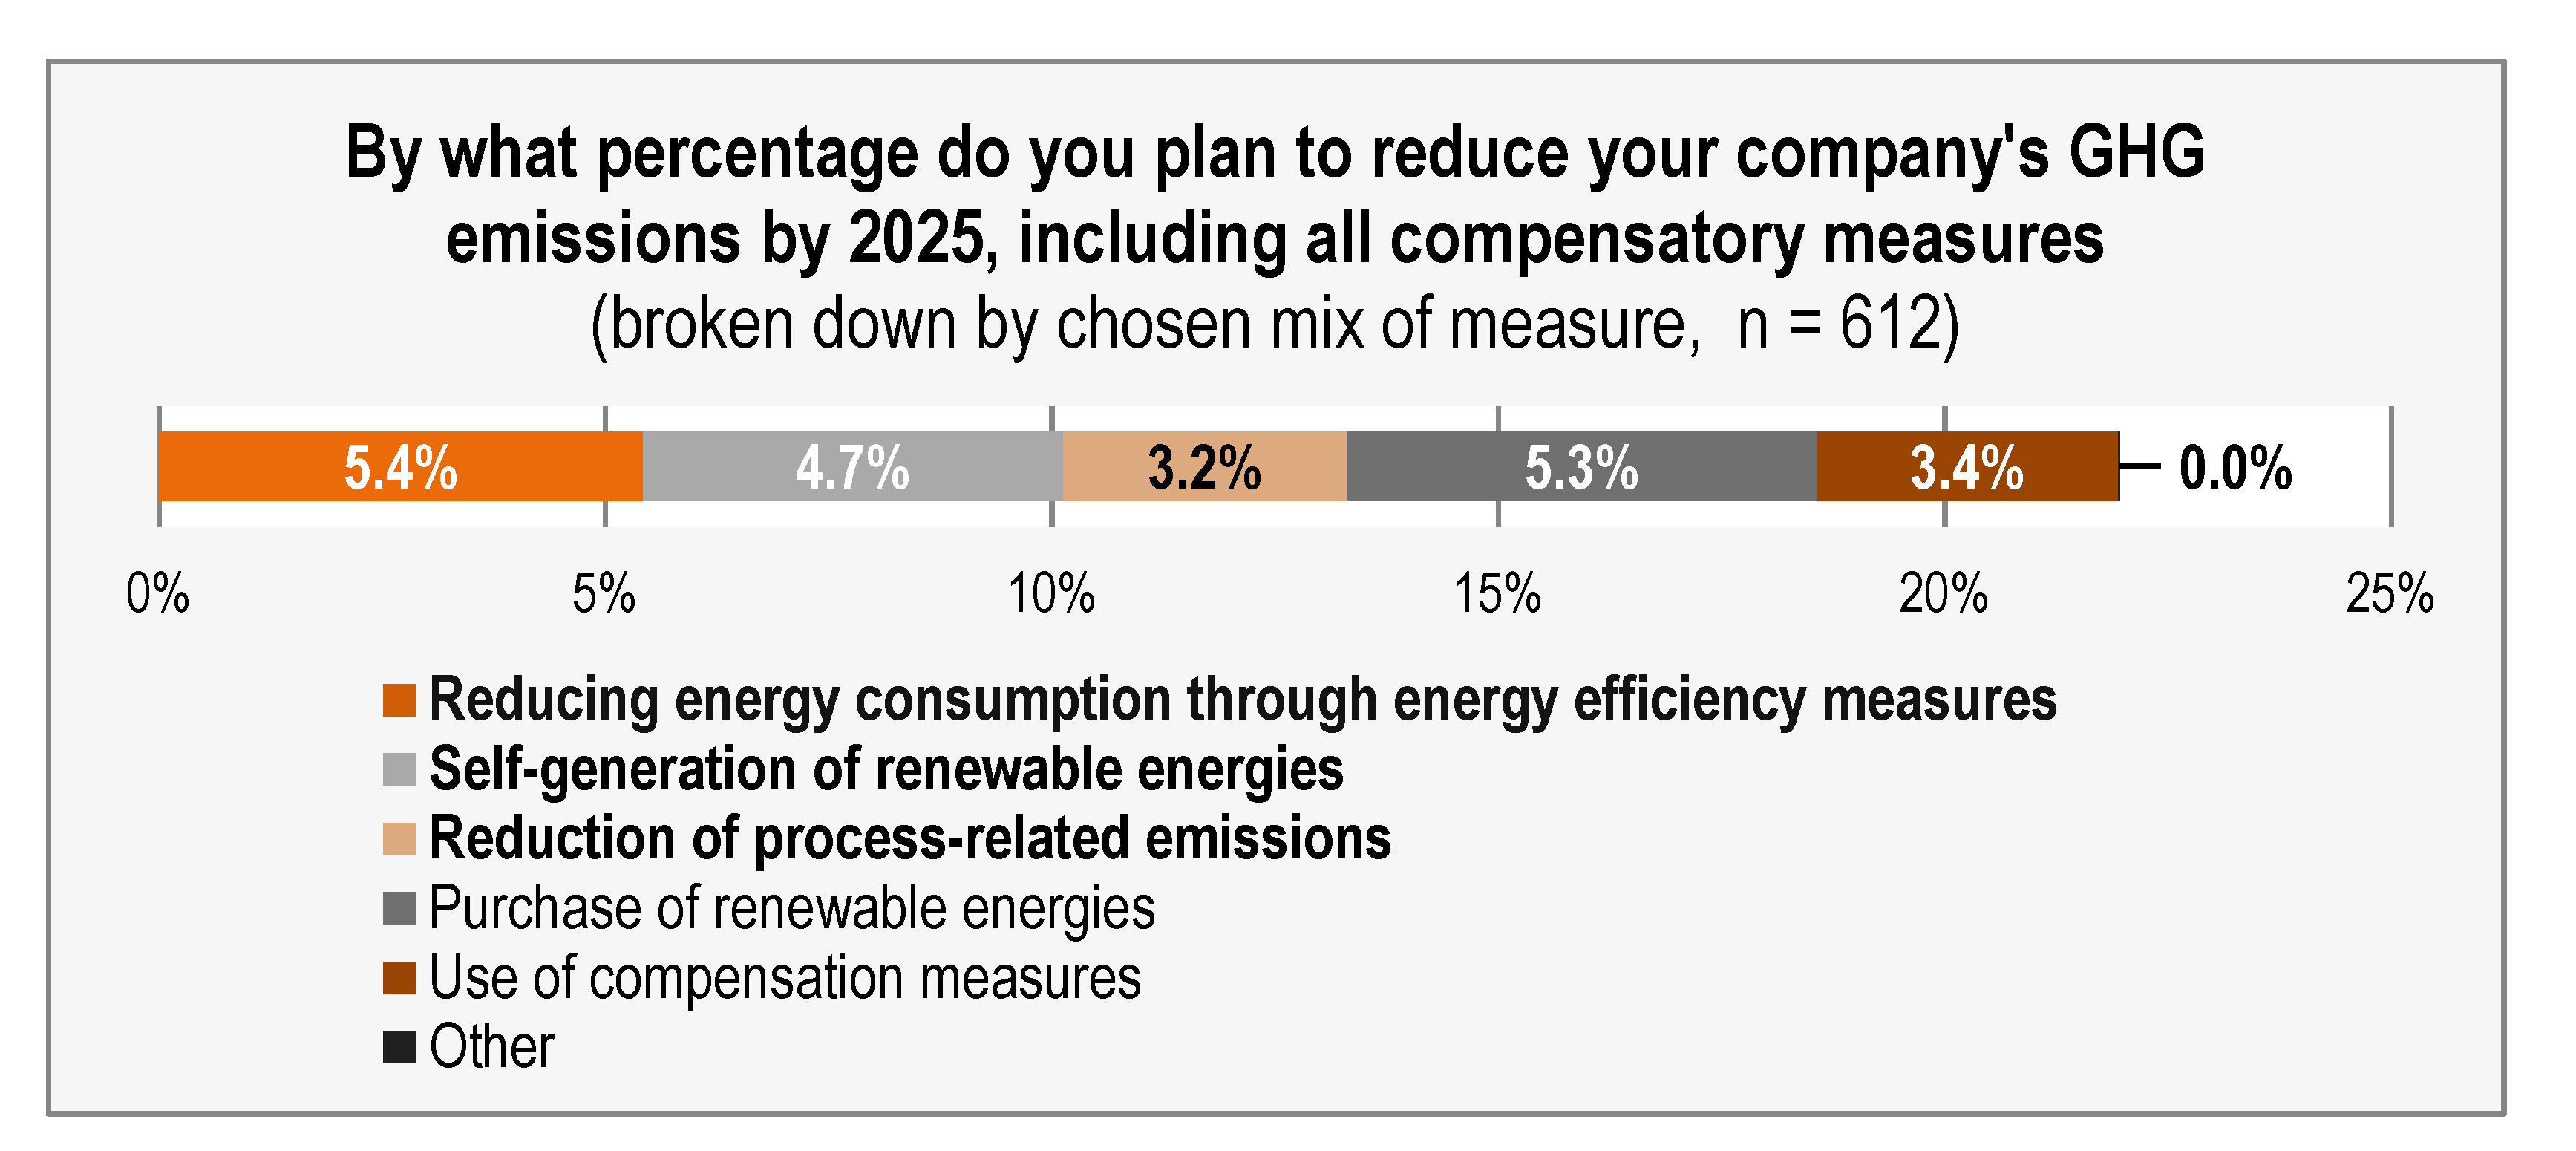
Figure 3.
GHG reduction target for 2025, broken down by measure option [in %], by sector (n ≥ 20).
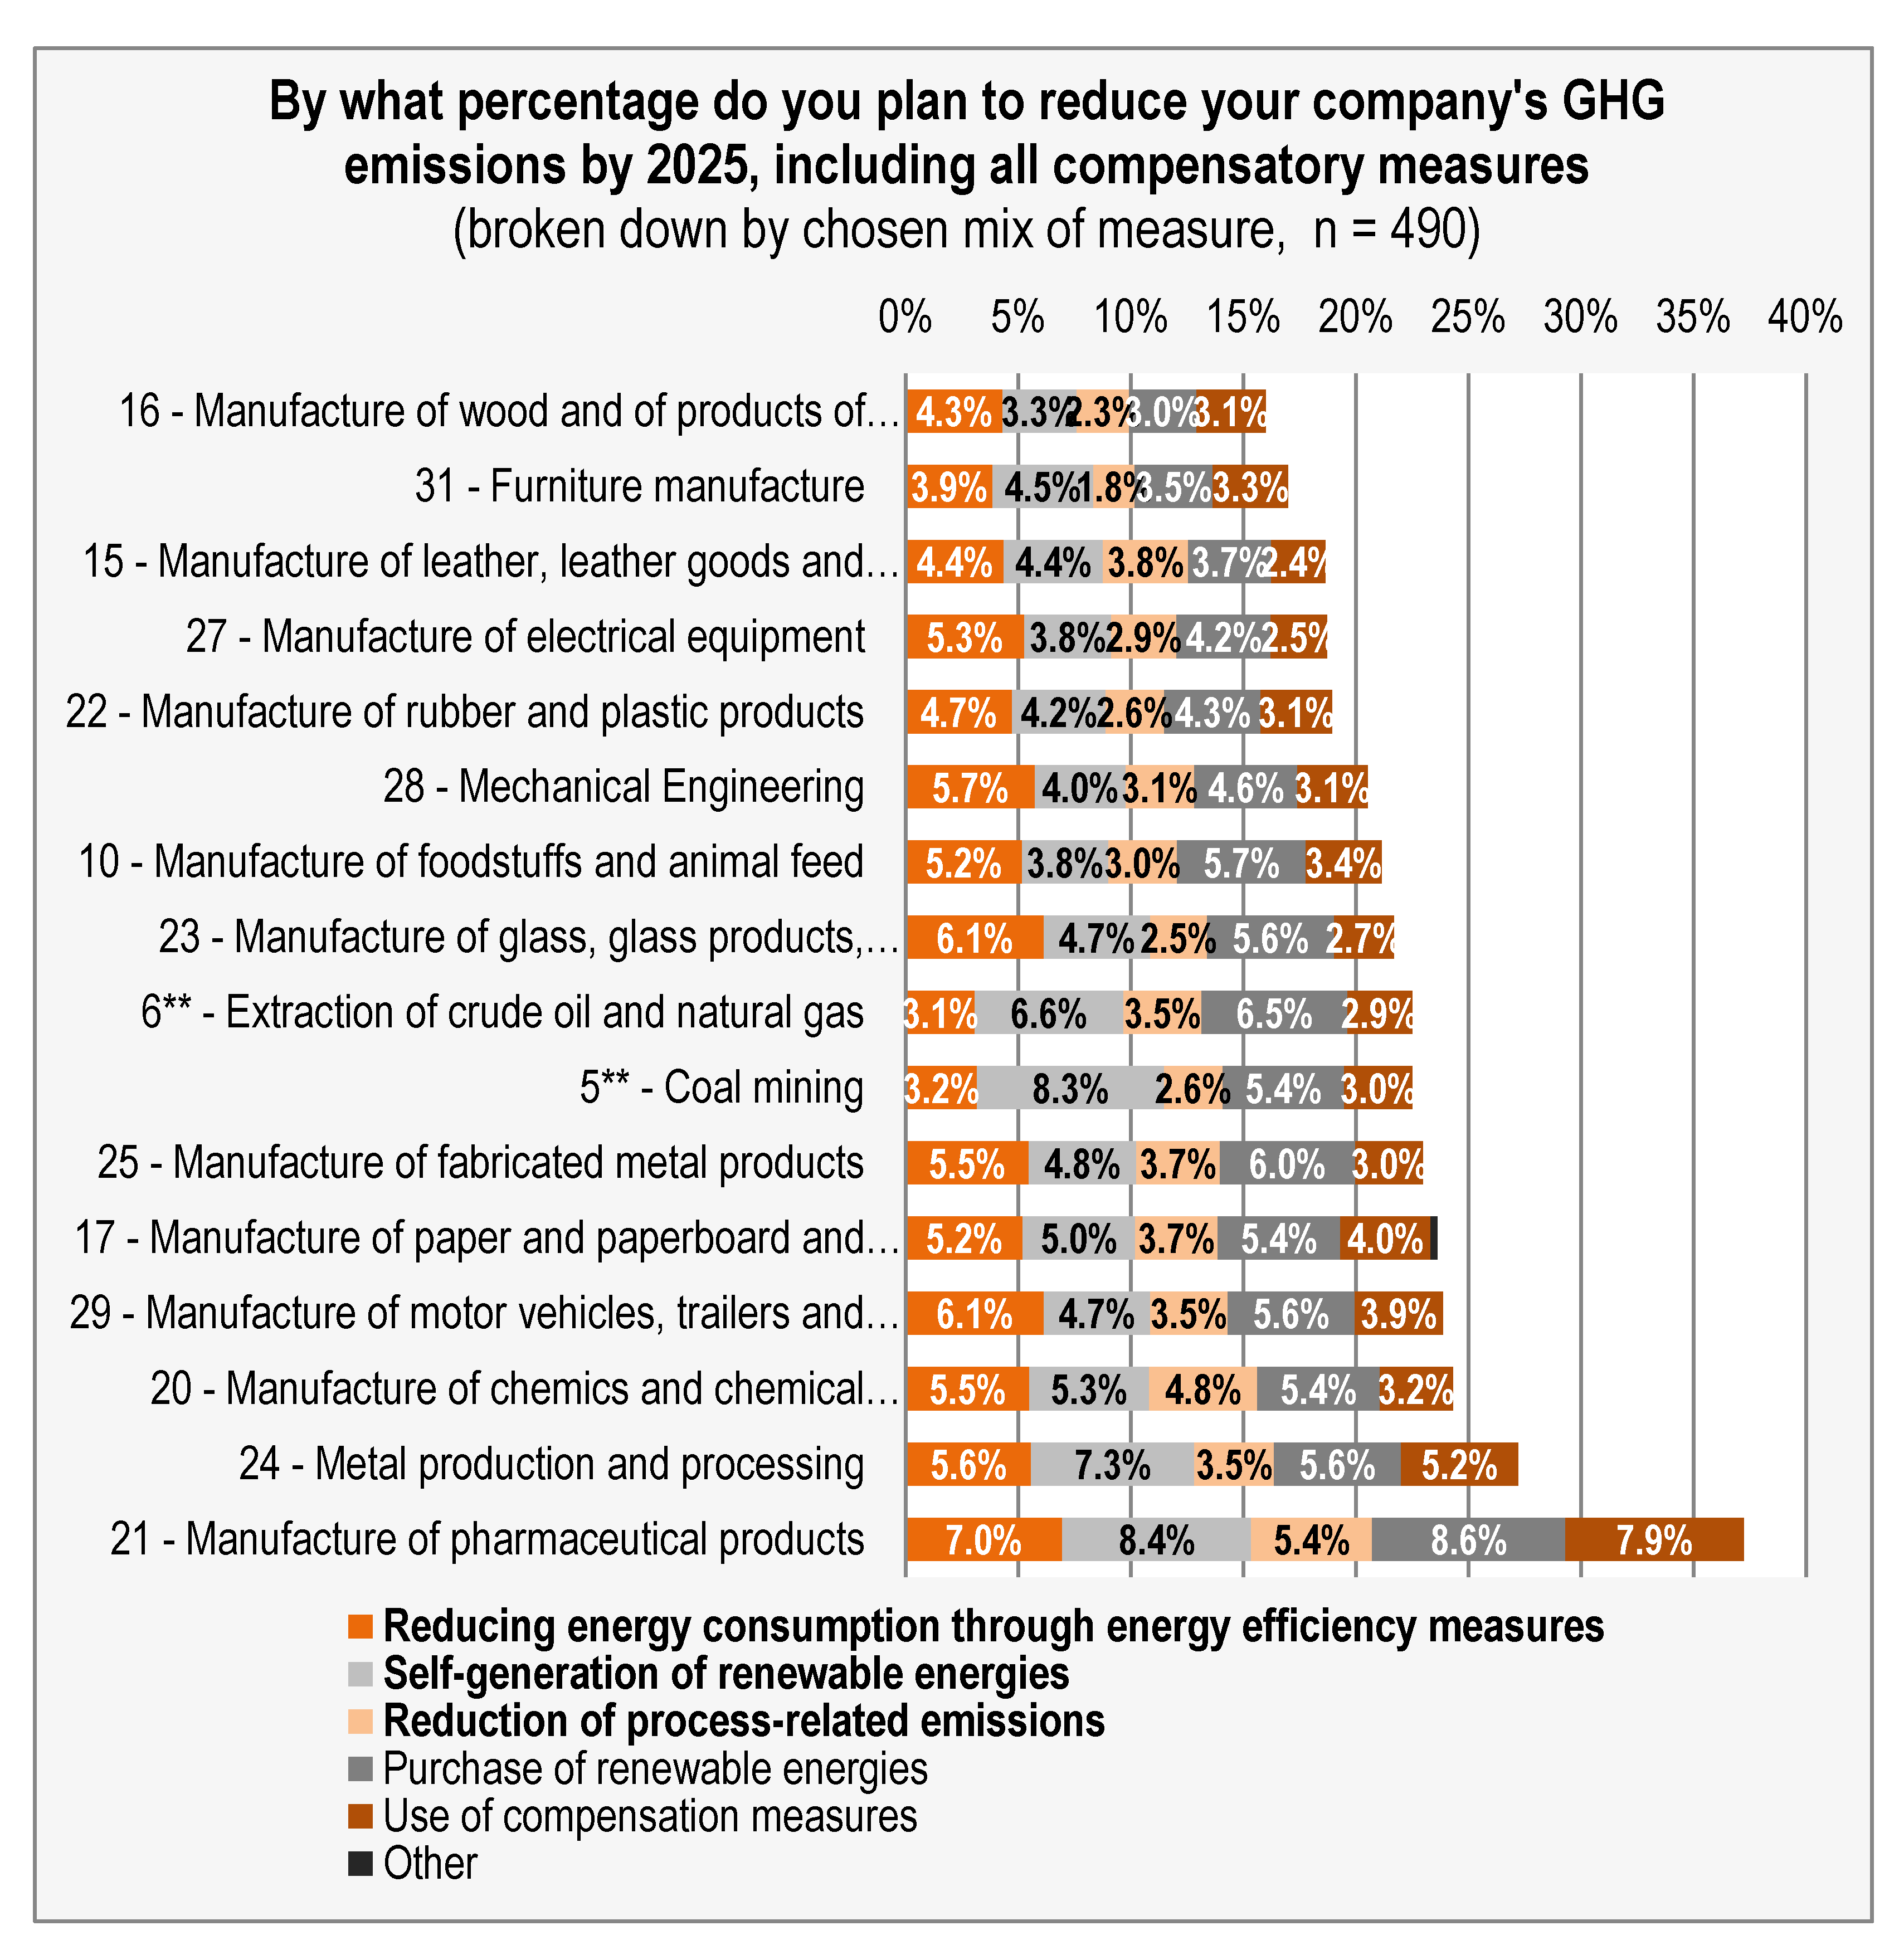

Table 1.
Sample composition by sector ( n 2020/1 = 864, n 2020/2 = 866 ).
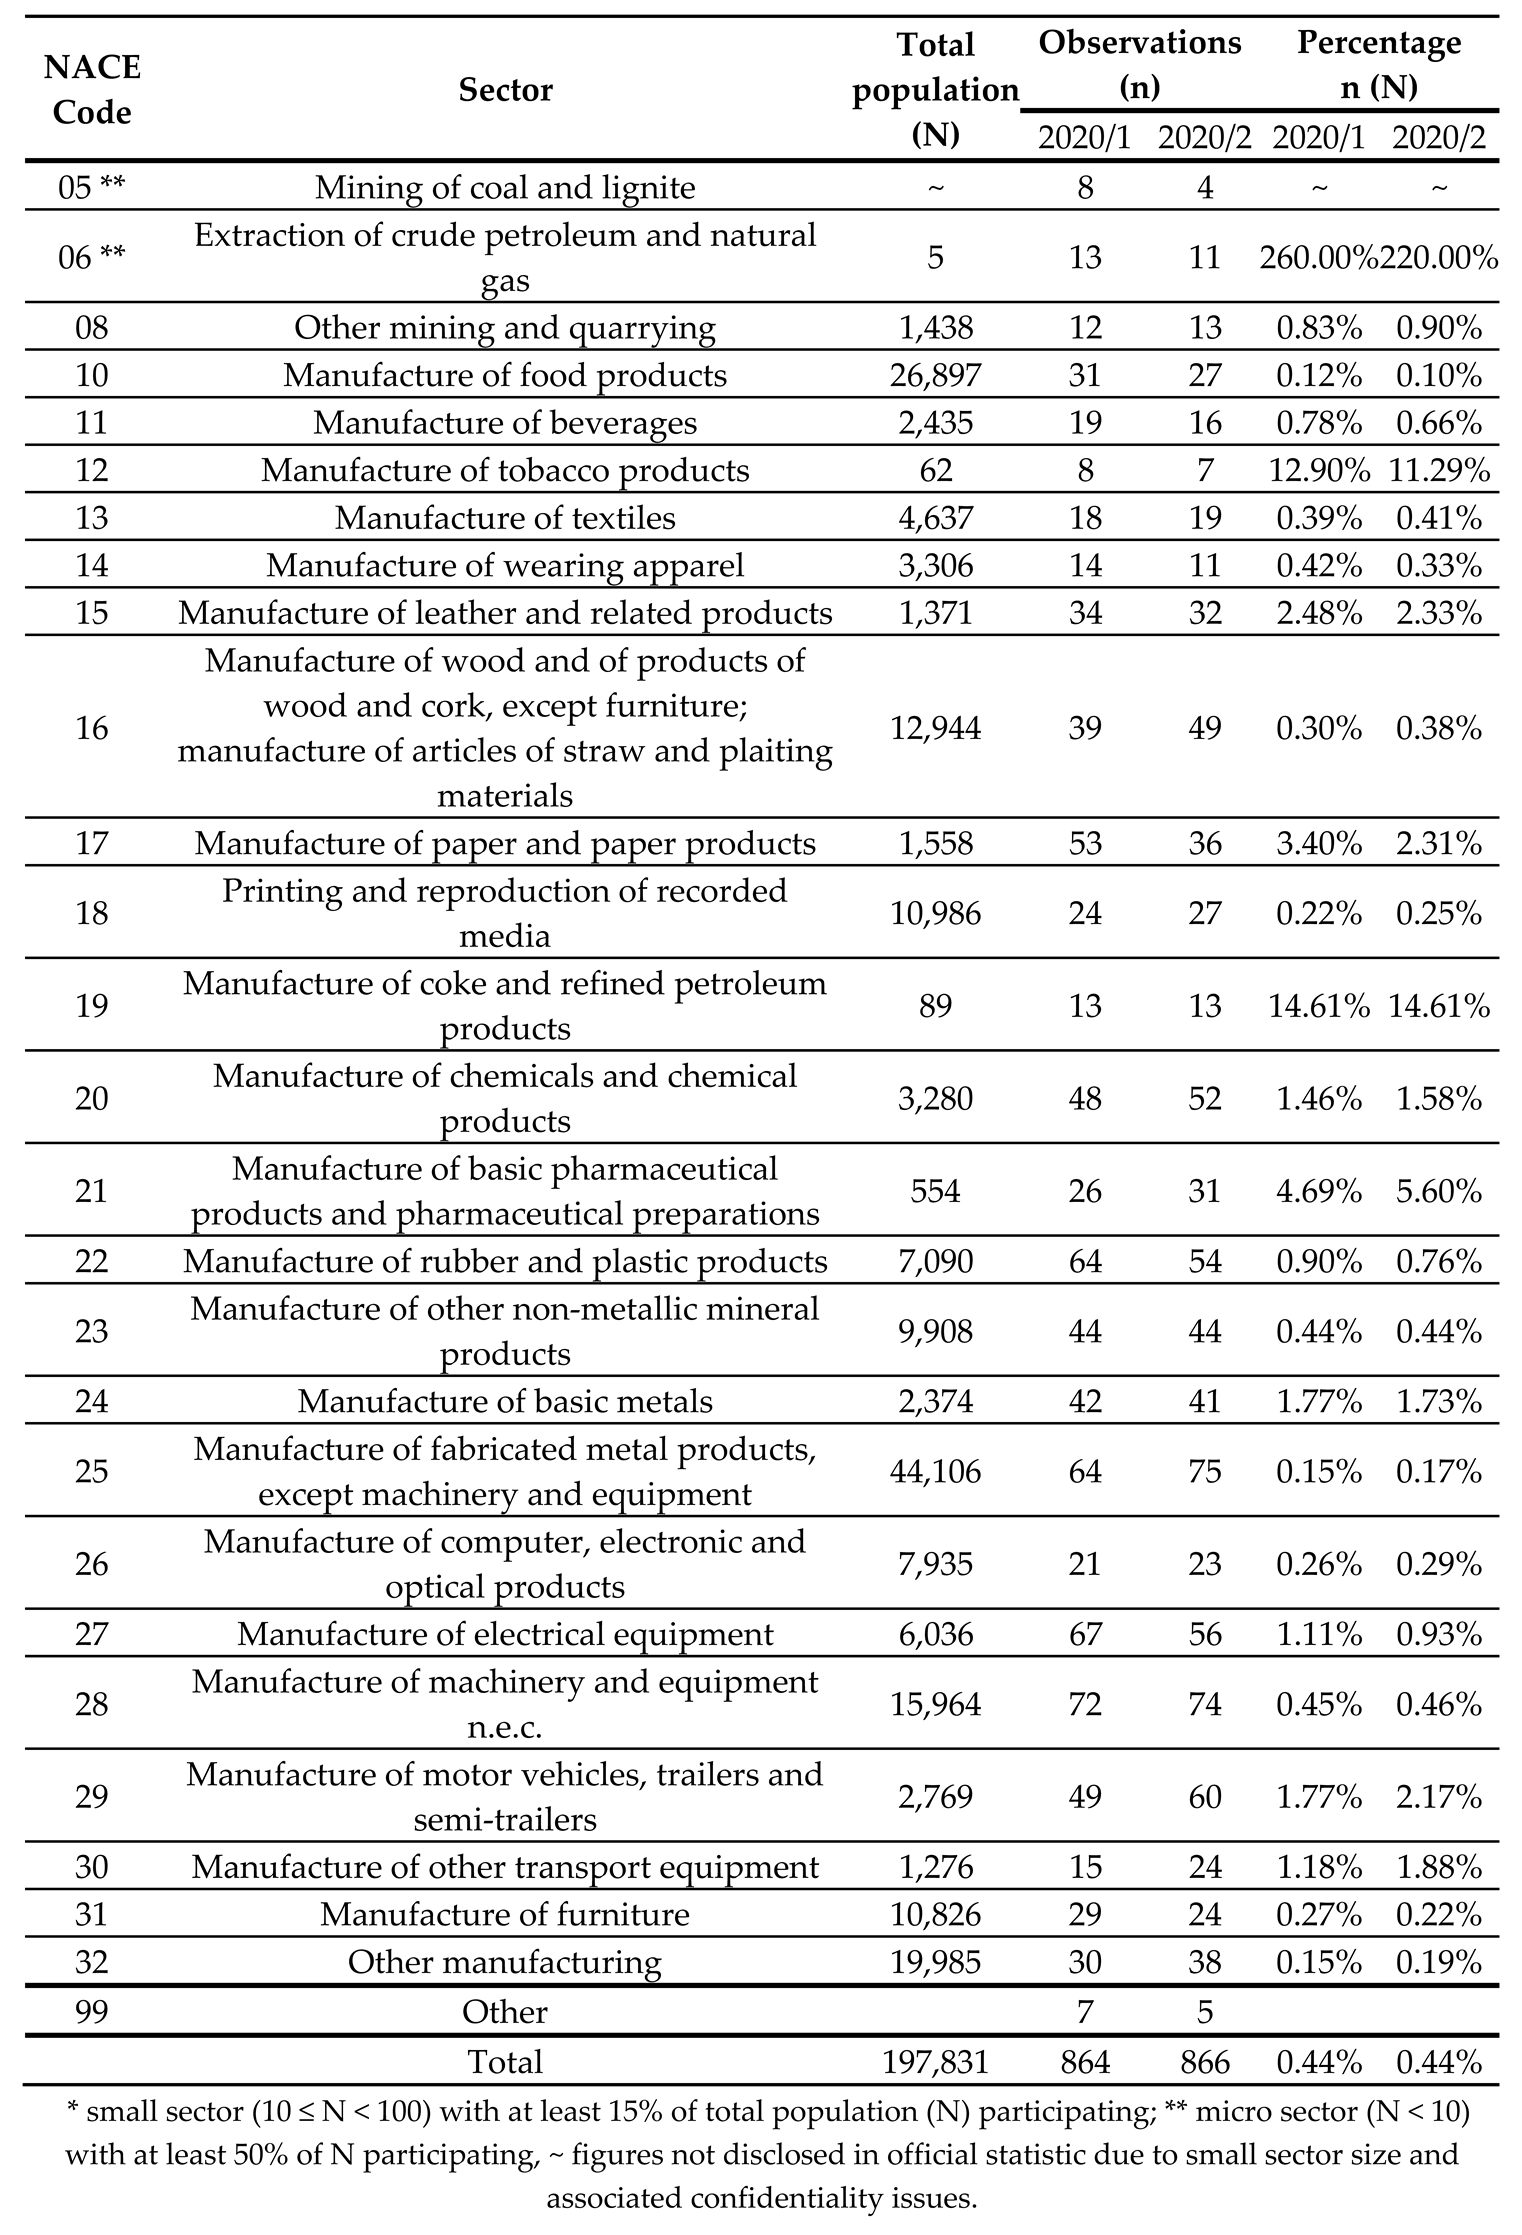 |
Table 2.
Converting Industry targets from 2019 to 1990 base year.
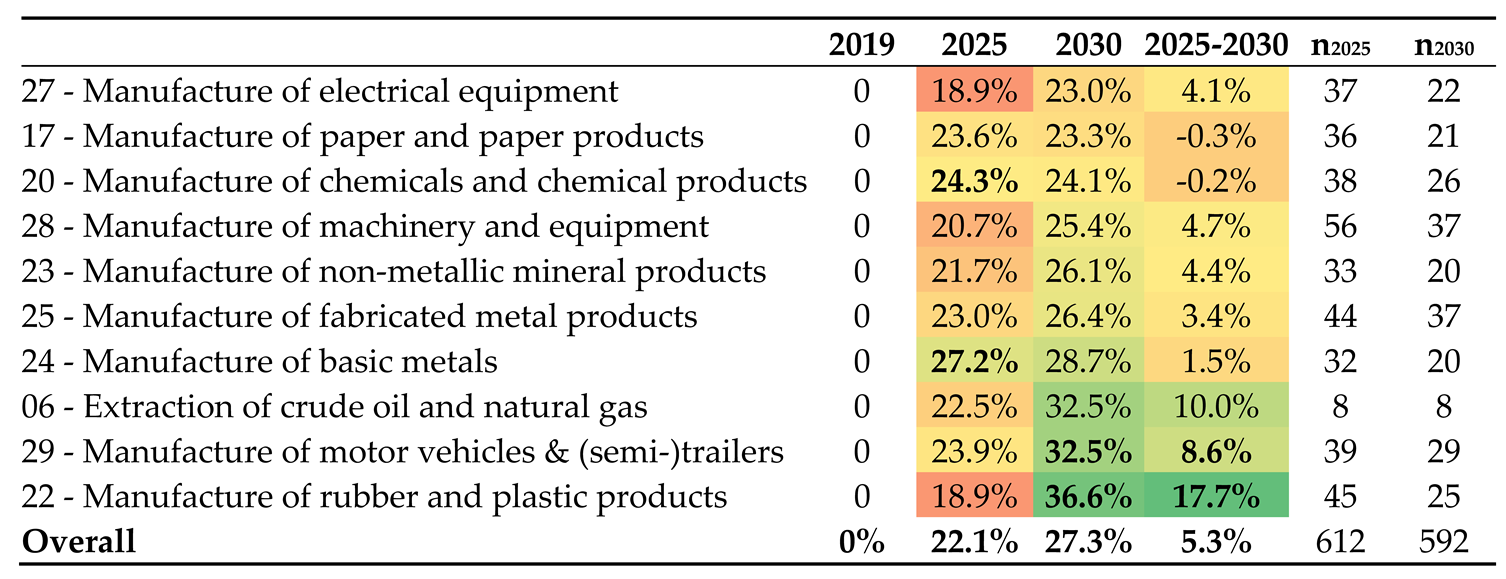 |
Table 3.
Converting Industry targets from 2019 to 1990 base year.
| CO2-equivalents (in million tonnes) | 1990 | 2019 | 2025 | 2030 |
|---|---|---|---|---|
| Absolute & Policy Target Emissions for Industry | 284 | 187 | 140 | |
| Absolute if measures are implemented as planned | 146 | 136 | ||
| Absolute savings of planned measures | +97 | 0 | -41 | -51 |
| %-change compared to 2019 | 52 % | 0 | -22.1 % | -27.3 % |
| %-change compared to 1990 | 0 | -34 % | -49 % | -52 % |
| Political Target (overall) | -65 % |
Table 4.
Impact estimation of 2025 Saving Targets.
| Measure | in % | in Mio t CO2-eq. | in TWh | ca. equivalent to |
|---|---|---|---|---|
| Energy Efficiency | 5.4 % | 10.2 | ~75 | |
| Self-generation of renewable energies | 4.7 % | 8.8 | ~65 | 380 km² photovoltaic |
| Reduction of process emissions | 3.2 % | 6.0 | ||
| Purchase of renewable energy | 5.3 % | 9.9 | ~73 | 9.700 wind turbines |
| Compensation | 3.4 % | 6.3 | 10.000 km² forest | |
| Other | 0.1 % | 0.0 | ||
| Estimated total GHG savings Industry | 22.1 % | 41 | ~138/~75 |
Disclaimer/Publisher’s Note: The statements, opinions and data contained in all publications are solely those of the individual author(s) and contributor(s) and not of MDPI and/or the editor(s). MDPI and/or the editor(s) disclaim responsibility for any injury to people or property resulting from any ideas, methods, instructions or products referred to in the content. |
© 2023 by the authors. Licensee MDPI, Basel, Switzerland. This article is an open access article distributed under the terms and conditions of the Creative Commons Attribution (CC BY) license (http://creativecommons.org/licenses/by/4.0/).
Copyright: This open access article is published under a Creative Commons CC BY 4.0 license, which permit the free download, distribution, and reuse, provided that the author and preprint are cited in any reuse.


