Submitted:
04 November 2025
Posted:
05 November 2025
You are already at the latest version
Abstract
This study examined the effects of two apple cultivars (Gala and Jonagold), four irrigation levels (0, 10, 20, and 30 mm), and four fertilization treatments (N0P0K0, N8P8K8, N16P16K16, N24P24K24) on nursery tree density. Jonagold exhibited a slightly higher mean density (95.63% ± 4.790) compared to Gala (93.50% ± 6.195). Tree density peaked at 99.38% ± 1.295 under the 30 mm watering norm and declined with reduced irrigation, while fertilization levels showed no significant independent effect. Both cultivars achieved their highest densities under the 30 mm watering norm (Gala: 99.25% ± 1.650; Jonagold: 99.50% ± 0.827), and several cultivar–fertilizer–irrigation combinations reached 100% density. The lowest density (89.00% ± 6.944) occurred in Gala under the N24P24K24 treatment without irrigation. Overall, results indicate that irrigation, particularly the 30 mm norm, is the key determinant of maximizing nursery tree density, with select combinations enabling complete survival.
Keywords:
irrigation
; fertilisation
; nursery production
; factorial experiment
; trees quality
1. Introduction
1.1. Importance of the Nursery Phase
The nursery phase is an important stage in the lives of grafted fruit trees, influencing their productivity and profitability in the orchard. Traditional nursery management usually employs a one-size-fits-all approach, providing uniform amounts of water and fertilizer to an entire block of trees. This approach, while simple, may fail to meet the specialized needs of individual trees or developmental stages, resulting in suboptimal growth and poor productivity.
1.2. Determinants of Nursery Success
1.2.1. Irrigation
Irrigation is crucial for nutrient distribution, root growth, and overall plant health. Even in soils rich in nutrients, a lack of water hinders absorption and limits growth potential [1,2,3]. Well-planned irrigation schedules can greatly enhance yields; however, Romanian nurseries face a significant technological gap. Numerous producers depend on outdated or basic systems, leading to water wastage and inefficiency. These issues are intensified by extreme weather events, including extended droughts and heat waves, which increase water needs beyond what conventional methods can provide. Young fruit trees, with their less developed root systems, are especially susceptible, making accurate irrigation management vital for robust growth and successful orchard establishment [4,5,6,7].
Like all cultivated plants, the growth of fruit trees in nurseries is heavily influenced by climatic and soil conditions. Among the critical factors—heat, light, air, and nutrients—water is especially important, constituting 75–85% (or more) of tree biomass [8,9,10,11]. Thus, water is essential for sustained horticultural productivity, yet high demand and decreasing availability due to climate change pose challenges to economic viability, environmental sustainability, and social equity [12,13,14].
1.2.2. Fertilization
Soil fertility plays a crucial role in the success of nurseries. Proper fertilization guarantees a steady supply of readily available nutrients that meet the needs of each species, rootstock, or scion–rootstock pairing at various growth stages [15]. Contemporary fertilization methods integrate long-term strategies for soil enhancement—like increasing organic matter, implementing crop rotation, and using green manures—with specific applications of mineral fertilizers (nitrogen to promote growth, phosphorus for root establishment, and potassium for resilience against stress) [16,17]. The efficacy of these methods relies on tailoring application rates, timing, and techniques based on the soil’s agrochemical characteristics and the plants’ requirements. During the growing season, fertilizers continue to be the primary nutrient source for horticultural crops [18]. Insufficient levels of nitrogen, phosphorus, or potassium can lead to reduced seedling density and overall growth. The amount of nutrients taken up each year is influenced by factors such as climate, soil type, tillage practices, and the strength of the grafted rootstock–scion combination [19]. Additionally, the genetic factor of the fruit tree planting material plays a vital role in how trees absorb and utilize nutrients. Firstly, the type of species and variety determine the nutritional needs.
1.2.3. Cultivar Selection
Selecting the right cultivar establishes the genetic basis for nursery production, affecting how well plants adapt to local soil conditions and climate as well as their resistance to various pests and diseases [20]. While it may have a smaller statistical impact on production variability compared to irrigation or fertilization, cultivar choice is crucial for the inherent growth potential and overall quality of the plants. Utilizing robust and well-suited cultivars lessens the need for corrective measures, ensuring both immediate success in the nursery and lasting stability in the orchard.
1.3. Challenges in Integrated Management
Although irrigation, fertilization, and cultivar selection are crucial, their effective integration in practice is often hindered by systemic challenges. Many nursery operators do not have a thorough grasp of how these elements work together, as this understanding typically originates from years of practical experience [21,22,23]. Financial constraints also limit their access to advanced technologies such as drip irrigation systems, high-quality fertilizers, and certified planting materials [24,25]. Additionally, climate change introduces more uncertainties, with possible droughts or new diseases threatening to disrupt well-structured management strategies [26,27]. The challenges of integrating irrigation, fertilizer, and cultivar in grafted tree production stem not from a lack of desire but from structural obstacles: gaps in knowledge, financial limitations, and the complexity of natural ecosystems. A successful approach necessitates technical knowledge, financial resources, and the ability to adapt to changing circumstances [28].
1.4. Current Limitations in Nursery Water and Nutrient Management
While water and nutrient management are acknowledged as crucial factors for nursery success, there are still several significant knowledge gaps regarding grafted fruit trees. Most of the existing studies on irrigation and fertilization have focused on mature orchards or container-grown systems, leaving the nursery stage less explored, even though it plays a vital role in developing root systems, vigor, and future orchard performance. Specifically, irrigation thresholds that are appropriate for shallow and developing root systems are not clearly defined, forcing managers to rely on findings from orchard studies that may not be suitable for young trees. Additionally, the relationship between water availability and nutrient supply is not well understood: although irrigation significantly affects nutrient uptake, only a limited number of studies have rigorously examined the interactions of various irrigation and fertilization strategies in grafted trees grown in open-field nursery settings. Recent studies emphasize both the potential and the constraints of our current understanding. Duan et al. [29] illustrated in extremely dry areas that the combination of irrigation with high levels of fertilization maximized both crop yield and water-use efficiency in apple orchards, highlighting the crucial role of interactions between water and nutrients. Likewise, Mankotia et al. [30] found that different fertigation schedules in high-density apple orchards not only affected fruit size and yield but also impacted biochemical quality traits, indicating that fertilization interacts with water to influence physiological results. In trials conducted in Europe, subsurface drip irrigation systems notably enhanced the yields and quality of Gala apples when compared to surface irrigation methods [31], while a worldwide meta-analysis of irrigation strategies validated that deficit irrigation techniques can improve water-use efficiency, yet their success is highly dependent on factors like cultivar, climate, and growth phase. Together, these results underline the significance of integrated management of water and nutrients, but they also point out that most of the evidence is derived from mature orchards rather than nurseries.
1.5. Research Rationale and Objectives
While apple (Malus domestica) cultivars are extensively grown and appreciated for their adaptability to climatic conditions in Romania, their substantial water needs and ineffective soil moisture utilization raise issues amid increasing climate variability [32]. Earlier research has explored the physiology of apple growth and orchard management, but there has been limited focus on quantifying the specific water and nutrient requirements of different rootstocks in nursery settings or on applying these insights toward practical management solutions. This research aims to fill that void by evaluating the following hypotheses: (H1) increasing irrigation within the tested operational range will increase nursery tree density and seedling quality more strongly than proportional increases in NPK alone, because water limits nutrient uptake and root growth in early stages; (H2) cultivar responses will differ, with Jonagold and Gala showing distinct sensitivity to water and nutrient levels; and (H3) water × fertilizer interactions will reveal threshold effects (i.e., a water level above which additional NPK provides diminishing returns), indicating an efficient management frontier that nurseries can adopt. These hypotheses are grounded in recent experimental findings on water-fertilizer coupling in juvenile apples and in broader syntheses calling for integrated water–nutrient management in horticulture. Our methodological framework merges physiological evaluations with hands-on nursery management to ensure both scientific accuracy and practical usability. The objective of this research is to (i) quantify the effects of incrementally increased irrigation and NPK levels—delivered through a practical drip-fertigation setup—on grafted apple tree density (proxy for production quality), (ii) test cultivar-specific responses (Gala vs. Jonagold) to the same management regimes, and (iii) explore interaction effects (water × fertilization × cultivar) that inform trade-offs between water inputs and fertilizer dosing under local pedoclimatic conditions.
2. Results and Discussion
2.1. Effect of Fertilisation, Watering Norm and Cultivar on Apple Trees Density
According to Table 1, the Cultivar factor demonstrated a statistically significant difference in tree density with Jonagold exhibiting a higher mean tree density percentage (95.63a ± 4.790) compared to Gala (93.50b ± 6.195). The different letter designations (‘a’ vs. ‘b’) indicate that this difference is significant, suggesting a genetic or inherent variation in canopy establishment or survival rate between the two apple varieties. The application of different water norms strongly influenced tree density. Tree density percentage progressively increased with rising water application, ranging from a low of 91.00c ± 5.987 at the 0mm norm to a maximum of 99.38a ± 1.295 at the 30 mm norm. The highest tree density (99.38a ± 1.295) was achieved under the 30mm irrigation level, which was significantly higher than all other water norms. The significant increase at 20 mm (95.38b ± 5.236) compared to the lower norms (0 mm and 10 mm both 91.00c ± 5.987 and 92.50c ± 4.701, respectively) highlights the critical positive effect of optimal water availability on tree establishment and survival. In contrast, the variation in NPK Fertilisation levels (N0P0K0 to N24P24K24) did not produce a statistically significant effect on the Tree Density Percentage. All four fertilisation treatments resulted in statistically similar tree density values, ranging narrowly from 93.75a ± 6.484 (N8P8K8) to 95.75a ± 4.882 (N0P0K0). The absence of significant differences (indicated by the single letter ‘a’ for all treatments) suggests that baseline soil nutrient levels or the lowest applied NPK rate (N0P0K0) were adequate to support tree survival and density, or that the specific range of NPK levels tested did not act as a limiting factor on initial establishment.
According to Figure 1, as the watering norm rises, the trees’ density for the Gala cultivar generally shows an upward trend. The trees’ density value is lowest at a watering norm of 0 mm, with a range of roughly 86 to 96%. The trees’ density values are consistently higher at the highest watering norm of 30 mm, typically ranging from 97 to 100%. The trees’ density is also influenced by the fertilisation treatments (N0P0K0, N8P8K8, N16P16K16, N24P24K24), with N24P24K24 frequently displaying the highest values within each watering norm. Additionally, as the watering norm rises, the Jonagold cultivar shows an increase in trees’ density. Like Gala cultivar, the lowest trees’ density values, which range from roughly 91 to 94%, are found at the 0 mm watering norm. The trees’ density values are highest at the 30 mm watering norm, regularly hitting 100% or very nearly. The effects of the various fertilisation methods are also apparent, as N24P24K24 continuously displays high trees’ density values.
Jonagold shows higher trees’ density values than Gala under the same conditions when comparing the two cultivars. At higher watering norms, this difference becomes more noticeable. At the given watering norms, Jonagold often reaches 100% trees’ density, whereas Gala reaches a maximum of roughly 100% but has a wider range of values. Overall, the findings indicate that a higher percentage of tree density is positively correlated with both using the Jonagold cultivar and raising the watering norm.
2.2. Effect of Water Norm and Cultivar on Apple Trees Density
At the lowest irrigation level (0 mm), both cultivars showed statistically similar and minimal tree density, with Gala at 90.50d ± 7.090 and Jonagold at 91.50cd ± 4.774, indicating that severe water stress negates any cultivar-specific advantage, as shown in Table 2. As the water norm increased, Jonagold consistently maintained a numerically higher or equal tree density percentage compared to Gala, and, crucially, demonstrated a significant response at a lower irrigation level. Specifically, Jonagold at the 10 mm norm reached 94.75b ± 3.810, which was statistically superior to Gala at the same norm (90.25d ± 4.494) and statistically comparable to the density achieved by Gala only at the 20 mm norm (94.00bc ± 5.544). At the highest irrigation level (30 mm), both cultivars attained their maximum tree density percentage, with Gala reaching 99.25a ± 1.650 and Jonagold reaching 99.50a ± 0.827. These results were statistically indistinguishable, suggesting that under non-limiting water conditions, both cultivars achieve near-perfect tree establishment. The statistically similar high densities across both cultivars at 30 mm confirm that adequate irrigation is the most critical factor for maximizing tree density, although the better performance of Jonagold at intermediate water levels suggests it may be marginally more resilient or efficient under moderate water limitations.
According to Figure 2, at higher watering norms, this difference becomes more noticeable between the two apple cultivars. At the given watering norms, Jonagold often reaches 100% density, whereas Gala reaches a maximum of roughly 100% but has a wider range of values. Overall, the findings indicate that a higher percentage of tree density is positively correlated with both using the Jonagold cultivar and raising the watering norm.
2.3. Effect of Fertilisation and Cultivar on Apple Trees Density
For the Gala cultivar, tree density remained remarkably consistent across all NPK fertilisation levels, ranging from a low of 93.00bc ± 5.912 at N16P16K16 to a high of 94.00c ± 6.751 at N8P8K8. All four Gala treatments fell into statistically similar groupings (‘bc’ or ‘c’), reinforcing the earlier observation from the main effects analysis that NPK application had minimal, if any, influence on Gala’s establishment success (Table 3). In contrast, the Jonagold cultivar showed a wider, though mostly overlapping, range of responses. The most prominent result is the significantly higher tree density percentage achieved by Jonagold under the N0P0K0 regime (97.75a ± 3.226). This N0P0K0 result was statistically superior to all four Gala treatments and to the Jonagold NPKv8 treatment (93.50abc ± 6.370), suggesting that, for Jonagold, the addition of NPK at the 8%/ha rate might have slightly depressed tree density relative to the unfertilised control, or that the baseline nutrient supply was already optimal. The other Jonagold treatments (N16P16K16 at 95.00ab ± 4.611 and N24P24K24 at 96.25bc ± 3.582) generally resulted in higher density than Gala treatments but were statistically less dense than the Jonagold N0P0K0 condition.
Across the various fertilisation treatments, the density values for the Gala cultivar remain comparatively constant (Figure 3). At roughly 94%, N0 P0 K0 and N8 P8 K8 and exhibit higher values. The values of trees’ density for the N16P16K16 and N24P24K24 treatments range from 93% to 93.5%. Conversely, the Jonagold apple cultivar shows a more noticeable fertilisation-based variation in trees’ density. At roughly 97.5%, the N0 P0 K0 treatment produces the highest density for this cultivar. The values then drop for N8P8K8 and N16P16K16, reaching roughly 93 and 95%.
The most significant difference is noticed with the N0 P0 K0 treatment, where Jonagold reaches approximately 97.5% compared to Gala, approximately 94%. The difference is less pronounced for the other fertilisation treatments.
2.4. Effect of Watering Norm and Fertilisation on Apple Trees Density
The data overwhelmingly confirm that irrigation level is the dominant factor determining tree density, irrespective of the fertilisation regime. Across all four NPK levels (N0P0K0, N8P8K8, N16P16K16, and N24P24K24), the highest tree density percentages were consistently achieved at the 30mm water norm , ranging from 99.00cd ± 0.943 (N8P8K8) to the perfect 100.00abc ± 0.000 (achieved with N16P16K16). This trend highlights that sufficient water is the prerequisite for maximizing tree establishment success. Conversely, the lowest tree densities for all NPK treatments were recorded at the 0 mm water norm. the interaction analyses revealed more nuanced effects. In the Cultivar × Fertilisation interaction, NPK application had virtually no effect on the Gala cultivar. For Jonagold, the unfertilised control (N0P0K0) resulted in the highest tree density percentage (97.75a ± 3.226), which was statistically superior to the N8P8K8 treatment, suggesting that the lowest application rate may have been marginally detrimental or that the baseline nutrient supply was already optimal for this cultivar. The most distinct role for fertilisation was observed in the Fertilisation × Water Norm interaction. Under conditions of 30 mm irrigation (low water stress), NPK levels were irrelevant, as all treatments achieved statistically high densities. Conversely, under 0 mm irrigation (high water stress), the N0P0K0 treatment resulted in the highest density (95.00bcd ± 2.867) within that group, statistically outperforming the highest rate (N24P24K24_0 mm at 89.00ab ± 6.944). This suggests that NPK application under severe drought conditions may exacerbate stress. Finally, at intermediate irrigation levels, particularly 20 mm, the highest NPK rate (N24P24K24_20 mm) yielded the highest tree density (96.50a ± 3.689) within that water norm, suggesting that higher NPK rates may be most beneficial when water is moderately limiting (Table 4).
There is a consistent pattern across all fertilisation treatments: the trees’ density rises in tandem with the watering norm (Figure 4). The 0 mm watering norm yields the lowest density values, which range from roughly 89% to 95%. The 30 mm watering norm consistently yields the highest density values, with values approaching or surpassing 100% for all fertilisation treatments.
There are some differences when the fertilisation treatments are compared. With trees’ density beginning higher at 0 mm and then sharply increasing with higher watering norms, the N0 P0 K0 and N24P24K24 treatments exhibit a similar pattern. In comparison to N0 P0 K0 and N24P24K24, the N8 P8 K8 and N16P16K16 treatments exhibit lower trees’ density values at the 0 mm and 10 mm watering norms. All fertilisation treatments produce high trees’ density at the 30 mm watering norm, with N16P16K16 and N24P24K24 displaying values at or close to 100%.
2.5. Classification of Apple Cultivars Based on Water and Fertilisation Treatments
The grafted apple trees’ density for different levels of factor interactions can be classified using the Lp-norm. The Lp-Norm was calculated using the general p-space normalization formula: . The values of the grafted apple trees’ density for each factor level were scaled (i.e., normalized) in the range [0, 1] with the formula . In our case, p = 2.5 was considered and we derive the values for the interaction factor Cultivar*Water_Norm*Fertilisation in Table 3 and Figure 5, Figure 6, Figure 7, Figure 8, Figure 9 and Figure 10.
Quartiles of Lp-Norm for the interaction factor Cultivar*Water_Norm*Fertilisation perform values, in decreasing order of tree density, from: 4, with Lp-Norm values range [0.9901; 1.0000]; 3, with Lp-Norm values range [0.9510, 0.9901]; 2, with Lp-Norm values range [0.9206; 0.9810] and 1, with Lp-Norm values range [0.8652; 0.9206].
The interactions between factors: fertilisation (N0 P0 K0, N8 P8 K8, N16P16K16, N24P24K24) and cultivar (Gala and Jonagold) at various watering norms (0 mm, 10 mm, 20 mm, and 30 mm) are shown in Figure 5 and Figure 6. Particularly with N16P16K16 and N24P24K24 fertilisation, the ‘Lp-Norm’ values for the Gala cultivar are low at 0 mm and 10 mm watering norms but greatly increase at 20 mm and 30 mm. Conversely, the Jonagold cultivar exhibits greater ‘Lp-Norm’ values at the 0 mm and 10 mm watering norms, especially when fertilized with N0 P0 K0 and N8 P8 K8. With lower values for Gala at low watering norms and higher values at high watering norms, the patterns for “Quartiles” are comparable to those for “Lp-Norm.”. Jonagold displays a range of values, with high “Quartiles” at watering norms of 20 and 30 mm.
The Lp-Norm values and quartiles for various water levels among the apple cultivars are illustrated in Figure 7 and Figure 8. These figures emphasize the different reactions of Gala and Jonagold to increased irrigation, with Gala displaying consistently low values at 0 and 10 mm and significantly high values at 30 mm, whereas Jonagold shows more variability but generally higher values.
Figure 7 shows a clear upward trend in tree density as irrigation increased. The largest gains occurred between the non-irrigated control and the 20 mm watering norm, while the step from 20 to 30 mm produced smaller but still positive effects.
Figure 8 illustrates the interaction of irrigation. Treatments clustered according to water availability, with the highest densities consistently observed under the 30 mm irrigation norm. Non-irrigated treatments grouped at the lowest density values regardless of fertilisation, underlining the dominant role of water. Between cultivars, Jonagold consistently occupied the higher-density range, confirming its genetic advantage under varying treatment combinations. The Gala cultivar exhibits very low values at 0 mm and 10 mm watering norms and very high values at 30 mm for both ‘Lp-Norm’ and ‘Quartiles’. The Jonagold cultivar exhibits a distinct pattern, exhibiting a range of low and high values across the various watering norms.
The combined impact of fertilisation and watering norm is examined in the final heatmap, Figure 9. The N0P0K0 fertilisation treatment exhibits higher values at 10 mm watering norm, but otherwise the values are low at the 0 mm and 10 mm watering norms. The values are primarily high at the 20 mm and 30 mm watering norms, with the 30 mm watering norm exhibiting the deepest red hues across all fertilisation treatments. This suggests that there is a strong correlation between higher values for the measured parameter and a higher watering norm.
This research examined fixed irrigation and fertilization methods in grafted apple trees, aiming to enhance the design of customized, stage-specific nursery strategies. Although our treatments remained constant, the findings establish a foundation for developing adaptable approaches by elucidating how the interaction of water, nutrients, and cultivar characteristics influences tree density. The findings of this research consistently demonstrate that adopting a personalized strategy for water and nutrient application significantly enhances the growth of grafted apple trees in nursery conditions. A key discovery is the positive correlation between increased tree density percentages and higher watering standards, with the 30 mm watering standard achieving the highest average tree density (99.38%) across all fertilization treatments and cultivars. Certain combinations of cultivars and fertilizers, such as Gala with N16P16K16/N24P24K24 and Jonagold with N0P0K0/N16P16K16, reached a full tree density of 100%. These results are consistent with earlier studies: Zhou et al. [33] found that applying mild deficit irrigation in conjunction with high fertilization maximized both dry matter accumulation and water use efficiency in juvenile apple trees, reinforcing our assertion that irrigation intensity plays a crucial role in nursery success. In addition, Li et al. [34] indicated that varying nitrogen levels had a significant impact on apple productivity under different irrigation conditions, which aligns with our observation that fertilization interacts with watering norms but is less critical than water availability in influencing tree density. The impact of cultivar is clearly reflected in our findings, with Jonagold demonstrating a higher average tree density of 95.63% compared to Gala’s 93.50%. Even without any fertilization (N0P0K0), Jonagold achieved a density of 97.75%, while Gala reached only 93.75%. Surprisingly, Jonagold reached very high density even in the absence of fertilization. There are several mechanisms that could account for this finding. First, the natural soil fertility at the research location might have been adequate to support initial growth, concealing the impact of any additional inputs. Second, an over-application of fertilizer could lead to osmotic or salt stress, especially in sandy soils that lack sufficient buffering capacity, potentially diminishing seedling survival in comparison to plots without fertilizer. Third, the genetic and physiological characteristics of Jonagold—such as enhanced intrinsic vigor, deeper root systems, or more effective nutrient absorption—could make it less reliant on extra fertilization than Gala. These factors underscore the importance of considering both genotype-specific physiological traits and soil characteristics when analysing the results of fertilization. These results indicate that the effects of fertilization are dependent on context, moderated by both soil conditions and genotype. This aligns with the findings of Zhang et al. [32], who indicated that genetic traits and planting density significantly influence nursery growth, highlighting that the choice of cultivar determines underlying growth potential. Our research on fertilization shows that although all NPK treatments resulted in high tree densities at the 30 mm watering standard, the impact of fertilization by itself was not as significant. This aligns with the findings of Duan et al. [35] and Ladon et al. [36], who reported that optimized fertilization enhances tree growth and yield, but water availability frequently serves as the key limiting factor, especially in younger trees. Csihon et al. [37] also pointed out that a balanced NPKMg fertilization influences growth indicators like trunk cross-sectional area and fruit yield, which supports our observation that fertilization interacts with both cultivar and irrigation but does not override the effects of water. Additionally, research conducted in high-density orchards emphasizes the significance of water management: Jiang et al. [38] and Tojnko & Čmelik [39] indicated that effective irrigation sustains tree growth and yield, while Wheeler et al. [40] pointed out that lack of water considerably hampers orchard performance. Our findings corroborate that watering standards have a greater impact on tree density compared to fertilization, reflecting these wider orchard observations. Lastly, integrated nutrient management practices that amalgamate organic and mineral contributions (Sompouviset et al., [41]; Zhang et al., [42]) underscore the practical importance of our results: while all NPK treatments achieved high densities under optimal watering conditions, customizing nutrient application based on cultivar and irrigation strategy can boost efficiency, minimize waste, and enhance seedling quality. The results of this research support earlier investigations showing that irrigation is the key factor influencing the initial growth of trees, while fertilization and the selection of cultivar influence growth results in conjunction with the availability of water.
In summary, our findings affirm that irrigation is crucial for the initial success of the nursery, while fertilization and cultivar choice influence outcomes in conjunction with water. Notably, the fact that certain combinations achieved full density without fertilizer underscores the potential for customized, stage-based strategies that incorporate soil fertility, cultivar traits, and irrigation dynamics. Such adaptive approaches could enhance efficiency, minimize inputs, and improve seedling quality beyond what fixed high-dose methods can provide.
The 4th quartile, which has the highest level of tree density, contains samples with all water norm with 30 mm and high fertilisation levels for both analysed cultivars, but the samples of Jonagold 20 mm*NPKv0 and 30 mm*NPKv0 which are without irrigation (Table 1 and Figure 10). The 3rd quartile, which has the second highest level of tree density, contains samples with water norm with 10 mm and 20 mm and with high fertilisation levels for both analysed cultivars, but the samples of Jonagold 10 mm*NPKv0 and Gala 0mm*NPKv0 which are without fertilisation. The 2nd quartile, contains samples with water norm with 0 mm, 10 mm and 20 mm and with all fertilisation levels for both analysed cultivars. This fact prescribes that the Lp-Norm classification method is successful for classification of the grafted apple trees’ density within the levels of the interaction factor Cultivar*Water_Nnorm*Fertilisation. Furthermore, the distribution of analysed factors over the Lp-Norm values and Lp-Norm quartiles proves that the Water_Norm factor performs the main effect over the grafted apple trees’ density.
3. Materials and Methods
3.1. Climate and Soil Conditions of the Research Location
The research was conducted in a private nursery in north-western Romania, located at geographical coordinates 47.0722° N, 21.9211° E, Bihor County, Oradea. Climatic conditions were characterised using data sourced from the Meteorological Station of Oradea, situated approximately 5 km southeast of the research site. In 2024, the average annual temperature was 10.7º C. The coldest month in 2024 was January, with an average temperature of –2.5º C, and the warmest month was July, with an average temperature of 24º C. The highest amount of precipitation was recorded in May, totalling 103.8 mm, whereas the lowest precipitation was observed in January 2024, with 12.5 mm, as shown in Table 5. Late spring frosts are common in March, given Romania’s climate. Early autumn frosts rarely occur in September, but are common in October and November. Late spring frosts occasionally occur as unexpected climatic events, posing a threat to the normal growth and development of grafted trees. In contrast, early autumn frosts have a minimal adverse impact, as they typically coincide with the end of the grafted trees’ vegetative cycle.
Geomorphologically, the experimental field features a predominantly flat terrain, subtly disrupted by depressions and gravel banks—elements characteristic of floodplain landscapes. A distinctive characteristic of the area is the presence of rolled gravel banks scattered throughout, appearing across all types of micro-relief—whether on gravel ridges, within depressions, or on flat terrain. The experiment involves soils of various textures, formed by fluvial deposits, particularly coarse, and fluvial gravel in various stages of evolution: from young, unevolved soils (alluvial soils – Aluviosols) to cambisols (Eutricambosols) and Preluvosols (former brown clayey alluvial soils). The experiment was carried out on a Preluvosol soil, distinguished by its layered composition, featuring an ochric horizon (Ao), an argic horizon (Bt), which exhibits clay accumulation resulting from migration from the upper layers, and a C horizon, representing the parent rock. The Ao horizon, 20–25 cm thick, is lighter in colour—typically brown or light brown; the Bt horizon, measuring approximately 75 cm in thickness, is characterized by significant clay accumulation and exhibits a more yellowish hue in its upper section. Beneath it, the C horizon consists of unconsolidated rock material. The soil reaction is acidic to slightly acidic, with a pH between 5.75 and 6.35 in the Ao and Bt horizons.
The humus content in the topsoil layer (0–10 cm) reaches 1.85% due to more intensive fertilisation. This value declines to 1.41% at a depth of 50–60 cm, marking the beginning of the subsoil layer. Within the subsoil (up to 115 cm depth), humus levels fluctuate between 1.46% and 1.70%, consistently remaining above 1%.
3.2. Research Methods and Biological Material Used
To achieve the research objectives, a comprehensive experimental framework was employed, structured as a three-factor factorial design of type 4 × 2 × 4. The study was conducted in five replications, arranged in Randomized Complete Block Design, with each plot containing four trees arranged at a density of 0.7× 0.25 m. Irrigation served as the primary factor in the study, encompassing four treatments: no irrigation, and irrigation levels of 10 mm, 20 mm, and 30 mm. The apple cultivars Gala and Jonagold were treated as the secondary factor, while fertilisation was evaluated as the tertiary factor. To obtain the NPK doses corresponding to the fertilisation treatments, complex fertiliser 16:16:16 was used in the following quantities (kg/ha): 50 kg for N8P8K8; 100 kg for N16P16K16; 150 kg for N24P24K24. The fertilizer is water-soluble and is produced by Azomureș, a Romanian manufacturer. We limited the treatments to NPK because these macronutrients represent the primary limiting factors for nursery apple growth. Micronutrients (e.g., Mg, Ca, Fe, Zn) were not included as independent treatments since preliminary soil analyses indicated sufficient baseline levels, and Romanian nursery practices prioritize NPK management. By focusing on NPK, our study isolates the macronutrients most relevant to root development and early seedling vigor, without confounding effects of nutrients that were not limiting in our experimental soil.
The irrigation and fertilization levels in our study (0, 10, 20, and 30 mm; N0P0K0, N8P8K8, N16P16K16, and N24P24K24) were chosen based on two practical considerations: (i) their alignment with common nursery management practices in northwestern Romania, and (ii) the technical limitations of the drip irrigation and fertigation system used, which allowed precise water delivery increments of 10 mm and fertilizer dosing corresponding to multiples of 8% of NPK 16:16:16. This factorial structure ensured both feasibility for nursery operators and statistical robustness in evaluating treatment effects. Henceforth, the treatment, originally N0P0K0, N8P8K8, N16P16K16, N24P24K24 will be consistently abbreviated as NPKv0, NPKv8, NPKv16, NPKv24.
For the establishment of field I, the land was prepared by deep plowing to a depth of 35 cm, performed in August 2023. This was followed by the levelling operation (through discing and harrowing) in October.
In field II, in the spring of 2024, a heading-back cut (or pruning to the base/bud) was executed. This was followed by two mechanical cultivations between the rows and four manual cultivations on the row. Furthermore, four manual weeding operations (to remove wild growth) and two tipping/pinching operations of the lateral shoots were also carried out.
For the control of diseases and pests, three treatments were applied using the fungicide Dithane (0.2%) and the insecticide Fastak (0.02%).
The initial biological material for the study consisted of MM 106 apple layer classified under the ‘Certified’ category. Dormant buds from the Gala and Jonagold cultivars were used for grafting. The propagation technique used in this study was chip budding. Early August 2024 was the carefully chosen time for the grafting because late summer is frequently thought to be ideal for bud establishment. Since the cambium of the scion and rootstock is still active at this time of year the graft will unite quickly and heal successfully.
Both Gala and Jonagold apples are among the most widely cultivated apple varieties, but they differ significantly in their fruit and tree characteristics. Gala is an autumn cultivar, producing medium-sized fruit with a thin, intense red skin and a predominantly sweet taste. Jonagold, a winter cultivar, yields much larger fruit with a yellowish-green skin partially covered in red, and is noted for its balanced, sweet-tart flavor. While the crisp, fine flesh of the Gala apple makes it ideal for immediate consumption, the semi-crisp and very juicy flesh of the Jonagold, combined with its excellent storage life, makes it suitable for both fresh eating and processing. In short, Gala is preferred for its sweet and delicate taste, while Jonagold is valued for its generous size and complex, perfectly balanced flavor. Both apple cultivars adapt well to the climatic conditions of Romania, especially in hilly areas [29].
Fertigation was performed using a drip system equipped with hoses measuring 16 mm in diameter and 0.4 mm in wall thickness. This hose was equipped with drippers positioned at intervals of 25 cm. Each dripper had four outlet holes and ensured a flow rate of 2 L/hour at a pressure of 1 bar. The daily duration of irrigation varied according to the desired irrigation rate: for a rate of 10 mm, irrigation lasted 3.5 hours; for a rate of 20 mm, the duration was 7 hours; for a rate of 30 mm, irrigation lasted 10.5 hours. The timing of fertigation was determined based on soil moisture variation and the minimum threshold (19.85%) for the variant irrigated with 10 mm. The soil moisture was measured with the HD2 moisture meter, at a depth of 15 cm. This moisture meter is a portable device for measuring soil moisture, produced by IMKO GmbH, Germany. Thus, to establish the fruit tree density, fertigation was applied in 2024 on 20 July, 17 August, 20 August and 23 August. Fertigation took place in the early morning (between 4:00 and 8:00 a.m.) to reduce water loss due to evaporation. The method is inefficient at midday due to heat and wind. A reservoir was used to create a concentrated blend of water-soluble fertilizer.
The density of grafted trees per hectare was determined by the number of seedlings in the plot that had suitable vigour to be used as planting material (higher than 1 meter and healthy). To ascertain the significance of the differences between the gradations and combinations of the three factors, the experimental data was processed using three-way ANOVA (P = 0.05) and Lp-norm (N = 5). The analysed factors were: Cultivar, with two levels Gala and JonaGold; Water_Norm, with four levels: 0mm (i.e., without any irrigation), 10 mm, 20 mm and 30 mm and Fertilisation with four levels: NPKv0 (i.e., without any fertilizers), NPKv8, NPKv16 and NPKv24.
The decision to use p=2.5 was guided by insights from existing literature and preliminary validation before the main experiment. Prior research has shown that p values ranging from 2 to 3 provide a balanced influence of both large and small deviations, thereby increasing the analysis’s sensitivity to changes in growth metrics. For example, Harb et al. [43] illustrated how effective L p -norms can be in approximating tree structures, underscoring the importance of intermediate p-values in identifying subtle differences in tree morphology. Furthermore, our preliminary tests conducted on a sample of our data indicated that p=2.5 yielded the most reliable and distinctive outcomes for assessing tree density and growth uniformity. This choice reinforces the reliability of the L p -norm analysis utilized in our research.
Statistical analysis of grafted trees density was conducted through XLSTAT v27.1.3.0 (Lumivero LLC, 1331 17th Street, Suite 404, Denver, CO 80202, USA).
3.3. Calculations
To assess the direct water usage (or agricultural water demand), a soil water balance was created based on the moisture levels in the soil at both the start and end of each month from April to September.
The soil water reserve (R) was determined using the formula [44]:
where DA is the bulk density (t/m³); H is the depth of the active soil layer (m); W is the soil moisture content (%).
R=100×DA×H×W
For the irrigation norm during the vegetation period in the case of a closed-circuit water balance (irrigation hydrological regime without groundwater contribution), the relation is [44]:
where ∑(E+T) is the overall water usage from the soil throughout the growing season; Rf is the amount of available soil water at the conclusion of the growing season, calculated using a formula that factors in the soil bulk density for the specified depth, the depth of the saturated soil layer, and the wilting point for that depth (m³/ha); Ri is the initial amount of soil water available in the wetted layer at the start of the growing season, calculated using a formula similar to the one for the final reserve, but utilizing the field capacity of the soil rather than the wilting point (m³/ha); Pv is the total summer rainfall that is equal to or exceeds 5 mm.
∑m= ∑ (E+T) + Rf+ Ri-Pv (m3/ha);
To establish the moment when soil water supplementation through irrigation is necessary, the minimum threshold (Pmin) was determined, which represents the lower limit of soil moisture readily accessible to plants. For medium-textured soils, which include the soil of the experimental plot, the minimum threshold (Pmin) (as a percentage) was calculated using the formula [44]:
Pmin = CO + ½(CC-CO);
where CO is the wilting coefficient (%); CC is the Field Capacity (FC) (%).
The volumetric minimum threshold (m³/ha) was calculated using the formula [43]:
Pmin.vol.=100 x DA x H x Pmin.
For the indirect determination of water consumption, potential evapotranspiration (PET) was estimated using the Thornthwaite method. This method estimates PET as a function of air temperature using the formula [44]:
where ETP is potential monthly evapotranspiration (m3 per month); tn is the mean monthly temperature for which ETP is calculated (°C); I is annual thermal index.
a - empirical coefficient determined by the relation: a=0,000000675 I2 – 0,000077 I +0,01279211 I +0,49239; K - light coefficient (or correction factor) based on the field’s latitude (for the April–September period: 1.135, 1.3, 1.32, 1.133, 1.225, 1.045).
3.4. Water Consumption for Different Irrigation Conditions
Considering water consumption across various irrigation methods, the analysis identified how precipitation, soil moisture reserves, and irrigation standards contribute to meeting the water requirements of apple seedlings (Table 6).
In 2024, for the non-irrigated variant, seedlings relied on useful precipitation in a proportion of 81.67% and on the internal soil reserve in an amount of 18.33% to meet their water requirements, as shown in Figure 11. Under the 10 mm irrigation regime, water consumption was covered by precipitation (76.66%), soil reserves (12.88%) and irrigation (7.46%). In terms of water consumption coverage for the variant irrigated with a watering rate of 20 mm, there was a slight reduction in the contribution of precipitation (74.98%) and soil reserves (10.70%) against a significant increase in the contribution of irrigation (14.23%), compared to the 10 mm irrigation rate. Changing the irrigation rate from 20 to 30 mm led to a reduction in the contribution of soil water (4.44%) associated with a constant contribution of precipitation and an increase in the contribution of irrigation (21.17%) to meet the water requirements of the seedlings.
4. Conclusions
This research found that the availability of water was the key factor influencing the density of grafted apple seedlings in nursery settings. Under the conditions of this study, descriptive trends indicated that higher irrigation rates were associated with higher tree density, while the effects of fertilization were less clear and potentially cultivar-dependent. Throughout all treatments, the 30 mm irrigation level consistently yielded the highest values for tree density, while the impact of fertilization was more inconsistent and dependent on the context. Only certain cultivar-fertilizer combinations, like Gala with N16P16K16 or N24P24K24 and Jonagold with N0P0K0 or N16P16K16, reached full density (100%), but these results should be viewed with caution since statistical tests were not conducted to verify whether these differences are significant compared to other treatments. The levels of irrigation and fertilization examined were selected to align with local nursery practices and to mitigate risks such as over-watering, nutrient leaching, or salt stress in the coarse soils at the experimental site. Within these limits, tree density seemed to reach a plateau at 30 mm of irrigation, indicating that water was the primary limiting factor under the conditions studied.
While the findings are compelling, the regional distinctiveness and small number of cultivars pose a potential barrier to generalizability. Future research should broaden the scope to include more apple cultivars and geographic regions to validate these findings across varied pedoclimatic situations. The results indicate that a 30 mm irrigation standard optimally increased the density of grafted apple trees under the examined conditions; however, the relevance of these findings should be evaluated in relation to cultivar-specific and regional differences. This experiment focused solely on the Gala and Jonagold cultivars, which are commonly cultivated in Romania, but other cultivars with varying scion-rootstock combinations might display different physiological reactions to water and nutrient management. For instance, dwarfing rootstocks typically have shallower root systems and modified nutrient absorption capabilities, which could alter the point at which irrigation becomes inadequate. Additionally, the coarse, gravelly soils found in northwestern Romania present a pedoclimatic scenario susceptible to nutrient leaching, so the findings from this location might not be entirely applicable to nurseries on heavier clay soils or in areas with greater levels of baseline precipitation. In regions with higher moisture levels, the added advantage of a 30 mm irrigation may be less significant, whereas in dry climates, more substantial water standards or alternative irrigation techniques may be required to reach comparable densities. One final limitation in the methodology is the relatively small dimensions of the experimental plots, which contained merely four trees for each treatment replicate. Although employing a Randomized Complete Block Design (RCBD) and systematically analyzing five replicates helps to reduce variability, this limited plot size raises the possibility that individual outlier trees could disproportionately affect the average results. Future research focused on validating these findings would be improved by utilizing larger experimental units (for instance, 10–20 trees per plot) to obtain a more consistent and reliable average treatment response, thereby increasing the overall statistical power and applicability of the results.
These points highlight that while our results offer compelling evidence within the tested framework, they should be confirmed across a broader spectrum of cultivars, soil types, and climate conditions to create comprehensive, universally applicable guidelines for nursery management.
Supplementary Materials
The following supporting information can be downloaded at website of this paper posted on Preprints.org.
Author Contributions
Conceptualization, A.V. and A. C. T.; methodology, A. P..; software, A. C. T.; validation, A. P. and A. C. T.; formal analysis, A.V.; investigation, A. P.; resources, A.V.; data curation, A.P.; writing—original draft preparation, A. C. T.; writing—review and editing, A.V and A. P.; visualization, A.V.; supervision, A. P. and A. C. T.; project administration, A.V.; funding acquisition, A.V. All authors have read and agreed to the published version of the manuscript.
Funding
The APC was funded by the University of Oradea.
Data Availability Statement
The original contributions presented in this study are included in the article/Supplementary Material. Further inquiries can be directed to the corresponding author(s).
Conflicts of Interest
The authors declare no conflicts of interest.
References
- Spinelli, G.; Bonarrigo, A.C.; Cui, W.; Grobowsky, K.; Jordan, S.H.; Ondris, K.; Dahlke, H.E. Evaluating the Distribution Uniformity of Ten Overhead Sprinkler Models Used in Container Nurseries. Agricultural Water Management 2024, 303, 109042. [Google Scholar] [CrossRef]
- Tardivo, C.; Patel, S.; Bowman, K.D.; Albrecht, U. Nursery Characteristics and Field Performance of Nine Novel Citrus Rootstocks under HLB-Endemic Conditions. HortScience 2025, 60, 931–939. [Google Scholar] [CrossRef]
- Wei, H.; Xu, W.; Kang, B.; Eisner, R.; Muleke, A.; Rodriguez, D.; Harrison, M.T. Irrigation with Artificial Intelligence: Problems, Premises, Promises. Hum.-Cent. Intell. Syst. 2024, 4, 187–205. [Google Scholar] [CrossRef]
- Thakur, S.; Sharma, N.C.; Kumar, P.; Verma, P.; Singh, U.; Verma, P. Optimisation of Budding Timing and Methods for Production of Quality Apricot Nursery Plants. J. Hortic. Sci. Biotechnol. 2025, 1–18. [Google Scholar] [CrossRef]
- Carr, M.K.V. Irrigation Research: Developing a Holistic Approach. Acta Hortic. 2000, 537, 733–739. [Google Scholar] [CrossRef]
- Rosa, L.; Ragettli, S.; Sinha, R.; Zhovtonog, O.; Yu, W.; Karimi, P. Regional Irrigation Expansion Can Support Climate-Resilient Crop Production in Post-Invasion Ukraine. Nat. Food 2024, 5, 684–692. [Google Scholar] [CrossRef]
- Nicolae, S.; Butac, M.; Chivu, M. Comparative Study in the Nursery of Vegetative Plum Rootstocks, ‘Mirodad 1’ and ‘Saint Julien A’. Sci. Pap. Ser. B Hortic. 2024, LXVIII(1), 94–98. Print ISSN 2285-5653.
- Kumawat, K.L.; Raja, W.H.; Nabi, S.U. Quality of Nursery Trees Is Critical for Optimal Growth and Inducing Precocity in Apple. Appl. Fruit Sci. 2024, 66, 2135–2143. [Google Scholar] [CrossRef]
- Kumawat, K.L.; Raja, W.H.; Chand, L.; Rai, K.M.; Lal, S. Influence of Plant Growth Regulators on Growth and Formation of Sylleptic Shoots in One-Year-Old Apple cv. Gala Mast. J. Environ. Biol. 2023, 44, 122–133. [Google Scholar] [CrossRef]
- Ray, S.; Majumder, S. Water Management in Agriculture: Innovations for Efficient Irrigation. Mod. Agron. 2024, 169–185. [Google Scholar]
- Heera, J. Challenges Encountered by Nursery Owners When Producing Seedlings. Indo-Am. J. Agric. Vet. Sci. 2025, 13(2), 1–10.
- Oyedele, O.O.; Adebisi-Adelani, O.; Amao, I.O.; Ibe, R.B.; Arogundade, O.; Amosu, S.A.; Alamu, O.O. Knowledge Uptake of Stakeholders in Fruit Tree Production Training in Ibadan, Oyo State. J. Agric. Ext. 2025, 29(3), 101–110. [Google Scholar] [CrossRef]
- Lian, H.N.; Sema, A.; Singh, B.; Sarkar, A.; Konjengbam, R. Nursery Performance of Khasi Mandarin on Different Citrus Rootstocks in Northeast India. Appl. Fruit Sci. 2025, 67, 155. [Google Scholar] [CrossRef]
- Kour, R.; Alavekar, M.S.; Singh, R.P.; Singh, D. Nursery Management and Disease Control. Hortic. Crops 2025, 174. [Google Scholar]
- Dominguez, L.I.; Robinson, T.L. Effects of Tree Lateral Branch Number and Angle on Early Growth and Yield of High-Density Apple Trees. HortTechnology 2025, 35, 191–201. [Google Scholar] [CrossRef]
- Mayer, J. My Little Fruit Tree; Franckh Kosmos Publishing House: Stuttgart, Germany, 2019; p. 113. ISBN 9783440163645.
- Zahir, S.A.D.M.; Jamlos, M.F.; Omar, A.F.; Nordin, M.A.H.; Raypah, M.E.A.; Mamat, R.; Muncan, J. Quantifying the Impact of Varied NPK Fertilizer Levels on Oil Palm Plants during the Nursery Stage: A Vis-NIR Spectral Reflectance Analysis. Smart Agric. Technol. 2025, 11, 100864. [Google Scholar] [CrossRef]
- Mir, M.S.; Raja, W.; Kanth, R.H.; Dar, E.A.; Shah, Z.A.; Bhat, M.A.; Salem, A. Optimizing Irrigation and Nitrogen Levels to Achieve Sustainable Rice Productivity and Profitability. Sci. Rep. 2025, 15, 6675. [Google Scholar] [CrossRef]
- Rotowa, O.J.; Małek, S.; Jasik, M.; Staszel-Szlachta, K. Substrate and Fertilisation Used in the Nursery Influence Biomass and Nutrient Allocation in Fagus sylvatica and Quercus robur Seedlings after the First Year of Growth in a Newly Established Forest. Forests 2025, 16, 511. [Google Scholar] [CrossRef]
- Choi, S.-H.; Kim, D.-Y.; Lee, S.Y.; Lee, K.H. Effect of Nutrient Management during the Nursery Period on the Growth, Tissue Nutrient Content, and Flowering Characteristics of Hydroponic Strawberry in 2022. Horticulturae 2024, 10, 1227. [Google Scholar] [CrossRef]
- Chu, L.; Liu, D.; Li, C.; Xu, C.; Huang, H. Dwarfing of Fruit Trees: From Old Cognitions to New Insights. Hortic. Adv. 2025, 3, 7. [Google Scholar] [CrossRef]
- Aglar, E.; Ozturk, B.; Saracoglu, O.; Demirsoy, H.; Demirsoy, L. Rootstock and Training Effects on Growth and Fruit Quality of Young ‘0900 Ziraat’ Sweet Cherry Trees. Appl. Fruit Sci. 2024, 66, 61–70. [Google Scholar] [CrossRef]
- Hasan, M.U.; Malik, A.U.; Saleem, B.A.; Raza, H.; Amin, M. Supplementation of Potassium and Phosphorus Nutrients to Young Trees Reduced Rind Thickness and Improved Sweetness in ‘Kinnow’ Mandarin Fruit. Erwerbs-Obstbau 2023, 65, 1657–1666. [Google Scholar] [CrossRef]
- Nečas, T.; Wolf, J.; Kiss, T.; Göttingerová, M.; Ondrášek, I.; Venuta, R.; Laňar, L.; Letocha, T. Improving the Quality of Nursery Apple and Pear Trees with the Use of Different Plant Growth Regulators. Eur. J. Hortic. Sci. 2020, 85, 430–438. [Google Scholar] [CrossRef]
- Wolf, J.; Kiss, T.; Ondrašek, I.; Nečas, T. Induction of Lateral Branching of Sweet Cherry and Plum in Fruit Nursery. Not. Bot. Horti Agrobo Cluj Napoca 2019, 47, 962–969. [Google Scholar] [CrossRef]
- Sayyad-Amin, P. A Review on Breeding Fruit Trees Against Climate Changes. Erwerbs-Obstbau 2022, 64, 697–701. [Google Scholar] [CrossRef]
- Ferreira, C.S.S.; Soares, P.R.; Guilherme, R.; Vitali, G.; Boulet, A.; Harrison, M.T.; Malamiri, H.; Duarte, A.C.; Kalantari, Z.; Ferreira, A.J.D. Sustainable Water Management in Horticulture: Problems, Premises, and Promises. Horticulturae 2024, 10, 951. [Google Scholar] [CrossRef]
- Neupane, K.; Witcher, A.; Baysal-Gurel, F. An Evaluation of the Effect of Fertilizer Rate on Tree Growth and the Detection of Nutrient Stress in Different Irrigation Systems. Horticulturae 2024, 10, 767. [Google Scholar] [CrossRef]
- Duan, X.; Zhang, H.; Li, Y.; Zhang, J.; Wang, L.; Zhang, X.; Zhang, Y.; Zhang, Z. Optimization of Irrigation and Fertilization of Apples under Magnetoelectric Water Irrigation in Extremely Arid Areas. Front. Plant Sci. 2024, 15, 1356338. [Google Scholar] [CrossRef] [PubMed]
- Mankotia, S.; Sharma, J. C.; Verma, M. L. Impact of Irrigation and Fertigation Schedules on Physical and Biochemical Properties of Apple under High-Density Plantation. Commun. Soil Sci. Plant Anal. 2024, 56, 985–993. [Google Scholar] [CrossRef]
- Mašán, V.; Burg, P.; Vaštík, L.; Vlk, R.; Souček, J.; Krakowiak-Bal, A. The Evaluation of the Impact of Different Drip Irrigation Systems on the Vegetative Growth and Fruitfulness of ‘Gala’ Apple Trees. Agronomy 2025, 15(9), 2161. [Google Scholar] [CrossRef]
- Chira, L.; Pașca, I. Apple Trees Growing; MAST Publishing House: Bucharest, Romania, 2004; p. 37. ISBN 9738497981.
- Zhou, H.; Niu, X.; Yan, H.; Zhao, N.; Zhang, F.; Wu, L.; Yin, D.; Kjelgren, R. Effect of Water–Fertilizer Coupling on the Growth and Physiological Characteristics of Young Apple Trees. Agronomy 2023, 13, 2506. [Google Scholar] [CrossRef]
- Li, X.; Zhang, H.; Li, Y.; Zhang, J.; Wang, L.; Zhang, X.; Zhang, Y.; Zhang, Z. Effects of water and nitrogen regulation on apple tree growth and physiological characteristics. Plants 2024, 13, 2404. [Google Scholar] [CrossRef] [PubMed]
- Zhang, Q.; Zhang, H.; Zhang, J.; Zhang, X.; Zhang, Y.; Zhang, Z. Optimizing planting density for production of high-quality apple nursery stock. New Zeal. J. Crop Hortic. Sci. 2015, 43, 1–10. [Google Scholar]
- Ladon, T.; Zhang, H.; Li, Y.; Zhang, J.; Wang, L.; Zhang, X.; Zhang, Y.; Zhang, Z. Optimizing apple orchard management: Investigating the impact of planting density, training systems, and fertigation levels on tree growth, yield, and fruit quality. Sci. Hortic. 2024, 289, 110428. [Google Scholar] [CrossRef]
- Csihon, Á.; Holb, I.J.; Szabó, Z.; Kovács, G.; Varga, A.; Tóth, B.; Sárközi, M.; Tóth, M.; Bálint, A.; Kocsis, M.; et al. Impacts of N-P-K-Mg fertilizer combinations on tree parameters and fungal disease incidences in apple cultivars with varying disease susceptibility. Horticulturae 2024, 10, 1217. [Google Scholar] [CrossRef]
- Jiang, X.; Zhang, H.; Zhang, J.; Zhang, X.; Zhang, Y.; Zhang, Z. Investigation of effective irrigation strategies for high-density apple orchards. Agronomy 2021, 11, 732. [Google Scholar] [CrossRef]
- Tojnko, S.; Čmelik, Z. Influence of irrigation and fertilization on performances of young apple trees. Agric. Conspec. Sci. 2000, 65, 17–20. [Google Scholar] [CrossRef]
- Wheeler, E.; Zhang, H.; Zhang, J.; Zhang, X.; Zhang, Y.; Zhang, Z. Effects of irrigation on cropping of ‘Elstar’, ‘Golden Delicious’, ‘Idared’, and ‘Jonagold’ apple trees. Agric. Conspec. Sci. 2005, 70, 17–20. [Google Scholar]
- Sompouviset, P.; Zhang, H.; Zhang, J.; Zhang, X.; Zhang, Y.; Zhang, Z. Mulching and irrigation strategies for climate-resilient apple orchards. Sci. Rep. 2025, 15, 86552. [Google Scholar]
- Zhang, H.; Zhang, J.; Zhang, X.; Zhang, Y.; Zhang, Z. Effects of fertilization and drip irrigation on the growth and physiological characteristics of young apple trees. Forests 2024, 15, 1651. [Google Scholar] [CrossRef]
- Harb, B.; Kannan, S.; McGregor, A. Approximating the Best–Fit Tree Under Lp Norms. In Proceedings of the 8th International Workshop on Approximation Algorithms for Combinatorial Optimization Problems (APPROX 2005) and the 8th International Workshop on Randomization and Computation (RANDOM 2005), Berkeley, CA, USA, 22–24 August 2005; Springer: Berlin/Heidelberg, Germany, 2005; pp. 118–129. [Google Scholar]
- Enache, L. Agrometeorology, Sitech Publishing House: Bucharest, Romania, 2012.
Figure 1.
Interaction between fertilisation, watering norm and cultivar.
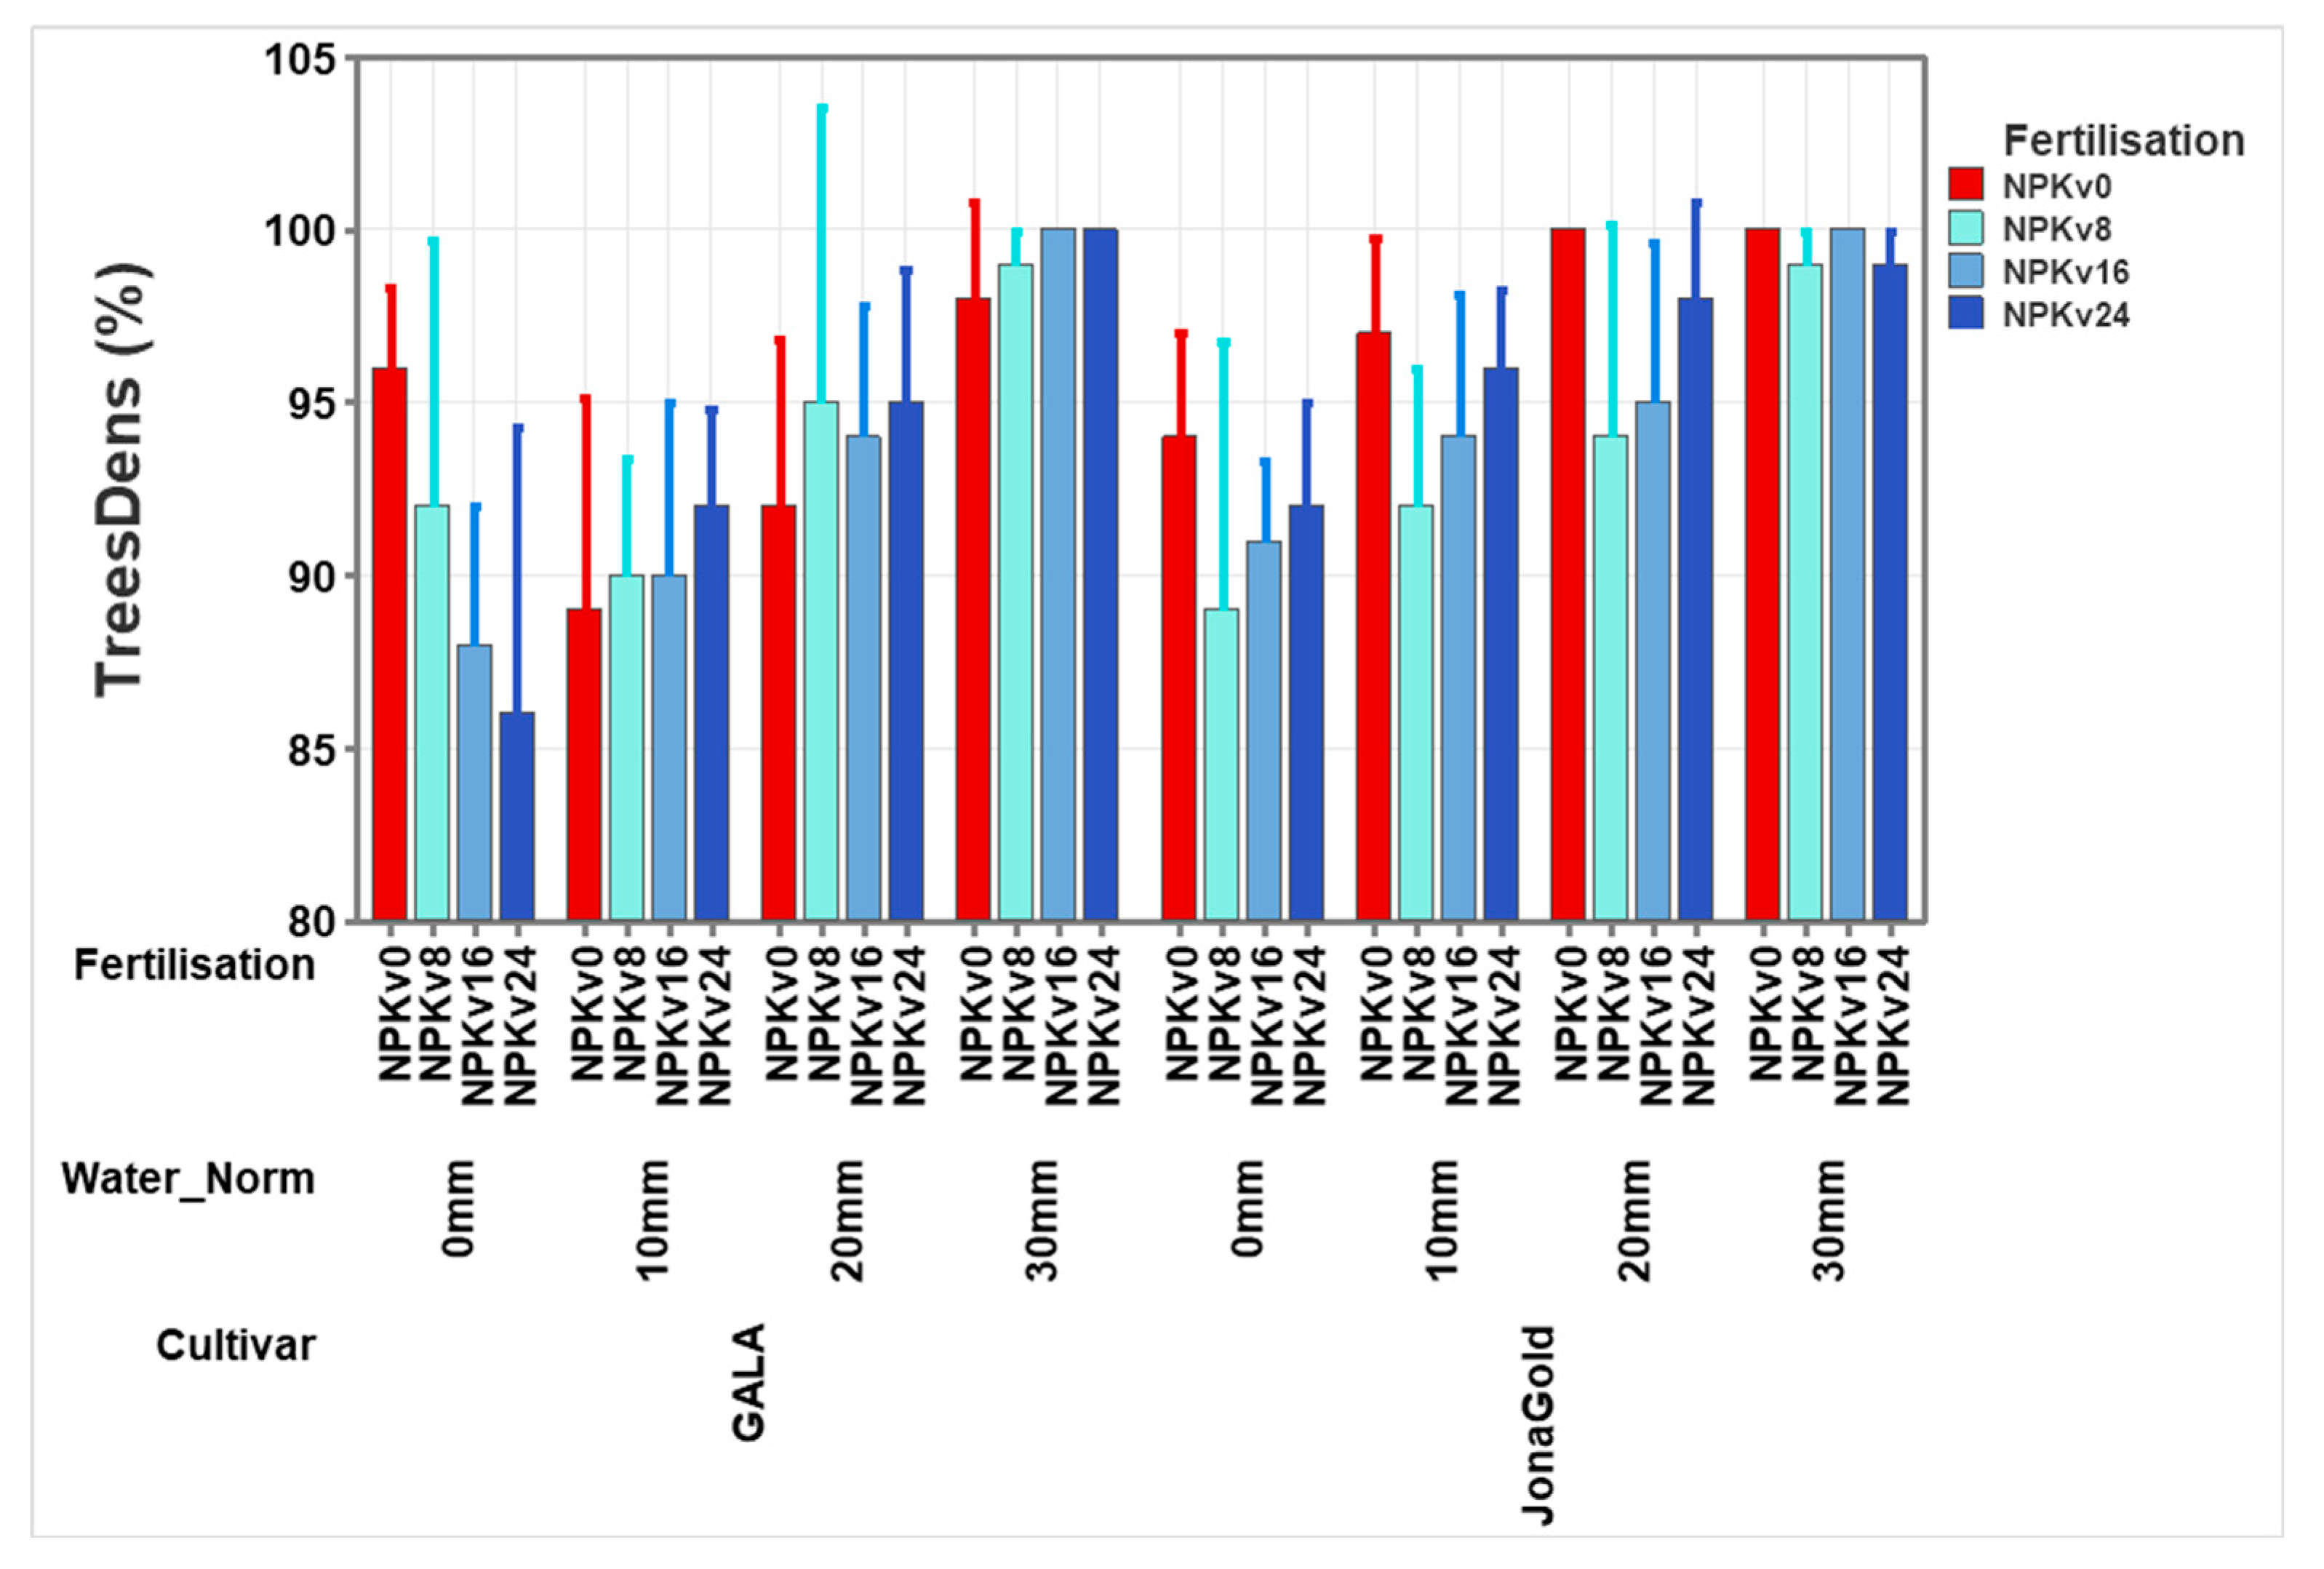
Figure 2.
Interaction between watering norm and cultivar.
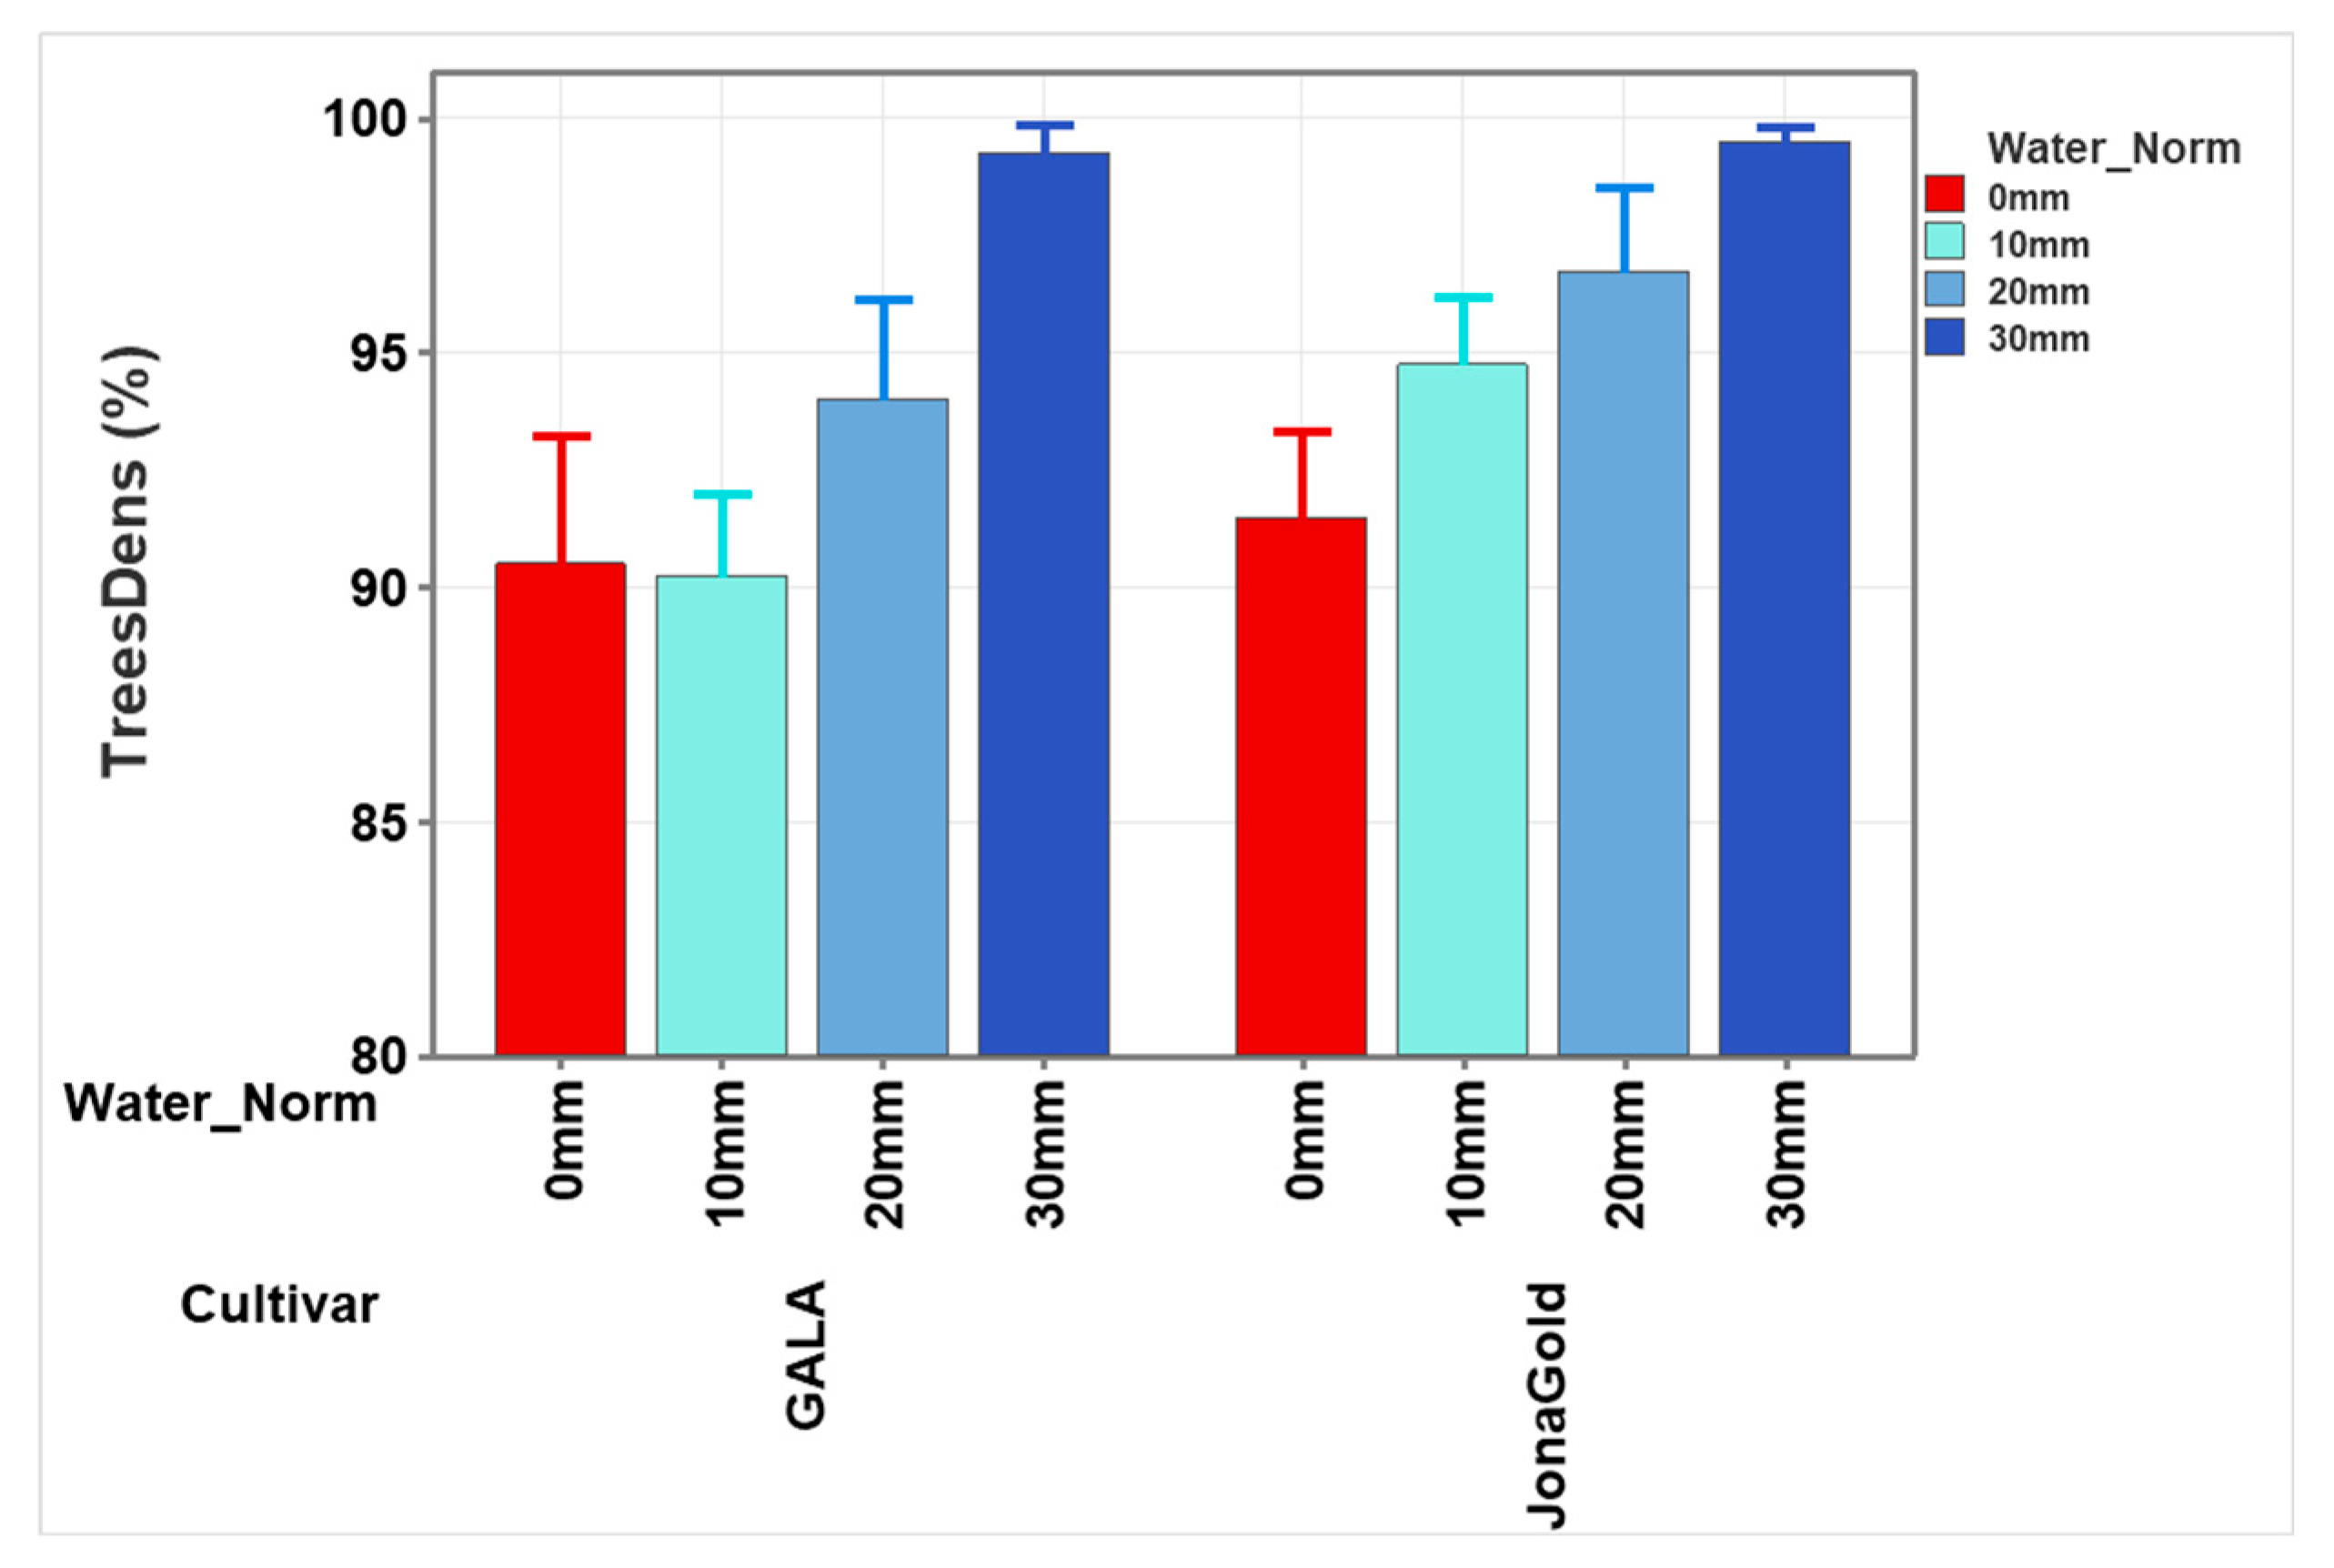
Figure 3.
Interaction between fertilisation and cultivar.
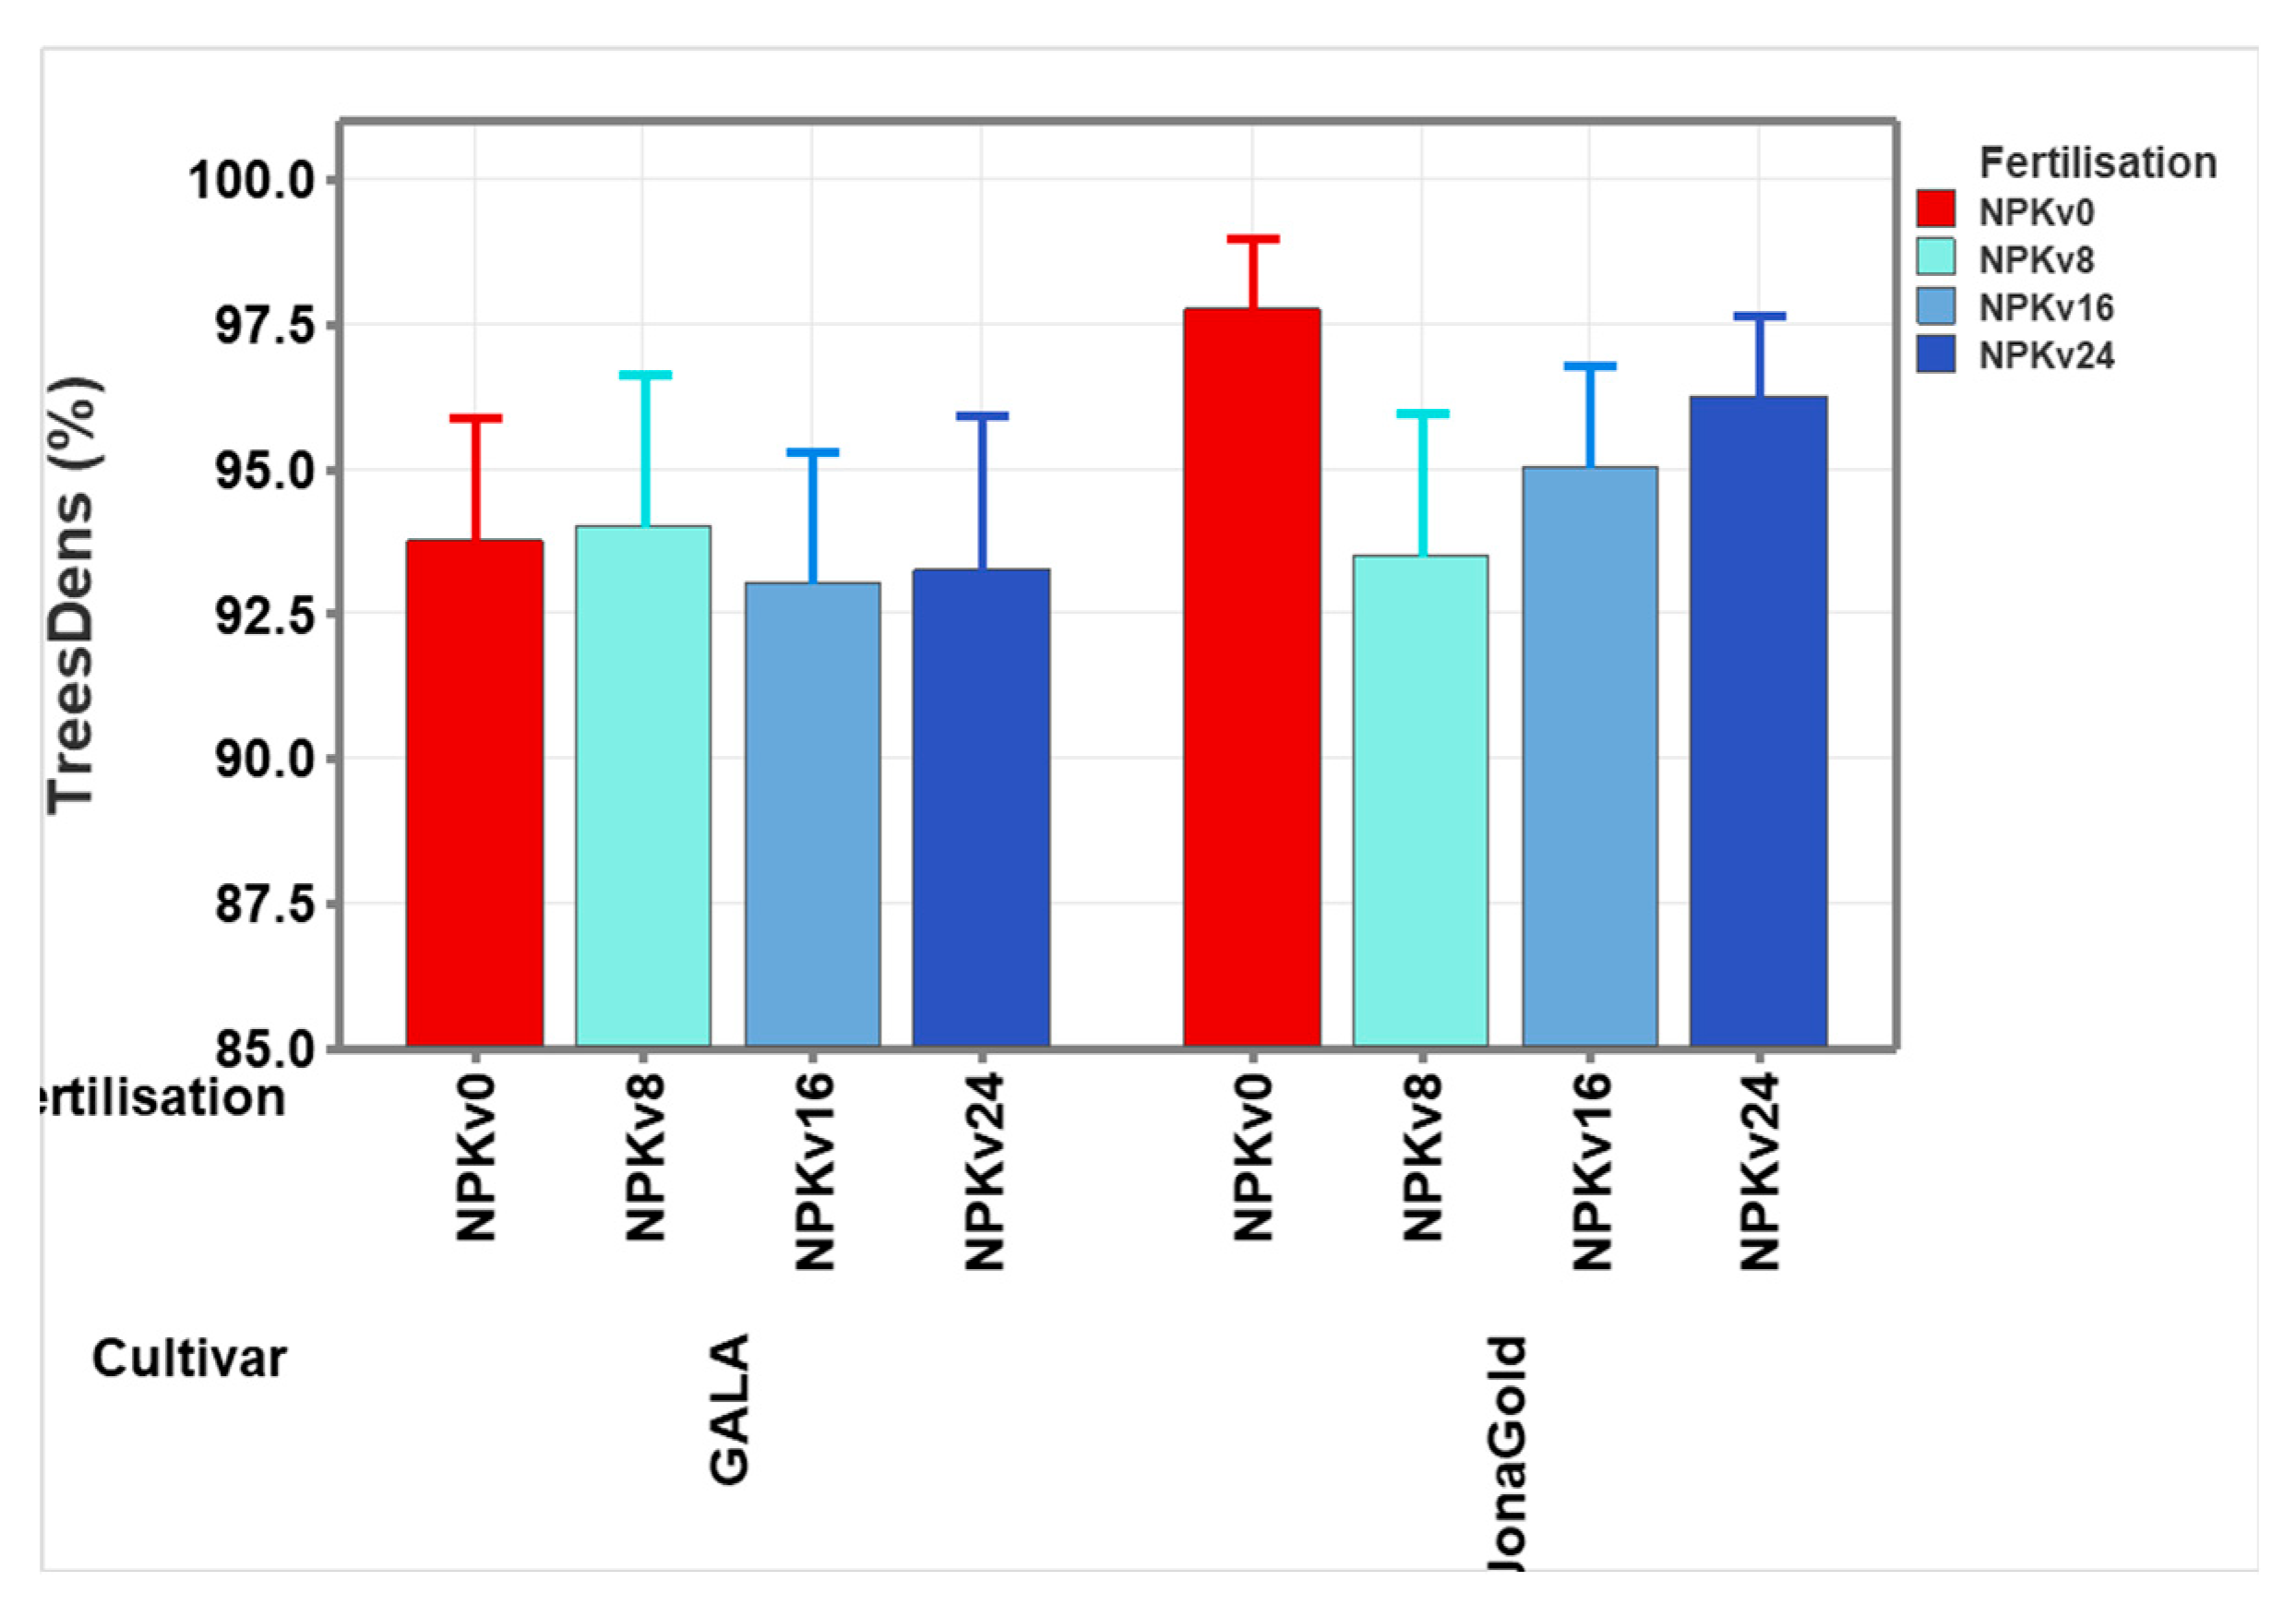
Figure 4.
Interaction between watering norm and fertilisation.

Figure 5.
Heat-map graph of Lp-Norm values for different water and fertilisation levels for the apple cultivars.
Figure 5.
Heat-map graph of Lp-Norm values for different water and fertilisation levels for the apple cultivars.
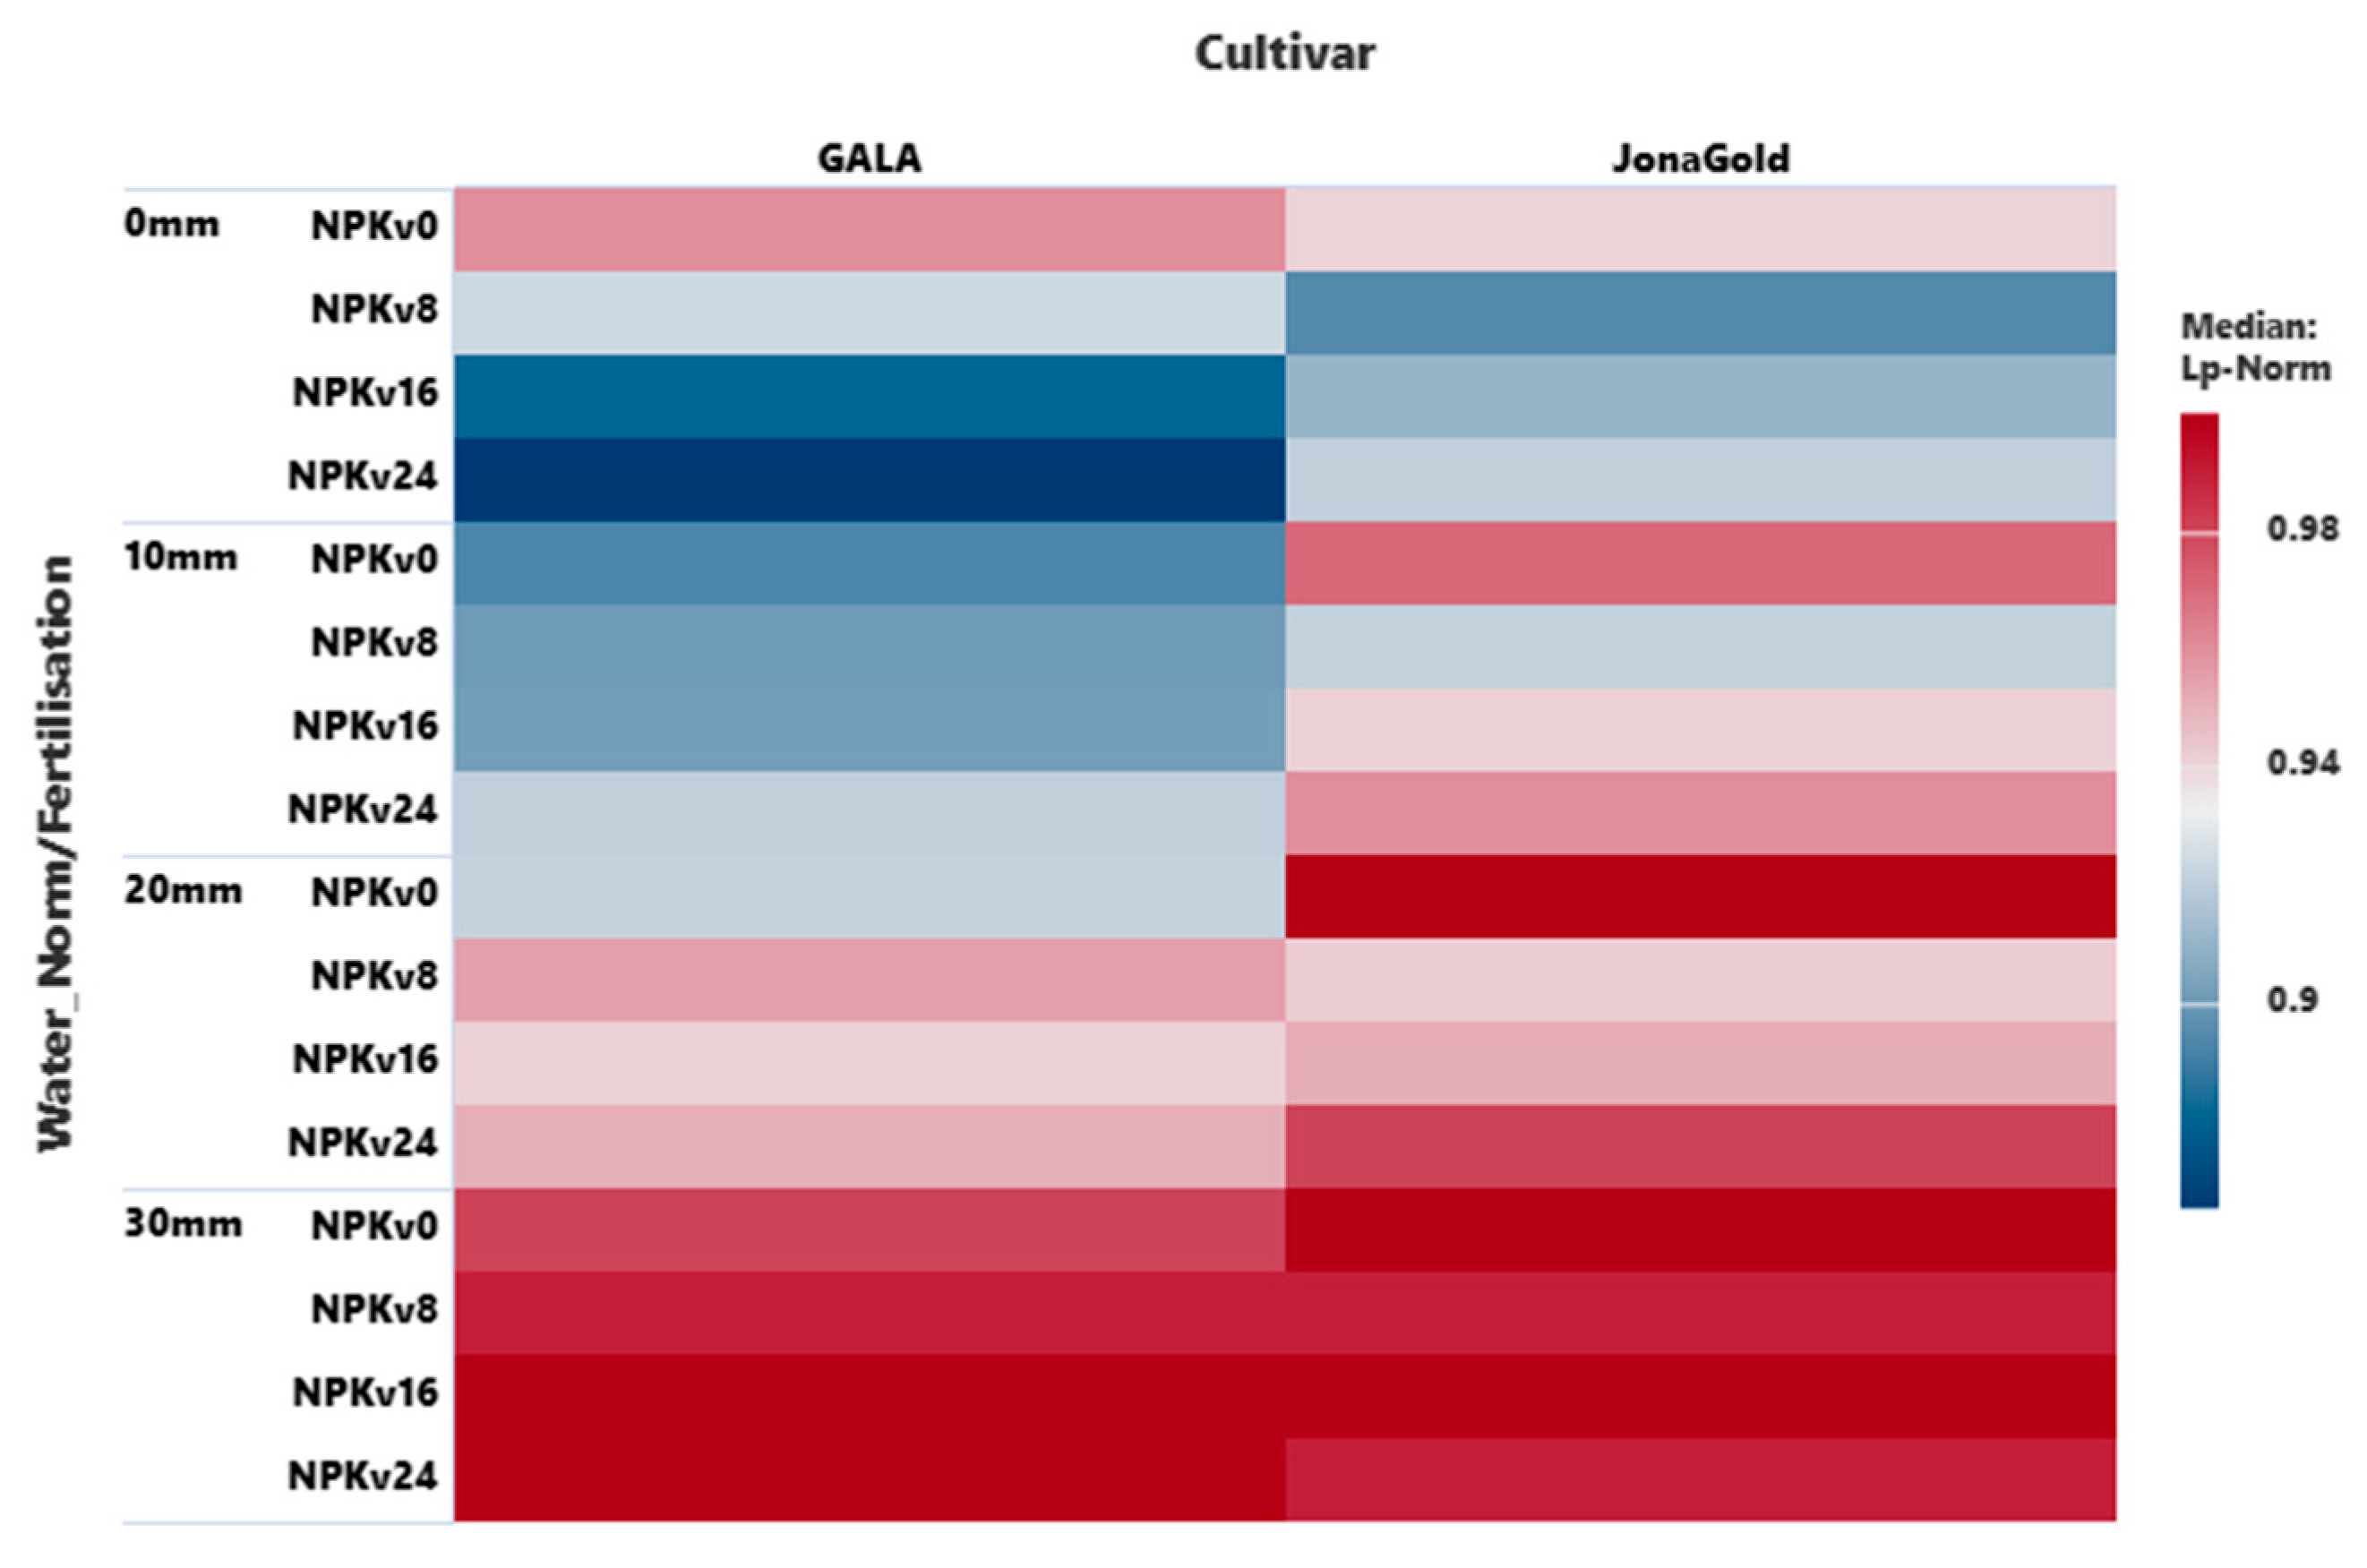
Figure 6.
Heat-map graph of Lp-Norm quartiles for different water and fertilisation levels for the apple cultivars.
Figure 6.
Heat-map graph of Lp-Norm quartiles for different water and fertilisation levels for the apple cultivars.
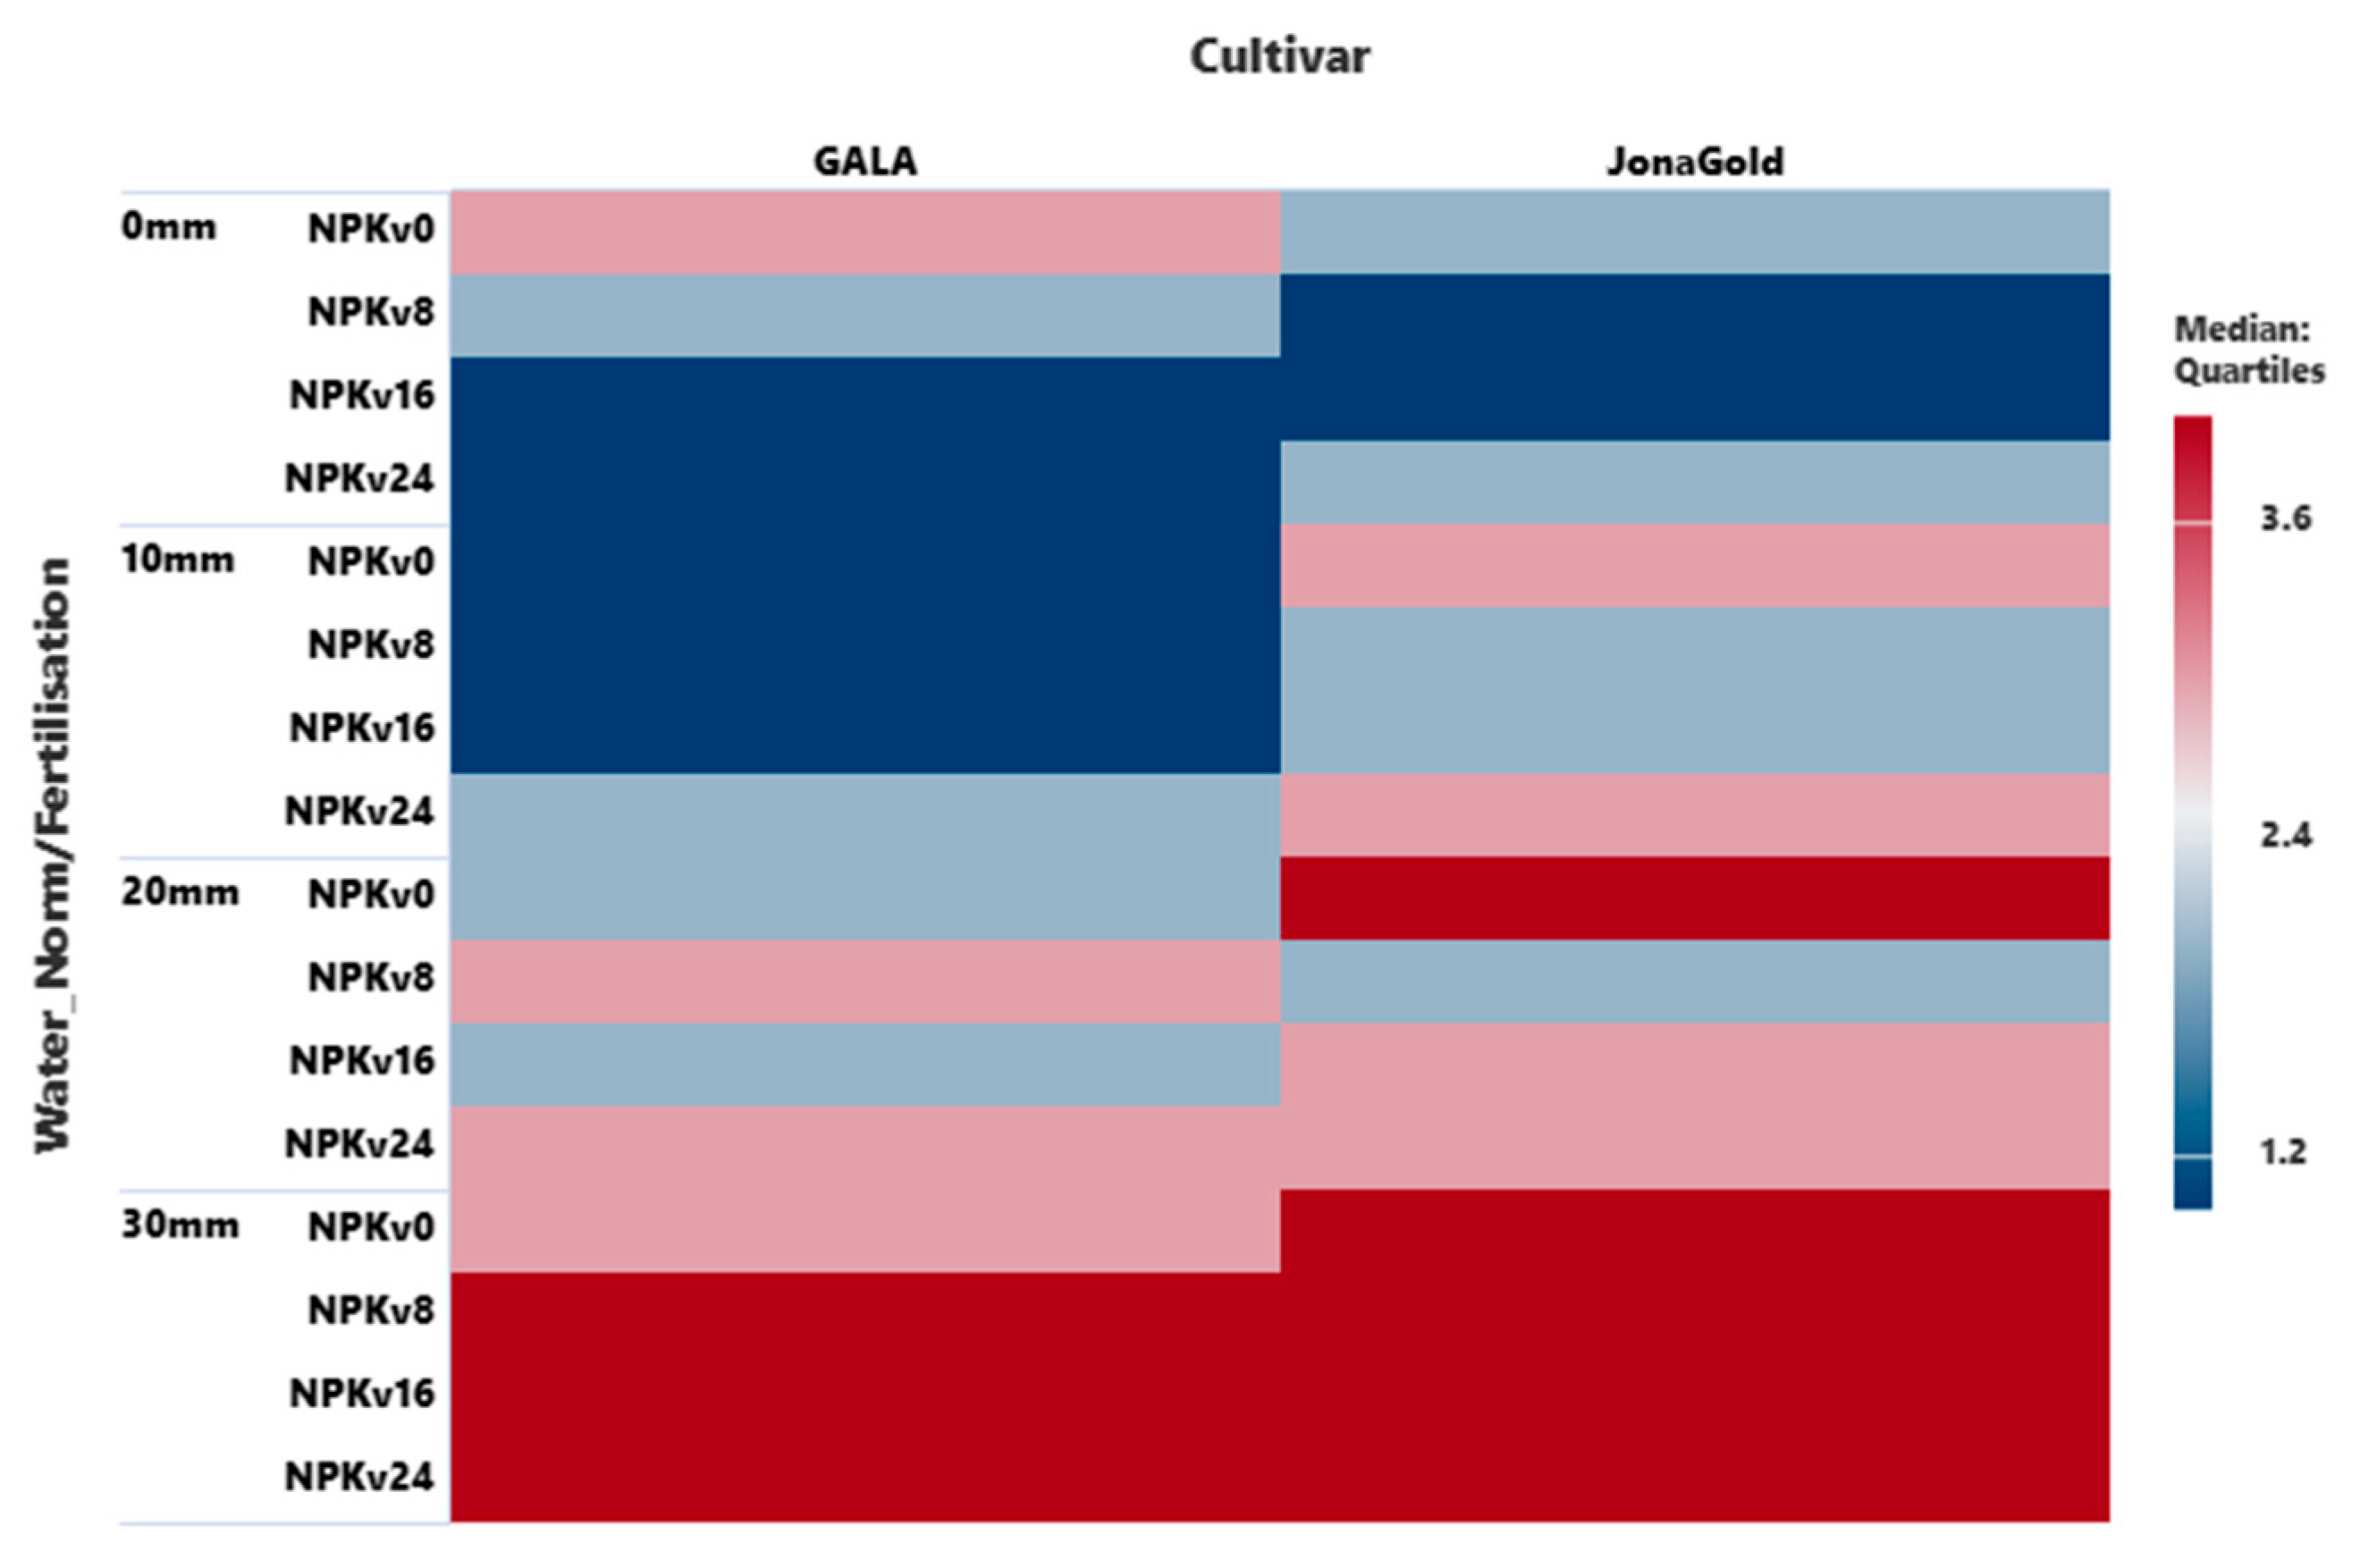
Figure 7.
Heat-map graph of Lp-Norm values for different water levels across the apple cultivars.
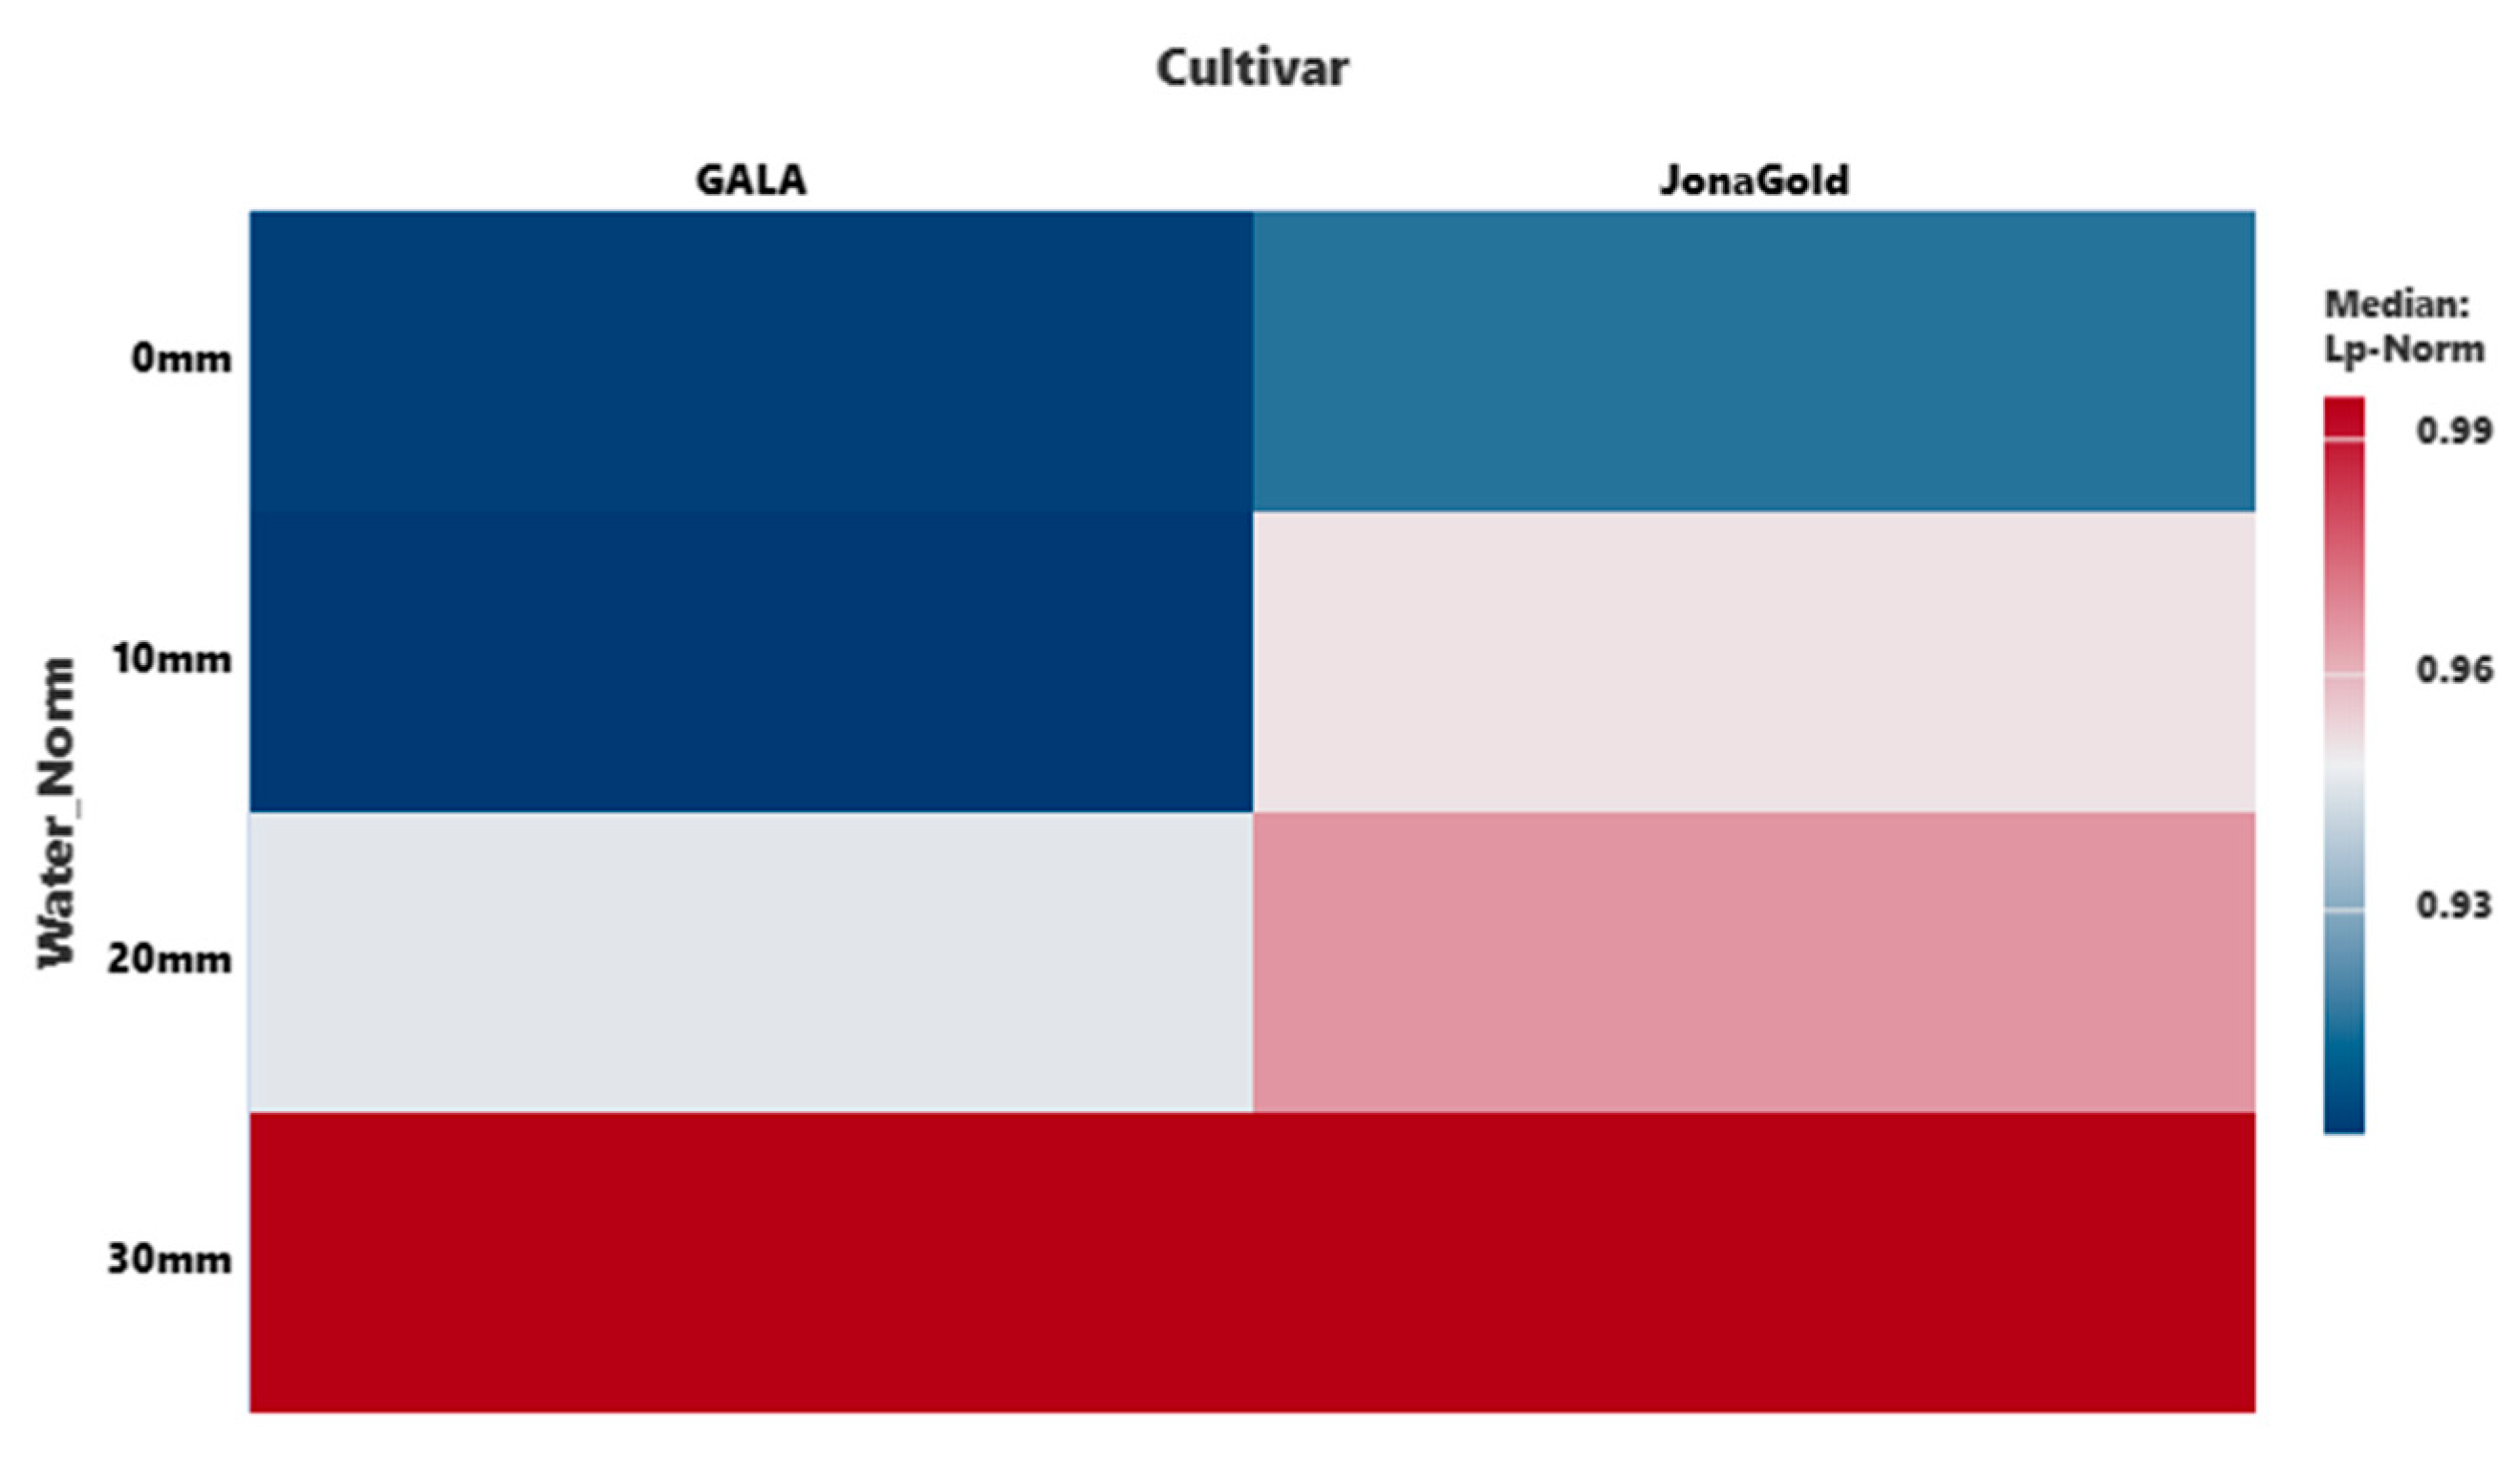
Figure 8.
Heat-map graph of Lp-Norm quartiles for different water levels across the apple cultivars.
Figure 8.
Heat-map graph of Lp-Norm quartiles for different water levels across the apple cultivars.
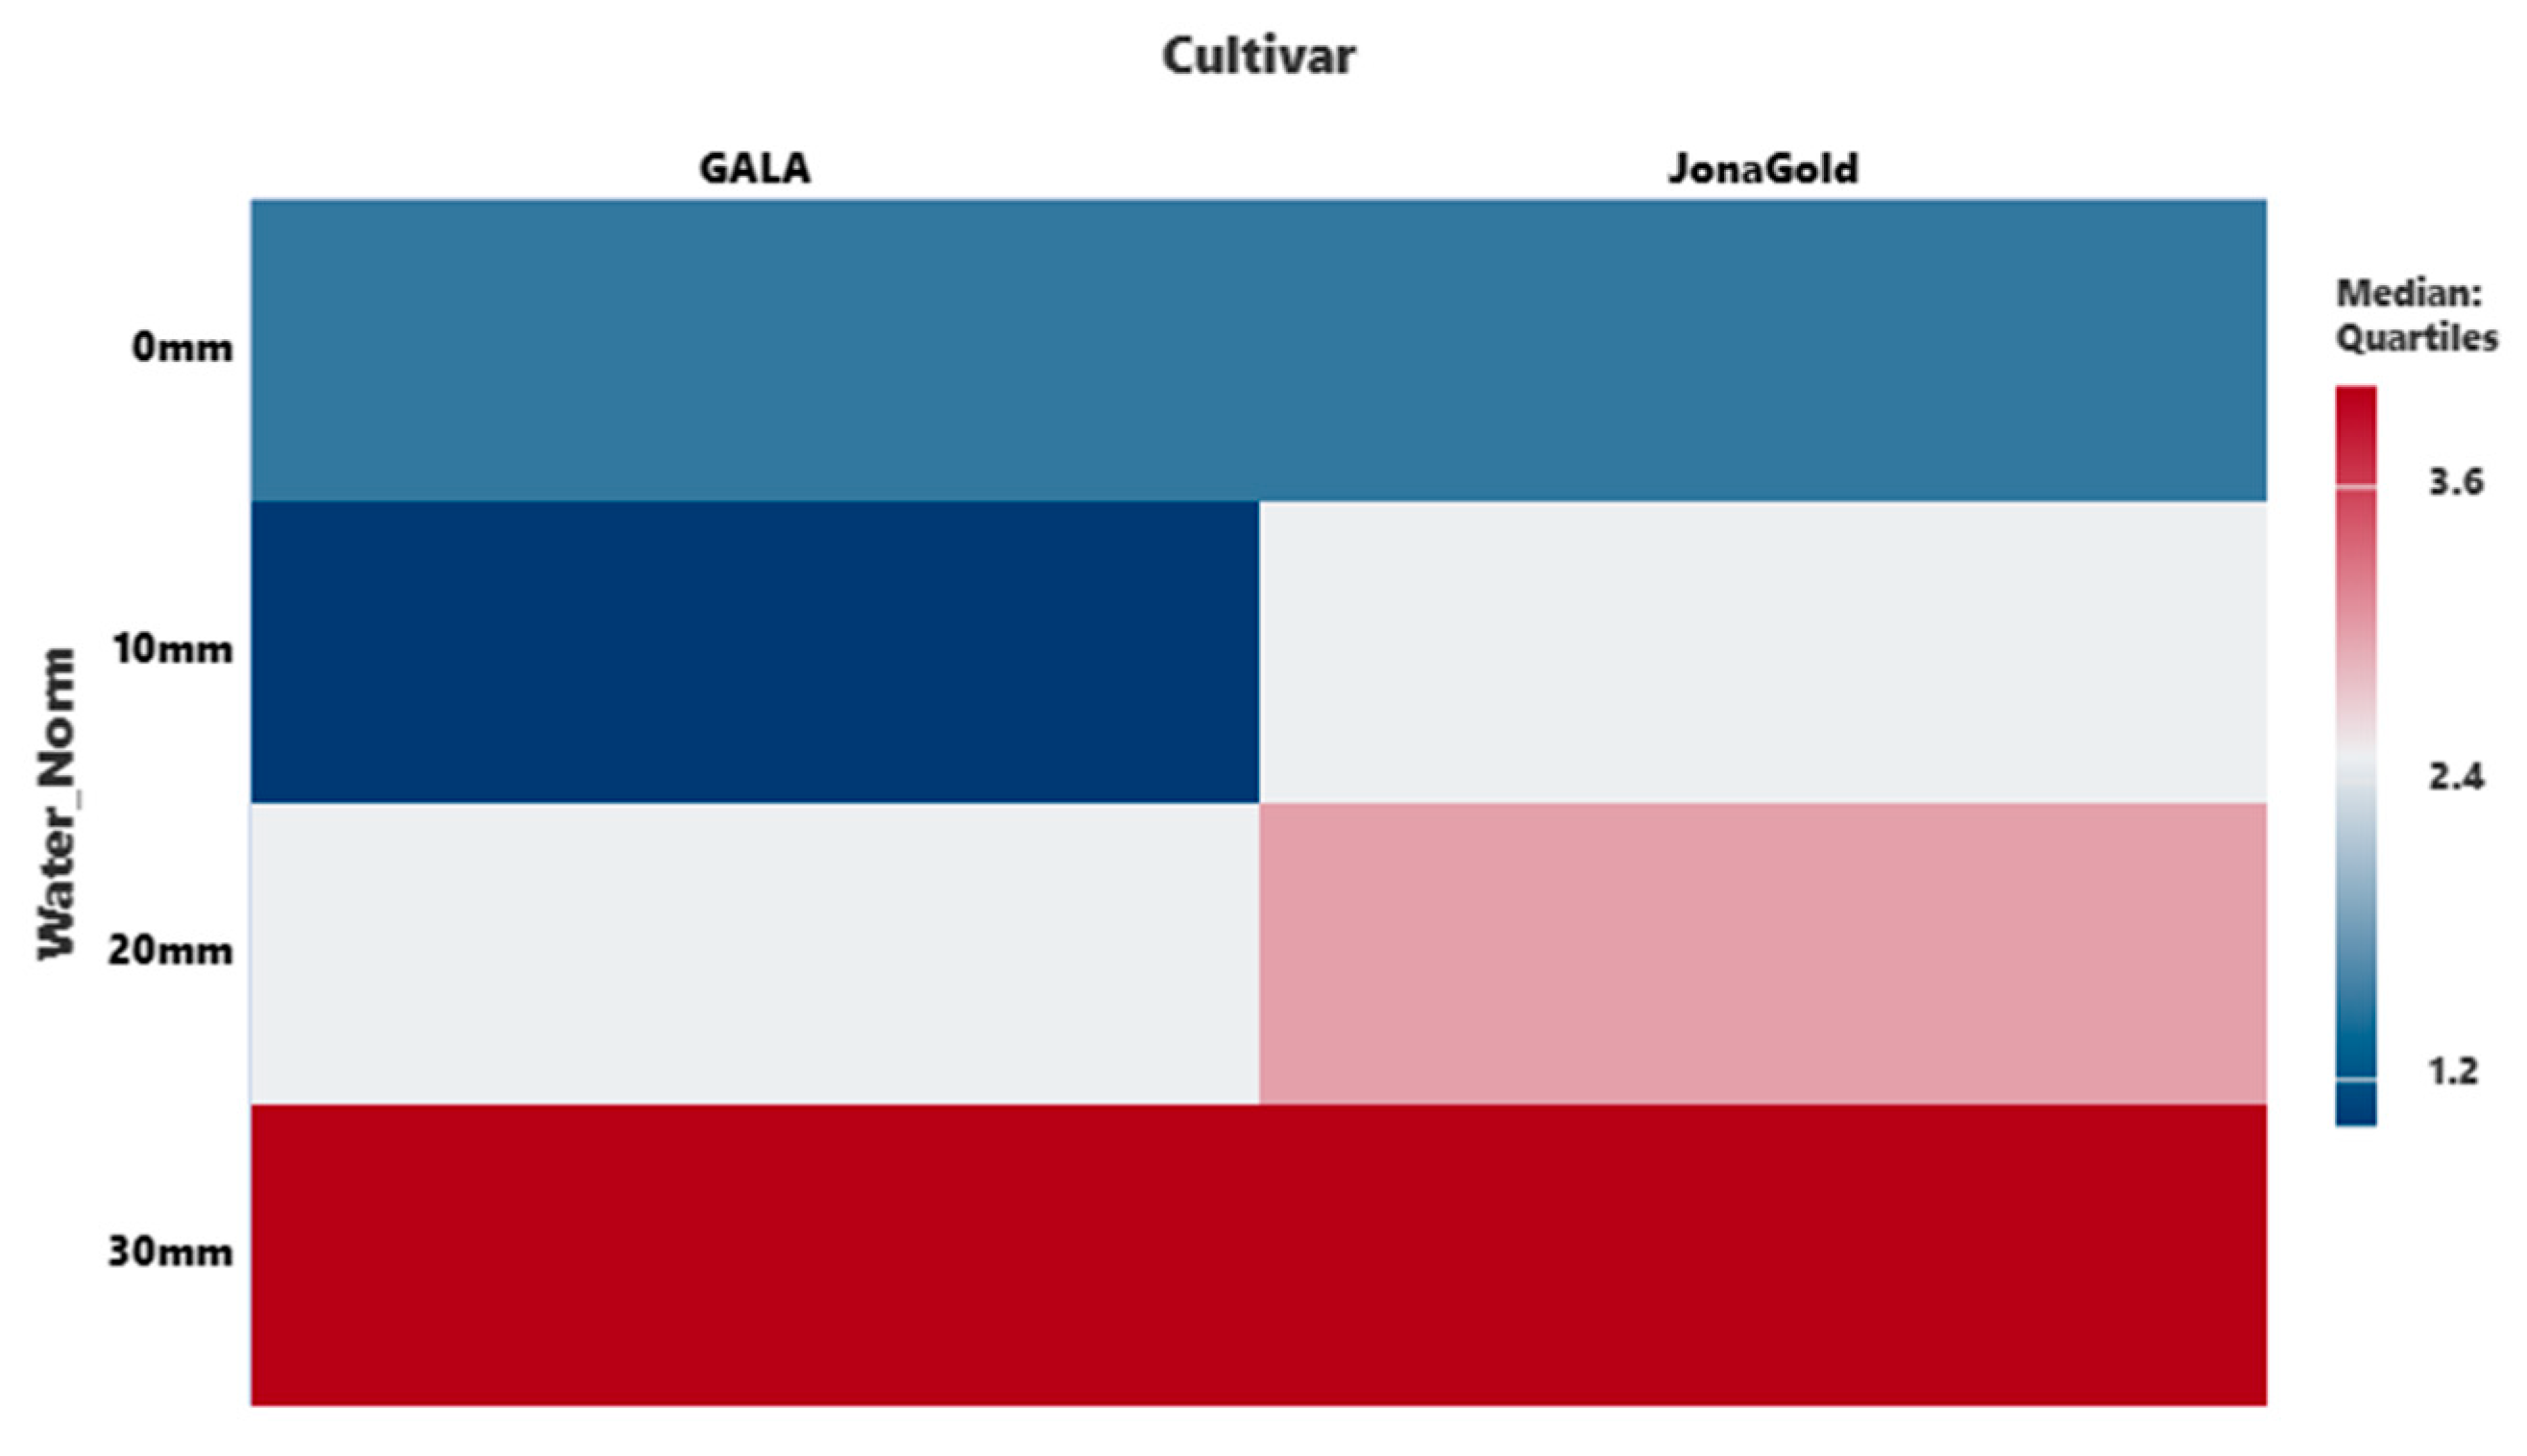
Figure 9.
Heat-map graph of Lp-Norm quartiles for different fertilisation levels in relation to varying water norms.
Figure 9.
Heat-map graph of Lp-Norm quartiles for different fertilisation levels in relation to varying water norms.
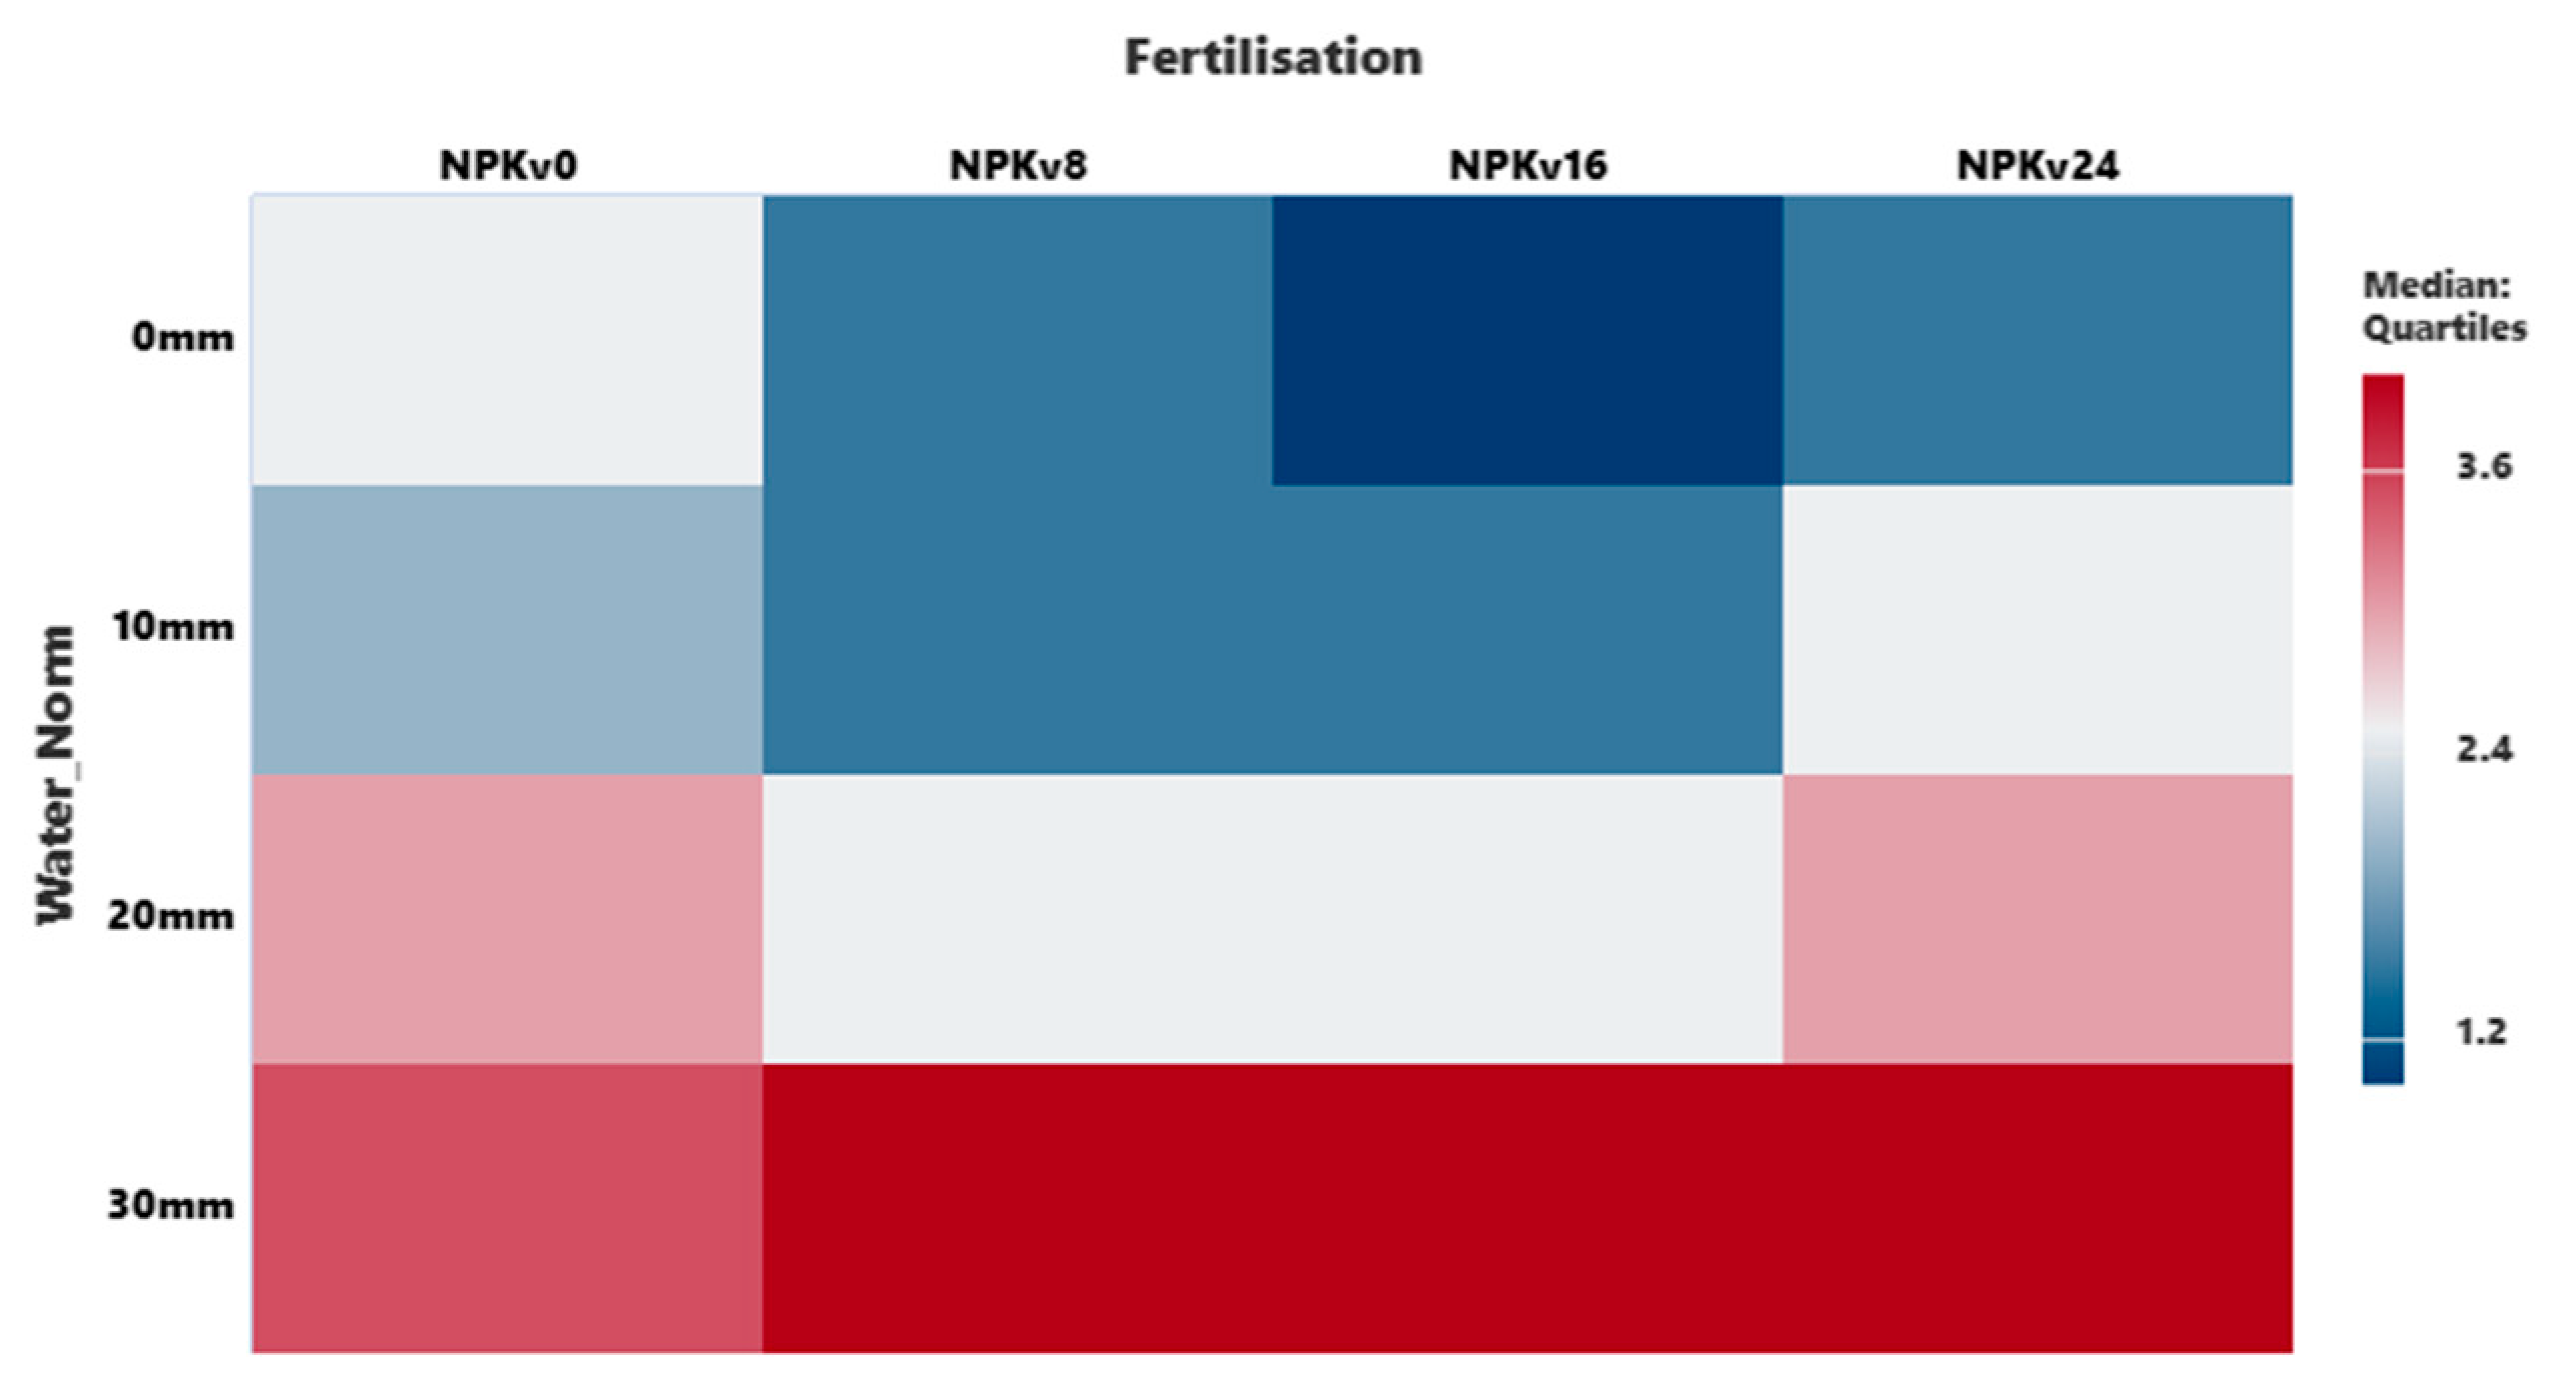
Figure 10.
Graphical distribution of the values and quartiles of Lp-Norm for the interaction factor Cultivar*Water_Nnorm*Fertilisation.
Figure 10.
Graphical distribution of the values and quartiles of Lp-Norm for the interaction factor Cultivar*Water_Nnorm*Fertilisation.
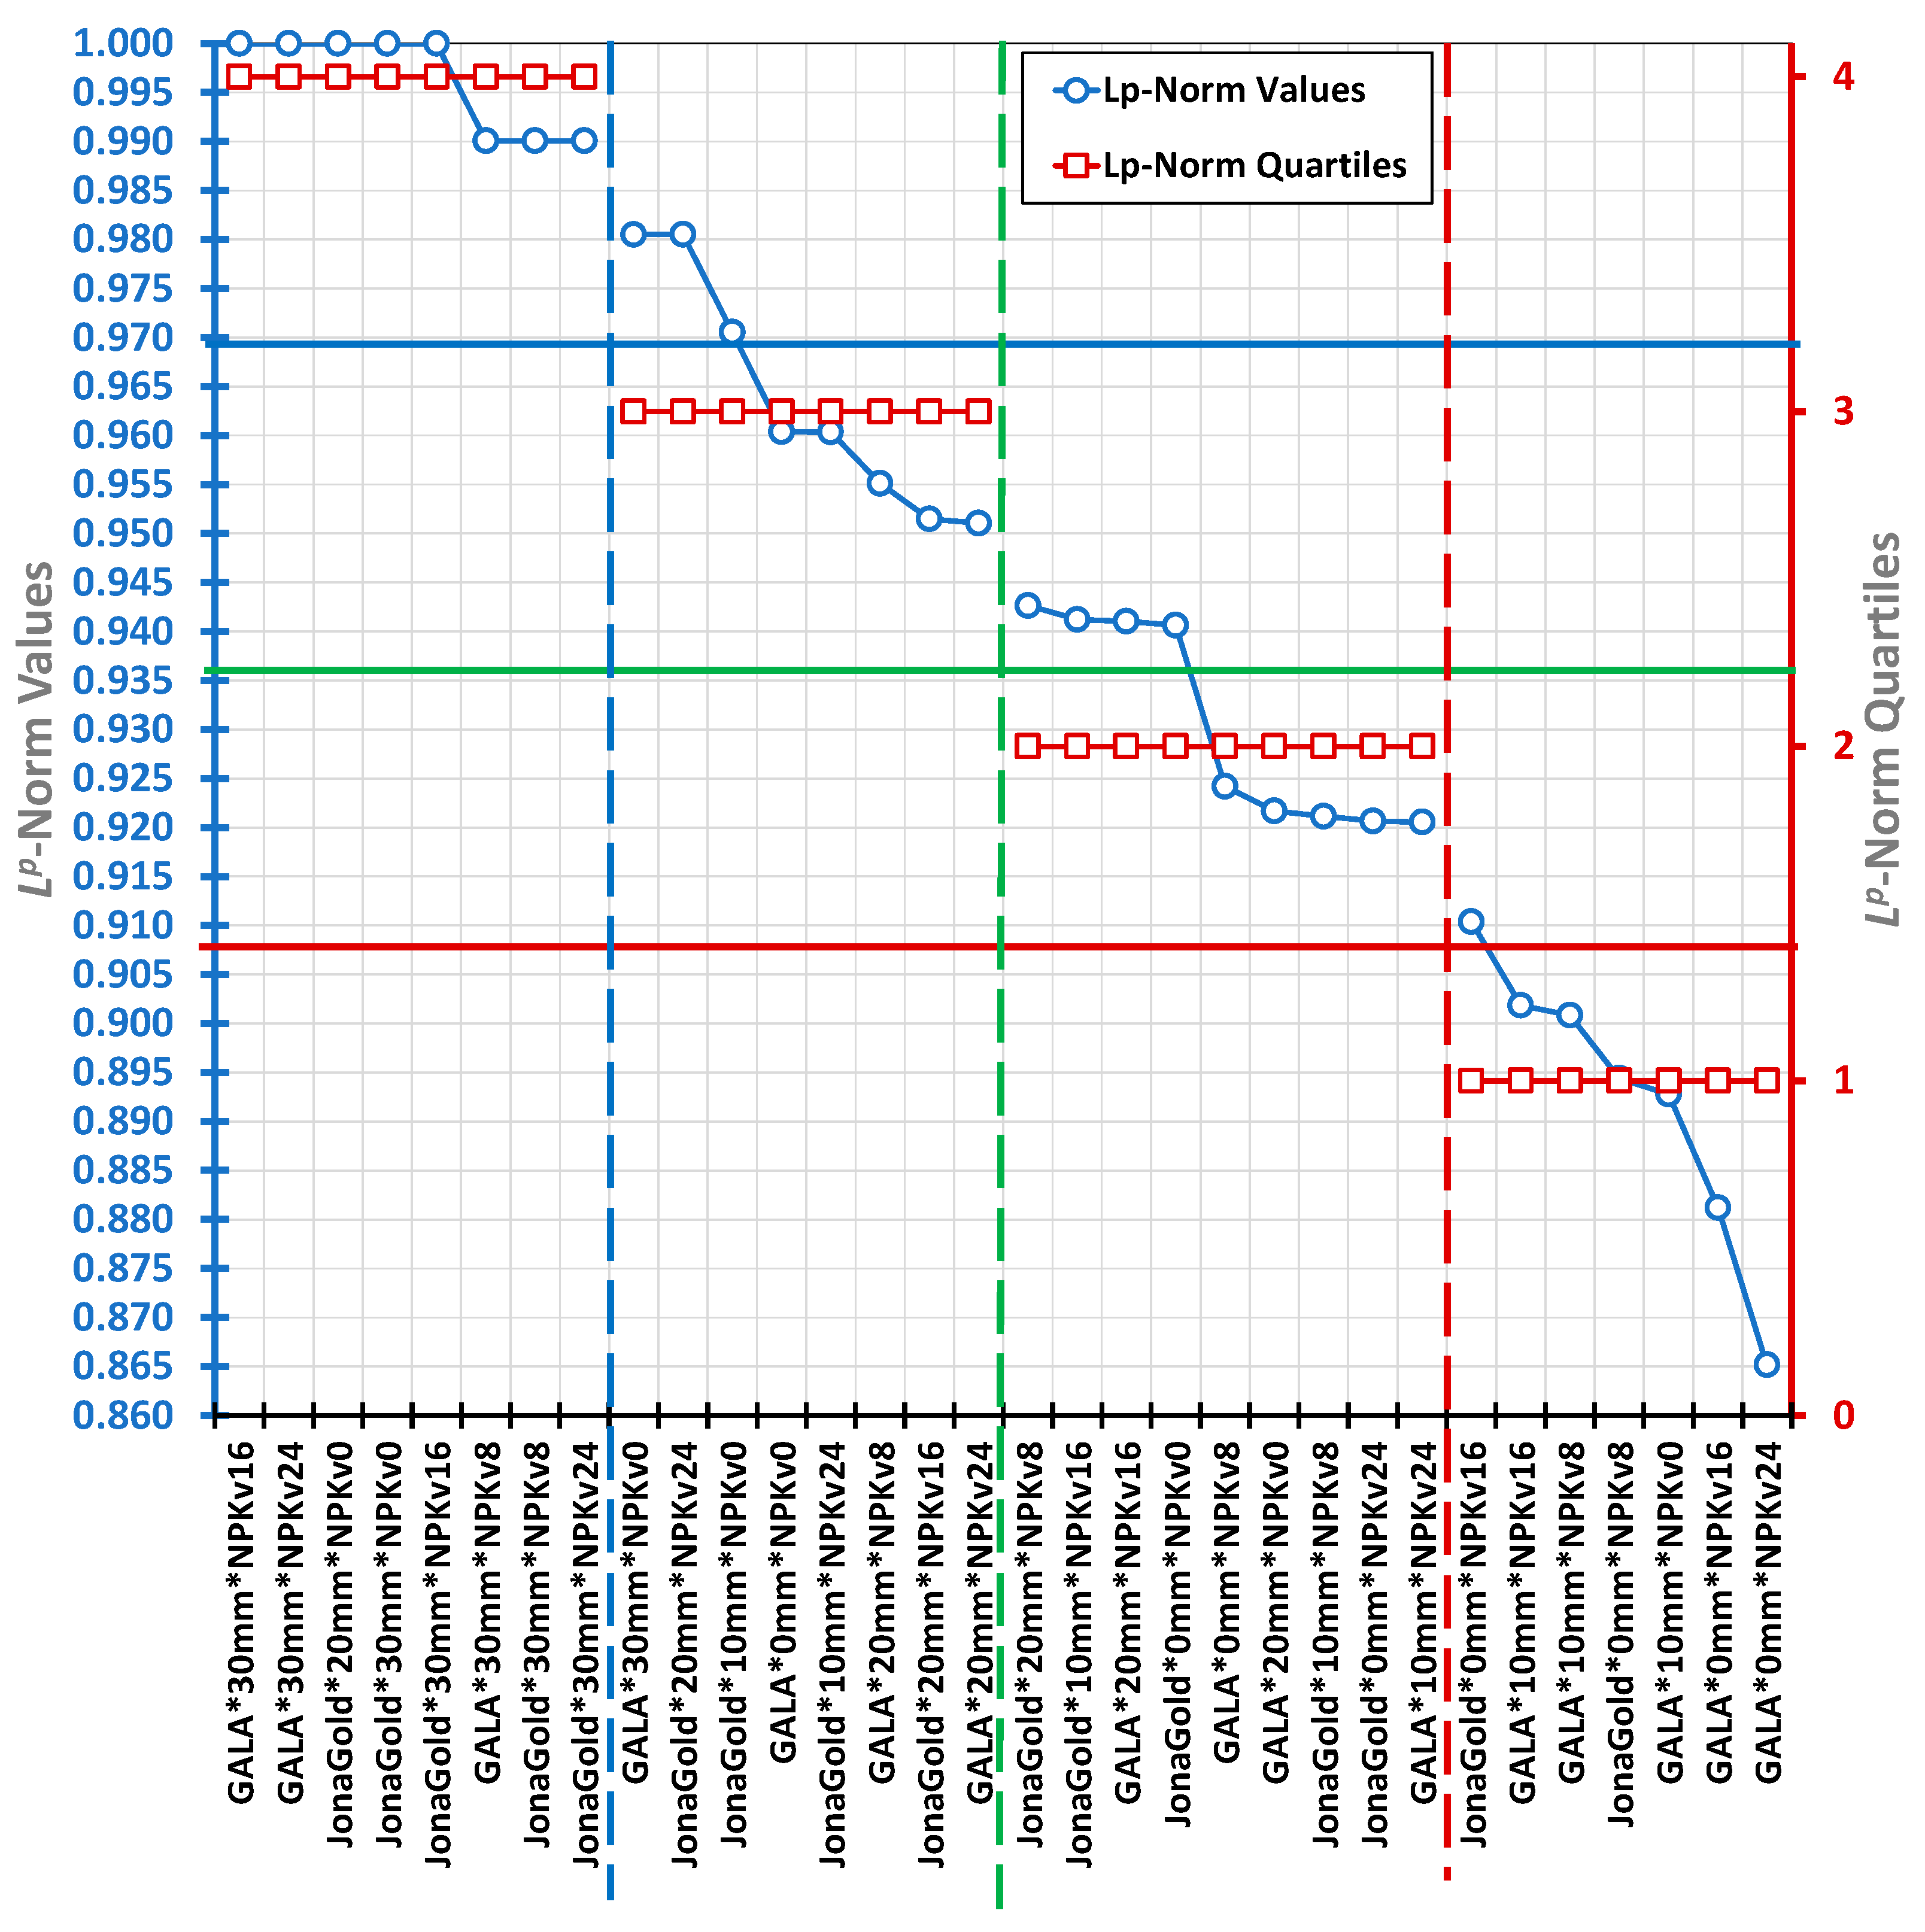
Figure 11.
Percentage of water consumption coverage from different sources for irrigation conditions in 2024.
Figure 11.
Percentage of water consumption coverage from different sources for irrigation conditions in 2024.
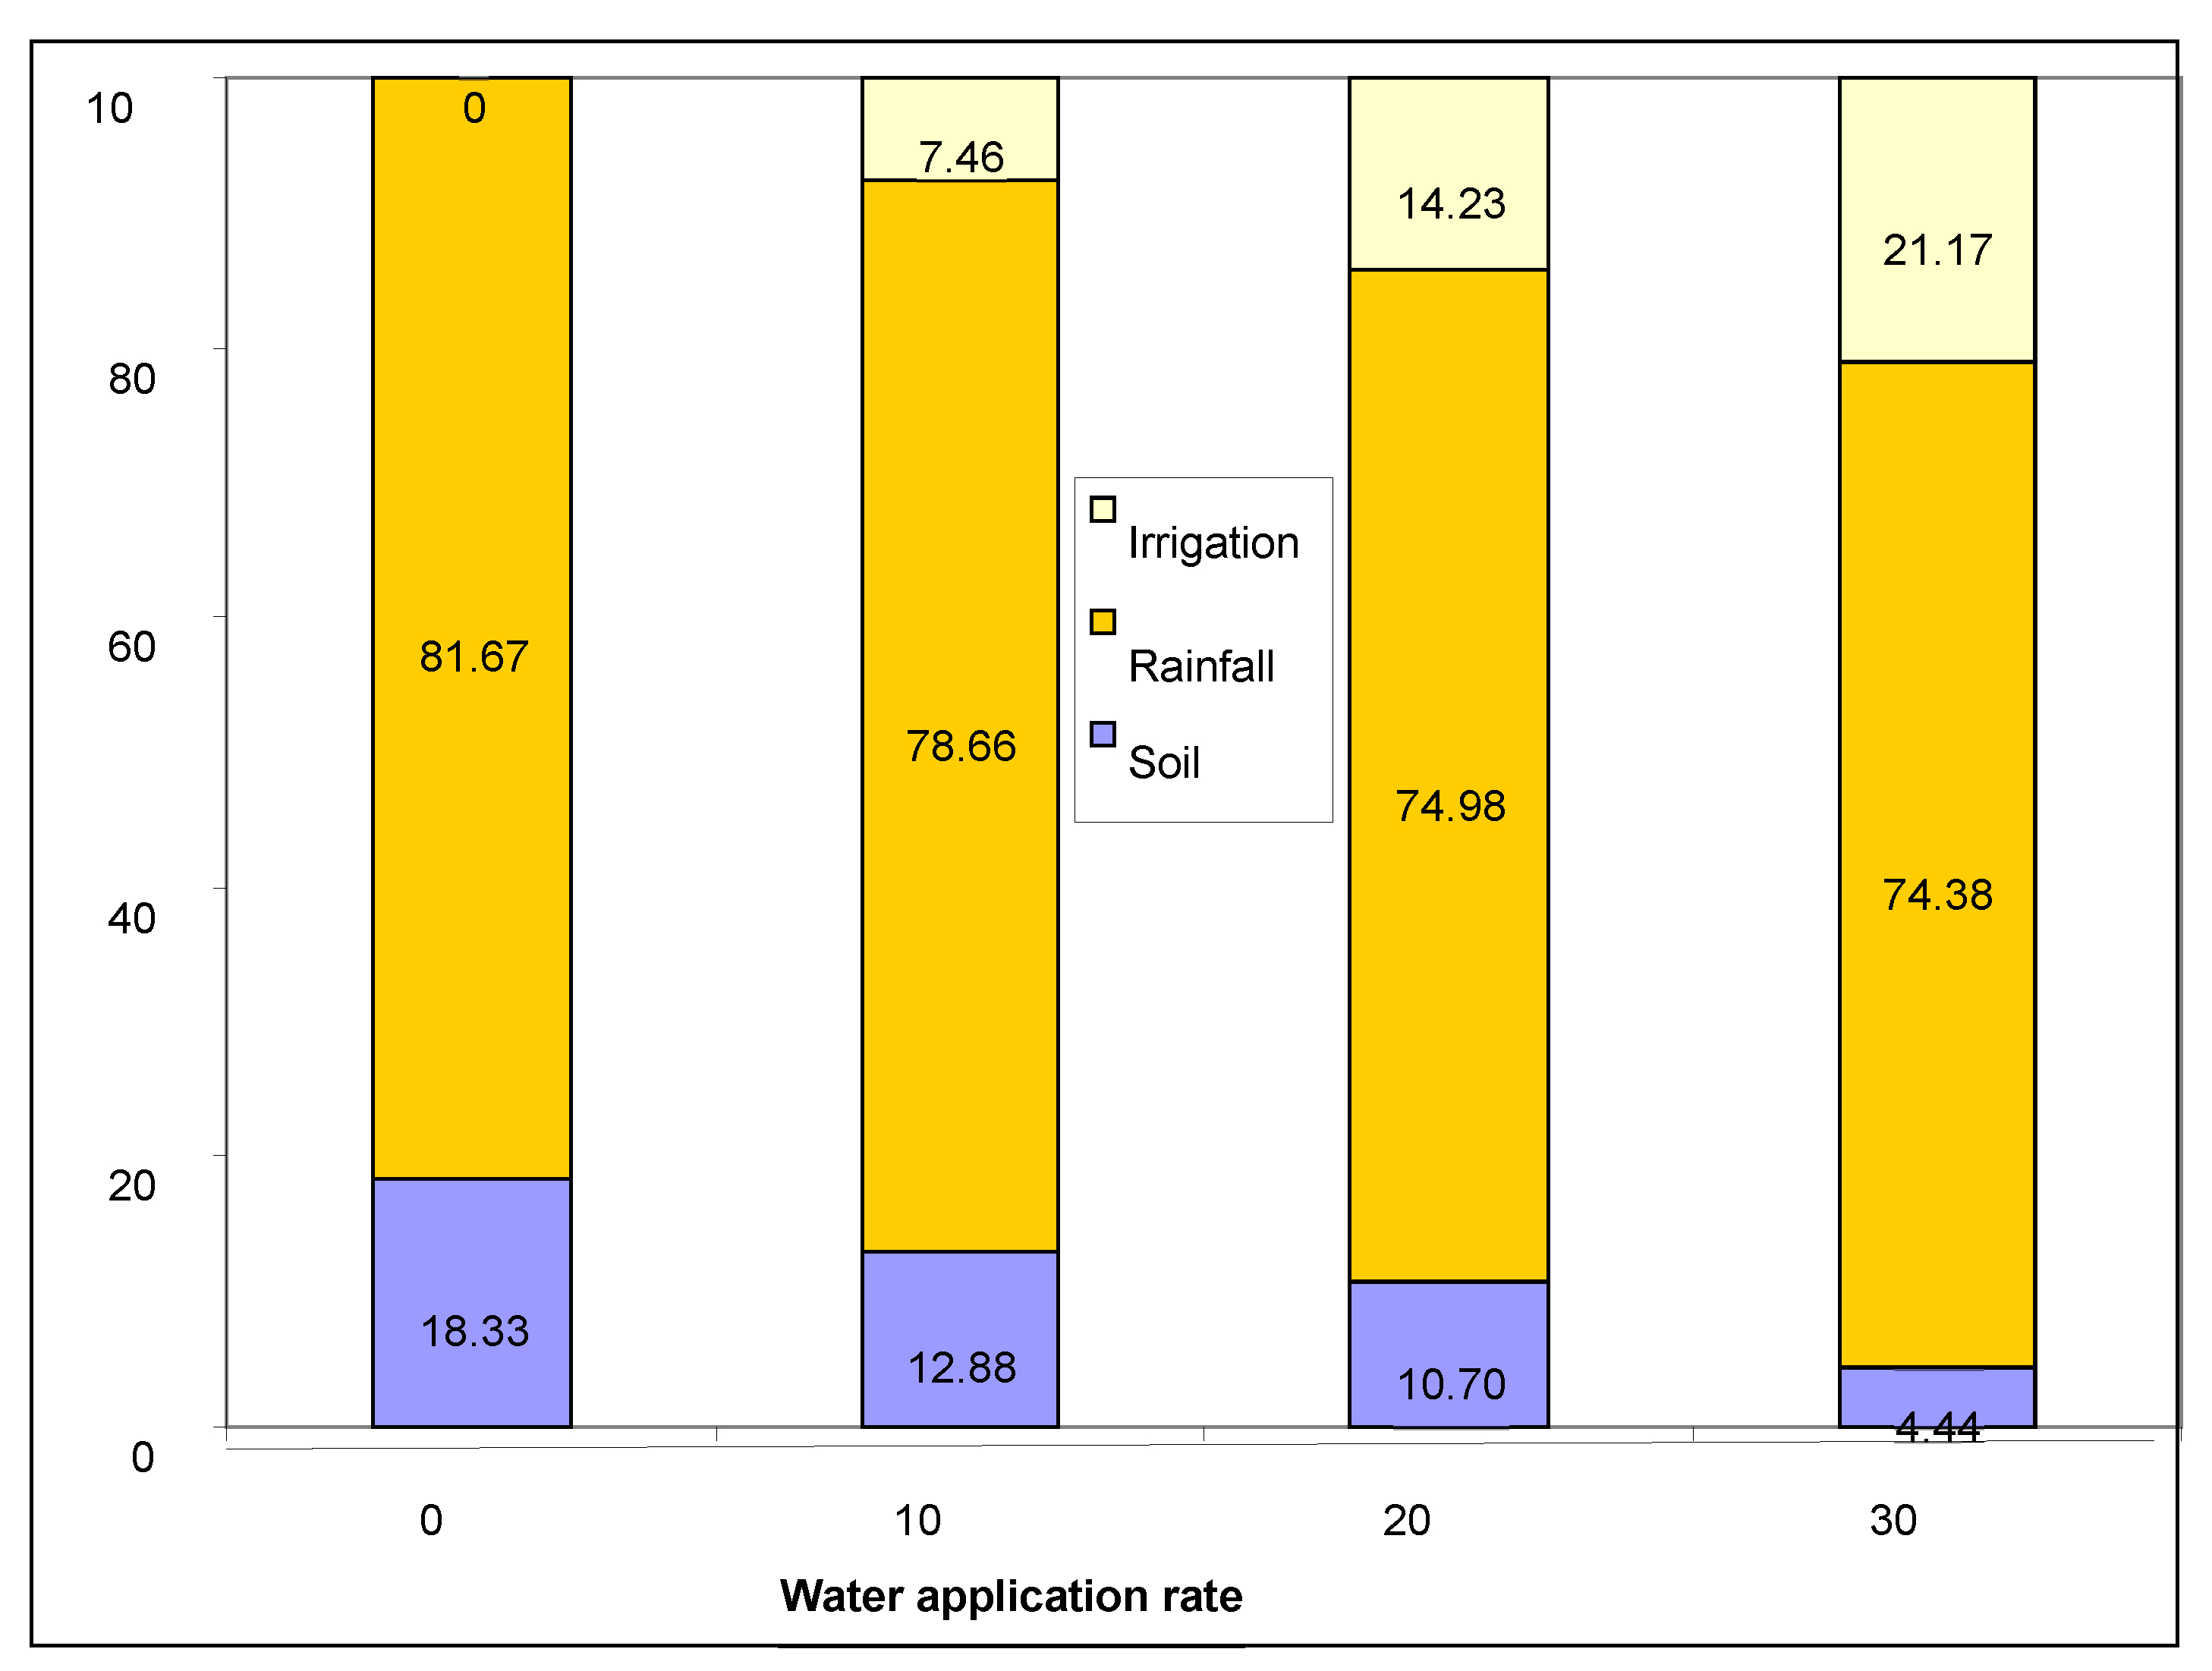

Table 1.
Tree Density Percentage in Relation to Cultivar, Watering Norm, and Fertilisation.
| Cultivar | Frequency | Tree_Density (%) |
|---|---|---|
| GALA | 80 | 93.50b ± 6.195 |
| JonaGold | 80 | 95.63a ± 4.790 |
| Water_Norm | Frequency | Tree_Density (%) |
| 0mm | 40 | 91.00c ± 5.987 |
| 10mm | 40 | 92.50c ± 4.701 |
| 20mm | 40 | 95.38b ± 5.236 |
| 30mm | 40 | 99.38a ± 1.295 |
| Fertilisation | Frequency | Tree_Density (%) |
| NPKv0 | 40 | 95.75a ± 4.882 |
| NPKv8 | 40 | 93.75a ± 6.484 |
| NPKv16 | 40 | 94.00a ± 5.330 |
| NPKv24 | 40 | 94.75a ± 5.665 |
Table 2.
Interaction Effect of Cultivar and Watering Norm on Tree Density Percentage.
| Cultivar*Water_Norm | Frequency | Tree_Density (%) |
|---|---|---|
| GALA_0mm | 20 | 90.50d ± 7.090 |
| GALA_10mm | 20 | 90.25d ± 4.494 |
| GALA_20mm | 20 | 94.00bc ± 5.544 |
| GALA_30mm | 20 | 99.25a ± 1.650 |
| JonaGold_0mm | 20 | 91.50cd ± 4.774 |
| JonaGold_10mm | 20 | 94.75b ± 3.810 |
| JonaGold_20mm | 20 | 96.75ab ± 4.644 |
| JonaGold_30mm | 20 | 99.50a ± 0.827 |
Table 3.
Interaction Effect of Cultivar and Fertilisation on Tree Density Percentage.
| Cultivar*Fertilisation | Frequency | Tree_Density (%) |
| GALA_NPKv0 | 20 | 93.75bc ± 5.486 |
| GALA_NPKv8 | 20 | 94.00c ± 6.751 |
| GALA_NPKv16 | 20 | 93.00bc ± 5.912 |
| GALA_NPKv24 | 20 | 93.25bc ± 6.950 |
| JonaGold_NPKv0 | 20 | 97.75a ± 3.226 |
| JonaGold_NPKv8 | 20 | 93.50abc ± 6.370 |
| JonaGold_NPKv16 | 20 | 95.00ab ± 4.611 |
| JonaGold_NPKv24 | 20 | 96.25bc ± 3.582 |
Table 4.
Interaction Effect of Cultivar and Fertilisation on Tree Density Percentage.
| Fertilisation*Water_Norm | Frequency | Tree_Density (%) |
|---|---|---|
| NPKv0_0mm | 10 | 95.00bcd ± 2.867 |
| NPKv0_10mm | 10 | 93.00de ± 6.325 |
| NPKv0_20mm | 10 | 96.00e ± 5.416 |
| NPKv0_30mm | 10 | 99.00e ± 2.211 |
| NPKv8_0mm | 10 | 90.50cde ± 7.807 |
| NPKv8_10mm | 10 | 91.00de ± 3.801 |
| NPKv8_20mm | 10 | 94.50cde ± 7.382 |
| NPKv8_30mm | 10 | 99.00cd ± 0.943 |
| NPKv16_0mm | 10 | 89.50abc ± 3.598 |
| NPKv16_10mm | 10 | 92.00cd ± 5.011 |
| NPKv16_20mm | 10 | 94.50cd ± 4.223 |
| NPKv16_30mm | 10 | 100.00abc ± 0.000 |
| NPKv24_0mm | 10 | 89.00ab ± 6.944 |
| NPKv24_10mm | 10 | 94.00ab ± 3.266 |
| NPKv24_20mm | 10 | 96.50a ± 3.689 |
| NPKv24_30mm | 10 | 99.50a ± 0.850 |
Table 5.
Average monthly temperatures and average monthly precipitation in 2024 (0 C).
| Month | Jan. | Feb. | Mar. | Apr. | May | Jun. | Jul. | Aug. | Sep. | Oct. | Nov. | Dec. | Average |
|---|---|---|---|---|---|---|---|---|---|---|---|---|---|
|
Average monthly temperatures (0C) |
-2.5 | -1.9 | 4.0 | 12.5 | 16.0 | 19.5 | 24.0 | 20.0 | 18.3 | 13.5 | 7.5 | -2.4 | 10.7 |
|
Average monthly precipitations (mm) |
12.5 | 15.7 | 18.0 | 2.0 | 103.8 | 55.6 | 86.4 | 30.8 | 57 | 63 | 20.4 | 54.3 | 43.29 |
Table 6.
Sources of water consumption coverage for different irrigation conditions in 2024 (m3/ha).
| Year | Irrigation rate | Total water consumption (m3/ha) |
Source of water consumption coverage (m3 /ha) |
||
|---|---|---|---|---|---|
| Soil | Rainfall | Irrigation | |||
| 2024 | 0 mm | 3.872 | 0.071 | 3.162 | - |
| 10 mm | 4.020 | 0.0558 | 3.162 | 0.3 | |
| 20 mm | 4.217 | 0.0455 | 3.162 | 0.6 | |
| 30 mm | 4.251 | 0.0189 | 3.162 | 0.9 | |
Disclaimer/Publisher’s Note: The statements, opinions and data contained in all publications are solely those of the individual author(s) and contributor(s) and not of MDPI and/or the editor(s). MDPI and/or the editor(s) disclaim responsibility for any injury to people or property resulting from any ideas, methods, instructions or products referred to in the content. |
© 2025 by the authors. Licensee MDPI, Basel, Switzerland. This article is an open access article distributed under the terms and conditions of the Creative Commons Attribution (CC BY) license (http://creativecommons.org/licenses/by/4.0/).
Copyright: This open access article is published under a Creative Commons CC BY 4.0 license, which permit the free download, distribution, and reuse, provided that the author and preprint are cited in any reuse.


