
Submitted:
04 November 2025
Posted:
04 November 2025
You are already at the latest version
Abstract
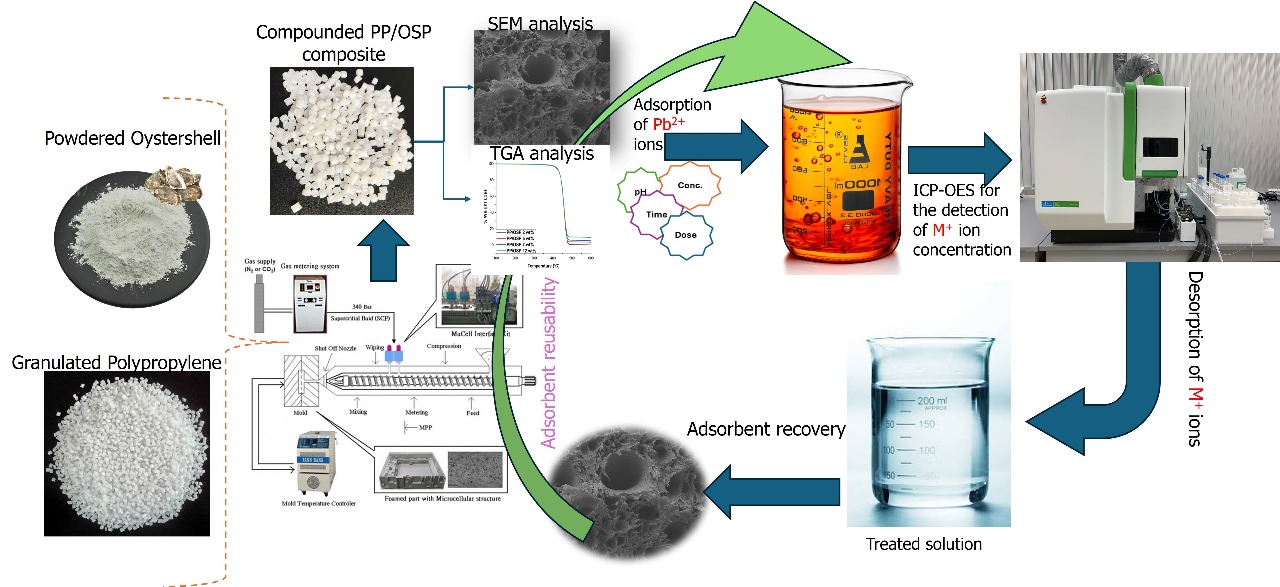
Microcellular injection-molded oyster shell nano-powder (OSP) with polypropylene (PP) is a potential adsorbent material that can reduce toxic metal ion contamination in groundwater. This study aims to investigate the PP/OSP composite material properties and determine the toxic metal ion adsorption properties of polypropylene/oyster shell nano-powder (PP/OSP) in an aqueous medium. This research focused on lead Pb(II) ion using different parameters such as contact time, pH value, and initial concentrations to optimize the conditions for heavy metal remediation. Characterization techniques such as XRD, SEM, FTIR, and TGA were used to analyze the surface morphology, functional groups, and thermal stability, respectively. The adsorption isotherms were conducted, and the behavior was consistent with the Langmuir and Temkin isotherms. A pseudo-first-order kinetic model was preferred, with a maximum adsorption capacity for lead removal obtained at 13,89 mg/g.
Keywords:
oyster shell nano powder
; polypropylene
; microcellular injection molding
; compounder
; Lead Pb(II)
; adsorption
Oyster is a mollusk and a marine shellfish, also known as “milk of the sea.” It is a major marine resource with high nutritional value. Recently, researchers have focused on natural fillers such as calcium oxide (CaO), which has a spherical shape. OSP is an inexpensive and readily available resource that can be used in thermal stabilizers, heavy metal adsorption, and flame retardant applications [1]. Furthermore, Taiwan is an island with an abundance of marine resources, including oysters, abalones, and clams. One practice in a circular economy is reusing such materials to produce new products, among which their use as polymer fillers is the most effective application. However, microplastics pose a potential risk to human health through transmission and bioaccumulation in the food chain [2] as they have already been widely detected in food [3]. In the future, the environmental exposure risk of microplastics may increase as plastic production is expected to reach 318 million tons annually in 2050 [4]. Furthermore, environmental microplastics could serve as carriers for heavy metals from rivers to the sea due to their small size, large specific surface area, and hydrophobicity [5]. As commonly detected pollutants in the environment [6], heavy metals such as Cu, Cr, and Pb were also frequently found in environmental microplastics [7], with metal concentration similar to or higher than those in sediment phases [8].
Although microplastics can adsorb heavy metals [8,9], the adsorption capacity varies with the type of microplastics and heavy metals due to differences in physicochemical properties. For example, polystyrene and film microplastics have greater adsorption capacity for Cu(II) than polyvinyl chloride, polyethylene, fishing line fibers, and bottle cap particles because of the favorable physicochemical properties of film microplastics [10]. Compared with Cu and Cd, Pb shows a higher affinity to Polypropylene (PP) because it more readily binds to functional groups on microplastics, enhancing adsorption [11]. In addition, particle size is an essential factor influencing adsorption. In the environment [12], microplastics are further fragmented into smaller parts due to environmental dynamics, which affects the adsorption capacity of heavy metals on microplastics [13].
Moreover, Polypropylene (PP) is one of the most widely used polymers in packaging and industrial applications owing to its low cost and excellent properties such as low density and high chemical resistance[14]. It has been widely applied to biomedical materials because of its non-cytotoxicity, ease of processing, and recyclability [15]. However, it lacks antibacterial properties, allowing bacteria to easily inhabit PP [16]. Therefore, modifications are necessary to render it antibacterial or biocompatible. Nevertheless, combining antimicrobial agents with PP is challenging because of its hydrophobicity and lack of functional groups [17]. Its surface, however, can be modified using several methods, including chemical, flame, Co-γ-ray, corona, ultraviolet, and plasma treatment [18].
Several studies have reported modifying the surface of PP by incorporating different fillers such as SiO2 [19], CaCO3 [20], Al2O3 [21], nano-clay [22], and ZnO nanoparticles [23]. The applications for various purposes depend on the properties of these inorganic nanoparticles. Joudeh et al. [25] modified PP first by irradiation with γ-ray in the presence of acetylene and then through extrusion blending with Ag nanoparticles; the resulting nanocomposites exhibited notable antimicrobial activity. Other studies revealed that ZnO is an efficient antibacterial agent for PP [26]. However, the study investigated incorporating nano oyster shell powder (OSP) as a filler material to enhance PP's mechanical, chemical, and physical properties and to improve its adsorption efficiency [27].
Some studies have focused on recycling OSP waste and converting it into valuable products [27,28]. Hsu, [29]reported that oyster shell powder (OSP) can effectively adsorb certain heavy metals, such as Pb(II) and Ni(II), from wastewater. OSP can be treated using hydrothermal techniques, and several technologies related to OSP have been used to construct porous scaffolds [30] and produce raw materials for bone tissue engineering. Oyster shell, as a recyclable material, offers potential for adsorption in removing heavy metal ions from wastewater and contaminated groundwater [31]. Reusing oyster shells as an alternative, low-cost, and non-toxic adsorption material reduces environmental impact while adding economic and practical value as a waste product [32]. Accordingly, reusing waste oyster shells as an adsorption material for wastewater remediation provides an innovative approach to environmental improvement [33]. It also increases the value of waste and contributes to the development of the oyster meat industry in South Africa. The main objective of this study was to investigate the adsorption potential of Polypropylene/oyster shell powder as an effective adsorbent for metallic ion uptake in solution and to characterize Polypropylene/oyster shell powder adsorption mechanisms[34,35]. Batch adsorption experiments were conducted to study the effects of contact time, pH value, initial concentration, and dosage on adsorption efficiency.
2. Materials and Methods
Nano OSP was supplied as received by Hans Global Textile Co., Taiwan, while Polypropylene (PP) with part number K1035 and a melt flow index of 38 g/10 min was provided by Taiwan Formosa Co., LTD. The chemical composition of PP is (C3H6)n, and OSP consists of 98.2% CaO. The nano-OSP content was 2, 5, 7, and 12 wt%, respectively, and the mixing ratios are shown in Table 1. The mixing process was performed by spraying liquid wax (1 vol.% of batch weight 600 g, 6 CC for 7 wt% OSP) on the PP pellets' surface inside a plastic bag, and the powder dispersion was completed by hand-shaking the plastic bag. One batch of 600 g OSP/PP composites produced approximately 25 molds of ASTM D638 tensile specimens. Microcellular injection molding (as shown in Figure 1) was conducted using an Arburg-420C 1000 injection molding machine equipped with Mucell® capability. Foamed samples were crushed using a plastic grinder for the adsorption study. The thermal decomposition temperature was determined by thermogravimetric analysis (TGA) (SII TG/DTA6200), and the experiment was conducted with samples (10 mg) in air at temperatures ranging from 40 to 600 °C, with a heating rate of 10 °C/min. The cellular structures of the foamed composites were examined using a JEOL JSM6360 SEM system. The PVT property was measured using Smart RHEO of CEAST, Italy. X-ray diffraction (XRD) was performed on a PANalytical PW3040/60 X’Pert Pro, with Cu Ka radiation (45 kV, 40 mA) and a wavelength λ= 1.54 °A. The scan angle covered 2º< 2θ< 70 º for the polymer composites at a scan speed of 3º min-1.
3. Kinetic and Equilibrium Sorption Studies
The study employed a systematic batch adsorption methodology to investigate the effects of pH, initial metal concentration, and contact time on Pb(II) removal. For each experiment, approximately 0.17 g of the PP/OSP was measured and reacted with aqueous solutions of the metal ions [36]. These mixtures were agitated on a mechanical shaker at a constant speed of 150 rpm and maintained at a controlled temperature of 25 °C. Subsequently, the pH of the aqueous solutions was carefully adjusted from 2 to 12 using 0.1 M HCl and NaOH. At the same time, other parameters were held constant to determine the influence of pH on metal ion adsorption. The effect of initial metal ion concentration was investigated by exposing the PP/OSP to solutions containing 0.1 to 1.25 mg·L−1 of Pb(II). Furthermore, the effect of contact time was examined by measuring the adsorbed metal ions at predefined intervals ranging from 5 to 30 minutes at 5-minute intervals.
After the experiments, the mixtures were filtered, and the metal ion concentrations in the supernatants were quantified using ICP-OES, ensuring the reliability and accuracy of the results. The quantities of adsorbed metal species at equilibrium (Qe) and their removal efficiencies (R) were calculated using Equations 1 and 2:[37]
Here, Qe represents the amount of adsorbed metal species at equilibrium, Co and Ce denote the initial and equilibrium concentrations of the metal ions, respectively, V is the volume of the solution, and m is the mass of the PP/OSP. The adsorption kinetics were assessed using Equation 3, where Qt and Ct represent the amount of metal species adsorbed and the concentration at time t, respectively. Removal efficiency (Rt) at any time t was calculated using Equation 4.
This approach aligns with the growing interest in developing efficient and cost-effective methods for heavy metal removal from water and wastewater[38,39].
3.1. Characterization Method
Different polymers and composite samples required varying axial speeds, with composites generally requiring lower axial speeds compared to neat polymers and microplastics before adsorption characterization. Fourier-transform infrared spectroscopy (FTIR) analysis was conducted using a Spectrum 3 Tri-Range FT-IR Spectrometer in Johannesburg, South Africa, employing scanning wavelengths ranging from 400 to 4000 cm−1. X-ray diffraction (XRD) was used to analyze microplastics and qualitatively evaluate the degree of crystallization. The thermal properties of the PP/OSP were assessed through thermogravimetric analysis (TGA) using the EXSAR6000 SII TG/DTA 6200 equipment, where approximately 10 mg of the PP/OSP was heated in air at a rate of 10 ◦C·min−1 from ambient temperature to 900 ◦C. Subsequently, the dispersion morphology of the PP/OSP was examined using a JSM-IT300 InTouch Scope. Scanning electron microscope (SEM) inspection was performed with a Sigma 360 FE-SEM, XEISS, Oberkochen, Germany. Furthermore, the concentration of heavy metal ions in aqueous media was quantified using an inductively coupled plasma optical emission spectroscopy (ICP-OES), Agilent 720 series.
4. Results & Discussion
4.1. Fourier Transformation InfraRed (FTIR)
The Fourier transform infrared spectrometer FT-IR-ATR was used to evaluate the chemical characteristics of the PP/OSP composite. A wavenumber range of 3250 to 566 cm−1 was applied to investigate the functional groups of the PP/OSP composite (Figure 2). All spectra with different ratios are illustrated in the figure below. As observed, with increasing OSP content within the PP matrix, the peak intensity decreases, and a shift in the composite wavelength occurs after OSP incorporation. The regions at 864 cm−1 and 1433 cm−1 in the PP+OSP spectrum are attributed to the appearance of the C=O functional group from the carbonate ion (Fleet M, 2009) [40], indicating the presence of CaCO3 in the PP/OSP composite. The peak at 2125 cm-1 is assigned to -CH2 stretching, and the peak at 1712 cm-1.is assigned to -CH stretching. The region at 3254 cm−1 is attributed to the -OH stretching of carboxyl groups. However, in the PP/OSP 5wt %, peaks were not detected in the composites, possibly due to the low concentrations of OSP. This suggests that a weak chemical reaction between PP/OSP may have occurred due to the aggregation and poor dispersion of OSP in the PP composite with 5 wt% OSP [41].
4.2. Physical Properties: P-V-T Diagram
The polymer’s PVT and viscosity values are required to perform the computer simulations of injection molding mold flow analysis. Typically, such information is supplied by the polymer suppliers. However, these data are often unavailable for polymer composites. Figure 3 shows the P-V-T values for neat PP and 12 wt% OSP composites. PP is a semi-crystalline, non-polar polymer with a high shrinkage rate [42]. Its melting temperature is around 160 ℃, showing a significant increase in specific volume during melting between 110~160 ℃. The specific volumes are 1.114 and 1.254 cm3/g for temperatures of 110 and 160, respectively, at 10 MPa. The volume expansion rate is 11.2%. The minimum and maximum P-V-T values for neat PP at 10 MPa are 1.08 and 1.31 cm3/g, respectively. Figure 3 also presents the P-V-T values for 12 wt% OSP of PP composites, with minimum and maximum values of 0.946 and 1.142 cm3/g, respectively, at 10 MPa. These values are smaller than those of neat PP. The main component of OSP is calcium carbonate, whose volume expansion is lower than that of the polymer when heated. Golzar et al. [43] examined the P-V-T properties of wood plastic composites (WPC) for extrusion. They found that the viscosity order at a shear rate of 8 s⁻¹ was 40 wt% WPC > 20 wt% WPC > HDPE, while at shear rates above 9 s⁻¹, the sequence changed to 20 wt% WPC > HDPE > 40 wt% WPC.
4.3. XRD
To understand the material structure and crystalline phase, X-ray diffraction (XRD) analysis was conducted on PP, OSP, and PP/OSP composites. Neat PP shows characteristic peaks at 2θvalues of 13.9, 16.7, 23.6, and 19.1, which are related to the semi-crystalline nature of PP. The diffraction peaks of OSP appear at 18, 22.9, 29.4, 317, and 36.2 (Figure 4), indicating that it is primarily composed of CaCO3, typically in the aragonite and calcite state. After heating to approximately 700~900 ℃, the XRD pattern changes to CaO. These data agree with the reported data in the literature for calcite [44].
4.4. Thermal Properties
The thermal stability of OSP plays a crucial role in processing PP polymer. PP/OSP bio-composites were analysed using TGA. Figure 5A,B show thermogravimetric analysis (TGA) and the first derivative TG curve of the PP/OSP composites. Although oyshell shells contain other oxides in their chemical composition, these did not significantly influence the thermal stability behavior of PP. The composites of PP with oyster exhibited higher onset decomposition and maximum decomposition temperatures. The temperature data indicate a single-phase degradation step, which can be attributed to the elimination of critical functional groups such as the carboxylic group [C=O]. This mass loss results in a maximum weight loss (Tmax) with a total mass loss of 95%. The remaining residual mass can be attributed to the PP structure with residual CH functional groups. The thermal stability increased remarkably after loading OSP into the PP matrix. This improvement might be attributed to the higher compatibility between PP and OSP. This result confirms better adhesion between OSP and PP at higher filler content, resulting in a more stable structure at a higher temperature [45].
4.5. SEM Micrographs
The surface SEM micrographs of PP/OSP 2 wt% (Figure 6A) showed a sponge-like material with fractures. The weak deformation of the biocomposite is due to cavities, resulting from fewer OSP aggregations and poor interfacial adhesion between the PP matrix and the OSP filler. The 5 wt% sample (Figure 6B) illustrated a change in morphology, characterized by an irregular and rougher surface. In the 7wt% sample(Figure 6C), an increased amount of the OSP filler was indicated by a slight change in morphology and a rough surface, revealing excellent compatibility between OSP and PP. This improvement is attributed to the increased weight percentage supporting the PP matrix, where the fillers introduced interfacial bonding between the two materials. The 12 wt% sample (Figure 6D) exhibited fractures similar to those observed in Figure 6C.
An overview of the cell density and dimension is represented in Figure 7. The assessment provides an outline of the effect of oyster shells on polypropylene performance. The figure shows a gradual increase in cell density, while cell size decreases with increasing oyster mass. As the oyster mass reaches 5 wt.%, the cell density remains constant, and the cell size decreases from 50 micrometers to 25 micrometers. These findings indicate that oyster shell particles act as heterogeneous nucleating agents that promote cell nucleation in polypropylene during microcellular foaming. The significant improvement in cell nucleation is attributed to the addition of oyster shell powder, which creates numerous heterogeneous boundaries and reduces cell nucleation energy [46]
4.6. Effect of Initial Concentration, pH, Dosage, and Time
The effect of initial metal ion concentration on the percentage removal of Pb(II) was investigated within the initial concentration range 0.125 to 1.25 ppm. Figure 8(A) illustrates the variation of metal ion removal efficiency by PP/OSP 5 wt% nanocomposite against initial concentration. Among all adsorbents, PP/OSP 5 wt% exhibited the best performance, achieving an optimal removal efficiency of 73.35% at 0.75 ppm.
PH is a critical parameter in adsorption between adsorbent and adsorbate particles. This is because the surface binding sites on the adsorbent are more effectively exposed for adsorbing the adsorbate, depending on the acidic or alkaline nature of the media. In this study, pH affected the adsorption process by influencing the level of protonation of the functional groups on the adsorbent surface and altering its surface charge. Figure 8(B) shows the effects of pH on the removal efficiency of Pb(II) using PP/OSP 5 wt% nanocomposites. The removal percentage increased with pH, reaching equilibrium at pH 6 using the PP/OSP 5 wt% adsorbent. Nonetheless, as pH further increased, there was a sudden fall in uptake efficacy from pH 7 onwards. The overall Pb(II) ion remediation was observed at pH 6 with 86.6 % efficacy using PP/OSP 5 wt% nanocomposite. The mechanism of pH relies on Pb(II) uptake [43], as indicated in previous experimental work. Toxic metal ion uptake can be divided into three different steps, viz., hydrolysis when pH > 6, adsorption or surficial remediation when 5 < pH < 6, and competitive adsorption between Pb2+ and H3O+ when pH < 5. Thus, the outcomes in Figure 6 suggest that remediation of Pb(II) ions is favorable via adsorption or surficial deposition. Accordingly, the negatively charged adsorbent surface selectively attracted Pb(II) within the 5 < pH < 6 pH range. Hydrolysis of Pb(II) is likely to reduce the absorption of free Pb(II) ions [47].
In this study, the investigation of the effects of adsorbent dosage and adsorption time is crucial for determining the adsorption capacity of PP/OSP 5 wt% nanocomposite. In Figure 8C, the removal of Pb(II) ions was varied using a dosage from 0.5 to 0.25 g. Observing the removal of Pb(II) in Figure 8C reveals that the uptake efficacy increases with the adsorbent dose. This is due to the increased availability of active sites on the surface of the PP/OSP 5 wt% nanocomposite for metal ion adsorption. Equilibrium was achieved at a 0.17 g with a removal efficiency of 91.1% for Pb(II) ions. The addition of mass increased the Pb(II) metal ion uptake. Figure 8D demonstrates the difference in percentage remediation of Pb(II) over a period range of 5, 10, 15, 20, 25, and 30 minutes using 0.17g of PP/OSP 5wt% nanocomposites with pH 6 and 0.75 ppm Pb(II) initial concentration as constants. From Figure 8D, the optimal Pb(II) remediation on PP/OSP 5 wt% was achieved at an adsorption capacity of 13.89 mg/g. The maximum remediation of Cd(II) was completed within 25 min using the PP/OSP 5 wt% nanocomposite. After 25 min, the nanocomposite reached equilibrium and showed a reduction in adsorption capacity.
4.7. Adsorption Isotherm
The adsorption isotherm analysis of Pb(II) ions on PP/OSP 5 wt% was carried out to understand the adsorption mechanism [48]. To improve the design of the adsorption system for the removal of Pb(II) ions from aqueous solutions, it is essential to describe the relationship between the amount of Pb(II) ions adsorbed per unit weight of adsorbent (qe) at adsorption equilibrium and the residual concentration of Pb(II) ions in the solution. Two models were used to analyze the experimental data and describe how adsorbents and adsorbates interact [49].
The desired isotherm was determined by evaluating the correlation coefficients for the linear forms of the conventional isotherm equations. Table 1 presents the values of the isotherm correlation coefficients based on these linear equations. Several studies have used two classical adsorption equilibrium models—the Langmuir equation (3) and the Freundlich equation (5) —for metal ions sorption by polymer composites [50]
4.7.1. Langmuir Isotherm
Whenever the plot fits a Langmuir isotherm, a plot of Ce/qe versus Ce is linear (Figure 8). The R2 values (R2=0.327) indicate that the PP/OSP 5 wt% adsorption data do not follow the Langmuir model. CH, OH-, and C=O functional groups were involved in the uptake of Pb(II) from aqueous solutions using the PP/OSP 5 wt% polymer composite; however, the results did not conform to the Langmuir adsorption model. The most important parameter in the Langmuir adsorption model is RL, a dimensionless constant defined as an equilibrium factor used to evaluate whether the adsorption system is satisfactory or unsatisfactory [51]. RL is calculated from the initial concentration using Eq. 6. If RL ranges between 0 and 1, the sorption is categorized as favourable, meaning that adsorption occurs at specific homogeneous sites within the adsorbent [52]. The dimensionless constant was found to be satisfactory, with a value of 0.86.
where qe is the adsorption capacity for each concentration (mg/g); qm is the maximum adsorption capacity or the adsorption capacity when the system achieves equilibrium (mg/g); K is the equilibrium constant (mg/L); and Ce is the adsorbate concentration (mg/L).
where K is related to the energy of adsorption (l/mg) and Co is the initial concentration
4.7.2. Freundlich Isotherm
The Freundlich isotherm model is based on a correlation describing the adsorption of solutes from a liquid to a solid surface and assumes that the adsorbent surface is heterogeneous (e.g., different sites with numerous adsorption energies are involved). Choy, McKay, and Porter presented the nonlinear form of the Freundlich isotherm as[49]:
where qe is the adsorption capacity for each concentration (mg/g); Kf is the Freundlich constant (Lm/g); Ce is the adsorbate concentration (mg/L); and 1/n is the heterogeneity factor. The linear plots with good correlation coefficients (> 0.900) indicate that the adsorption followed the Freundlich isotherm model. The correlation coefficient of 0.94 suggests that the PP/OSP 5 wt% composite exhibited favourable Pb(II) uptake.
4.7.3. Temkin Isotherm
The Temkin model assumes that heat adsorption for metal ions decreases with surface saturation due to continuous interactions between the adsorbent and dye molecules. The Temkin model is expressed as:
where B is the Temkin constant that is controlled by the adjusted uptake temperature (J mol−1), KT is the binding constant of the Temkin isotherm (L/g), qe is the amount of dye adsorbed at equilibrium (mg/g), and Ce is the dye equilibrium concentration at a constant temperature (mg L−1) [53]. The constants B and KT can be obtained from the slope and intercept of the plot of qe versus ln Ce, as shown in Figure 9 C below.
qe= B In kT B In Ce
Kt (dm3/g) represents the equilibrium binding energy corresponding to the optimum binding energy, and BT (J/mol) is a constant related to the heat of adsorption. R is the ideal gas constant, and T is the absolute temperature.

Table 2.
Freundlich isotherm and Langmuir isotherm results of PP/OSP 5 wt% composites.
| Langmuir isotherm | Freundlich isotherm | Temkin isotherm | ||||||||
|---|---|---|---|---|---|---|---|---|---|---|
| Metal ions | RL | K | R2 | Qmax (mg/g) | Kf | n | R2 | At | Bt | R2 |
| Pb(II) | 0.997 | 0.001 | 0.38 | 13,89 | 50,98 | 1.73 | 0.94 | 23,55 | 1,385 | 0.975 |
4.8. Kinetic Models
This study examines the rate of adsorption and adsorption mechanism on PP+OSP by applying pseudo-first-order and pseudo-second-order models. The correlation coefficients indicate the degree of agreement between the experimental data and the predicted model values. The linear form of the Lagergren et al. equation was used for the pseudo-first-order model as:
where qe and qt refer to the amounts of Pb(II) adsorbed on the PP/OSP 5 wt% nanocomposites at equilibrium time and time t (min), and Kad represents the pseudo-first-order constant (min−1). The rate constant, Kad, and correlation coefficients for different Pb(II) ion concentrations were calculated from the linear log plots (qe-qt) versus t. A best-fit line was plotted, and the correlation coefficient (R2) was obtained at 0.97, as shown in Figure 10 B. The correlation coefficient successfully fit the experimental data, which indicated that the adsorption of Pb(II) ions onto polymer composites followed pseudo-first-order kinetics for Pb(II) adsorbate.
The pseudo-second-order equation is expressed as Equation 10 below. For second-order kinetics to be valid, the plot of t/q(t) versus t must be linear. Figure 9 shows the plot of the pseudo-2nd-order model, with a linear fit of a correlation coefficient of R2 = 0,10, indicating that Pb(II) sorption followed the pseudo-2nd-order model, as shown in Table 3. For the 2nd-order kinetic model to be applicable, the correlation coefficient must be greater than 0.9. It is therefore concluded that the Freundlich isotherm was not a better fit for the experimental data compared to the Langmuir isotherm for Pb(II) ions removal on PP/OSP 5 wt% polymer composite. Hence, the sorption process of Pb(II) ions on PP/OSP 5 wt% polymer composites followed the first-order kinetics.
The linear form of the Lagergren et al. equation was used for pseudo-second-order as:
It should be noted that the pseudo-second order kinetics is only applicable when the plot of t/q(t) versus t shows a linear relationship. Figure 10B presents the plot for the pseudo-second order model, where the correlation coefficient, R2 =0.10 for Pb(II), indicates that the model was not suitable for Pb(II) adsorption.
4.9. Desorption Studies
Figure 11 illustrates the desorption studies of Pb(II) by PP/OSP 5 wt% in aqueous solutions. Desorption refers to the reuse and recycling of the adsorbent through several cycles. Therefore, the repeated adsorption and desorption cycles after adsorbent regeneration serve as significant indicators of performance. The adsorption test was conducted at 25 °C, pH 6±0.5, an initial Pb(II) concentration of 0.75 ppm, 0.17 g mass, 10 mL volume, and 25 minutes contact time. The desorption experimentation was performed at 25 °C, pH 8, using 1.0M NaOH as the desorption solution, with an initial Pb(II) concentration of 0.75 ppm, and a contact time of 25 min. The desorption removal rate of Pb(II) concentration on PP/OSP 5 wt% drastically decreased with an increase in the number of recycle times, which led to an early equilibrium and a rise in the residual Pb(II) ion concentration in solution. This was evident when the removal rate decreased from 90 % to 55 % after eight cycles, as shown in Figure 10. This indicates that the efficient adsorbent remained effective after eight cycles for reuse.
5. Conclusions
Instrumental analysis of the biocomposite confirmed a successful synthetic route for fabricating foamed PP/OSP biopolymer with varying weight percentages of 2, 5, 7, and 12 wt%. The increased weight percentage of the PP/OSP biocomposite enhanced its thermal and chemical stability, as illustrated in Figure 2 and Figure 5. The increase in cell density is attributed to the incorporation of oyster shell in the polypropylene. Functional groups were identified using FTIR-ATR, and all samples exhibited parent material characteristics, which can be attributed to low OSP loading. OSP did not significantly affect the thermal stability. The prepared PP/OSP biopolymers, with ratios of 2, 5, 7, and 12 wt% OSP, were used as heavy metal adsorbents for Pb(II) adsorption from aqueous solutions. The remediation of Pb(II) on the PP/OSP biocomposite followed the Langmuir isotherm, indicating that Pb(II) ions were adsorbed on homogeneous sites with uniform binding energies, forming a single layer on the biocomposite surface. It was established that the removal of Pb(II) from aqueous solutions occurred predominantly through chemical adsorption, consistent with pseudo-second-order kinetics.
Author Contributions
Conceptualization, S.H. and T.N.M.; methodology, S.H.; software, M. C. and T.N.M.; validation, T.N.M.; formal analysis, T.N.M. and N. B.; investigation, C.D.; resources, P.M.; data curation, M. C; writing—original draft preparation, T.N.M.; writing—review and editing, S.H.; visualization, S.H.; supervision, M.C.; project administration, M.C.; funding acquisition, N/A. All authors have read and agreed to the published version of the manuscript.
Data Availability Statement
Data available upon request.
Conflicts of Interest
The authors declare no conflicts of interest.
Abbreviations
The following abbreviations are used in this manuscript:
| OSP | Oyster shell powder |
| PP | Polypropylene |
| WPC | Wood plastic polymer |
References
- Chen, X.Y.; Zhang, Y.; Wang, X.G.; Zhang, C. M.; Jiao. Synergistic safety improvement between oyster shell powder and ammonium polyphosphate in TPU composites. 30Polymers for Advanced Technologies 2019, 30, 7. [Google Scholar] [CrossRef]
- Yang, D.; Shi, H.; Li, L.; Li, J.; Jabeen, K.; Kolandhasamy, P. Microplastic Pollution in Table Salts from China. Environ Sci Technol 2015, 49, 13622–13627. [Google Scholar] [CrossRef]
- Liebezeit, G.; Liebezeit, E. Origin of Synthetic Particles in Honeys. Pol J Food Nutr Sci 2015, 65, 143–147. [Google Scholar] [CrossRef]
- Singh, V.; Chakraborty, S. Microplastic Pollution in Freshwater Systems: A Potential Environmental Threat. In River Health and Ecology in South Asia: Pollution, Restoration, and Conservation; Springer International Publishing, 2021; 341–356. [CrossRef]
- Rafa, N.; Ahmed, B.; Zohora, F.; Bakya, J.; Ahmed, S.; Ahmed, S. F.; Mofijur, M.; Chowdhury, A. A.; Almomani, F. Microplastics as Carriers of Toxic Pollutants: Source, Transport, and Toxicological Effects. Environmental Pollution. 2024. [Google Scholar] [CrossRef] [PubMed]
- Rasheed, T.; Bilal, M.; Nabeel, F.; Adeel, M.; Iqbal, H. M. N. Environmentally-Related Contaminants of High Concern: Potential Sources and Analytical Modalities for Detection, Quantification, and Treatment. Environment International. 2019, 52–66. [Google Scholar] [CrossRef]
- Han, X.; Wang, S.; Yu, X.; Vogt, R. D.; Feng, J.; Zhai, L.; Ma, W.; Zhu, L.; Lu, X. Kinetics and Size Effects on Adsorption of Cu(II), Cr(III), and Pb(II) Onto Polyethylene, Polypropylene, and Polyethylene Terephthalate Microplastic Particles. Front Mar Sci. 2021, 8, 785146. [Google Scholar] [CrossRef]
- Anderson, J. C.; Park, B. J.; Palace, V. P. Microplastics in Aquatic Environments: Implications for Canadian Ecosystems. Environmental Pollution. 2016, 269–280. [Google Scholar] [CrossRef]
- Shi, M.; Xie, Q.; Li, Z. L.; Pan, Y. F.; Yuan, Z.; Lin, L.; Xu, X. R.; Li, H. X. Adsorption of Heavy Metals on Biodegradable and Conventional Microplastics in the Pearl River Estuary, China. Environmental Pollution 2023, 322, 121158. [Google Scholar] [CrossRef]
- Lai, S.; Fan, C.; Yang, P.; Fang, Y.; Zhang, L.; Jian, M.; Dai, G.; Liu, J.; Yang, H.; Shen, L. Effects of Different Microplastics on the Physicochemical Properties and Microbial Diversity of Rice Rhizosphere Soil. Front Microbiol 2024, 15, 1513890. [Google Scholar] [CrossRef]
- Liu, S.; Huang, J. H.; Zhang, W.; Shi, L. X.; Yi, K. X.; Zhang, C. Y.; Pang, H. L.; Li, J. N.; Li, S. Z. Investigation of the Adsorption Behavior of Pb(II) onto Natural-Aged Microplastics as Affected by Salt Ions. J Hazard Mater 2022, 431, 128643. [Google Scholar] [CrossRef]
- Tang, S.; Yang, X.; Zhang, T.; Qin, Y.; Cao, C.; Shi, H.; Zhao, Y. Adsorption Mechanisms of Metal Ions (Pb, Cd, Cu) onto Polyamide 6 Microplastics: New Insight into Environmental Risks in Comparison with Natural Media in Different Water Matrices. Gondwana Research 2022, 110, 214–225. [Google Scholar] [CrossRef]
- Li, S.; Cao, L.; Liu, Q.; Sui, S.; Bian, J.; Zhao, X.; Gao, Y. Enhancing Pb Adsorption on Crushed Microplastics: Insights into the Environmental Remediation. Water 2024, 16, 3541. [Google Scholar] [CrossRef]
- Hossain, M. T.; Shahid, M. A.; Mahmud, N.; Habib, A.; Rana, M. M.; Khan, S. A.; Hossain, M. D. Research and Application of Polypropylene: A Review. Discover Nano. Springer. 2024. [Google Scholar] [CrossRef] [PubMed]
- Dziuba, R.; Kucharska, M.; Madej-Kiełbik, L.; Sulak, K.; Wiśniewska-Wrona, M. Biopolymers and Biomaterials for Special Applications within the Context of the Circular Economy. Materials. 2021, 14, 7704. [Google Scholar] [CrossRef]
- Muteeb, G.; Rehman, M. T.; Shahwan, M.; Aatif, M. Origin of Antibiotics and Antibiotic Resistance, and Their Impacts on Drug Development: A Narrative Review. Pharmaceuticals. 2023, 16, 1615. [Google Scholar] [CrossRef]
- Rani, S.; Mathew, B. T.; Kumar, D.; Nandan, B.; Srivastava, R. K. Upcycling Polypropylene Waste into Antimicrobial Porous Composite – A Sustainable Approach for Circular Economy. Surfaces and Interfaces 2025, 62, 106300. [Google Scholar] [CrossRef]
- Tsou, C. H.; Wu, C. S.; Hung, W. S.; De Guzman, M. R.; Gao, C.; Wang, R. Y.; Chen, J.; Wan, N.; Peng, Y. J.; Suen, M. C. Rendering Polypropylene Biocomposites Antibacterial through Modification with Oyster Shell Powder. Polymer 2019, 160, 265–271. [Google Scholar] [CrossRef]
- Bikiaris, D. N.; Vassiliou, A.; Pavlidou, E.; Karayannidis, G. P. Compatibilisation Effect of PP-g-MA Copolymer on IPP/SiO2 Nanocomposites Prepared by Melt Mixing. Eur Polym J 2005, 41, 1965–1978. [Google Scholar] [CrossRef]
- Chan, C.-M.; Wu, J.; Li, J.-X.; Cheung, Y.-K. Polypropylene/Calcium Carbonate Nanocomposites. polymer, 2002, 43, 2981–2992. [Google Scholar] [CrossRef]
- Mirjalili, F.; Chuah, L.; Salahi, E. Mechanical and Morphological Properties of Polypropylene/Nano α -Al Composites. The Scientific World Journal 2014. [Google Scholar] [CrossRef]
- Moja, T. N.; Bunekar, N.; Mojaki, S.; Mishra, S. B.; Tsai, T. Y.; Hwang, S. S.; Mishra, A. K. Polypropylene–Polypropylene-Grafted-Maleic Anhydride–Montmorillonite Clay Nanocomposites for Pb(II) Removal. J Inorg Organomet Polym Mater 2018, 28, 2799–2811. [Google Scholar] [CrossRef]
- Karwadiya, J.; Lützenkirchen, J.; Darbha, G. K. Retention of ZnO Nanoparticles onto Polypropylene and Polystyrene Microplastics: Aging-Associated Interactions and the Role of Aqueous Chemistry. Environmental Pollution 2024, 352, 124097. [Google Scholar] [CrossRef] [PubMed]
- Singh, V.; Yadav, S. S.; Chauhan, V.; Shukla, S.; Vishnolia, K. K. Applications of Nanoparticles in Various Fields. In Diagnostic Applications of Health Intelligence and Surveillance Systems. 2021, 221–236. [Google Scholar] [CrossRef]
- Joudeh, N.; Linke, D. Nanoparticle Classification, Physicochemical Properties, Characterization, and Applications: A Comprehensive Review for Biologists. Journal of Nanobiotechnology. 2022. [Google Scholar] [CrossRef] [PubMed]
- Oliani, W. L.; Parra, D. F.; Komatsu, L. G. H.; Lincopan, N.; Rangari, V. K.; Lugao, A. B. Fabrication of Polypropylene/Silver Nanocomposites for Biocidal Applications. Materials Science and Engineering C 2017, 75, 845–853. [Google Scholar] [CrossRef]
- Shah, A. R.; Prabhakar, M. N.; Lee, D.-W.; Kim, B.-S.; Song, J. I. Development and Characterization of Oyster Shell Powder Filled Polypropylene Composite. Composites Research 2014, 27, 201–206. [Google Scholar] [CrossRef]
- Haba, B.; Djellali, S.; Abdelouahed, Y.; Boudjelida, S.; Faleschini, F.; Carraro, M. Transforming Plastic Waste into Value: A Review of Management Strategies and Innovative Applications in Sustainable Construction. Polymers 2025, 17, 881. [Google Scholar] [CrossRef]
- Hsu, T. C. Experimental Assessment of Adsorption of Cu2+ and Ni2+ from Aqueous Solution by Oyster Shell Powder. J Hazard Mater 2009, 171, 995–1000. [Google Scholar] [CrossRef]
- Liu, T.; Chen, M.; Zhao, Y.; Zhao, S.; Rui, C.; Li, W.; Yang, F. Oyster Shell Powder/PCL Composite Scaffolds Loaded with Psoralen Nanospheres Promote Large Bone Defect Repair. ACS Omega 2025, 10, 2231–2242. [Google Scholar] [CrossRef]
- Hussain, F.; Kim, L. H.; Oh, S. E.; Kim, S. Neutralization of PH and Removal of Heavy Metals from Acid Mine Water by Using Low-Cost Biosorbents in Batch and Column Studies. Groundw Sustain Dev 2025, 31, 101506. [Google Scholar] [CrossRef]
- Shan Romario, Y.; Octavia, T.; Hananto Saputra, T.; Fransiskus Xaverius, Suryadi. Sustainable composite fabrication using waste oyster shells through additive manufacturing technology. Journal of the Chinese Society of Mechanical Engineers 2024, 45, 501–507. [Google Scholar]
- Xu, X.; Liu, X.; Oh, M.; Park, J. Oyster Shell as a Low-Cost Adsorbent for Removing Heavy Metal Ions from Wastewater. Pol J Environ Stud 2019, 28, 2949–2959. [Google Scholar] [CrossRef]
- Topić Popović, N.; Lorencin, V.; Strunjak-Perović, I.; Čož-Rakovac, R. Shell Waste Management and Utilization: Mitigating Organic Pollution and Enhancing Sustainability. Applied Sciences 2023, 13, 623. [Google Scholar] [CrossRef]
- Bellei, P.; Torres, I.; Solstad, R.; Flores-Colen, I. Potential Use of Oyster Shell Waste in the Composition of Construction Composites: A Review. Buildings 2023, 13, 1546. [Google Scholar] [CrossRef]
- Mouni, L.; Merabet, D.; Robert, D.; Bouzaza, A. Batch Studies for the Investigation of the Sorption of the Heavy Metals Pb2+ and Zn2+ onto Amizour Soil (Algeria). Geoderma 2009, 154, 30–35. [Google Scholar] [CrossRef]
- Torad, N. L.; El-Nasr, A. A.; Doustkhah, E.; Abu Haija, M.; Lyu, W.; Khalifa, A.; Salahuddin, N. A.; Assadi, M. H. N.; Ayad, M. M. Chemically Surface-Engineered Mesoporous Silica for the Toxic Metal Ions Uptake: Insights from Experiment and Density Functional Calculations. Langmuir 2025, 41, 9194–9203. [Google Scholar] [CrossRef] [PubMed]
- Aslam, A.; Kanwal, F.; Javied, S.; Nisar, N.; Torriero, A. A. J. Microbial Biosorption: A Sustainable Approach for Metal Removal and Environmental Remediation. International Journal of Environmental Science and Technology 2025, 13245–13276. [Google Scholar] [CrossRef]
- Phiri, Z.; Moja, N. T.; Nkambule, T. T. I.; de Kock, L. A. Utilization of Biochar for Remediation of Heavy Metals in Aqueous Environments: A Review and Bibliometric Analysis. Heliyon. 2024. [Google Scholar] [CrossRef]
- Fleet, M. E. Infrared Spectra of Carbonate Apatites: Ν2-Region Bands. Biomaterials 2009, 30, 1473–1481. [Google Scholar] [CrossRef]
- He, R.; Zhou, J. L.; Huang, P. M.; Guan, B. W.; Sheng, Y. P. Effects of Mineral Admixtures on Microstructure-Linked Strength Properties of Macro-Synthetic Fiber Reinforced Concrete. International Journal of Pavement Research and Technology 2015, 8, 94–102. [Google Scholar] [CrossRef]
- Kościuszko, A; Marciniak, D; Sykutera, D; Post-processing time dependence of shrinkage and mechanical properties of injection-molded polypropylene. Materials 2020, 14, 22. [CrossRef]
- Golzar, M; Sadeghian, N. Measurement of PVT properties of wood-plastic composites, 16TH International Conference on Composites Materials ISME-2007, 2007. [CrossRef]
- Tongwanichniyom, S.; Thanit Pattamapitoon, T.; Sangvichien, N.; Phornphisutthimas, S. ; Production of calcium oxide from waste oyster shells for a value-added application of antibacterial. Ecology Environment and Conservation 2021, 27, 539–547. [Google Scholar]
- Li, L.; Zeng, Z.; Wang, Z.; Peng, Z.; She, X.; Li, S.; Zhong, J. Effect of Oyster Shell Powder Loading on the Mechanical and Thermal Properties of Natural Rubber/Oyster Shell Composites. Polymers and polymer composites 2017, 25. [Google Scholar] [CrossRef]
- Neskoromnaya, E. A.; Khamizov, R. K.; Melezhyk, A. V.; Memetova, A. E.; Mkrtchan, E. S.; Babkin, A. V. Adsorption of Lead Ions (Pb2+) from Wastewater Using Effective Nanocomposite GO/CMC/FeNPs: Kinetic, Isotherm, and Desorption Studies. Colloids Surf A Physicochem Eng Asp 2022, 655, 130224. [Google Scholar] [CrossRef]
- Musah, M.; Azeh, Y.; Mathew, J.; Umar, M.; Abdulhamid, Z.; Muhammad, A. Adsorption Kinetics and Isotherm Models: A Review. Caliphate Journal of Science and Technology 2022, 4, 20–26. [Google Scholar] [CrossRef]
- Kostoglou, M.; Karapantsios, T. D. Why Is the Linearized Form of Pseudo-Second Order Adsorption Kinetic Model So Successful in Fitting Batch Adsorption Experimental Data? Colloids and Interfaces 2022, 6, 55. [Google Scholar] [CrossRef]
- Çiçekçi, A.; Sevim, F.; Sevim, M.; Kavcı, E. Adsorption Capacity, Reaction Kinetics and Thermodynamic Studies on Ni(II) Removal with GO@Fe3O4@Pluronic-F68 Nanocomposite. Polymers 2025, 17, 2141. [Google Scholar] [CrossRef]
- Chien, M.; Chen, S.; Huang, K.; Moja, T. N.; Hwang, S. Cell Morphology, Material Property and Ni(II) Adsorption of Microcellular Injection-Molded Polystyrene Reinforced with Graphene Nanoparticles. Polymers 2025, 17, 189. [Google Scholar] [CrossRef]
- Oladimeji, T. E.; Oyedemi, M.; Emetere, M. E.; Agboola, O.; Adeoye, J. B.; Odunlami, O. A. Review on the Impact of Heavy Metals from Industrial Wastewater Effluent and Removal Technologies. Heliyon 2024. [Google Scholar] [CrossRef]
- Chen, S.; Xu, R.; Huang, H.; Yi, F.; Zhou, X.; Zeng, H. Reduction-Adsorption Behavior of Platinum Ions on Activated Carbon Fibers. Journal of Materials Science 2007, 42, 9572–9581. [Google Scholar] [CrossRef]
- Yadav, V.; Tiwari, D. P.; Bhagat, M. Isotherm, Kinetics, and Thermodynamic Parameters Study of Arsenic (Iii) and Copper (Ii) Adsorption onto Limonia Acidissima Shell Carbon. Desalination Water Treat 2020, 184, 214–224. [Google Scholar] [CrossRef]
Figure 1.
Microcellular injection molding setup.
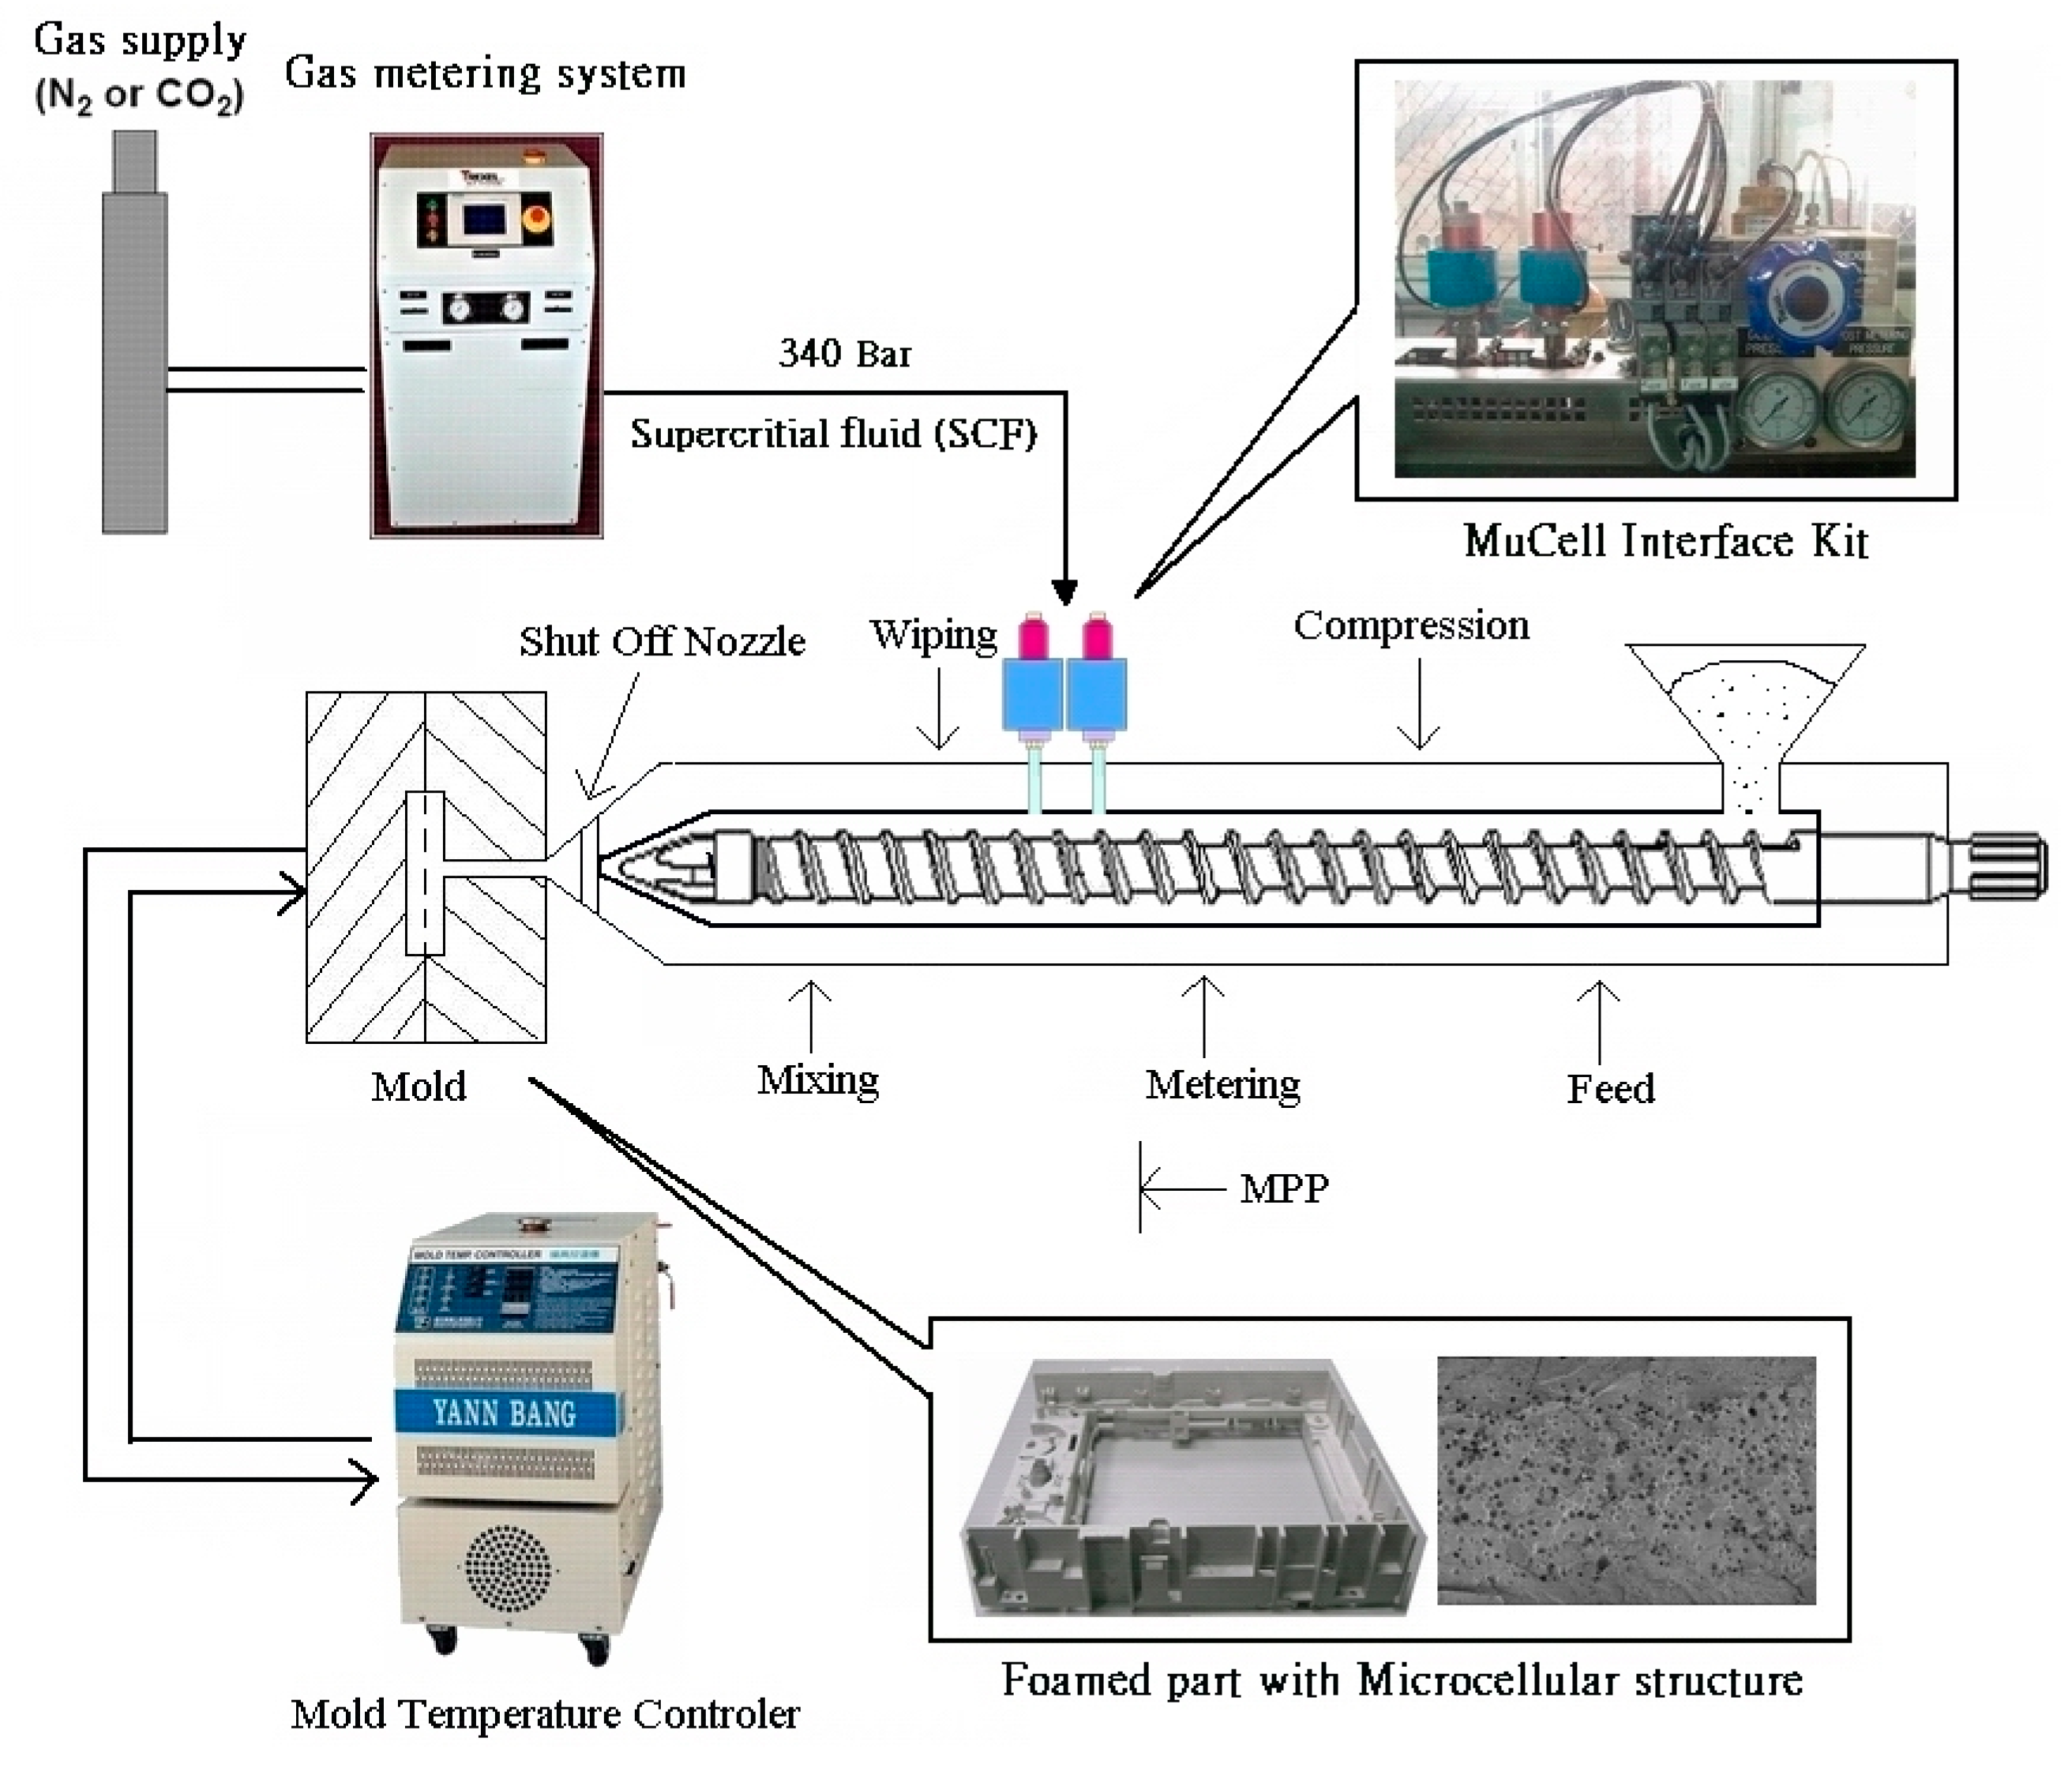
Figure 2.
FT-IR spectrum of the polypropylene oyster shells.
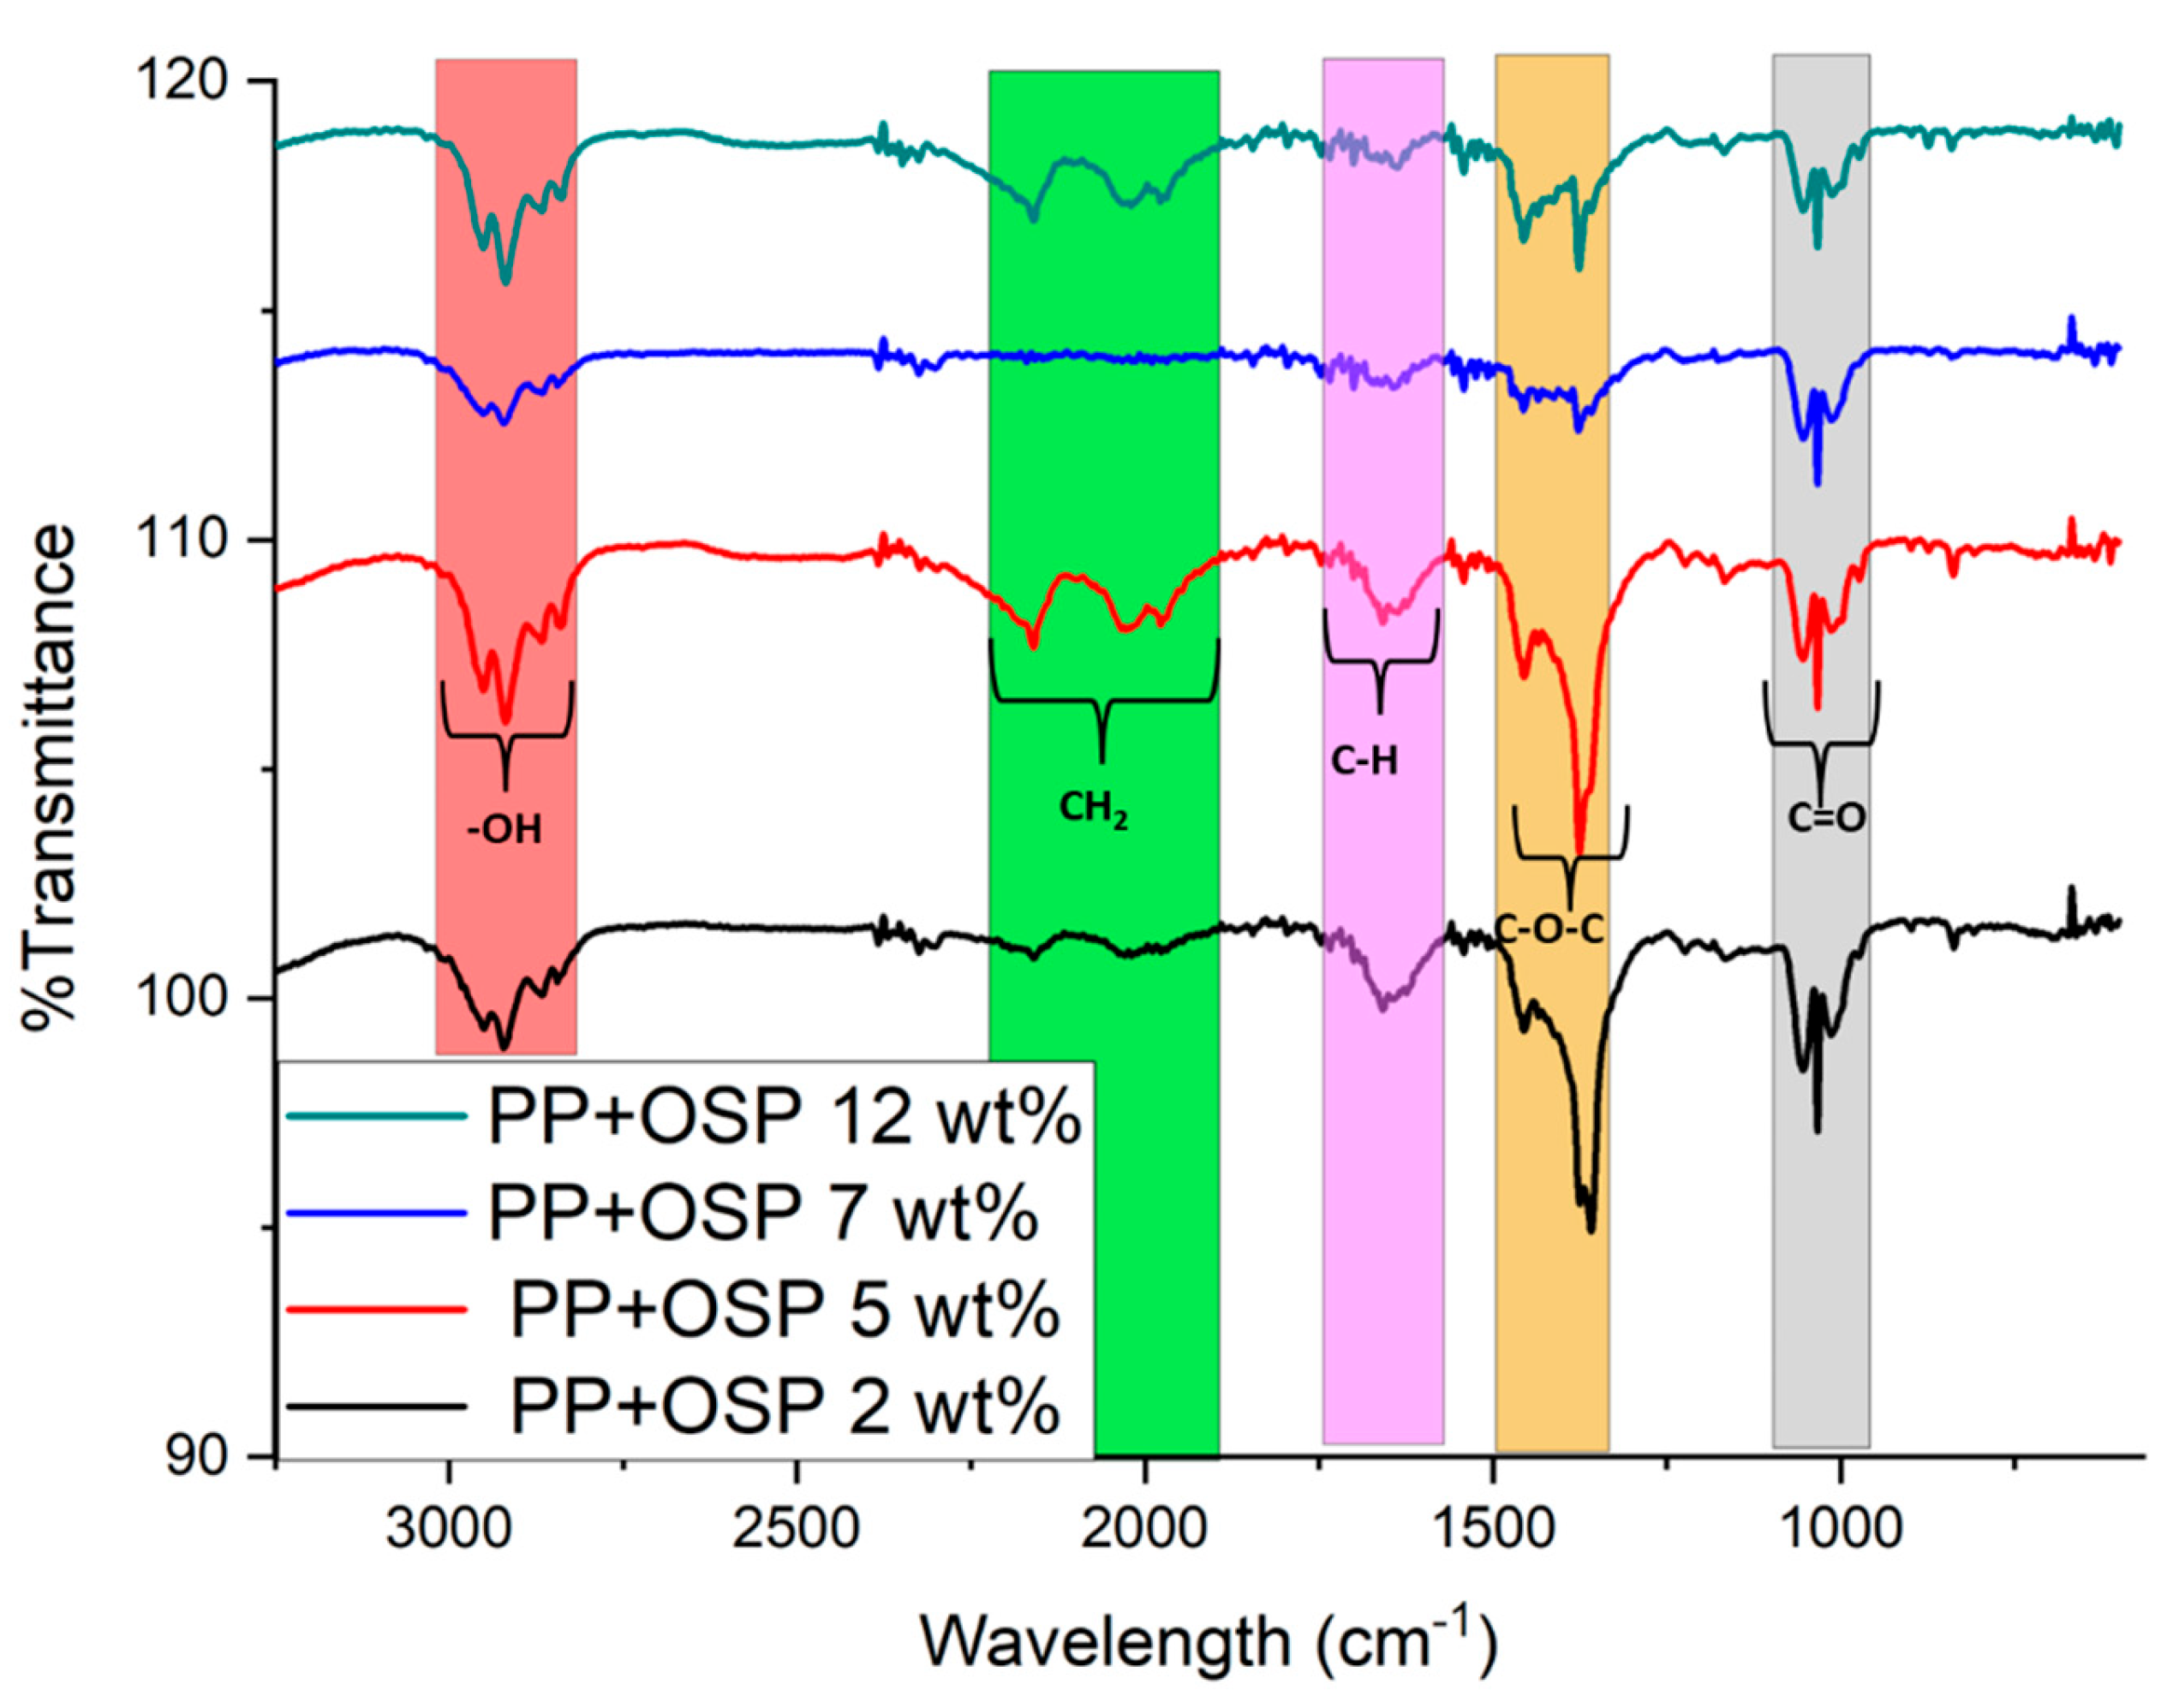
Figure 3.
P-V-T value for neat PP and 12 wt.% OSP composites.
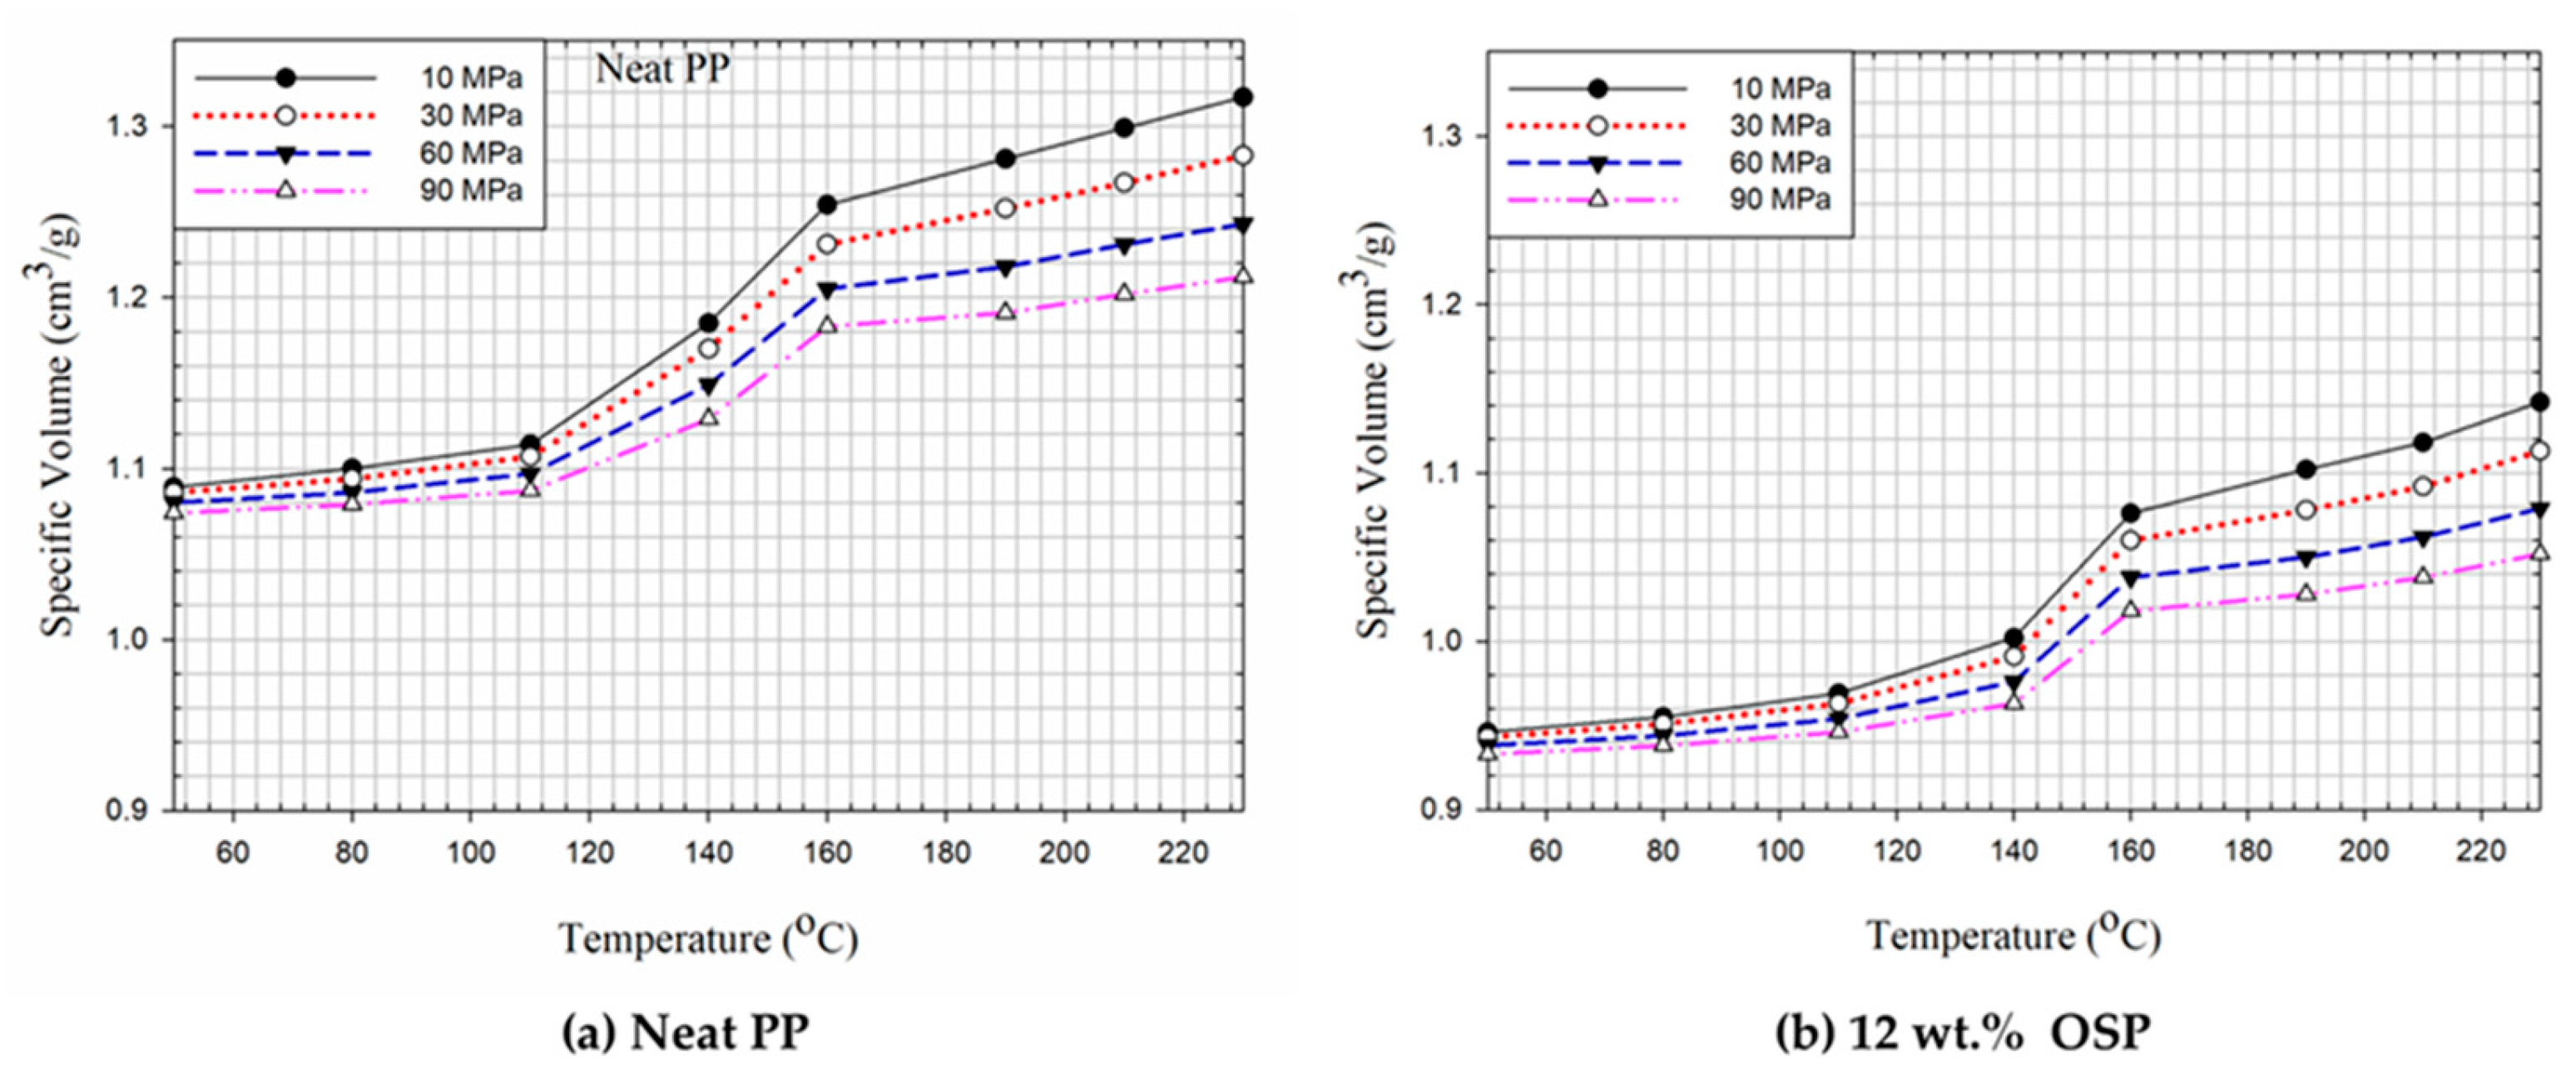
Figure 4.
XRD characteristics of OSP, neat PP, and 7 wt.% OSP composites.
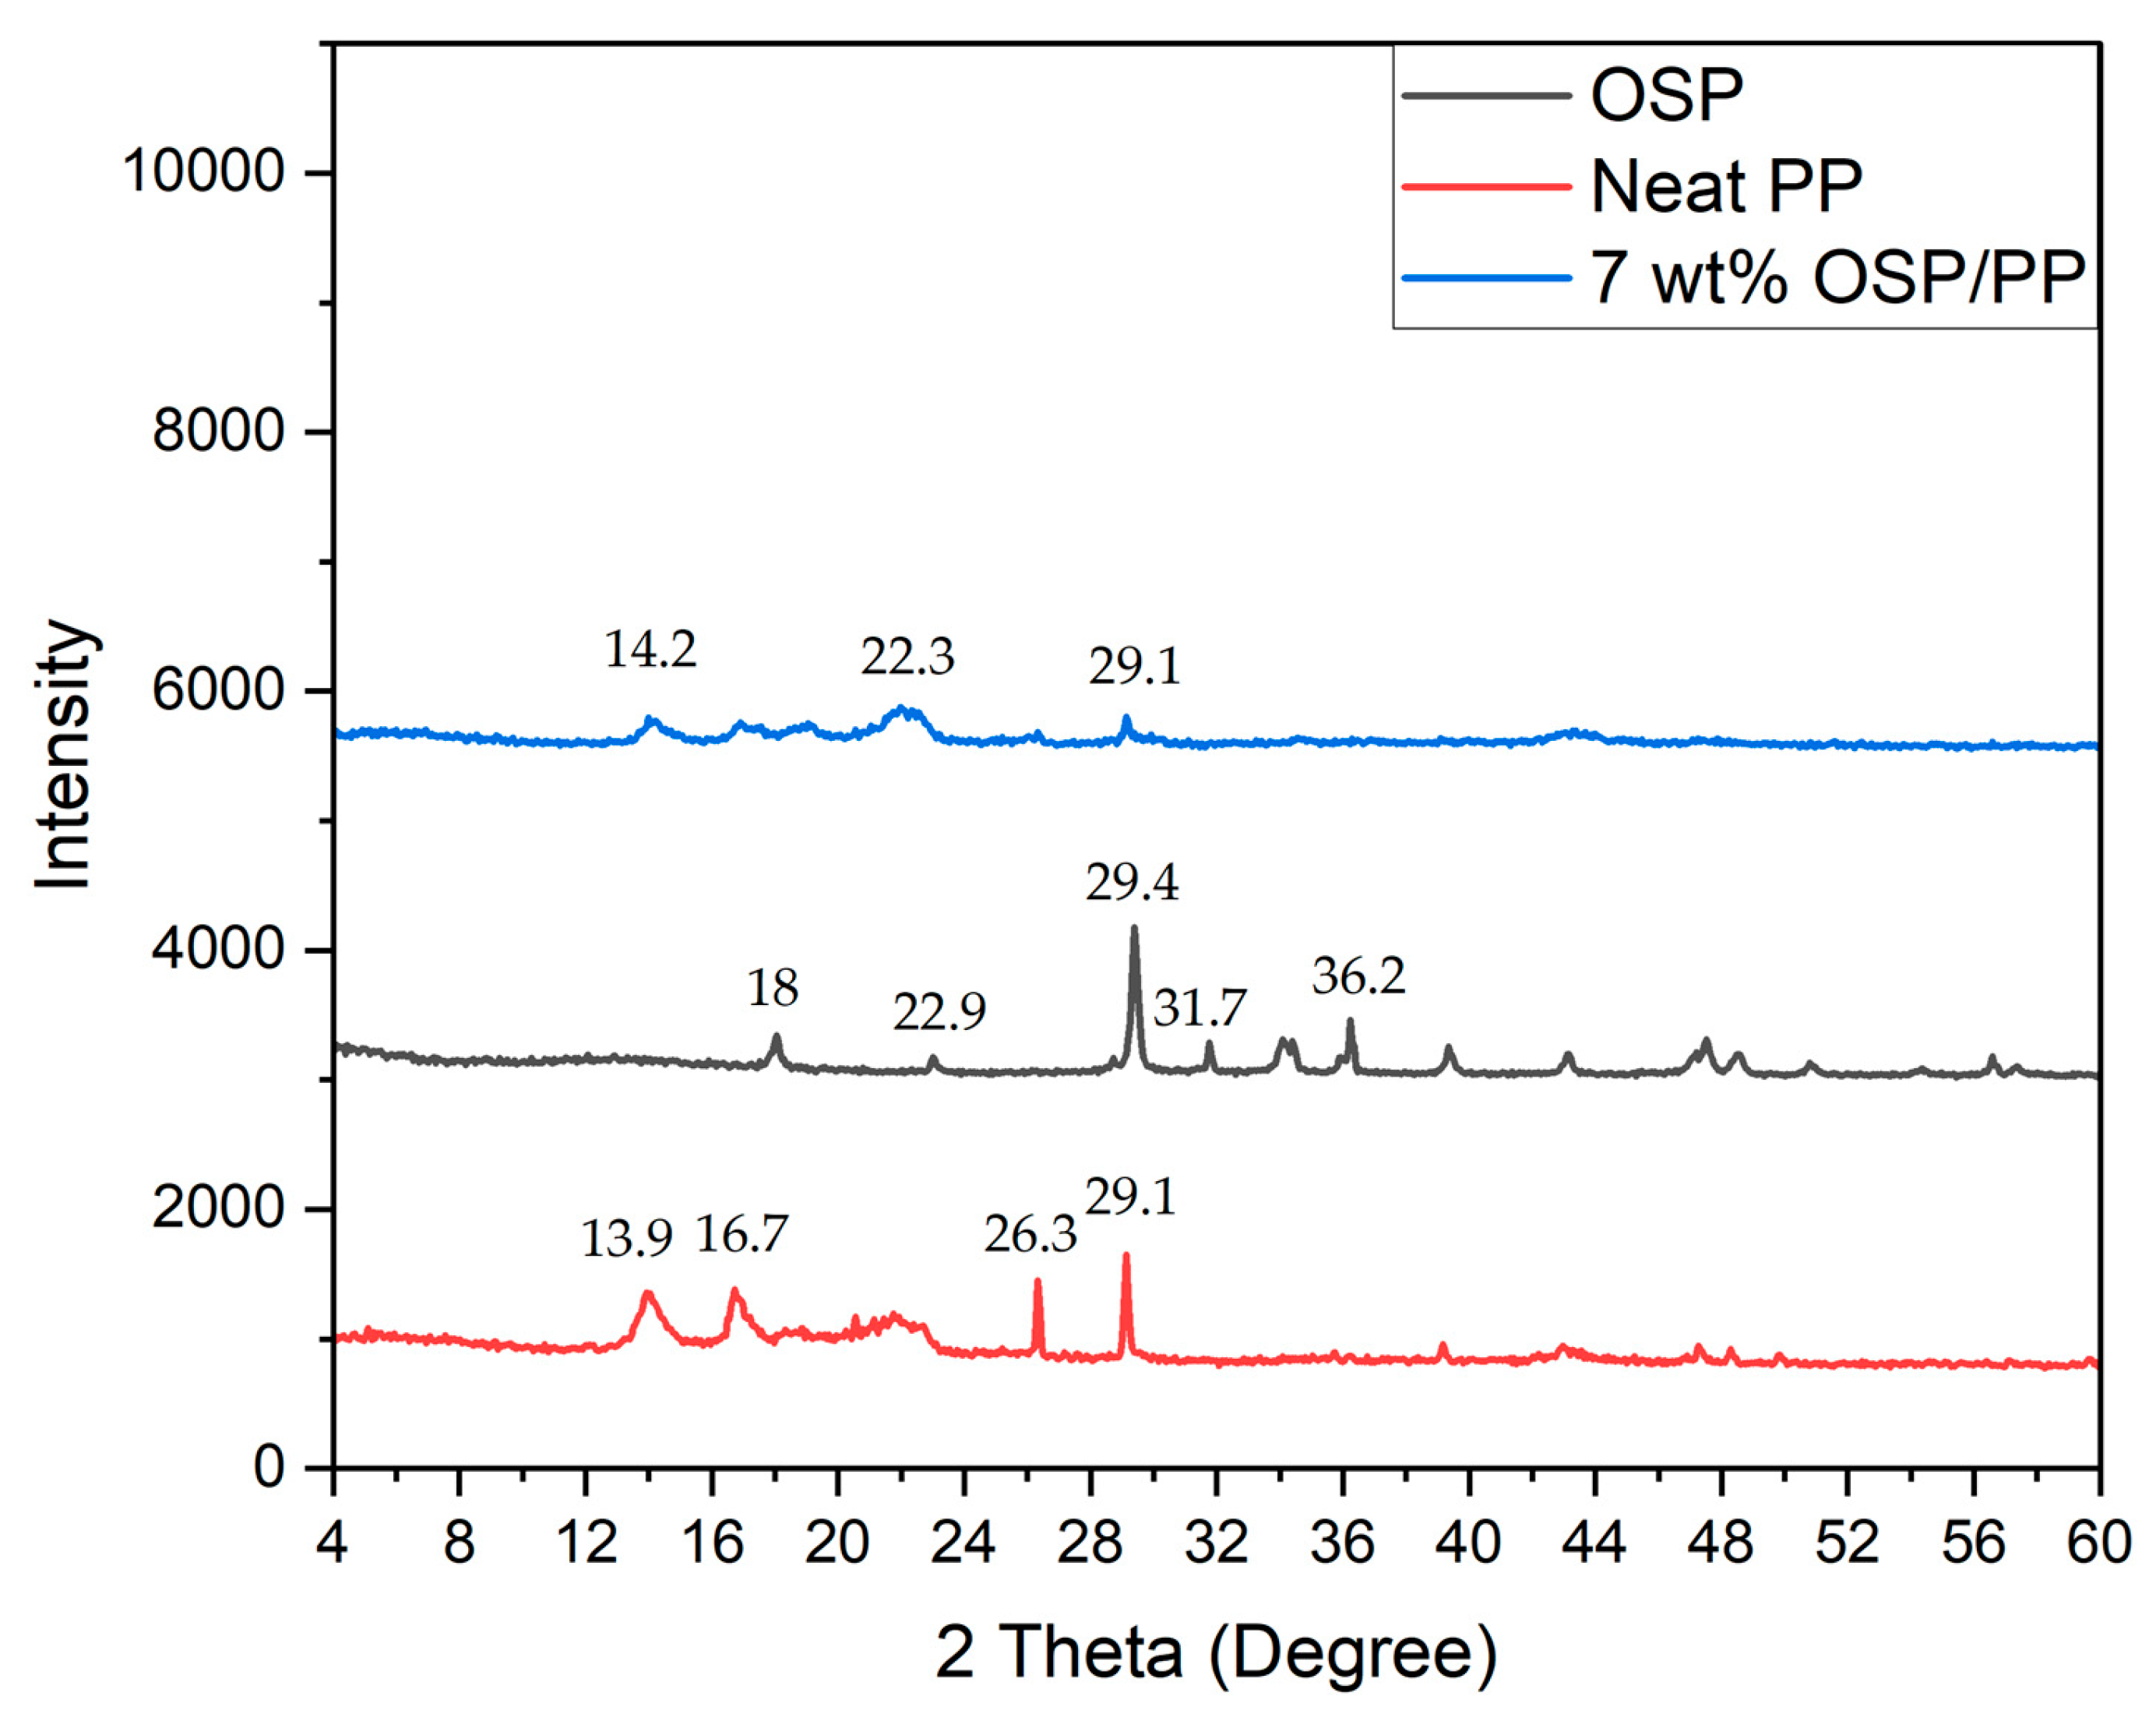
Figure 5.
Thermogravimetric curves of PP/OSP biocomposites.
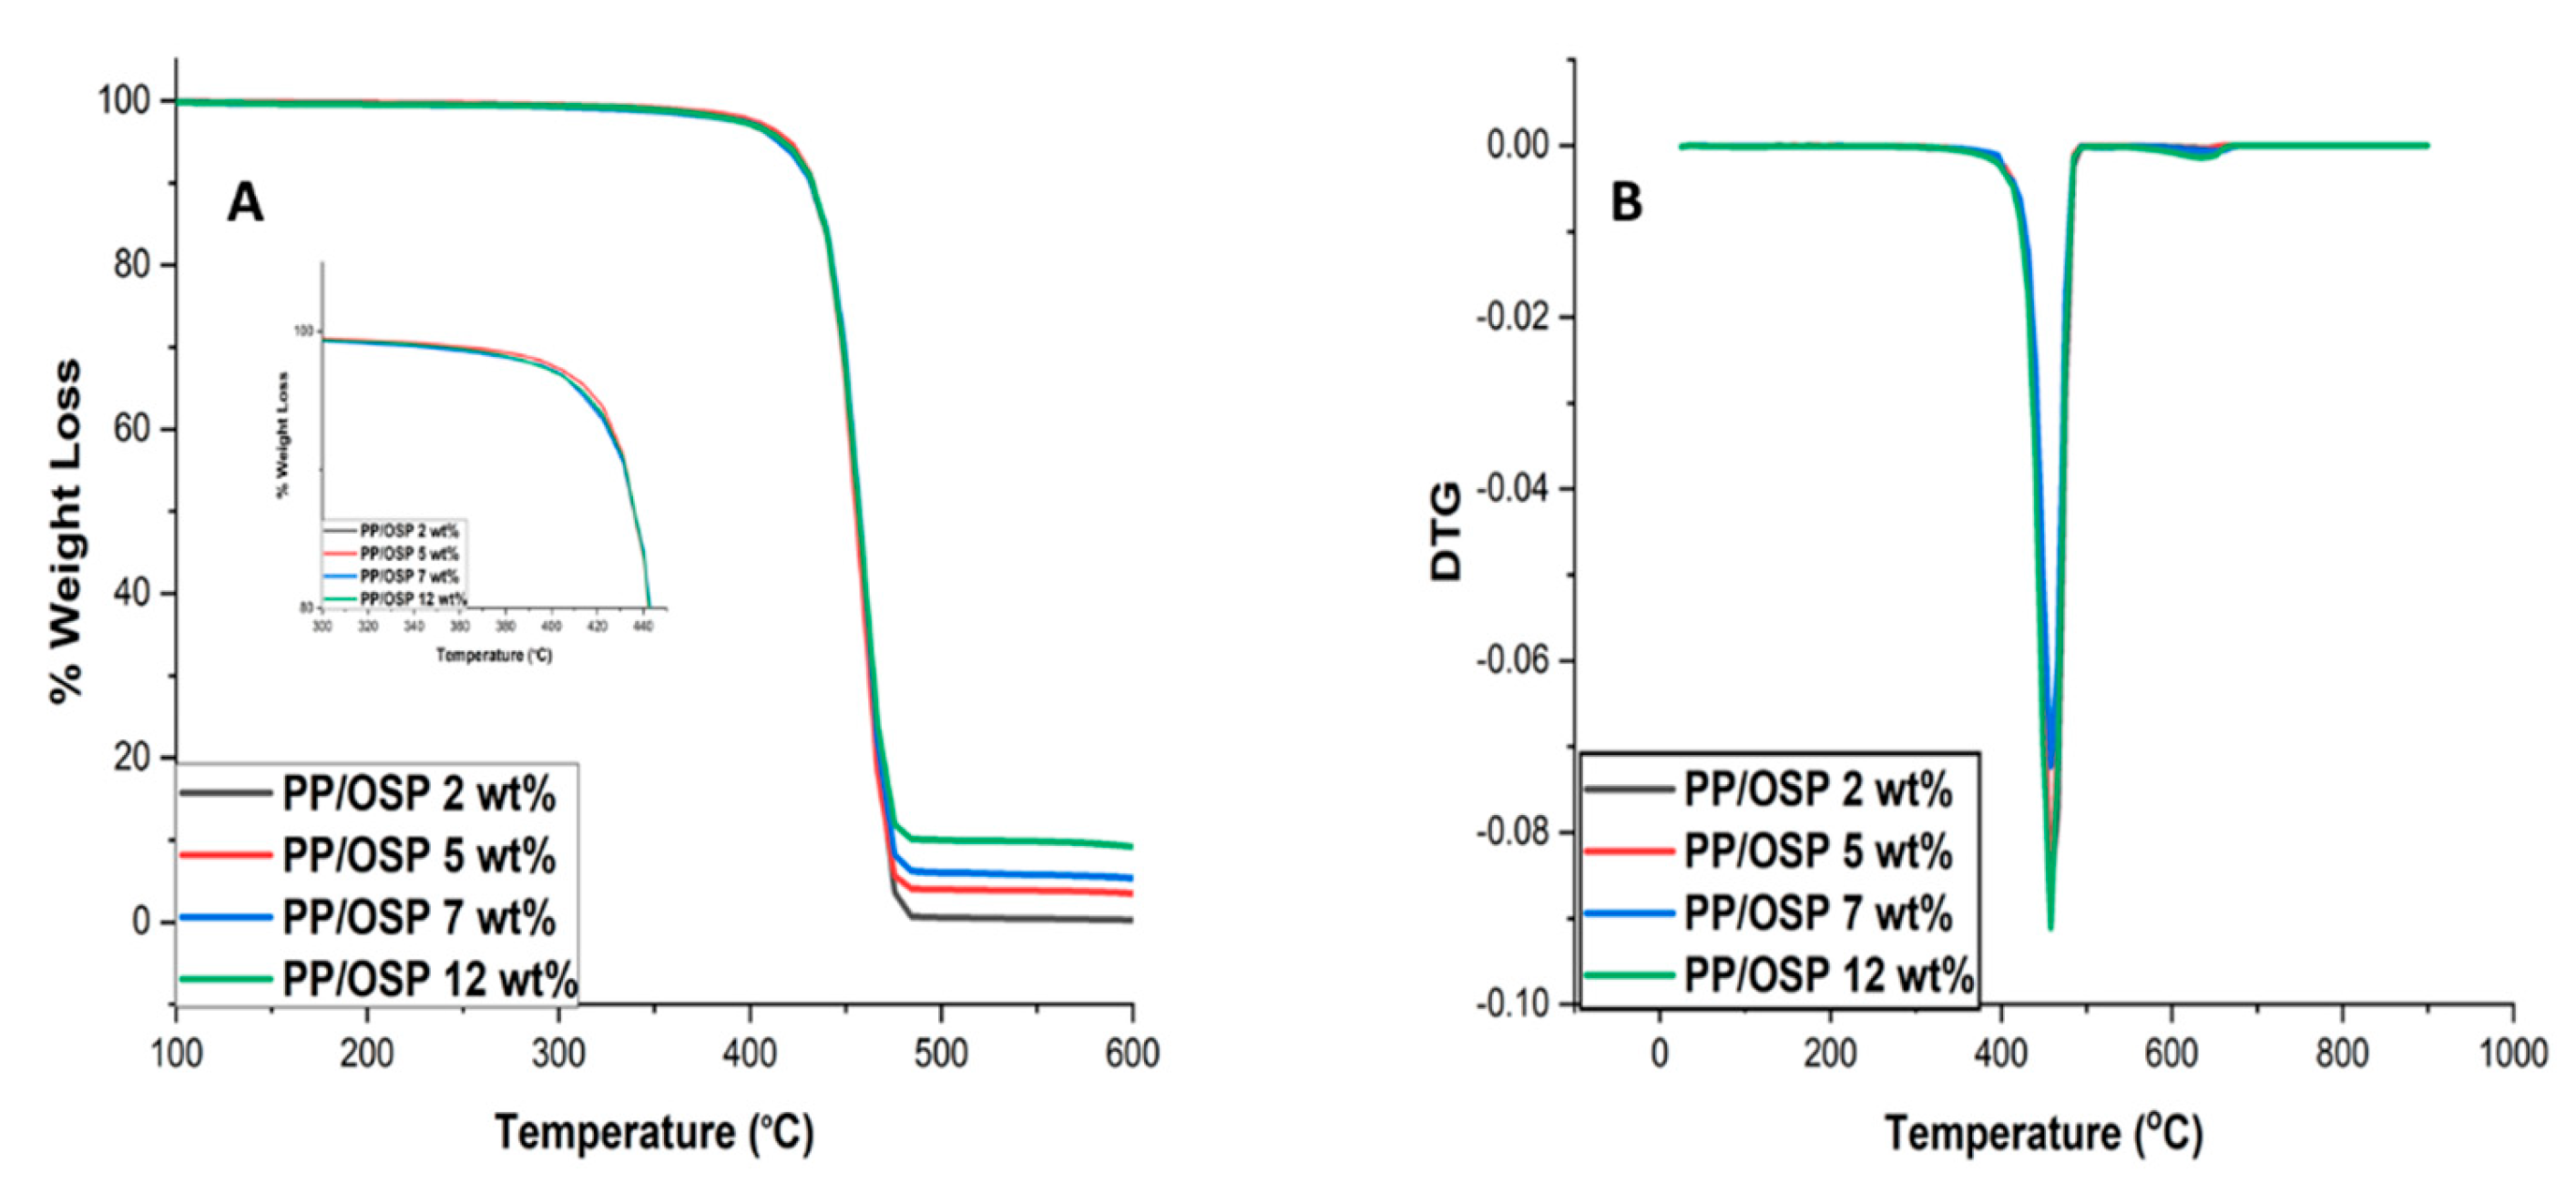
Figure 6.
SEM images of PP/OSP biocomposites: (a) 2 wt% OSP; (b) 5 wt% OSP; (c) 7 wt% OSP; (d) 12 wt% OSP; (e) neat OSP.
Figure 6.
SEM images of PP/OSP biocomposites: (a) 2 wt% OSP; (b) 5 wt% OSP; (c) 7 wt% OSP; (d) 12 wt% OSP; (e) neat OSP.
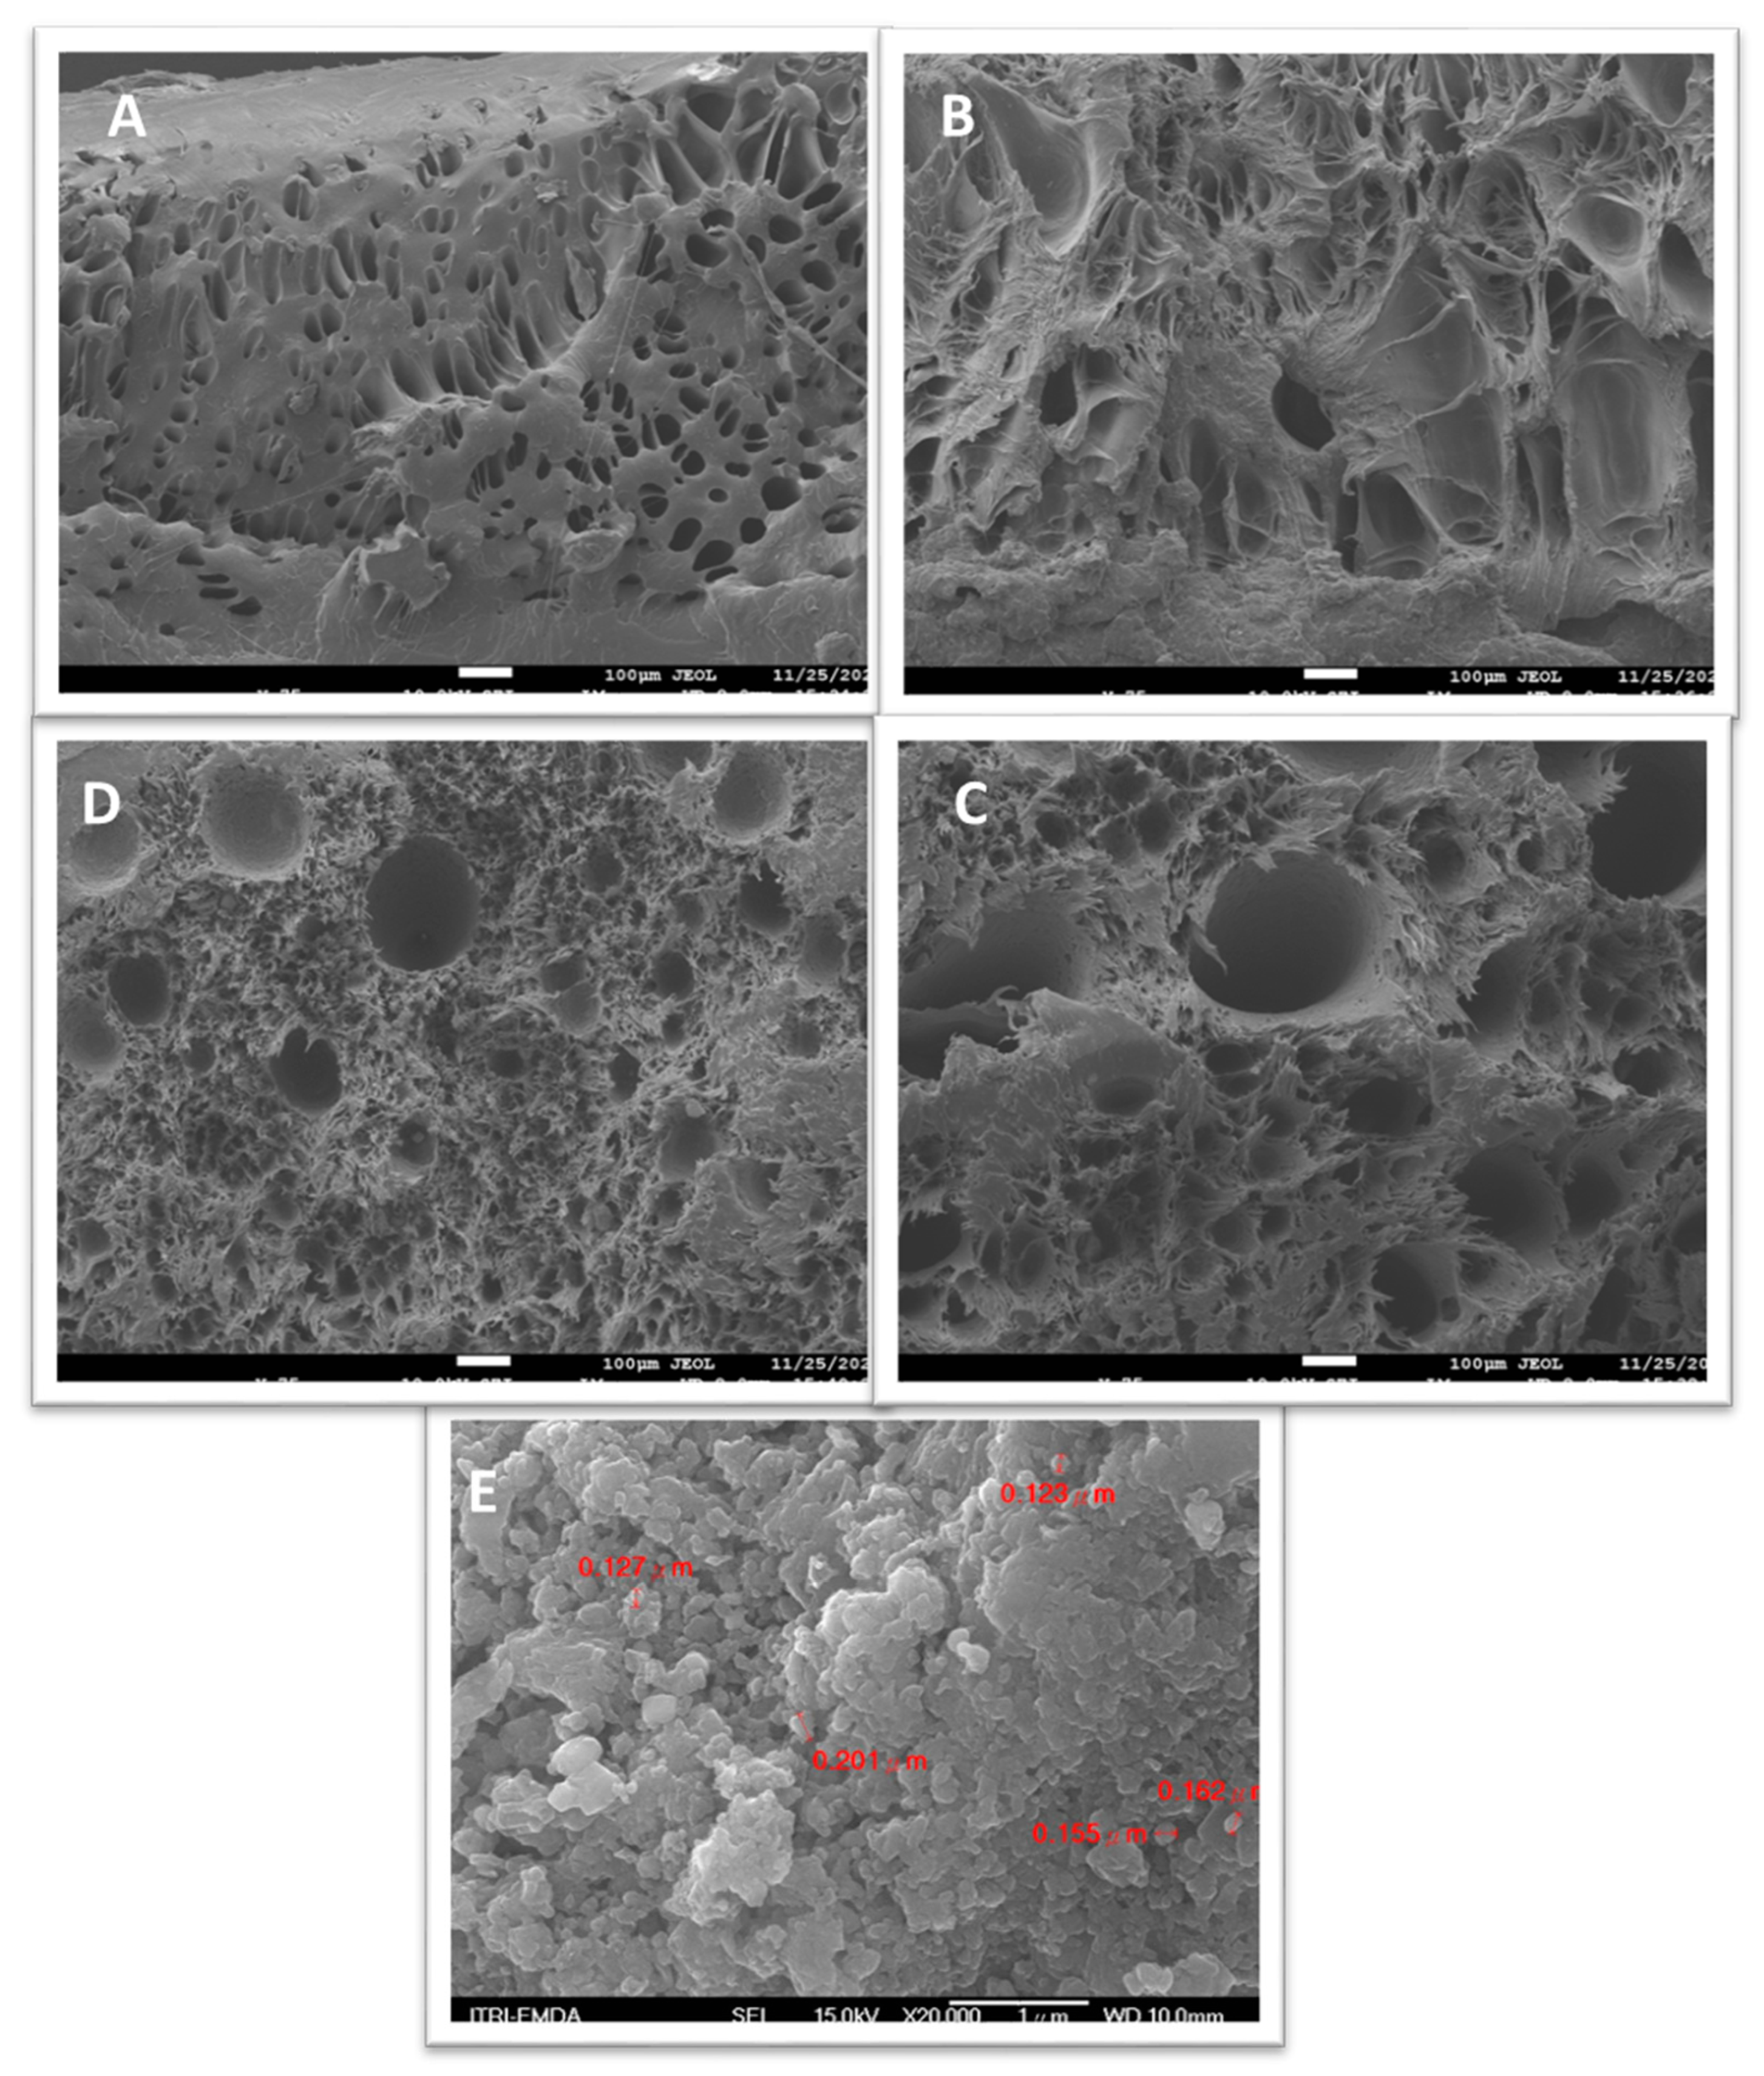
Figure 7.
Cell size and cell density of oyster shell powder on polypropylene.
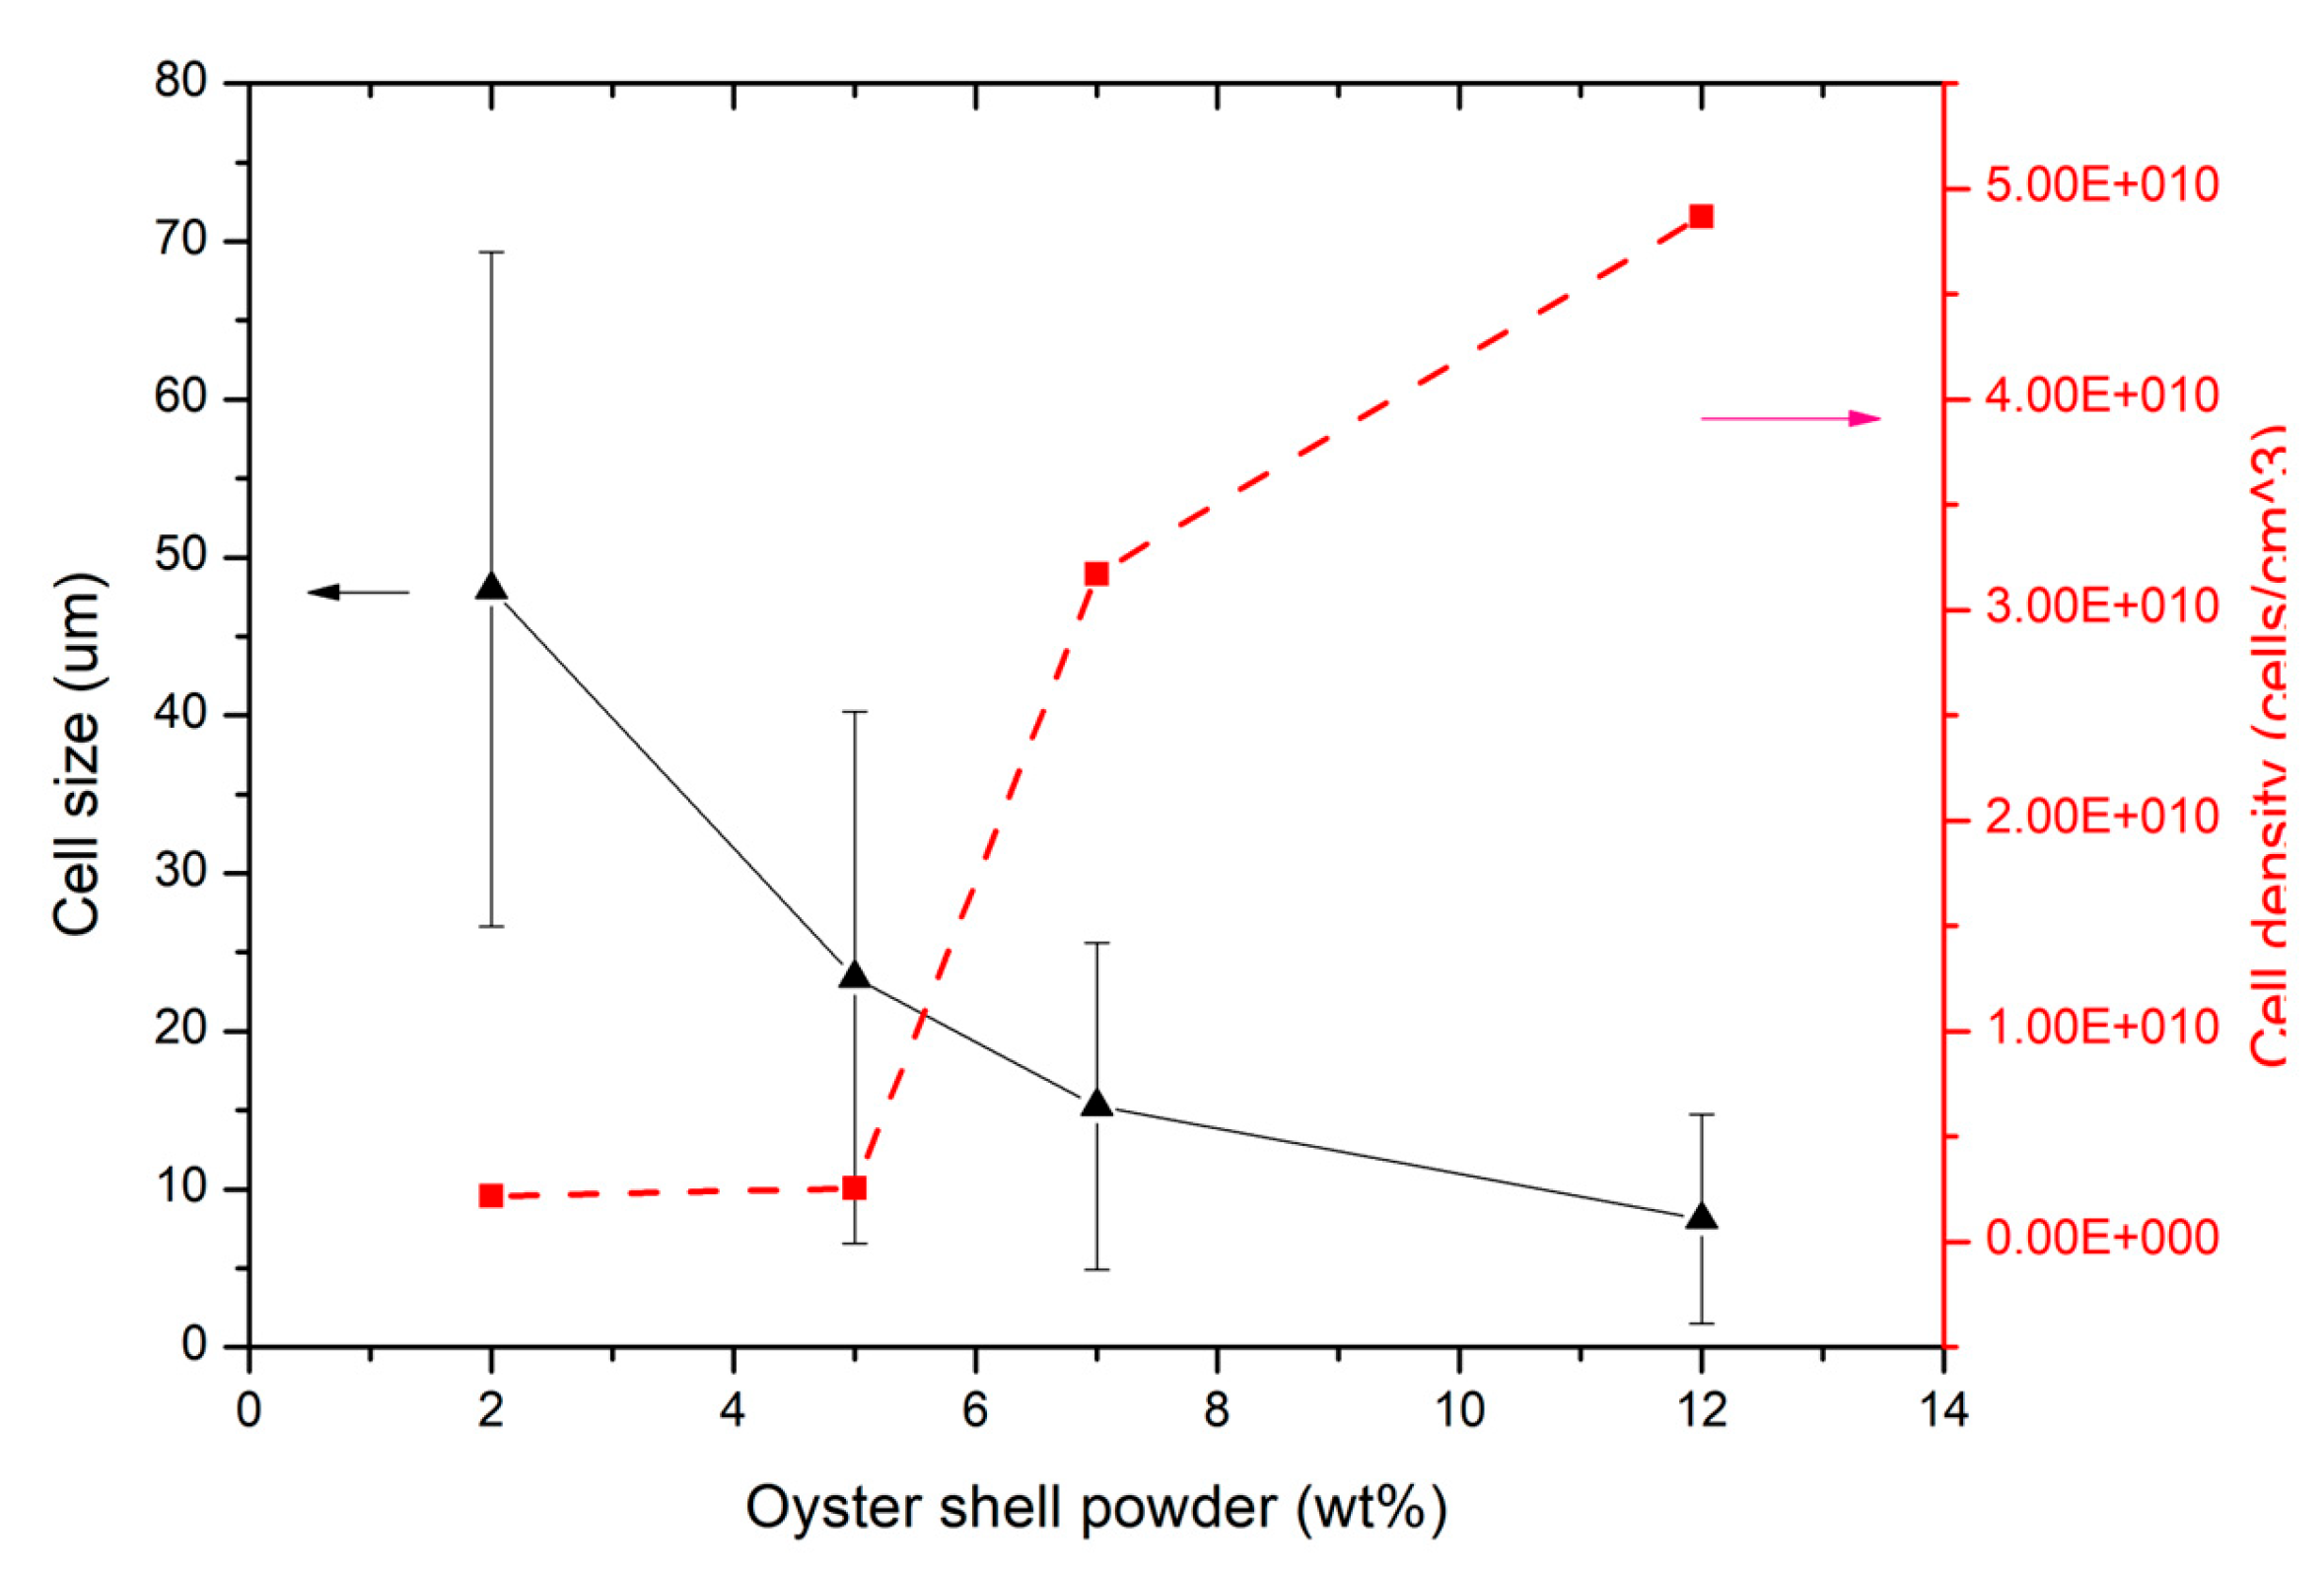
Figure 8.
Adsorption of Pb(II) ions on PP/OSP as a function of initial metal concentration (A) and effect of pH (B), function of dose (C), and effect of time measured in mg/g (D).
Figure 8.
Adsorption of Pb(II) ions on PP/OSP as a function of initial metal concentration (A) and effect of pH (B), function of dose (C), and effect of time measured in mg/g (D).
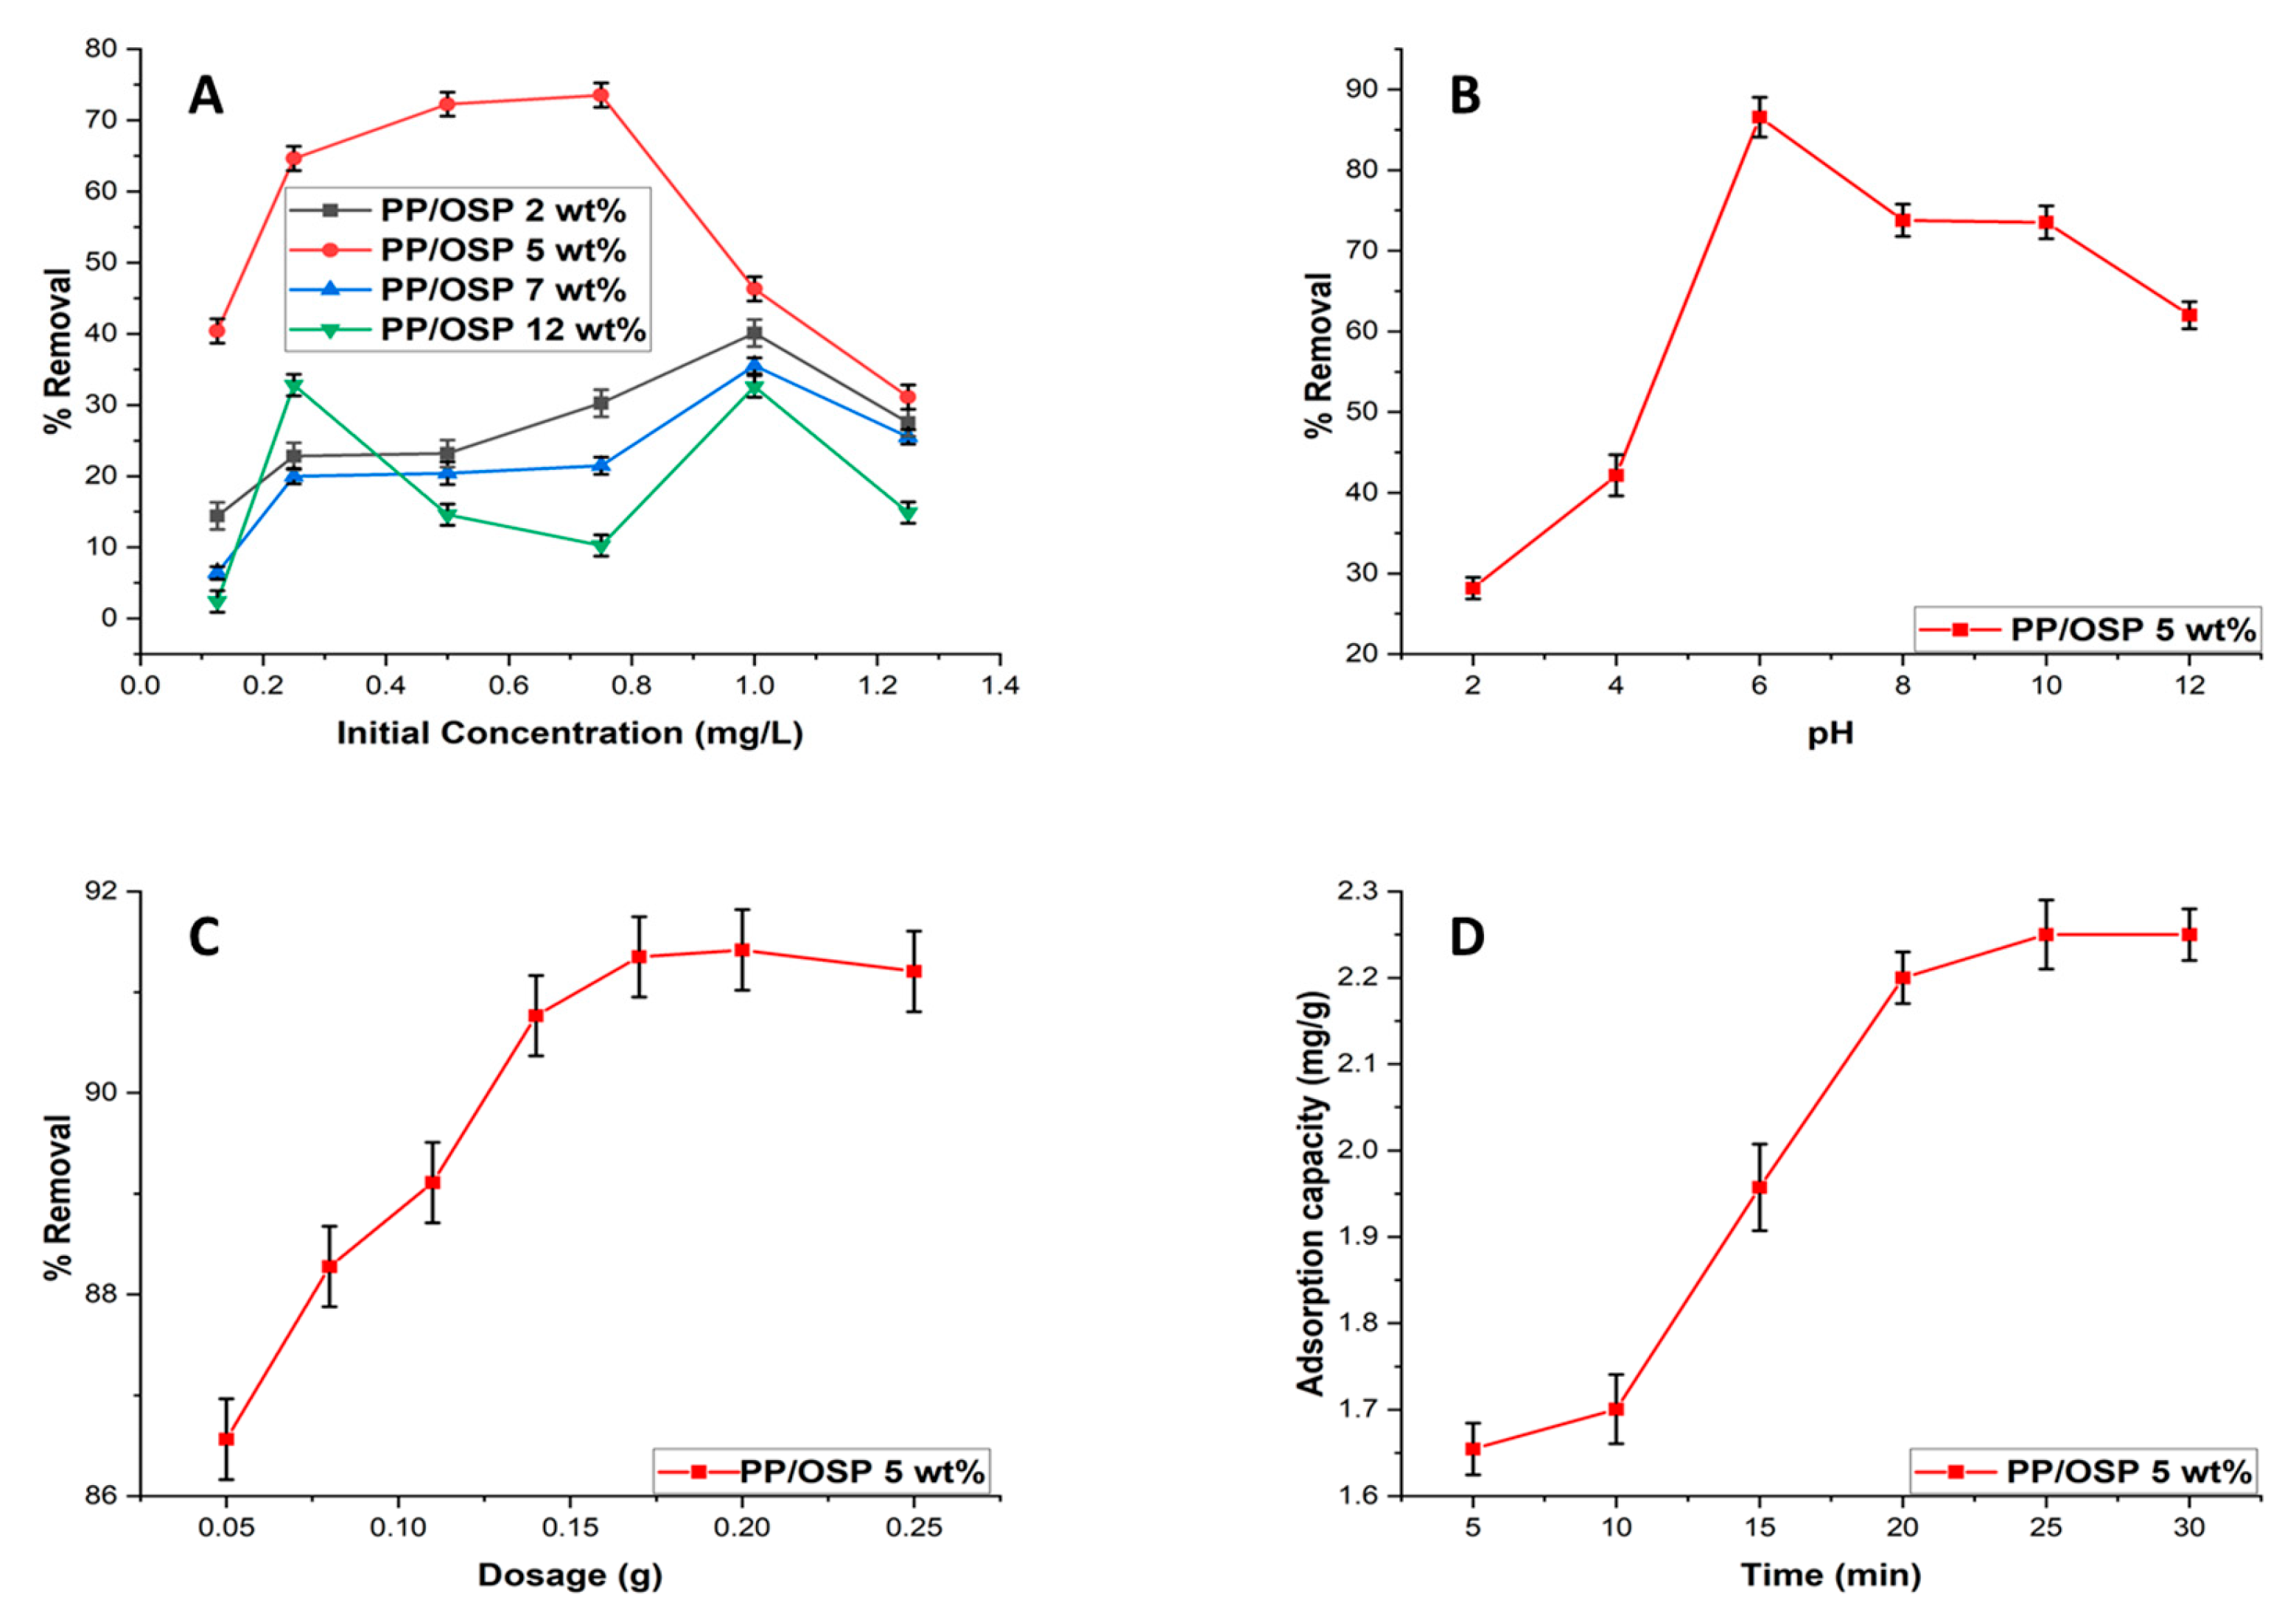
Figure 9.
Linearized fits for Langmuir (A), Freundlich (B), and Temkin isotherm (C), 0,8 ppm of Pb(II), 0.17 g PP/OSP 5 wt% composites.
Figure 9.
Linearized fits for Langmuir (A), Freundlich (B), and Temkin isotherm (C), 0,8 ppm of Pb(II), 0.17 g PP/OSP 5 wt% composites.
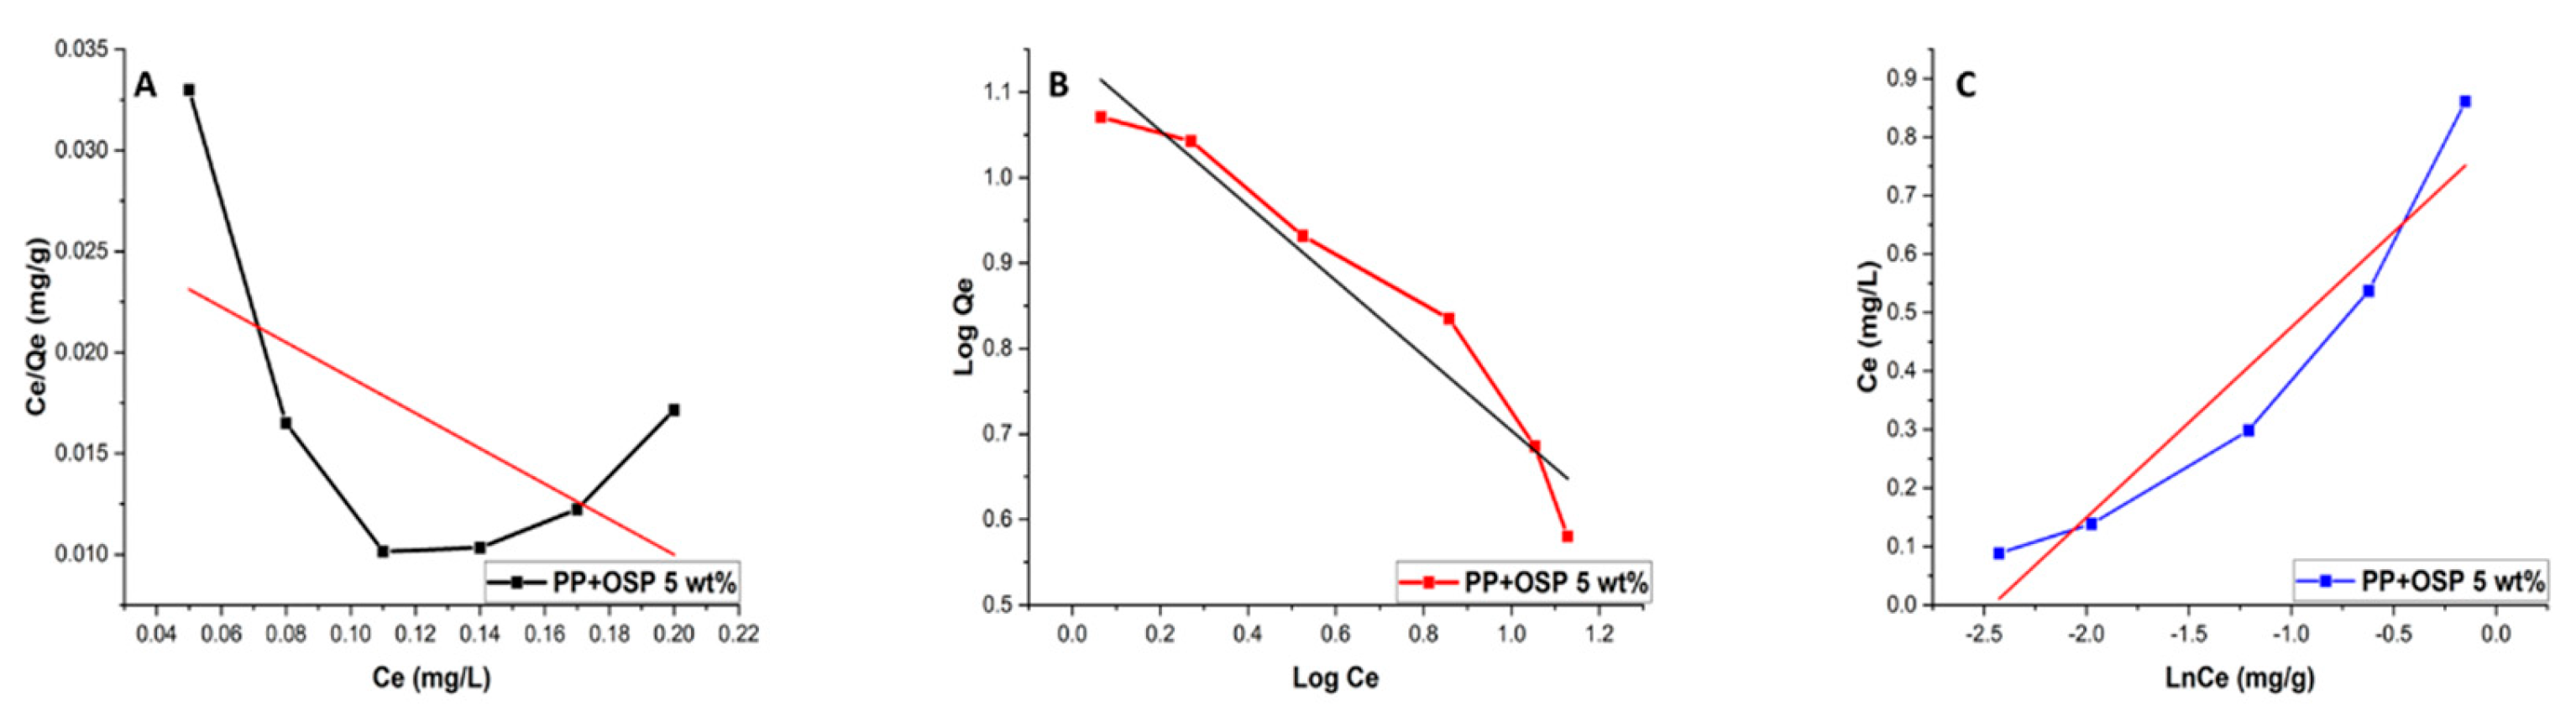
Figure 10.
Linearized fits for pseudo-first order (A) and pseudo-second order (B) of Pb(II) with 0.17g PP/OSP 5 wt% composite at 25 °C.
Figure 10.
Linearized fits for pseudo-first order (A) and pseudo-second order (B) of Pb(II) with 0.17g PP/OSP 5 wt% composite at 25 °C.
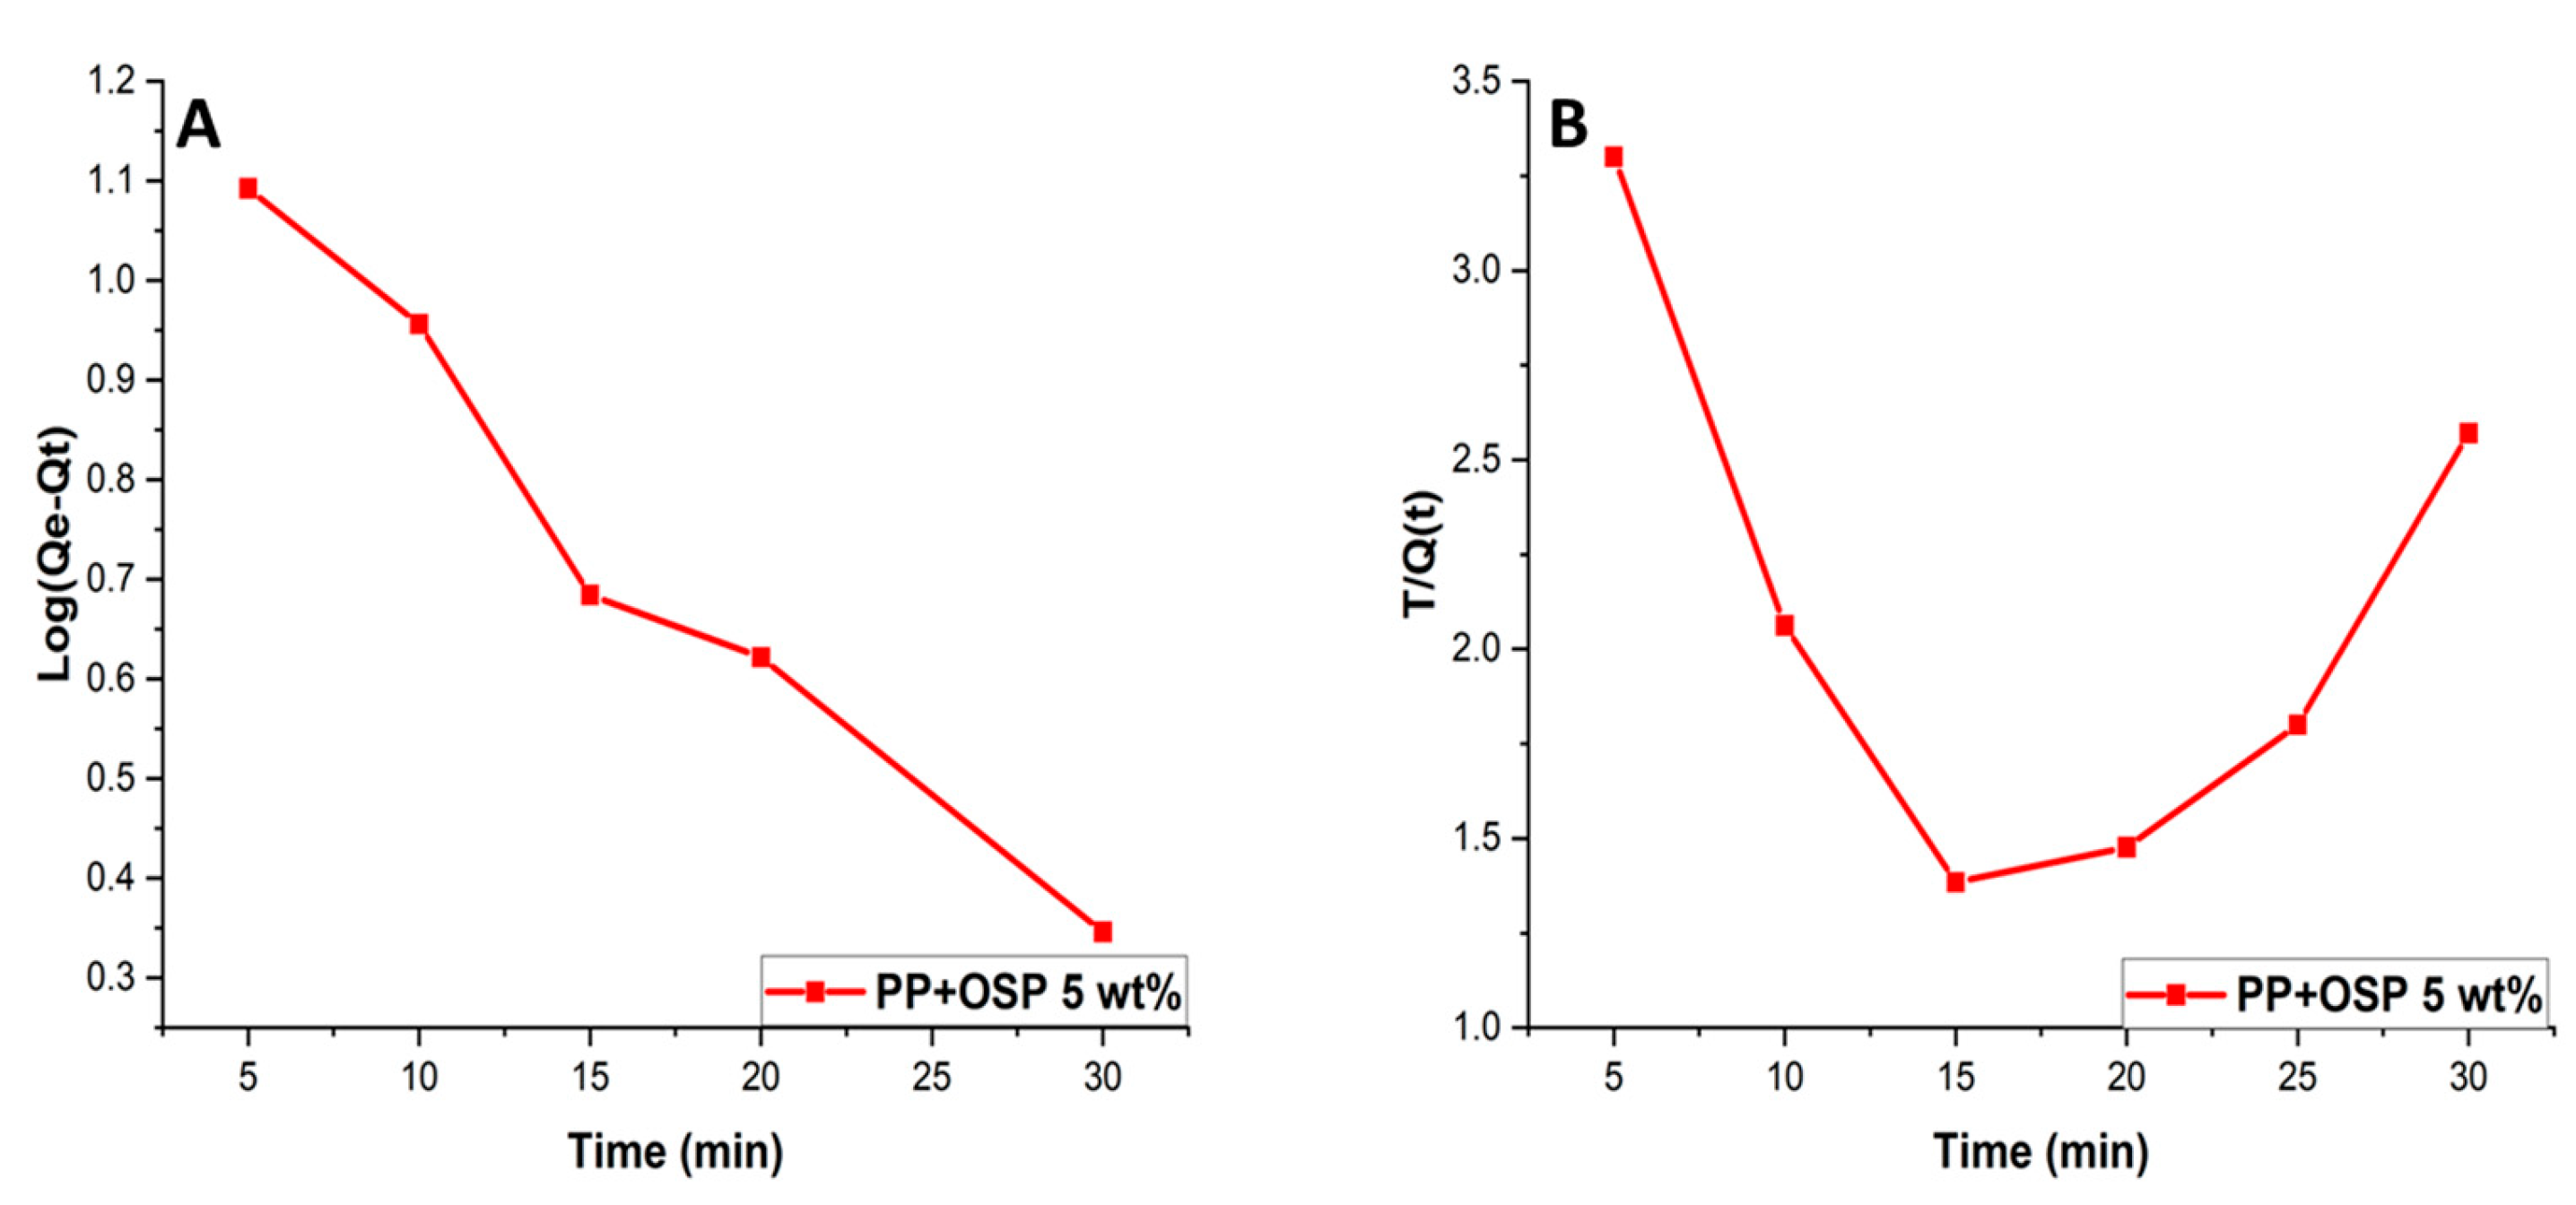
Figure 11.
Effect of Cycle Time on Pb(II) Desorption.
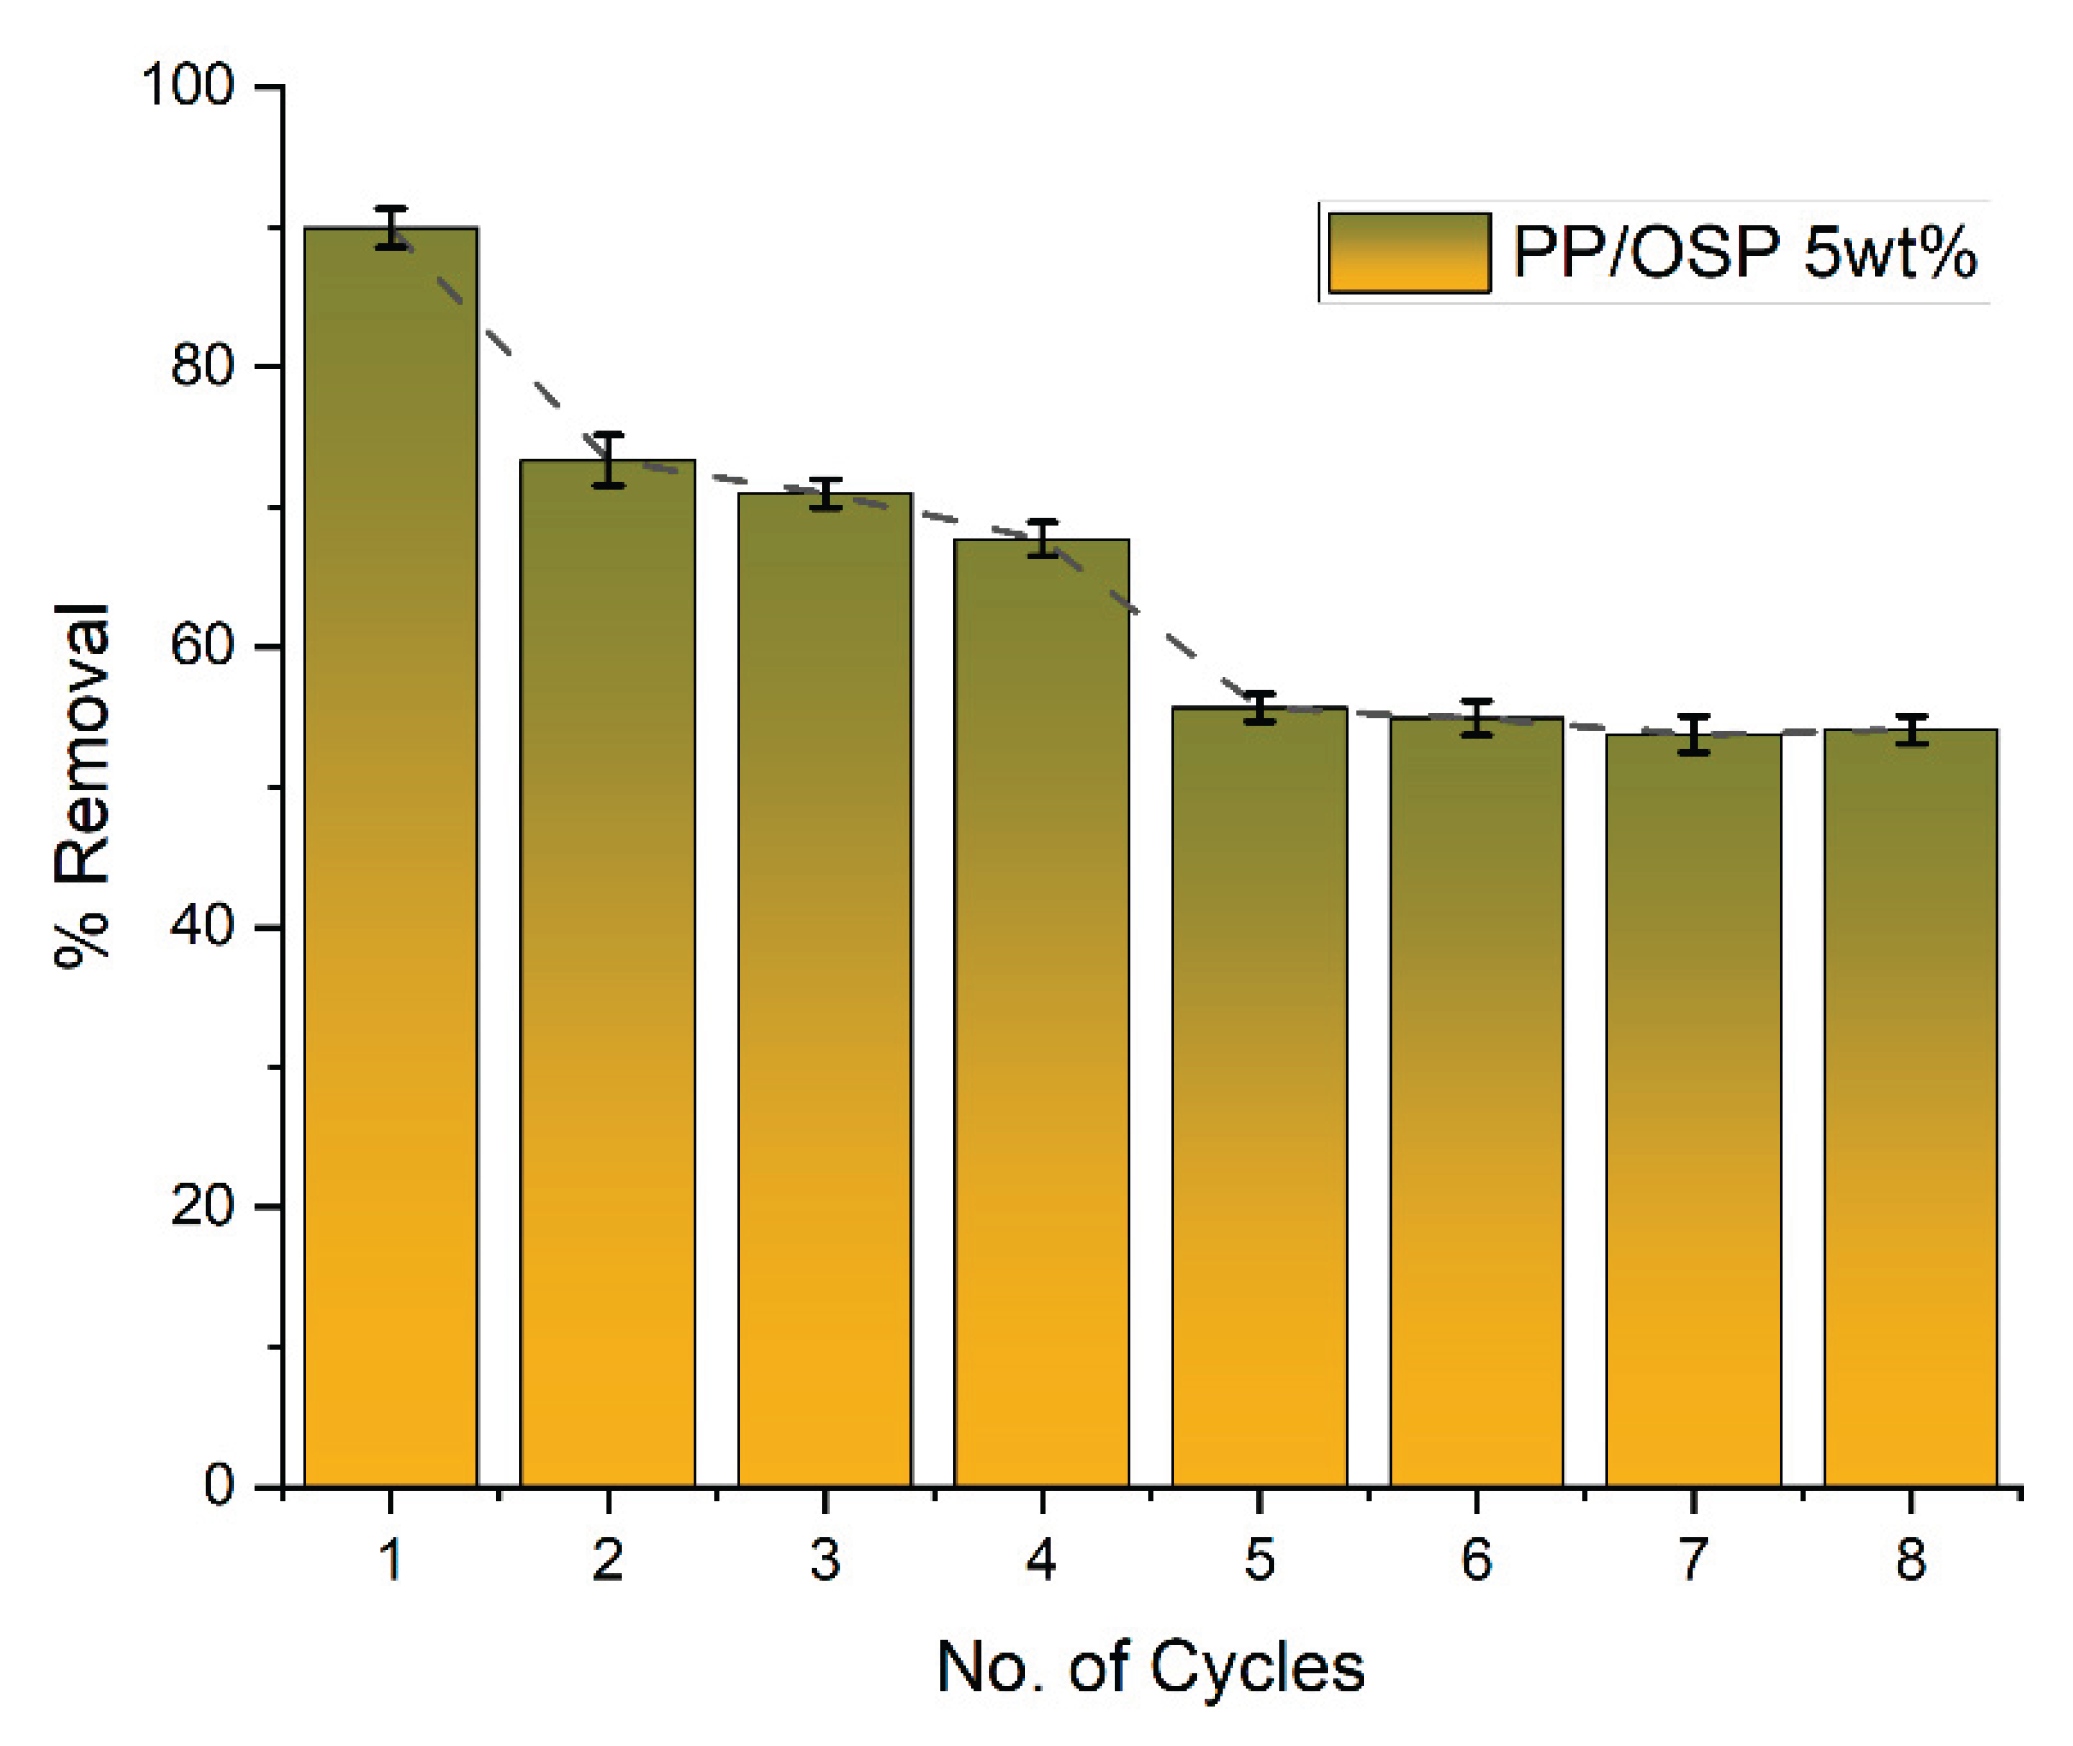
Table 1.
Mixing ratio of PP/OSP bio-composites.
| OSP (g) | PP (g) | Total weight (g) | |
|---|---|---|---|
| Neat PP | 0 | 600 | 600 |
| 2 wt% | 12 | 588 | 600 |
| 5 wt% | 30 | 570 | 600 |
| 7 wt% | 42 | 558 | 600 |
| 12 wt% | 72 | 528 | 600 |
Table 3.
Coefficients of sorption kinetics for Pb(II) removal on PP/OSP 5 wt% and their correlation coefficient (R2). (Experimental conditions: Co = 0.75 mg L−1; dosage = 0.17 g per 250 mL; mixing rate = 250 rpm; T = 25 ± 1 °C; pH = 6.0 ± 0.2 for Pb(II)).
Table 3.
Coefficients of sorption kinetics for Pb(II) removal on PP/OSP 5 wt% and their correlation coefficient (R2). (Experimental conditions: Co = 0.75 mg L−1; dosage = 0.17 g per 250 mL; mixing rate = 250 rpm; T = 25 ± 1 °C; pH = 6.0 ± 0.2 for Pb(II)).
| Adsorbent | Metal ion | Initial Conc. (mg/L) | Pseudo 1st order | Pseudo 2nd order | |||
|---|---|---|---|---|---|---|---|
| Calc. equil. Uptake qe (mg/g) | K1 (min-1) | R2 | K2 (min-1) | R2 | |||
| PP/OSP 5 wt% | Pb (II) | 0,75 mg/L | 13.89 mg/g | 5,7*10-5 | 0.971 | 1.19*10-4 | 0.102 |
Disclaimer/Publisher’s Note: The statements, opinions and data contained in all publications are solely those of the individual author(s) and contributor(s) and not of MDPI and/or the editor(s). MDPI and/or the editor(s) disclaim responsibility for any injury to people or property resulting from any ideas, methods, instructions or products referred to in the content. |
© 2025 by the authors. Licensee MDPI, Basel, Switzerland. This article is an open access article distributed under the terms and conditions of the Creative Commons Attribution (CC BY) license (http://creativecommons.org/licenses/by/4.0/).
Copyright: This open access article is published under a Creative Commons CC BY 4.0 license, which permit the free download, distribution, and reuse, provided that the author and preprint are cited in any reuse.


