
Submitted:
29 October 2025
Posted:
05 November 2025
You are already at the latest version
Abstract
This study merged archival data from three separate experiments to investigate the typology of individuals who benefit most and least from gratitude letter writing interventions (N = 487). First, k-means clustering of pre- to post-intervention changes in affect revealed three distinct groups: Buffered, Mixed Feelings, and Backfired. The Buffered cluster comprised individuals who, on average, experienced decreases in negative affect (e.g., less frustration) but no changes in positive emotions (e.g., joy). The Mixed Feelings cluster experienced increases in positive and self-conscious affect (e.g., indebtedness). The Backfired cluster experienced decreases in positive feelings and increases in negative affect. Next, differences in individual characteristics across clusters indicated that those in the Buffered cluster were relatively more neurotic, had higher baseline negative feelings, and had lower trait gratitude. Those in the Mixed Feelings cluster were comparatively more agreeable and seemed to put more effort into the activity. Finally, those in the Backfired cluster had relatively higher baseline positive feelings and were more open and conscientious. These findings contribute to understanding individual differences in the effectiveness of gratitude letter interventions and highlight opportunities to tailor such activities to promote personal growth.
Keywords:
gratitude
; gratitude letter
; well‐being
; cluster analysis
; person‐activity fit
; individual differences
; personal growth
Individual Differences in the Affective Experience of Writing a Gratitude Letter: Who Benefits Most?
Gratitude, considered both a trait and emotional state (Emmons & McCullough, 2003), involves recognizing and appreciating the positive aspects of one’s life while acknowledging that these benefits often stem from the intentional actions of others (Emmons & McCullough, 2003). As an emotion, gratitude broadens thoughts and actions that help build personal and interpersonal resources (Fredrickson, 2004), encouraging individuals to reflect on benefits received—freely given by others—and fostering a desire to reciprocate kindness. These feelings, in turn, reinforce social bonds and contribute to a cycle of positive emotions and connection. Over time, this cycle fosters personal growth and a sense of belonging, thereby enhancing well-being (Fredrickson, 2004; Kashdan et al., 2009).
Compared to less grateful individuals, those high in trait gratitude report greater subjective well-being (e.g., life satisfaction and positive affect) and stronger prosocial feelings (e.g., empathy), and lower levels of envy, depression, and anxiety (McCullough et al., 2002). Gratitude also enhances trust (Dunn & Schweitzer, 2005), social connections, and prosocial behaviors such as direct and upstream reciprocity (i.e., paying it forward), thus creating a continuous loop in which one values and feels valued by others (e.g., Bono & Sender, 2018; Fredrickson, 1998; Froh et al., 2010; Grant & Gino, 2010).
Gratitude can also be cultivated. Studies testing the effects of gratitude interventions have found improvements in feelings of well-being (e.g., Armenta et al., 2022; Dickens, 2017; Oriol et al., 2020), social connection, and social support (Grant & Gino, 2010; Walsh et al., 2022a). These interventions can also buffer against stress (Reckart et al., 2017), depression, envy, and materialism (Chaplin et al., 2018; Froh et al., 2011). For example, a longitudinal study using structural equation modeling to assess directionality between gratitude, social support, stress, and depression found that, in the best direct model, practicing gratitude led to increases in feelings of social support and decreases in feelings of stress and depression over a 3-month period, controlling for personality traits (Wood et al., 2008a, Study 2).
Gratitude expressions can vary by target (social vs. nonsocial), format (lists vs. letters), and medium (e.g., email, social media posts, and texts). The present study focuses on interventions that involve writing gratitude letters. This intervention was first published by Seligman and his colleagues in 2005 as a “gratitude visit,” in which participants wrote and delivered a letter thanking someone who had been especially kind to them. That study reported increases in well-being for the letter writers (λ2 = .49 at post-test). Since then, many studies have replicated and extended these findings, distinguishing between the effects of writing a gratitude letter (e.g., Armenta et al., 2022; Lyubomirsky et al., 2011; Regan et al., 2022) and delivering the letter to the intended recipient (Kumar & Epley, 2018; Walsh et al., 2022a; Walsh et al., 2022b).
A recent systematic review of the effectiveness of happiness strategies found that writing gratitude letters can increase positive affect based on two preregistered and sufficiently powered studies (Folk & Dunn, 2023). However, the same review also highlighted other sufficiently powered studies with null or mixed results, suggesting that gratitude letter interventions may not be equally beneficial for everyone or in all contexts. For instance, some studies have found that expressing or recalling gratitude can lead to simultaneous pleasant and unpleasant feelings, including elevation (e.g., moved, uplifted), connectedness, indebtedness, and guilt (Layous et al., 2017). Other studies have also reported increases in negative self-conscious emotions (Tangney, 2012), such as guilt, shame, embarrassment, and indebtedness (Armenta et al., 2022; Regan et al., 2022; Walsh et al., 2022b).
This variability in outcomes raises an important question: Are there individual characteristics or baseline affective states or traits that help explain who is more likely to experience affective improvements, declines, mixed feelings, or no change after writing a gratitude letter?
Writing Gratitude Letters: The Role of Person-Activity Fit
Like prescription medication, the effects of writing a gratitude letter may vary depending on individual and contextual factors. Drawing from theory and empirical research, Lyubomirsky and Layous (2013) developed the Positive Activity Model (see Figure 1), which posits that the success of positive activity interventions (PAIs) depends on both activity and person features. Activity features include aspects of the PAI itself, such as the type of gratitude intervention or how frequently the activity is performed. Person features are concerned with the background, preferences, and performance of the individual practicing the PAI, such as their demographic characteristics, personality, activity effort, and baseline affective state. A core tenet of the model is that PAIs are most effective when activity features are matched to person characteristics (see Lyubomirsky & Layous, 2013 for a review).
The present study focused on the person-activity fit of writing a gratitude letter, examining individual changes in affect after the intervention, followed by an analysis of person features, given the limited research on individual differences in gratitude intervention outcomes (Folk & Dunn, 2023).
Past Research on the Effects of Gratitude PAIs Based on Person Features
Demographics
Gratitude is associated with greater subjective well-being across age groups (Chopik et al., 2019), but findings regarding age and gratitude are mixed. Some studies report lower trait gratitude among younger and middle-aged adults compared to older adults (Chopik et al., 2019; Kern et al., 2014), while others find no associations (Kashdan et al., 2009; Wood et al., 2008b). Further, most gratitude intervention studies use undergraduate samples, limiting generalizability across age or generation (Chopik et al., 2019).
Women generally report higher gratitude than men, potentially due to gender role expectations and stereotypes, such as perceptions of male weakness and threatened masculinity (Froh & Bono, 2008; Froh et al., 2009b). For example, a set of studies found that young men viewed expressing gratitude as relatively complex and conflicting, whereas young women found it relatively interesting and exciting (Kashdan et al., 2009). In a follow-up study among older adults (M = 69.52), women reported feeling less burdened, less obligated, and more grateful after receiving a gift compared to men.
Research also suggests that individuals from collectivist cultures may benefit less from gratitude interventions than those from individualistic cultures (Shin et al., 2020; Shin & Lyubomirsky, 2017). In one study, U.S. and South Korean participants experienced similar well-being gains after performing acts of kindness, but Americans benefited more from gratitude interventions (Layous et al., 2013), possibly due to greater guilt and indebtedness felt by South Koreans. In a U.S.-based study, Latinx and European Americans rated gratitude as more desirable and appropriate, and reported more frequent and intense gratitude expressions than East Asian Americans (Corona et al., 2020).
Most relationship status studies have focused on romantic partners (e.g., Algoe et al., 2010; Kubacka et al., 2011). To our knowledge, no studies have reported differences in feelings of gratitude based on relationship status (e.g., single vs. in a relationship).
Personality
Findings on personality and gratitude are mixed. Some studies have found no correlations (Breen et al., 2010), while others have identified positive associations with agreeableness, openness, conscientiousness, and extraversion, and negative associations with neuroticism (McCullough et al., 2002; McCullough et al., 2004; Reckart et al., 2017; Szcześniak et al., 2020).
Activity Effort
Activity effort appears to be a key predictor of PAI success (Wang et al., 2017). For example, in an 8-month longitudinal study, participants who reported exerting more effort while expressing gratitude or envisioning their best future selves experienced greater gains in life satisfaction and positive affect, relative to a control group (Lyubomirsky et al., 2011).
Trait Gratitude
Some studies suggest that individuals lower in trait gratitude tend to benefit more from gratitude interventions, possibly due to a floor effect (e.g., Froh et al., 2008; Harbaugh & Vasey, 2014; McCullough et al., 2004; Rash et al., 2011), while those higher in trait gratitude tend to benefit less potentially due to a ceiling effect (e.g., Harbaugh & Vasey, 2014). However, other studies have found that those high in trait gratitude may also experience greater benefits (Oltean et al., 2022; Toepfer et al., 2012).
Baseline Affective States
Some evidence indicates that individuals with relatively low pre-intervention positive affect (i.e., they are less happy to begin with) show greater improvements in subjective well-being following gratitude interventions, compared to those with relatively higher levels of positive affect (Froh et al., 2009a). Like with trait gratitude, these findings may be related to floor and ceiling effects, respectively (Emmons & Mishra, 2011). However, other studies have not found such moderating effects (Rash et al., 2011).
The Present Study
Building on this review, the present pre-registered (https://aspredicted.org/B8D_QGJ) study addressed the following research questions (RQ):
RQ1 Activity Fit: Do distinct clusters emerge based on changes in affect after writing a gratitude letter?
RQ2 Person Features: Are there individual differences (e.g., demographics, personality, pre-intervention affect) across these clusters?
Activity Fit Predictions: Do Distinct Affect Clusters Emerge?
Based on prior literature suggesting that gratitude interventions do not uniformly improve well-being, we expected two to four affective clusters to emerge. A two-cluster solution would separate those who benefited (i.e., increased positive affect and decreased negative affect) from those who did not. Three- or four-cluster solutions might include groups showing no change or mixed emotions (i.e., increases in both positive and negative affect). These cluster labels (“benefit,” “do not benefit,” “no change,” “mixed emotions”) were used as placeholders and updated following data inspection.
Person Features Predictions: Who Benefits Most from Gratitude Interventions?
We predicted that the benefit cluster would include a higher proportion of women, European Americans, and Latinx individuals. If clusters reflecting no benefit or mixed emotions emerged, we expected greater representation of Asian-identifying individuals. Age, generation, and relationship status were treated as exploratory.
Given that expressing gratitude facilitates introspection and personal growth (Bono & Sender, 2018; Kashdan et al., 2009), we predicted that individuals lower in trait gratitude and baseline positive affect, and higher in baseline negative affect and neuroticism, would be more likely to belong to the benefit cluster. Other personality traits were explored without specific hypotheses.
Lastly, we predicted that individuals in the benefit cluster would report higher activity effort, given prior research on the importance of effort in PAI efficacy (Lyubomirsky & Layous, 2013).
Methods
Archival data from three gratitude studies conducted by the Positive Activities and Well-Being Lab at the University of California, Riverside, were merged and used for the present study (N = 487).
- Regan, Walsh, Lyubomirsky (2022; n = 157), henceforth the Ways of Expressing Gratitude study (https://doi.org/10.1007/s42761-022-00160-3).
- Walsh, Regan, Twenge, Lyubomirsky (2022; n = 231), henceforth the Optimal Way to Give Thanks study (https://doi.org/10.1007/s42761-022-00150-5).
- Walsh, Regan, Lyubomirsky (2022; n = 99), henceforth the Thanking Parents study (https://doi.org/10.1080/17439760.2021.1991449).
The Ways of Expressing Gratitude study was conducted in 2019 with Australian adults recruited using the Pureprofile sample panel. The other two studies—Optimal Way to Give Thanks (conducted in 2020) and Thanking Parents (conducted in 2016) —included an ethnically diverse sample of undergraduate students recruited from a large public university in California. As the name suggests, Thanking Parents specifically instructed participants to write a gratitude letter to one of their parents, whereas the other two studies allowed participants to write to anyone they felt grateful towards. Ethics approval was obtained from the Institutional Review Board of the University of California, Riverside. Additional information about these studies can be found in the provided DOI links.
Data Preparation
To minimize confounding variables in the cluster analysis, we reviewed and compared the experimental conditions and measures across the three studies prior to merging them. We selected an experimental condition that was consistent across studies: participants wrote a gratitude letter but did not share it. The Ways of Expressing Gratitude and the Optimal Way to Give Thanks studies included multi-day interventions. For consistency, we only used post-intervention data from the first gratitude letter to control for the effects of writing multiple letters. We also selected measures that were identical or very similar in wording across studies. After identifying common conditions and measures, we standardized variable names and item coding to ensure uniformity before merging (see S1-S9 in Supplemental Materials for an overview of the original studies and a codebook).
Participants
The mean age of participants in the merged dataset was 28 (SD = 15.7)—67% were Gen Z (born between 1995 and 2007), 12% were Millennials (born between 1980 and 1994), 9% were Gen X (born between 1965 and 1979), 10% were Baby Boomers (born between 1946 and 1964), and 2% were from the Silent Generation (born between 1925 and 1945). Over half of participants identified as female (62%). There was also a mix of relationship status, with 38% single, not in a relationship, 20% single (not defined), 19% in a relationship, 15% married, 5% divorced/separated, 3% cohabiting, and 1% widowed. The sample was ethnically diverse: 34% identified as White, 26% as Asian, 24% as Hispanic, 6% as Black, and 10% as Other. Notably, 93% of non-White participants were drawn from the undergraduate samples. A full breakdown of sample characteristics is provided in Table A1 of the Appendix.
Activity Fit Measures
To examine differences in the affective experience of writing a gratitude letter, we used 6 items from Schnall and colleague’s Elevation Scale (2010) and 14 items from an adapted version of the Affect Adjective Scale (AAS; Diener & Emmons, 1985). Four composite scores were created: Elevation, Positive Affect (PA), Negative Affect (NA), and Self-Conscious Affect (SCA). Change scores were calculated by subtracting pre-intervention (T0) ratings from post-intervention ratings (T1).
Elevation was measured using items such as “A warm feeling in your chest,” “Moved,” and “Uplifted,” rated on a 7-point scale ranging from 1 (do not feel at all) to 7 (feel very strongly). We computed scale reliabilities using Cronbach’s alpha (T0 α = .85; T1 α = .89).
The AAS also used a 7-point scale ranging from 1 (not at all) to 7 (extremely). PA included “Happy,” “Pleased,” “Joyful,” and “Enjoyment” (T0 α = .92; T1 α = .92). NA included “Unhappy,” “Worried/Anxious,” “Angry/Hostile,” “Frustrated,” and “Depressed/Blue” (T0 α = .87; T1 α = .86). SCA included “Indebted,” “Guilty,” “Embarrassed,” “Uncomfortable,” and “Ashamed” (T0 α = .80; T1 α = .81).
Why separate negative affect from self-conscious affect? As previously mentioned, research suggests that writing a gratitude letter may elicit both positive and self-conscious emotions (e.g., guilt, indebtedness), resulting in mixed emotional responses (Layous et al., 2017; Walsh et al., 2022c; Watkins et al., 2006). For example, a series of studies found that gratitude, but not other PAIs or control tasks, produced both pleasant and unpleasant states, including feeling moved, uplifted, and indebted (Layous et al., 2017). Another study replicated these findings, with participants reporting greater elevation, indebtedness, and guilt after writing a gratitude letter than after completing a neutral task (Walsh et al., 2022c). Therefore, a cluster may emerge in which SCA, but not NA, increases after writing a letter.
Person Features Measures
Following the first part of the analyses, we examined whether cluster membership varied by person features, including demographics (mean age, generation, gender, ethnicity, and relationship status), personality, trait gratitude, baseline affect, and activity effort.
Age was entered via an open-text numerical field. Generation was estimated by subtracting age from the year of the study’s pre-test (or the prior year, if the pre-test occurred in the first quarter of the year). Gender options included: “Male,” “Female,” and “Other.” Relationship status categories included: “Single, not in a relationship,” “In a relationship,” “Cohabiting/living together,” “Single (not defined),” “Married,” “Divorced/Separated,” and “Widowed.” Ethnicity items included: “Asian,” “Black,” “Hispanic,” “White,” and “Other.”
Personality was measured using the 15-item Big Five Inventory-2 Extra Short Form (BFI-2-XS; Soto & John, 2017) administered in the Ways of Expressing Gratitude and the Optimal Way to Give Thanks studies (N = 388). Each personality trait was assessed with three items (positively and negatively worded), rated using a 5-point Likert scale from 1 (strongly disagree) to 5 (strongly agree). Trait composite scores were calculated for extraversion (α = .67), agreeableness (α = .54), conscientiousness (α = .58), neuroticism (α = .81), and openness to experience (α = .44). As noted by Soto and John (2017), relatively low internal consistencies are typical for the BFI-2-XS, sometimes falling below conventional thresholds, but this is expected given that the scale’s design prioritizes content validity over internal consistency (p.70).
Dispositional gratitude was captured using a composite score of two items from the Trait Gratitude Questionnaire (McCullough et al., 2002): “I am grateful to a wide variety of people currently in my life” and “I find myself more able to appreciate the people, events, and situations that have been part of my life history, “rated from 1 (strongly disagree) to 7 (strongly agree; α = .76). Baseline affect was assessed using the same T0 affect and elevation scales and composite scores (i.e., elevation, PA, NA, SCA) used in the cluster analyses.
Activity effort was measured using one item with a 7-point scale. Of note, question wording was less consistent across studies compared to the other measures. The Ways of expressing gratitude study asked, “During this time, how much effort did you put into your daily writing activities?” with three points in the scale labeled 1 (Not a lot of effort), 4 (A moderate amount of effort), and 7 (A great deal of effort). The Optimal Way to Give Thanks study asked, “How much effort did you put into writing the letter of gratitude?” with the same scale labels used in the Ways of Expressing Gratitude study. The Thanking Parents study asked, “Please select the point on the scale for each statement to indicate the extent to which you agree or disagree with the statement: I put forth my best effort in responding to this survey.” All points of the scale were labeled and ranged from 1 (Strongly agree) to 7 (Strongly disagree). Because this item was administered post-intervention across studies, it was presumed to reflect effort during the gratitude letter activity.
Coding the Gratitude Letters
Next, we conducted an exploratory qualitative analysis of the content of the gratitude letters. Only participants from the Ways of Expressing Gratitude and Thanking Parents studies uploaded letters (N = 236) and thus were included in these analyses. Four coders (three human, one AI tool—ChatGPT) were blind to study aims. Human coders were trained and first coded 20% of the letters. The first author then analyzed coding reliability, met with the human coders to discuss inconsistencies, and revised the codebook accordingly. Final coding indicated strong consistency. Intraclass correlation coefficients (ICCs) for average measures ranged from .85 to .95 (Koo & Li, 2016). Average ratings across coders were used in analyses.
Seven themes were coded on 5-point scales, informed by prior literature on gratitude letter quality (Hodge et al., 2023; Lyubomirsky & Layous, 2013; Lyubomirsky et al., 2005): (1) writer effort, (2) level of detail, (3) heartfelt sincerity, (4) reflection depth, (5) genuineness, (6) superficiality, and (7) benefactor effort (based on the reason the writer expressed gratitude). The number of words in each letter was also recorded.
Writer effort was coded based on the length and level of detail noted in the letter, with a scale ranging from 1 (No effort at all) to 5 (A great deal of effort). ICC(3, k) = .95, CI [.94, .96], F(235, 705) = 20.45, p < .001.
Level of detail reflected the level of specificity provided when explaining the reason(s) for being grateful (e.g., specific context, anecdotes, examples), using a scale ranging from 1 (Not at all detailed) to 5 (Extremely detailed). ICC(3, k) = .91, CI [.89, .93], F(235, 705) = 11.18, p < .001.
Heartfelt sincerity was coded based on the writer’s use of language expressing what it has meant or how it has felt to receive support from the benefactor, using a scale ranging from 1 (Not heartfelt and sincere at all) to 5 (Extremely heartfelt and sincere). ICC(3,k) = .90, CI [.88, .92], F(235, 705) = 10.14, p < .001.
Reflection depth was based on the degree to which the writer seemed to have deeply considered the actions of the benefactor, with a scale ranging from 1 (No depth of reflection at all) to 5 (A great deal of depth of reflection). ICC(3, k) = .93, CI [.91, .94], F(235, 705) = 14.23, p < .001.
Genuineness was coded based on perceptions that the letter truly expressed genuine gratitude, with a scale ranging from 1 (Not at all genuine) to 5 (Extremely genuine). ICC(3, k) = .89, CI [.87, .91], F(235, 705) = 9.47, p < .001.
Superficiality rated perceptions about the letter’s substance (e.g., the degree to which the letter read like a greeting card vs. a personalized letter), with a scale ranging from 1 (Not at all superficial) to 5 (Extremely superficial). ICC(3, k) = .85, CI [.81, .88], F(235, 705) = 6.56, p < .001.
Benefactor effort reflected whether the benefit conferred seemed like a heavy lift (e.g., took a considerable amount of time), based on the reason the letter writer was grateful, using a scale ranging from 1 (No effort at all/effort not specified) to 5 (A great deal of effort). The benefit conferred could be tangible (e.g., helping pay for college) or intangible (e.g., consistently providing support through a divorce or illness). ICC(3, k) = .86, CI [.82, .88], F(235, 705) = 6.92, p < .001.
Data Exclusion Criteria
The original study exclusion criteria were followed with two exceptions. First, although the Optimal Way to Give Thanks study excluded one participant for reporting minimal effort, we retained this case due to our focus on effort. Second, participants missing pre- or post-intervention data for the cluster analysis variables (PA, NA, SCA, elevation) were excluded (n = 12), as change scores could not be computed.
Analytic Approach
Analyses were conducted using R, except for column proportion comparisons of categorical variables, which were computed using SPSS.
Prior to conducting the cluster analysis, we z-scored the change scores for PA, elevation, NA, and SCA to account for differences in ranges and standard deviations, thereby minimizing the risk of misclassification (Zakharov, 2016). We also examined normality and intercorrelations of the z-scores to reduce concerns about multicollinearity and to ensure that none of the original datasets would become its own cluster. We then proceeded to test our first research question—do distinct clusters emerge based on changes in affect after writing a gratitude letter?—using K-means clustering with the Euclidean distance metric and centroid averaging (Jain, 2010; Zakharov, 2016). To identify the optimal cluster solution, we examined compactness (i.e., the homogeneity within each cluster), separability (i.e., the distinctiveness of each cluster), misclassification risk, and interpretability (Vargha et al., 2016).
Compactness was assessed with a scree plot of within-cluster sum of squares (WSS). Lower WSS indicated tighter clustering (i.e., lower variability within a cluster; Vargha et al., 2016). Separability was measured using average silhouette width with values that ranged from 0 (low separability) to 1 (high separability; Rousseeuw, 1987). Misclassification risk was inspected using silhouette values for individual respondents. Numbers below zero indicated the observation may belong to another cluster. Interpretability was assessed via visualization of the clusters using principal component analyses (PCA; Pison et al., 1999) and a review of cluster characteristics based on the means of z-scored change variables. A positive z-score indicated above-average affective gains; zero indicated no change; and negative indicated a decline relative to the average change observed in the total sample.
After selecting a final cluster solution, we tested our second research question by examining whether clusters differed by person features.
One-way between-subjects ANOVAs were conducted to examine differences in mean age, baseline affect, trait gratitude, personality, activity effort, and coded features of the gratitude letters. Tukey’s Honestly Significant Difference (HSD) tests were used for post hoc comparisons (Howell, 2013). Effect sizes for the ANOVAs were estimated using eta squared (η2), while Cohen’s d was used for pairwise comparisons. Interpretations of effect size magnitude followed conventional benchmarks, with η2 values of .01, .06, and .14 considered small, medium, and large, respectively (Cohen, 1988), and Cohen’s d values of .20, .50, and .80 similarly interpreted as small, medium, and large (Cohen, 1988).
Associations between cluster membership and categorical demographic variables were assessed using Pearson’s chi-square goodness of fit tests, with Benjamini–Hochberg corrections applied to adjust for multiple comparisons (Benjamini & Hochberg, 1995; Howell, 2013). Effect sizes were estimated using adjusted Cramér’s V, with values of .10, .30, and .50 interpreted as small, medium, and large effects, respectively (Cohen, 1988). To reduce the risk of invalid inferences due to sparse cell sizes, categories with low counts were excluded from these analyses. This included individuals from the Silent Generation (n = 8), those who selected “other” as their gender identity (n = 2), and individuals who identified as “cohabiting” (n = 13) or “widowed” (n = 5) under relationship status.
Across all analyses, an alpha level of .05 was used to determine statistical significance. However, significance testing was not interpreted in isolation. In line with best practices in psychological science, results were evaluated holistically, taking into account statistical significance, effect size magnitude, and the broader pattern and theoretical coherence of findings. This approach was adopted to prioritize precision in interpretation and to avoid overreliance on dichotomous thresholds alone.
Results
Do Distinct Affect Clusters Emerge After Writing a Gratitude Letter?
Normality was confirmed for the z-scored pre- to post-intervention changes in positive affect (PA), elevation, negative affect (NA), and self-conscious affect (SCA). Correlation analyses revealed no strong associations among the affective change variables, both overall and within each study, thereby reducing multicollinearity concerns. Additionally, the pattern of correlations was consistent across the three datasets, suggesting that no single dataset was driving cluster formation (see Table A2 in the Appendix).
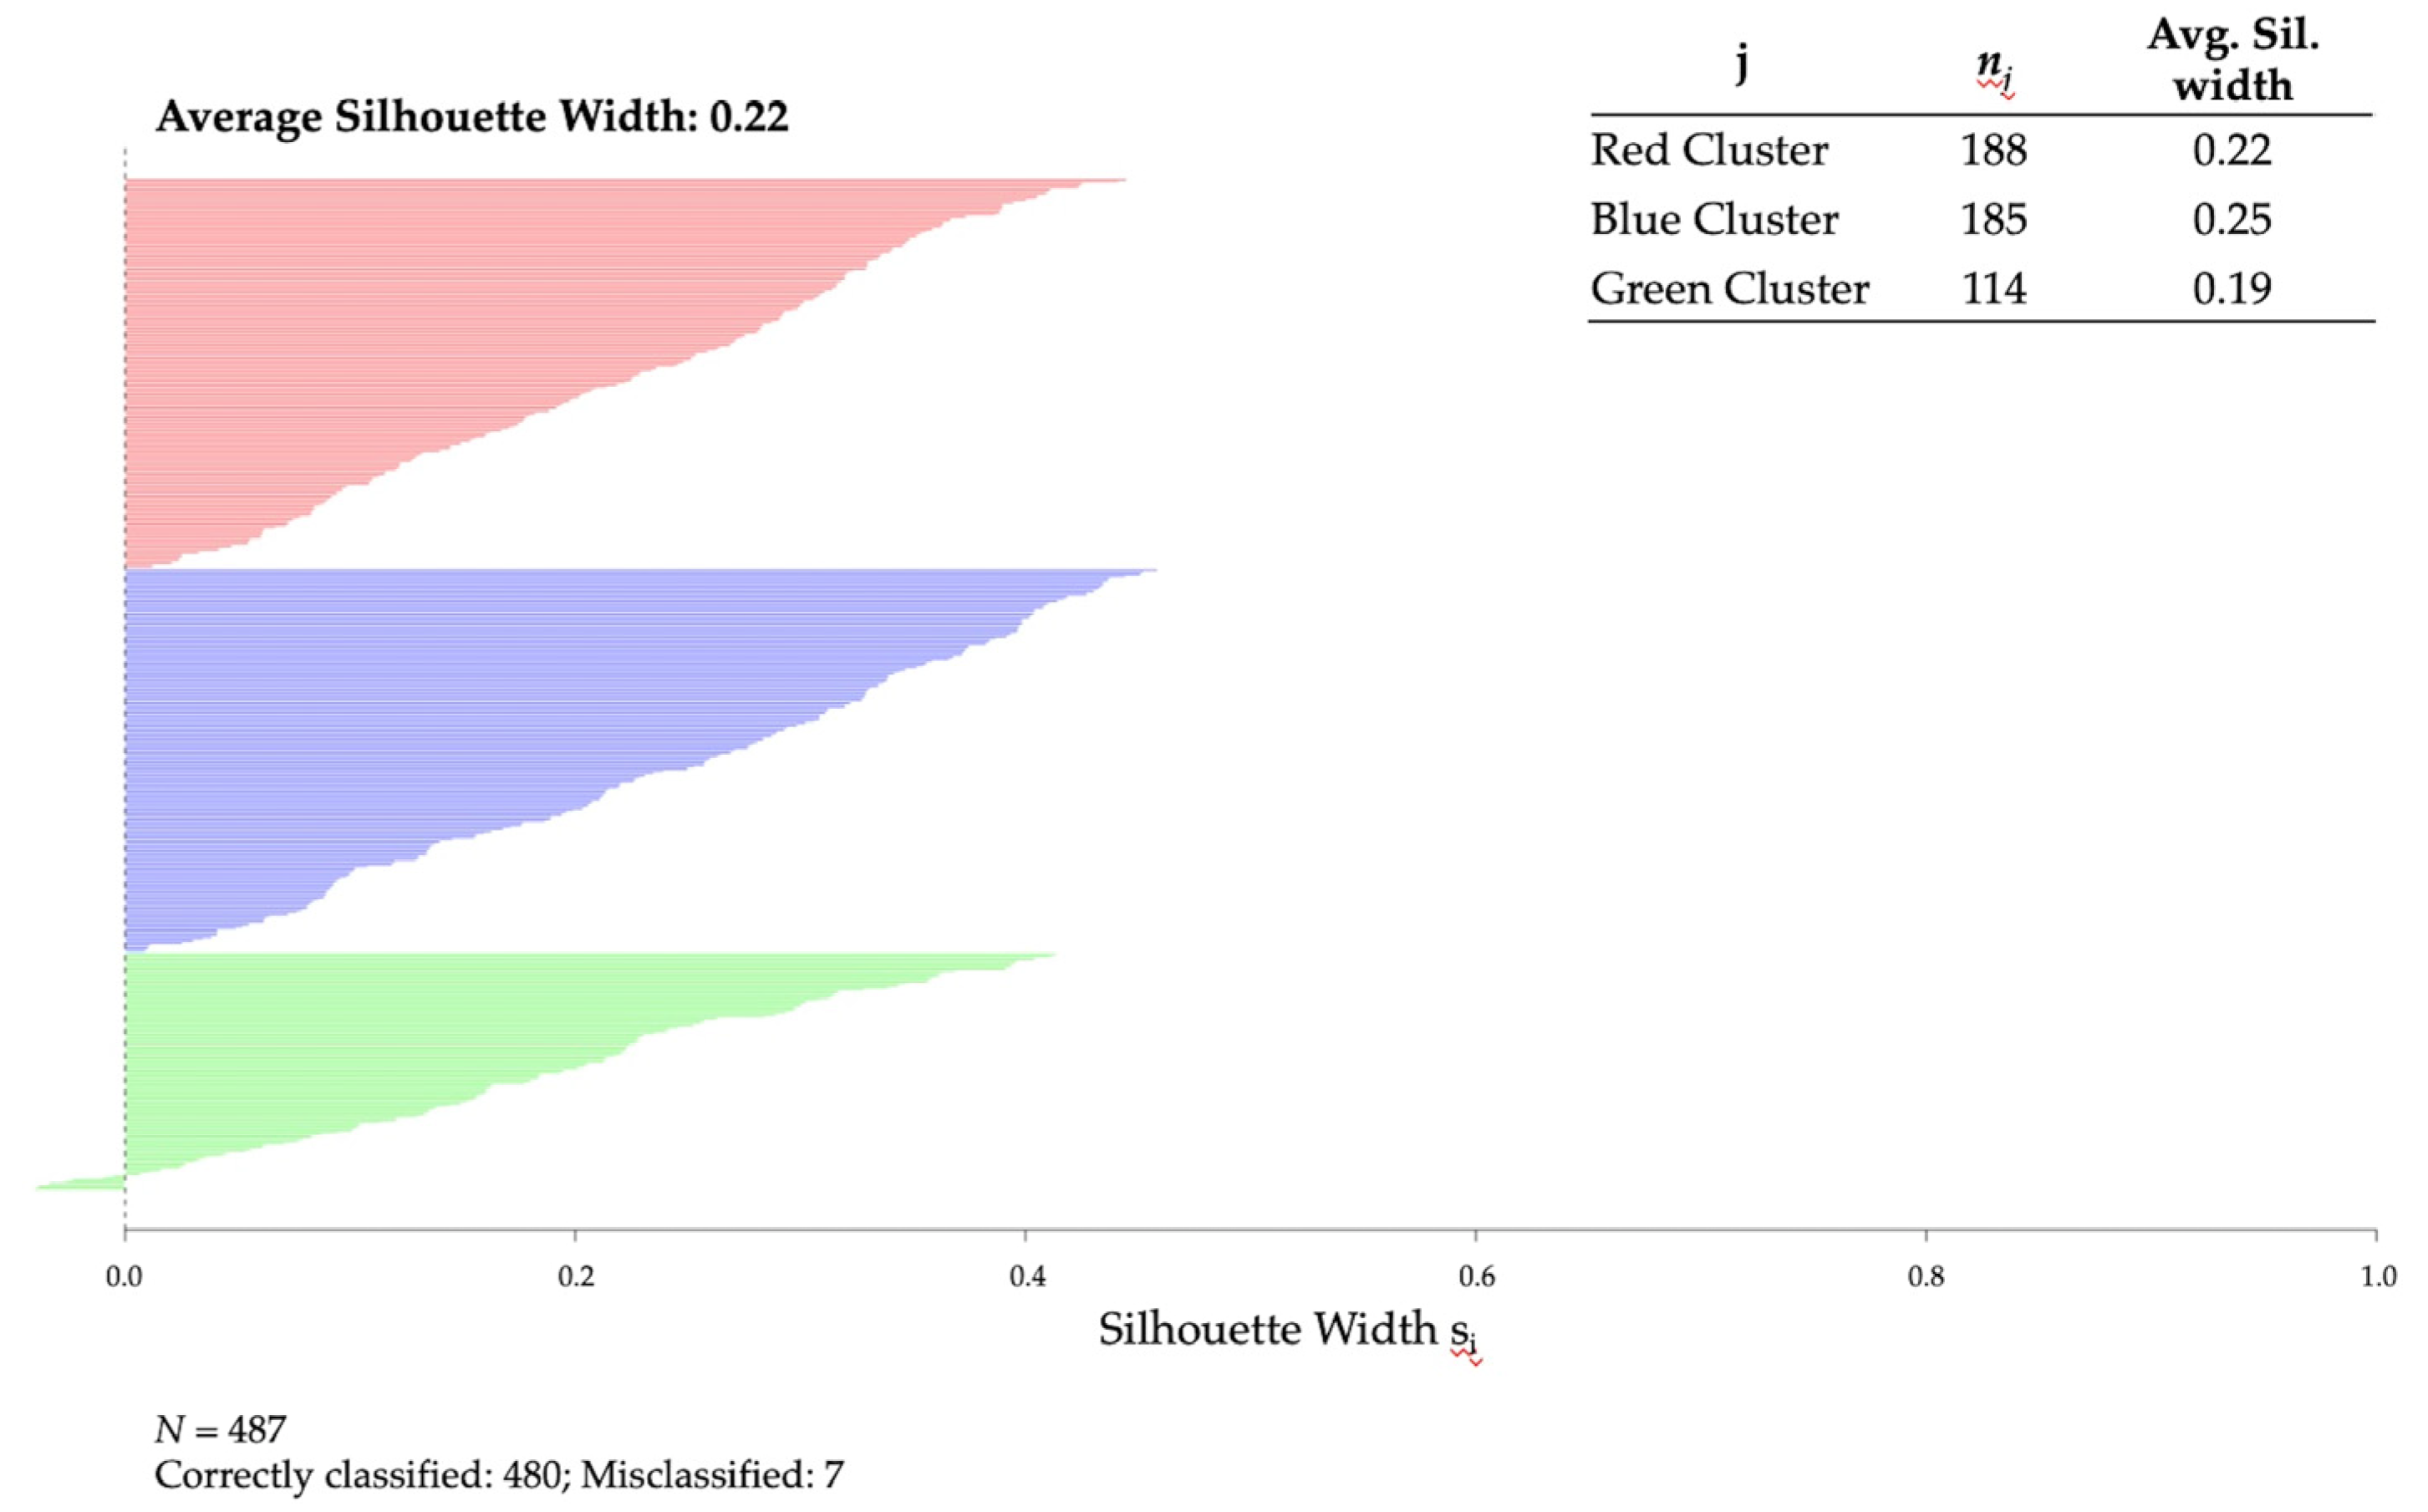
The compactness analysis supported a two-cluster solution based on the elbow point criterion, but a three-cluster solution also appeared viable and had a lower within-cluster sum of squares (WSS), indicating greater compactness. The separability analysis supported the two- and three-cluster solutions (.21 and .22, respectively; see Figure 2 below), relative to the other cluster solutions. Further, the silhouette plots per observation showed minimal misclassification (see Figure B1 and Figure B2 in the Appendix).
To interpret the cluster structures, we inspected the mean z-scored change scores for each solution (see Table 1). In the two-cluster solution, participants were grouped into Backfired and Uplifted clusters. The Backfired cluster was characterized by decreases in PA and elevation, increases in NA, and moderate elevations in SCA, relative to the sample average. The Uplifted cluster showed the opposite pattern, with increases in PA and elevation, decreases in NA, and moderate reductions in SCA.
In the three-cluster solution, participants were grouped in Backfired, Mixed Feelings, and Buffered clusters. Those in the Backfired cluster remained consistent with the two-cluster solution, although decreases in PA and elevation and increases in NA were more pronounced, and changes in SCA were less pronounced. Those in the Mixed Feelings cluster showed increases in PA, elevation, and SCA, but no changes in NA, relative to the sample average. Participants in the Buffered cluster experienced reductions in NA and SCA but no changes in PA or elevation.
Principal component analyses (PCAs) were conducted to visualize the cluster structure in a two-dimensional space. The first principal component (PC1) accounted for 46% of the variance and primarily reflected a contrast between positive and negative affect, with low contributions from SCA. PC1 correlated moderately with PA (r = .57), elevation (r = .52), and NA (r = –.56), and weakly with SCA (r = –.31). The second principal component (PC2) explained 28% of the variance and captured variation primarily driven by SCA, showing a strong positive correlation with SCA (r = .76) and weaker positive correlations with PA (r = .34), elevation (r = .44), and NA (r = .33). Full PCA loadings are shown in Table A3 of the Appendix.
Plots of the PCA results revealed separation between clusters. In the two-cluster solution, PC1 distinguished between positive (Uplifted) and negative (Backfired) affective responses, with minimal overlap between clusters. PC2, which captured SCA-related variation, did not clearly separate the two clusters, consistent with the absence of a distinct mixed emotion cluster. In contrast, the three-cluster solution revealed more nuanced distinctions, including a clear representation of the Mixed Feelings cluster along PC2. Although the boundaries between clusters were close, overlap remained minimal, supporting the distinctiveness of the three-cluster solution (see Figure 3).
The three-cluster solution was selected as the final model given that (1) PCA identified a mixed feelings component that accounted for a moderate amount of variance, (2) this solution allowed for a more nuanced analysis of person feature differences, and (3) this grouping had slightly better compactness and separability. Additional support for this choice came from examining the individual items within each affective composite (see Table A4 in the Appendix). Participants in the Buffered cluster experienced reductions in all NA and SCA items, relative to the sample average, with little to no change in PA and elevation, except for a moderate increase in happiness. The Mixed Feelings cluster showed increases in all PA, elevation, and SCA items, with the largest SCA increase observed in feelings of indebtedness (other SCA items increased moderately). The Backfired cluster exhibited decreases in all PA and elevation items and increases in all NA items. SCA also increased moderately, except for indebtedness, which showed a slight decline.
To further interpret the unexpected indebtedness change scores, post hoc correlations between indebtedness and all other affect items were examined at baseline (T0) and post-intervention (T1). Table 2 presents these correlations. At baseline, indebtedness was weakly correlated with most elevation items but became moderately and positively correlated with feeling uplifted and a warm feeling in the chest post-intervention. Conversely, baseline correlations with negative affect items, including feeling unhappy, angry/hostile, and frustrated weakened post-intervention. Moderate associations with other self-conscious emotions persisted, though weaker relationships were observed with feeling ashamed and uncomfortable post-intervention.
Demographics
No significant differences across clusters emerged for age, (F(2, 484) = 0.48, p = 0.620, η2 = .002. Similarly, generational differences across clusters were not statistically significant overall, χ2(6) = 11.45, p = .075, Adjusted Cramer’s V = .08. However, post hoc comparisons indicated that participants in the Backfired and Mixed Feelings clusters were more likely to be members of Gen Z (69% and 70%, respectively), compared to the Buffered cluster (58%, p < .05). No statistically significant differences emerged for gender (χ2(2) = 1.13, p = .57) or ethnicity (χ2(8) = 8.49, p = .39), though descriptive trends aligned with prior research. Women were slightly more likely to fall into the Buffered cluster (66%) compared to the Backfired cluster (60%), while men were more likely to appear in the Backfired cluster (40%) than the Buffered cluster (33%). Asian participants were more likely to fall into the Backfired and Mixed Feelings clusters (27% and 30%, respectively) than into the Buffered cluster (18%). White participants were more prevalent in the Buffered cluster (41%) compared to the Mixed Feelings and Backfired clusters (32% each). No differences were observed by relationship status (χ2(8) = 6.38, p = .60). Demographics per cluster are shown in Table A5 of the Appendix.
Personality
Significant personality differences emerged across clusters. Neuroticism varied by cluster with a medium effect size, F(2, 385) = 13.63, p < .001, η2 = .07. Participants in the Buffered cluster scored significantly higher in neuroticism (M = 3.67, SD = 1.00) than those in the Backfired (M = 3.06, SD = 1.11) and Mixed Feelings (M = 2.96, SD = 1.07) clusters. Agreeableness also differed significantly across clusters, F(2, 385) = 4.66, p = .01, η2 = .02, with participants in the Mixed Feelings cluster scoring higher (M = 3.88, SD = 0.78) than those in the Buffered cluster (M = 3.57, SD = 0.77). Marginally significant effects were found for conscientiousness, F(2, 385) = 3.17, p = .043, η2 = .02, and openness, F(2, 385) = 2.87, p = .058, η2 = .01. Those in the Buffered cluster were less conscientious (M = 3.23, SD = 0.85) and less open (M = 3.34, SD = 0.85) than those in the Backfired cluster (M = 3.51, SD = 0.87; M = 3.59, SD = 0.73, respectively). No significant differences were found for extraversion (F(2, 385) = 2.13, p = .12, η2 = .01). Descriptive statistics and pairwise comparisons are summarized in Table A6 and Table A7.
Baseline Affect and Trait Gratitude
Baseline affect and trait gratitude also varied significantly by cluster. Large effect sizes were observed for baseline negative affect, F(2, 484) = 81.25, p < .001, η2 = .25, and self-conscious affect, F(2, 484) = 70.27, p < .001, η2 = .23. Participants in the Buffered cluster began with higher levels of negative affect (M = 3.85, SD = 1.30) and self-conscious affect (M = 2.80, SD = 1.10) compared to both the Backfired (M = 2.29, SD = 1.04; M = 1.71, SD = 0.82, respectively) and Mixed Feelings (M = 2.35, SD = 1.07; M = 1.61, SD = 0.85, respectively) clusters. Statistically significant, though smaller, differences also emerged for baseline positive affect, F(2, 484) = 14.03, p < .001, η2 = .05, elevation, F(2, 484) = 6.87, p = .001, η2 = .03, and trait gratitude, F(2, 484) = 7.09, p < .001, η2 = .03. Participants in the Backfired cluster had the highest baseline positive affect (M = 4.47, SD = 1.31) and elevation (M = 4.18, SD = 1.24), followed by the Mixed Feelings (M = 3.95, SD = 1.29; M = 3.77, SD = 1.20, respectively) and Buffered (M = 3.70, SD = 1.37; M = 3.73, SD = 1.34, respectively) clusters. Trait gratitude was highest among participants in the Backfired (M = 5.89, SD = 1.01) and Mixed Feelings (M = 5.73, SD = 1.12) clusters compared to the Buffered cluster (M = 5.39, SD = 1.31). Full results are presented in Table A8 and Table A9 of the Appendix.
Activity Effort
Activity effort varied modestly across clusters, F(2, 333) = 3.41, p = .034, η2 = .02. Although post hoc pairwise comparisons were not statistically significant, participants in the Mixed Feelings (M = 5.71, SD = 1.09) and Buffered (M = 5.65, SD = 1.24) clusters reported slightly higher effort than those in the Backfired cluster (M = 5.40, SD = 1.21). See Table A10 and Table A11 in the appendix for full comparisons.
Coded Gratitude Letters
Analyses of the content of the gratitude letters revealed statistically significant differences across clusters for all seven coded categories, including writer effort (F(2, 233) = 4.49, p = .012, η2 = .04); level of detail (F(2, 233) = 6.29, p = .002, η2 = .05); heartfelt sincerity (F(2, 233) = 3.74, p = .025, η2 = .03); reflection depth (F(2, 233) = 5.28, p = .006, η2 = .04); genuineness (F(2, 233) = 5.12, p = .007, η2 = .04); superficiality (F(2, 233) = 5.64, p = .004, η2 = .05); and benefactor effort (F(2, 233) = 4.59, p = .011, η2 = .04). Letters from participants in the Mixed Feelings cluster were rated significantly higher on writer effort, level of detail, reflection depth, and genuineness than those from both the Backfired and Buffered clusters. Letters from those in the Mixed Feelings cluster also received higher ratings for heartfelt sincerity compared to those from the Backfired cluster and included more references to benefactor effort compared to the Buffered cluster. Letters from the Backfired cluster received higher superficiality ratings compared to those from the Mixed Feelings cluster. Mean ratings and standard deviations for each cluster are presented in Table 3, with pairwise comparisons detailed in Table A12 of the Appendix.
Finally, letter word count varied marginally across clusters, F(2, 233) = 2.99, p = .052, η2 = .03. Participants in the Mixed Feelings cluster (M = 135.56, SD = 75.04) wrote slightly longer letters than those in the Buffered cluster (M = 107.05, SD = 68.67). See Table A13 and Table A14 in the appendix for full descriptive and inferential statistics.
Discussion
The primary aim of this study was to evaluate individual differences in the person–activity fit (Lyubomirsky & Layous, 2013) of writing a gratitude letter. To this end, we merged data from three existing experiments in which participants wrote gratitude letters but did not share them.
Do Distinct Affect Clusters Emerge After Writing a Gratitude Letter?
Both two- and three-cluster solutions emerged from the analysis with comparable compactness and separability. However, the three-cluster solution enhanced interpretability, allowed for more nuanced analyses, and aligned closely with prior work on gratitude-induced mixed affective states (e.g., Layous et al., 2017).
Findings partially supported our predictions. The Backfired and Mixed Feelings clusters emerged as expected, but a distinct Benefit cluster did not. Instead, the Buffered cluster comprised individuals who, on average, experienced decreases in negative affect and self-conscious affect. The Mixed Feelings cluster included individuals who showed increases in positive affect, elevation, and self-conscious affect. In contrast, individuals in the Backfired cluster experienced decreases in positive affect and elevation and increases in negative affect.
An exploratory follow-up revealed that, among individuals in the Mixed Feelings cluster, indebtedness increased the most relative to other self-conscious affect items. In the Backfired cluster, indebtedness slightly decreased while all other self-conscious affect items moderately increased. Further, across the full sample, the meaning of indebtedness appeared to shift after the intervention. Before the intervention, indebtedness positively correlated with negative affective states such as feeling unhappy, frustrated, and angry/hostile. After the intervention, these associations disappeared, and indebtedness instead became moderately and positively correlated with elevation items, such as feeling uplifted and having a warm sensation in the chest. This shift suggests that the Mixed Feelings cluster may not reflect emotional ambivalence but instead a distinct pattern in which self-conscious emotions are embedded within an overall uplifted emotional profile—consistent with prior findings that gratitude interventions uniquely elicit both uplifting and self-evaluative emotions (Layous et al., 2017; Watkins et al., 2006).
These findings underscore the dual nature of gratitude. Self-conscious emotions such as indebtedness, when felt in a relational context, can reinforce prosocial norms and deepen social bonds (Hareli & Parkinson, 2008; Tsang, 2006, 2007). Some research has distinguished between transactional (need to repay) and transcendent (desire to pay) indebtedness, with the latter predicting greater prosocial reciprocity (Nelson et al., 2023). Based on these findings, future research may benefit from isolating indebtedness rather than combining it with other self-conscious emotions to examine its unique psychological and relational consequences.
Who Benefits Most—and Least—from Writing a Gratitude Letter?
No significant differences in emotional response clusters emerged based on demographic features such as gender, ethnicity, age, or generation. This finding suggests that demographics alone may be insufficient to predict who will benefit from gratitude letter writing.
In contrast, baseline emotional states, personality traits, and features of the gratitude letters were more informative. Individuals in the Buffered cluster—those who experienced reductions in negative affect and self-conscious affect—had higher pre-intervention levels of neuroticism, negative affect, and self-conscious affect, along with lower levels of trait gratitude. Effect sizes were small for trait gratitude, medium for neuroticism, and large for negative affect and self-conscious affect. These findings align with prior work showing that gratitude interventions are especially beneficial for individuals who begin with low trait gratitude or higher negative emotionality, likely due to a floor effect (Froh et al., 2008; Froh et al., 2009a; Harbaugh & Vasey, 2014; McCullough et al., 2004).
Individuals in the Mixed Feelings cluster were more agreeable and grateful than individuals in the Buffered cluster. Further, according to coder ratings, those in the Mixed Feelings cluster invested more effort, with letters that were more detailed, reflective, and genuine relative to the other clusters, and more heartfelt and sincere compared to the Backfired cluster. Further, coders rated the benefactor’s actions described in these letters as more effortful compared to those described by individuals in the Buffered cluster. Although effect sizes were small, findings suggest that individuals who experience both uplifting and self-conscious emotional responses may be tapping into the social–relational meaning of gratitude. Prior studies support the view that mixed emotions—particularly those that include a sense of indebtedness—can promote social connection and motivate reciprocity (Watkins et al., 2006; Nelson et al., 2023).
In contrast, individuals in the Backfired cluster began with relatively high levels of positive affect, elevation, trait gratitude, openness, and conscientiousness. Following the intervention, these individuals experienced greater increases in feelings such as frustration and unhappiness. Further, coders rated their letters as more superficial compared to letters from the Mixed Feelings cluster. Earlier work suggests that when individuals are already dispositionally grateful and in a positive mood, gratitude interventions may yield little benefit due to a ceiling effect (Emmons & Mishra, 2011; Harbaugh & Vasey, 2014). However, although effect sizes are small, the present findings may be the first to suggest that writing a gratitude letter can backfire among individuals with certain emotional or dispositional profiles. Writing a gratitude letter may have disrupted a previously positive state, or the activity may have felt contrived or inauthentic, producing frustration or disengagement.
These findings also align with recent research on tailoring interventions based on emotional readiness. A recent study of Chinese adults found that an AI-powered system that delivered interventions matched to participants’ baseline affect produced the strongest gains in well-being relative to other experimental conditions (Liu et al., 2024). Specifically, individuals high in positive affect were encouraged to reflect on past accomplishments, while those low in positive affect engaged in best-self visualizations, and the remaining participants engaged in a gratitude activity. Combined with the present study, these findings suggest that tailoring activities to person–state features may enhance psychological outcomes. Future research should replicate this work.
Limitations
Merging datasets presented both strengths and limitations for this study. A primary strength was the increased sample size and diversity, which allowed for more stable cluster estimation and detection of meaningful individual differences in affective response. Larger and more heterogeneous samples help address the overreliance on convenience samples (e.g., college students) often seen in gratitude intervention research (e.g., Chopik et al., 2019; Froh et al., 2009b). At the same time, despite a thorough review to ensure consistency across studies, some differences remained (see Materials and Methods section).
Although the gratitude letter activity was highly similar across studies, methodological differences beyond our core variables may have been introduced. To help maintain consistency, we only included measures with similar wording across studies and used z-scored change scores to limit the influence of variable scale differences and unequal variances. Nevertheless, unmeasured methodological differences cannot be ruled out. Given that this approach limited variable inclusion, future studies could incorporate other affective and cognitive states (e.g., authenticity, social connection, rumination) and person features (e.g., motivation, self-efficacy, socioeconomic status) to further inform individual differences across clusters.
In addition, effect sizes in the person-feature comparisons were small, with the exception of baseline negative affect, self-conscious affect, and neuroticism. This pattern aligns with meta-analyses of gratitude interventions, which have generally reported small to medium effects (Dickens, 2017). In psychological science, small effects are common due to the complex nature of human behavior (Götz et al., 2021). Importantly, small but statistically significant effects can still offer valuable theoretical and applied insights, especially when considered in context (Funder & Ozer, 2019). This study contributes to that goal by highlighting patterns that may otherwise be obscured in group-level averages.
Moreover, the analytic sample was not demographically representative. Women, Gen Z participants, and single individuals were overrepresented. Further, due to chi-square test sensitivity to small expected frequencies, we excluded underrepresented categories from the demographic person features analyses, including participants from the Silent Generation, individuals who selected “other” gender identities, and those reporting “cohabiting” or “widowed” relationship statuses. Future studies should aim to replicate these findings using more demographically balanced and population-representative samples.
This study also focused exclusively on nonclinical samples. While the present findings suggest that individuals higher in negative and self-conscious affect may experience the greatest reductions in these feelings after a gratitude letter intervention, prior research raises important caveats. For instance, individuals with clinical symptoms of depression or anxiety who are prone to experiencing guilt, shame, or embarrassment may not benefit from gratitude interventions (Layous et al., 2017). Therefore, clinical applications of gratitude interventions must be guided by careful assessment and tailoring. Future studies could examine clustering patterns in clinical populations to explore whether similar or distinct emotional profiles emerge.
Finally, the findings pertain specifically to writing a gratitude letter without sharing it. These results should not be generalized to other forms of gratitude practice, such as counting blessings or delivering the letter to the intended recipient. Prior research suggests that delivering a gratitude letter can produce stronger or different emotional effects than writing alone (Kumar & Epley, 2018; Walsh et al., 2022b). Future studies should extend this clustering approach to a broader range of gratitude and positive activity interventions (e.g., acts of kindness, best-self visualizations, practicing optimism) to examine whether similar person–activity fit patterns emerge.
Conclusions
Writing a gratitude letter may not be universally beneficial. The present findings highlight the importance of considering differences in individual traits and moods prior to using gratitude letter interventions to improve well-being.
Who Might Benefit?
Writing a gratitude letter may boost positive feelings along with feelings of indebtedness, among individuals who put effort into the activity (e.g., write letters that are detailed and genuine), are agreeable (e.g., compassionate, assume the best about people), and even some who may already have the tools to be dispositionally grateful. Notably, feeling indebted may not necessarily be negative for some individuals and, based on prior research, may promote reciprocity.
Writing a gratitude letter may also shield certain individuals against negative emotions—specifically, those with room to improve their moods, those who tend to be less grateful, and those who are dispositionally neurotic (e.g., worries a lot, is easily upset). The introspective feature of expressing gratitude may help this profile of individual foster a sense of coherence—the perception that the world is comprehensible, manageable, and meaningful (Antonovsky, 1993; Lindström & Eriksson, 2005)—and motivate positive reframing of unfavorable events into manageable ones (Lambert et al., 2009), thus promoting personal growth.
Who Might not Benefit as Much?
Individuals who are already in a good mood and some who are dispositionally grateful may experience ceiling or backfiring effects. In other words, rather than providing an incremental mood boost, this activity may lead to the opposite effect among those who are relatively happier and grateful.
Author Contributions
Conceptualization, T.V., L.W., and S.L.; methodology, T.V. and L.W.; software, T.V.; formal analysis, T.V.; investigation, T.V.; data curation, T.V. and L.L.; writing—original draft preparation, T.V.; writing—review and editing, S.L., L.W., and L.L.; visualization, T.V.; supervision, S.L.; project administration, T.V. All authors have read and agreed to the published version of the manuscript.
Funding
This research received no external funding. However, the original studies were funded by the John Templeton Foundation (Grant 61113).
Institutional Review Board Statement
Research was conducted in accordance with the Declaration of Helsinki and approved by the Institutional Review Board of the University of California, Riverside (Ways of Expressing Gratitude study: HS-12-112, approved October 15, 2018; Optimal Ways to Give Thanks study: HS-16-052, approved November 29, 2019; Thanking Parents study: HS-16-052, approved May 6, 2016).
Informed Consent Statement
Informed consent was obtained from all subjects.
Data Availability Statement
Materials (e.g., consent forms and surveys) and data used in this study are openly available in the Open Source Science Framework. Ways of Expressing Gratitude study: https://osf.io/rp34a/overview?view_only=9857064e8d2544c69889f9908ce14c12; Optimal Way to Give Thanks study: https://osf.io/4bwnf/overview; Thanking Parents study: https://osf.io/xj6s9/overview (Actors files)
Acknowledgments
We thank our lab colleague James Chinn and our research assistants Angel Tang and Hrithik Jariwala for their support coding the gratitude letters.
Conflicts of Interest
The authors declare no conflicts of interest.
Appendix A. Tables

Table A1.
Demographics.
| Merged Dataset |
Ways of Expressing Gratitude Study |
Optimal Way to Give Thanks Study |
Thanking Parents Study |
|
|---|---|---|---|---|
| (N = 487) | (n = 157) | (n = 231) | (n = 99) | |
| Age (M ± SD in years) | 28 (15.7) | 47 (15.6) | 19 (1.85) | 19 (1.5) |
| Generation | ||||
| Gen Z | 67% | 5% | 99% | 91% |
| Millennial | 12% | 30% | 1% | 9% |
| Gen X | 9% | 28% | 0% | 0% |
| Boomer | 10% | 32% | 0% | 0% |
| 2% | 5% | 0% | 0% | |
| Sex | ||||
| Female | 62% | 50% | 66% | 73% |
| Male | 38% | 50% | 33% | 27% |
| Other | 0% | 0% | 1% | NA |
| Ethnicity | ||||
| White | 34% | 85% | 8% | 14% |
| Black | 6% | 10% | 3% | 9% |
| Hispanic | 24% | 0% | 35% | 35% |
| Asian | 26% | 0% | 44% | 24% |
| Other | 10% | 5% | 10% | 17% |
| Relationship Status | ||||
| Single, not in a relationship | 38% | 17% | 69% | NA |
| Relationship | 19% | 15% | 29% | NA |
| Cohabiting | 3% | 8% | 0% | NA |
| Single (not defined) | 20% | NA | NA | 100% |
| Married | 15% | 44% | 1% | 0% |
| Divorced/Separated | 5% | 14% | 0% | 0% |
| Widowed | 1% | 3% | 0% | 0% |
NA = Not asked.
Table A2.
Correlation of z-Scored Change Score Variables.
| Present Study |
Ways of Expressing Gratitude Study |
Optimal Way to Give Thanks Study |
Thanking Parents Study |
|||||||||||||
|---|---|---|---|---|---|---|---|---|---|---|---|---|---|---|---|---|
| PA | Elev | NA | SCA | PA | Elev | NA | SCA | PA | Elev | NA | SCA | PA | Elev | NA | SCA | |
| Positive Affect (PA) |
1 | 1 | 1 | 1 | ||||||||||||
| Elevation (Elev) |
.48 | 1 | .46 | 1 | .56 | 1 | .38 | 1 | ||||||||
| Negative Affect (NA) |
-.37 | -.27 | 1 | -.34 | -.10 | 1 | -.51 | -.48 | 1 | -.32 | .01 | 1 | ||||
| Self-Conscious Affect (SCA) |
-.06 | -.02 | .39 | 1 | -.01 | -.01 | .41 | 1 | -.07 | -.13 | .39 | 1 | -.15 | .15 | .38 | 1 |
Table A3.
Principal Component Analysis (z-Scored Change Scores).
| PC1 | PC2 | |
|---|---|---|
| Positive Affect | .57 | .34 |
| Elevation | .52 | .44 |
| Negative Affect | -.56 | .33 |
| Self-Conscious Affect | -.31 | .76 |
| Standard Deviation | 1.36 | 1.06 |
| Proportion of Variance | .46 | .28 |
| Cumulative Proportion | .46 | .74 |
Table A4.
Mean Affect z-Scored Change Score Per Item for the Three-Cluster Solution.
| Items | Backfired | Mixed Feelings | Buffered |
|---|---|---|---|
| Positive Affect | |||
| Happy | -0.63 | 0.47 | 0.25 |
| Pleased | -0.58 | 0.51 | 0.10 |
| Joyful | -0.58 | 0.54 | 0.05 |
| Enjoyment | -0.45 | 0.52 | -0.13 |
| Elevation | |||
| Moved | -0.51 | 0.52 | -0.04 |
| Uplifted | -0.63 | 0.55 | 0.11 |
| Optimistic about humanity | -0.46 | 0.46 | -0.01 |
| A warm feeling in your chest | -0.57 | 0.50 | 0.11 |
| A desire to help others | -0.44 | 0.39 | 0.06 |
| A desire to become a better person | -0.38 | 0.39 | -0.01 |
| Negative Affect | |||
| Unhappy | 0.54 | -0.02 | -0.83 |
| Worried/Anxious | 0.40 | -0.10 | -0.49 |
| Angry/Hostile | 0.42 | 0.11 | -0.88 |
| Frustrated | 0.53 | -0.06 | -0.76 |
| Depressed/Blue | 0.48 | -0.03 | -0.74 |
| Self-Conscious Affect | |||
| Indebted | -0.16 | 0.46 | -0.51 |
| Guilty | 0.18 | 0.22 | -0.66 |
| Embarrassed | 0.20 | 0.25 | -0.73 |
| Uncomfortable | 0.29 | 0.18 | -0.76 |
| Ashamed | 0.21 | 0.27 | -0.78 |
Table A5.
Demographics Per Cluster.
| Backfired | Mixed Feelings | Buffered | |
|---|---|---|---|
| (A) | (B) | (C) | |
| (n = 185) | (n = 188) | (n = 114) | |
| Age (M ± SD in years) | 27 (15.0) | 28 (17.2) | 29 (14.2) |
| Generation | |||
| Gen Z | 69% C | 70% C | 58% |
| Millennial | 12% | 9% | 18% |
| Gen X | 9% | 6% | 14% |
| Boomer | 9% | 12% | 11% |
| Silent | 2% | 3% | 0% |
| Sex | |||
| Female | 60% | 62% | 66% |
| Male | 40% | 38% | 33% |
| Other | 1% | 0% | 1% |
| Ethnicity | |||
| White | 32% | 32% | 41% |
| Black | 7% | 5% | 9% |
| Hispanic | 25% | 23% | 24% |
| Asian | 27% | 30% | 18% |
| Other | 10% | 10% | 9% |
| Relationship Status | |||
| Single, no relationship | 41% | 36% | 37% |
| Relationship | 20% | 19% | 17% |
| Cohabiting | 3% | 3% | 2% |
| Single (not defined) | 19% | 23% | 18% |
| Married | 14% | 13% | 18% |
| Divorced/Separated | 4% | 4% | 8% |
| Widowed | 1% | 2% | 0% |
Significance level for upper case letters (A, B, C): .05. Note: For each significant pair, the upper case letter of the category with the smaller column proportion appears in the category with the statistically larger column proportion.
Table A6.
Personality—Means and Standard Deviations Per Cluster.
| Backfired | Mixed Feelings | Buffered | |
|---|---|---|---|
| Personality | (A) | (B) | (C) |
| Neuroticism | |||
| Mean | 3.06 | 2.96 | 3.67 |
| Standard Deviation | 1.11 | 1.07 | 1.00 |
| Pairwise Comparison | - | - | AB |
| Agreeableness | |||
| Mean | 3.73 | 3.88 | 3.57 |
| Standard Deviation | 0.73 | 0.78 | 0.77 |
| Pairwise Comparison | - | C | - |
| Conscientiousness | |||
| Mean | 3.51 | 3.45 | 3.23 |
| Standard Deviation | 0.87 | 0.89 | 0.85 |
| Pairwise Comparison | C | - | - |
| Openness | |||
| Mean | 3.59 | 3.47 | 3.34 |
| Standard Deviation | 0.73 | 0.78 | 0.85 |
| Pairwise Comparison | C | - | - |
| Extraversion | |||
| Mean | 3.02 | 2.82 | 2.81 |
| Standard Deviation | 0.95 | 0.93 | 0.93 |
| Pairwise Comparison | - | - | - |
Sample size: N = 388 (Backfired n = 150; Mixed Feelings n = 145; Buffered n = 93). Significance level for upper case letters (A, B, C): .05. Note: For each significant pair, the upper case letter of the category with the smaller column proportion appears in the category with the statistically larger column proportion.
Table A7.
Personality—Cluster Pairwise Comparison Statistics.
| Personality Type | Contrast | Diff | p Adj | Cohen’s D |
|---|---|---|---|---|
| Neuroticism | Mixed Feelings-Backfired | -0.10 | .718 | -0.09 |
| Neuroticism | Buffered-Backfired | 0.61 | <.000 | 0.57 |
| Neuroticism | Buffered-Mixed Feelings | 0.71 | <.000 | 0.66 |
| Agreeableness | Mixed Feelings-Backfired | 0.14 | .241 | 0.19 |
| Agreeableness | Buffered-Backfired | -0.16 | .233 | -0.22 |
| Agreeableness | Buffered-Mixed Feelings | -0.31 | .007 | -0.40 |
| Conscientiousness | Mixed Feelings-Backfired | -0.07 | .797 | -0.07 |
| Conscientiousness | Buffered-Backfired | -0.28 | .037 | -0.33 |
| Conscientiousness | Buffered-Mixed Feelings | -0.22 | .142 | -0.25 |
| Openness | Mixed Feelings-Backfired | -0.12 | .386 | -0.15 |
| Openness | Buffered-Backfired | -0.24 | .047 | -0.31 |
| Openness | Buffered-Mixed Feelings | -0.12 | .452 | -0.16 |
| Extraversion | Mixed Feelings-Backfired | -0.19 | .177 | -0.21 |
| Extraversion | Buffered-Backfired | -0.21 | .204 | -0.23 |
| Extraversion | Buffered-Mixed Feelings | -0.02 | .990 | -0.02 |
Table A8.
Baseline Affect and Trait Gratitude—Means and Standard Deviations Per Cluster.
| Backfired | Mixed Feelings | Buffered | |
|---|---|---|---|
| Baseline Affect | (A) | (B) | (C) |
| Positive Affect | |||
| Mean | 4.47 | 3.95 | 3.70 |
| Standard Deviation | 1.31 | 1.29 | 1.37 |
| Pairwise Comparison | BC | - | - |
| Elevation | |||
| Mean | 4.18 | 3.77 | 3.73 |
| Standard Deviation | 1.24 | 1.20 | 1.34 |
| Pairwise Comparison | BC | - | - |
| Negative Affect | |||
| Mean | 2.29 | 2.35 | 3.85 |
| Standard Deviation | 1.04 | 1.07 | 1.30 |
| Pairwise Comparison | - | - | AB |
| Self-Conscious Affect | |||
| Mean | 1.71 | 1.61 | 2.80 |
| Standard Deviation | 0.82 | 0.85 | 1.10 |
| Pairwise Comparison | - | - | AB |
| Trait Gratitude | |||
| Mean | 5.89 | 5.73 | 5.39 |
| Standard Deviation | 1.01 | 1.12 | 1.31 |
| Pairwise Comparison | C | C | - |
Sample size: N = 487 (Backfired n = 185; Mixed Feelings n = 188; Buffered n = 114). Significance level for upper case letters (A, B, C): .05. Note: For each significant pair, the upper case letter of the category with the smaller column proportion appears in the category with the statistically larger column proportion.
Table A9.
Baseline Affect and Trait Gratitude—Cluster Pairwise Comparison Statistics.
| Measure | Contrast | Diff | p Adj | Cohen’s D |
|---|---|---|---|---|
| Positive Affect T0 | Mixed Feelings-Backfired | -0.52 | <.000 | -0.40 |
| Positive Affect T0 | Buffered-Backfired | -0.78 | <.000 | -0.59 |
| Positive Affect T0 | Buffered-Mixed Feelings | -0.25 | .243 | -0.19 |
| Elevation T0 | Mixed Feelings-Backfired | -0.42 | .004 | -0.33 |
| Elevation T0 | Buffered-Backfired | -0.45 | .007 | -0.36 |
| Elevation T0 | Buffered-Mixed Feelings | -0.04 | .967 | -0.03 |
| Negative Affect T0 | Mixed Feelings-Backfired | 0.06 | .857 | 0.05 |
| Negative Affect T0 | Buffered-Backfired | 1.55 | <.000 | 1.39 |
| Negative Affect T0 | Buffered-Mixed Feelings | 1.49 | <.000 | 1.34 |
| Self-Conscious Affect T0 | Mixed Feelings-Backfired | -0.10 | .535 | -0.11 |
| Self-Conscious Affect T1 | Buffered-Backfired | 1.09 | <.000 | 1.21 |
| Self-Conscious Affect T2 | Buffered-Mixed Feelings | 1.19 | <.000 | 1.32 |
| Trait Gratitude | Mixed Feelings-Backfired | -0.17 | .331 | -0.15 |
| Trait Gratitude | Buffered-Backfired | -0.50 | .001 | -0.45 |
| Trait Gratitude | Buffered-Mixed Feelings | -0.34 | .032 | -0.30 |
Table A10.
Activity Effort—Mean and Standard Deviation Per Cluster.
| Backfired | Mixed Feelings | Buffered | |
|---|---|---|---|
| Effort | (A) | (B) | (C) |
| Mean | 5.40 | 5.71 | 5.65 |
| Standard Deviation | 1.21 | 1.09 | 1.24 |
| Pairwise Comparison | - | - | - |
Sample size: N = 487 (Backfired n = 185; Mixed Feelings n = 188; Buffered n = 114). Significance level for upper case letters (A, B, C): .05. Note: For each significant pair, the upper case letter of the category with the smaller column proportion appears in the category with the statistically larger column proportion.
Table A11.
Activity Effort—Cluster Pairwise Comparison Statistics.
| Measure | Contrast | Diff | p Adj | Cohen’s D |
|---|---|---|---|---|
| Effort | Mixed Feelings-Backfired | 0.33 | .058 | 0.28 |
| Effort | Buffered-Backfired | 0.36 | .089 | 0.31 |
| Effort | Buffered-Mixed Feelings | 0.03 | .979 | 0.03 |
Table A12.
Coded Gratitude Letters—Cluster Pairwise Comparison Statistics.
| Coding Theme | Contrast | Diff | p Adj | Cohen’s D |
|---|---|---|---|---|
| Writer effort | Buffered-Backfired | -0.04 | .977 | -0.03 |
| Writer effort | Mixed Feelings-Backfired | 0.44 | .037 | 0.38 |
| Writer effort | Mixed Feelings-Buffered | 0.48 | .029 | 0.42 |
| Level of detail | Buffered-Backfired | 0.00 | 1 | 0.00 |
| Level of detail | Mixed Feelings-Backfired | 0.51 | .007 | 0.47 |
| Level of detail | Mixed Feelings-Buffered | 0.51 | .011 | 0.47 |
| Heartfelt sincerity | Buffered-Backfired | 0.03 | .978 | 0.03 |
| Heartfelt sincerity | Mixed Feelings-Backfired | 0.38 | .039 | 0.38 |
| Heartfelt sincerity | Mixed Feelings-Buffered | 0.35 | .087 | 0.34 |
| Reflection depth | Buffered-Backfired | -0.02 | .997 | -0.01 |
| Reflection depth | Mixed Feelings-Backfired | 0.48 | .017 | 0.42 |
| Reflection depth | Mixed Feelings-Buffered | 0.50 | .020 | 0.44 |
| Genuineness | Buffered-Backfired | -0.03 | .989 | -0.02 |
| Genuineness | Mixed Feelings-Backfired | 0.44 | .021 | 0.41 |
| Genuineness | Mixed Feelings-Buffered | 0.47 | .020 | 0.44 |
| Superficiality | Buffered-Backfired | -0.18 | .547 | -0.18 |
| Superficiality | Mixed Feelings-Backfired | -0.50 | .003 | -0.50 |
| Superficiality | Mixed Feelings-Buffered | -0.32 | .109 | -0.33 |
| Benefactor effort | Buffered-Backfired | -0.19 | .515 | -0.19 |
| Benefactor effort | Mixed Feelings-Backfired | 0.30 | .147 | 0.29 |
| Benefactor effort | Mixed Feelings-Buffered | 0.49 | .010 | 0.48 |
Table A13.
Letter Word Count—Mean and Standard Deviation Per Cluster.
| Backfired | Mixed Feelings | Buffered | |
|---|---|---|---|
| Word Count | (A) | (B) | (C) |
| Mean | 114.61 | 135.56 | 107.05 |
| Standard Deviation | 86.94 | 75.04 | 68.67 |
| Pairwise Comparison | - | - | - |
Sample size: N = 236 (Backfired n = 76; Mixed Feelings n = 96; Buffered n = 64). Significance level for upper case letters (A, B, C): .05. Note: For each significant pair, the upper case letter of the category with the smaller column proportion appears in the category with the statistically larger column proportion.
Table A14.
Pairwise Comparisons of Mean Number of Words Used in Letters.
| Measure | Contrast | Diff | p Adj | Cohen’s D |
|---|---|---|---|---|
| Number of Words in Letter | Buffered-Backfired | -7.56 | .834 | -0.10 |
| Number of Words in Letter | Mixed Feelings-Backfired | 20.96 | .185 | 0.27 |
| Number of Words in Letter | Mixed Feelings-Buffered | 28.52 | .061 | 0.37 |
Appendix B. Figures
Figure A1.
Average Silhouette Width Per Observation: Two-Cluster Solution.
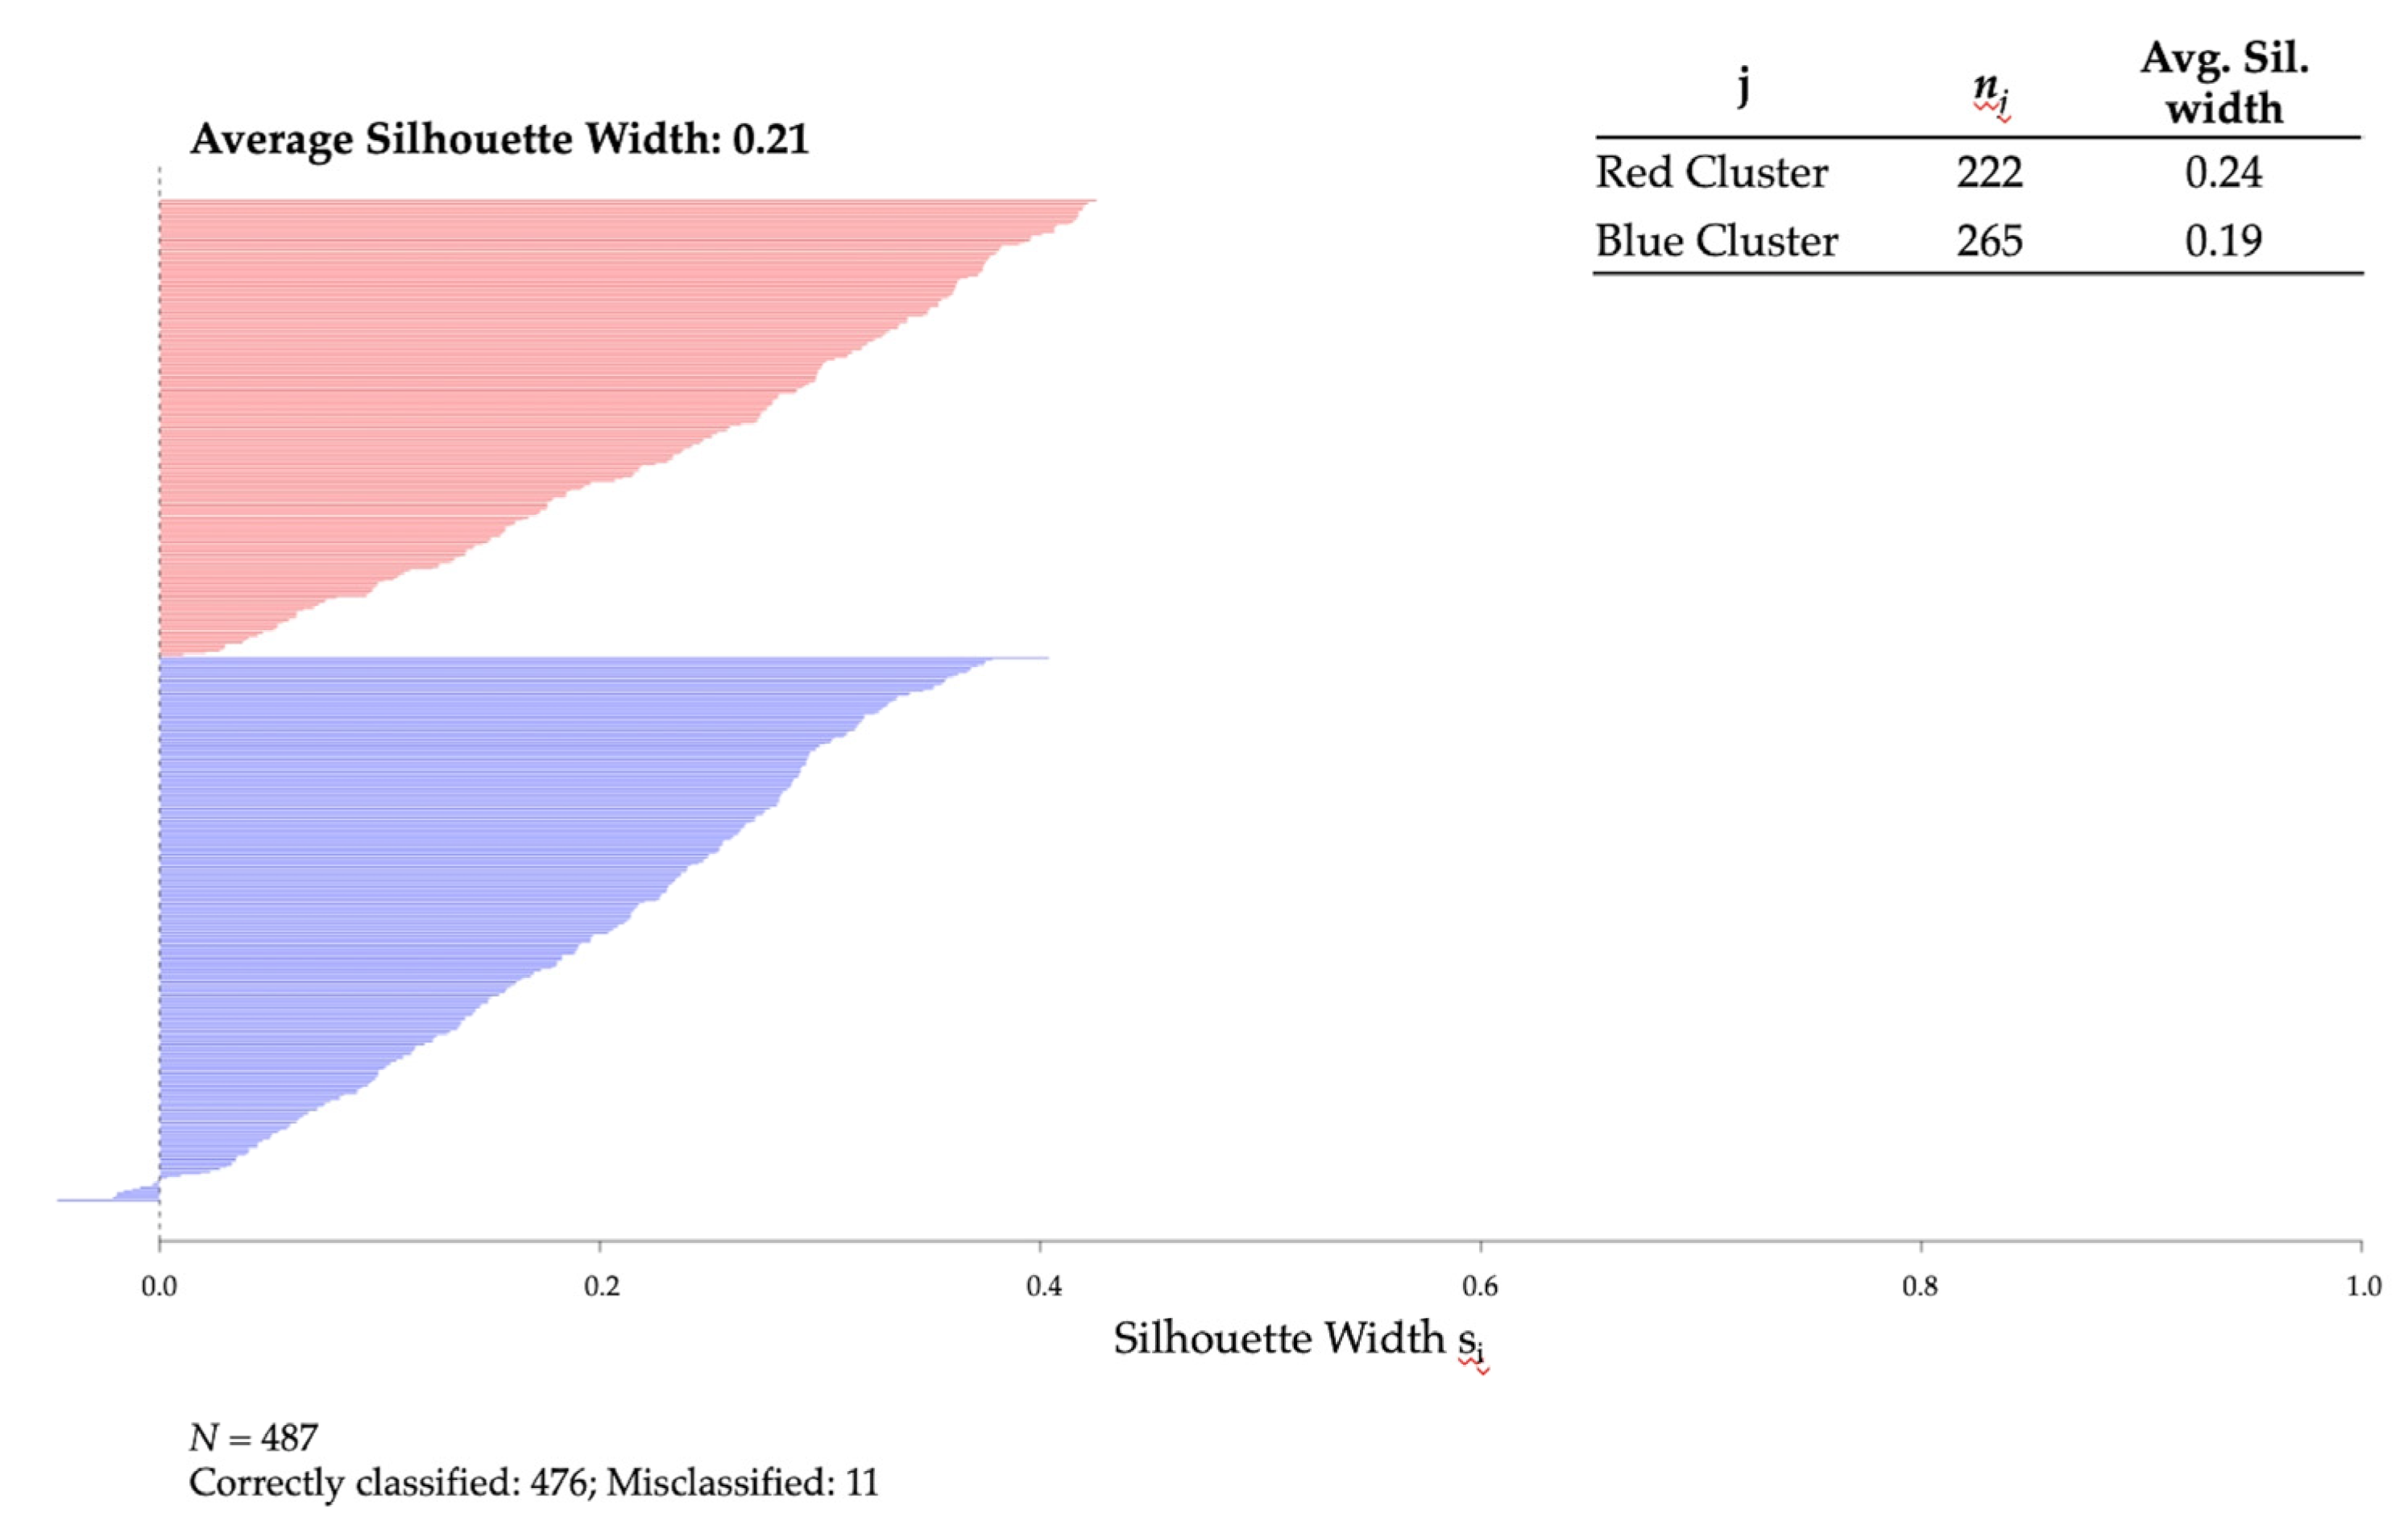
Figure A2.
Average Silhouette Width Per Observation: Three-Cluster Solution.
References
- Algoe, S. B., Gable, S. L., & Maisel, N. C. (2010). It’s the little things: Everyday gratitude as a booster shot for romantic relationships. Personal Relationships, 17(2), 217–233. [CrossRef]
- Antonovsky, A. (1993). The structure and properties of the Sense of Coherence scale. Social Science & Medicine, 36(6), 725–733. [CrossRef]
- Armenta, C. N., Fritz, M. M., Walsh, L. C., & Lyubomirsky, S. (2022). Satisfied yet striving: Gratitude fosters life satisfaction and improvement motivation in youth. Emotion, 22(5), 1004–1016. [CrossRef]
- Benjamini, Y. & Hochberg, Y. (1995). Controlling the false discovery rate: A practical and powerful approach to multiple testing. Journal of the Royal Statistical Society: Series B (Methodological) 57, 289–300. [CrossRef]
- Bono, G., & Sender, J. T. (2018). How gratitude connects humans to the best in themselves and in others. Research in Human Development, 15(3-4), 224–237. [CrossRef]
- Breen, W. E., Kashdan, T. B., Lenser, M. L., & Fincham, F. D. (2010). Gratitude and forgiveness: convergence and divergence on self-report and informant ratings. Personality and Individual Differences, 49(8), 932–937. [CrossRef]
- Chaplin, L. N., John, D. R., Rindfleisch, A., & Froh, J. J. (2018). The impact of gratitude on adolescent materialism and generosity. The Journal of Positive Psychology, 14(4), 502–511. [CrossRef]
- Chopik, W. J., Newton, N. J., Ryan, L. H., Kashdan, T. B., & Jarden, A. J. (2019). Gratitude across the life span: Age differences and links to subjective well-being. The Journal of Positive Psychology, 14(3), 292–302. [CrossRef]
- Cohen, J. (1988). Statistical power analysis for the behavioral sciences (2nd ed.). Lawrence Erlbaum Associates.
- Corona, K., Senft, N., Campos, B., Chen, C., Shiota, M., & Chentsova-Dutton, Y. E. (2020). Ethnic variation in gratitude and well-being. Emotion, 20(3), 518–524. [CrossRef]
- Dickens, L. R. (2017). Using gratitude to promote positive change: A series of meta-analyses investigating the effectiveness of gratitude interventions. Basic and Applied Social Psychology, 39(4), 193–208. [CrossRef]
- Diener, E., & Emmons, R. A. (1985). The independence of positive and negative affect. Journal of Personality and Social Psychology, 47, 1105–1117. http://dx.doi.org/10.1037/0022-3514.47.5.1105.
- Dunn, J. R., & Schweitzer, M. E. (2005). Feeling and believing: The influence of emotion on trust. Journal of Personality and Social Psychology, 88(5), 736–748. [CrossRef]
- Emmons, R. A., & McCullough, M. E. (2003). Counting blessings versus burdens: An experimental investigation of gratitude and subjective well-being in daily life. Journal of Personality and Social Psychology, 84(2), 377–389. [CrossRef]
- Emmons, R. A., & Mishra, A. (2011). Why gratitude enhances well-being: What we know, what we need to know. In K. M. Sheldon, T. B. Kashdan & Steger, M. F. (Eds.), Designing positive psychology: Taking stock and moving forward (1st ed., pp. 248-262). Oxford University Press. https://academic.oup.com/book/4376.
- Folk, D., & Dunn, E. (2023). A systematic review of the strength of evidence for the most commonly recommended happiness strategies in mainstream media. Nature Human Behaviour, 7(10), 1697–1707. [CrossRef]
- Fredrickson, B. L. (1998). What good are positive emotions? Review of General Psychology, 2(3), 300–319. [CrossRef]
- Fredrickson B. L. (2004). The broaden-and-build theory of positive emotions. Philosophical transactions of the Royal Society of London. Series B, Biological sciences, 359(1449), 1367–1378. [CrossRef]
- Froh, J. J., & Bono, G. (2008). The gratitude of youth. In S. J. Lopez (Ed.), Positive psychology: Exploring the best in people, Vol. 2. Capitalizing on emotional experiences (pp. 55–78). Praeger Publishers/Greenwood Publishing Group.
- Froh, J. J., Bono, G., & Emmons, R. (2010). Being grateful is beyond good manners: Gratitude and motivation to contribute to society among early adolescents. Motivation and Emotion, 34(2), 144–157. [CrossRef]
- Froh, J. J., Emmons, R. A., Card, N. A., Bono, G., & Wilson, J. A. (2011). Gratitude and the reduced costs of materialism in adolescents. Journal of Happiness Studies, 12(2), 289–302. [CrossRef]
- Froh, J. J., Kashdan, T. B., Ozimkowski, K. M., & Miller, N. (2009a). Who benefits the most from a gratitude intervention in children and adolescents? Examining positive affect as a moderator. The Journal of Positive Psychology, 4(5), 408–422. [CrossRef]
- Froh, J. J., Sefick, W. J., & Emmons, R. A. (2008). Counting blessings in early adolescents: An experimental study of gratitude and subjective well-being. Journal of School Psychology, 46(2), 213–233. [CrossRef]
- Froh, J. J., Yurkewicz, C., & Kashdan, T. B. (2009b). Gratitude and subjective well--being in early adolescence: Examining gender differences. Journal of Adolescence, 32(3), 633–650. [CrossRef]
- Funder, D. C., & Ozer, D. J. (2019). Evaluating effect size in psychological research: Sense and nonsense. Advances in Methods and Practices in Psychological Science, 2, 156– 168. [CrossRef]
- Götz, F. M., Gosling, S. D., & Rentfrow, J. (2021). Small effects: The indispensable foundation for a cumulative psychological science. Perspectives on Psychological Science, 17(1), 205–215.
- Grant, A. M., & Gino, F. (2010). A little thanks goes a long way: Explaining why gratitude expressions motivate prosocial behavior. Journal of Personality and Social Psychology, 98(6), 946–955. [CrossRef]
- Harbaugh, C. N., & Vasey, M. W. (2014). When do people benefit from Gratitude Practice? The Journal of Positive Psychology, 9(6), 535–546. [CrossRef]
- Hareli, S., & Parkinson, B. (2008). What’s social about social emotions? Journal for the Theory of Social Behaviour, 38(2), 131–156. [CrossRef]
- Hodge, A. S., Ellis, H. M., Zuniga, S., Zhang, H., Davis, C. W., McLaughlin, A. T., Hook, J. N., Davis, D. E., & Van Tongeren, D. R. (2023). Linguistic and thematic differences in written letters of gratitude to god and gratitude toward others. The Journal of Positive Psychology, 19(1), 83–94. [CrossRef]
- Howell, D. C. (2013). Statistical Methods for Psychology (8th ed.). Wadsworth Cengage Learning.
- Jain, A. K. (2010). Data clustering: 50 years beyond K-means. Pattern Recognition Letters, 31(8), 651–666. [CrossRef]
- Kashdan, T. B., Mishra, A., Breen, W. E., & Froh, J. J. (2009). Gender differences in gratitude: Examining appraisals, narratives, the willingness to express emotions, and changes in psychological needs. Journal of Personality, 77(3), 691–730. [CrossRef]
- Kern, M. L., Eichstaedt, J. C., Schwartz, H. A., Park, G., Ungar, L. H., Stillwell, D. J., Kosinski, M., Dziurzynski, L., & Seligman, M. E. (2014). From “Sooo excited!!!” to “so proud”: Using language to study development. Developmental Psychology, 50(1), 178–188. [CrossRef]
- Koo, T. K., & Li, M. Y. (2016). A guideline of selecting and reporting intraclass correlation coefficients for Reliability Research. Journal of Chiropractic Medicine, 15(2), 155–163. [CrossRef]
- Kubacka, K. E., Finkenauer, C., Rusbult, C. E., & Keijsers, L. (2011). Maintaining close relationships. Personality and Social Psychology Bulletin, 37(10), 1362–1375. [CrossRef]
- Kumar, A., & Epley, N. (2018). Undervaluing gratitude: Expressers misunderstand the consequences of showing appreciation. Psychological Science, 29(9), 1423–1435. [CrossRef]
- Lambert, N. M., Graham, S. M., Fincham, F. D., & Stillman, T. F. (2009). A changed perspective: How gratitude can affect sense of coherence through positive reframing. The Journal of Positive Psychology, 4(6), 461–470. [CrossRef]
- Layous, K., Lee, H., Choi, I., & Lyubomirsky, S. (2013). Culture matters when designing a successful haPAIness-increasing activity: A comparison of the United States and South Korea. Journal of Cross-Cultural Psychology, 44(8), 1294–1303. http://dx.doi.org/10.1177/0022022113487591.
- Layous, K., Sweeny, K., Armenta, C., Na, S., Choi, I., & Lyubomirsky, S. (2017). The proximal experience of gratitude. PLOS ONE, 12(7). [CrossRef]
- Lindström, B., Eriksson, M. (2005). Salutogenesis. Journal of Epidemiology & Community Health, 59(6), 440–442. [CrossRef]
- Liu, I., Liu, F., Xiao, Y., Huang, Y., Wu, S., & Ni, S. (2024a). Investigating the key success factors of chatbot-based positive psychology intervention with retrieval and generative pre-trained transformer (GPT)-based chatbots. International Journal of Human-Computer Interaction, 41(1), 341–352. [CrossRef]
- Lyubomirsky, S., Dickerhoof, R., Boehm, J. K., & Sheldon, K. M. (2011). Becoming happier takes both a will and a proper way: An experimental longitudinal intervention to boost well-being. Emotion, 11(2), 391–402. [CrossRef]
- Lyubomirsky, S., & Layous, K. (2013). How do simple positive activities increase well-being? Current Directions in Psychological Science, 22(1), 57–62. [CrossRef]
- Lyubomirsky, S., Sheldon, K. M., & Schkade, D. (2005). Pursuing happiness: The architecture of sustainable change. Review of General Psychology, 9(2), 111–131. [CrossRef]
- McCullough, M. E., Emmons, R. A., & Tsang, J.-A. (2002). The Grateful Disposition: A conceptual and empirical topography. Journal of Personality and Social Psychology, 82(1), 112–127. [CrossRef]
- McCullough, M. E., Tsang, J.-A., & Emmons, R. A. (2004). Gratitude in intermediate affective terrain: Links of grateful moods to individual differences and daily emotional experience. Journal of Personality and Social Psychology, 86(2), 295–309. [CrossRef]
- Nelson, J. M., Hardy, S. A., Tice, D., & Schnitker, S. A. (2023). Returning thanks to god and others: Prosocial consequences of transcendent indebtedness. The Journal of Positive Psychology, 19(1), 121–135. [CrossRef]
- Oltean, L.-E., Miu, A. C., Șoflău, R., & Szentágotai-Tătar, A. (2022). Tailoring gratitude interventions. how and for whom do they work? the potential mediating role of reward processing and the moderating role of childhood adversity and trait gratitude. Journal of Happiness Studies, 23(6), 3007–3030. [CrossRef]
- Oriol, X., Unanue, J., Miranda, R., Amutio, A. & Bazán, C. (2020). Self-transcendent aspirations and life satisfaction: The moderated mediation role of gratitude considering conditional effects of affective and cognitive empathy. Frontiers in Psychology, 11. [CrossRef]
- Pison, G., Struyf, A., & Rousseeuw, P. J. (1999). Displaying a clustering with CLUSPLOT. Computational Statistics & Data Analysis, 30(4), 381–392. [CrossRef]
- Rash, J. A., Matsuba, M. K., & Prkachin, K. M. (2011). Gratitude and well--being: Who benefits the most from a gratitude intervention? Applied Psychology: Health and Well-Being, 3(3), 350–369. [CrossRef]
- Reckart, H., Huebner, E. S., Hills, K. J., & Valois, R. F. (2017). A preliminary study of the origins of early adolescents’ gratitude differences. Personality and Individual Differences, 116, 44–50. [CrossRef]
- Regan, A., Walsh, L. C., & Lyubomirsky, S. (2022). Are some ways of expressing gratitude more beneficial than others? Results from a randomized controlled experiment. Affective Science, 4(1), 72–81. [CrossRef]
- Rousseeuw, P. J. (1987). Silhouettes: A graphical aid to the interpretation and validation of cluster analysis. Journal of Computational and Applied Mathematics, 20, 53–65. [CrossRef]
- Schnall, S., Roper, J., & Fessler, D. M. T. (2010). Elevation leads to altruistic behavior. Psychological Science, 21(3), 315–320. http://doi.org/10.1177/0956797609359882.
- Seligman, M. E., Steen, T. A., Park, N., & Peterson, C. (2005). Positive psychology progress: Empirical validation of interventions. American Psychologist, 60(5), 410–421. [CrossRef]
- Shin, L. J., Armenta, C. N., Kamble, S. V., Chang, S.-L., Wu, H.-Y., & Lyubomirsky, S. (2020). Gratitude in collectivist and individualist cultures. The Journal of Positive Psychology, 15(5), 598–604. [CrossRef]
- Shin, L. J., & Lyubomirsky, S. (2017). Increasing well-being in independent and interdependent cultures. In S. Donaldson & M. Rao (Eds.), Scientific advances in positive psychology (1st ed., pp. 11-36). Santa Barbara, CA: Praeger. https://www.bloomsbury.com/us/scientific-advances-in-positive-psychology-9781440834806/.
- Soto, C. J., & John, O. P. (2017). Short and extra-short forms of the Big Five Inventory–2: The BFI-2-S and BFI- 2-XS. Journal of Research in Personality, 68, 69-81.
- Szcześniak, M., Rodzeń, W., Malinowska, A., & Kroplewski, Z. (2020). Big five personality traits and gratitude: The role of emotional intelligence. Psychology Research and Behavior Management, 13, 977–988. [CrossRef]
- Tangney, J. P. (Ed.). (2012). Self-conscious emotions. In M. R. Leary & J. P. Tangney (Eds.), Handbook of self and identity (2nd ed., pp. 446–478). The Guilford Press. https://psycnet.apa.org/record/2012-10435-021.
- Toepfer, S. M., Cichy, K., & Peters, P. (2012). Letters of gratitude: Further evidence for author benefits. Journal of Happiness Studies, 13(1), 187–201. [CrossRef]
- Tsang, J.-A. (2006). The effects of helper intention on gratitude and indebtedness. Motivation and Emotion, 30(3), 198–204. [CrossRef]
- Tsang, J.-A. (2007). Gratitude for small and large favors: A behavioral test. The Journal of Positive Psychology, 2(3), 157–167. [CrossRef]
- Vargha, A., Bergman, L. R., & Takács, S. (2016). Performing cluster analysis within a person-oriented context: Some methods for evaluating the quality of Cluster Solutions. Journal for Person-Oriented Research, 2(1–2), 78–86. [CrossRef]
- Walsh, L. C., Armenta, C. N., Itzchakov, G., Fritz, M. M., & Lyubomirsky, S. (2022c). More than merely positive: The immediate affective and motivational consequences of gratitude. Sustainability, 14(14), 8679. [CrossRef]
- Walsh, L. C., Regan, A., & Lyubomirsky, S. (2022a). The role of actors, targets, and witnesses: Examining gratitude exchanges in a social context. The Journal of Positive Psychology, 17(2), 233–249. [CrossRef]
- Walsh, L. C., Regan, A., Twenge, J. M., & Lyubomirsky, S. (2022b). What is the optimal way to give thanks? Comparing the effects of gratitude expressed privately, one-to-one via text, or publicly on social media. Affective Science, 4(1), 82–91. [CrossRef]
- Wang, R. Adele., Nelson-Coffey, S. K., Layous, K., Jacobs Bao, K., Davis, O. S., & Haworth, C. M. (2017). Moderators of wellbeing interventions: Why do some people respond more positively than others? PLOS ONE, 12(11). [CrossRef]
- Watkins, P., Scheer, J., Ovnicek, M., & Kolts, R. (2006). The debt of gratitude: Dissociating Gratitude and indebtedness. Cognition & Emotion, 20(2), 217–241. [CrossRef]
- Wood, A. M., Maltby, J., Gillett, R., Linley, P. A., & Joseph, S. (2008a). The role of gratitude in the development of social support, stress, and depression: Two longitudinal studies. Journal of Research in Personality, 42(4), 854–871. [CrossRef]
- Wood, A. M., Maltby, J., Stewart, N., & Joseph, S. (2008b). Conceptualizing gratitude and appreciation as a unitary personality trait. Personality and Individual Differences, 44(3), 621–632. [CrossRef]
- Zakharov, K. (2016). Application of K-means clustering in psychological studies. The Quantitative Methods for Psychology, 12(2), 87–100. [CrossRef]
Figure 1.
Positive Activity Model (Lyubomirsky & Layous, 2013).
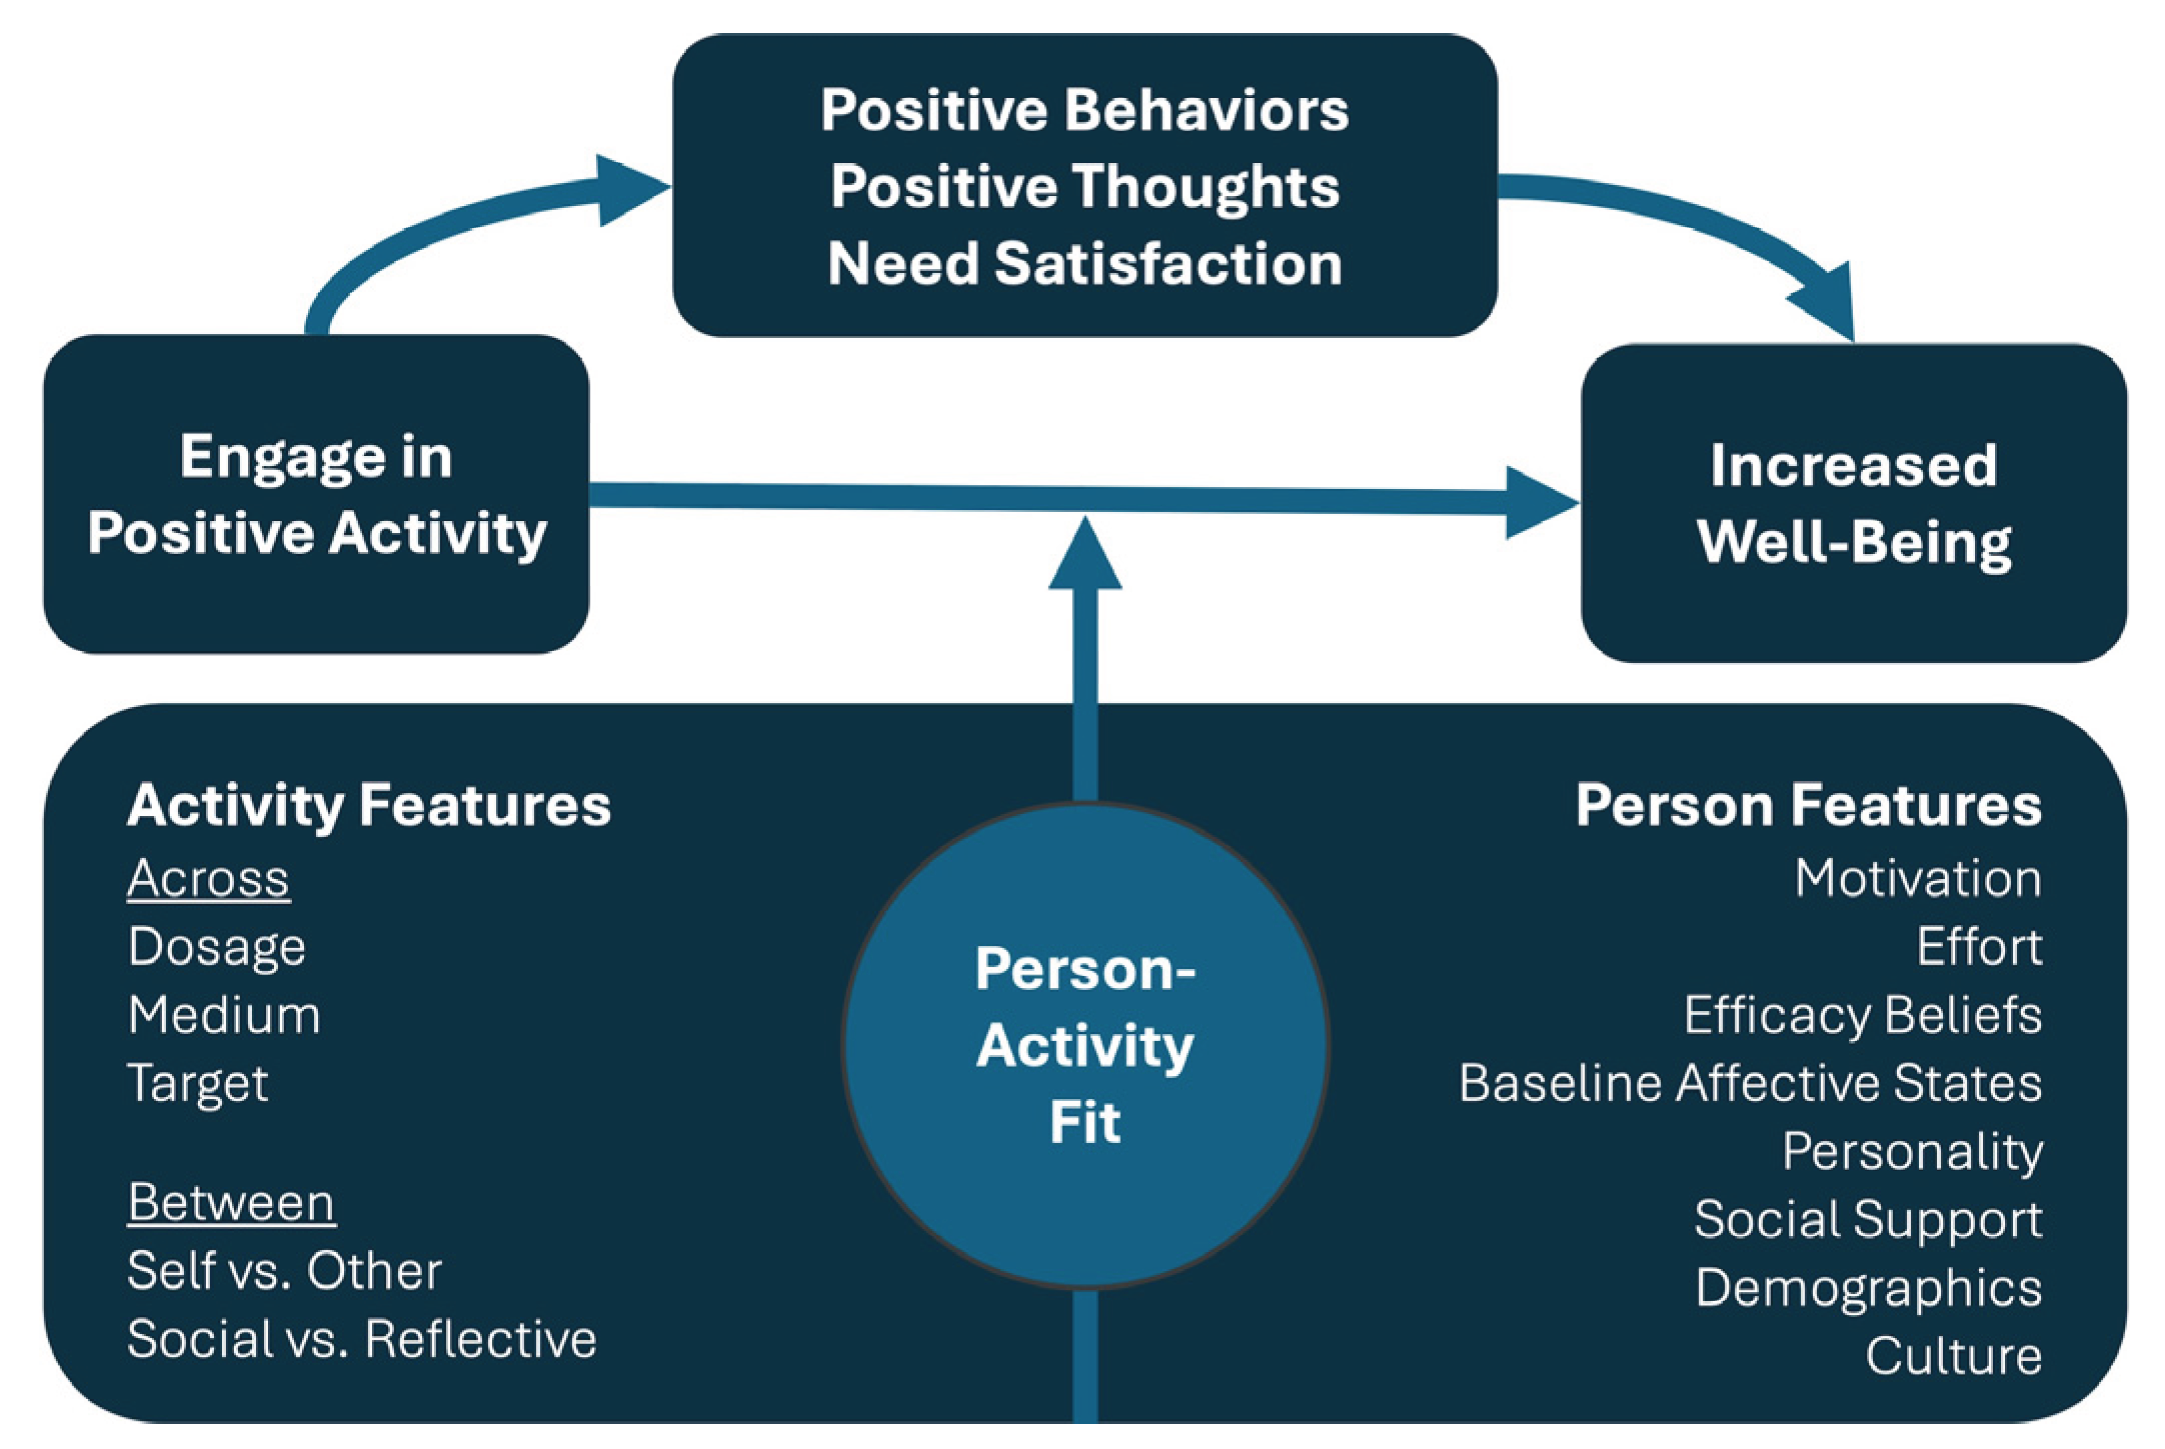
Figure 2.
Cluster Compactness and Separability Assessment. (a) Scree plot indicates a two- or three-cluster solution, with a three-cluster solution providing lower WSS, indicating better compactness; (b) Average silhouette width indicates that a three-cluster solution provides the best separability, closely followed by a two-cluster solution.
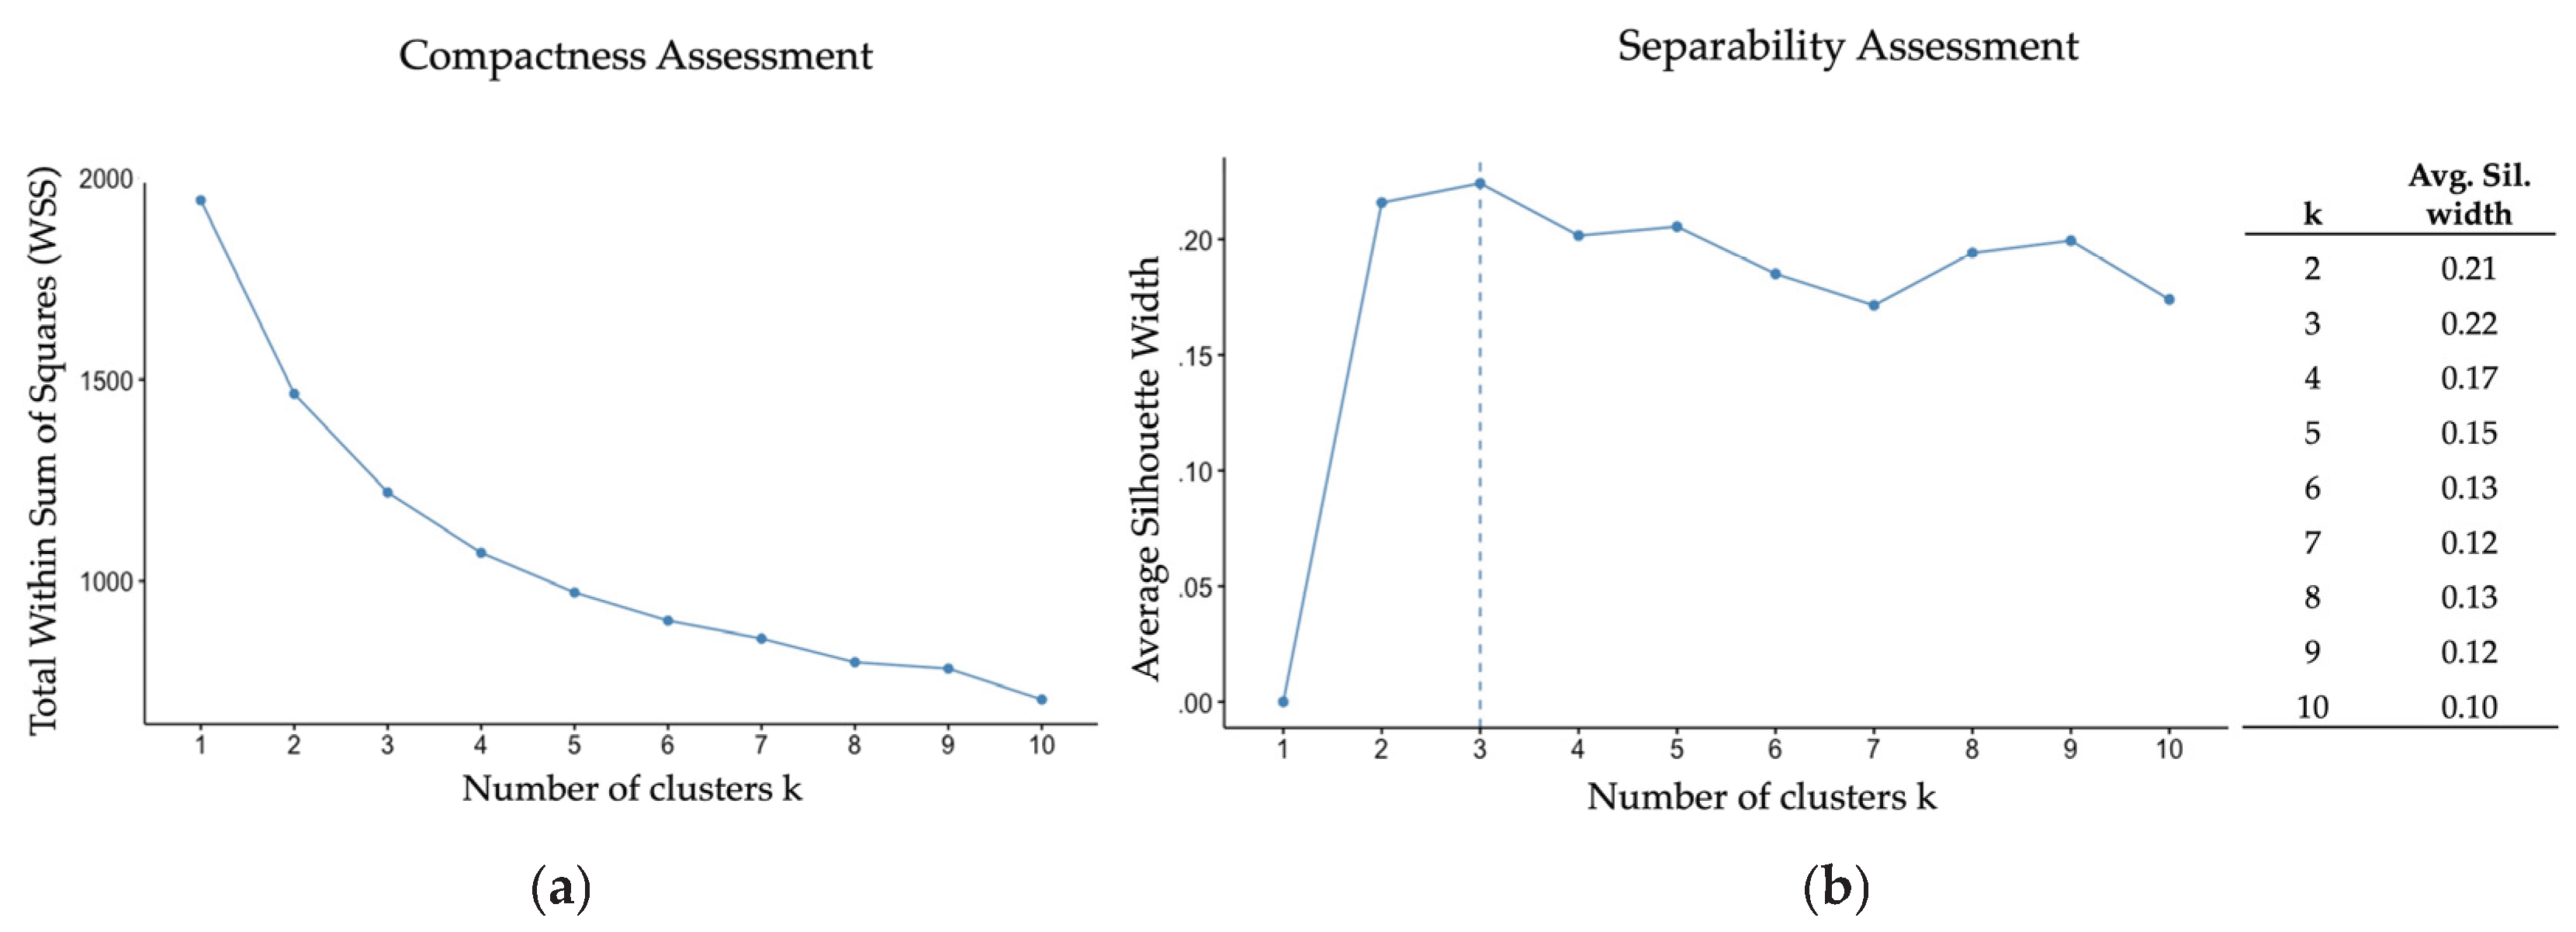
Figure 3.
Principal Component Analyses. (a) Depicts observations in the two-cluster solution; (b) Depicts observations in the three-cluster solution.
Figure 3.
Principal Component Analyses. (a) Depicts observations in the two-cluster solution; (b) Depicts observations in the three-cluster solution.
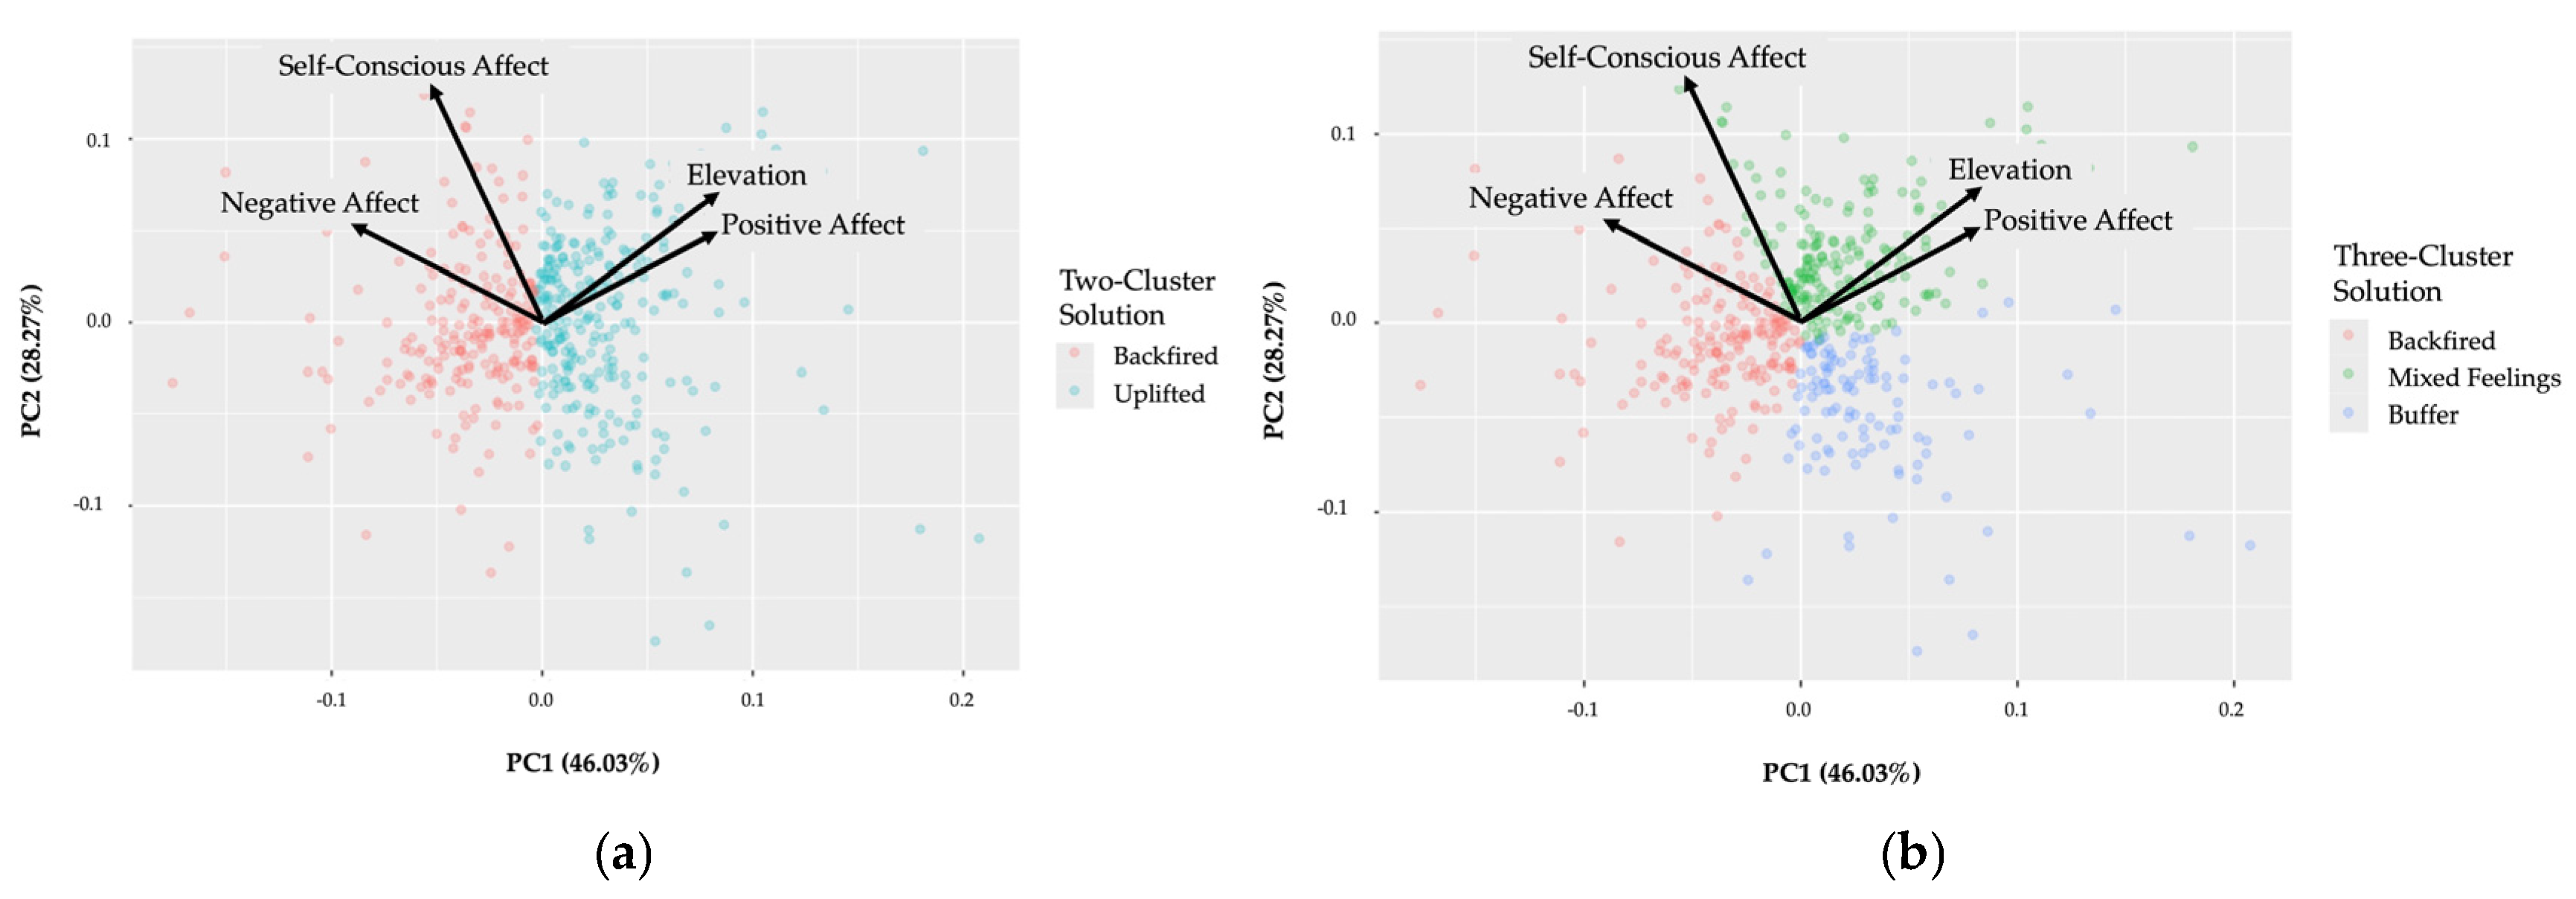
| Two-Cluster Solution | Three-Cluster Solution | ||||
| Backfired | Uplifted | Backfired |
Mixed Feelings |
Buffered | |
| n = | 222 | 265 | 185 | 188 | 114 |
| Positive Affect | -0.60 | 0.51 | -0.69 | 0.64 | 0.07 |
| Elevation | -0.58 | 0.48 | -0.72 | 0.68 | 0.06 |
| Negative Affect | 0.61 | -0.51 | 0.66 | -0.03 | -1.02 |
| Self-Conscious Affect | 0.32 | -0.27 | 0.20 | 0.45 | -1.06 |
Table 1.
Mean Affect z-Scored Change Score.
| Two-Cluster Solution | Three-Cluster Solution | ||||
| Backfired | Uplifted | Backfired |
Mixed Feelings |
Buffered | |
| n = | 222 | 265 | 185 | 188 | 114 |
| Positive Affect | -0.60 | 0.51 | -0.69 | 0.64 | 0.07 |
| Elevation | -0.58 | 0.48 | -0.72 | 0.68 | 0.06 |
| Negative Affect | 0.61 | -0.51 | 0.66 | -0.03 | -1.02 |
| Self-Conscious Affect | 0.32 | -0.27 | 0.20 | 0.45 | -1.06 |
Table 2.
Correlation of Indebtedness with Other Affect Items (Total Sample).
| r Indebtedness | ||
| Items | T0 | T1 |
| Positive Affect | ||
| Happy | -.01 | .05 |
| Pleased | .06 | .14 |
| Joyful | .09 | .07 |
| Enjoyment | .09 | .06 |
| Elevation | ||
| Moved | .20 | .29 |
| Uplifted | .09 | .24 |
| Optimistic about humanity | .13 | .21 |
| A warm feeling in your chest | .14 | .27 |
| A desire to help others | .12 | .19 |
| A desire to become a better person | .06 | .12 |
| Negative Affect | ||
| Unhappy | .23 | .07 |
| Worried/Anxious | .14 | -.06 |
| Angry/Hostile | .25 | .08 |
| Frustrated | .26 | .01 |
| Depressed/Blue | .13 | .05 |
| Self-Conscious Affect | ||
| Indebted | 1 | 1 |
| Guilty | .27 | .28 |
| Embarrassed | .32 | .28 |
| Uncomfortable | .21 | .15 |
| Ashamed | .38 | .29 |
Who Benefits Most—and Least—from Writing a Gratitude Letter?
Table 3.
Coded Gratitude Letters—Means and Standard Deviations Per Cluster.
| Backfired | Mixed Feelings | Buffered | |
| Coding Theme | (A) | (B) | (C) |
| Writer effort | |||
| Mean | 2.99 | 3.43 | 2.95 |
| Standard deviation | 1.31 | 1.06 | 1.10 |
| Pairwise comparison | - | AC | - |
| Level of detail | |||
| Mean | 2.63 | 3.13 | 2.62 |
| Standard deviation | 1.18 | 1.00 | 1.06 |
| Pairwise comparison | - | AC | - |
| Heartfelt sincerity | |||
| Mean | 3.14 | 3.53 | 3.18 |
| Standard deviation | 1.20 | 0.88 | 0.97 |
| Pairwise comparison | - | A | - |
| Reflection depth | |||
| Mean | 2.69 | 3.17 | 2.68 |
| Standard deviation | 1.22 | 1.07 | 1.12 |
| Pairwise comparison | - | AC | - |
| Genuineness | |||
| Mean | 3.10 | 3.54 | 3.07 |
| Standard deviation | 1.25 | 0.94 | 1.02 |
| Pairwise comparison | - | AC | - |
| Superficiality | |||
| Mean | 2.34 | 1.84 | 2.16 |
| Standard deviation | 1.17 | 0.80 | 0.99 |
| Pairwise comparison | B | - | - |
| Benefactor Effort | |||
| Mean | 2.68 | 2.98 | 2.48 |
| Standard deviation | 1.15 | 0.98 | 0.97 |
| Pairwise comparison | - | C | - |
Sample size: N = 236 (Backfired n = 76; Mixed Feelings n = 96; Buffered n = 64). Significance level for upper case letters (A, B, C): .05. Note: For each significant pair, the key of the category with the smaller column proportion appears in the category with the larger column proportion.
Disclaimer/Publisher’s Note: The statements, opinions and data contained in all publications are solely those of the individual author(s) and contributor(s) and not of MDPI and/or the editor(s). MDPI and/or the editor(s) disclaim responsibility for any injury to people or property resulting from any ideas, methods, instructions or products referred to in the content. |
© 2025 by the authors. Licensee MDPI, Basel, Switzerland. This article is an open access article distributed under the terms and conditions of the Creative Commons Attribution (CC BY) license (http://creativecommons.org/licenses/by/4.0/).
Copyright: This open access article is published under a Creative Commons CC BY 4.0 license, which permit the free download, distribution, and reuse, provided that the author and preprint are cited in any reuse.


