
Submitted:
03 November 2025
Posted:
04 November 2025
You are already at the latest version
Abstract
Cu-modified ferrites, prepared by solvothermal syntheses, at up to 200 oC, show the presence of copper metal particles, embedded in ferrite nanocrystalline particle agglomerates. Notably, these metallic copper micron sized crystallites are dramatically reduced in size, down to a few tens of nanometers, when part of the copper dopant is replaced by zinc. All materials are magnetic due to the presence of the cubic spinel phase, being ferrimagnetic, with a narrow hysteresis of 6 kOe for the largest particle size copper ferrite material of 15 nm, to superparamagnetic for the zinc-doped, 9-10 nm average particle size ferrite. The oxidant activity of the materials was studied in free-radical oxidation reactions (pH 7.4, physiological and pH 8.5, optimal for the generation of ROS) by the chemiluminescent method with: i) Fenton`s reagent (.OH, .OOH); ii) H2O2; iii) with O2.- radicals. All materials showed moderate inhibitory activities, converted to prooxidant at pH 7.4, except for the largest isolated copper particles containing material, which remained inhibitory. Materials antimicrobial potential was checked on Gram-positive and Gram-negative bacteria, Escherichia coli ATCC 25922 and Staphylococcus aureus ATCC 25923 via two classical methods namely the spot and well diffusion tests in agar medium. Тhe above tests included also a nanocrystalline CuO, tenorite, as a reference material too. Daphnia magna ecotoxicity test show that all investigated materials are rather toxic and since daphnia are a key component in freshwater ecosystems, the toxicity even at low concentrations may have significant consequences for the ecological balance. This requires careful monitoring and assessment of the possible use or disposal of these nanomaterials in the environment.
Keywords:
nanocrystalline ceramics
; superparamagnetism
; metallic copper particles
; antimicrobial activity
; ROS
; ecotoxicity
1. Introduction
At the lower limits of spatial atomic order, nanocrystalline materials incorporating bioactive elements in atomic/ionic forms and magnetic components or phase-separated surface deposited inclusions, offer a large and diverse framework of multifunctional materials. Considering mainly inorganic materials, these include metallic nanoparticles, simple and complex metal oxides. Properties originating from the reduced particles sizes, e.g. tissue/cell permeabilities and facile body release, relatively large specific surface area, abundance of active surface sites, are often combined with magnetism – ferro-/ferri- or superparamagnetism and biocompatibility to establish novel key applications in biomedicine [1,2,3]. These include hyperthermia and drug delivery [4], anticancer drug delivery agents [5] and direct cancer annihilation by multifunctional nanomaterials [6]. To complement the range of intensively studied applications, antimicrobial action and wound healing [7,8,9,10], drinking and industrial water disinfection and purification [11,12,13,14,15], radioactive species sequestration [16,17,18] should be noted as key points in the security and sustainability of modern clean environments. And yet more, the multifunctionality of many nanomaterials underpins their added value as “theranostics” where one property ensures their diagnostic capability while another - a therapeutic one [19,20,21]. The growing worldwide concern for antibiotic microbial resistance, and on the other hand, antibiotic environmental pollution, food and drinking water contamination by existing and new pathogens are already identified as the cause of death for nearly a million people per year with a gloomy perspective to increase dramatically in the forthcoming ears [22,23,24]. Thus, there are prominent and constant driving forces stimulating research on the discovery and development of novel environmentally friendly materials to replace/complement antibiotics, combat new pathogens and generally ensure clean and safe environment.
Known for centuries and one of the most explored bioactive species, particularly for its bactericide action, is silver [25,26]. Its active form may be of different type: ionic, charged and neutral cluster species as well as nanoparticles, carried on surfaces and in micropores [27]. We have studied the antimicrobial activity and toxicity of various silver species, dispersed in zeolites [28], and found that high content, e.g. >30% by weight, silver nanoparticles loaded zeolites possessed very high antimicrobial activity while an order of magnitude lower content Ag+ exchanged zeolite showed comparable bactericide effect. Both materials, namely Ag-Xcl(Na-X type zeolite) and SA25-Ag (ZSM-25 zeolite with Si-to-Al=25) appeared highly toxic against Daphnia magna [28]. While all materials, carrying predominantly either ionic silver species or nanoparticles showed decreased activity with the time of storage under ambient conditions, a clear conclusion on which exactly was the active species was not possible to draw. A scenario in which silver nanoparticles could also release more active ionic or cluster silver species at certain stages could not be excluded [28]. However, it is clear that a careful and accurate materials characterization, with suitable experimental techniques is essential for the successful development of these materials [29], taking into account that some species and materials as a whole may undergo structural changes due to the influence of the characterization probe as for instance the observed in our case silver reduction during X-ray analyses [28].
Zinc, with its ionic species mostly carried as a component in ZnO nanoparticles, is very popular due to a practical biocompatibility and have already found real life applications [30]. Despite the vast number of research works and research techniques employed, the exact mechanisms involved in the antibacterial action, in which cell growth is either terminated or inhibited, or tumor cell annihilation is observed, are not quite clear as often not clear is even what is the exact nature of the active species – ionic, clusters or nanoparticles. Various antibacterial action mechanisms have been considered particularly for zinc oxide nanoparticles [31] that may be generalized for all nanoparticles not excluding other possible mechanisms too. Although still debatable, the accepted main mechanisms of antibacterial activity include: i) Reactive Oxygen Species (ROS) generation [32], induced by ionic species in a zeolite carrier for instance [33], entering the bacteria cells. The role of singlet oxygen generation by nanoparticles has been noted in some studies [34,35] too; ii) the release of ionic species on its own or in conjunction with the ROS action has been considered [36]. Notably, the authors of the latter study [36] found that the bactericidal activity was rather directly related to the release of ionic species, Zn2+, whereas, the generation of ROS was not; iii) nanoparticle penetration through cell membranes and inhibition of cell metabolism [37] or direct i.e. mechanical cell membrane damage and leakage [38]. In other cases, it has been found that metallic nanoparticles may cause cell DNA damage [39]. Due to a holistic structure-activity approach and using a large experimental results database [40], metallic nanoparticles, including Co, Ni, Cu, Zn, Ag, Au, Pd, have been classified as toxic while W, Sn and Al nanoparticles have been classified as non-toxic [40]. The same study concluded that metal oxide nanoparticles of Ag2O, Co2O3, CoO, CuO, Cu2O, Mn2O3, Mn3O4, Er2O3, Ni2O3, Yb2O3 and ZnO are toxic. On the other hand, Al2O3, CaO, CeO2, Fe2O3, Ga2O3, Gd2O3, HfO2, MgO, MoO3, SiO2, SnO2, TiO2, WO3, Y2O3 and ZrO2 appear non-toxic. For medicinal and related applications, however, it is the active species concentration window that needs to be adequately determined. This would allow the use of a particular nanomaterial in concentrations that are harmless for the host, but detrimental for the targeted pathogens and especially drug-resistant strains. In this relation, large research efforts have been devoted on studying the biocompatibility of Fe3O4, MnFe2O4, ZnFe2O4 and other spinel structure nanosized materials with not only direct antibacterial properties. Others include controlled release drug carriers under pH activation, Magnetic Resonance Imaging (MRI) enhancement agents [41,42], tumor cells annihilation via hyperthermia where external alternative magnetic field is applied on the particles, causing local heating [43,44].
The iron oxide exists in three different forms, namely cubic spinel Fe3O4, space group Fd3m, known as the mineral magnetite, containing both di-and three valent iron species. Magnetite may be oxidized to form maghemite - γ-F2O3 which is a defect structure of magnetite, containing only trivalent iron in the same crystal lattice. At elevated temperatures, maghemite is converted to hematite - α-F2O3 with hexagonal lattice, space group Rc. Both magnetite and maghemite are ferrimagnetic, the latter being a defect structure of the other, with some vacant iron sites, due to the higher oxidation state.
Magnetite is perhaps the most studied iron oxide form for biomedical, but also many other applications related to its magnetic nature, for instance. The reason for this may be found in its flexible crystal structure, able to accommodate various other metal ions in the place of some of the iron ions. This on its turn provides a broader framework for the creation of materials with variable physicochemical properties, including bioactivity related ones. The corresponding crystal structure of magnetite may be also written as FeFe2O4, namely the cubic spinel with a general formula AB2O4, in its primitive cell representation, shown in Figure 1a, consists of two structural building blocks: 1) two tetrahedra form the sites A, i.e. AO4-6 units and ii) the voids in between the tetrahedra make four octahedral sites where the charge compensating B ions reside. Hematite, the thermodynamically most stable, nonmagnetic phase, shown in Figure 1b, consists of only octahedra. The spinel is called “normal” when all divalent ions reside in the A-sites and all three valent ions reside in the B-sites as is for ZnFe2O4 [45,46]. The spinel is called inverse, as is the magnetite, when half of the three valent iron ions are positioned in the tetrahedral sites while the divalent ions occupy half of the octahedral B-sites. Such inversed spinel is the nickel ferrite, while manganese ferrite is only partially inverse and in thermodynamic equilibrium under normal conditions 80% of the divalent ions reside in the A-sites [45,46]. However, in nanocrystalline versions of these materials, including other metal ion substitutes like Co, Cr, Cu, Ca, Li, various degrees of inversion are often observed.
In the present work, we have focused on copper-substituted ferrites which due to the well-known antimicrobial and generally toxic properties of Cu [47,48], CuO [49,50], Cu2O [50,51] and other copper-containing compounds with biological and medicinal functionalities [52,53], has the potential of combining the aforementioned biological properties with magnetism at the nanocrystalline level. Copper specifically, is very important to study, because of its possible crucial role in metals balance in the brain, affecting the development of Alzheimer’s dementia and Parkinson’s disease [47]. In its equilibrium bulk state, at temperatures below 427 oC, Cu-ferrite crystalizes in tetragonal unit cell, space group I41/amd. Above this temperature the compound adopts the cubic spinel structure [54,55]. The phase compositions and the tetragonal-to-cubic phase transition temperature have been studied in a number of studies as a function of particle size and synthesis routes, showing no definitive correlation between crystallite size and phase composition nor transition temperature [56,57,58,59,60]. Attempts to prepare the cubic spinel phase at near room temperature have led to obtaining two-phase samples or even expelling part of the copper in tenorite extra phase [59,60]. The potential biological applications of copper ferrite, and particularly the cubic spinel phase have already attracted research interests. It has been found, for instance, that increasing the copper content in cobalt ferrite nanoparticles, substantially enhances their antimicrobial activity [61]. While the authors of the study assumed pure cubic spinel phase materials for all anticipated stoichiometries, in their diffraction patterns is seen the presence of extra reflections. These were identified as due to CuO, tenorite phase in another study on the synthesis of copper ferrites at different pH values [62]. Notably the amount of the extra CuO phase increased upon changing the synthesis pH from 12 down to pH 8 [62]. Thus, a hypothesis in which the active component actually is copper monoxide, tenorite, [49,62] with an increasing amount that correlates well with the enhancement of the observed antimicrobial activity [62] seems reasonable. The stable tetragonal form of copper ferrite, on the other hand, has been tested alongside zinc ferrite too, showing high antioxidant and antibacterial efficacy [63] further promoting the possible bio and medicinal applications of copper dopped ferrites. Remarkably strong bactericide action has been observed for Cu(I) species formed at the surface of copper ferrite nanoparticles via partial reduction by hydroxylamine (NH2OH) treatment [64]. Regardless of the exact crystallographic phase, but rather due to the electronic state of the active, in this case ionic surface species were able to generate ROS at high constant rates inside microbial cell bodies [62]. Quite often, at the scales of a few nanometer particles and when biological functionalities are targeted [65,66], including key functions activation under near infrared irradiation [67], the cubic spinel polymorph of copper ferrite has been assumed and seemingly observed, usually by PXRD, as the dominating and consequently the active material form. To elucidate further the role of the materials crystalline state and order, we have focused on the microstructural and magnetic properties of our copper containing ferrite materials as key factors responsible for biologically important functionalities such as bactericide action, redox activity and ecotoxicity. As mentioned earlier [32], special attention was given to the generation of ROS and prooxidant activity as an important biomarker of the antibacterial activity and the oxidation level inside of the organism. On the contrary, low levels of these reactions and products are usually demonstrative for antioxidant (inhibitory) effects[68,69].
2. Results and Discussion
XRPD data of the dry powder materials are shown in Figure 2 over most of the observable diffraction intensity for these structures. As seen in the same figure, for samples CuFeO_1A, CuZnFeO_2A, and CuFeO_4A, the scattered integral intensity is dominated by the magnetite cubic spinel phase as indexed in the diffractogram of CuFeO_1A, in Figure 2. Sharp extra peaks of secondary phase are identified as metallic copper (SG. Fm3m, 224), by the presence of the most intense reflections (111), (200), and (220), Figure 2. The diffractogram of the CuFeO_3A material is dominated by the most stable α-Fe2O3 phase, namely hematite, hexagonal space group Rc (No. 167). This is shown alongside a computed diffraction pattern for better identification of the measured reflexes since there is some coincidence with those of the cubic spinel phase. This sample contains significant amounts of the cubic spinel phase too, as indicated by the presence of the (220), (311), (333), (511) and (440) reflexes. Notably, no metallic copper is observed in the PXRD profile of this sample.
On the other hand, the lattice parameters of the cubic spinel phases in samples CuFeO_1A and CuFeO_4A are very close to those of pure magnetite Fe3O4 [70,71,72] while that of CuZnFeO_2A agrees quite well to the lattice parameter of nanocrystalline ZnFe2O4 [73,74]. Better insight at the diffraction patterns, around the metallic copper phase reflections are provided in the supplementary material, Figure S1. An example profile fitting to extract the constituent phases crystal lattice parameters is shown in Figure S2.

Table 1.
Samples identification and physical parameters: Given is the lattice parameter of the conventional cubic Bravais unit cell, representative crystallite size from the Scherrer dependence of the line (333) broadening, the maximum attained magnetic moment, Mmax, at 6000 Oe, and the coercitivities, HC.
| Sample | Phase | Latt. Par., [Å] | Cry. Size, [nm] | Mmax, [emu/g] | HC, Oe |
|---|---|---|---|---|---|
| CuFeO_1A | Magnetite+Cu | 8.36(7) | 15 | 56 | 89 |
| CuZnFeO_2A | Magnetite+Cu | 8.428(5) | 9 | 27 | 0 |
| CuFeO_3A | Hematite + Magnetite | 5.03(0), 13.76(4), 8.34(6) | n.a. | 22 | 16 |
| CuFeO_4A | Magnetite+Cu | 8.37(7) | 11 | 46 | 0 |
These observations suggest that only very small amounts of copper may have entered the spinel crystal structures, and most of the copper has precipitated in the form of metallic particles. The estimated X-ray particle sizes of the cubic spinel ferrite phases agree well with the High-Resolution Transmission Electron microscopy (HRTEM) observations. Notably, the observed PXRD reflections of the cubic copper phase in CuFeO_1A and CuFeO_4A samples, contain no sample line broadening. On the contrary, and although following very similar synthetic procedure as for CuFeO_4A, in the CuZnFeO_2A material the copper phase reflections are significantly broadened, comparable to the host spinel phases, as seen in Figure 2. Clearly, the metallic phase in this sample is nanocrystalline too, with an average crystallite size about 25 - 30 nm, as derived from the corresponding diffraction line broadening. HRTEM images for three of our samples are shown in conventional – Figure 3 a, b, and c and in high-resolution mode – in Figure 3. d, e, and f. The macroscopic morphologies of the samples are visualized in the first set evidently showing a relatively uniform size distribution. Sample CuFeO_1A contains larger nanoparticles with average sizes in the range of 15-20 nm, whereas samples CuFeO_4A and CuZnFeO_2A consist of nanoparticles with average diameters of 5-10nm. In the high-resolution mode TEM images – Figure 3 d, e, and f., the lattice planes can be seen clearly for each visible grain/particle, which proves that all samples are nanocrystalline, even those with particle sizes down to 5 nm. Scanning electron (SEM) images of only the Cu-containing samples were collected, searching for metallic copper particles (no such particles were expected in CuZnFeO_2A due to the PXRD results, Figure 2.), and are shown in Figure 4. These elucidate the presence of copper metal particles in the form of fine well shaped micron sized crystallites in samples CuFeO_1A and CuFeO_4A. Details of the corresponding EDS analyses and element distribution mapping are provided in the Supplementary information file.
On the other hand, no well-defined copper metal particles are seen in the SEM images of the CuFeO_3A material, with presence of the copper spectrum spreading on parts of the sample as seen in the corresponding element map more like an irregular surface coating. We recall, that all powder materials were collected from their mother liquors and out from the washing solvent using a magnet. However, clearly not only magnetic phases present in the collected powders and upon visual inspection no powder material had remained in the corresponding liquid solutions. Hence, the magnetic and nonmagnetic phases must be incorporated one into the other. Furthermore, all four materials appear dark brown to black while pure hematite is orange-reddish.
Copper substituted hematite materials have been studied before [74,75,76,77] showing that its hexagonal phase takes up to 5-6 % wt Cu(II) [75,76,77] and above metallic copper is precipitated [75]. The determined lattice parameters in our hematite phase, on the other hand, agree quite well with those of pure hematite [75,77] and we might then again assume that the CuFeO_3A materials is a composite of hematite, magnetite and nanostructured copper and or copper oxide phases. Note that if the copper oxide phase consists of very small, a few nanometers sized crystallite, and not very high amount, this would preclude its clear observation in the PXRD pattern. The antibacterial activity of Cu-doped hematites, in particular, clearly increases with the increase of the copper content [75] further confirming that most likely released Cu-ionic species are the bactericide active component.
2.1. Magnetic Properties
All samples show magnetic properties at room temperatures. Sample CuFeO_1A has the highest maximal magnetization of 56 emu/g (at 6 kOe – the maximum field intensity available on the instrument) and the largest coercivity. Its behavior is ferrimagnetic typical for the ferrite materials. On the other hand, sample CuFeO_4A has practically zero coercivity and is therefore superparamagnetic, attaining a maximal magnetization of 46 emu/g, at 6 kOe. The observed relatively high magnetization is most likely due to the good crystallinity of the nanoparticles seen on the HRTEM images too, as shown in Figure 3. These magnetic properties - high magnetic moment and zero coercivity are quite suitable for biomedical applications such as drug deliveries. One can see from the TEM images that sample CuFeO_1A consists of larger particles above 15 nm in diameter, whereas sample CuFeO_4A consists of particles less than 10 nm in diameter. Particles less than 10nm are very likely to be superparamagnetic, which explains the difference in the magnetic properties of the abovementioned samples.
Figure 5.
Magnetic hysteresis loops measured at room temperature. The inset shows the region of small magnetic fields to visualize the hysteresis effects.
Figure 5.
Magnetic hysteresis loops measured at room temperature. The inset shows the region of small magnetic fields to visualize the hysteresis effects.
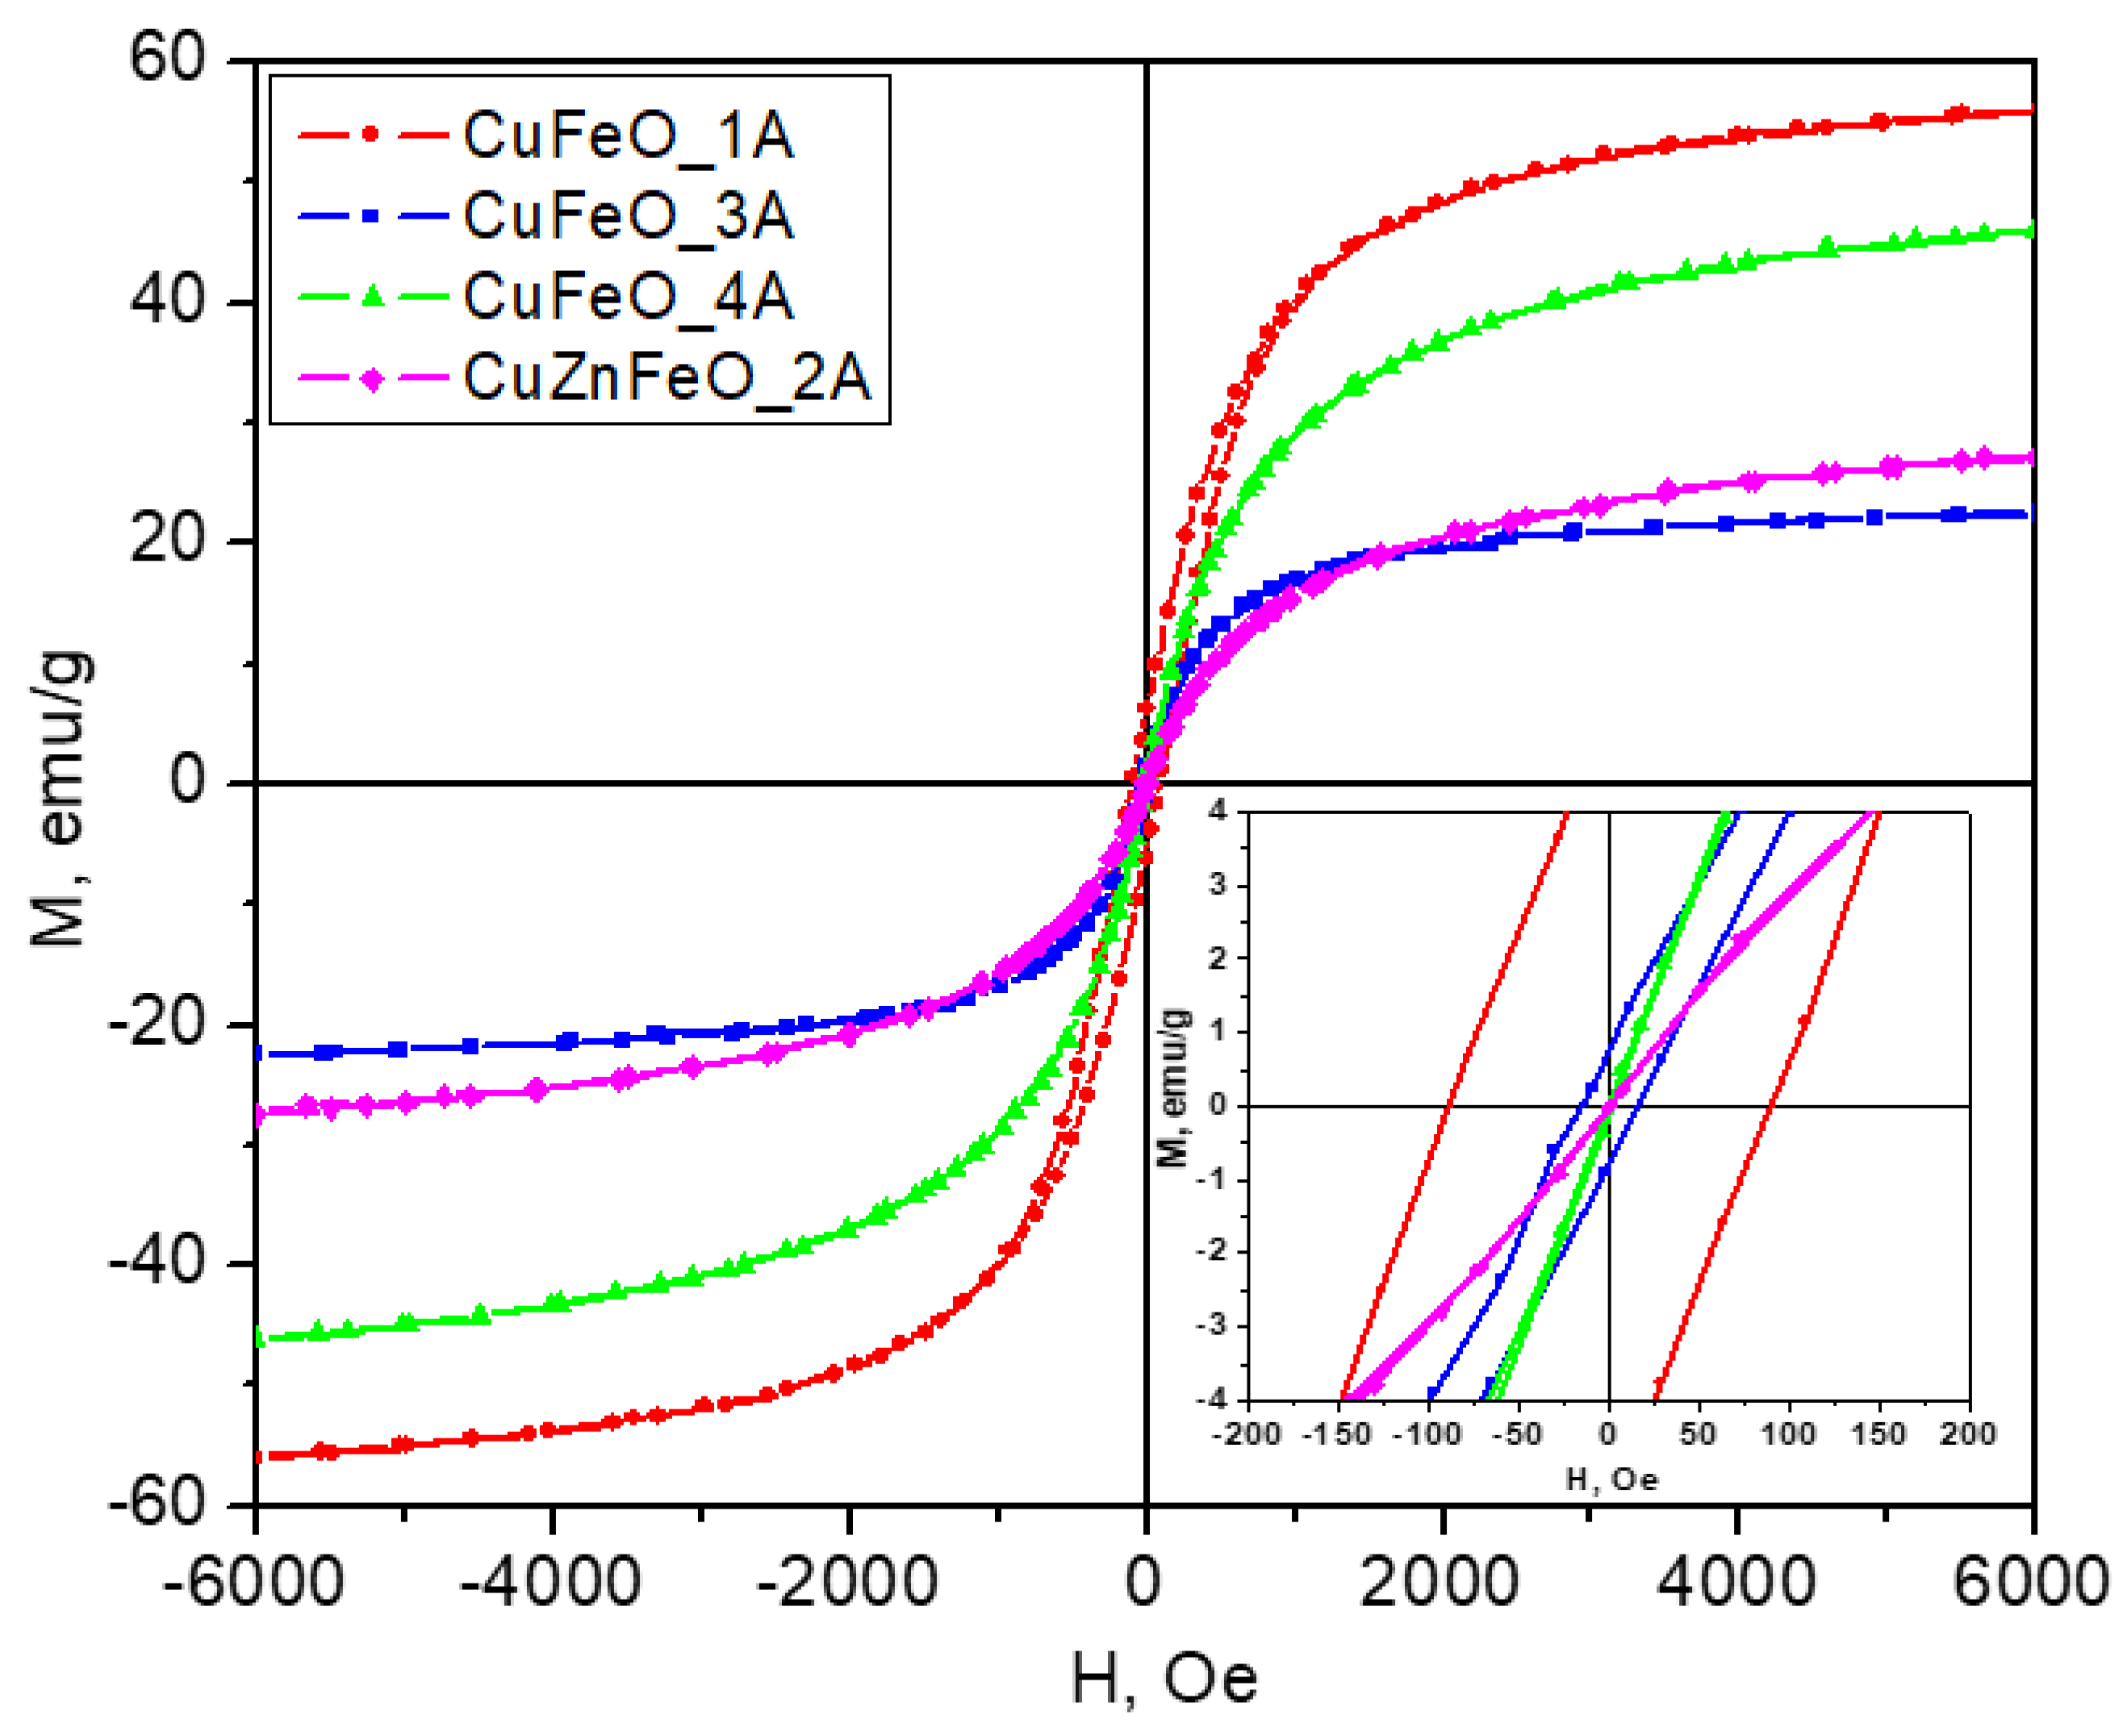
The CuFeO_3A material is ferrimagnetic at room temperature, with a maximal magnetization much lower than for CuFeO_1A, by about a factor of three and a factor of two lower than that of CuFeO_4A, indicating that the magnetic phase quantity in this material must have been reduced by the corresponding amount, which generally agrees with the PXRD observation. This is mainly due to the predominant existence of the antiferromagnetic phase at room temperature [78,79] hematite phase in this sample, thus reducing the overall net magnetic moment. Note that the antiferromagnetic state shows only weak paramagnetism in external magnetic fields and hence contributes a negligible amount to the magnetization of the material, only at high external field intensity values. The addition of Zn in the copper ferrite structure – sample CuZnFeO_2A, results in a purely superparamagnetic properties at room temperature, presumably due to the small size of the nanoparticles, mostly less than 10 nm, as seen in the TEM images, Figure 3. It is worth noting that since no extra zinc-containing phases are detected, the spinel phase must be a Zn-substituted ferrite, e.g. ZnxFe1-xFe2O4 which is known ferrimagnetic at ambient temperatures, in contrast to the stoichiometric normal spinel ZnFe2O4 which would be paramagnetic above 10 K [45,46]. However, at the nanoscale, and when prepared at relatively low temperatures, some inversion degree in ZnFe2O4 may exist too, converting the material into a ferrimagnet at room temperatures too [46]. Since this material too contains diamagnetic copper metal phase, Figure 2, a corresponding reduction in the expected magnetization should be expected.
2.2. Redox Activities
To study the effect of the newly synthesized materials on the kinetics of free-radical oxidation reactions, we applied the activated chemiluminescent method using the probe lucigenin in three model systems [80]. Usually medium with higher alkalinity favors radical generation and enables the achievement of reliable measurements and comparable differences. Two different pH levels were tested - pH 7.4 and pH 8.5, physiological and alkaline (favoring ROS generation). Three ex vivo model systems were implemented in buffer solutions [80]. As for the other biological studies below, an own nanocrystalline CuO (nCuO) material was tested along with the Cu-ferrite materials as an informal reference. Its structural characteristics, by means of PXRD and TEM data are provided in the Supplementary information file Figure S3.
2.2.1. System I
The Fenton`s reaction between Fe2+ ions and H2O2 produces highly reactive, short-living radicals. Usually, the achieved chemiluminescent emission is much higher than the one from other mixtures:
- (1)
- Fe2+ + H2O2 → Fe3+ + ·OH + −OH
- (2)
- Fe3+ + H2O2 → Fe2+ + ·OOH + H+
At pH 8.5 all the observed reactions, except the control, possessed similar kinetics – it was like a plateau, slightly increasing with time. That was indicative for the ROS taking part in the reaction and released in the solution with time. The control reaction emitted highest signal (100%), maximum ~77340 RLU. All the tested materials presented definitive suppression and strong inhibitory activity against the specifically generated ROS. CuFeO_1A showed lowest inhibition – 6.5 times; CuZnFeO_2A presented a stronger inhibition ~25 times; CuFeO_3A and CuFeO_4A suppressed the signal 128 and 113 folds; the signal detected from nCuO was 56 times lower than the control, Figure 6 [28,69,80].
At pH 7.4 (physiological), the kinetic curves were not smooth and had various fluctuations. But all tested materials suppressed the chemiluminescence signal and also presented inhibition: CuFeO_1A – 4.5 fold, ZnCuFeO_2A – 4.2 fold, CuFeO_4A and nCuO – 5% and 16% inhibition respectively; CuFeO_3A had no effect, Figure 6. When the signal is suppressed, this is indicative for the neutralization of the present in the system ROS and hence indicative of antioxidant/inhibitory properties of the material. On the contrary, in the reactions where the signal is higher than the control – the material is oozing metal ions or other reagents, forming ROS or others, taking part in the chosen reaction.
2.2.2. System II
In this system, the strong oxidant hydrogen peroxide serves both as an oxidizing agent and a ROS. At alkaline pH, the kinetics curves are smooth and the signal in all the reactions was increasing slightly in time. The control system emitted most light. All the other tested samples demonstrated strong inhibition on the reaction: CuFeO_1A – almost 4 times, CuZnFeO_2A – 28 times, CuFeO_3A – almost 63 times, CuFeO_4A – 88 times (highest inhibition), nCuO – 28 times (similar to CuZnFeO_2A), Figure 7 [28,69,80]. This is indicative that all tested materials efficiently suppress oxidation by H2O2 at alkaline conditions.
At pH 7.4, all tested materials confirmed their inhibitory properties against H2O2. CuFeO_1A, CuZnFeO_2A and CuFeO_4A reduced the chemiluminescent signal 3 times, CuFeO_3A – 2 times, and nCuO – almost 6 times. The kinetic curves presented fluctuating plateaus, Figure 7. H2O2 always acts as a strong oxidizing agent, even at very low concentrations.
The described and confirmed by the above results antioxidizing H2O2 activity of the tested materials suggests that they can effectively scavenge or decompose this ROS under physiological conditions too. This behaviour implies redox-modulating properties that could be beneficial in reducing oxidative stress in biological environments. Such inhibition of H2O2-induced oxidation indicates that these metal oxide composites may act as efficient antioxidant mimetics, possibly through surface redox reactions.
2.2.3. System III
The O2.– generation in this system is following the chemical scheme of Nishikimi et al. [81,82]:
PhMS + NAD.H + H+ --> PhMS.H2 + NAD+
PhMS.H2 + PhMS --> 2PhMS.H.
PhMS.H. + O2 --> PhMS + O2.- + H+
The superoxide radical is extremely short living and very aggressive.
At pH 8.5 all the tested materials demonstrated once more inhibitory properties and effective neutralization against the generated ROS. Their inhibition activity was as follows: CuFeO_1A - 8.8 times; all the other materials presented close effects – less or more than 2 folds inhibition of the reaction. The kinetics curves were fluctuating in a plateau shape, Figure 8 [28,69,80].
At pH 7.4 (physiological) the observed inhibitory activity was converted into prooxidant. That effect was observed only in that oxidation model system and conditions. The prooxidant effects varied between 1.6 and 2.4 times with respect to the control in the sequence: CuFeO_1A, CuZnFeO_2A, CuFeO_3A and nCuO. Inhibitory properties in those conditions, possessed only CuFeO_4A, decreasing the chemiluminescent signal less than 2 times with respect to the control. The kinetics curves were fluctuating in a plateau shape too, Figure 8. The effects observed for all tested materials were stable in time.
In comparison to the control reactions, the efficiency of the investigated materials can be summarized as follows, Table 2:
All the observed effects demonstrate that most of these materials do not provoke the accumulation of ROS and would not burden the physiological processes that are connected with their generation, breaking the extremely sensitive oxidation equilibrium in the body. Most of them exhibited very well-defined inhibitory effects against the already generated ROS, stable in time. All tested nano-ceramic materials showed clear inhibitory/antioxidant activity, especially at alkaline pH (8.5), effectively suppressing ROS generation and oxidation reactions. The inhibition was pH-dependent, being stronger under alkaline conditions than at physiological pH (7.4). Overall, the materials did not promote ROS accumulation and maintained redox balance, indicating good physiological compatibility and stable, time-persistent effects suitable for redox-modulating applications.
2.3. Antimicrobial Activities
The results from the antimicrobial tests, summarized in Table 3 and Table 4, evidence similar activity of copper containing ferrite nanoparticles for both Gram-positive and Gram-negative bacteria. The used as a reference nanocrystalline tenorite powder (nCuO) was by a factor of 10 more toxic than the composite ferrite – the minimal bactericidal concentration (MBC) on both bacteria Table 3 and Table 4. S. aureus ATCC25923 is somewhat more resistant as CuFeO_1A and CuFeO_3A had no effect on it, in concentrations of 10 mg/ml, in contrast to E. coli ATCC25923. The other two materials, CuFeO_4A and CuZnFeO_2A, had similar effect on both bacteria: with Minimal Bactericidal Concentration (MBC) of 10 mg/ml and Minimal Inhibition Concentration (MIC) of 5 mg/ml. These results suggest higher biocompatibility of CuFeO_1A and CuFeO_3A, and a lower one for CuZnFeO_2A and CuFeO_4A. Our present results may be directly compared to previous studies with the same system [67], in which the authors also observed higher sensitivity of E. coli to the presence of the copper containing ferrites than S. aureus. Notably, the copper ferrite materials in that earlier study [67] showed very much improved antibacterial efficiency when irradiated by monochromatic IR light (808 nm) being able to absorb and convert that extraordinarily efficiently as high as nearly 29% [67], quite surprising for a semiconductor with a band gap around 2 eV [87,88]. A closer inspection of the PXRD data presented in Figure 2g in Ref. [67], reveals the presence of very sharp, high intensity lines on top of the (400), (200), and (533) spinel reflexes, much sharper than the (220), (311), (511), and (440) lines which are clearly very much broadened due to the nanocrystalline character of that material too [67]. The sharp intense lines in that study too coincide with the (111), (200) and (220) lines of metallic copper and in fact the corresponding diffractogram is very similar to that of our CuFeO_4A material, Figure 2, in the present study.
The presence of extra phase - metallic copper in [67], on the other hand, could mean that the nanocrystalline majority phase is actually Fe3O4, magnetite, or the same with little copper substitution in which case the band gap would drop down to 0.1 – 0.3 eV [89 and references there in], making the material a very good absorber in the IR range. This would mean however that those authors actually investigated some magnetite Fe3O4 (explaining also the high magnetization values) along with the presence of large metallic copper crystallites [67] and the extraordinary IR light to heat conversion efficiency (and the corresponding bactericide efficiency under IR) may be due to a cooperative effect between the magnetite nanocrystalline material and metallic copper which is a plasmonic metal too. However, in our studies, all of the copper containing materials on their own, i.e., without external assistance, behave as a rather weak bactericide agents.
2.4. Ecotoxicity
The results of the experiments with CuFeO _1A, Figure 9, showed that at high concentrations (25 and 10 mg/L) daphnia were alive during the first 6 hours (100% survival). After 24 hours, survival dropped sharply to 0% and remained so at the 48th hour. This indicates strong toxicity with a rapid lethal effect that occurred after the 6th hour. At 5 mg/L, daphnia remained 100% alive during the first 6 hours. After 24 hours, survival was 50% and remained at this level at the 48th hour. This result indicates moderate toxicity at this concentration. That is, CuFeO_1A exhibited pronounced toxicity on daphnia, with mortality occurring mainly after 6 hours and increasing up to 24 hours. The toxic effect was strongly concentration-dependent, with complete mortality at 10 and 25 mg/L and partial at 5 mg/L. The control showed that the toxicity was due to the substance, not the conditions. A LC₅₀ for CuFeO_1A was calculated based on the data obtained, for 24 and 48 hours (since there is significant mortality there). Here 50% mortality is exactly at 5 mg/L, so LC₅₀ (24 and 48 hours) ≈ 5 mg/L. The LC₅₀ value of about 5 mg/L indicates that CuFeO_1A is significantly less toxic than the CuZnFeO_2A, whose LC₅₀ was about 0.042 mg/L. This suggests that CuFeO_1A may be safer for the environment, but still has moderate toxicity and should be handled with care.
Figure 10 reflects the results of treatment of D. magna with CuZnFeO_2A, showing that at a high concentration (5 mg/L) 90% of daphnia remained alive during the first 6 hours. After 24 hours, survival dropped sharply to 0%, and did not recover after 48 hours. This indicates a strong toxicity of this concentration, causing mortality almost entirely after the first day. At an average concentration (0.5 mg/L) during the first 6 hours, survival was also high (90%). After 24 hours, survival dropped to 40%, and at the 48th hour – to 20%. The toxic effect occurred more slowly and was not completely lethal at these concentrations, but it was significant. At a low concentration (0.05 mg/L), survival during the first 6 hours was 90%. After 24 hours, it dropped to 60%, and at 48 hours – to 40%. There is still significant toxicity, but the effect was weaker compared to higher concentrations. Therefore, CuZnFeO_2A had a toxic effect on daphnia, which was mainly manifested after the first 6 hours of exposure. Toxicity is concentration-dependent - higher concentrations cause faster and greater mortality. At the 48th hour mortality ranged from 60% at 0.05 mg/L to 100% at 5 mg/L.
The toxic effect of CuZnFeO_2A was not instantaneous, but developed over time, probably due to accumulation or a delayed cellular/molecular response. The toxic effect was strongly concentration-dependent. A LC50 of ~0.0417 mg/L was calculated which indicates that even low concentrations of CuZnFeO_2A are toxic to daphnia. The control group (without nanoparticles) showed 100% survival at all times, confirming that mortality was due to CuZnFeO_2A exposure. The ecological significance is related to the fact that daphnia are a key component of freshwater ecosystems and the toxicity of ZnCuFe_2A, even at low concentrations, can have significant consequences for the ecological balance. This requires careful monitoring and assessment of the possible use or disposal of these nanomaterials in the environment.
In Figure 11, the results of the time dynamics of CuFeO_3A toxicity showed that at 5 mg/L, survival droped in the first few hours — from 100% to 70%, after 2 hours, and reached 50% at 4–6th hours, after which by the 24th and 48th hours survival was nil.
At 0.5 mg/L there was also a visible decrease in the first 6 hours, with 50% survival at 5–6 hours, and complete mortality at the 24th and the 48th hours. At 0.05 mg/L there was no mortality for up to 6 hours, but after 24 hours survival droped to 50%, and at the 48th hour — to 30%, which indicates a delayed toxic effect at the low concentration. The control was stable with 100% survival. Regarding the concentration and time-dependent effect, it is clear that the toxicity of CuFeO_3A is influenced by the concentration and time. The higher the concentration, the faster and more severe the mortality occurs. At low concentrations (0.05 mg/L) the toxic effect was delayed and was smaller, but still significant after 24-48 hours. The LC50 (for 48 hours) was calculated by linear interpolation for LC50 (between 0.05 and control). LC50 (48 hours) ≈ 0.036 mg/L CuFeO_3A. It is evident that CuFeO_3A is highly toxic to daphnia, with its toxicity being similar to that of CuZnFeO_2A (LC50 around 0.04 mg/L). Toxicity was also manifested as an acute effect at higher concentrations (mortality within 6 hours) and more delayed at low concentrations. The control confirmed that mortality is due to exposure to CuFeO_3A.
The results regarding the time dynamics of CuFeO_4A toxicity, Figure 12, showed that at 5 mg/L and 0.5 mg/L there was a gradual decrease in survival within the first 6 hours. At 5 mg/L, survival droped from 100% to 60% in 5-6 hours. At 0.5 mg/L, the drop was even more drastic – 30% at the 6th hour. After 24 and 48 hours, at all concentrations, survival was 0%, i.e., complete mortality. The concentration-dependent effect showed that higher concentrations lead to faster and stronger toxicity. Even the lowest concentration (0.05 mg/L) caused complete mortality within 24 hours, although during the first 6 hours, survival was about 90%. Since mortality was 100% at all concentrations tested at the 24th and 48th hours, it was not possible to calculate LC50 from these data, because even at the lowest concentration mortality was complete. Therefore, CuFeO_4A is very toxic to daphnia, even at the lowest test concentration (0.05 mg/L) resulting in 100% mortality within 24 hours. Toxicity began within the first few hours, but the effect was delayed, with a gradual decrease in survival. For a more accurate determination of LC50, it is necessary to study lower concentrations (below 0.05 mg/L). The control test confirmed that the mortality was caused by the exposure to the presumed active substance.
Treatment of D. magna with nCuO showed 100% survival of daphnia in the control group at all time points, Figure 13, confirming that there were no external factors affecting mortality. At the lowest concentration (0.0005 mg/L) there was no observed effect on survival. All daphnia survived (100%) for 48 hours. This is probably the NOEC (No Observed Effect Concentration). At a concentration of 0.0031 mg/L there was no effect until the 5th hour, but from the 6th hour onwards 10% mortality (90% survival) was observed. There was no further deterioration until the 48th hour. This concentration can be defined as the LOEC (Lowest Observed Effect Concentration). At the highest concentration (0.0125 mg/L), 100% survival was observed by the 5th hour, 90% by the 6th hour, and a decrease to 80% by the 48th hour. It is clear that the exposure time enhances the toxic effect of the nanoparticles. Therefore, time- and dose-dependent toxicity of nCuO nanoparticles to daphnia was observed. The higher the concentration and the longer the exposure, the greater the mortality. The concentration of 0.0005 mg/L can be considered safe (NOEC) for the period of 48 hours. The concentration of 0.0031 mg/L showed the onset of toxic effect (LOEC). 0.0125 mg/L already lead to significant mortality with prolonged exposure. We did not access concentrations at which the mortality was above 50%, i.e., there was no clear zone around LC50. The highest mortality we observed was 20% (at 0.0125 mg/L). Therefore, LC50 > 0.0125 mg/L, but we cannot provide an accurate estimate at this point. This substance can be classified as non-toxic or weakly toxic to daphnia.
Table 5.
Summary of the LC50 (48 h) for the tested substances on Daphnia magna.
| No. | Material | LC50 (48 ч) [mg/L] | Toxicity class* |
|---|---|---|---|
| 1 | CuFeO_1A | ~5.0 | Moderately toxic |
| 2 | CuZnFeO_2A | ~0.042 | Highly toxic |
| 2 | CuFeO_3A | ~0.036 | Highly toxic |
| 5 | CuFeO_4A | <0.05 (100% lethality) | Highly toxic |
| 6 | nCuO | >0.0125 (n.d. LC50) | Nontoxic/weakly toxic |
*Substance LC50 (48 h) [mg/L].
OECD/REACH toxicity classes (a simplified scheme for categorizing the toxicity of substances based on LC50).
• LC50 ≤ 1 mg/L → Very toxic
• 1 < LC50 ≤ 10 mg/L → Toxic
• LC50 > 10 mg/L → Slightly toxic
• LC50 not reached → Slightly or non-toxic
The ultimate recipient of nanoparticles, including various types of copper-based nanoparticles is the aquatic environment [83]. These recent results on nanoparticle ecotoxicity, with respect to an anticipated increased production, especially as a component of antimicrobial agents, raises concerns about their uncontrolled release into the environment and the subsequent ecological risks. The high reactivity of Cu-based particles allows interactions with biotic and abiotic components of the environment, leading to bioaccumulation and disruption in living organisms. Increasing the concentration of Cu-based particles causes various toxic effects, mainly by inducing oxidative stress, disrupting antioxidant mechanisms, damaging cells and tissues, and slowing growth. The need for further research on their toxicity and measures to control their release into the environment is emphasized. Given the limited data on the toxicity of copper-based nanoparticles, additional studies are needed. Some earlier studies [84] found that at low exposure concentrations of Cu nanoparticles and ZnO nanoparticles (below 0.05 and 0.5 mg/L, respectively), accumulated mainly dissolved ions, while at high exposure concentrations (above 0.1 mg/L and 1 mg/L, respectively), particles rather than released ions played a dominant role in the accumulation process. The toxicity and accumulation of Cu as well as ZnO nanoparticles in Daphnia magna depended on the particle size, exposure concentration, and routes of uptake by the organism. Metal nanoparticles can inhibit the growth and reproduction of D. magna, with effects that differ depending on whether they are particles, dissolved ions, or mixtures. The results of another study [85] showed that nCu was toxic in all endpoints. The 48-hour median lethal concentration of nCu was 0.63 mg/L. Significant inhibition of the reproduction and growth of D. magna was found. A concentration-dependent decrease in filtration and uptake was observed, which was consistent with the inhibition of the reproduction and growth of D. magna. Biochemical response tests showed an increase in GST activity and a decrease in AChE activity, while SOD and CAT activities increased at low concentrations and decreased at high concentrations for all exposures. These results confirm that nanosized Cu and Cr can have negative effects on Daphnia magna at various levels [85]. As far as our study is concerned, a special note is withregard to the CuFeO_3A material, which appears most toxic while at the same time we did not observe the explicit presence of copper-based phases in the corresponding diffraction pattern, represented in Figure 2. The reason hence, may well be that in that sample non crystalline or very small, at the nanoscale copper and/or copper oxide phases, have been formed which are more toxic than the larger crystallite copper of nCuO.
The accumulation in the antennae of Daphnia magna during our tests is additionaly illustrated in Figure S2.
3. Materials
Fe(Cl)3.6H2O, CuCl2, ZnCl2 and NaOH all >99% purity metals basis and 25%wt NH4OH from AnalytiChem Belgium NV were used along with extra pure, SLR grade Ethylene glycol from Fisher scientific, and PEG6000, SigmaAldrich.
The materials used in the chemiluminescent study were purchased with high purity: iron sulphate (p. a.) (Merck, Germany), hydrogen peroxide (30%) (Merck, Germany), phenazine methosulfate (PhMS) (N-methyldibenzopyrazine methyl sulfate salt) (p. a.) (Merck, Germany), lucigenin (bis-N-methylacridinium nitrate) (p. a.) (Sigma-Aldrich, USA), β-nicotinamide adenine dinucleotide, reduced form (p. a.) (NAD.H, Boehringer, Germany), dimethyl sulfoxide (p. a.) (DMSO, Sigma-Aldrich, USA), buffers pH 8.5 and pH 7.4 (Sigma-Aldrich, USA). All chemicals were used as-purchased.
4. Methods
4.1. Nanocrystalline Materials Preparation and Characterization
The synthesis procedures for the investigated nanopowders were similar as those reported in [67] with minor modifications. All details are given in the Supplementary information file accompanying this article.
The phase composition of the synthesized materials was checked by X-Ray Powder Diffraction (XRPD) using an URD-6 diffractometer, Freiberger Präzisionsmechanik GmbH, Rich. Seifert & Co. GmbH &Co. KG, Freiberg, Germany, using a Cu radiation source and a graphite crystal monochromator at the detector side. The X-ray source was operated at 35 kV and 20 mA. Powder diffraction patterns were collected with a 2θ step of 0.05 degrees, and 10 seconds counting time per step. Coherent scattering length (crystallite size) was estimated from the broadening of the well-separated (333) diffraction line of the spinel phase, using Scherrer’s equation:
In which K is the Scherrer’s constant (0.9), λ is the radiation wavelength of the copper source, β is the Full Width at Half Maximum (FWHM) in radians of 2θ.
Transmission Electron Microscopy (TEM) was performed on a high-resolution, 200 kV STEM
JEOL JEM 2100 instrument with JEOL, Akishima, Japan. TEM images were recorded usinga CCD camera (GATAN Inc., Pleasanton, CA, USA). Scanning Electron Microscopy (SEM) was performed on a TESCAN Lyra I XMU equipped with a Bruker, Quantax 200 X-ray Energy Dispersive Spectrometer (EDS).
Magnetic properties were characterized using a Vibrating Sample Magnetometer (VSM) at room temperature, with maximal magnetic field of 6 kOe. The samples were prepared by compressing the powder into cylindrical quartz containers so that the particles could not move during the measurements.
4.2. Chemiluminescent Assay
The first system was Fenton`s. It was generating .OOH and .OH radicals: it contained 0.2 mol of sodium hydrogen phosphate buffer, with the chosen pH, Fenton’s reagent: FeSO4 (5.10−4 mol) - H2O2 (1.5%), lucigenin (10−4 mol) and the tested material (1 mg/ml).
The second system contained the strong oxidant hydrogen peroxide (H2O2): 0.2 mol sodium hydrogen phosphate buffer, with the chosen pH, H2O2 (1.5%), the chemiluminescent probe lucigenin (10−4 mol) and the tested material (1 mg/ml).
The third system was generating superoxide radicals (O2.-) in the reaction NAD.H-PhMS: it contained 0.2 mol of sodium hydrogen phosphate buffer with the chosen pH, NAD.H (10−4 mol), phenazine-metasulfate (10−6 mol), lucigenin (10−4 mol) and the tested material (1 mg/ml).
The control samples presented blank reactions, where the tested new material was not applied. All reactions were monitored for 3 minutes, every 3 seconds, at 370C. All materials were sonicated for 60 min before application.
All experiments were performed in triple reproducible measurements. The statistical analysis is performed by Origin 8.5 and Microsoft Office Excel 2010 and the Student’s t-test, p ≤ 0.05, measured by LUMIstar Omega (BMG Labtech GmbH, Ortenberg, Germany, 2020).
4.3. Antimicrobial Activity Tests
The antimicrobial effect was tested on Gram-positive and Gram-negative bacteria, Escherichia coli ATCC 25922 and Staphylococcus aureus ATCC 25923, which were both supplied by the National Bank of Industrial Microorganisms and Cell Cultures (NBIMCC), Sofia, Bulgaria. The test microorganisms were grown in nutrient broth (NB Conda, Madrid, Spain) at 37 ◦C and 180 rpm for 24 h with 2 sub-cultivations to reach the exponential growth phase. The microbial density of the cultures was adjusted to 0.5 according to the McFarland standard and used for the antimicrobial tests. Two classical methods were used to study the antibacterial effect of the synthesized nanoparticles: spot and well diffusion tests in agar medium. Used microorganisms were obtained by National Bank of Industrial Microorganisms and Cell Cultures (NBIMCC). They were revitalized in nutrient broth (Conda, Spain) and subcultured two times to obtain exponential cultures. The bacterial suspension density was measured and justified to 0.5 according to McFarland on densitometer and 100 mkl of bacterial suspension was inoculated in 20 ml melted and cooled to 45 °C Nutrient agar (Conda, Spain). After solidification of the agar a bore holder was used to make 6 mm wells in the agar plate and 50 µL of the nanoparticles dispersions with different concentrations were dropped inside the wells. Petri dishes were kept for 2 h in a refrigerator at 4-5°C to provide diffusion of nanoparticles in the agar and after that incubated for 24 h at 37°C for development of bacterial cultures. The formed sterile zones around agar wells were measured and the antibacterial effect was assessed. The Spot - test was conducted with the same nutrient media and bacteria, but the inoculation of bacterial suspensions was on the solid nutrient agar. 5 µL drops of nanoparticle suspension was used and after 2 h diffusion in refrigerator Petry dishes were incubated for 24 h at 37°C The development of bacterial cultures was assessed and compared with the results of the diffusion test. It seems that direct contact between nanoparticles and bacteria give more precise results than the agar diffusion test.
4.4. Environmental Toxicity by Testing the Lethality of Daphnia Magna
Acute ecotoxicity tests were conducted using Daphnia magna (Cladocera, Crustacea) for all types of materials, which were applied in three concentrations with three replicates and two controls (untreated daphnia). Daphnia magna toxicity test was conducted according to the Acute lethality toxicity protocol OECD (2004) and Guideline for the testing chemicals Acute immobilization test (2012) Test No:202. Daphnia were grown in laboratory conditions. Readings were made at the 1st, 2nd, 3rd, 4th, 5th, 6th, 24th and 48th hours. For every experiment we used 10 daphnia in a glass with water, repeating each experiment three times. Percentage of survival data were handled within Microsoft Excel (LTSC MSO). Average survival percentage and the standard deviation were calculated for every group and time data point.
The mean survival rate (%) and standard deviation were calculated for each group and time point. The results are presented as mean ± standard deviation (SD). For the graphical representation, bar charts were used, with different colors indicating the concentrations, and the errors were visualized using error bars.
5. Summary and Conclusions
Our attempts to prepare nanocrystalline copper ferrite via solvothermal syntheses at relatively low temperatures resulted in obtaining composite materials, containing a majority phase of nanocrystalline ferrite spinel, agglomerating around relatively large well crystallized metallic copper particles. Clearly, at the applied syntheses conditions, Cu(II), being a significantly elongated Jan-Teller ion, does not fit in the otherwise flexible cubic spinel lattice, and the system minimizes its energy by expelling this species. Likely depending on the pH, the oxidizing/reducing nature of the environment, either metallic copper or copper oxides can be formed as more stable secondary phases. When zinc is also added to the starting solution, zinc-substituted ferrite was obtained, yet again nanocrystalline, but notably the phase separated metallic nanoparticles were also nanocrystalline. All of the freshly prepared materials possess ferrimagnetic or superparamagnetic properties for the Zn-substituted ferrite in particular. The biological activity of the studied nanoceramics was closely related to their chemical/phase composition as well as the degree of oxidation of the metal cations in their content. The nanomaterials that were dominated by mixed-valence phases showed the strongest and most persistent suppression of the reactions dependent on ROS. The high concentration of Fe³⁺ and the limited presence of reduced Cu⁺ and Fe²⁺ ions diminished the activity of the material and therefore excessive formation of free radicals, maintaining redox balance. On the opposite, phases and nanomaterials that were enriched with reduced metals e.g. metallic Cu could be easily oxidized in a Fenton`s reaction and exhibit a weaker and pH-dependent inhibitory effects. The presence of Zn²⁺ stabilized the crystal lattice; it could reduce the solubility of copper. However, Zn²⁺ itself did not participate in redox cycles and could weaken the antioxidant potential by diluting the active iron and copper centers. The pure nCuO sample demonstrated the highest antibacterial activity, because of typical pronounced oxidative and toxic effects. The inclusion of Fe³⁺ and Zn²⁺ in the lattice stabilized the copper species and limited oxidative stress, transforming a potentially prooxidant system into a more biologically compatible redox modulator. Those chemical dependencies probably determined the described inhibitory properties in the redox tests, as well as the weak bactericidal properties for most of the tested nanomaterials. Despite the materials complex nature, all materials show very similar antimicrobial properties, being generally nontoxic, slightly more efficient against the gram-positive E. coli. The redox activity tests proved that all sample compositions and related particle morphologies have good physiological compatibility, not promoting ROS accumulation, maintaining appropriate redox balance. These composite nano-ceramics would not burden the physiological processes that are connected with ROS generation, they would inhibit and suppress such reactions. Acute tests with Daphnia magna, on the other hand, evidence high ecotoxicity for all of the investigated active materials, likely due to the presence of fresh metallic copper particles. Their high ecotoxicity was probably due mainly to mechanical effects in the tested organisms, possibly facilitated by the magnetic properties of the complex particle aggregates, further accompanied by chemical transformations leading to metabolic damages. These latter results strongly suggest that such materials should be carefully characterised and classified to identify the correct phase compositions, consequently released into the environment or disposed of with care, but could at least be controlled by not very strong external magnetic fields.
Supplementary Materials
The following supporting information can be downloaded at the website of this paper posted on Preprints.org.
Author Contributions
Conceptualization, P.A.G, I.A.I.; Methodology, P.A.G, .M.T.G., E.L.P., I.A.I., E.P.N.; Validation, P.A.G. M.T.G., I.A.I., E.L.P., E.P.N.; Formal analysis,P.A.G. T.R.K., M.T.G., E.L.P., I.A.I, E.P.N.; Investigation, T.R.K., P.A.G., M.T.G., I.A.I., E.L.P., E.P.N.; Data curation, I.A.I., E.L.P., E.P.N.; Writing—original draft, P.A.G., M.T.G., T.R.K., E.L.P., E.P.N.; Writing—review & editing, P.A.G., M.T.G., E.L.P., I.A.I., E.P.N.,T.R.K.; Supervision, P.A.G., M.T.G.; Funding acquisition, P.A.G., M.T.G. All authors have read and agreed to the published version of the manuscript.
Institutional Review Board Statement
Not applicable.
Informed Consent Statement
Not applicable.
Data Availability Statement
The raw data supporting the conclusions of this article will be made available by the authors on request.
Acknowledgments
This research was funded by the Bulgarian National Science Fund (BNSF) under grant number KP-06-H88/8 and Sofia University “St. Kliment Ohridski” through grant number 80-10-18. The authors wish to acknowledge Daniela Karashanova for the TEM images and Kaloyan Genkov for the SEM analyses.
References
- D. Arcos, Nanomaterials in Biomedicine 2022, Int. J. Mol. Sci. 2023, 24, 9026. [CrossRef]
- A. M. Diez-Pascual, A. Rahdar, Functional Nanomaterials in Biomedicine Current Uses and Potential Applications. ChemMedChem 17 (2022) 202200142. [CrossRef]
- F Kurul , H. Turkmen, A. E. Cetin, S. N. Topkaya, Nanomedicine How nanomaterials are transforming drug delivery, bio-imaging, and diagnosis, Next Nanotech 7 (2025) 100129. [CrossRef]
- Mohana, S., Sumathi, S. Agaricus Bisporus Mediated Synthesis of Cobalt Ferrite, Copper Ferrite and Zinc Ferrite Nanoparticles for Hyperthermia Treatment and Drug Delivery. J. Clust. Sci. 35, (2024) 129–142 . [CrossRef]
- V. Narayanaswamy, Bilal Rah, I. A. Al-Omari , A. S. Kamzin, H. Khurshid, J. S. Muhammad, I. M. Obaidat, B. Issa, Evaluation of Antiproliferative Properties of CoMnZn-Fe2O4 Ferrite Nanoparticles in Colorectal Cancer Cells, Pharmaceuticals 2024, 17, 327. [CrossRef]
- Racca, L., Cauda, V., Remotely Activated Nanoparticles for Anticancer Therapy. Nano-Micro Lett. 13, 11 (2021). [CrossRef]
- J. Han, Y. Chen, X. Xiang, T. Wang, J. Shen, N. Zhang, C. Liang, X. Liu, X. Ma, A Comparative Analysis of the Antibacterial Spectrum of Ultrasmall Manganese Ferrite Nanozymes with Varied Surface Modifications, ACS Appl. Mater. Interfaces 2024, 16, 12, 14385–14404. [CrossRef]
- Haghniaz, R., Rabbani, A., Vajhadin, F. et al. Anti-bacterial and wound healing-promoting effects of zinc ferrite nanoparticles. J Nanobiotechnol 19, 38 (2021). [CrossRef]
- A. Rabbani, R. Haghniaz, T. Khan, R. Khan, A. Khalid, S. S. Naz, M. Ul-Islam, F. Vajhading, F. Wahid, Development of bactericidal spinel ferrite nanoparticles with effective biocompatibility for potential wound healing applications, RSC Adv., 2021,11, 1773-1782. [CrossRef]
- Mendes, C.; Thirupathi, A.; Corrêa, M.E.A.B.; Gu, Y.; Silveira, P.C.L. The Use of Metallic Nanoparticles in Wound Healing: New Perspectives. Int. J. Mol. Sci. 2022, 23, 15376. [CrossRef]
- Spinel ferrite magnetic adsorbents: Alternative future materials for water purification?, Coord. Chem. Rev., 315 (2016) 90-111. [CrossRef]
- Sukoviene, A.; Ali, S.; Jagminas, A.; Ramanavicius, S. Magnetic Cobalt and Other Types of Ferrite Nanoparticles: Synthesis Aspects and Novel Strategies for Application in Wastewater Treatment (Review). Appl. Sci. 2025, 15, 857. [CrossRef]
- V. K. Garg, V. K. Sharma, E. Kuzmann, Purification of Water by Ferrites - Mini Review, In Ferrites and Ferrates: Chemistry and Applications in Sustainable Energy and Environmental Remediation, Ch. 5, pp 137-143, ACS Symposium SeriesVol. 1238. [CrossRef]
- Mikhailovsky, V.L., Radovenchik, V.M. (1996). Water and Wastewater Treatment Using Ferrites. In: Hahn, H.H., Hoffmann, E., Ødegaard, H. (eds) Chemical Water and Wastewater Treatment IV. Springer, Berlin, Heidelberg. [CrossRef]
- I. M. Ramirez-Sanchez, E. R. Bandala, Use of Ferrate and Ferrites for Water Disinfection, In Ferrites and Ferrates: Chemistry and Applications in Sustainable Energy and Environmental Remediation, Ch. 6, pp 145-159, ACS Symposium SeriesVol. 1238. [CrossRef]
- S. Rmeid, A. Aridi, K. Habanjar, E. M. Abdel Rahman , W. F. Khalil, G. M. El-Subruiti, R. Awad, Removal of radioactive Co(II) and Sr(II) using (Co0.5Zn0.5)Fe2O4 nanoparticles co-doped with barium and antimony, Ceram. Int. 51 (2025) 4593 – 4612. [CrossRef]
- P. R. Naik, V. A. Rajashekara, S. Mudhulu, M. Channegowda, Facile synthesis, characterisation and application of zinc ferrite in removal of uranium from water by adsorption, J. Contamin. Hydrol. 273 (2025) 104583. [CrossRef]
- Khurram Shehzad, Zhu Haifeng, Mukhtar Ahmad, Yusuf Kareem, Muhammad Tayyab Butt, Muniba Rahmat, Weihong Xu, Jinhuai Liu, Yuanguo Xu, Facile synthesis of novel zinc ferrite nanostructures (ZFN) for enhanced adsorption of highly mobile and toxic As(III) from aqueous solutions, J. Water Proc. Eng. 63, (2024) 105464. [CrossRef]
- B. Carrese, G. Sanità, A. Lamberti, Nanoparticles Design for Theranostic Approach in Cancer Disease, Cancers 2022, 14, 4654. [CrossRef]
- F. Chen, E. B. Ehlerding, W. Cai, Theranostic Nanoparticles, J. Nucl. Med. , 55 (2014) 1919-1922. [CrossRef]
- R. A. Revia, Z. R. Stephen, M. Zhang, Theranostic Nanoparticles for RNA-Based Cancer Treatment, Acc. Chem. Res. 52 (2019) 1496–1506. [CrossRef]
- World Health Organization, 2018 10 threats to global health in 2018 (available at: https://medium.com/who/10-threats-toglobal-health-in-2018-232daf0bbef3).
- Biondo C Bacterial antibiotic resistance: the most critical pathogens, Pathogens 12 (2023) 116. [CrossRef]
- Hetta H F et al. 2023 Nanotechnology as a promising approach to combat multidrug resistant bacteria: a comprehensive review and future perspectives. [CrossRef]
- J.W. Alexander, History of the medical use of silver, Surg. Infect. 10 (2009) 289–292. [CrossRef]
- H.J. Klasen, Historical review of the use of silver in the treatment of burns. I. Early uses, Burns 26 (2000) 117–130. [CrossRef]
- P. Dutta, B. Wang, Zeolite-supported silver as antimicrobial agents, Coord. Chem. Rev. 383 (2019) 1–29. [CrossRef]
- E. L. Pavlova, E. P. Nenova, L. D. Yocheva, I. A. Ivanova, P. A. Georgiev, Antimicrobial and Oxidative Activities of Different Levels of Silver-Exchanged Zeolites X and ZSM-5 and Their Ecotoxicity, Pharmaceuticals 17 (2024) 1586. [CrossRef]
- M. Mahmoudi, The need for robust characterization of nanomaterials for nanomedicine applications, Nat. Commun. (2021) 125246. [CrossRef]
- A. Sirelkhatim, S. Mahmud, A. Seeni, N. Haida M. Kaus, L. C. Ann, S. Khadijah M. Bakhori, H. Hasan, D. Mohamad, Review on Zinc Oxide Nanoparticles: Antibacterial Activity and Toxicity Mechanism, Nanomicro Lett. . 19 (2015) 219–242. [CrossRef]
- A. Sirelkhatim, S, Mahmud, A. Seeni, N. H. M. Kaus, L. C. Ann, S. K. M. Bakhori, H. Hasan, D. Mohamad, Review on Zinc Oxide Nanoparticles - Antibacterial Activity and Toxicity Mechanism, Nano-Micro Lett. 7 (2015) 219–242. [CrossRef]
- A. Nel, T. Xia, L. Madler, N. Li, Toxic Potential of Materials at the Nanolevel. Science 2006, 311, 622–627. [CrossRef]
- Y. Matsumura, K. Yoshikata, S.-I. Kunisaki, T. Tsuchido, Mode of bactericidal action of silver zeolite and its comparison with that of silver nitrate. Appl. Environ. Microbiol. 69(7), 4278–4281. [CrossRef]
- H. Yang, C. Liu, D. Yang, H. Zhang, Z. Xi, Comparative study of cytotoxicity, oxidative stress and genotoxicity induced by four typical nanomaterials: the role of particle size, shape and composition. J. Appl. Toxicol. 29 (2009) 69–78. [CrossRef]
- A. Lipovsky, Z. Tzitrinovich, H. Friedmann, G. Applerot, A. Gedanken, R. Lubart, EPR study of visible light-induced ROS generation by nanoparticles of ZnO. J. Phys. Chem. C 113 (2009) 15997–16001. [CrossRef]
- Y. Leung, C. Chan, A. Ng, H. Chan, M. Chiang, A. Djurisic, Y. Ng, W. Jim, M. Guo, F. Leung, Antibacterial activity of ZnO nanoparticles with a modified surface under ambient illumination. Nanotechnology 23 (2012) 475703. [CrossRef]
- D. P. Linklater, V. A. Baulin, X. Le Guével, J-B. Fleury, E. Hanssen, T. H. P. Nguyen, S. Juodkazis et al., Antibacterial Action of Nanoparticles by Lethal Stretching of Bacterial Cell Membranes, Adv. Mater. (2020) 2005679. [CrossRef]
- K. L. Chen, G. D. Bothun, Nanoparticles Meet Cell Membranes: Probing Nonspecific Interactions using Model Membranes, Environ. Sci. Technol. 2014, 48, 2, 873–880. [CrossRef]
- G. Bhabra, A. Sood, B. Fisher, L. Cartwright, M. Saunders, W. H. Evans, A. Surprenant et. al. Nanoparticles can cause DNA damage across a cellular barrier, Nature Nanotech 4 (2009) 876–883. [CrossRef]
- G. P. Gakis , I. G. Aviziotis and C. A. Charitidis, Metal and metal oxide nanoparticle toxicity: moving towards a more holistic structure–activity approach, Environ. Sci.: Nano 10 (2023) 761-780. [CrossRef]
- J.H. Hankiewicz , J.A. Stoll, J. Stroud, J. Davidson, K.L. Livesey, K. Tvrdy, A. Roshko et. al., Nano-sized ferrite particles for magnetic resonance imaging thermometry, J. Magn. Magn, Mat. 469 (2019) 550-557.
- L. Wen, X. Fu, H. Zhang, P. Ye, H. Fu, Z. Zhou, R. Sun et. al., Tailoring Zinc Ferrite Nanoparticle Surface Coating for Macrophage-Affinity Magnetic Resonance Imaging of Atherosclerosis, ACS Appl. Mater. Interf. 16 (2024) 13496–13508. [CrossRef]
- L. Zhang, Q. Li, J. Liu, Z. Deng, X. Zhang, N. Alifu, X. Zhang, Recent advances in functionalized ferrite nanoparticles: From fundamentals to magnetic hyperthermia cancer therapy, Coll. Surf. B: Biointerfaces 254 (2024) 113754. [CrossRef]
- M. A. Medina , G. Oza, A. Ángeles-Pascual, M. González M., R. Antaño-López, A. Vera, L. Leija, E. Reguera et. al., Synthesis, Characterization and Magnetic Hyperthermia of Monodispersed Cobalt Ferrite Nanoparticles for Cancer Therapeutics, Molecules 25 (2020) 4428. [CrossRef]
- J. M. Hastings, L. M. Corliss, Neutron Diffraction Studies of Zinc Ferrite and Nickel Ferrite, Rev. Mod. Phys. 25 (1953) 114-119. [CrossRef]
- H. L. Andersen, M. Saura-Múzquiz, C. Granados-Miralles, E. Canévet, N. Locke. M. Christensen, Nanoscale 10 (2018), 14902-14914.
- J. Ramos-Zúñiga, N. Bruna, J. M. Pérez-Donoso, Toxicity Mechanisms of Copper Nanoparticles and Copper Surfaces on Bacterial Cells and Viruses, Int. J. Mol. Sci. 2023, 24, 10503. [CrossRef]
- M. Scholefield, S. J. Church, J. Xu, S. Patassini, F. Roncaroli, N. M. Hooper, R. D. Unwin, G. J. S. Cooper, Widespread Decreases in Cerebral Copper Are Common to Parkinsons Disease Dementia and Alzheimer’s Disease Dementia, Front. Aging Neurosci. 13 (2021) 641222. [CrossRef]
- S. Naz, A. Gul, M. Zia, R. Javed, Synthesis, biomedical applications, and toxicity of CuO nanoparticles, Applied Microbiology and Biotechnology 107 (2023) 1039–1061. [CrossRef]
- O. Havryliuk, G. Rathee, J. Blair, V. Hovorukha, O. Tashyrev, J. Morató, L. M. Pérez. T. Tzanov, Unveiling the Potential of CuO and Cu2O Nanoparticles against Novel Copper-Resistant Pseudomonas Strains- An In-Depth Comparison, Nanomaterials 14 (2024) 1644. [CrossRef]
- J. Y. Park, S. Lee, Y. Kim, Y. B. Ryu, Antimicrobial Activity of Morphology-Controlled Cu2O Nanoparticles- Oxidation Stability under Humid and Thermal Conditions, Materials 17 (2024) 261. [CrossRef]
- S. Wu, Q. Wang, Y. Li, B. Liu, Y. Miao, Recent Advances in the Biomedical Applications of Copper Nanomaterial-Mediated Cuproptosis, Adv. NanoBiomed Res. 4 (2024) 2400018. [CrossRef]
- M. J. Wozniak-Budych, K. Staszak, M. Staszak Copper and Copper-Based Nanoparticles in Medicine—Perspectives and Challenges, Molecules 28 (2023) 6687. [CrossRef]
- X.-X. Tang, A. Manthiram, J.B. Goodenough, Copper Ferrite Revisited, J. Sol. St. Chem. 79 (1989) 250-262. [CrossRef]
- A. M. Balagurov, I. A. Bobrikov, M. S. Maschenko, D. Sangaa, V. G. Simkin, Structural Phase Transition in CuFe2O4 Spinel Crystallogr. Rep. 58 (2013) 710–717. [CrossRef]
- V.A. Zhuravlev, R.V. Minin, V.I. Itin, I.Y. Lilenko, Structural parameters and magnetic properties of copper ferrite nanopowders obtained by the sol-gel combustion. J. Alloy. Compd. 2017, 692, 705–712. [CrossRef]
- J. Calvo-de la Rosa, M. R. Segarra, Influence of the Synthesis Route in Obtaining the Cubic or Tetragonal Copper Ferrite Phases, Inorg. Chem. 2020, 59, 13, 8775–8788. [CrossRef]
- D. Gingasu, I. Mindru, L. Patron, C.-B. Cizmas, Tetragonal copper ferrite obtained by self-propagating combustion. J. All. Compd. 2008, 460, 627–631. [CrossRef]
- R. Dhyani, R.C. Srivastava, P.S. Rawat, G. Dixit, Structural and elastic properties of tetragonal nano-structured copper ferrite. Int. J. Mater. Res. 2022, 113, 884–892. [CrossRef]
- F. Caddeo, D. Loche, M.F. Casula, A. Corrias, Evidence of a cubic iron sub-lattice in t-CuFe2O4 demonstrated by X-ray Absorption Fine Structure. Sci. Rep. 8 (2018) 797. [CrossRef]
- A. Samavati, A. F. Ismail, Antibacterial properties of copper-substituted cobalt ferrite nanoparticles synthesized by co-precipitation method, Particuology 30 (2017) 158-163. [CrossRef]
- T.A. Atia, P. Altimari, E. Moscardini, I. Pettiti, L. Toro, F. Pagnanelli, Synthesis and characterization of copper ferrite magnetic nanoparticles by hydrothermal route. Chem. Eng. Trans. 2016, 47, 151–156.
- K. H. Kahkesh, Z. Baghbantaraghdari, D. Jamaledin, F. D. Moghaddam, N. Kaneko, M. Ghovvati, Synthesis, Characterization, Antioxidant and Antibacterial Activities of Zinc Ferrite and Copper Ferrite Nanoparticles, Materials Chemistry Horizons 2 (2023) 49–56. [CrossRef]
- Yu Gu, F. Xiao, L. Luo, X. Zhou, X. Zhou, J. Li, Z. Li, Bacterial Disinfection by CuFe2O4 Nanoparticles Enhanced by NH2OH: A Mechanistic Study, Nanomaterials 10 (2020) 18. [CrossRef]
- J. H. Martínez-Montelongo, R. Hernandez-Rangel, I. Campos-Avelar, I. Betancourt, L. H. Quintero, M. E. Cano, J. A. Zapien, I. E. Medina-Ramirez, Antimicrobial activity of CuFe2O4 and CuFe2O4/ZnO: Squaring colorimetric and traditional microbiology assays with atomic force- and holotomography-microscopies, Ceram. Int. 51 (2025) 2452-2466. [CrossRef]
- J. Wang, R. Qiang, Q. Miao, R. Hu, H. Chen, S. Guo, Z. Liu, Synthesis and potent antibacterial activity of nano-CuFe2O4/MoS2@Ag composite under visible light, Appl. Surf. Sci. 684 (2025) 161908. [CrossRef]
- Y. Liu, Z. Guo, F. Li, Y. Xiao, Y. Zhang, T. Bu, P. Jia, T. Zhe, L. Wang, Multifunctional Magnetic Copper Ferrite Nanoparticles as Fenton like Reaction and Near-Infrared Photothermal antibacterial Therapy, ACS Appl. Mater. Interfaces 11 (2019) 31649−31660. [CrossRef]
- B. Abebe, E. A. Zereffa, A. Tadesse, et al. A Review on Enhancing the Antibacterial Activity of ZnO: Mechanisms and Microscopic Investigation. Nanoscale Res. Lett. 15, 190 (2020). [CrossRef]
- E. L. Pavlova, R. D. Toshkovska, T. E. Doncheva, I. A. Ivanova, Prooxidant and antimicrobic effects of iron and titanium oxide nanoparticles and thalicarpine. Arch Microbiol. 2020;202(7):1873-1880. [CrossRef]
- A. Taufiq, S. Sunaryono, E. G. R. Putra, S. Pratapa, Darminto, Nano-structural studies on Fe3O4 particles dispersing in a magnetic fluid using X-ray diffractometry and small-angle neutron scattering, Mater. Sci. Forum 827 (2015) 213-218. [CrossRef]
- R. Joshi B. P. Singh, R. S. Ningthoujam, Confirmation of highly stable 10 nm sized Fe3O4 nanoparticle formation at room temperature and understanding of heat generation under AC magnetic fields for potential application in hyperthermia, AIP Advances 10 (2020) 105033. [CrossRef]
- I. Safitri, Y. G. Wibowo, D. Rosarina and Sudibyo, Synthesis and characterization of magnetite (Fe3O4) nanoparticles from iron sand in Batanghari Beach, IOP Conf. Ser. Mater. Sci. Eng. 1011 (2021) 012020. [CrossRef]
- J. Philip, G. Gnanaprakash, G. Panneerselvam, M. P. Antony, T. Jayakumar et. al., Effect of thermal annealing under vacuum on the crystal structure, size, and magnetic properties of ZnFe2O4 nanoparticles, J. Appl. Phys. 102 (2007) 054305. [CrossRef]
- H. L. Andersen, M. Saura-Múzquiz, C. Granados-Miralles, E. Canévet, N. Locke, M. Christensen, Crystalline and magnetic structure-property relationship in spinel ferrite nanoparticles, Nanoscale 10 (2018) 14902-14914. [CrossRef]
- M. J. Kang, N. H. An, Y. S. Kang, Magnetic and Photochemical Properties of Cu Doped Hematite Nanocrystal, Mater. Sci. Forum 893 (2017) 136–143. [CrossRef]
- A. Ahmadi-Arpanah, H. Meleki-Ghaleh, Z. Dargahi, P. Khademi-Azandehi, G. Mirzaei, Y. Beygi-Khosrowshahi, M. H. Siadati, The photocatalytic antibacterial behavior of Cu-doped nanocrystalline hematite prepared by mechanical alloying, Appl. Nanosci. 11 (2021) 11817–832. [CrossRef]
- A. Lassoued, M. S. Lassoued, B. Dkhil, A. Gadri, S. Ammar, Structural, optical and morphological characterization of Cu-doped α-Fe2O3 nanoparticles synthesized through co-precipitation technique, J. Mol. Struct. 1148 (2017) 276-281. [CrossRef]
- S. Krehula, M. Ristic, Z Petrovic, L. K. Krehula, I. Mitar, S. Musi, Effects of Cu doping on the microstructural, thermal, optical and photocatalytic properties of α-FeOOH and α-Fe2O3 1D nanoparticles, J. All. Comp. 802 (2019) 290-300. [CrossRef]
- C. G. Shull, W. A. Strauser, and E. O. Wollan, Neutron Diffraction by Paramagnetic and Antiferromagnetic Substances, Phys. Rev. 83 (1951) 333 – 345. [CrossRef]
- Pavlova, E.L., Ivanova, I.A., Staneva, A.D. et al. Prooxidant, antioxidant and biological activity of nanocomposites of reduced graphene oxide, silver, copper and their combinations. Chem. Pap. (2022). [CrossRef]
- Morimitsu Nishikimi, N. Appaji Rao, Kunio Yagi, The occurrence of superoxide anion in the reaction of reduced phenazine methosulfate and molecular oxygen, Biochemical and Biophysical Research Communications,Volume 46, Issue 2, 1972, Pages 849-854,ISSN 0006-291X. [CrossRef]
- JT Hancock, R Desikan, SJ Neill, Role of reactive oxygen species in cell signalling pathways. Biochem Soc Trans. 2001 May;29(Pt 2):345-50. PMID: 11356180. [CrossRef]
- A. Sielska, L. Skuza, Copper Nanoparticles in Aquatic Environment: Release Routes and Oxidative Stress-Mediated Mechanisms of Toxicity to Fish in Various Life Stages and Future Risks” Current Issues in Molecular Biology 47, (2025) 472. [CrossRef]
- X. Yinlong, C. Guangchao, JGM, P. W. WJGM Peijnenburg, Toxicity and Accumulation of Cu and ZnO Nanoparticles in Daphnia magna. Environ. Sci. Technol. 2015, 49, 7, 4657–4664. [CrossRef]
- Lu, G., Yang, H., Xia, J., Zong, Y., & Liu, J. (2017). Toxicity of Cu and Cr nanoparticles to Daphnia magna. Water, Air, & Soil Pollution, 228(1), 18. [CrossRef]
- Organisation for Economic Co-operation and Development. (2004). Test No. 202: Daphnia sp. acute immobilisation test. OECD publishing.
- J. Mazurenko, A. K. Sijo, L. Kaykan, V. Kotsyubynsky, Ł. Gondek , A. Zywczak , M. Marzec, O. Vyshnevsky, Synthesis and Characterization of Copper Ferrite Nanoparticles for Efficient Photocatalytic Degradation of Organic Dyes, J. Nanotechn. (2025) 8899491. [CrossRef]
- M. Isabel Díez-García, T. Lana-Villarreal, R. Gómez, Study of Copper Ferrite as a Novel Photocathode for Water Reduction: Improving Its Photoactivity by Electrochemical Pretreatment, ChemSusChem 9 (2016) 1504 – 1512. [CrossRef]
- H. Liu, C. Di Valentin, Band Gap in Magnetite above Verwey Temperature Induced by Symmetry Breaking, J. Phys. Chem. C 121 (2017) 25736–25742. [CrossRef]
Figure 1.
Primitive unit cell of magnetite in a, and the same for hematite in b.
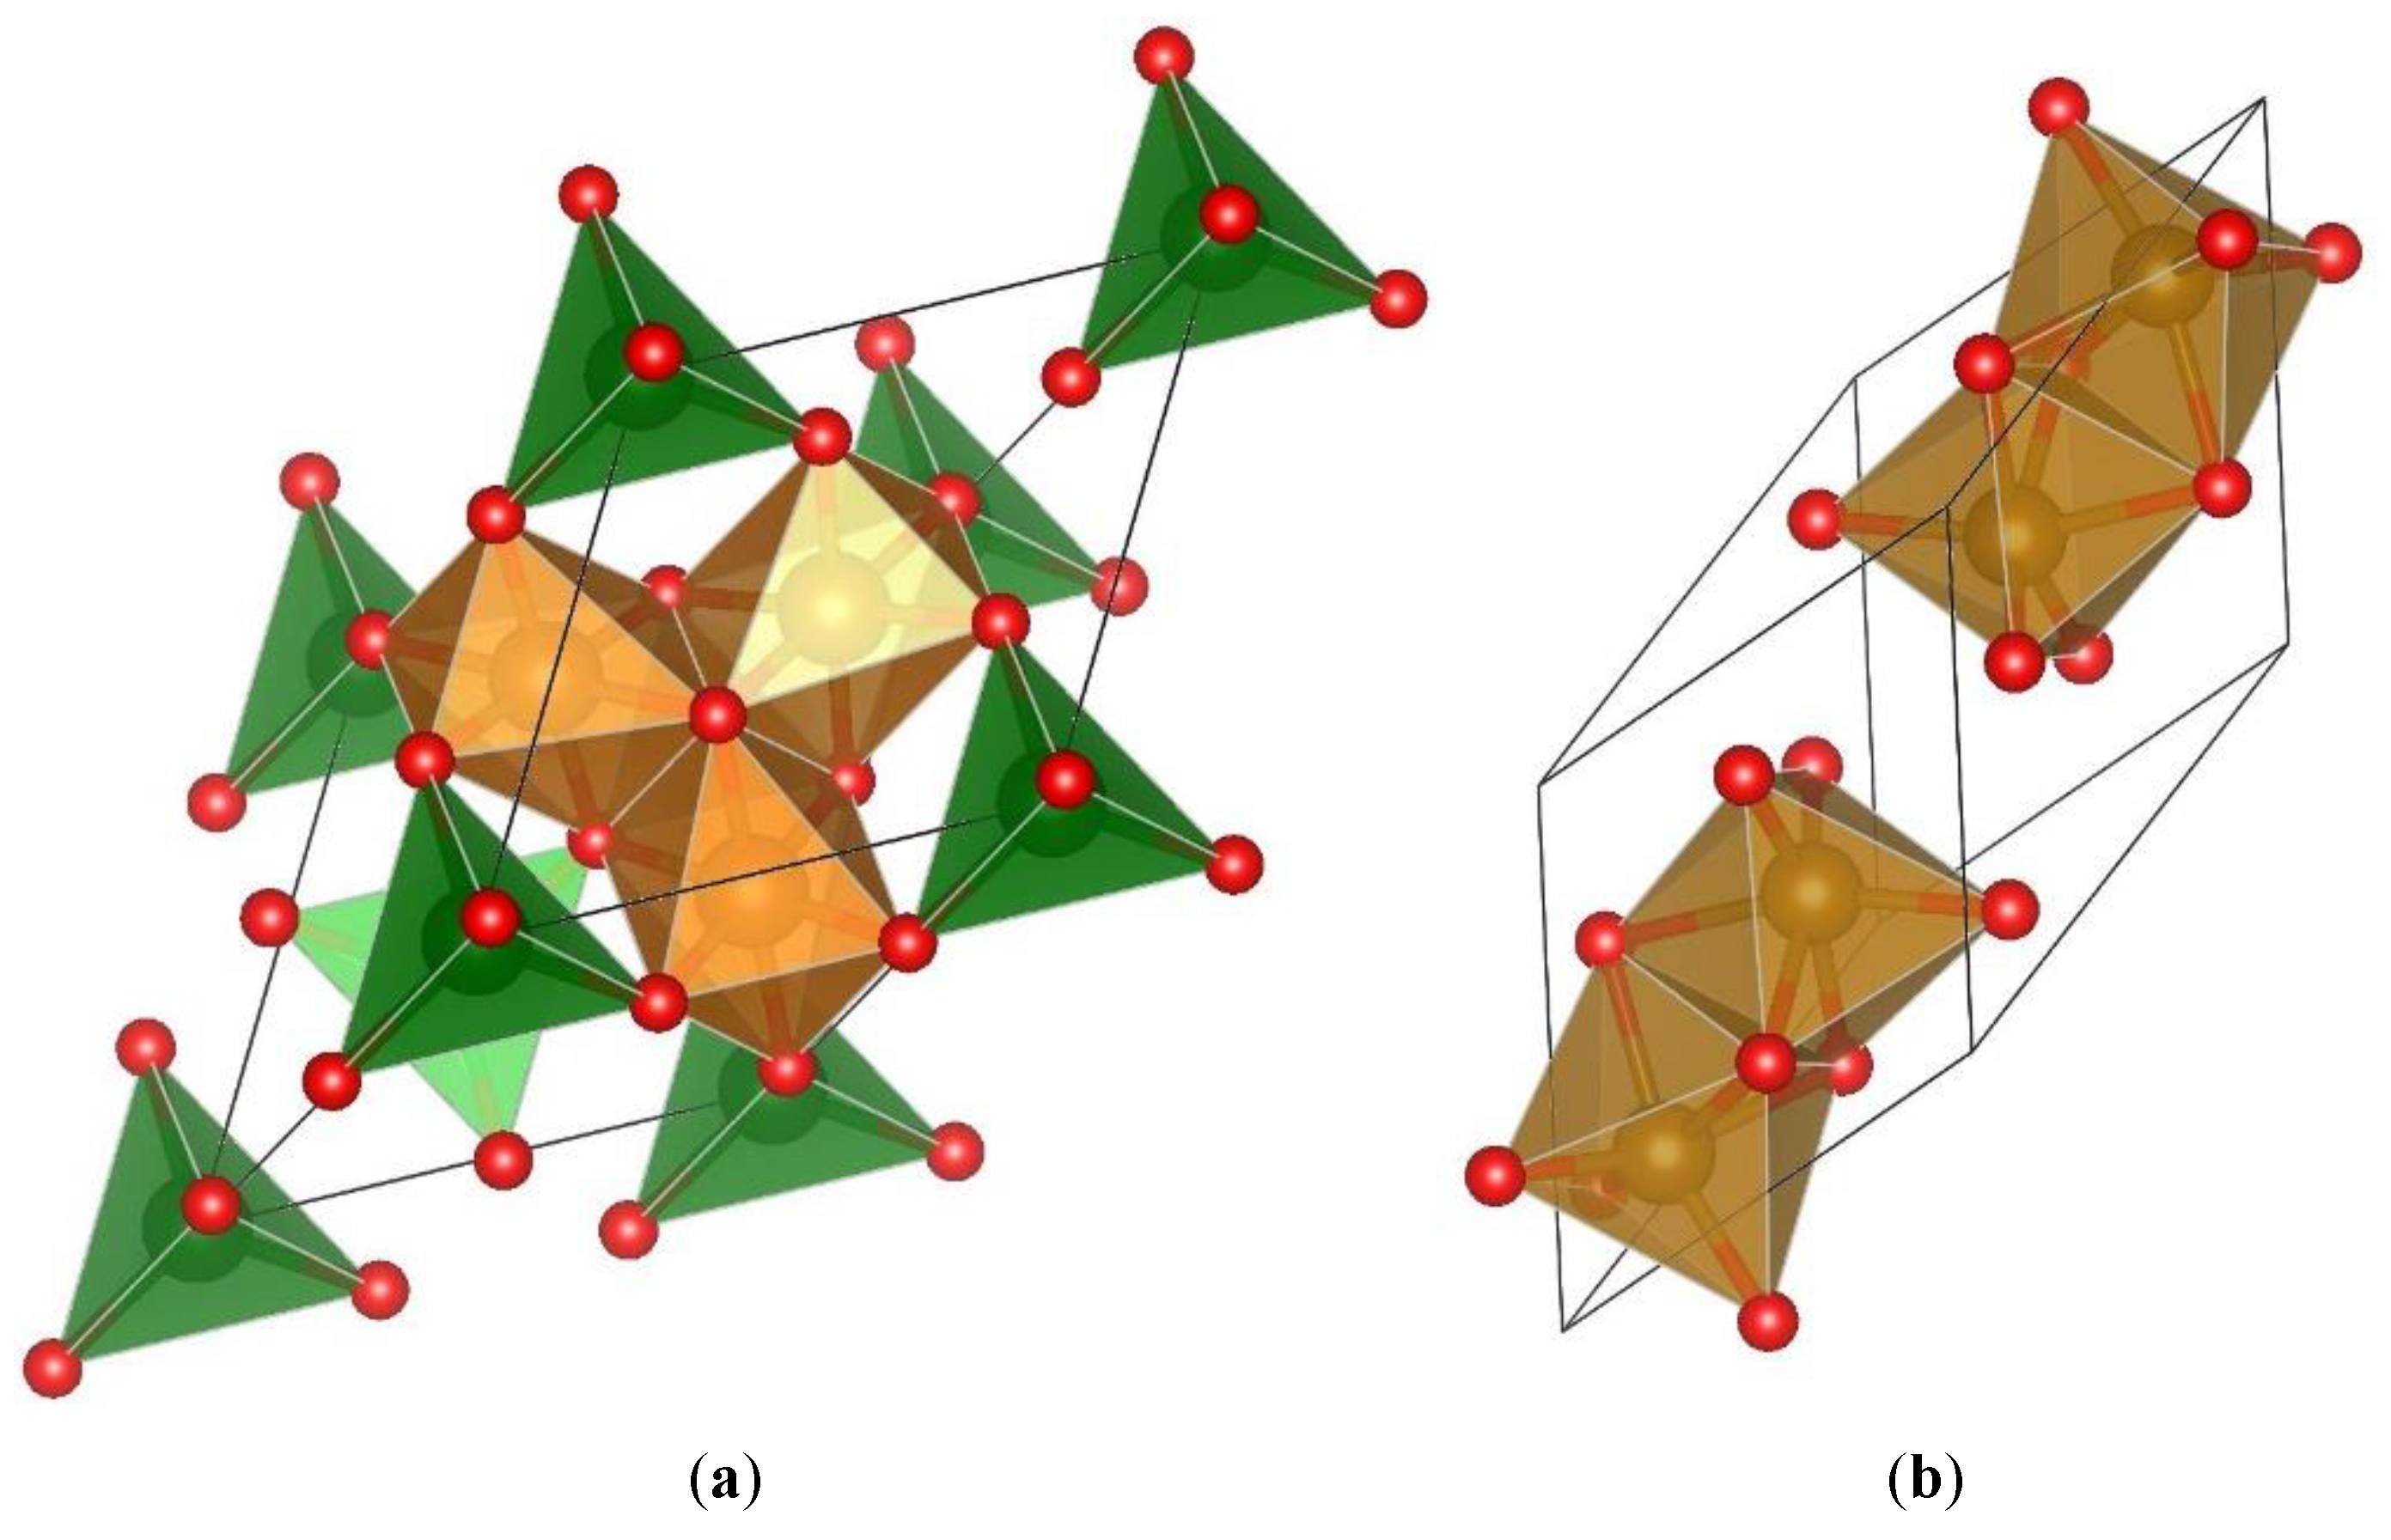
Figure 2.
PXRD patterns of the four sample materials, as indicated in the figure legend. The solid orange line, underneath the top pattern of CuFeO_3A, is due to a calculated PXRD profile of hematite.
Figure 2.
PXRD patterns of the four sample materials, as indicated in the figure legend. The solid orange line, underneath the top pattern of CuFeO_3A, is due to a calculated PXRD profile of hematite.
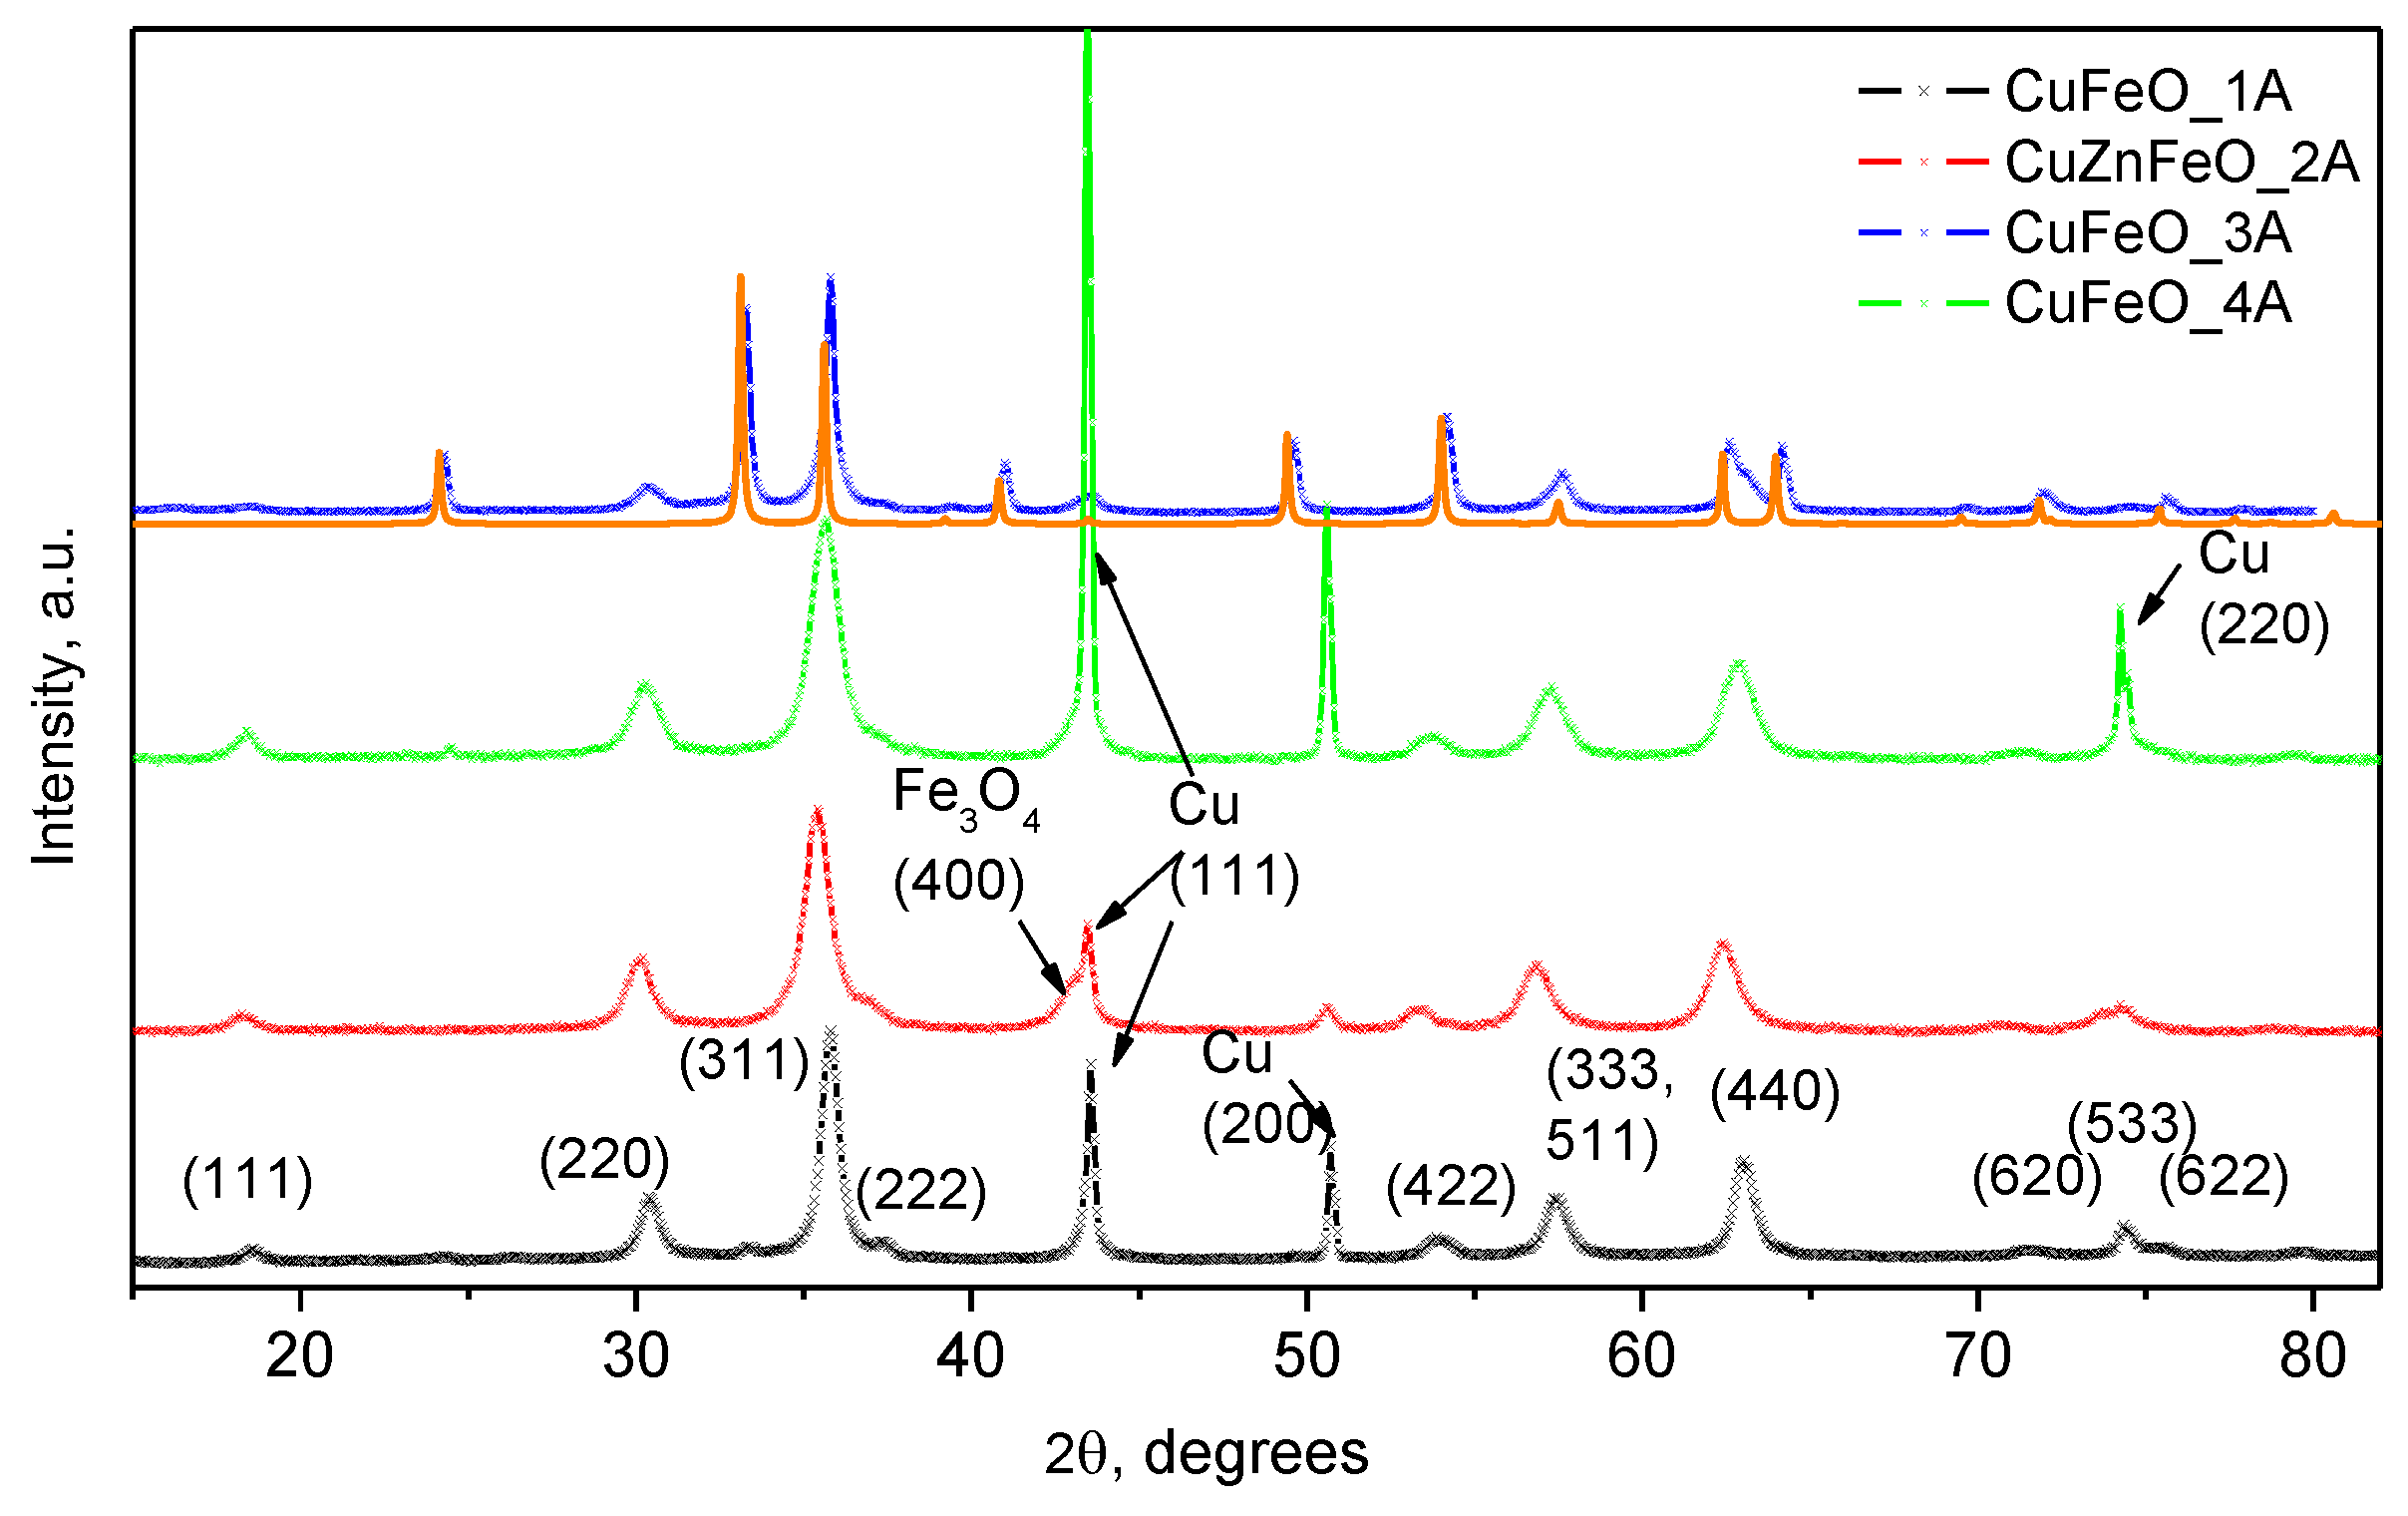
Figure 3.
TEM images of the CuFeO_1A – a), CuFeO_4A – b), and CuZnFeO_2A – c). HRTEMs of the same samples are shown in d), e) and f) to observe the typical crystallite particle sizes.
Figure 3.
TEM images of the CuFeO_1A – a), CuFeO_4A – b), and CuZnFeO_2A – c). HRTEMs of the same samples are shown in d), e) and f) to observe the typical crystallite particle sizes.
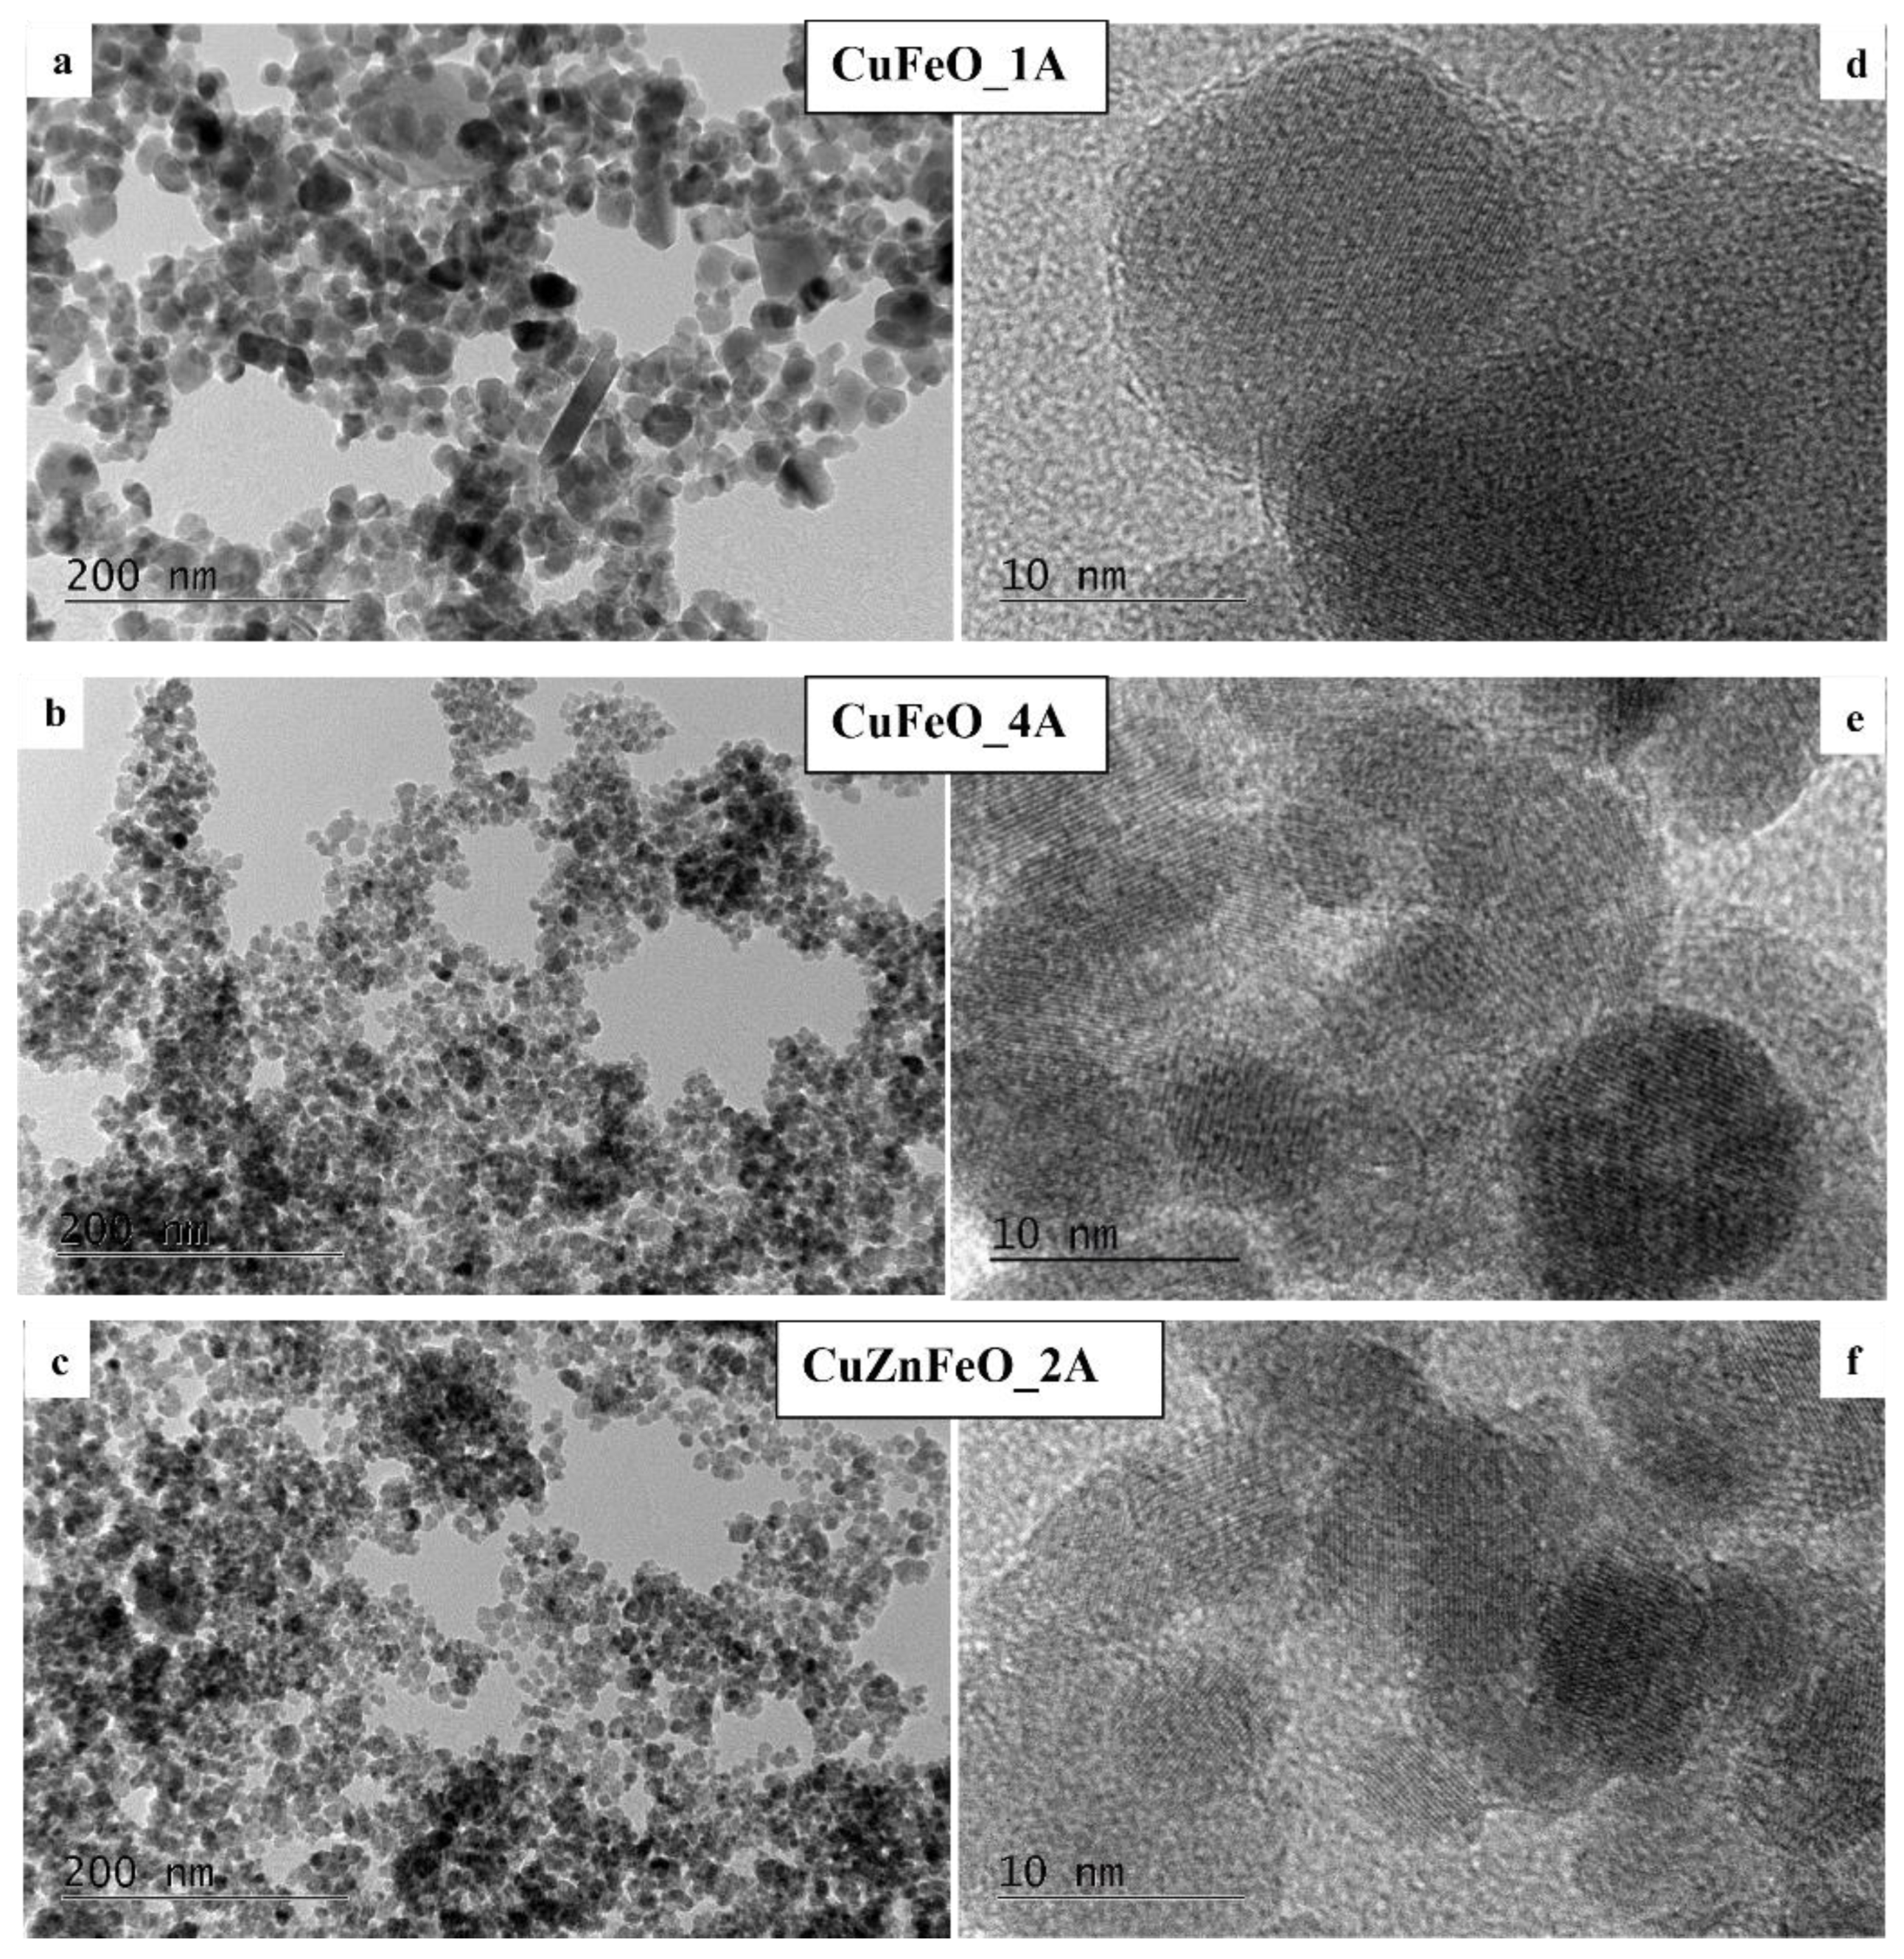
Figure 4.
SEM images of the CuFeO_1A - a, b, _3A – c, d, and _4A – e, f samples, illustrating the agglomerated powder morphology – left side, and isolated copper crystalline particles – on the right side. Accellerating voltage was 20 kV, at SEM WD ~9÷9.5 mm, magnifications x500 and x5000, accordingly.
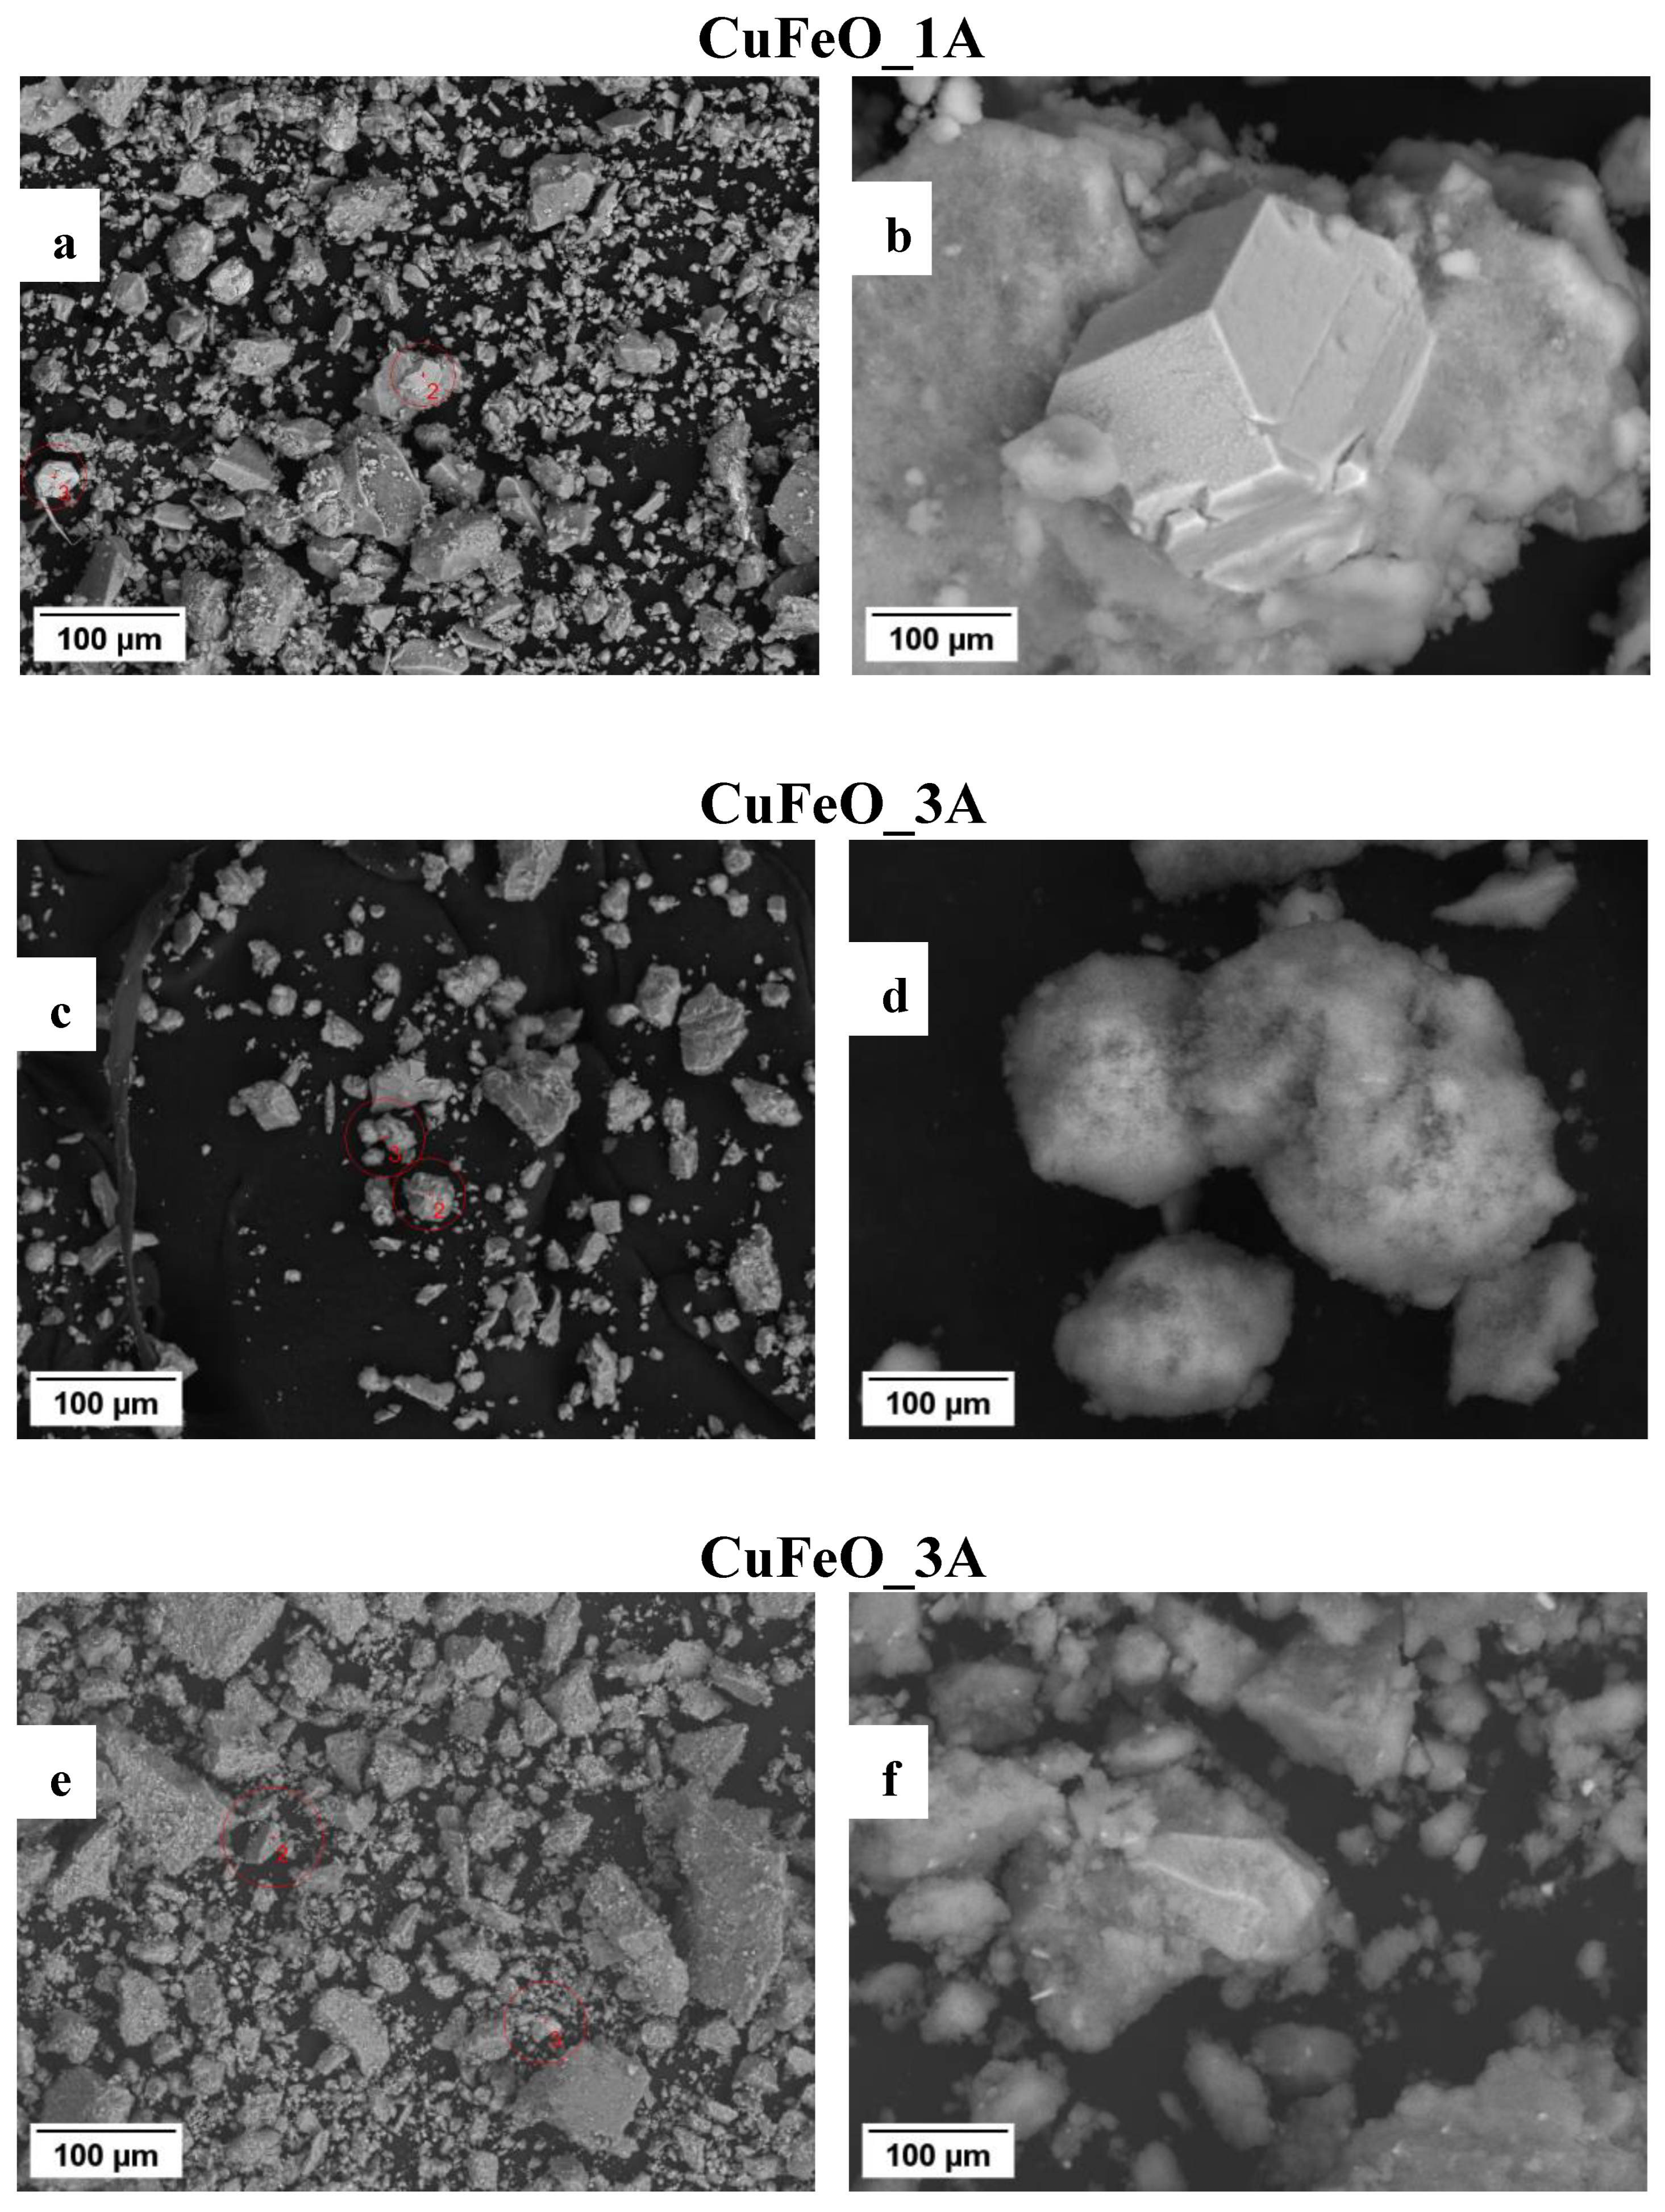
Figure 6.
Fenton`s chemiluminescence induced by .OH and .OOH radicals at pH 8.5 (A-kinetics, B-maximums) and pH 7.4 (A-kinetics, B-maximums) and the effect of newly synthesized nano-ceramic materials (p ≤ 0.05).
Figure 6.
Fenton`s chemiluminescence induced by .OH and .OOH radicals at pH 8.5 (A-kinetics, B-maximums) and pH 7.4 (A-kinetics, B-maximums) and the effect of newly synthesized nano-ceramic materials (p ≤ 0.05).
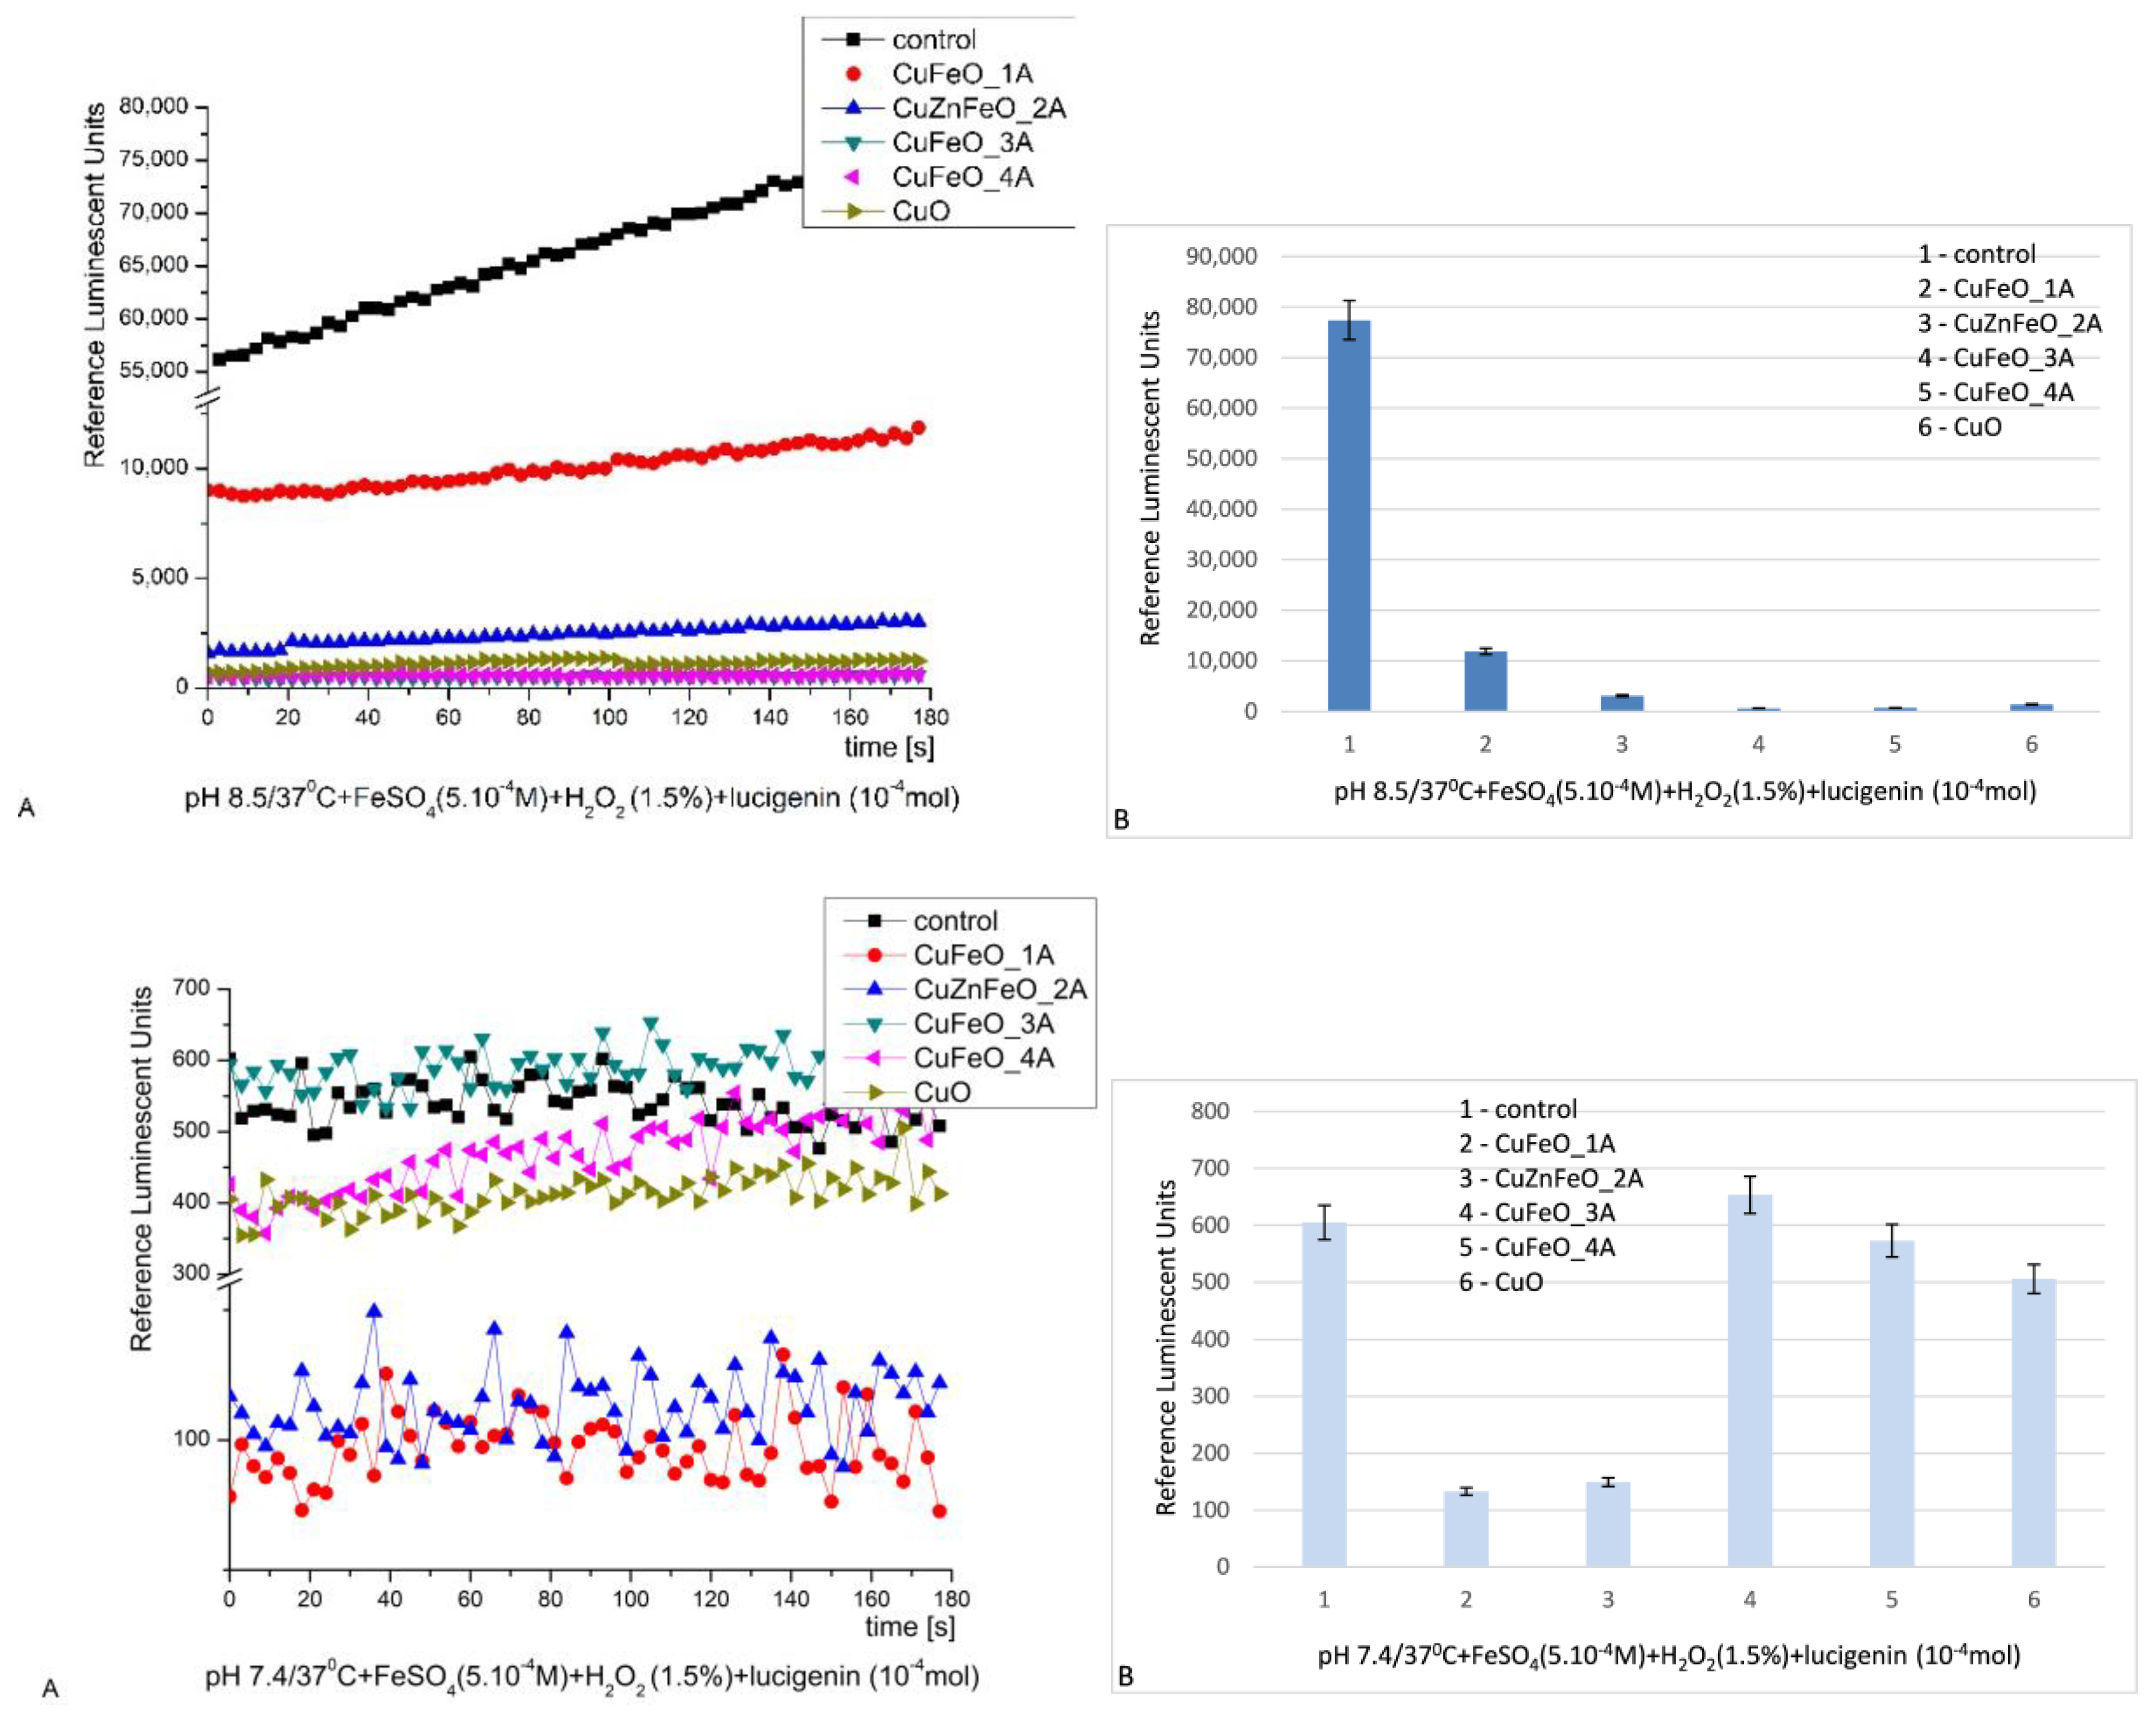
Figure 7.
H2O2 chemiluminescence induced by H2O2 at pH 8.5 (A-kinetics, B-maximums) and pH 7.4 (A-kinetics, B-maximums) and the effect of newly synthesized nano-ceramic materials (p ≤ 0.05).
Figure 7.
H2O2 chemiluminescence induced by H2O2 at pH 8.5 (A-kinetics, B-maximums) and pH 7.4 (A-kinetics, B-maximums) and the effect of newly synthesized nano-ceramic materials (p ≤ 0.05).
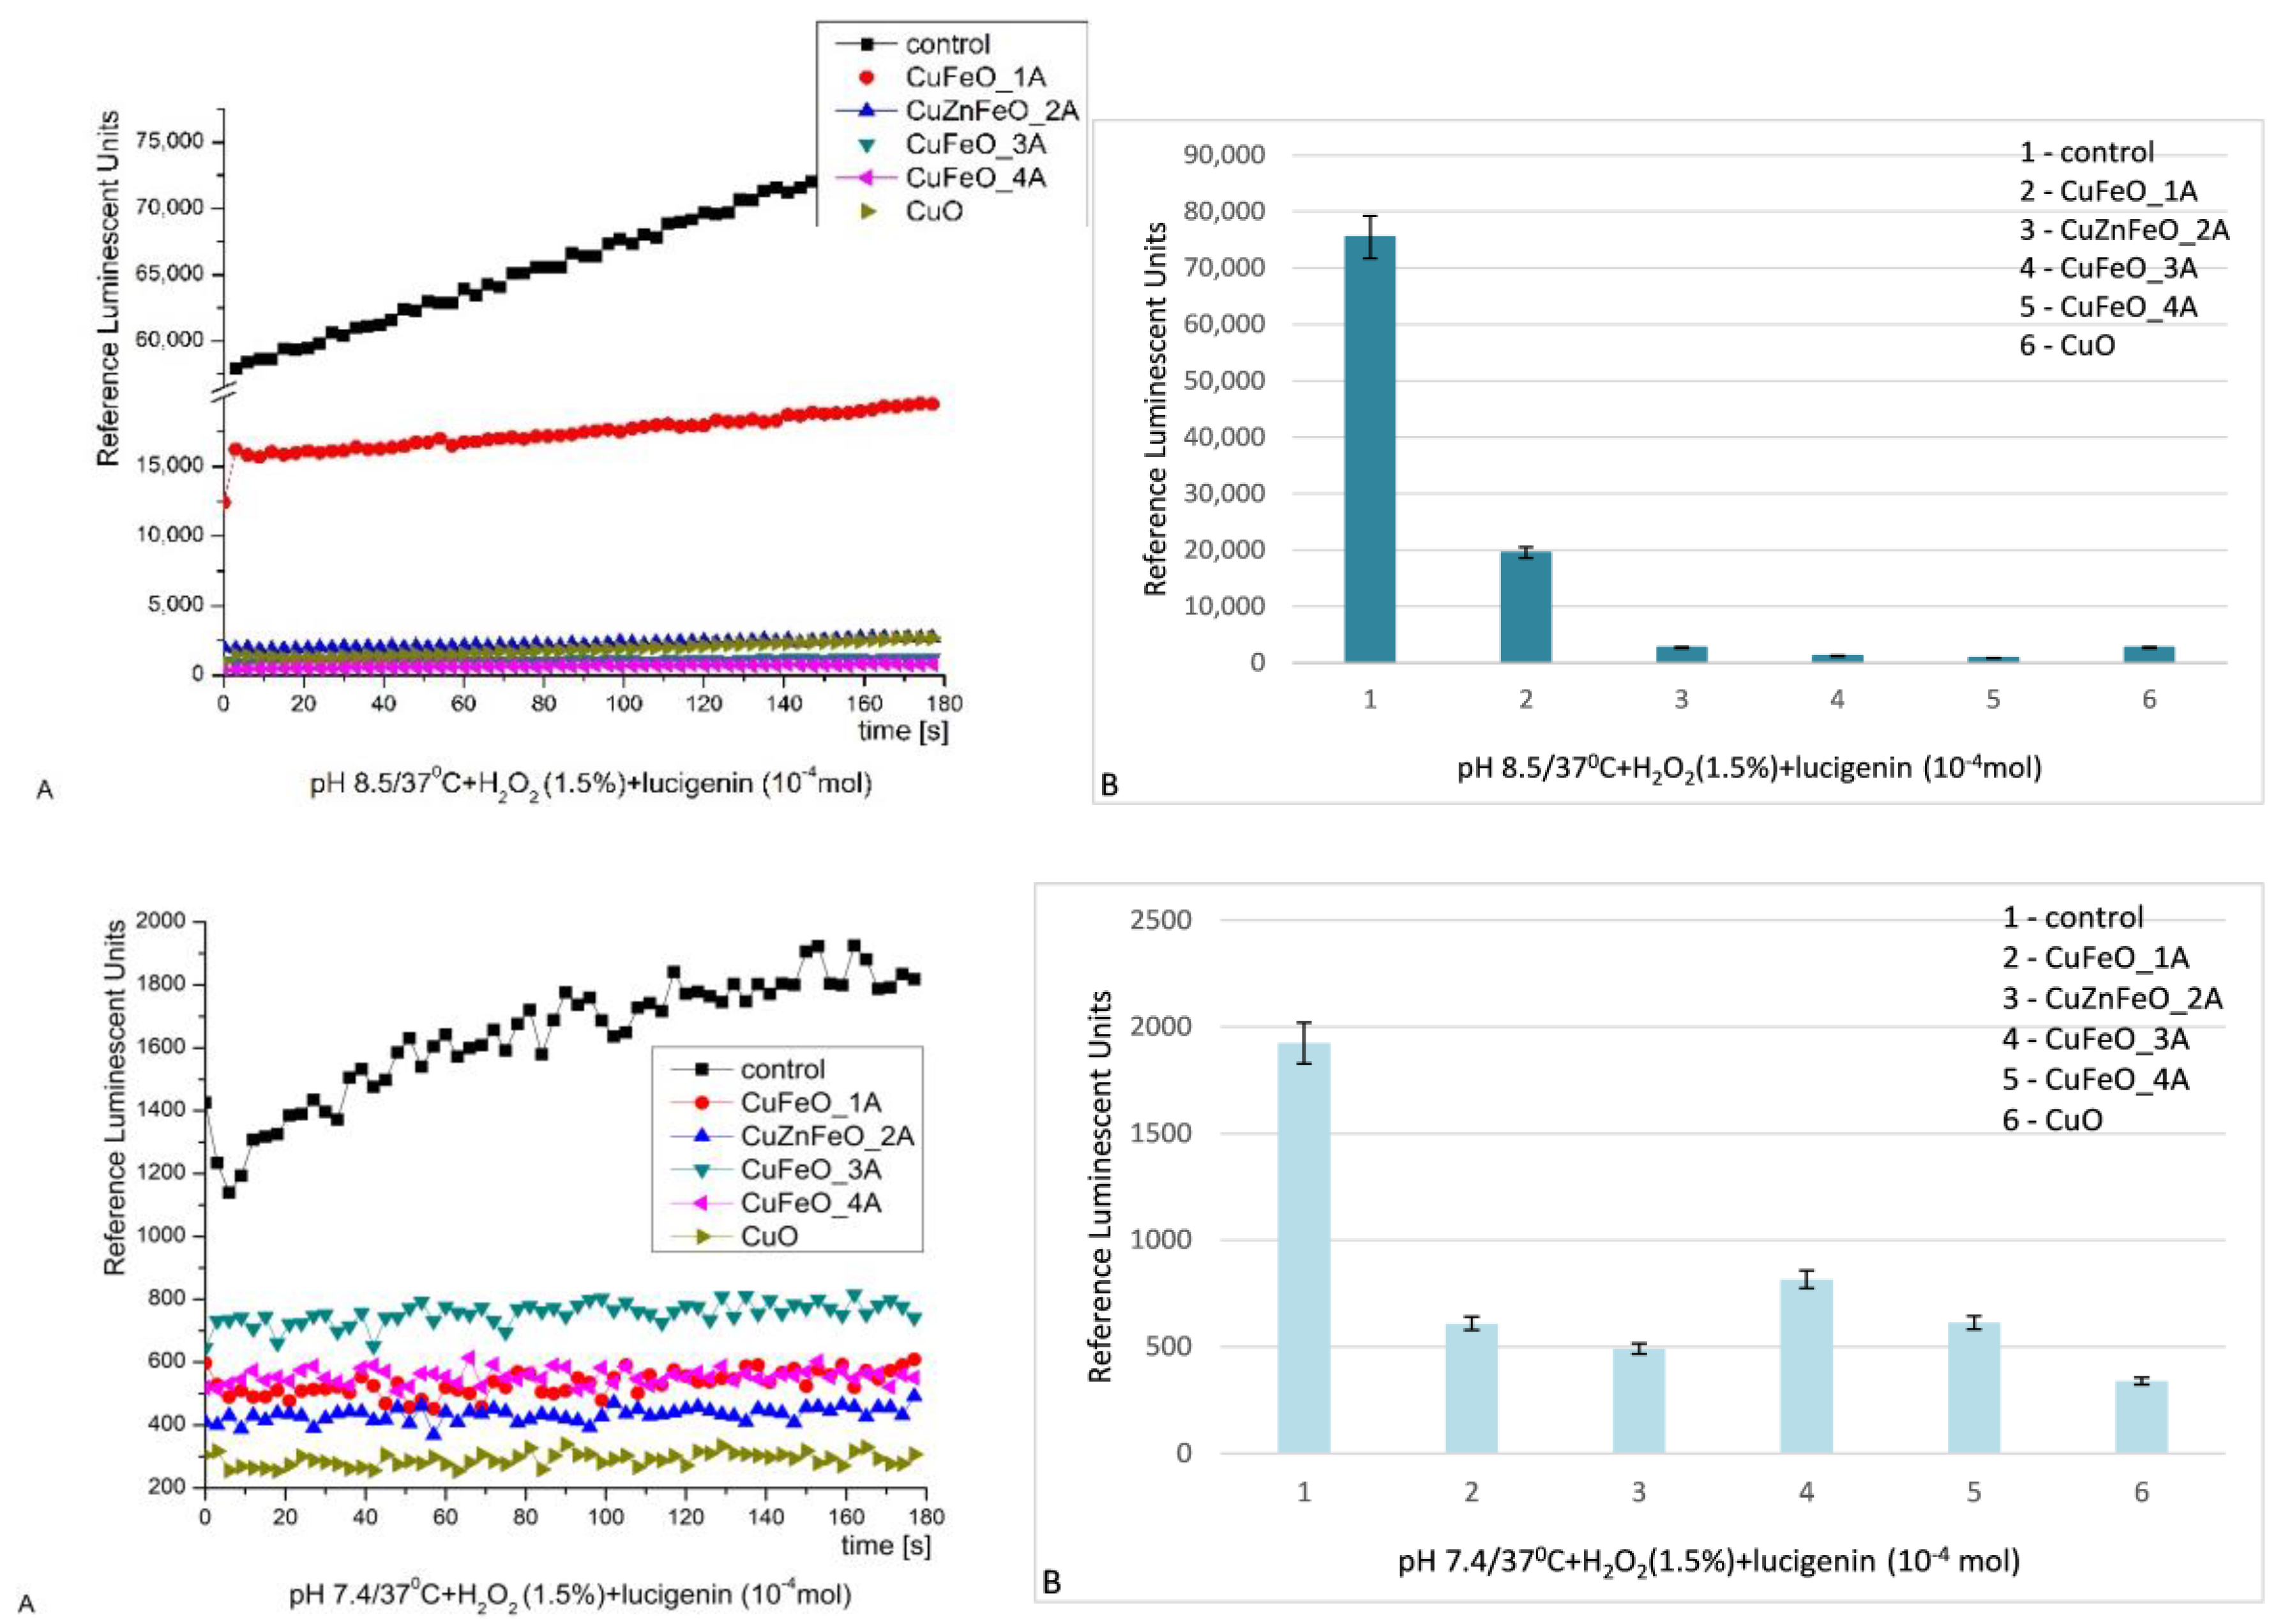
Figure 8.
NAD.H-PhMS chemiluminescence induced by O2.- radicals at pH 8.5 (A-kinetics, B-maximums) and pH 7.4 (A-kinetics, B-maximums) and the effect of newly synthesized nano-ceramic materials (p ≤ 0.05).
Figure 8.
NAD.H-PhMS chemiluminescence induced by O2.- radicals at pH 8.5 (A-kinetics, B-maximums) and pH 7.4 (A-kinetics, B-maximums) and the effect of newly synthesized nano-ceramic materials (p ≤ 0.05).
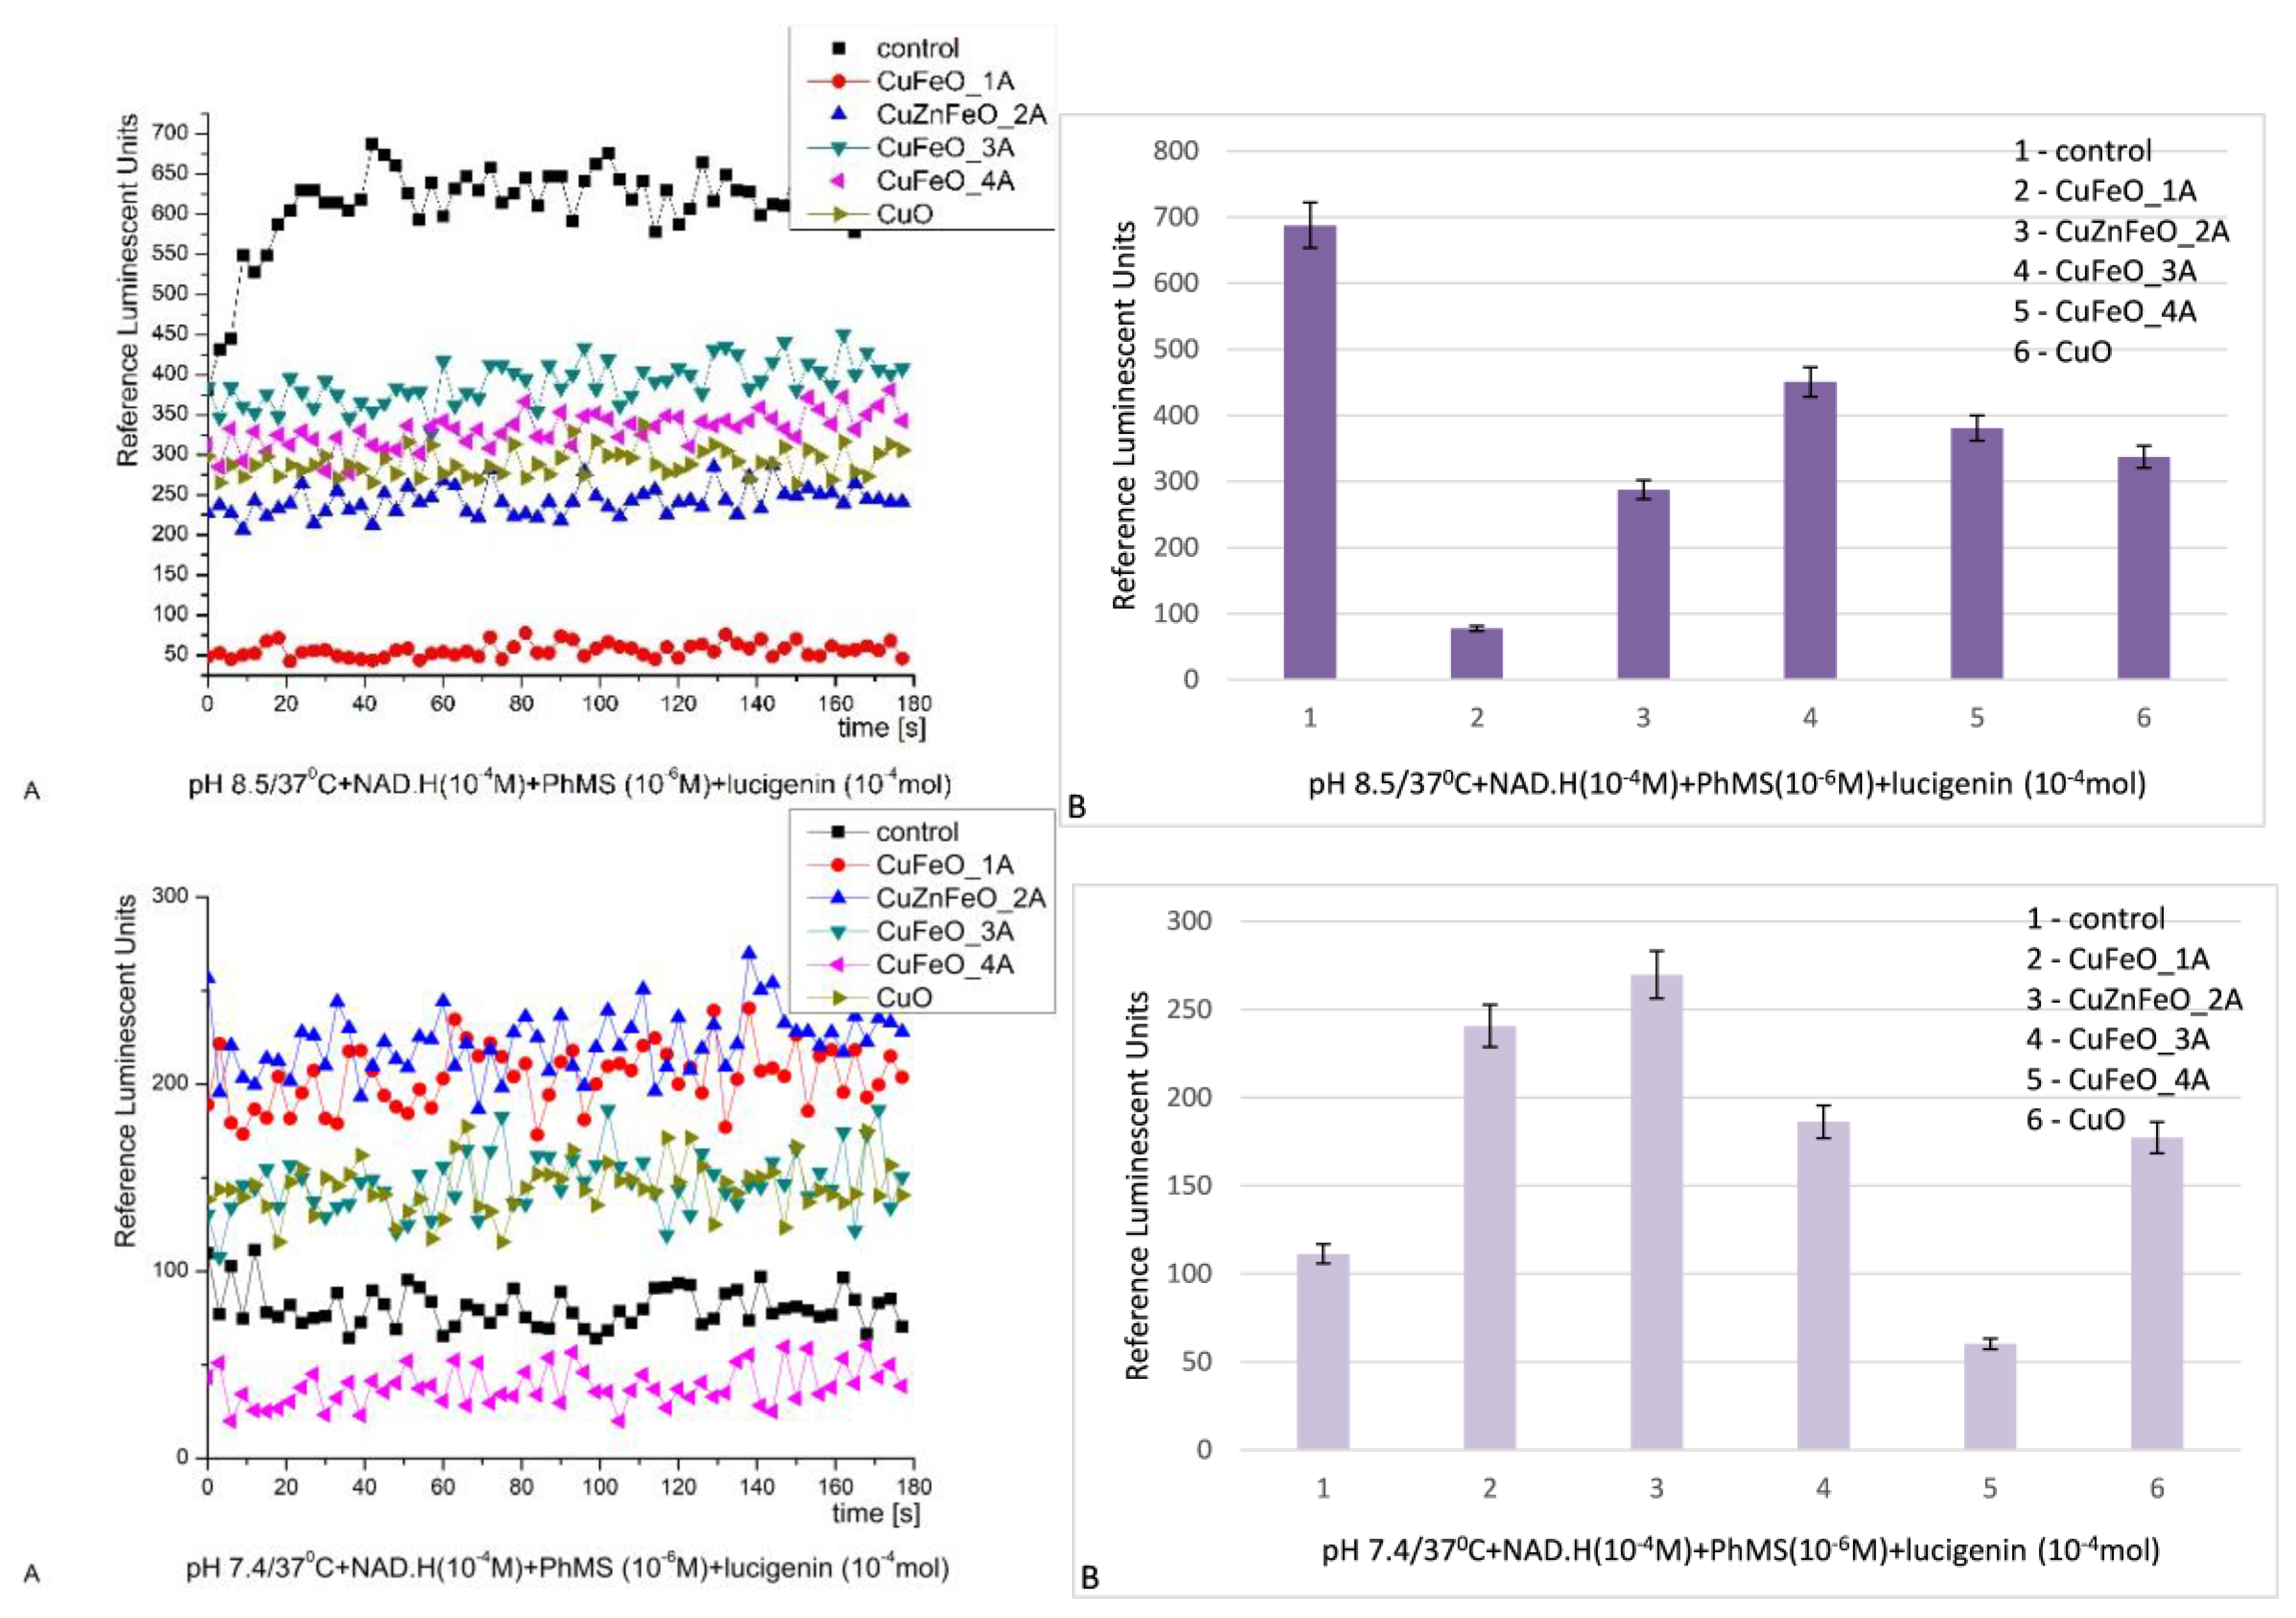
Figure 9.
Survival of Daphnia magna treated with CuFeO_1A.
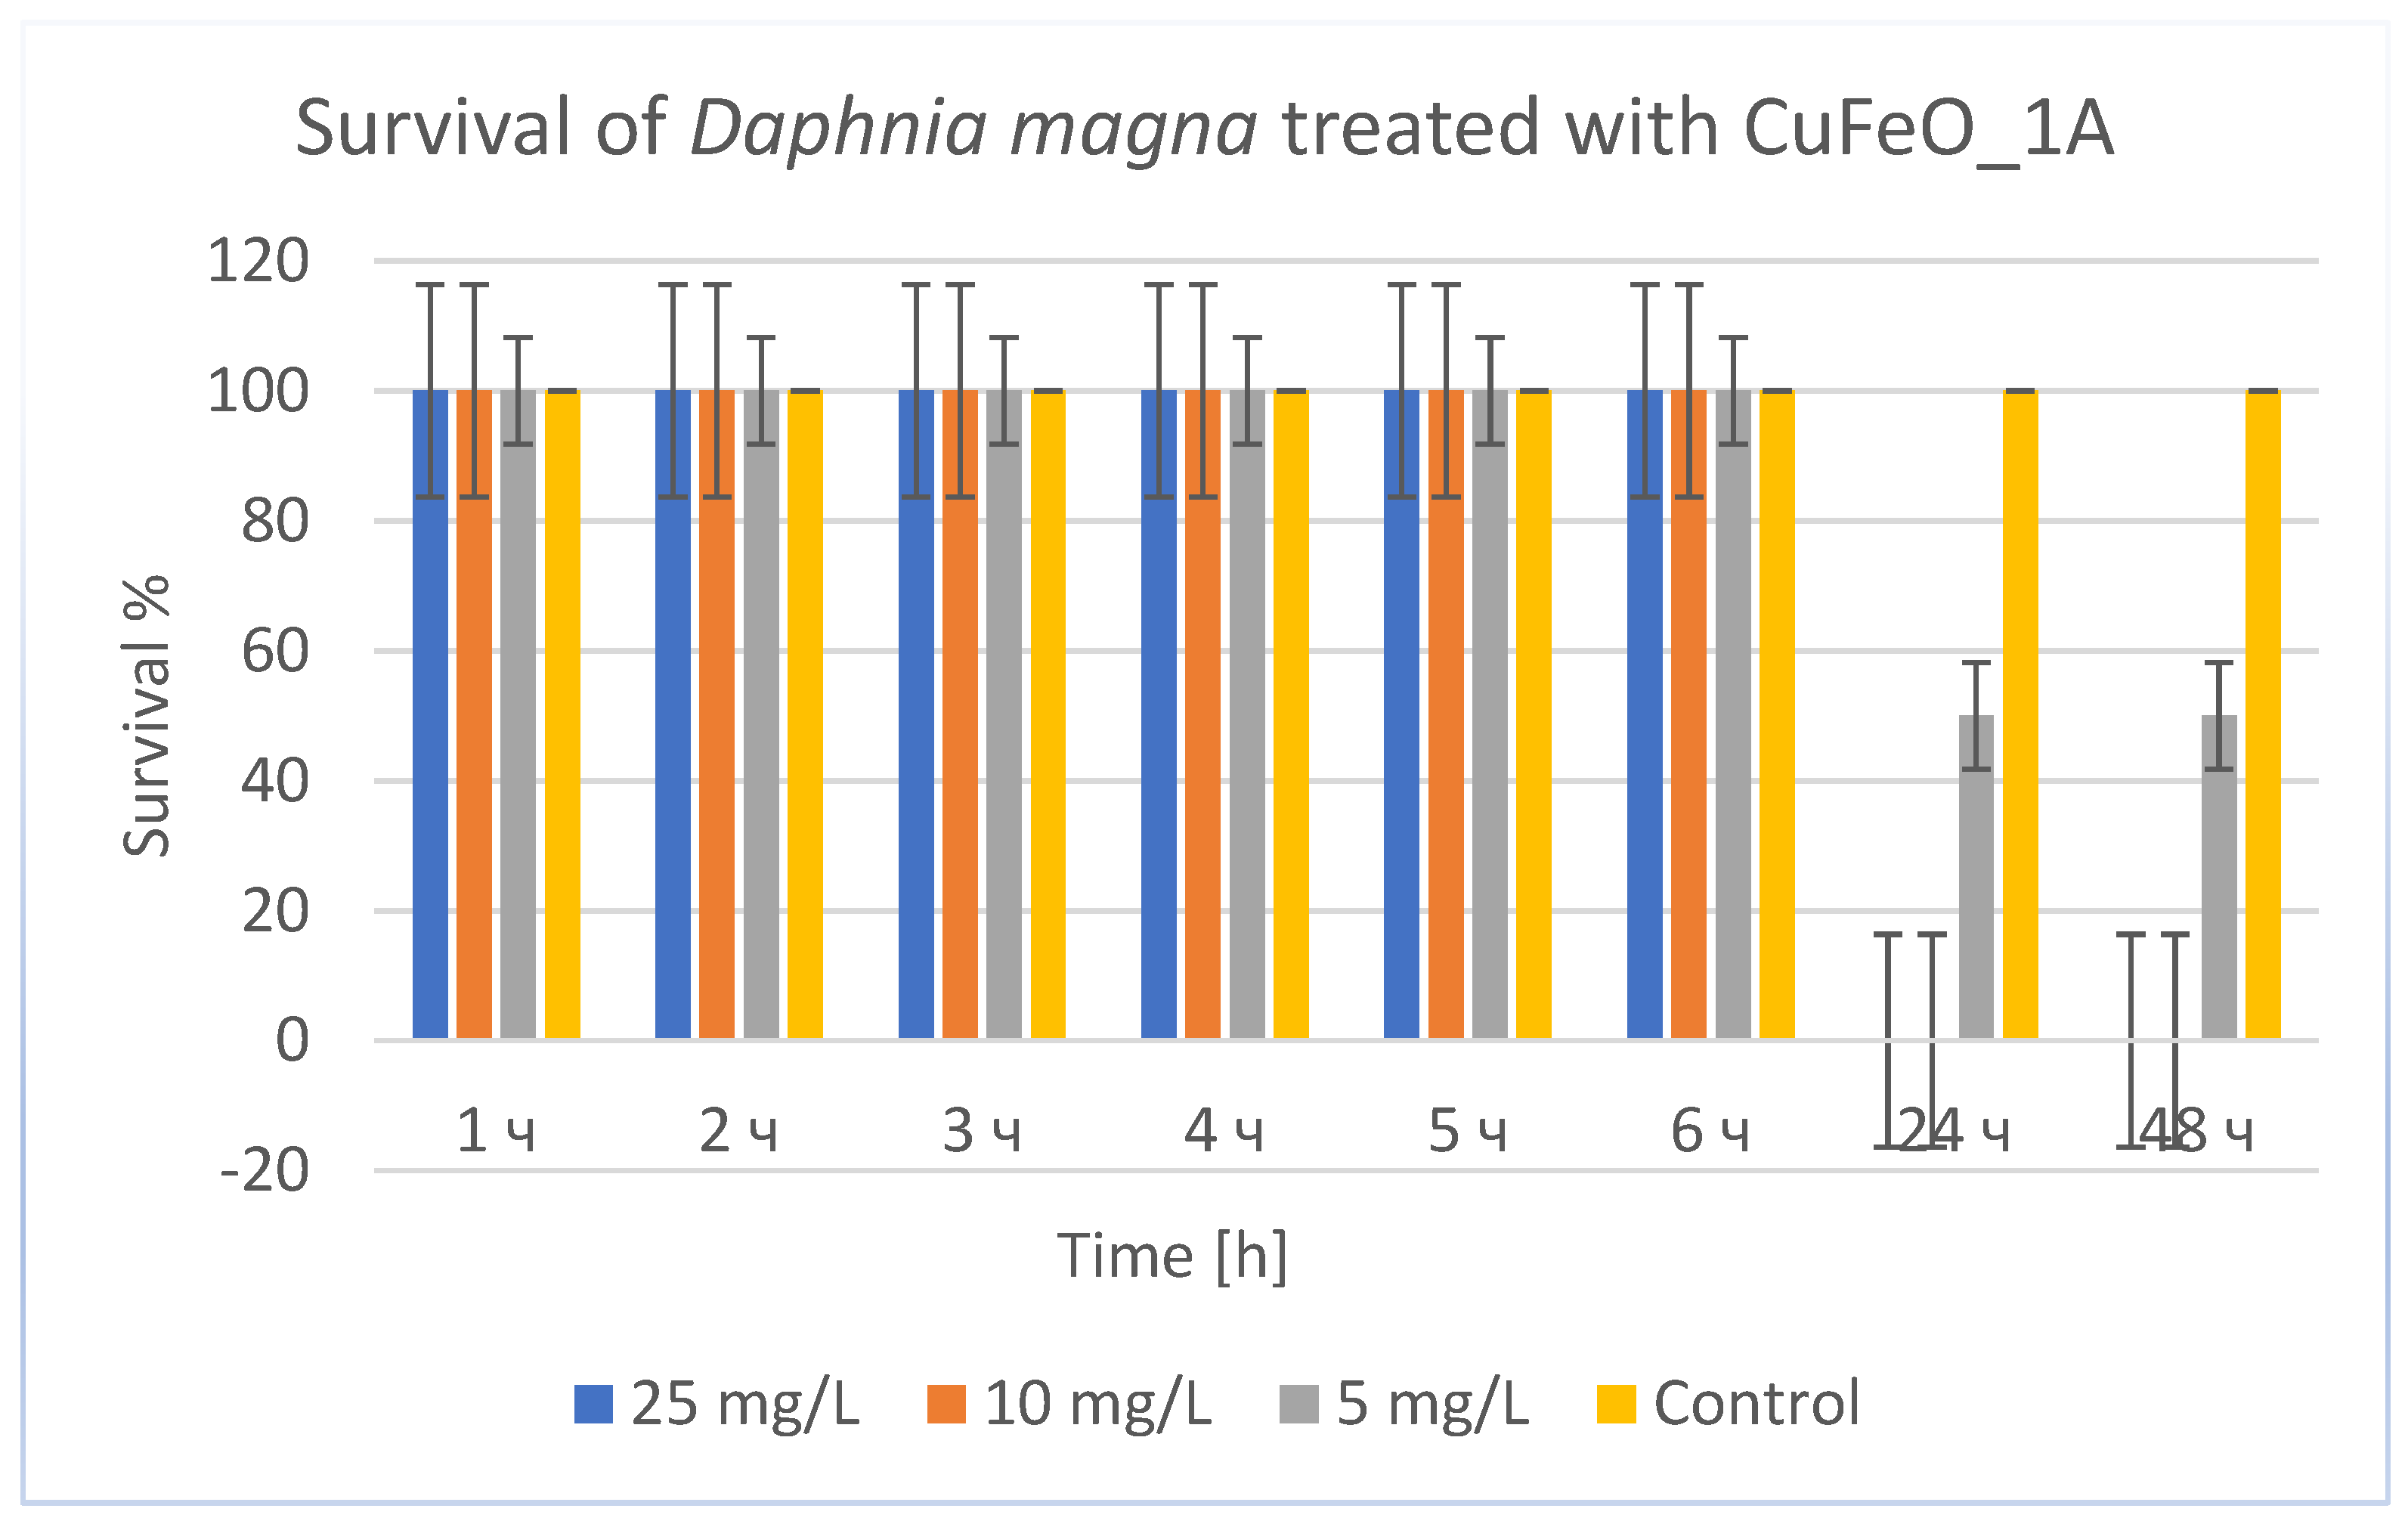
Figure 10.
Survival of Daphnia magna treated with CuZnFeO_2A.
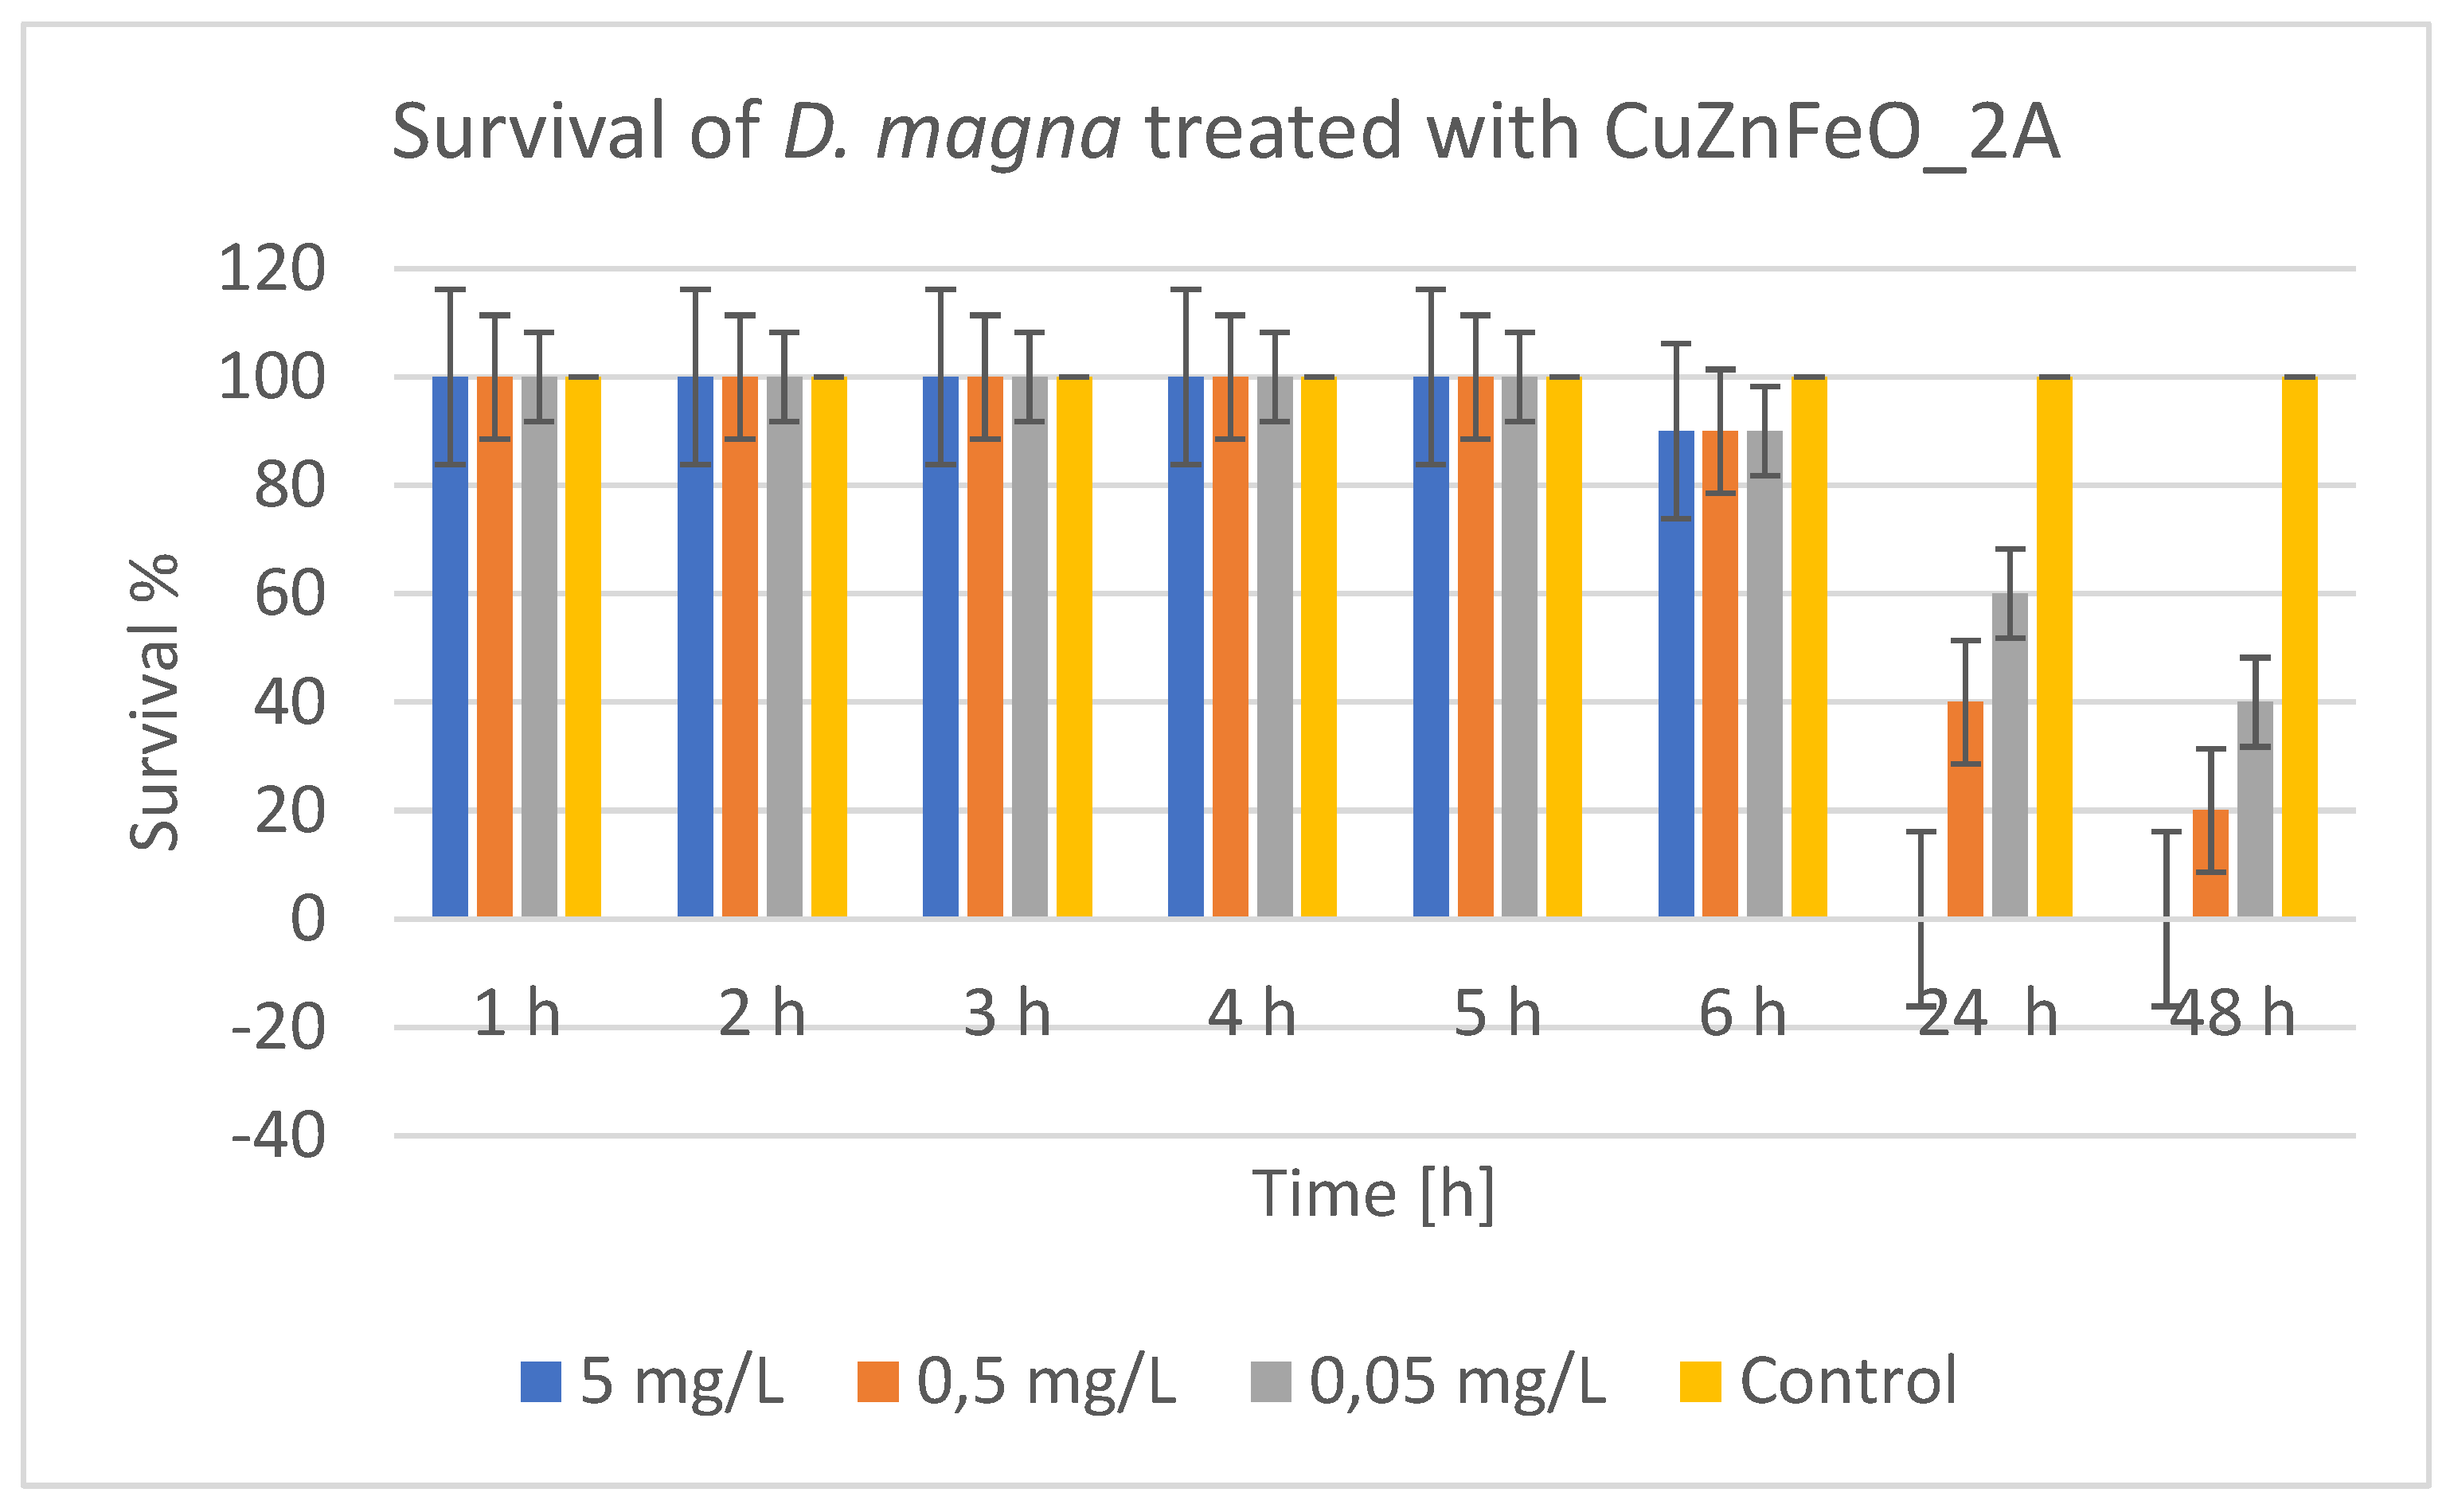
Figure 11.
Survival of Daphnia magna treated with CuFeO_3A.
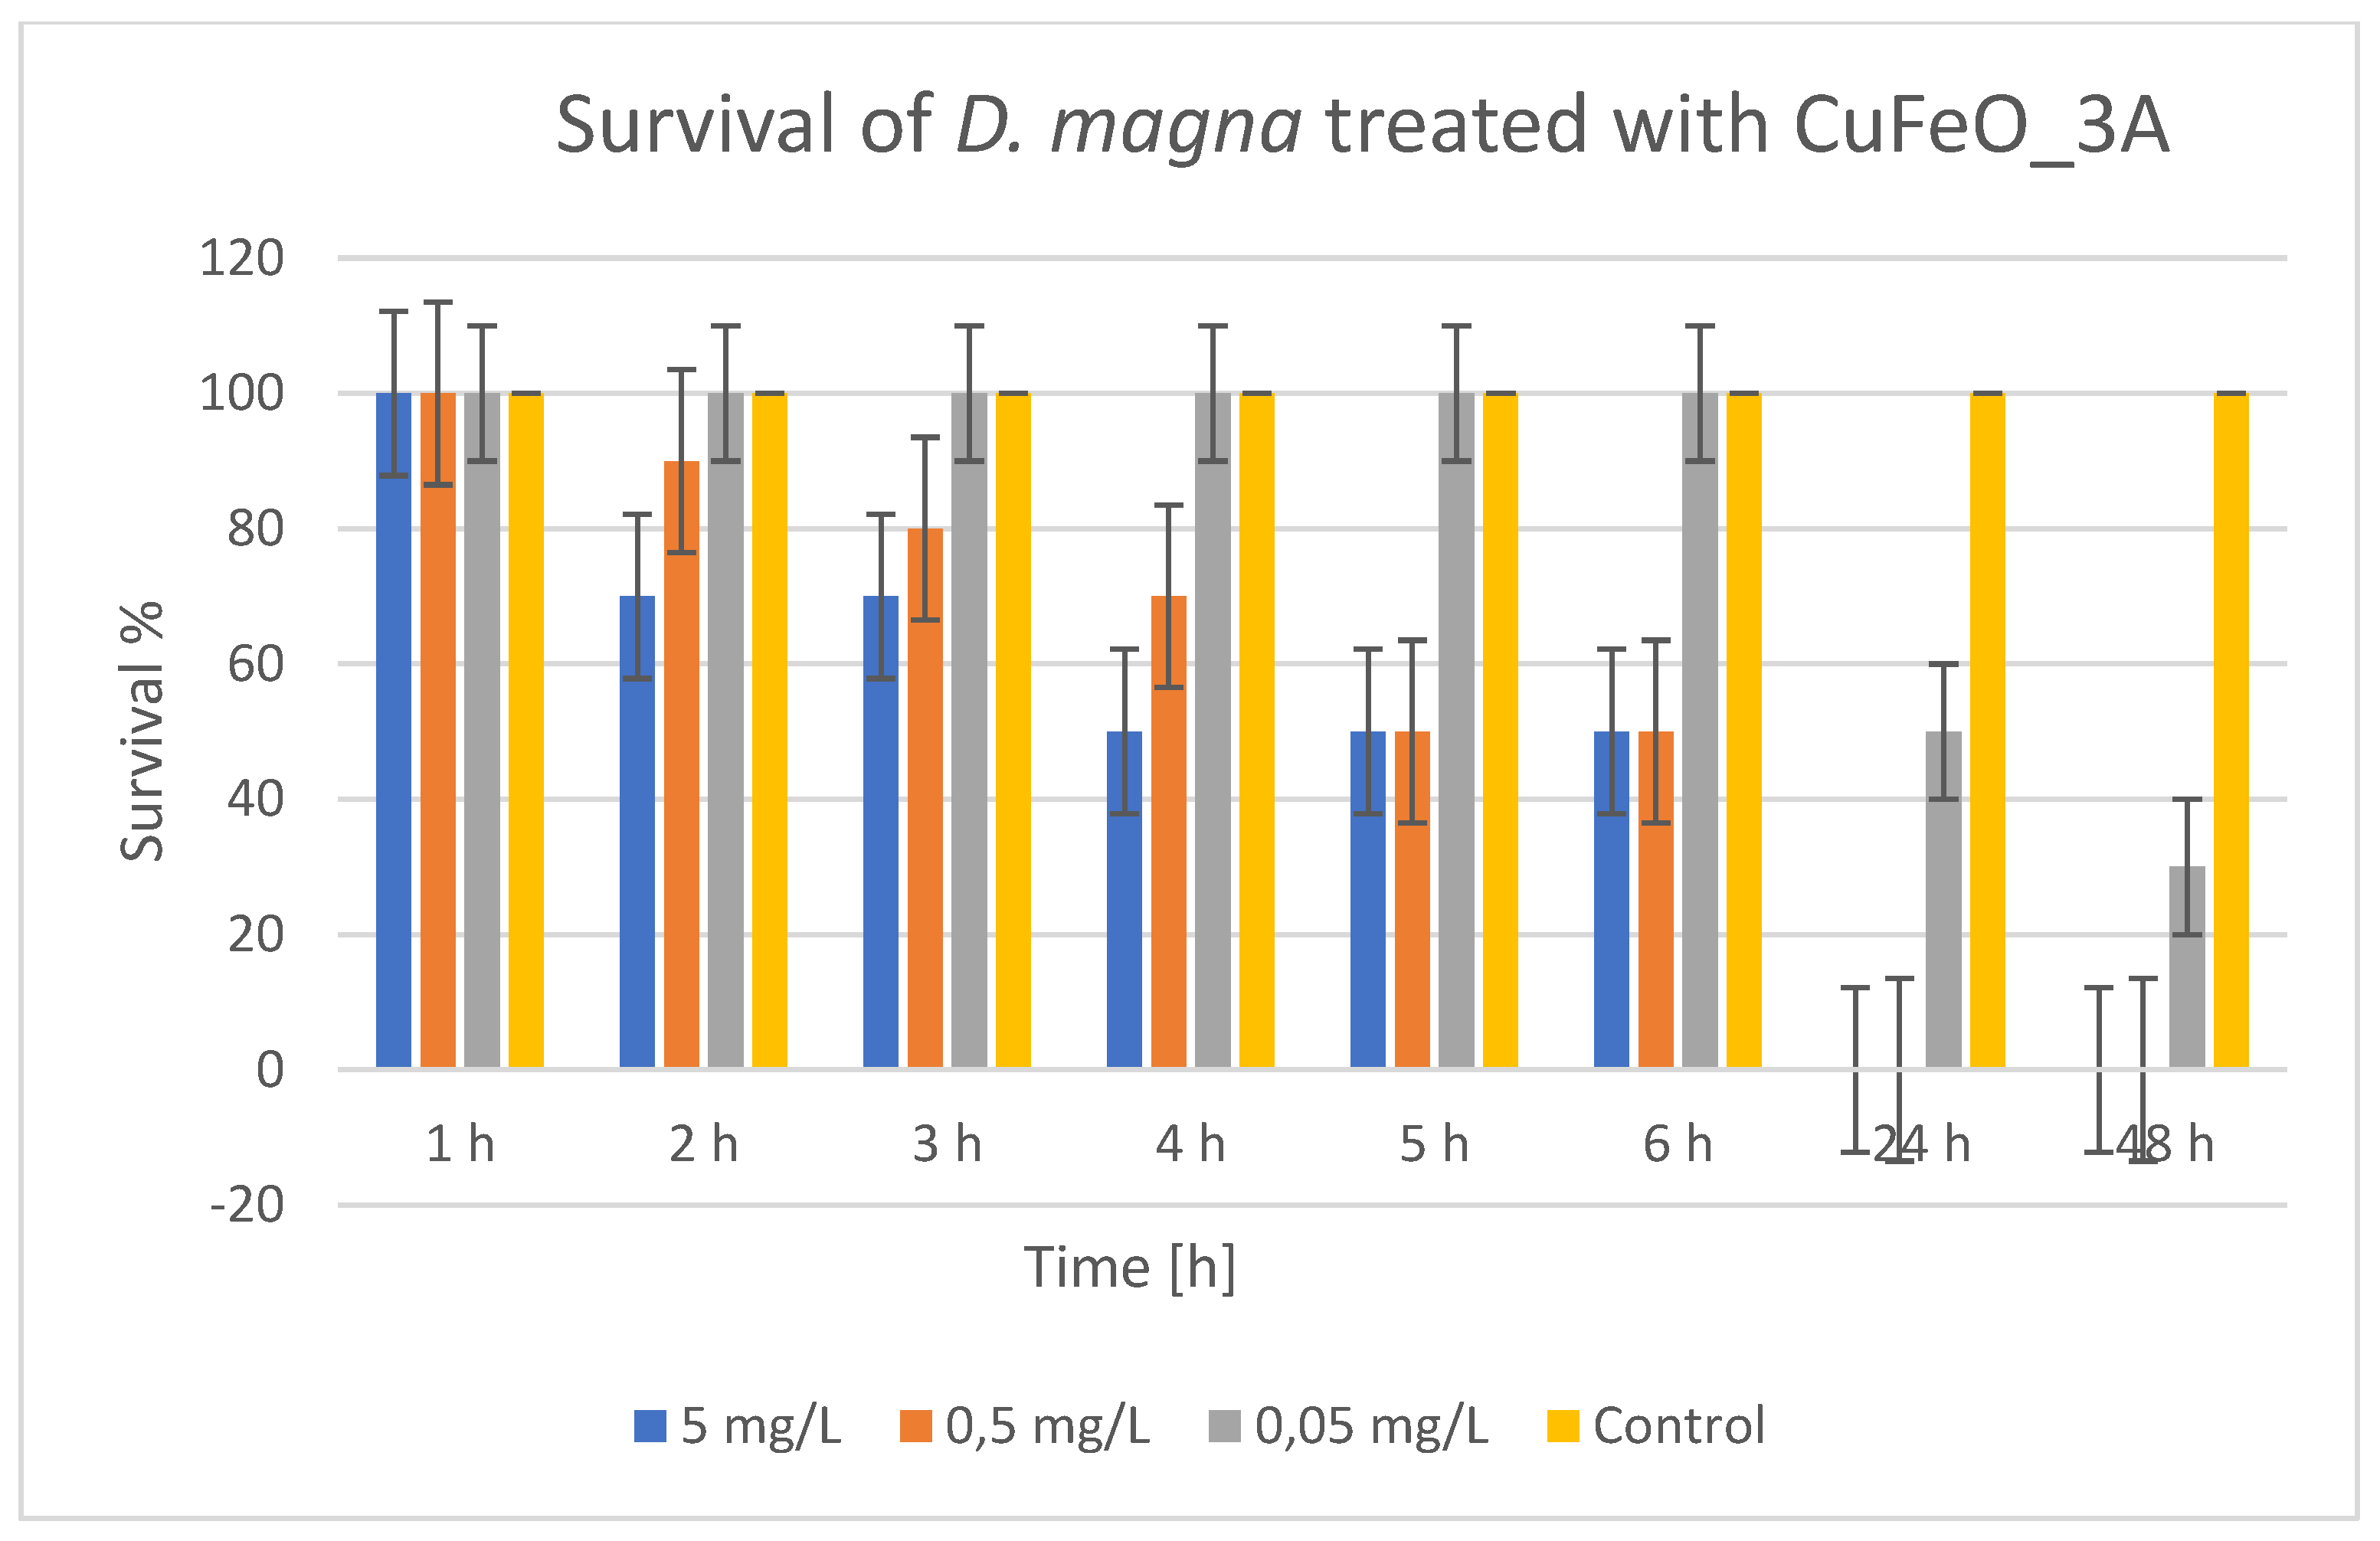
Figure 12.
Survival of Daphnia magna treated with CuFeO_4A.
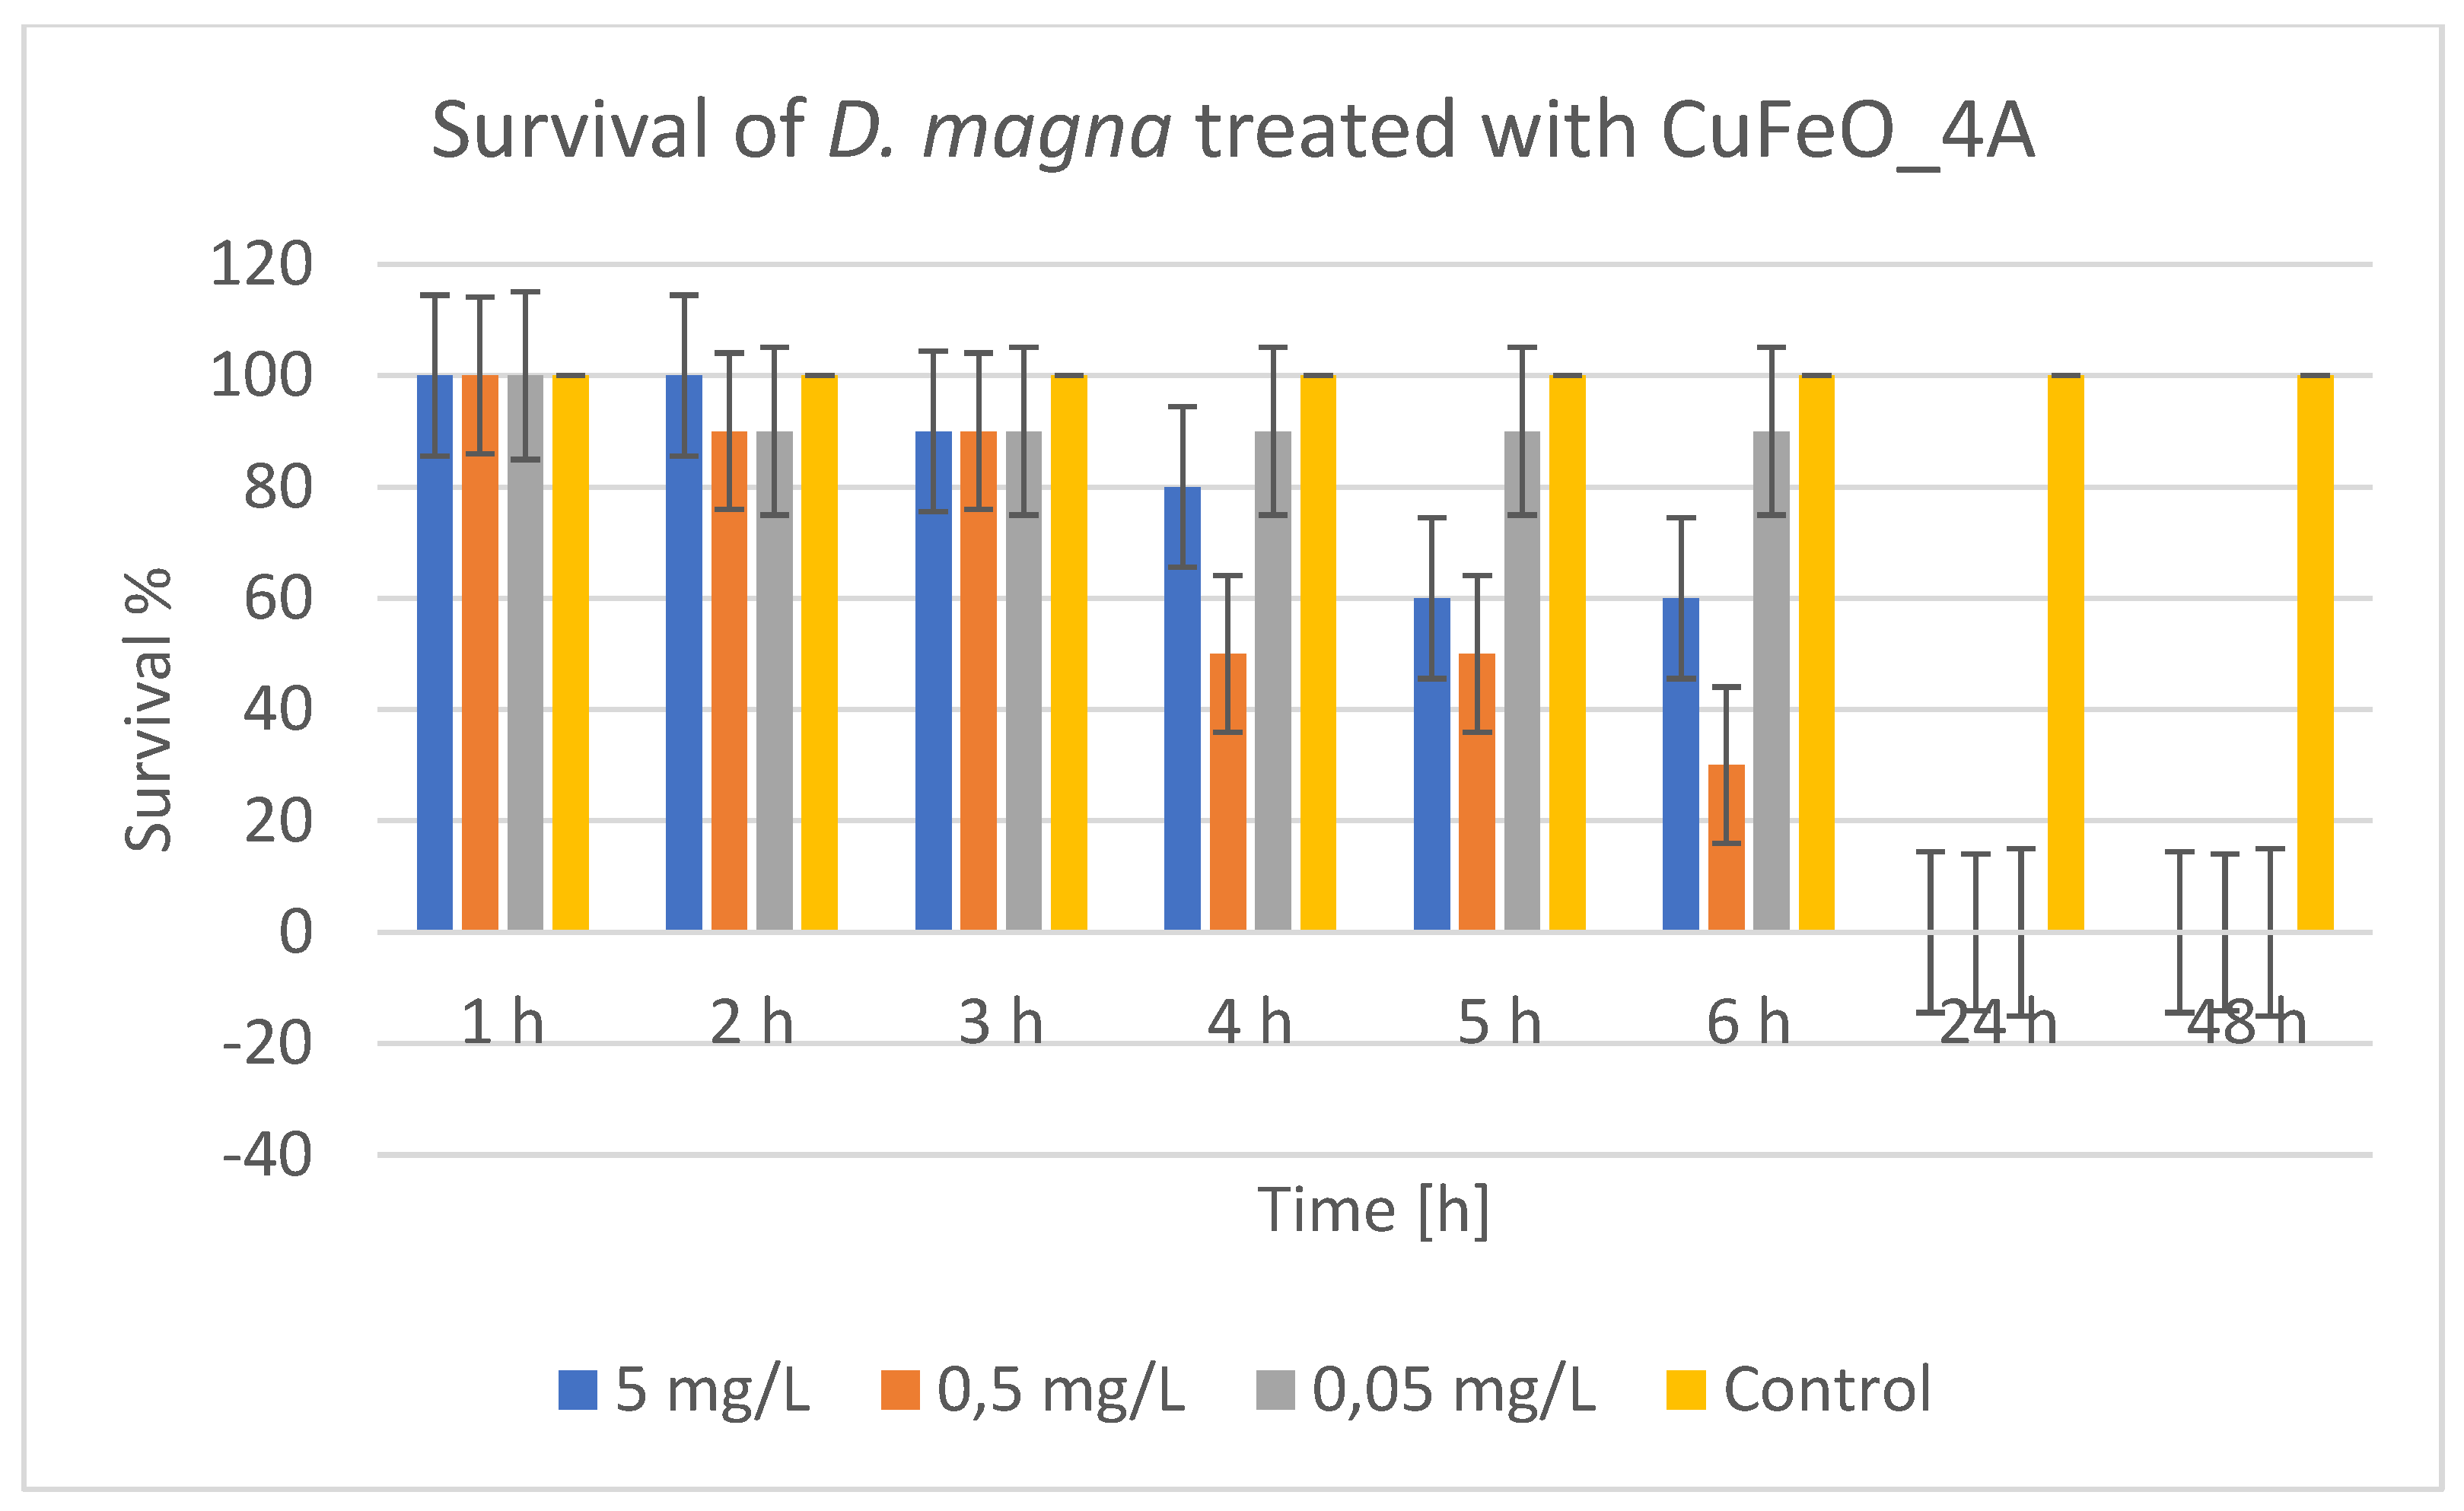
Figure 13.
Survival of Daphnia magna treated with nCuO.
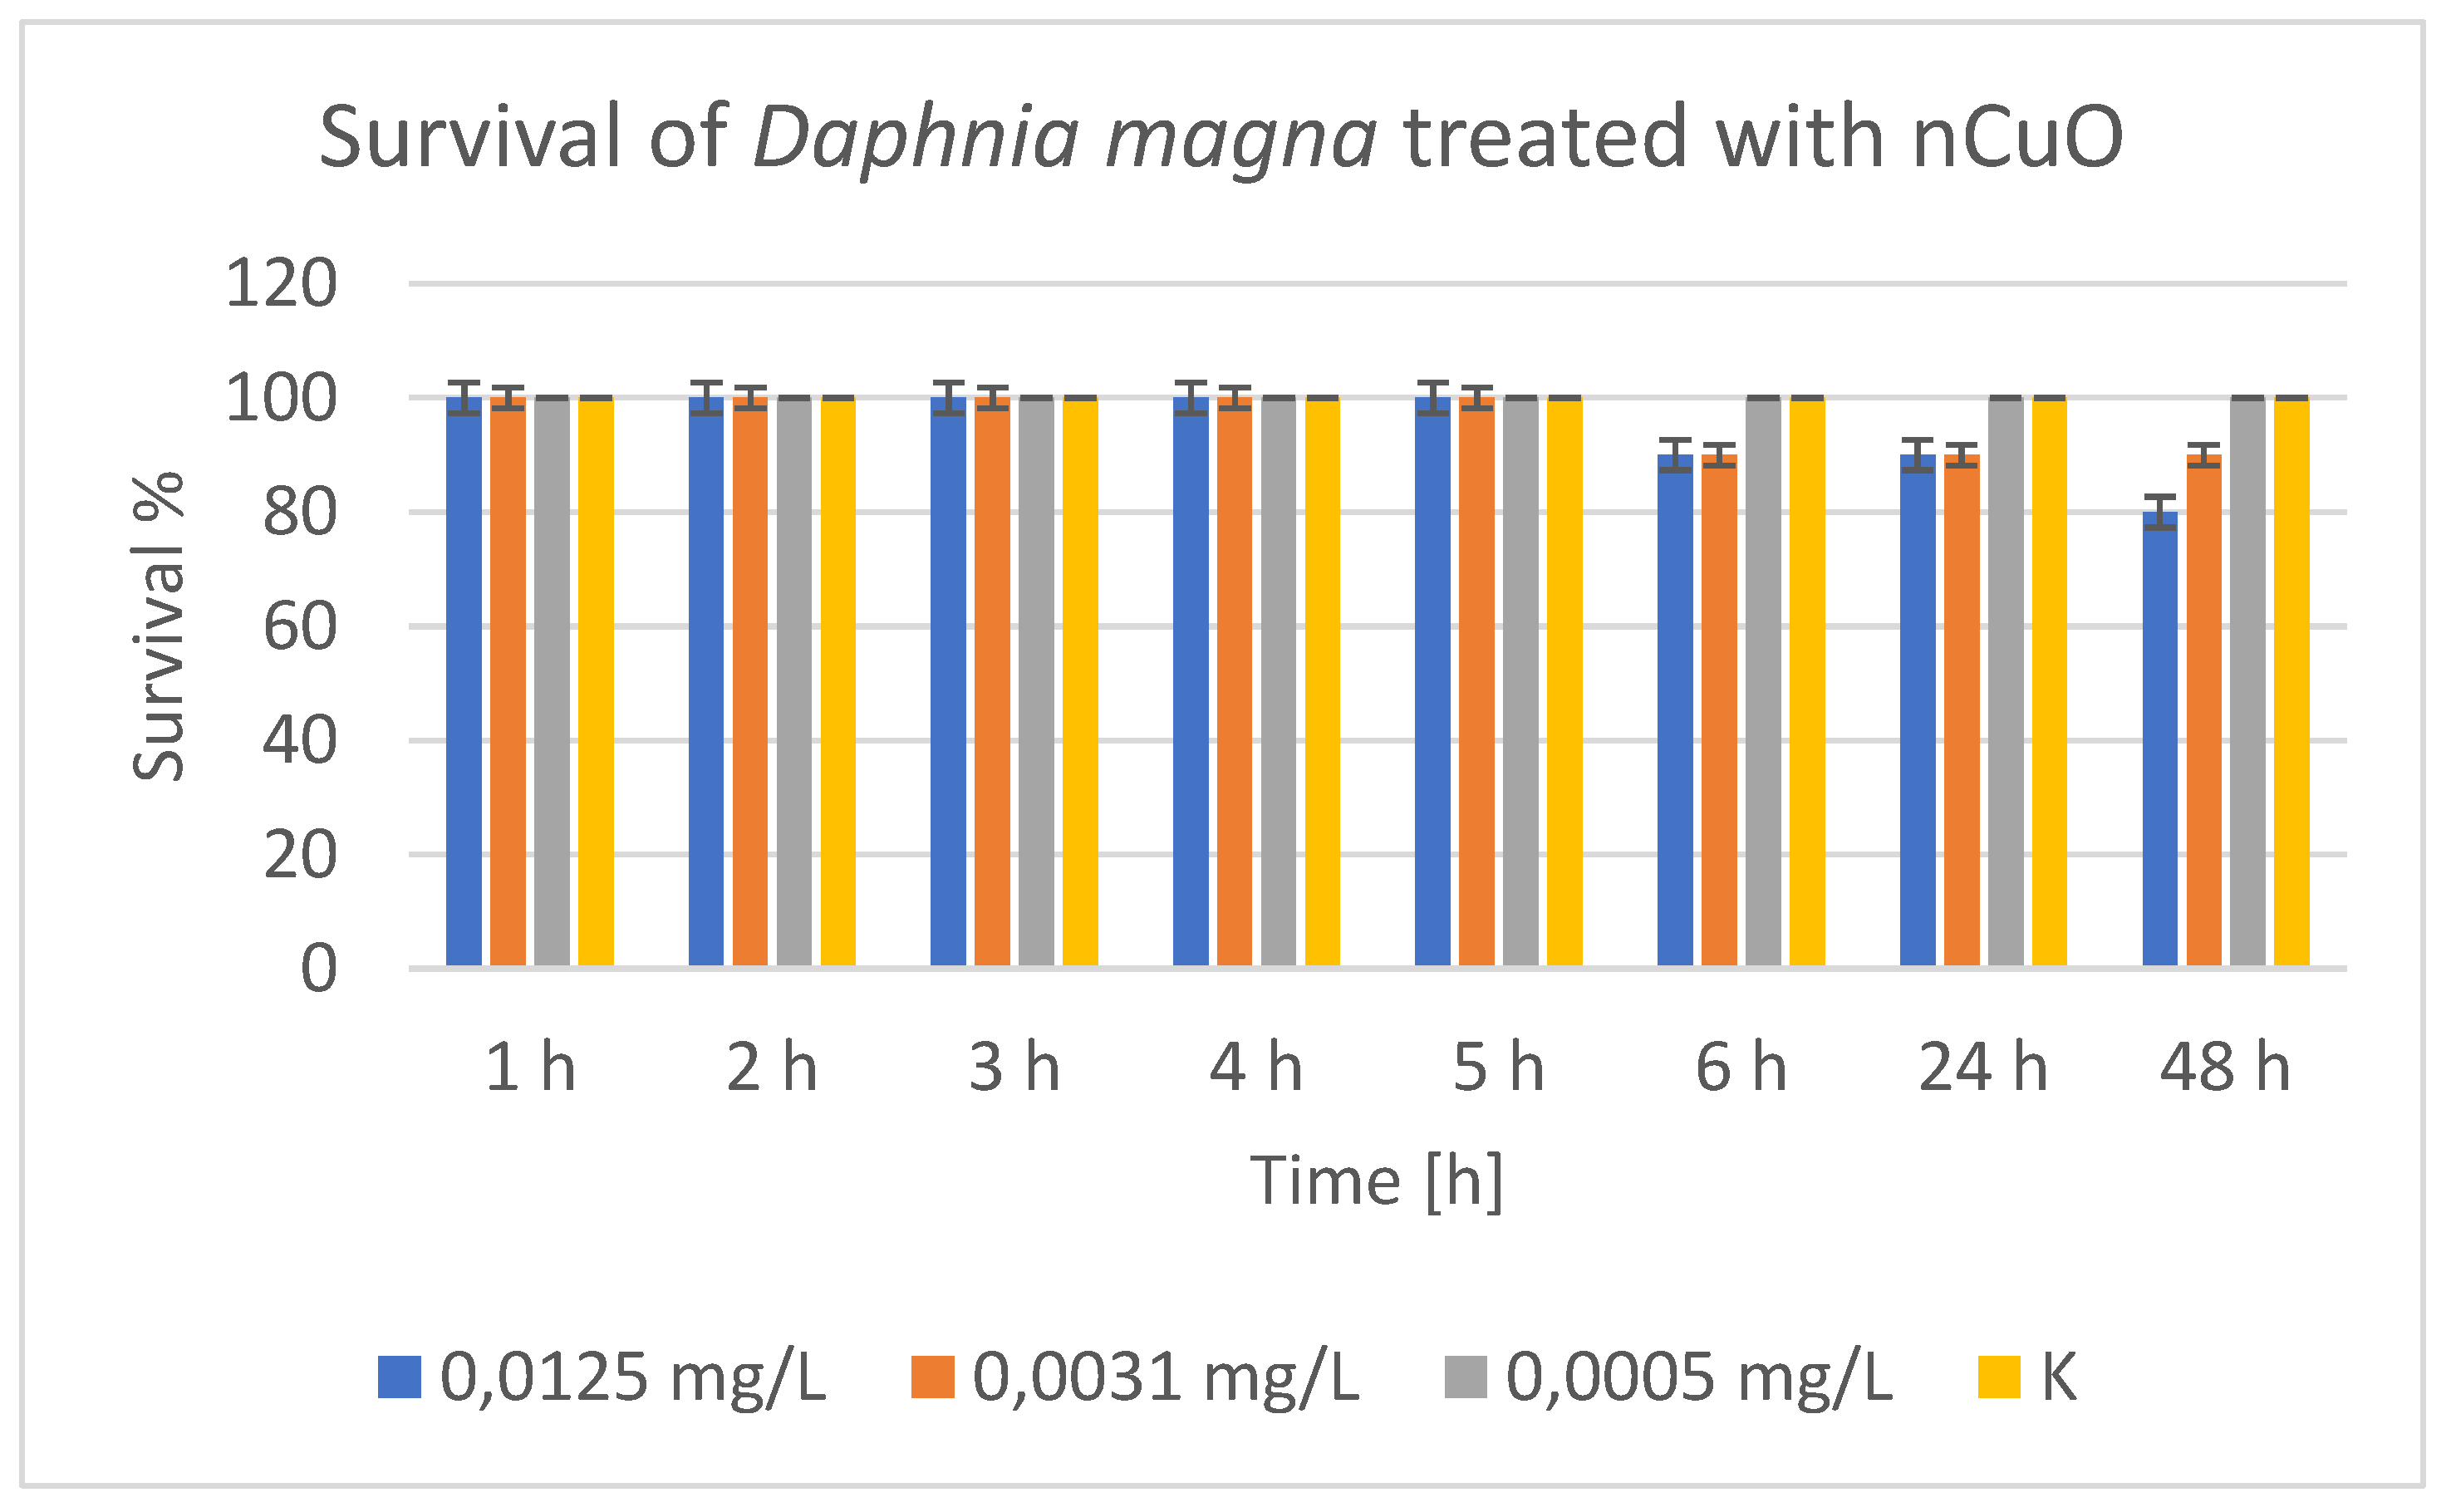
Table 2.
Inhibitory and prooxidant effects of nano-ceramic materials in ROS-generating systems.
| SYSTEM / ROS | pH, 370C | OBSERVATION | MOST ACTIVE NANOMATERIALS |
EFFECT (FOLDS) | TYPE OF EFFECT |
| Fenton’s system (.OH, .OOH, H2O2, -OH) |
8.5 (optimal) |
all materials showed definitive inhibitory activity |
CuFeO_3A CuFeO_4A |
128× 113× |
strong inhibition |
| Fenton’s system (.OH, .OOH, H2O2, -OH) |
7.4 (physiological) |
all materials suppressed oxidation | CuFeO_1A CuZnFeO_2A |
4.5× 4.2× |
moderate inhibition |
| H₂O₂ system |
8.5 (optimal) |
all materials inhibited oxidation | CuFeO_4A | 88× | strong inhibition |
| H₂O₂ system |
7.4 (physiological) |
well distinguished suppression of the oxidation | CuO | ~6× | clear inhibition |
| O₂.⁻ radicals | 8.5 (optimal) |
strong inhibition observed | CuFeO_1A | 8.8× | strong inhibition |
| O₂.⁻ radicals | 7.4 (physiological) | oxidation suppression converted into prooxidant effect; only CuFeO_4A showed inhibition |
CuFeO_1A (prooxidant), CuFeO_4A (inhibitory) |
CuFeO_1A >2.4× CuFeO_4A <2× |
prooxidant / weak inhibition |
Table 3.
Agar well tests results against Escherichia coli at various nanomaterial concentrations – 10.0, 5.0, 2.5, 1.0, и 0.1 mg/ml, including a nanocrystalline sample of CuO as a reference.
Table 3.
Agar well tests results against Escherichia coli at various nanomaterial concentrations – 10.0, 5.0, 2.5, 1.0, и 0.1 mg/ml, including a nanocrystalline sample of CuO as a reference.
| Active material | 10 mg/ml | 5 mg/ml | 1.0 mg/ml | 0.1 mg/ml |
|---|---|---|---|---|
| nCuO | BC | BC | MBC | MIC |
| CuFeO 1A | MBC | MIC | NO EFFECT | NO EFFECT |
| CuZnFeO 2A | MBC | MIC | NO EFFECT | NO EFFECT |
| CuFeO 3A | MBC | MIC | NO EFFECT | NO EFFECT |
| CuFeO 4A | MBC | MIC | NO EFFECT | NO EFFECT |
Table 4.
Agar well tests results against Staphylococcus aureus at various concentrations of the powder material: 10.0, 5.0, 2.5, 1.0, and 0.1 mg/ml, for all tested materials as well as the nanocrystalline nCuO reference material.
Table 4.
Agar well tests results against Staphylococcus aureus at various concentrations of the powder material: 10.0, 5.0, 2.5, 1.0, and 0.1 mg/ml, for all tested materials as well as the nanocrystalline nCuO reference material.
| Active material | 10 mg/ml | 5 mg/ml | 1.0 mg/ml | 0.1 mg/ml |
|---|---|---|---|---|
| nCuO | BC | BC | MBC | MIC |
| CuFeO 1A | NO EFFECT | NO EFFECT | NO EFFECT | NO EFFECT |
| CuZnFeO 2A | MBC | MIC | NO EFFECT | NO EFFECT |
| CuFeO 3A | NO EFFECT | NO EFFECT | NO EFFECT | NO EFFECT |
| CuFeO 4A | MBC | MIC | NO EFFECT | NO EFFECT |
Disclaimer/Publisher’s Note: The statements, opinions and data contained in all publications are solely those of the individual author(s) and contributor(s) and not of MDPI and/or the editor(s). MDPI and/or the editor(s) disclaim responsibility for any injury to people or property resulting from any ideas, methods, instructions or products referred to in the content. |
© 2025 by the authors. Licensee MDPI, Basel, Switzerland. This article is an open access article distributed under the terms and conditions of the Creative Commons Attribution (CC BY) license (http://creativecommons.org/licenses/by/4.0/).
Copyright: This open access article is published under a Creative Commons CC BY 4.0 license, which permit the free download, distribution, and reuse, provided that the author and preprint are cited in any reuse.


