
Submitted:
01 November 2025
Posted:
04 November 2025
You are already at the latest version
Abstract
We present a Vehicle-to-Grid (V2G) simulation study to reduce the electrical peak load in the San Diego area by taking advantage of the energy stored in Electric Vehicles (EVs). Specifically, our study focuses on using EVs and Vehicle-to-Grid/Everything (V2G/V2X) technologies as a solution to reduce costly grid infrastructure upgrades, in conjunction with the expected growth in transportation electrification in California. The results can be used to inform the California Public Utilities Commission (CPUC) of the potential of V2G/V2X as mobile distributed energy resources (DERs). If vehicles are charged during the day with power from local solar arrays mounted over parking lots, they could then take the charge home and deliver some of it to the grid or to homes, potentially ameliorating the well-known ``duck curve" issue, but without the need for costly infrastructure upgrades. Our study supports the conclusion that EVs and V2G/V2X technology have the potential to reduce peak load in the worst-case scenario by discharging just a fraction of energy from EV batteries.
Keywords:
electric vehicles
; community energy storage
; Vehicle-to-grid (V2G)
1. Introduction and Motivation
California has ambitious decarbonization goals, among them to have 8 million zero emission vehicles on the road by 2030 [1] and to replace space and water heating in buildings with electric heat pumps [2]. This will not only require an expansion of electricity generation but also the capacity to deliver electricity. The CPUC commissioned a study on the impact of the anticipated load growth on the distribution system if traditional methods are used to increase capacity [3]. The modeled cost was approximately $50 billion by 2035 for distribution infrastructure alone, not counting new generation or transmission. These daunting cost estimates have led to widespread interest in non-wire solutions as an alternative to costly upgrades to the distribution system [4]. Despite this, there have been few studies that have examined the role V2G-capable EVs could play as a non-wire solution in deferring upgrades to the distribution infrastructure. The CPUC, in its Integrated Resource Planning process, has begun to model the impact of bidirectional EVs (BEVs), but this is in the context of their capacity to store electricity to support the grid as a whole, not as a method of deferring infrastructure upgrades [5]. This is significant because under CA Senate Bill SB233, the California Energy Commission (CEC) is authorized to mandate bidirectionality in any class of EV in which it finds a compelling use case. Therefore, it is important to compile data on this specific use case.
The adoption of the EV and V2G technology comes from the need to achieve the zero-emission vehicle (ZEV) goals that California has for 2030. Recent California regulations and policies for the transition to a cleaner, safer, and electrified future are briefly described below:
- Executive order B-48-18 of Jan 2018 directs the state government to meet a series of milestones toward a long-term target of 1.5 million ZEVs on California’s roadways by 2025 and 5 million by 2030,
- Senate Bill 100 (DeLeon) 2018 sets a 2045 goal of powering all retail electricity sold in California and state agency electricity needs with renewable and zero-carbon resources, with mandated 60% of Renewable Portfolio Standard by 2030 and 100% by 2045,
- Executive order N-79-20 Sept 2020 that stipulates that 100% of in-state sales of new passenger cars and light-duty trucks must be zero-emission by 2035, and that 100% of medium- and heavy-duty vehicle sales must be zero emission by 2045, where feasible, and
- Senate Bill SB233 of Sept 2023 that authorizes the state board, in consultation with the California Energy Commission (CEC) and the CPUC, to require any weight class of battery electric vehicle to be bidirectional capable if the state board determines there is a sufficiently compelling beneficial bidirectional-capable use case to the battery electric vehicle operator and the electrical grid.
In order to meet those objectives, 8 million light-duty and 180,000 medium and heavy-duty ZEVs need to be on the roads by 2030. Concomitantly, the CPUC conducted two studies on the EV charging infrastructure required to support this, summarized in the report “Electric Vehicle Charging Infrastructure Assessment Analyzing Charging Needs to Support ZEVs in 2030,” and the Feb. 2023 report “Modeling Assumptions for the 2023-2024 Transmission Planning Process” on required transmission system upgrades. Based on the assumption that the power required to charge upcoming generations of EVs will be sourced from remote, utility-scale facilities that include utility solar farms, offshore wind, nuclear power from the Diablo Canyon power plant until 2030, and utility scale storage, the latter study concludes that by 2033, 21,738 MW of new battery storage, 1,524 MW of long-duration storage in the form of pumped hydro storage, and 41,148 MW of new in-state renewable resources will be required, that will necessitate 4,041 MW of partial or full transmission upgrades.
1.1. Proposed Idea and Study Contribution
The goal of this study is to determine the degree of penetration of BEVs that would be necessary in 2030 to defer upgrades to local distribution circuits in San Diego. Specifically, we examined five distribution circuits that are already scheduled for upgrades. We modeled the minimum number of BEVs that would be needed behind residential meters to give up part of their charge to avert the need to upgrade the circuit.
We have also used the methodology developed for this project to examine the impact of bidirectional EVs on the peak load in San Diego County as a whole. The local utility, San Diego Gas & Electric (SDG&E), has applied to build a new transmission line, the Golden Pacific Powerlink, to serve the county [6]. The new transmission line is expected to cost $2.3 billion and go into service in 2034. Using the same methodology we developed to ask how many BEVs would be needed to defer an upgrade of a distribution circuit, we can ask how many BEVs would be necessary in the county to defer a new transmission line.
Our pilot study [7], done under the auspices of the Center for Community Energy (CCE), a San Diego-based non-profit organization founded to advance the development of Community Choice Energy in the San Diego area, does exactly what [8] mentions, namely, show that EVs can work synergistically with the grid. Our study focuses on two key points not previously considered:
- EVs can move electricity as well as store it, and
- Transportation electrification is not an additional load but a synergistic support for building electrification.
Currently, the utility rate structure in California is designed to encourage EV owners to charge at night, preferably after midnight, but this is expected to change in the future. Electricity generated at night has a higher ratio of CO2 to kWh than electricity generated largely by PV during the day, as shown in Figure 1 [9].
Furthermore, there is currently enough solar power in California that there are frequent curtailments of utility-scale PV arrays [10]. For these reasons, California regulatory authorities are studying rate changes to encourage daytime or workplace charging [11,12]. The term “EV Happy Hour” was coined for this: denoting the hours from 10 AM to 4 PM when solar power is most abundant.
To this end, we are proposing a system in which, to the greatest extent possible, charging of EVs would occur during the day from distributed solar arrays over parking lots. The EVs would operate as mobile energy storage and deliver energy to houses and/or the grid during peak load times in the evening. Our small-scale pilot study shows that this approach of mobile energy storage can solve three problems:
- By building solar panels over parking lots, the need to upgrade the distribution and transmission infrastructure is reduced, as energy will be directly delivered to the EVs. Carport solar arrays are admittedly more expensive than ground mounts, but we suggest that the savings on transmission and distribution infrastructure will easily offset this.
- EVs fully charged during the day and connected to bidirectional chargers at houses during the evening will deliver power to the grid and potentially reduce the duck curve during critical hours (ramping during evening) and support the grid. The duck curve is mostly caused by residential load, so by implementing V2G technology with residential chargers, this issue can be mitigated.
- Currently, the availability of EV chargers in multi-unit dwellings (MUDs) is a problem because adding chargers to MUDs is known to be very expensive due to the upgrades to the electrical service required. If chargers at workplaces are common, this problem will be mitigated. If the chargers at MUDs are bidirectional, some EVs arriving from work can provide power to the building, reducing the need to upgrade the building’s electrical service when adding heat pumps.
1.2. Literature Review
Several references are similar/related to this study and draw similar conclusions to our work. For example,
- The article from Portland General Electric [13] presents an innovative EV charging management approach that reduces the need for infrastructure upgrades, while delivering additional benefits for grid reliability, resiliency, affordability, and a better customer experience.
- The study [14], carried out in New England, finds V2G’s effect on system capacity and value to be substantial, with participation from 13.9% of light-duty vehicle fleet displacing 14.7 GW of stationary storage (over $700 million in capital savings). The study concludes that “When compared to traditional demand response schemes, even at modest participation rates (5–10%), V2G yields over 337% more savings and tenfold the storage displacement.”
- The study referred to in [15] undertakes a seven-step process to perform a range of EV adoption scenarios and to analyze the impacts on the distribution system, that include (i) developing EV adoption forecasts based on multiple EV charging use cases (at-home charging, workplace charging, mix of both); (ii) vehicle characteristics (battery capacity, battery range, annual number of miles traveled); (iii( amount and type of EV supply equipment required to support each scenario; (iv) allocating the charging of these forecasted EVs to specific feeders; (v) developing vehicle charging load shapes; (vi) looking at over-loads on the different circuits, after allocating EVs, and (vii) estimating the adoption of solar PV and battery storage required to mitigate this new load. The authors conclude that adoption propensity modeling for DERs, including EVs, that considers socioeconomics, policy implications on customer behavior, and a host of other factors, is fundamentally required for integrated grid planning, and also how the distribution grid is planned and operated in the future.
- Reference [16] mentions some factors that will be key in the implementation of V2G as a feasible DER resource, for example: (a) Car Original Equipment Manufacturers (OEMs) need to incorporate V2G characteristics in their EVs. A few cars, such as Lucid Air, Ford F-150 Lightning, and Rivian R1S and R1T, already include these characteristics. (b) Hardware and software to enable V2G is needed, including communication protocols, net metering processes, and interfaces between grid and EV owners. (c) The automotive industry should upgrade battery warranties to allow bidirectional charging and discharging so batteries can be used as DERs.
Before moving to the next section, we mention that using the data primarily from [17] and elaborated upon here and also in [7], a preliminary version of this work was presented in [18]. This expanded journal paper has been completely rewritten, with the use of data/results not presented in [18], expanding the scope for single circuits to San Diego County, and also transmission upgrade deferral.
2. Data Collection and Methodology
In this section we present the key details of our simulation-based study of the future charging and total load in the distribution system in residential areas in San Diego, using publicly available datasets for electric load profiles, percentage of EV owners, and V2G and EV technical characteristics.
2.1. Methodology Summary
Our study looks at how many EV owners with V2G capability are necessary to balance the load increase in the residential areas by 2030 for each distribution circuit. We use the load profiles of a set of distribution circuits in San Diego that showed the high load for critical hours in 2022. Based on this, the goal is to solve for the minimum number of V2G-capable EVs that would be necessary to keep the load below 90% of capacity if they were participating in a virtual power plant. The constraints were that no EV would give up more than 30% of its battery capacity, and the bidirectional chargers are assumed to be limited to 7kW output capacity. Figure 2 shows the structure of the methodology followed in this work.
2.2. Simulation Data
The simulation is based on hourly load profiles from distribution lines in San Diego County. These hourly load profiles have been found in the SDG&E Interconnection Map [17], where all transmission and distribution lines in the San Diego area are shown. Reference [17] provides 2 spreadsheets: (a) Grid Needs Assessment (GNA), and (b) Distribution Deferral Opportunity Report (DDOR). The GNA is a list of grid needs identified from the distribution forecast, and the DDOR is a list of analyzed grid needs that would result in an investment requirement. Note that the load profiles are the worst-case load that occurred over the course of the year at any given hour. In our simulation, we are treating this as though these extreme hourly events all occur on the same worst-case day, which is not actually the case, so we are simulating a beyond-worst-case situation.
Both in the DDOR and the GNA list, circuits 41, 163, 233, 326, 386, and 859 are listed as grid needs, and the anticipated upgrade date is shown. Therefore, we look at these 6 circuits in our study. All of the relevant data from [17] can be found in [7], including the maximum load per residential consumer in each circuit, the load capacity modeling (forecast demand, facility loading, load capacity) by circuit, etc., some of which are tabulated below.
2.2.1. Circuits’ Customer Distribution
In order to know how many BEVs can be plugged in and discharging energy from their batteries, the number of residential customers in each circuit has to be known. The number of consumers for each circuit is listed in Table I below.
2.2.2. Circuit Capacity
Table II below shows the load capacity of each modeled circuit. Based on the GNA Excel spreadsheet provided by the SDG&E Interconnection Map, the 2022 forecasted demand and facility loading factor for every circuit have been considered to obtain the circuit capacity. For the simulation purpose, a very important parameter called the threshold will be used in each circuit to obtain a complete comparison between circuits.
2.2.3. Number of EVs with V2G Capabilities
Key to our study is the availability of BEVs to participate as mobile DERs. In 2022, the percentage of EVs in California was ∼3.3%. Although only some EVs are currently bidirectional, almost all manufacturers are claiming their new models will be BEVs, and as described earlier, the CEC has the authority to require this if it finds a beneficial use case. The output of our model will be the number of BEVs necessary to impact infrastructure costs.
2.2.4. Car Usage Patterns
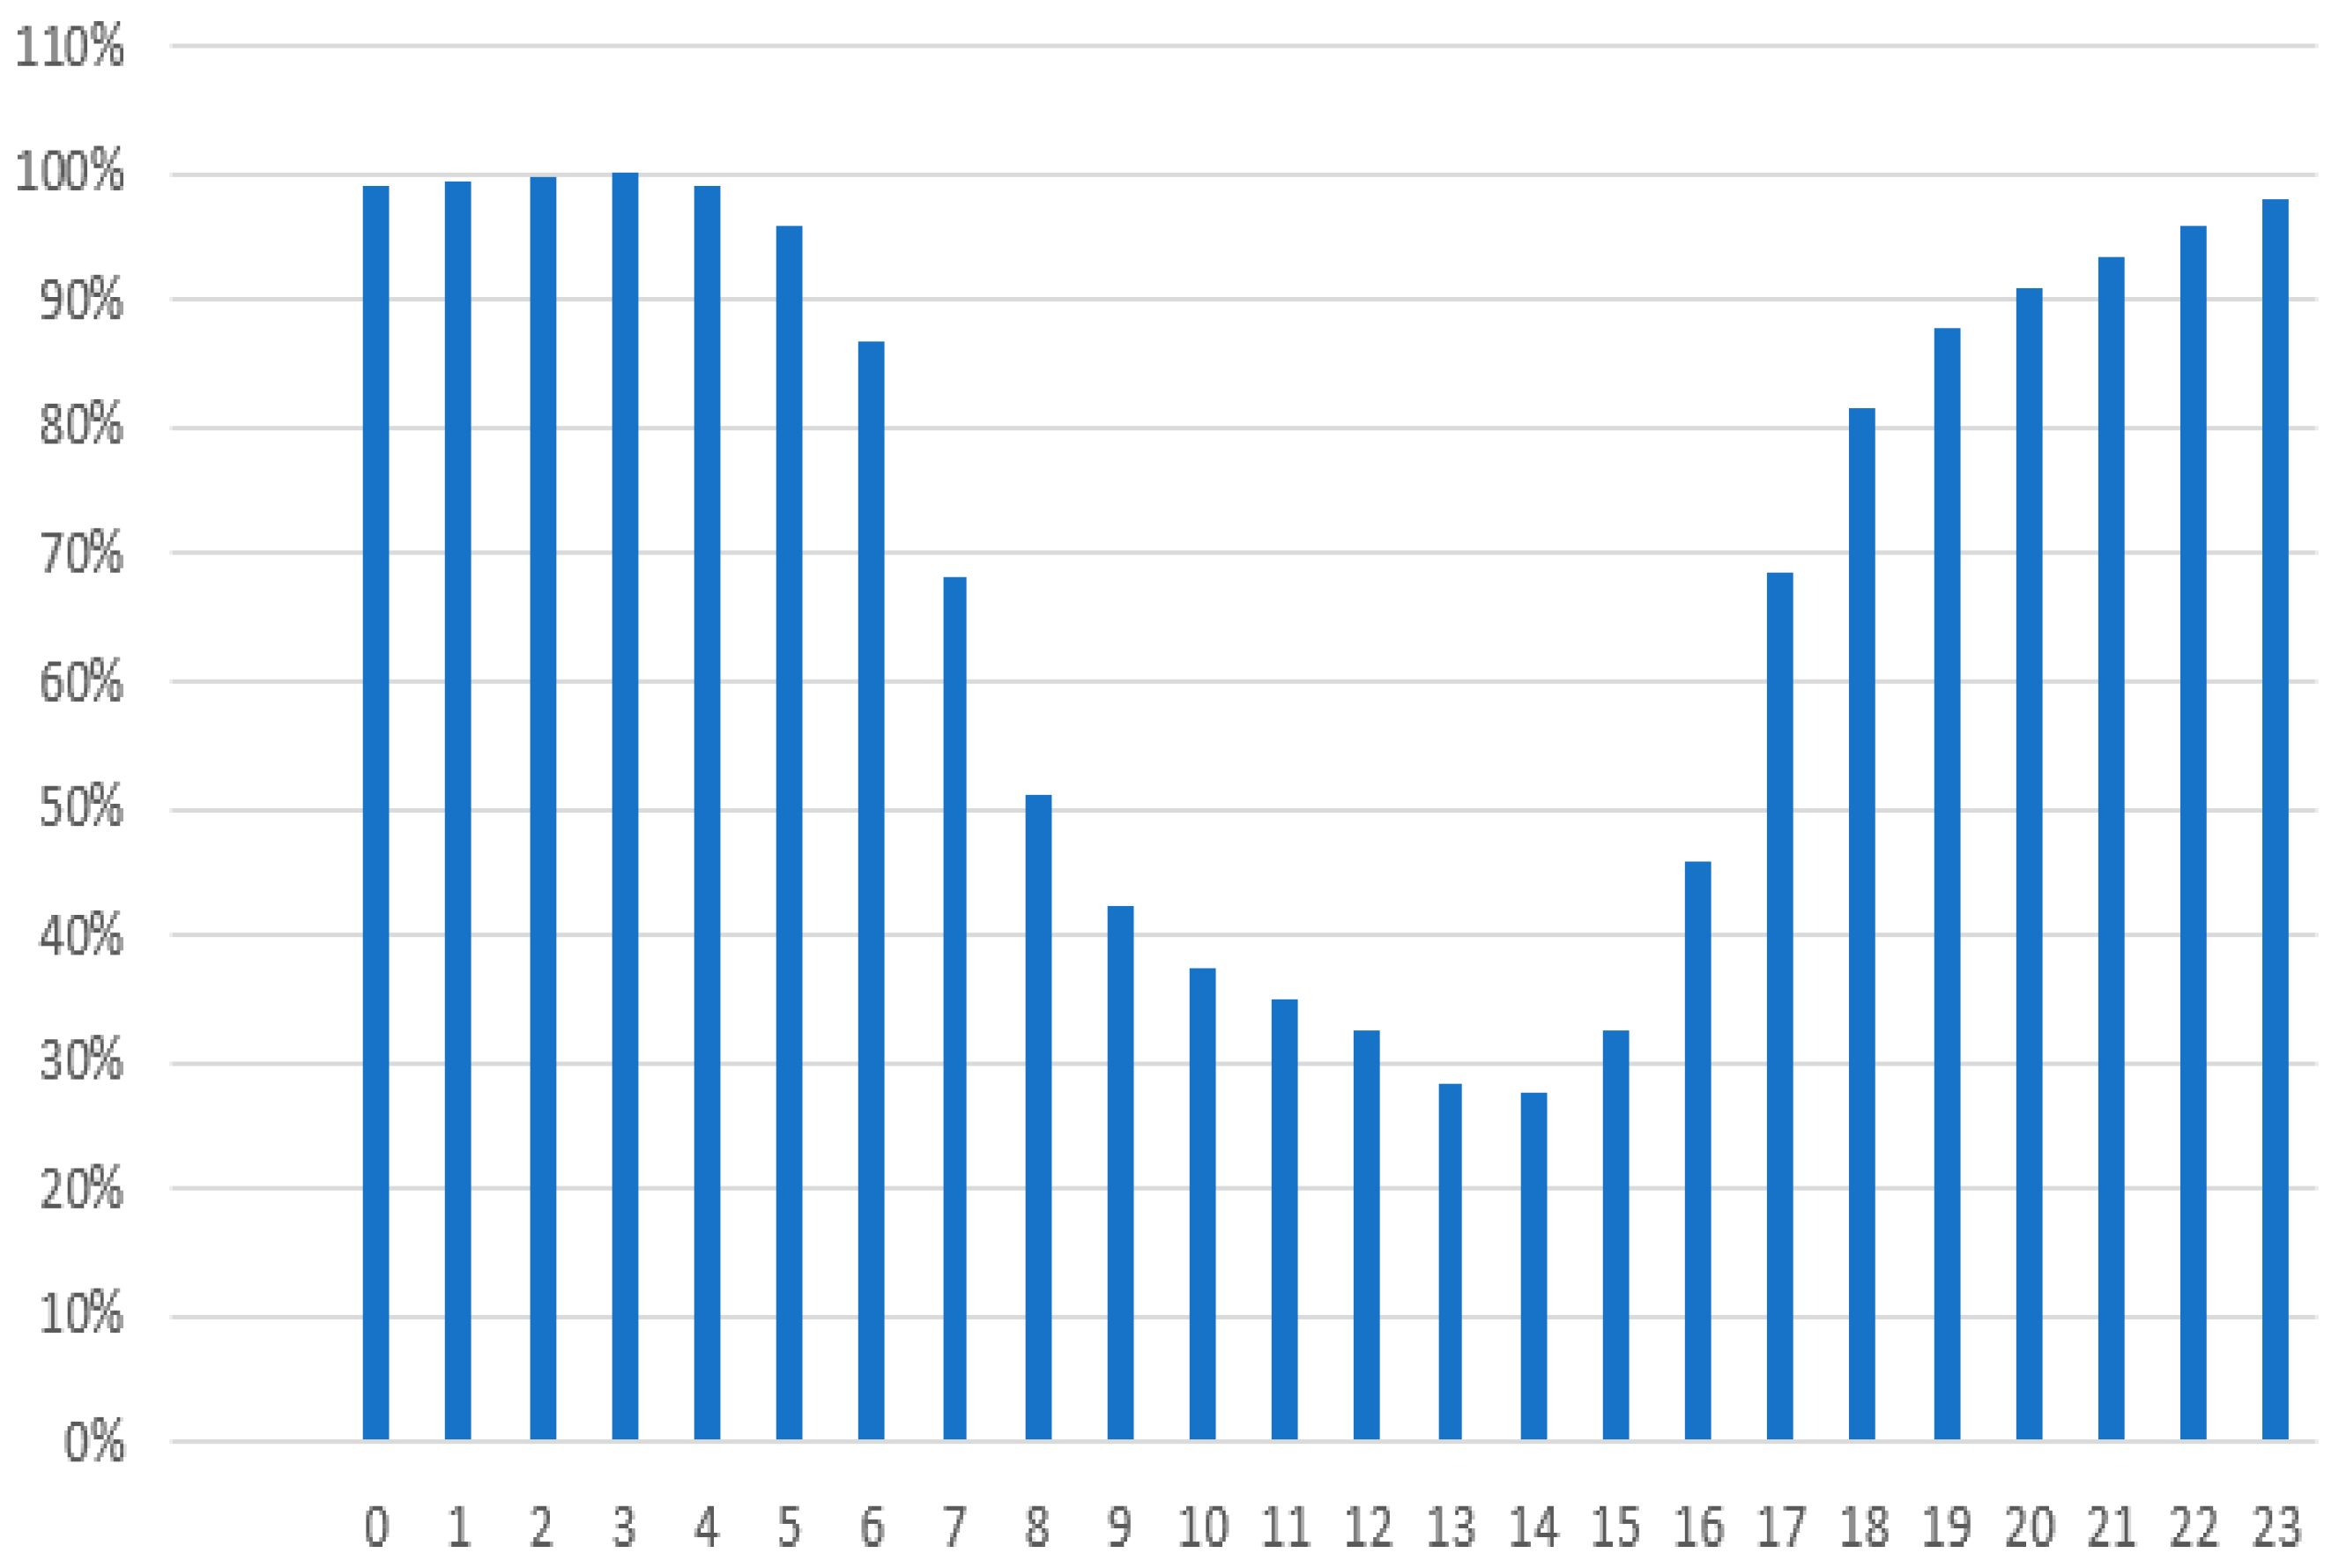
Besides knowing how many BEVs will be in a distribution line in the future, the fact that not all BEVs will arrive home at the same time has to be taken into consideration. Car home status in San Diego has been assumed to be the same distribution as for the entire US. According to the National Household Travel Survey conducted by the Federal Highway Administration, two different surveys have been used: Trip End Time for Work trip purposes and Trip End Time for Home trip purposes, details of which can be found in [7] [Appendix V]. The results of this study, that are used in the simulation, are shown in Figure 3.
2.2.5. Demand Increase Forecast
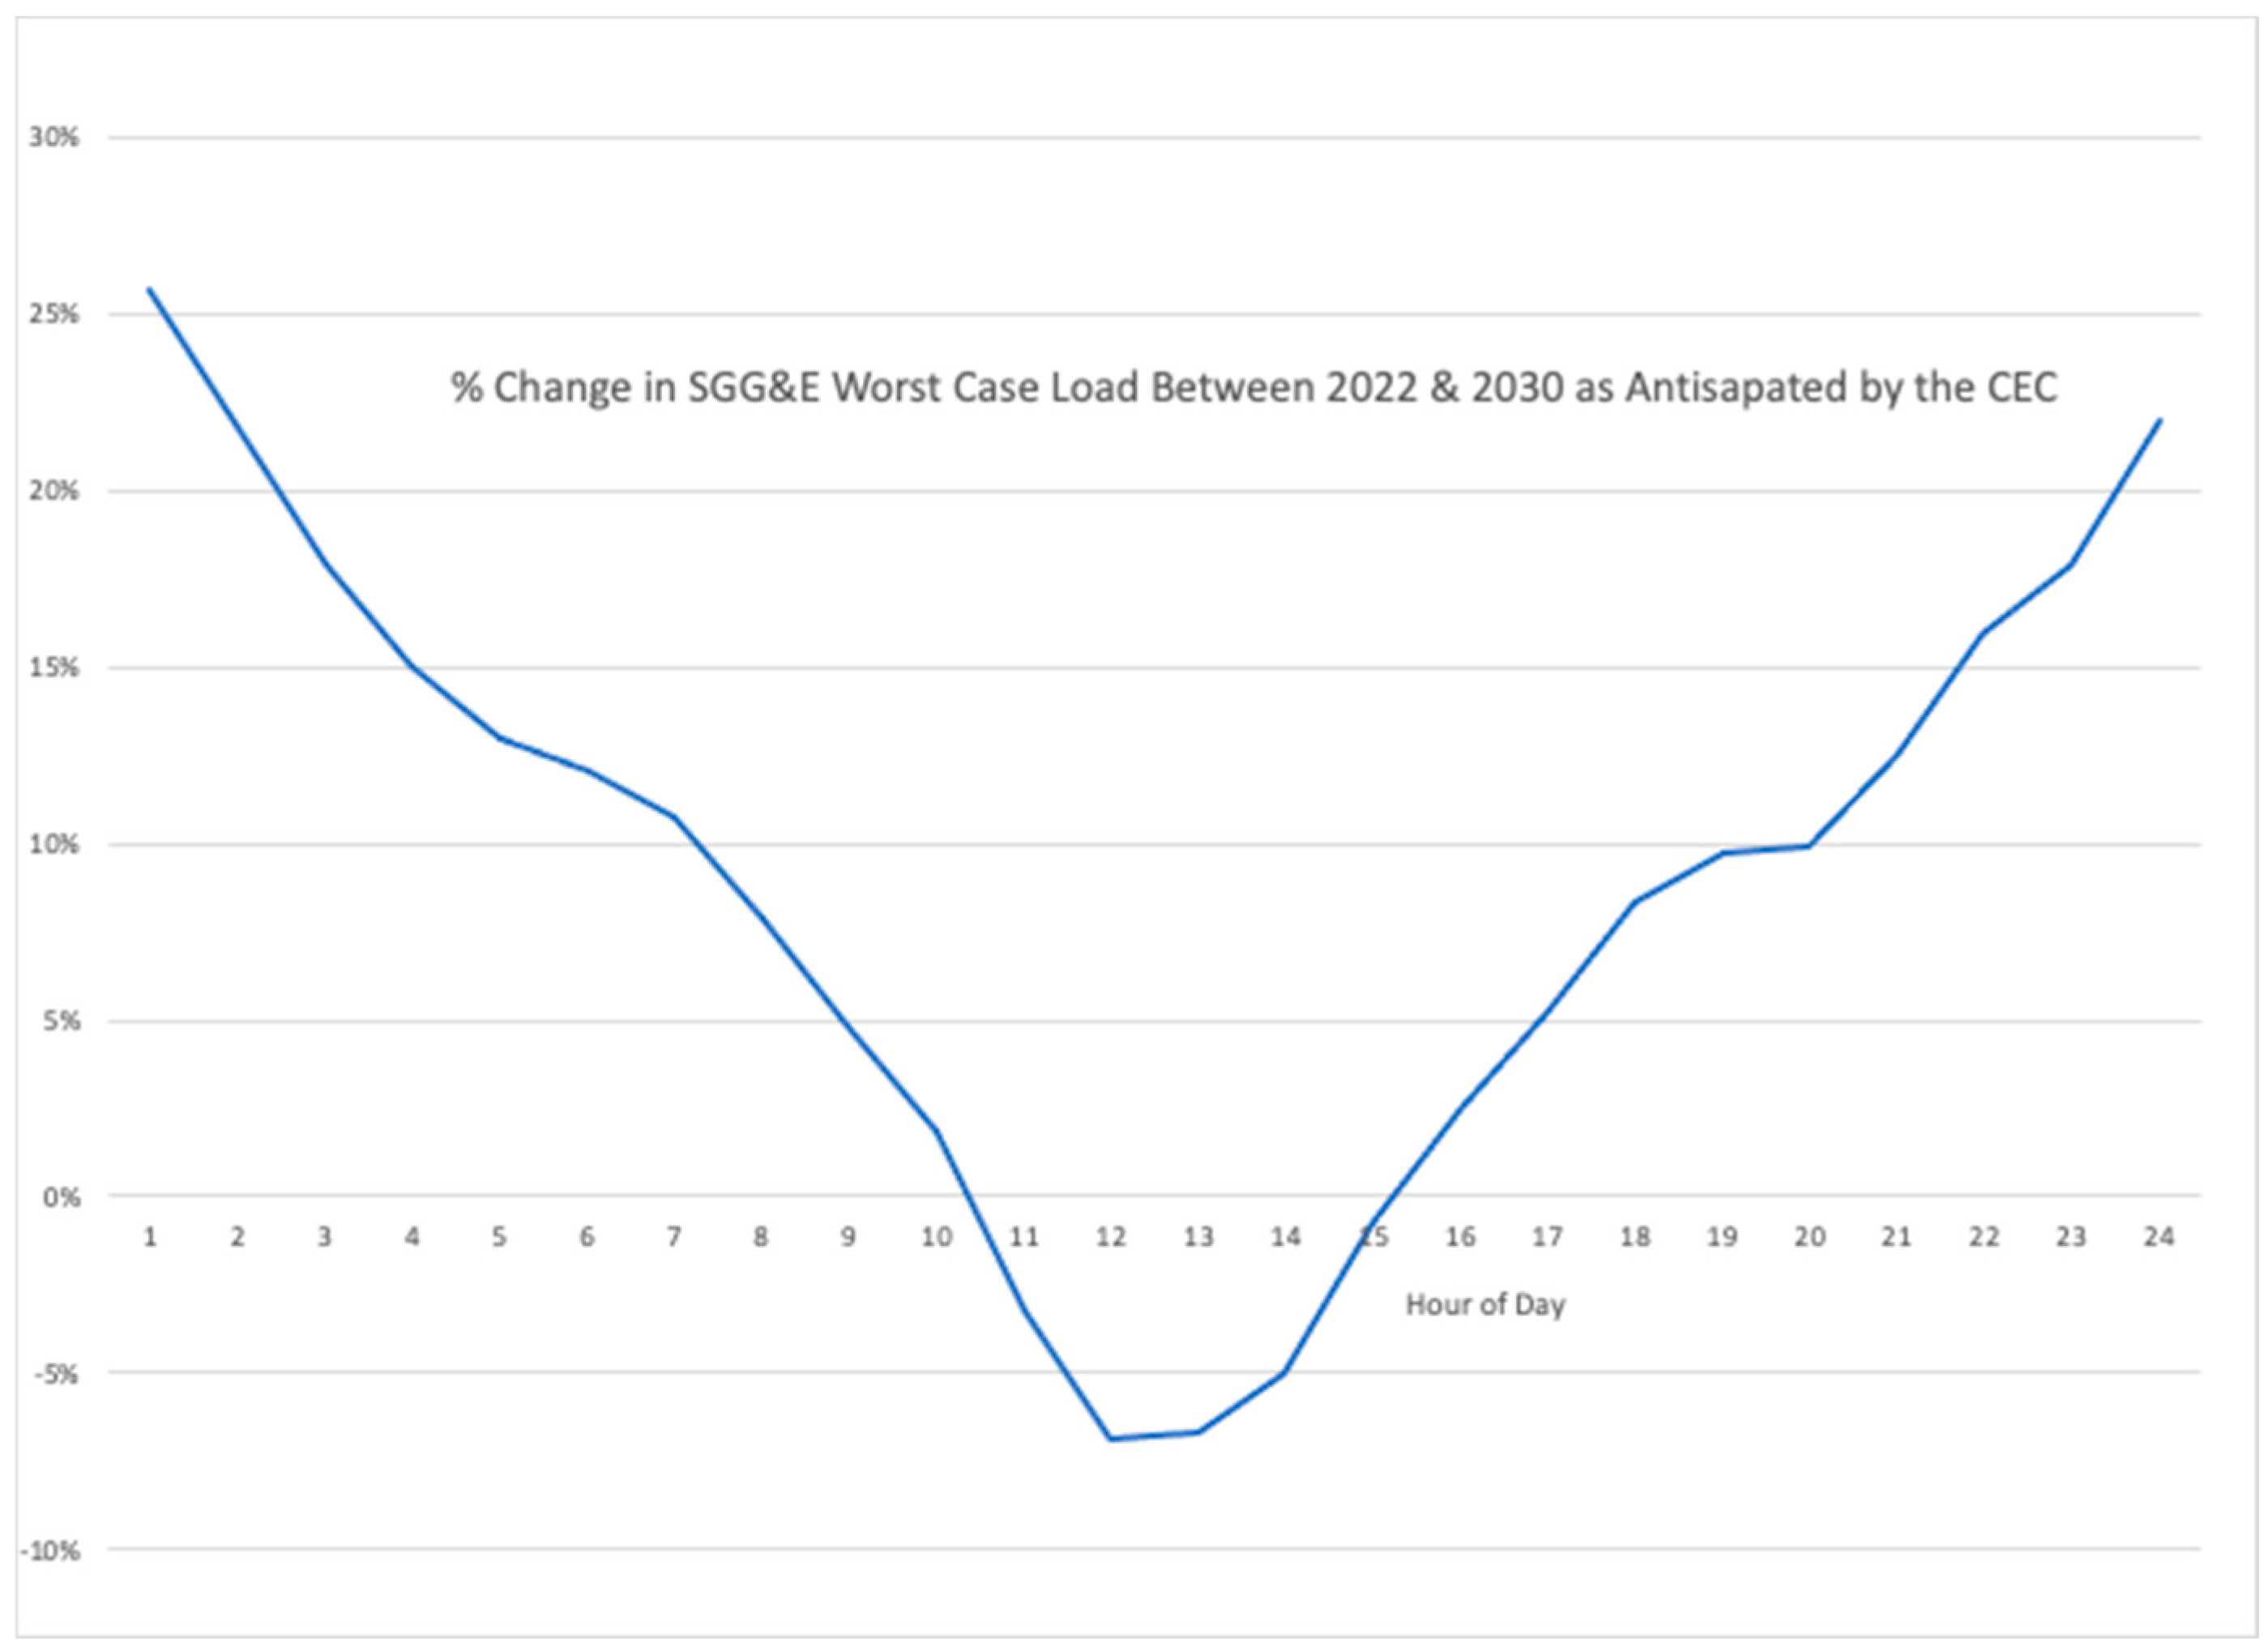
The 2021 CEC Integrated Energy Policy Report (IEPR) predicts hourly electricity demand in each of the IOU territories for the next 10 years. Using this, in [7], we compute the ratio between SDG&E ‘s hourly peak value in 2022 and the forecast values for 2030. The result is a table showing the anticipated change in worst-case load for each hour of the day between 2022 and 2030. Appendices I and II of [7] provide a detailed analysis of multiple scenarios to make these forecasts. The results of this analysis are summarized in Figure 4.
Figure 3.
Modeled EV Home status percentage [7].
Figure 3.
Modeled EV Home status percentage [7].
Note that the CEC expects the worst-case load to actually decrease in the middle of the day because of the expected increase in behind-the-meter rooftop solar. However, in the critical hours from 4 PM to 9 PM, substantial increases in worst-case load are expected. We have assumed that the best estimate available for the increase in individual circuits is the same as this expected system-wide increase and have modeled the anticipated load in individual circuits by applying these factors to each circuit.
Figure 4.
% change in SDG&E Worst Case Load Between 2022 & 2030 as anticipated by the CEC.
2.3. Calculation Model
The most important contribution of this work is the calculation model that can be used to compute/tabulate the requisite energy discharge (by hour) and percentage penetration of BEVs necessary to shave the peak load in 2030 by a user-specified threshold.
The model takes the form of a spreadsheet that, for a given assumption about what fraction of cars are bidirectionally capable EVs, calculates how much the load in a given circuit could be shaved if the EVs were participating in a virtual power plant programmed to keep the load below a given threshold. The following assumptions were used in all the runs reported here:
- Average cars per household: 2.3, the average for San Diego County
- Assumed average battery capacity of EVs in 2030: 88kWh
- Assumed export capacity of EVSE (bidirectional chargers) 7kW, based on the capacity of the Wallbox Quasar 2.
- Assumed threshold to be held: 90% of circuit capacity
- Maximum discharge from EV battery: 30% to allow driving the next day and to minimize battery wear
For each hour of the hypothetical worst-case day, given the trial percentage of BEVs, the model calculates what the load would be in 2030 by multiplying the 2022 load by the factor calculated from the CEC data. Then, if the calculated 2030 load is above the 90% threshold, it calculates how much energy the BEVs must discharge to shave this peak down to the threshold, given the number of cars that are at home that hour. This yields a discharge rule that represents the ratio of the power the EV service equipment (EVSE) must operate at relative to its maximum power. (Alternatively, this ratio could be thought of as the fraction of available cars and EVSE that must be activated to keep the circuit at the threshold; mathematically, this is the same thing.) Obviously, one criterion is that this ratio must be less than or equal to one for all hours:
If the computed discharge rule is greater than 1, it indicates that more energy is being withdrawn from the batteries than the maximum possible energy that can be discharged by the EVSE.
Next, the energy discharged per BEV per hour is calculated by multiplying the max power discharge and the discharge rule. This simple calculation takes into account that all BEVs will be plugged into the grid and, whenever the discharge rule allows it, BEVs will start delivering energy into the grid.
2.4. Percentage of Battery Withdrawn
The other key output of the simulation is the percentage of each BEV battery that is withdrawn, given by:
where,
The Excel Solver function was used to sweep over all possible values of the percentage of cars that were BEVs to find the smallest percentage that satisfied all the constraints.
As a check on the sensitivity to the projected load increase, the analysis was also run assuming that the 2030 load increase would be twice what the CEC predicted. Results for both the base predictions and the doubled predictions are shown in Table III in Results.
The same analysis was carried out on the total load for SDG&E’s system as a whole. This is relevant both for estimating the potential of V2G as a form of DER to substitute for new transmission infrastructure and as a way for this type of DER to reduce Resource Adequacy costs for local Load Serving Entities.
Figure 5 shows a screenshot of the model as run on circuit 163.
In order, the columns are:
A: Hour of day, B: 2022 worst case load by hour, C: Load increase % to 2030 as calculated from CEC data as shown in Figure 4 above, D: Load increase after adding an extra factor for sensitivity analysis (zero in this run so column D is equal to column C), E: Modeled 2030 worst case load by hour, F: % of cars home by hour as shown in Figure 3 above, G: Number of BEVs available based on the number of households, the assumed percent, and the previous column, H: The energy needed based on the difference between the threshold and the modeled 2030 load, I: The computed discharge rule, J: The resulting load after the EV discharge, K: The percentage change in peak load, L: The energy drawn per EV per hour used in the calculation of total battery draw per EV, M: The threshold, and N: The capacity.
3. Results and Discussion
3.1. Nominal Case
For the values we used in Figure 5 (for just one circuit, # 163), the main results are illustrated graphically in Figure 6.
Figure 6 clearly shows that even though the projection for 2030 is that the circuit load will be well above 90% capacity (the red line), a relatively small number of V2G-capable cars is sufficient to shave the peak (green line).
What is surprising is that the number of V2G-capable EVs necessary to defer an upgrade to a circuit that is already at 90% capacity in 2022 is so small; only 6.9% of the cars that are assumed to belong to households on the circuit. A natural question to ask is what happens if the underlying assumptions were to change. This is discussed in the next subsection.
3.2. Sensitivity Analysis
Even if the load growth is much greater than anticipated by the CEC, the model finds that it would not take massive penetration of BEVs to avoid infrastructure upgrades. Figure 7 shows the results of modeling the impact of assuming that the 2030 load growth is twice as great as the CEC projects.
In this case, the projected load would easily exceed the circuit capacity by 2030, but the model predicts that it would take only 22.9% of the vehicles belonging to the households on the circuit acting as DER to hold the circuit at 90% of capacity.
In this case, the projected load would easily exceed the circuit capacity by 2030, but the model predicts that it would take only 22.9% of the vehicles belonging to the households on the circuit acting as DER to hold the circuit at 90% of capacity.
This model was run for all the circuits described in Tables I and II, and the results are shown below in Table III, which shows the minimum fraction of BEVs needed to keep each circuit at the 90% threshold both in the case of the projected CEC load growth and under the assumption that the load growth is twice the CEC expectation.
Clearly, the above results indicate the feasibility of using (just a small fraction of available) EVs as a mobile storage resource, with peak-shaving capabilities that defer the need for costly infrastructure upgrades. As explained above, the model simultaneously solves for the constraints that the bidirectional chargers are not running at more than 100% power and that the cars do not give up more than 30% of battery capacity. The fact that the worst-case battery draw is below 30% for most circuits when modeling the CEC expected load shows that the power requirement, especially around 4 pm, when the smallest number of cars is available, is the limiting factor. When assuming a much larger deficiency by doubling the expected demand growth, the total amount of energy becomes the limiting factor, and the worst-case battery draw is 30% for most circuits.
The results of running the model on the whole county are shown in Figure 8.
In this case, the goal was to hold the load to an arbitrary 4GW just below the 2022 peak load, the intention being to see if using BEVs as a form of VPP could be an alternative to a new transmission line. As the graph in Figure 8 shows, if 2.5% of the cars in San Diego in 2030 were BEVs participating in a VPP, that would be of sufficient capacity to keep the worst-case peak load slightly below the 2022 load. Given the estimated number of cars in San Diego County, this represents about 75,000 BEVs.
4. Conclusions
Several conclusions can be drawn from the results and discussion in Section 3. The most critical is that the amount of DER needed to avoid infrastructural upgrades is consistently low. These circuits were chosen because they were scheduled for upgrades, and they were already loaded near their capacity, implying that the issue was thermal load on the conductors, not some single point of weakness on a specific component.
It is also notable that in most cases, the limiting factor was not the amount of energy it was necessary to draw from the EV batteries; this implies the limiting factor was the power of the EVSE. Therefore, if more powerful EVSE were used, even fewer BEVs would be necessary. It also shows that the load imposed on the BEVs is small compared to routine driving, both in terms of the amount of discharge and the C-rate. In this study, we assumed that the BEVs cannot be discharged faster than 7kW, which, with the assumed 88kWh battery size, corresponds to a discharge rate C of .08. Considering that ordinary driving imposes C-rates in excess of 3, it should be clear that this is a very light load. This should alleviate concerns that using BEVs in this mode would reduce battery life. Also, it should be kept in mind that the usage modeled here represents a hypothetical worst-case day that would occur at most once a year.
With respect to county-wide data, the ability to manage peak load with BEV-based DER has implications not only for future transmission planning, but also for the management of Resource Adequacy (RA) costs for the local Load Serving Entities; in this case, two local CCAs. Building a new transmission line will not reduce their RA costs, but moderating/shaving the peak load will. RA costs are not public data but are reported to reach $60-80/kW/month in the summer. At these rates, the 241MW peak load reduction shown in Figure 8 would be worth on the order of $14,000,000 in a single month to the local CCAs.
In summary then, our study supports the conclusion that EVs and V2X technology have the potential to reduce peak load in the worst-case scenario by discharging just a small amount of the stored battery energy, and avoid costly infrastructure upgrades at the distribution and transmission levels.
Author Contributions
Conceptualization, methodology, and writing– Jose Torre-Bueno, software, formal analysis, investigation - Rafael Aranzabal Obieta, original draft preparation – Sridhar Seshagiri; writing, review and editing, project administration, and funding acquisition – Jose Torre-Bueno. All authors have read and agreed to the published version of the manuscript.”.
Funding
An initial conference publication work was supported financially in part by SDSU.
Data Availability Statement
All of the data used in this study are cited in the References section. The results were generated using Excel, and all data is included in the Appendix of [7].
Conflicts of Interest
The authors declare no conflicts of interest.
References
- “CARB 2020 Mobile Source Strategy”, California Air Resources Board. https://ww2.arb.ca.gov/sites/default/files/2021-09/Proposed_2020_Mobile_Source_Strategy.pdf Accessed 28 Oct. 2025.
- “CARB California Building Decarbonization Assessment”. 2021, California Energy Commission. https://downloads.regulations.gov/EPA-R09-OAR-2023-0352-0020/attachment_25.pdf. Accessed 28 Oct. 2025.
- “Electrification Impacts Study Part 1: Bottom-Up Load Forecasting and System-Level Electrification Impacts Cost Estimates”. 2023. San Francisco, CA: Kevala, Inc. https://docs.cpuc.ca.gov/PublishedDocs/Efile/G000/M508/K423/508423247.PDF. Accessed 28 Oct. 2025.
- Prince, Jason. 2018. “The Non-Wires Solutions Implementation Playbook: A Practical Guide for Regulators, Utilities, and Developers.” Rocky Mountain Institute. http://www.rmi.org/insight/non-wires-solutions- playbook/. Accessed 28 Oct. 2025.
- Inputs & Assumptions 2022-2023 Integrated Resource Planning (IRP). 2023. California Public Utilities Commission, https://www.cpuc.ca.gov/-/media/cpuc-website/divisions/energy-division/documents/integrated-resource-plan-and-long-term-procurement-plan-irp-ltpp/2023-irp-cycle-events-and-materials/inputs-assumptions-2022-2023_final_document_10052023.pdf. Accessed 28 Oct. 2025.
- “SDG&E to Develop New Electric Transmission Line in Southern California | Sempra.” Sempra, 2025, www.sempra.com/newsroom/press-releases/san-diego-gas-electric-develop-new-electric-transmission-line-southern. Accessed 28 Oct. 2025.
- R. Aranzabal Obieta, “Vehicle-to-Grid analysis to Reduce Electrical Peak Load in the San Diego Area in 2030”, Master's Thesis, Universidad del Pais Vasco, 2023.
- I. Kamwa and J. Matevosyan, “Making electric vehicles and the grid work together: A necessity for sustainable mobility [Editors’ Voice],” IEEE Power and Energy Magazine, vol. 21, no. 6, pp. 4–12, 2023.
- “Today’s Outlook | Emissions | California ISO.” Caiso.com, 2025, www.caiso.com/todays-outlook/emissions. Accessed 28 Oct. 2025.
- “Library | Production and Curtailments Data | California ISO.” Caiso.com, 2025, www.caiso.com/library/production-curtailments-data. Accessed 28 Oct. 2025.
- Myers, Jeff. “Contributor: Why Electric Vehicle Drivers Should Charge Their Cars at the Office.” Los Angeles Times, Sept. 2025, www.latimes.com/opinion/story/2025-09-01/california-next-energy-challenge. Accessed 28 Oct. 2025.
- Lipman,Timothy 2021 Total Charge Management of Electric Vehicles, California Energy Commission. https://www.energy.ca.gov/sites/default/files/2021-12/CEC-500-2021-055.pdf. Accessed 28 Oct. 2025.
- M. Mills, M. Obi, K. Cody, K. Garton, A. M. Wisser, and S. Nabahani, “Utility Planning for Distribution-Optimized Electric Vehicle Charging: A Case Study in the United States Pacific Northwest,” IEEE Power and Energy Magazine, vol. 21, no. 6, pp. 48–55, 2023.
- J. Owens, I. Miller, and E. Gencer, “Can vehicle-to-grid facilitate the transition to low carbon energy systems?” Energy Adv., vol. 1, pp. 984–998, 2022. [Online]. Available: http://dx.doi.org/10.1039/D2YA00204C.
- R. A. F. Currie, T. Ward, J. L. Carney, G. Mandelman, M. C. Everett, A. Shumavon, N. Phelps, L. Griffin, and S. Roundtree, “Grid planning for electrification using highly granular analytics: Insights into the transportation distribution infrastructure,” IEEE Power and Energy Magazine, vol. 21, no. 6, pp. 68–76, 2023.
- G. Fitzgerald, C. Nelder, and J. Newcomb, “Electric Vehicles as Distributed Energy Resources,” [Online]. Available: https://rmi.org/wp-content/uploads/2017/04/RMI_Electric_Vehicles_as_DERs_Final_V2.pdf , 2016.
- “SDG&E Interconnection Map, 2022.” [Online]. Available: https://interconnectionmapsdge.extweb.sempra.com , San Diego Gas & Electric, San Diego, CA, 2022.
- R. A. Obieta, J. Torre-Bueno, and S. Seshagiri, "Making EVs and the grid work together: a San Diego based study," 2024 IEEE Energy Conversion Congress and Exposition, Phoenix, AZ, USA, 2024, pp. 1290-1296. [CrossRef]
Figure 1.
The ratio of CO2 production per kWh as a function of time of day in California [9].
Figure 1.
The ratio of CO2 production per kWh as a function of time of day in California [9].
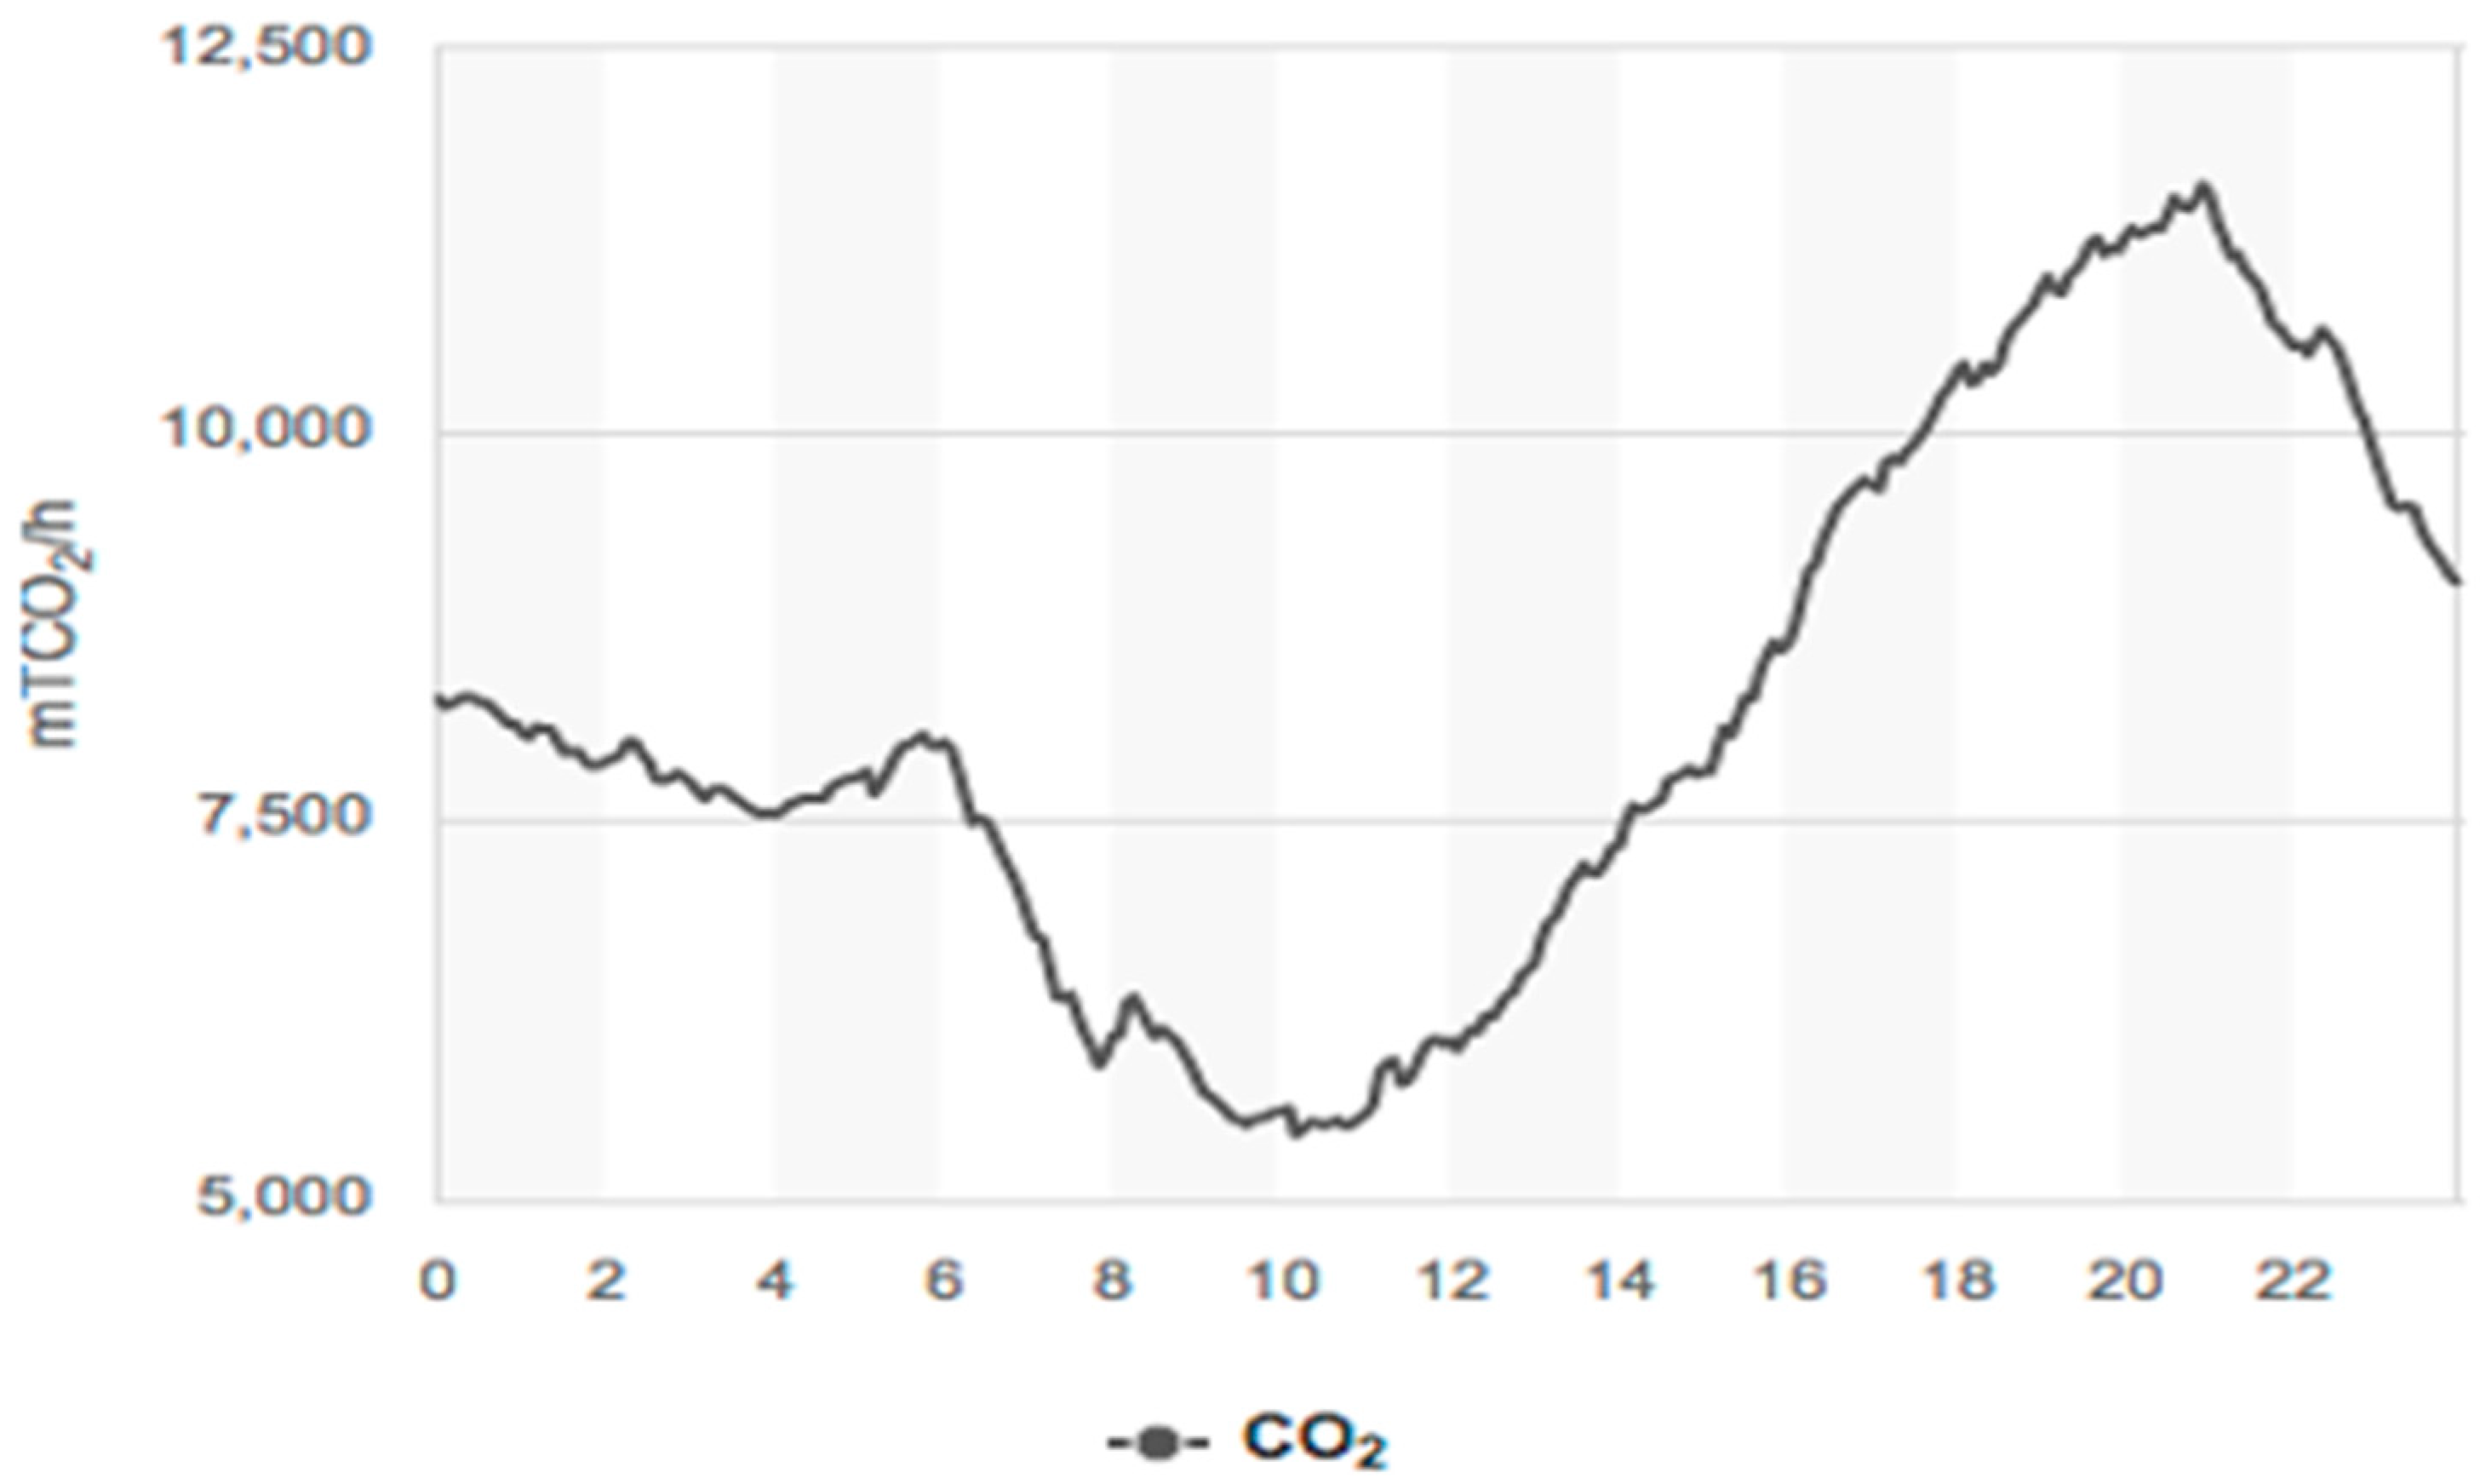
Figure 2.
Scheme of the methodology followed.
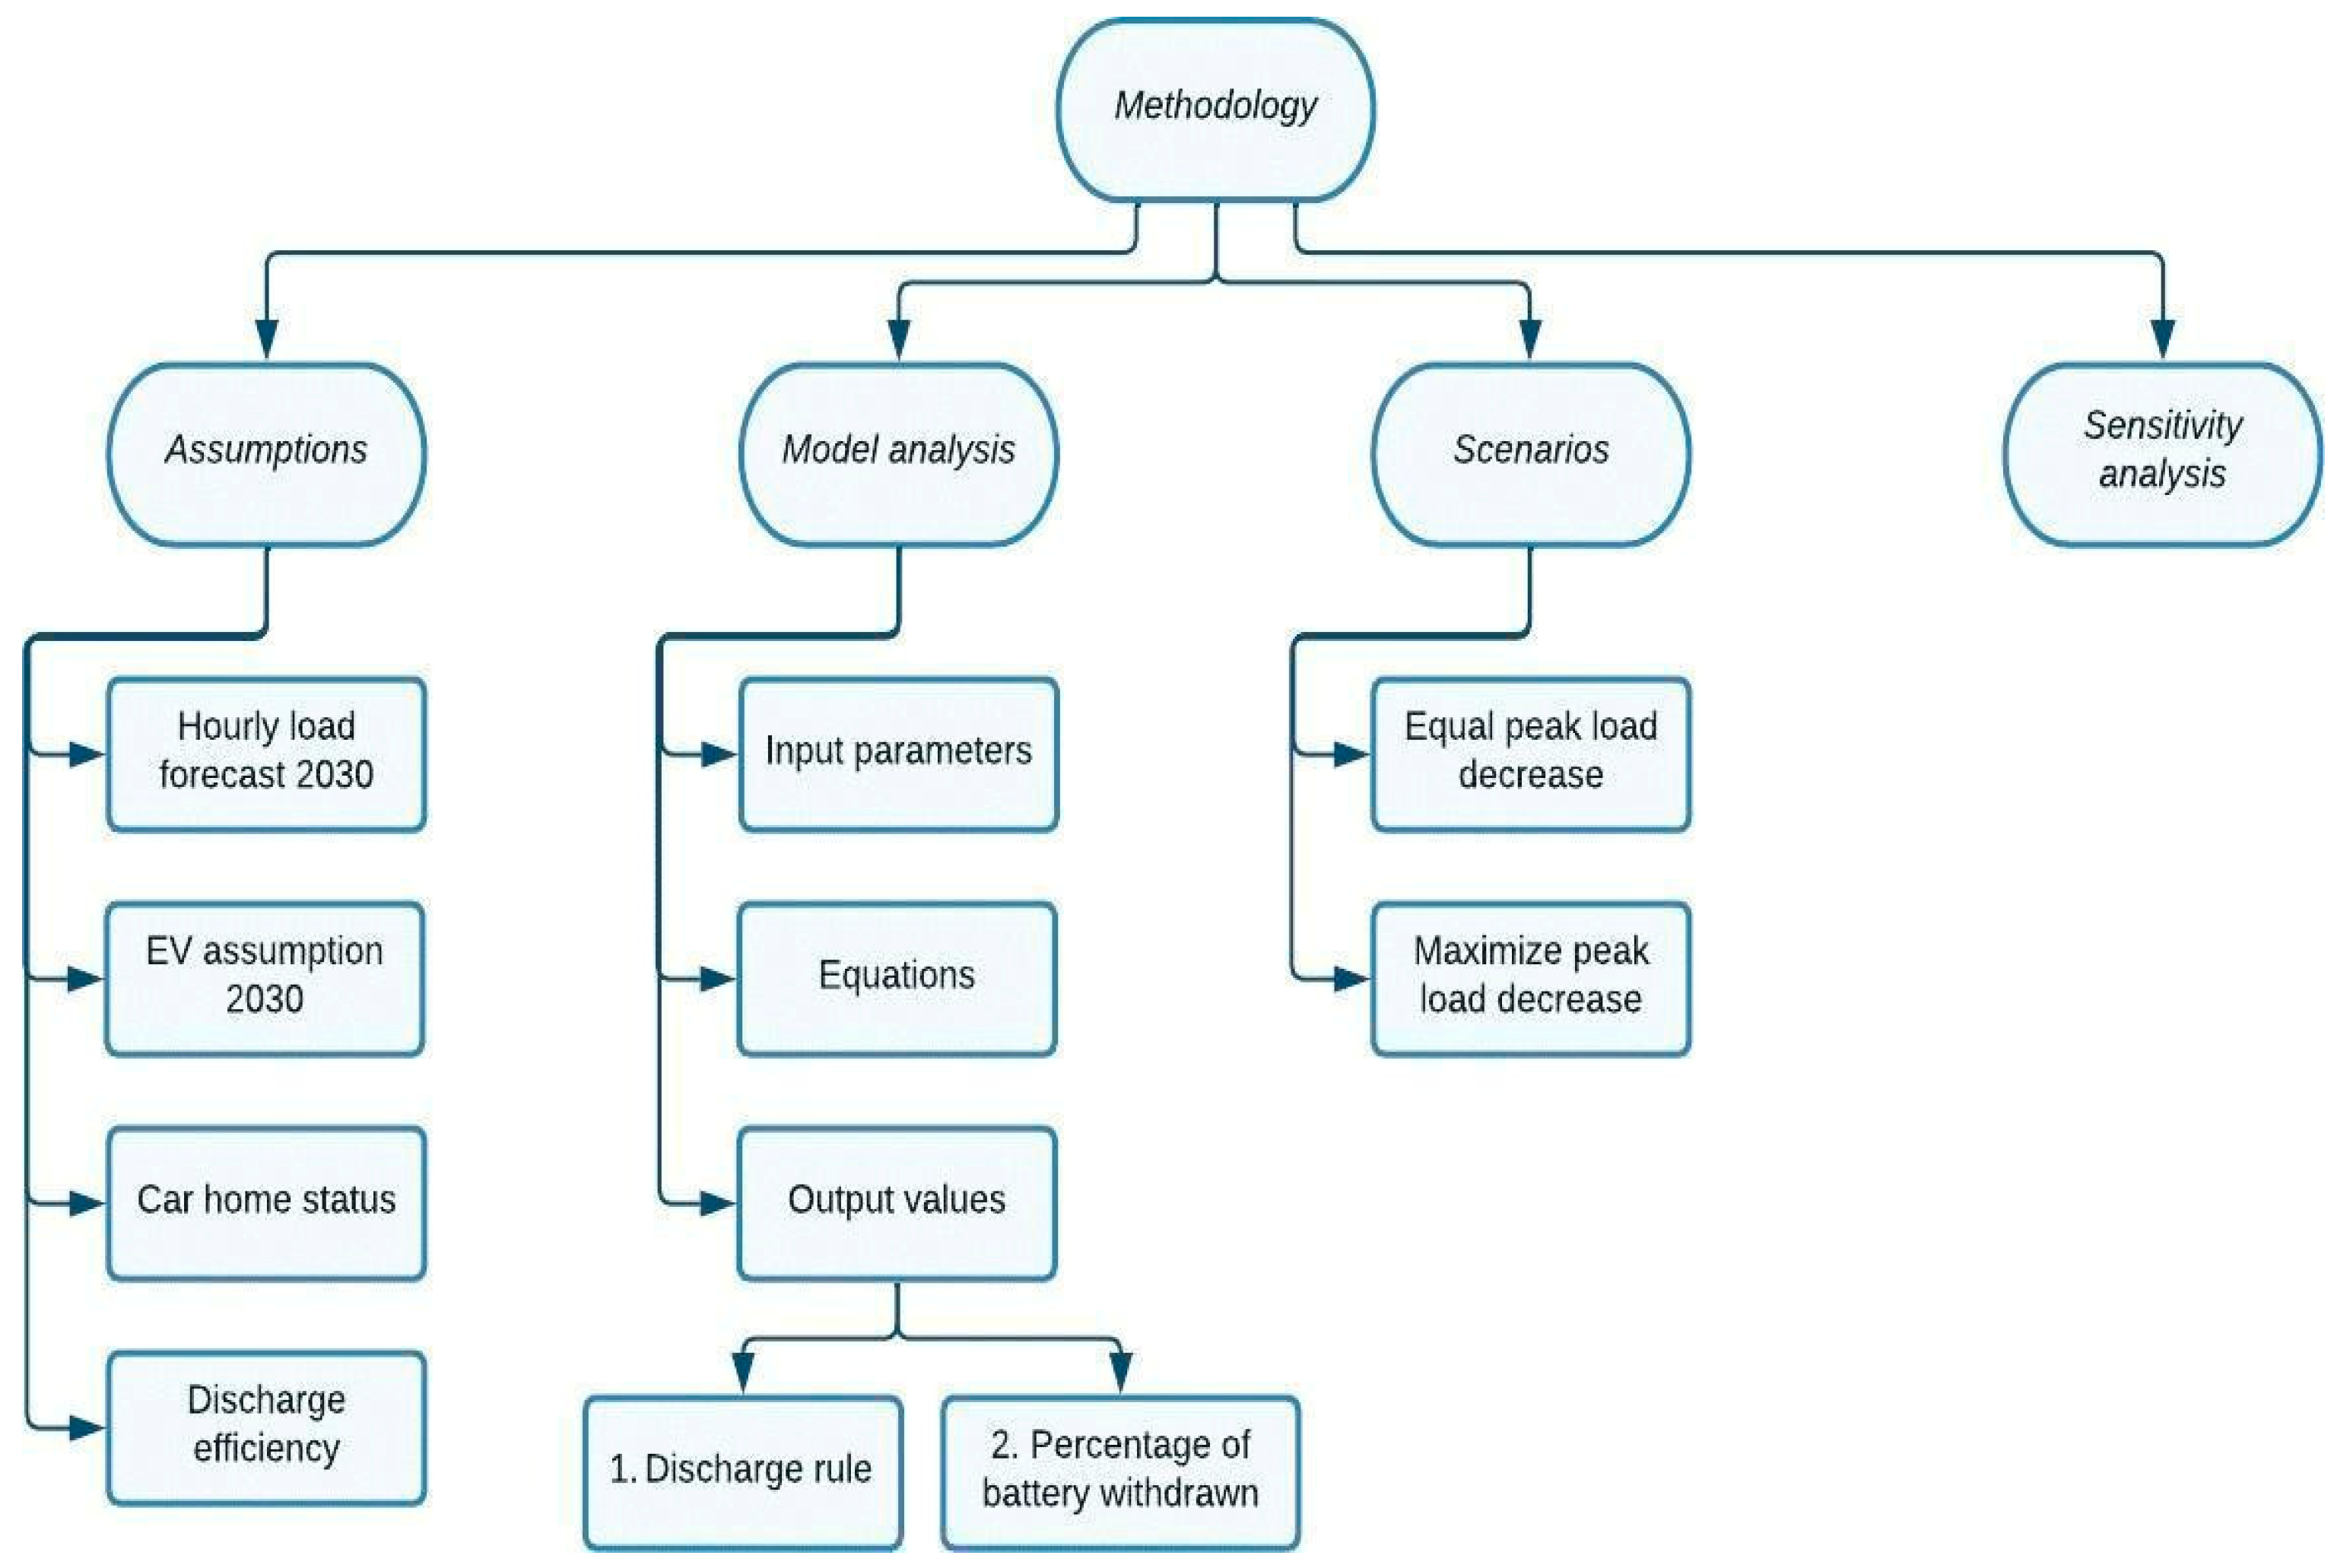
Figure 5.
Screenshot of model.
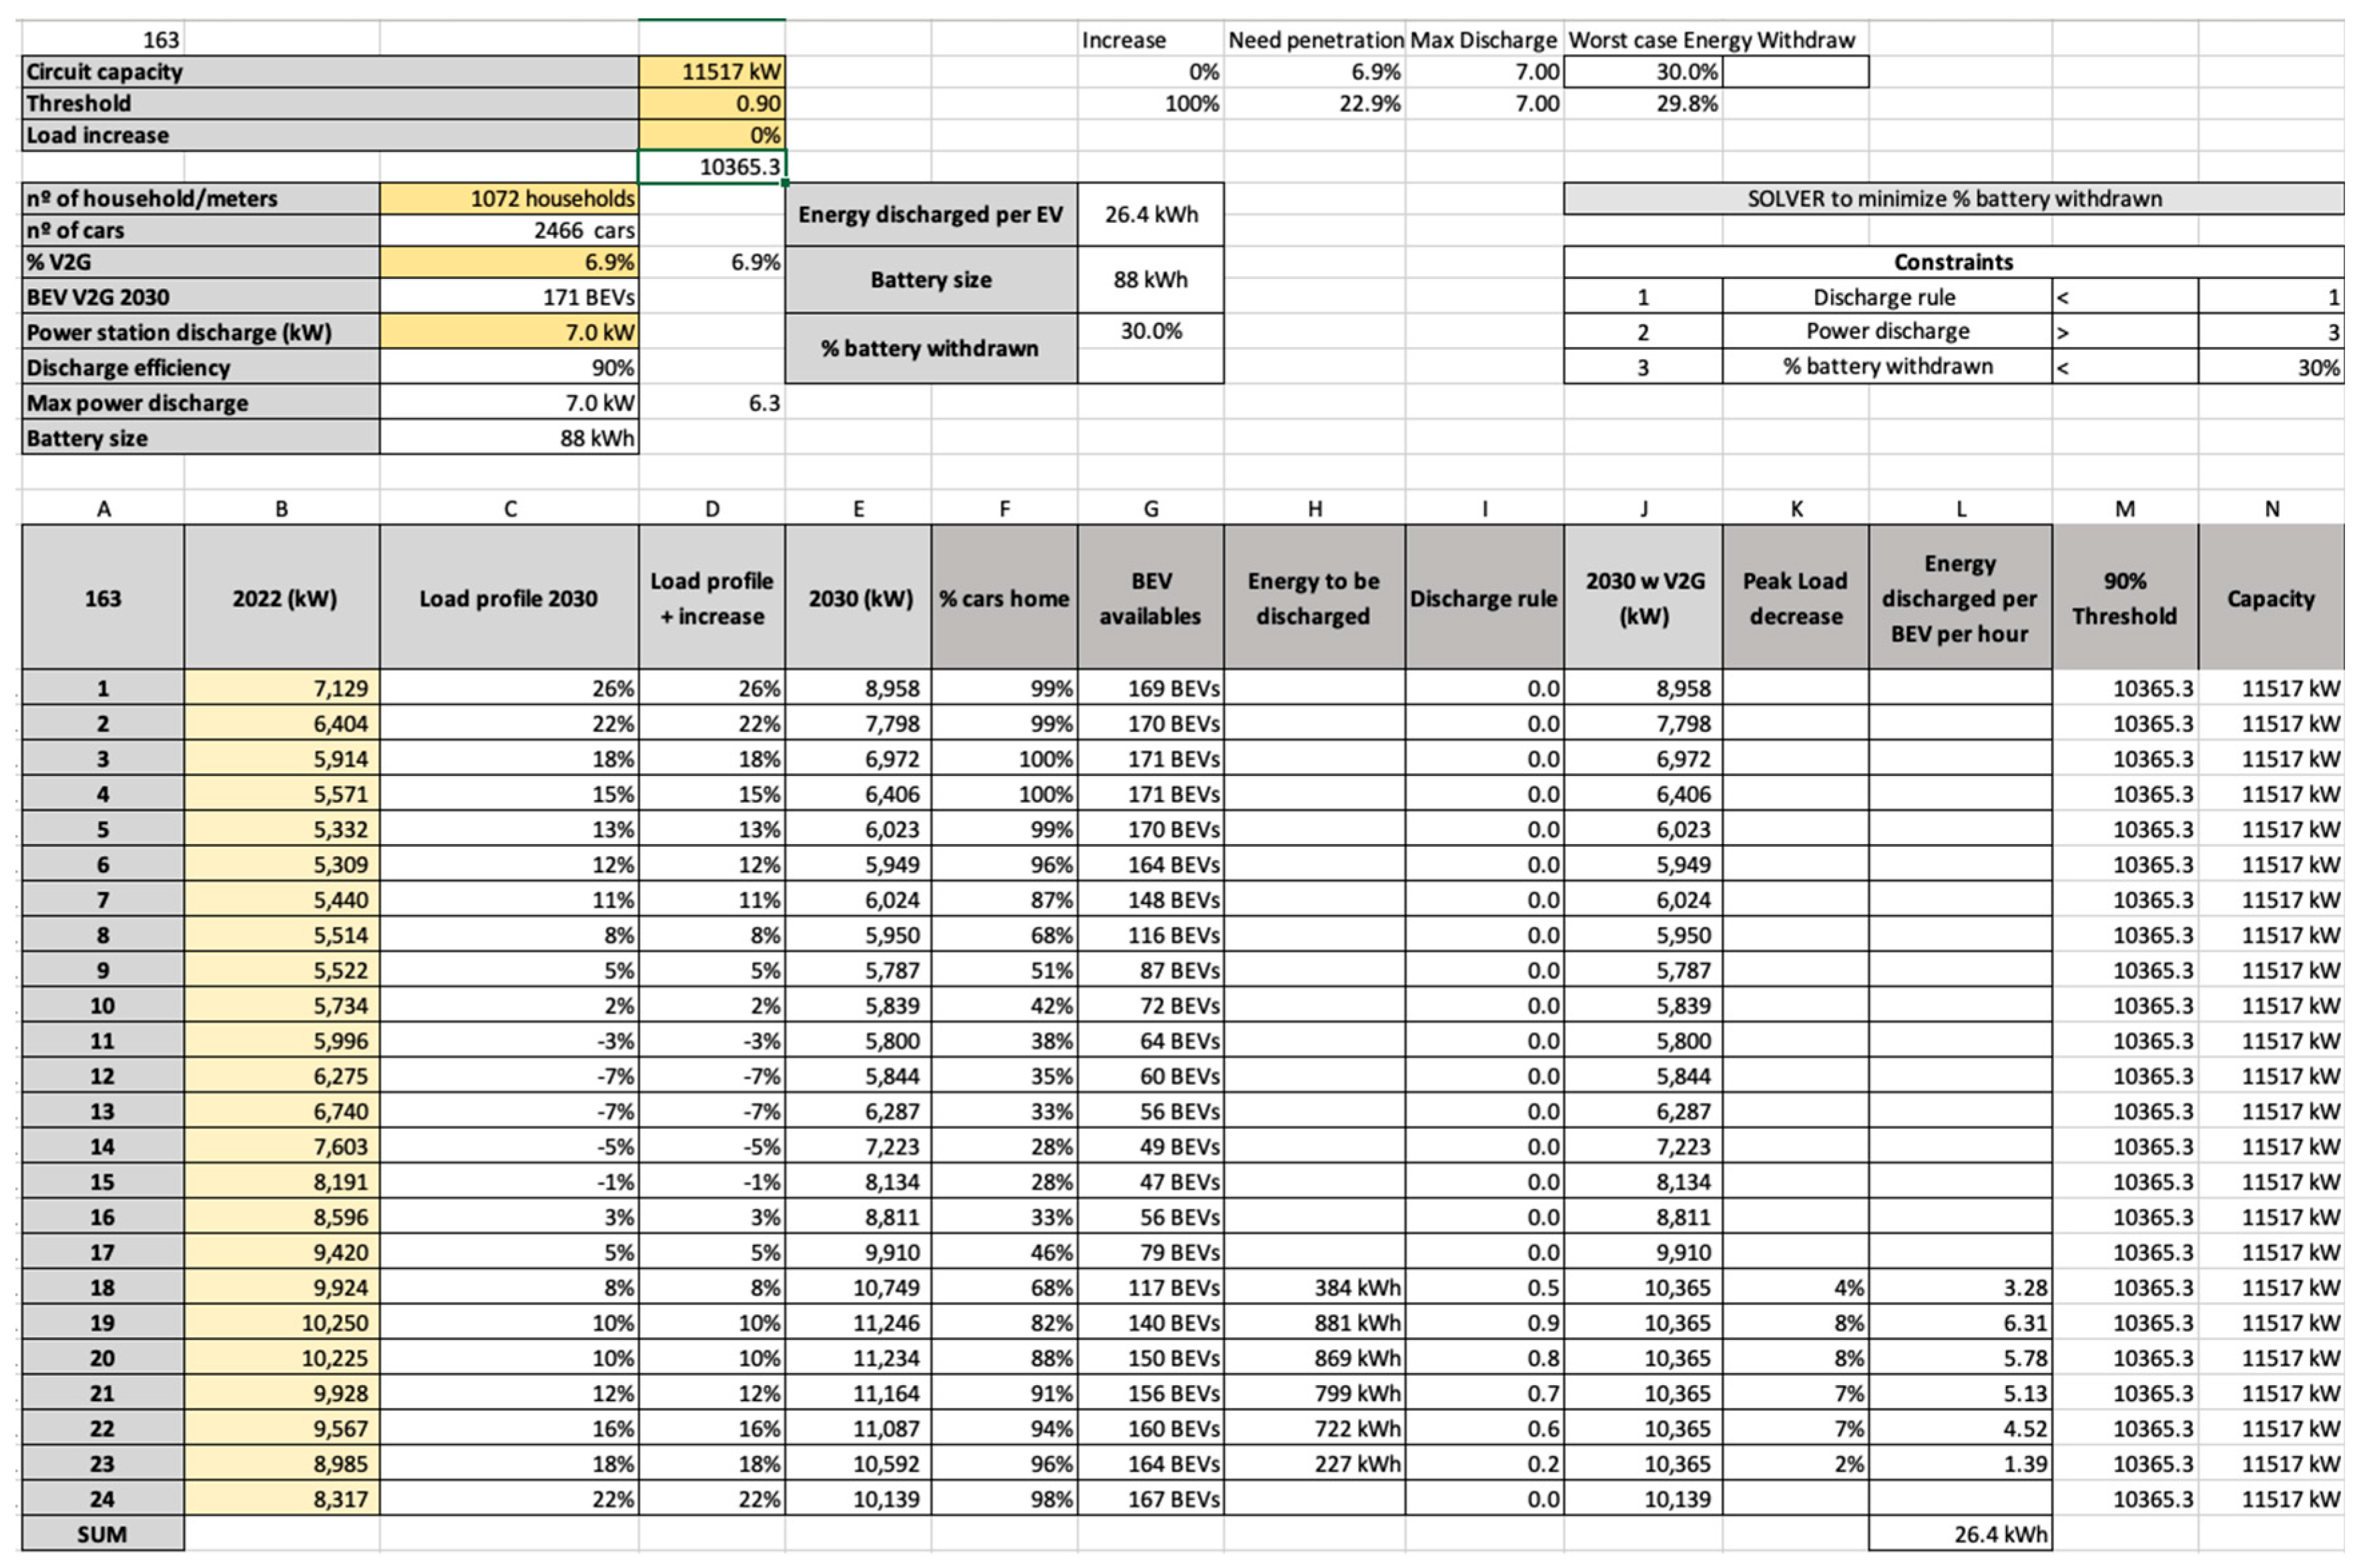
Figure 6.
Peak load on circuit 163 held to 90% of capacity by 6.9% penetration of BEVs.

Figure 7.
Load on circuit 163 with 2x CEC expected growth, held to 90% of capacity by 22.9% penetration of BEVs.
Figure 7.
Load on circuit 163 with 2x CEC expected growth, held to 90% of capacity by 22.9% penetration of BEVs.
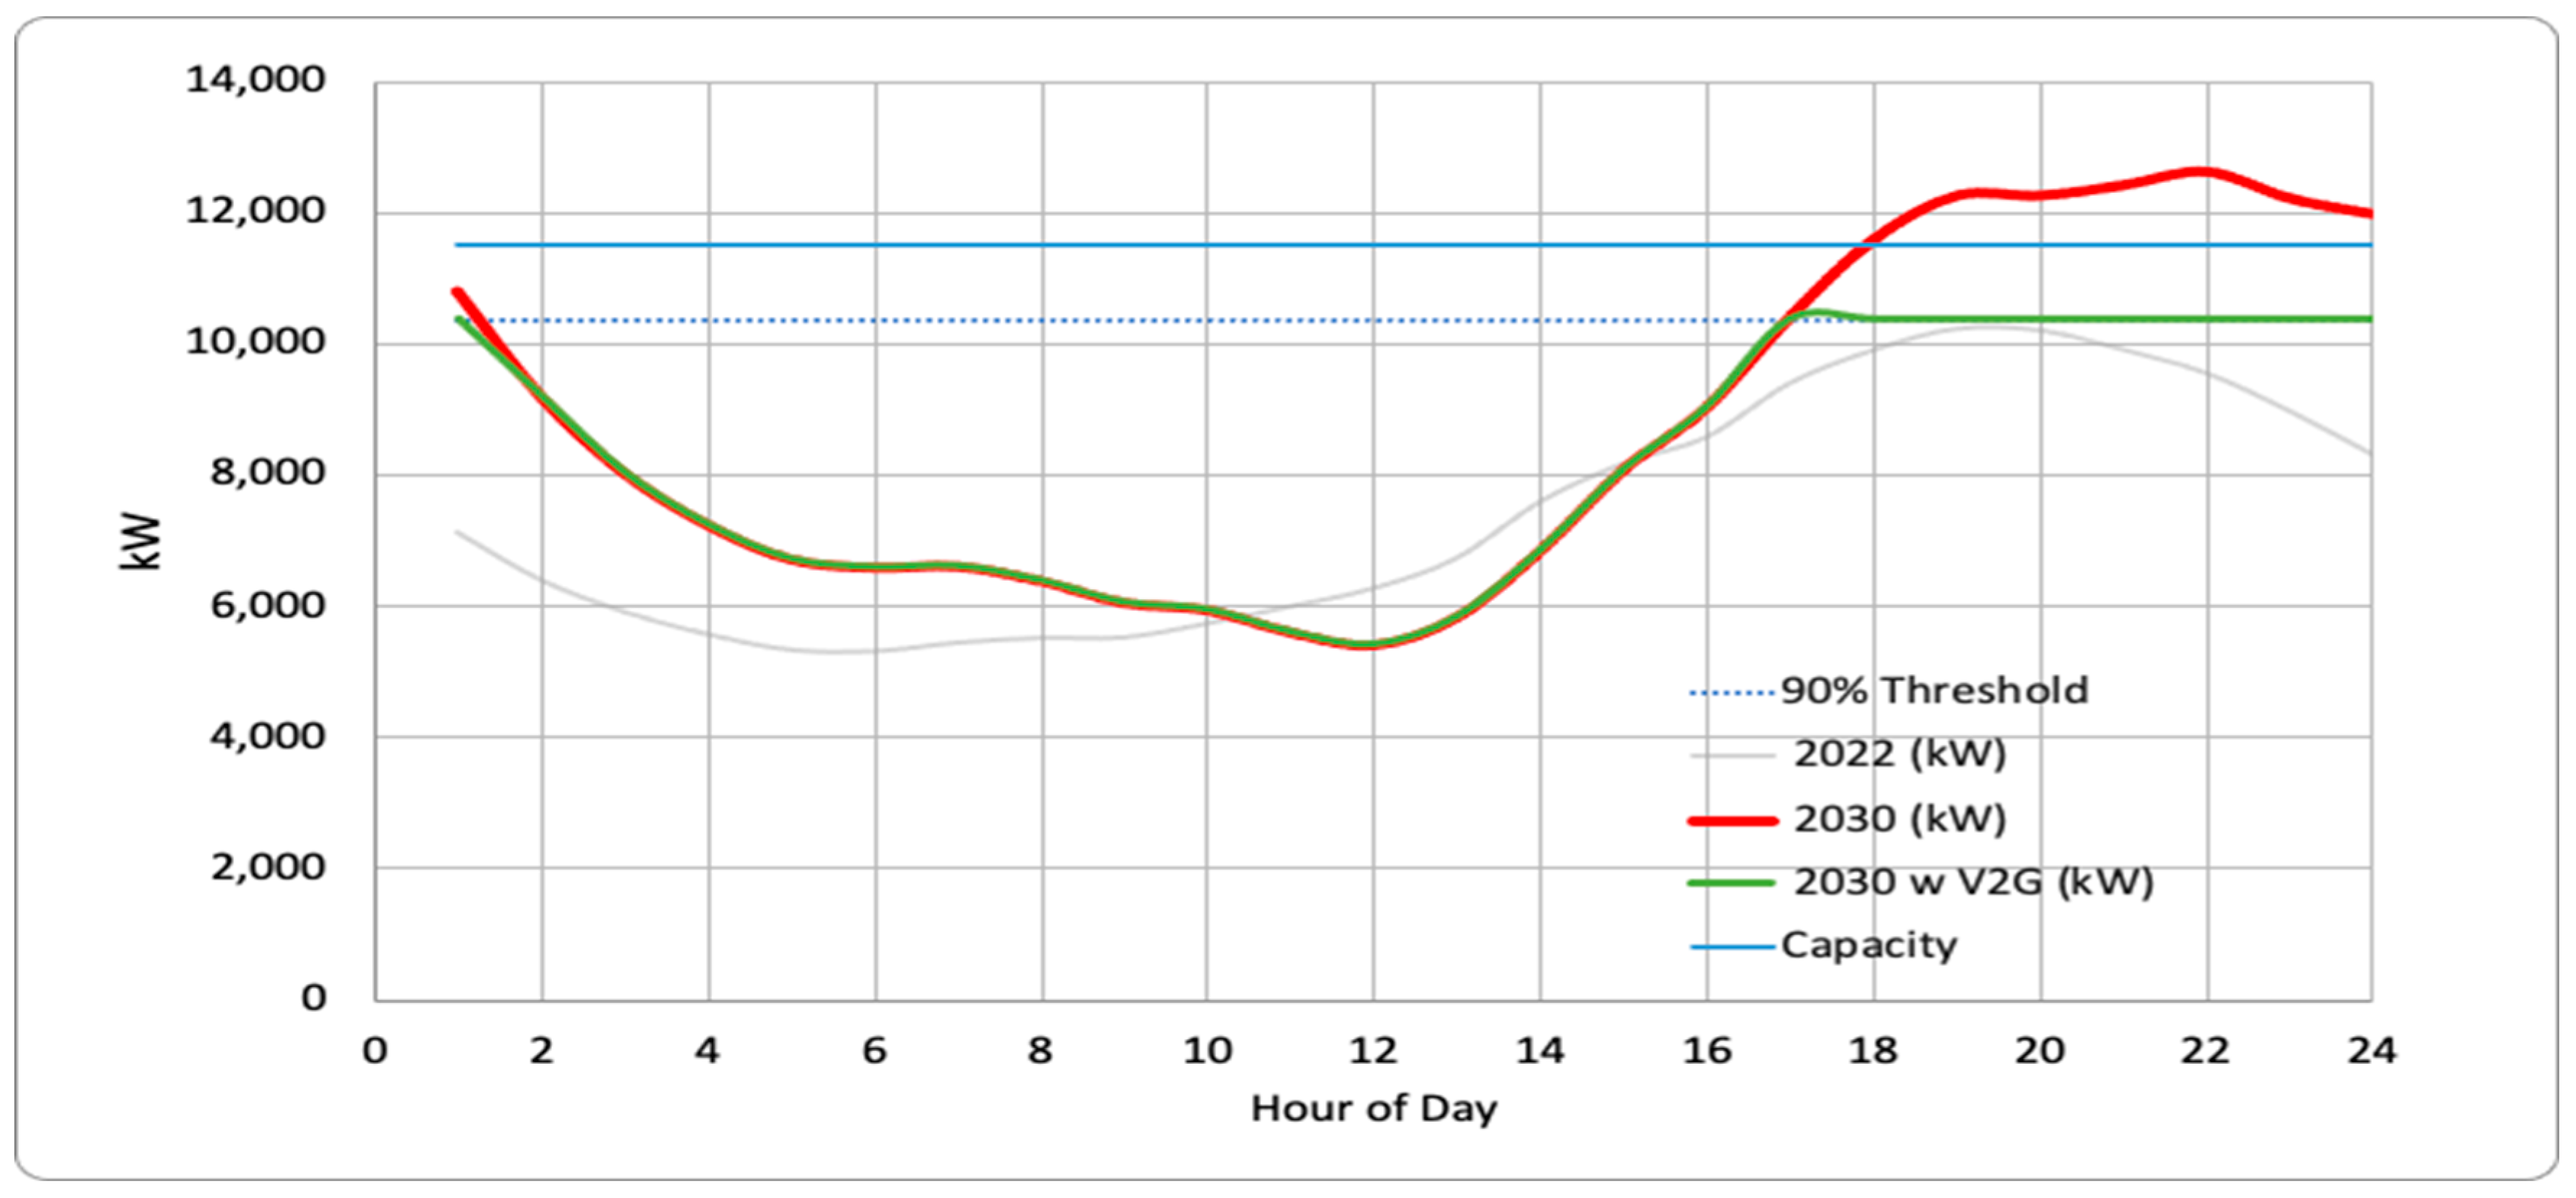
Figure 8.
Load on the SDG&E system held to 4GW by 2.5% penetration of BEVs.
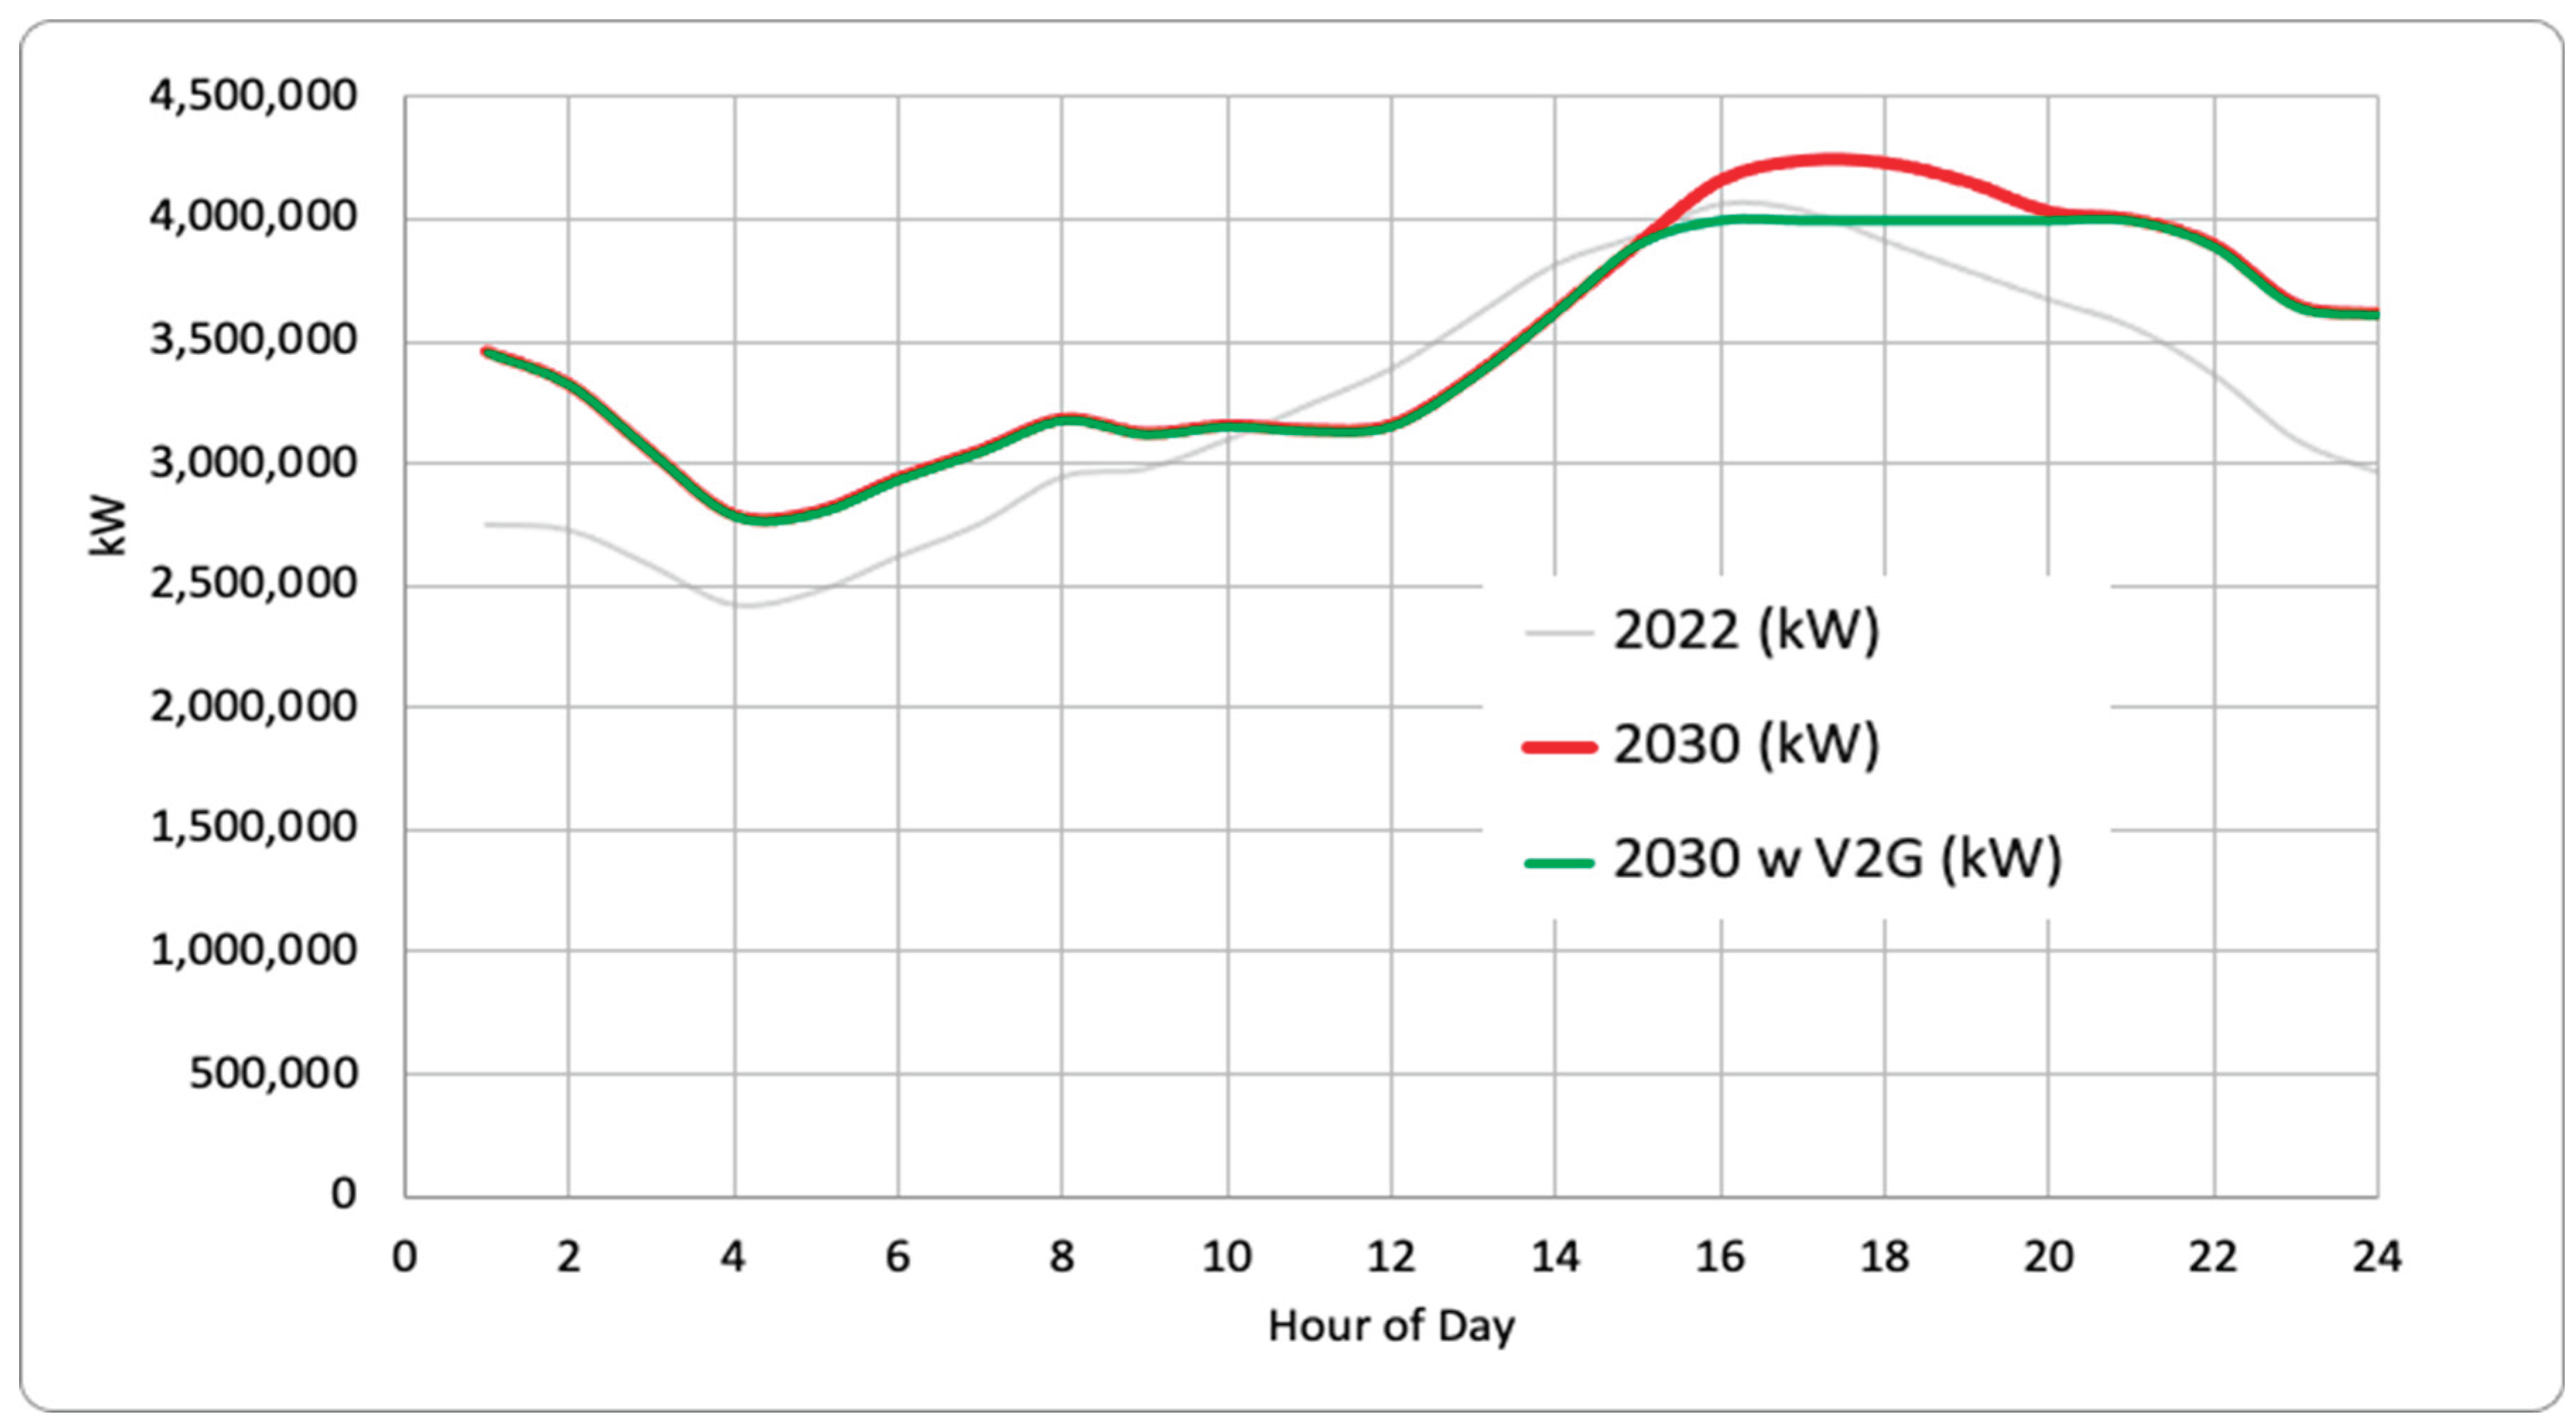

Table I.
Customer distribution by circuit in 2022.
| nº / % from total | Circuit 41 | Circuit 163 | Circuit 233 | Circuit 386 | Circuit 859 | Circuit 326 | ||||||
|---|---|---|---|---|---|---|---|---|---|---|---|---|
| Residential | 4260 | 87% | 1072 | 97% | 323 | 50% | 591 | 95% | 1470 | 94% | 1539 | 93% |
| Commercial | 624 | 13% | 30 | 3% | 36 | 6% | 28 | 5% | 100 | 6% | 107 | 6% |
| Industrial | 1 | 0% | 0 | 0% | 287 | 44% | 0 | 0% | 0 | 0% | 1 | 0% |
Table II.
Forecast demand, facility loading, and capacity, by circuit.
| Forecast demand | 8710 kW | 10250 kW | 9993 kW | 10880 kW | 9932 kW | 10623 kW |
| Facility loading | 84% | 89% | 83% | 87% | 80% | 85% |
Table III.
Results of Running model on all circuits.
| To Avoid Upgrade for 2030 load | To Avoid Upgrade for 2X 2030 load | ||||||
|---|---|---|---|---|---|---|---|
| Circuit # | Circuit Capacity kW | # Households | # Cars | % Bidirectional penetration needed | Worst case Battery Draw | % Bidirectional penetration needed | Worst case Battery Draw |
| 326 | 12,497 | 1,539 | 3,540 | 2.0% | 12.2% | 12.7% | 30.0% |
| 859 | 12,414 | 1,470 | 3,381 | 4.0% | 22.3% | 13.2% | 30.0% |
| 163 | 11,517 | 1,072 | 2,466 | 6.9% | 30.0% | 22.9% | 29.8% |
| 41 | 10,369 | 4,260 | 9,798 | 0.2% | 15.6% | 2.8% | 30.0% |
| 386 | 12,506 | 591 | 1,359 | 8.7% | 21.6% | 30.2% | 30.0% |
| 233 | 12,040 | 323 | 743 | 3.0% | 8.0% | 25.9% | 21.3% |
| All SD County | 5,000,000 | 1,140,000 | 2,622,000 | 2.9% | 23.9% | 7.6% | 30.0% |
Disclaimer/Publisher’s Note: The statements, opinions and data contained in all publications are solely those of the individual author(s) and contributor(s) and not of MDPI and/or the editor(s). MDPI and/or the editor(s) disclaim responsibility for any injury to people or property resulting from any ideas, methods, instructions or products referred to in the content. |
© 2025 by the authors. Licensee MDPI, Basel, Switzerland. This article is an open access article distributed under the terms and conditions of the Creative Commons Attribution (CC BY) license (http://creativecommons.org/licenses/by/4.0/).
Copyright: This open access article is published under a Creative Commons CC BY 4.0 license, which permit the free download, distribution, and reuse, provided that the author and preprint are cited in any reuse.


