
Submitted:
10 January 2025
Posted:
13 January 2025
You are already at the latest version
Abstract
As the adoption of electric vehicles (EVs) keeps increasing in recent years, two prevailing concerns of owners are charging station availability and reliability. During busy travel times, such as holiday weekends or during the summertime, it is common for owners to report long charger wait times due to limited site size and offline stations. Most charge point operators (CPOs) only install four to six chargers at a station, which leads to low redundancy. This study proposed a new movable, self-contained charging station design. This charging station can be deployed with short notice to temporarily increase capacity during busy times or emergencies such as evacuations due to natural disasters. With the goal of being self-sufficient, this study weighed the pros and cons of differing cell chemistries, sized the battery using charging data provided by the United States’ largest public CPO, and discussed the feasibility of a solar canopy.
Keywords:
electric vehicle
; DC fast charging
; mobile EV charging
; off-grid vehicle charging
; augmented vehicle charging
1. Introduction
Electric vehicle (EV) charging is classified using three different “levels”. Level 1 and level 2 make use of widely available, single-phase electricity and provide between 0.8 kWto 14.4 kW of power [1]. Level 1 and 2 charging make use of electric vehicle supply equipment (EVSEs) to provide AC power to the vehicle, which then uses an onboard charger to convert the AC power to DC power to charge the battery. Level 3 uses three-phase power, generally only available in commercial locations, and provides anywhere from 20 kW to 350 kW of power output [2]. These level 3 stations, also known as DC fast chargers (DCFCs), are generally what people think of when “electric vehicle chargers” are discussed. These chargers perform the AC to DC rectification outside the vehicle and deliver DC power directly to the vehicle’s battery, bypassing the vehicle’s onboard charger. The DCFCs tend to be placed in high-traffic areas such as shopping malls or at travel centers along busy highway corridors enabling long-distance traveling for EVs [3].
Many DCFC charge point operators (CPOs), such as Electrify America, EVgo, and ChargePoint, construct charging stations every 100 to 150 miles along travel corridors. Most EVs sold today have enough range to arrive at every station, but in most cases do not have enough range to skip a location. This requires drivers to stop at every station, making charger turnover and reliability of great concern to drivers and CPOs. Corridors such as Interstate 80 (I80) linking Salt Lake City, UT to Wyoming, or US Highway 93 linking Phoenix, AZ to Las Vegas, NV have very limited charging infrastructure to the point that one station being down makes these corridors impossible for EVs. The uncertainty surrounding charger availability leads some users to charge their vehicle to 100% when they do find a functional charger, a practice that can take hours and further exacerbates the problem of charger congestion.
Many criticize public CPOs for not installing more chargers per site, following in the footsteps of private CPOs such as Tesla. The typical Tesla Supercharger station has between eight and twelve stalls, while some stations include up to a hundred stalls. However, such station installations are costly and are rarely — if ever — fully utilized [4,5]. The limited station size can lead to bottlenecks during emergency evacuations, further slowing the adoption of EVs in hurricane or flood-prone areas. This also means just one stall being out of order can lead to long wait times as queues form [6]. Some equipment failures occur in such a manner that makes them hard or impossible to repair promptly and some CPOs are unable to get technicians out to the site quickly to repair the station. For these reasons, a mobile deployable charger makes a significant contribution to alleviating the queue and reducing wait times.
Multiple studies have been conducted using both real-time data and collected data to determine station reliability. Results have shown that between 20% and 23% of publicly available chargers are faulty in some way, leading to drivers being unable to charge [7,8]. If this rate is applied to stations along travel corridors where there are only four to six stalls per station, then at any given time between one and two stalls at a station may be non-functional.
For the purposes of this paper, “charger” or “stall” refers to a single, typically independent, dispenser which users plug their car into, while “site” or “station” refers to a particular location in which multiple chargers are placed within close proximity to one another (typically in adjacent parking slots). “Open” or “public” charging networks refer to those networks operated by CPOs at which any EV can charge regardless of manufacturer, such as Electrify America (EA) or EVgo. “Closed” or “private” charging networks are those where a majority of stations (> 50%) are limited to an exclusive list of manufacturers, such as Tesla Superchargers or Rivian Adventure Network (RAN).
2. Research Need
Charging deserts exist on vast expanses of American highways, particularly in the west. EV owners frequently vent their frustration in online forms with public CPOs [9,10,11], but the charging station review aggregation website PlugShare has become the most common outlet to express their frustration with broken hardware. Focusing again on the US 60 and US 93 corridors connecting Phoenix, AZ to Las Vegas, NV, once drivers leave the Phoenix Metropolitan Area there are only two DCFCs open to the public: a single 22 kW station at a dealership in Wickenburg, AZ, and a four-stall Electrify America (EA) station in Kingman, AZ. Beginning during the busy Memorial Day weekend of 2024 and continuing through July, users reported that at least one stall was down at the EA station [6]. However, multiple users across different days and weeks reported stalls being “derated” (only outputting a fraction of their rated output), had problems connecting to their vehicles, or said as many as three of the four stalls were unusable in some way [6]. During the holiday weekend, one user reported a queue as long as 11 vehicles waiting to charge; another user reported waiting 45 minutes to charge, and another user said there was still a queue at 10 pm on a Monday evening [6]. This station is not only highly important for traffic traveling between Phoenix and Las Vegas, but it is also the only stop between Needles, CA and Williams, AZ along Interstate 40, another busy corridor connecting travelers to Los Angeles, as shown in Figure 1.
One of the top concerns for potential EV buyers has continually been charging infrastructure and its availability, something that has been described as a “chicken and egg” situation: one must occur for the other to follow. Issues like that at the Kingman, AZ EA station have given gas vehicle owners pause when considering an EV. The general sentiment around road-tripping in an EV, regardless of the driver’s attitude towards EVs, is that it is a struggle [12]. Charger availability and reliability is a major issue that must be solved if EVs are to remain viable. While the initial cost might be higher for the portable charger discussed in this paper, the fact that the charger can be moved gives CPOs greater flexibility. For example, the charger could be moved to a new location along a travel corridor that experiences infrequent, but predictable, surges in demand. Furthermore, CPOs could place the charger at a potential site for a new station to gather demand information and “test the waters” before making a more permanent investment.
3. Charging Trailer Design
3.1. Design Constraints
In order to be transported and delivered where needed, the trailer must be hauled by a semi-truck. Therefore, the design will be limited by two constraints: first, all the power electronics, canopy covers, and the batteries must fit within the confines of a semi-trailer. Second, the total weight, including the semi-tractor, must be at or under 36,287 kg (80,0000 lbs). The weight of an unloaded tractor-trailer is estimated to be about 13,600 kg (30,000 lbs) [13], so a total weight at or under 22,680 kg (50,000 lbs) is targeted. It is also desirable to have a design that allows small services to be completed in-trailer, but also be modular so individual chargers or battery modules can be removed and serviced as needed. To achieve both requirements, six individual charger and battery combo units dubbed “Power Cubes” are mounted on rails in the trailer. These modules can be pulled partially out or removed entirely, and either repaired or replaced. One “cube” would contain the vehicle charger, DC-to-DC conversion equipment, battery management system (BMS), and battery cells. Each cube could be standalone — operated on its own even outside the trailer — or placed into parallel mode with other cubes to share battery capacity. Each cube’s BMS would be able to balance the cells within the cube and communicate with the trailer’s main BMS to balance all six cubes.
3.2. Battery Analysis
There are currently two major lithium chemistries used in electric vehicle batteries: nickel manganese cobalt (NMC) and lithium iron phosphate (LFP). NMC cells are generally preferred due to their high energy density. However, NMC cells have multiple disadvantages. First, the cells are very temperature sensitive in both extreme cold and extreme heat which can cause premature degradation, decreasing the amount of energy storage available [14]. For emergency situations where weather extremes are likely to occur, the ability to withstand extreme temperatures is highly desirable. Second, NMC cells experience great degradation when subjected to large amounts of “top charging”, aka charging to 100%, and NMC cells do not hold up well when kept at high states of charge for extended periods [15]. Finally, due to the large amount of energy planned to be stored in the trailer, safety is a major concern. NMC batteries are often regarded as less stable than LFP, and thus more likely to catch fire compared to other battery chemistries [16,17,18]. For example, thermal runaway for LFP cells is shown to occur around 256 °C, whereas NMC cells hit thermal runaway at 198 °C [17]. Thermal runaway propagation for NMC cells was five times faster than LFP cells, in part due to the lower maximum temperature of LFP cell fires (899 °C for NMC versus 524 °C for LFP) [18]. For these reasons, this study will focus on using LFP batteries.
Working within the constraints of the tractor-trailer and the legal maximum towing capacity, the limiting factor is the maximum weight. To calculate the theoretical maximum capacity for the trailer given a specific energy, the following equation can be used:
Currently, Contemporary Amperex Technology Co., Limited (CATL) produces the most energy-dense LFP battery, achieving a maximum specific energy of 160 Wh/kg and an energy density of 345 Wh/L [19,20]. Given a limit of 22,680 kg, the maximum allowable size of the battery is 3.63 MWh before factoring in other equipment.
In their 2023 Annual Report, Electrify America (EA) – the largest, public charging network in the United States – reported delivering 374 GWh of energy over 10.7 million charging sessions and 3800 chargers [21]. That breaks down to about 35 kWh per session, with each charger seeing 7.7 sessions per day and dispensing, on average, 270 kWh per day. Since six chargers onboard the trailer are targeted, we estimate a daily energy consumption of 1.62 MWh. This gives a maximum runtime of approximately 2.25 days given current, off-the-shelf technology.
LFP batteries with higher energy density are on the horizon. A report from The Production Engineering of E-Mobility Components Chair at RWTH Aachen University stated that, with current technology, LFP batteries could reach an energy density of up to 200 Wh/kg, increasing the theoretical capacity of the trailer to 4.54 MWh [22]. The total weight must still account for the DC-to-DC power converter equipment, the cooling system, and serviceability in the future, so the actual battery capacity must be smaller.
3.3. Charger Setup and Design
Currently, very few charge point operators (CPOs) have deployed stations with integrated batteries. Their use tends to be for reducing peak-power demands and not the sole source of power. EA and Tesla are the only two CPOs known to use battery storage at their charging sites, with both using Tesla’s Megapack battery storage solution [23]. However, neither CPO openly discusses their system design, so it is unknown if the charger can pull power directly from the battery or if it is rectified to AC before being sent to the charging equipment.
For this work, an end-to-end 400 V class DC system is considered. This will minimize losses and remove the need for DC-to-AC and AC-to-DC conversion. Due to the vast majority of DCFCs currently installed being limited to 400 V, all EVs are equipped to charge on 400 V stations even if they have an 800 V class architecture [24]. Because of this, a 400 V nominal rating is chosen. Each Power Cube would have a 400-Volt class battery and be rated to output 400 V at 375 amps independently of other cubes for a maximum output of 150 kW. Readily available DC fast chargers from ABB or Signet have an efficiency of 95% [26]. Studies have shown that high-power DC-to-DC converters have significantly less energy loss, amounting to an efficiency of 98% [26].
Due to the energy capacity of the battery, and the want to minimize project complexity and weight, this study opted to leave off any sort of AC charging. Doing this means AC to DC rectification will be handled solely off the trailer. To charge the trailer, the Combined Charging System (CCS) connector or J3400 (also known as North American Charging Standard, or NACS) would be standard to charge the trailer using DC charging infrastructure.
3.4. Future 800-Volt Compatibility
In the future, should faster charging speeds or native 800-Volt charging be needed, a small design update could be made to add contactors allowing two Power Cubes to act in series. This could be advantageous for commercial and industrial customers who maintain fleets of electric pickup trucks. Similar technology is already in use in electric pickup trucks: General Motor’s (GM) Ultium platform operates natively in 400-Volt mode, but in vehicles with the 24-module battery, a contactor can be actuated to split the pack into series mode and charge at 800 V on a compatible charger [27,28]. Similarly, the Tesla Cybertruck runs natively at 800 V, but uses a contactor to split the battery into parallel mode to charge at 400 V stations [29].
Such an update to the system would also allow for faster charging of the batteries themselves. The fastest DCFC currently available is rated at a maximum of 500 A at 920 V using the Combined Charging System (CCS) connector [30]. Tesla also reported that the recently standardized J3400 connector (also known as North American Charging Standard, or NACS) will be capable of “up to” 1000 V, and had tested the connector continuously at 900 A [31]. This means at 800 V the charger can output 500 kW, while at 400 V it can output 250 kW. To fully charge the battery in the trailer, it would take ~14.5 hours at 400 V or ~7.25 hours at 800 V given a flat charging curve.
3.5. Feasibility of Solar Canopy
A typical semi-trailer has four blank sides that are typically used for advertisement of the store or company for which the trailer is hauling goods. This work would make use of these to protect the chargers while in transport and shade vehicles while they’re charging. However, since these canopies are moveable, it would make them ideal canvases for photovoltaic (PV) panels.
Current off-the-shelf PV panels have an efficiency of 25%, with emerging technologies currently being researched approaching 46% [32]. The average direct irradiation on Earth each day varies based on a location’s distance from the equator, but for the United States can vary from 3.5 kWh/m2 to 6.5 kWh/m2 per day [33,34]. For the purposes of this study, the average for Logan, Utah was used, which is around 5 kWh/m2 per day. Given the coverable surface area of the trailer is 132.4 m2, the estimated output from the panels would be 165 kWh/day given the following equation
Any PV system comes at a cost in both tangible dollars and the complexity of the system. With an estimated system size of 33 kW, given the estimate of $1.70 per Watt provided by the National Renewable Energy Laboratory (NREL), it can be estimated a total system cost of $56,000 [35]. It would also require the installation of a solar charge controller and an additional DC-to-DC converter to boost the voltage to charge the battery.
3.6. Integrated Design
As previously discussed, the limiting factor for this study was the maximum weight for the trailer. The safety of LFP batteries comes at the cost of a lower energy density compared to NMC cells. This study deemed it a worthy trade-off, but the battery calculation did not take into account other sources of weight.
Charging equipment and the DC-to-DC conversion equipment would be the next greatest source of weight. The only currently known converter capable of the power input and output required for this design was created by the Volkswagen Group for use in the Porsche Taycan and Audi e-Tron lines of vehicles [36,37]. This converter was specifically meant to allow the vehicles to charge at 150 kW when using 400 V DC fast charging stations compared to the typical 50 kW the vehicles would be limited to at such a station. Because this device is proprietary, its exact weight and dimensions are not known. Other converters capable of taking in similar power ratings but outputting a significantly lower voltage are common and weigh 9 kg (20 lb) [38].
Most of the weight and size of DC fast chargers come from their switching equipment, rectifying AC voltage from the grid to DC voltage that can be accepted by the battery. Since that is all able to be replaced with the DC-to-DC converter, only the charge cable and user interface components such as an LCD remain. A typical CCS Type-1 cable comes in at 7.5 kg (16.5 lb) [39] with the rest being negligible.
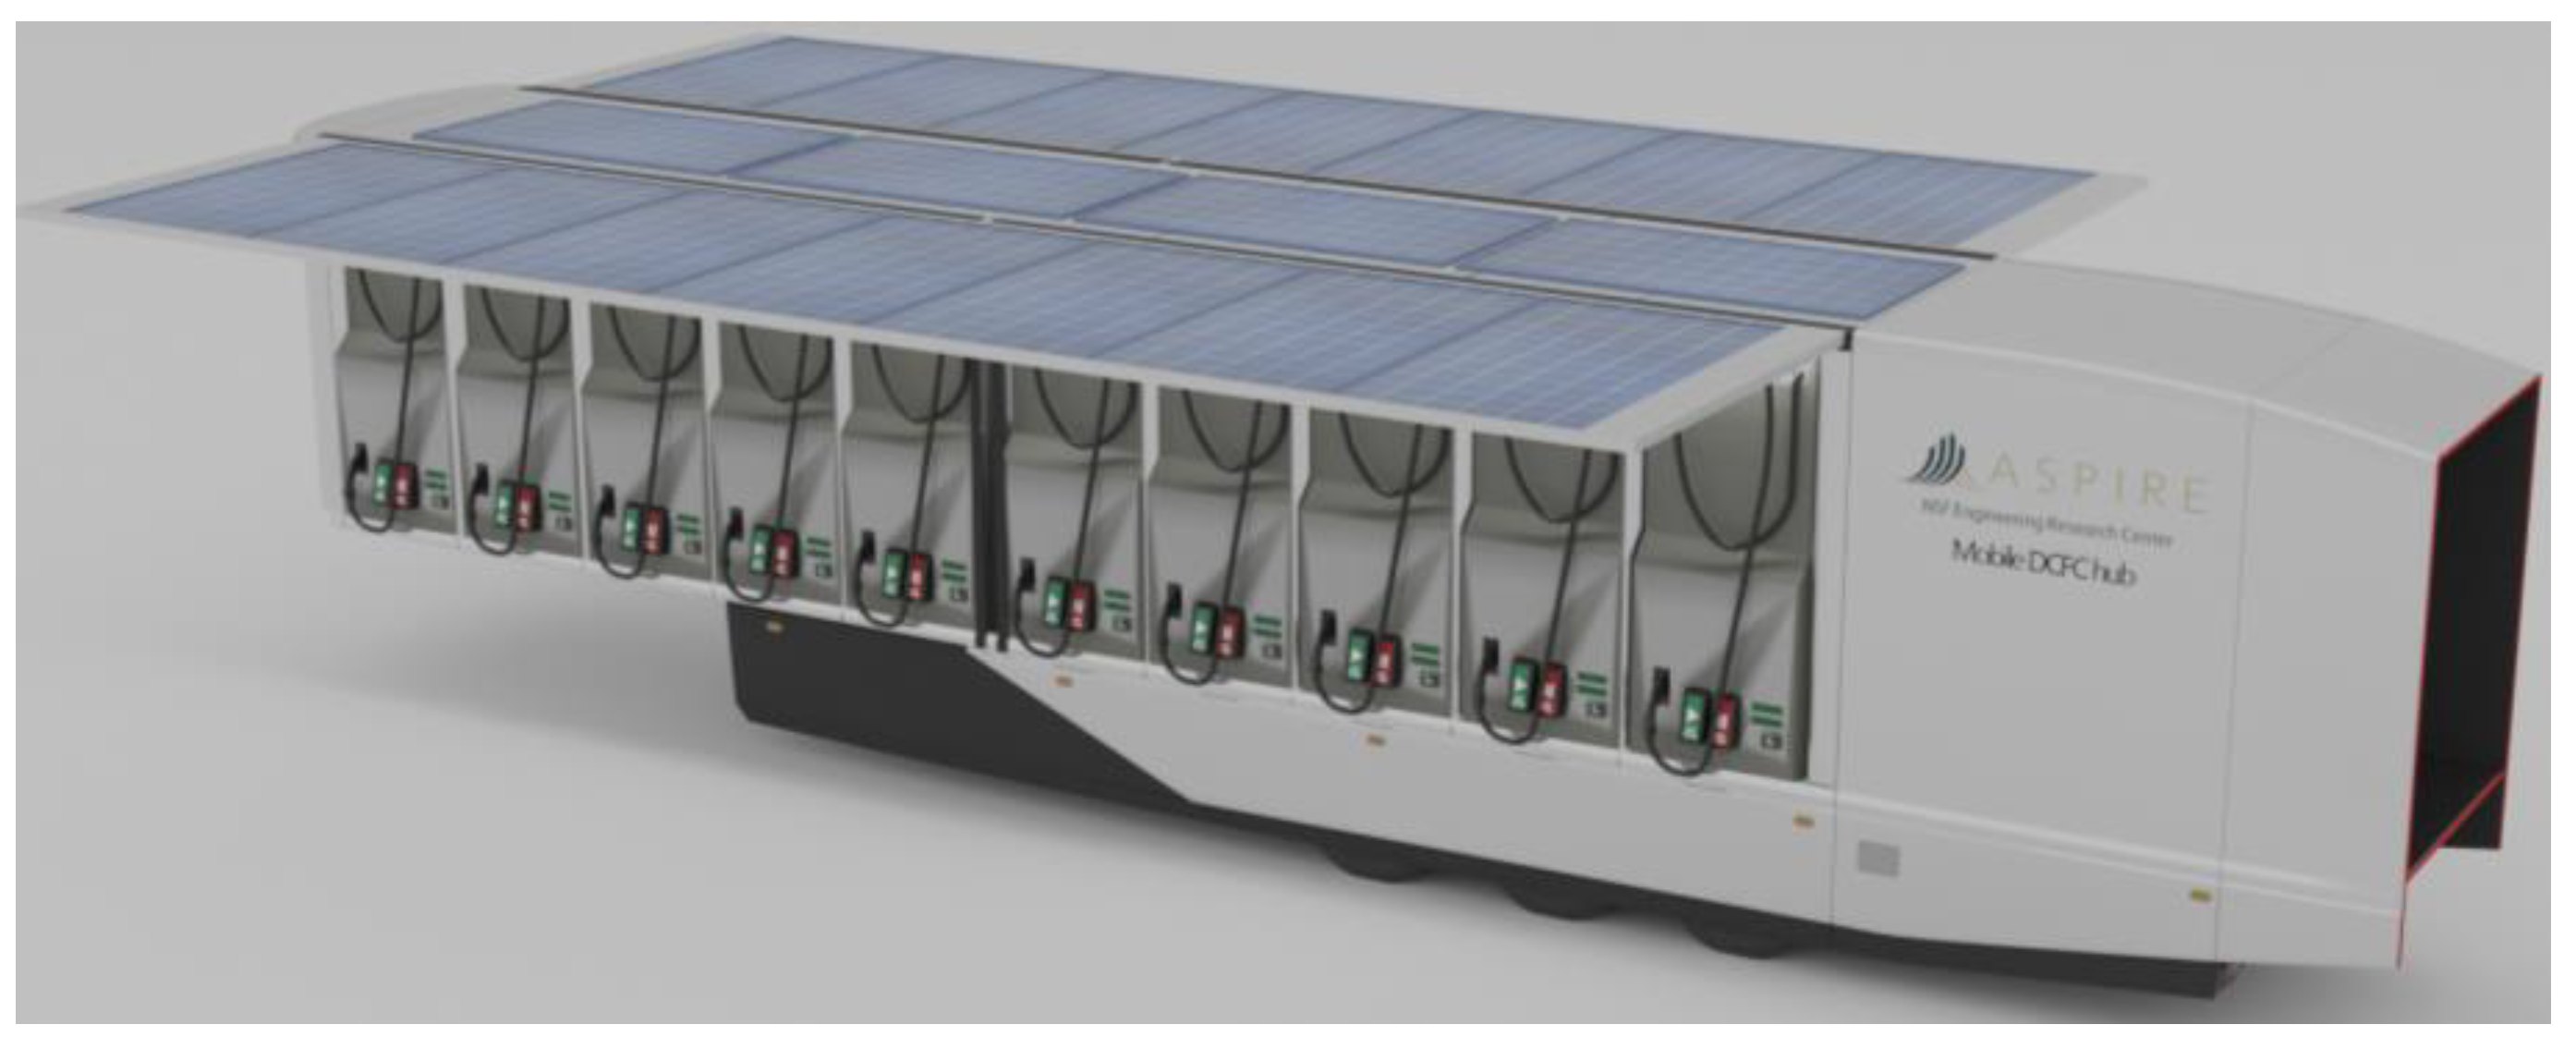
The final major source of weight is expected to be the solar canopy, incorporated into the design highlighted in Figure 2. Estimates show that the weight of typical residential panels is about 11 kg/m2 (24.3 lb/m2) [40]. That brings the total for the solar installation to 1456 kg (3210 lb) to provide approximately 165 kWh of energy per day based on data detailed in Section 3.5. To add in the solar canopy, the battery would have to be decreased in size by 234 kWh. Due to the unpredictability of the amount of solar-generated per day due to clouds, time of year, and other factors, it would not be advantageous to add solar at this time given current technology.
4. Cost Analysis and Feasibility
Most of the parts for a trailer like the one discussed can be bought off-the-shelf with the sole exception of the DC-to-DC converter. Batteries and solar panels – if equipped – are readily available for purchase.
To determine the number of battery cells that are required to meet a specific cube voltage, the following equation should be used:
With current technology, each block would contain 150 Ah for a total energy capacity of 615 kWh per cube. Given the price of $83 per battery [41], the cost of the battery for each cube is estimated to be $106,000. For six total cubes per trailer, the cost of batteries is estimated to reach $636,000. For this design of the trailer, the battery would be the only major known cost source. The estimated cost for a standard trailer is $40,000, with a refrigerated trailer estimated to be $60,000 [42]. Since the CCS cables used for the trailer can be standard, off-the-shelf units, the price is estimated to be $5,500 per cable, bringing the total for CCS cabling up to $33,000 [45]. Custom work would need to be done to build the cubes, the rail mounting system, and make use of the refrigerated trailer’s HVAC system to cool and heat the battery coolant through the custom backplane.
If a user were to add the solar canopy, the total capacity of the trailer would decrease by 234 kWh, reducing the cost of the batteries by $40,000. However, as discussed in Section 3.4, the solar comes at a cost of $56,000.
Either option would cost a minimum of $730,000 before custom fabrication. Given that Electrify America (EA) charges an average of $0.56 per kWh [43], barring any other expense such as the equipment and electricity to charge the trailer, the trailer would need to dispense 1.25 GWh of energy before it would break even given the current cost of batteries. This would take two consecutive years of usage per the usage rates calculated in Section 3.2.
When compared to the cost of a grid-connected DCFC, the feasibility of a trailer like the one proposed begins to make more sense. In their attempt to plug charging holes in their most important travel corridors, the State of California found that an off-grid, self-supporting DCFC station could cost as much as $858,000 [44]. For rural sites that were able to be connected to the grid, the cost was lower but nevertheless considerable: $122,000 to $440,000 per station [44]. In these rural situations where the chargers may never be at full capacity and take years or longer to generate profit, it might make sense for CPOs to go with a mobile approach such as the one outlined in this paper.
5. Conclusions and Future Research
This paper outlined and discussed the design of a novel EV DCFC integrated into the trailer of a semi-truck. With this design, charge point operators would be able to move a charger to where it is needed, allowing for greater flexibility than a stationary charging site. Different battery capacities were discussed and compared based on energy density and overall safety, with a choice made in favor of LFP cells. As novel battery technologies reach maturity, future updates could increase the energy density or reduce the cost of this project. The feasibility of integrating solar canopy into the mobile DCFC design is analyzed with a conclusion that it would not be advantageous to add solar at this time given current technology. Cost analysis shows the feasibility of the proposed concept and design, especially considering rural areas, high-traffic holiday seasons, and emergencies. More work is needed to fully recognize the components needed for the trailer, such as the DC-to-DC converter to match the trailer voltage to the voltage of the EV charging.
References
- Flores, Robert J., et al. “Electricity costs for an electric vehicle fueling station with level 3 charging.” Applied Energy, vol. 169, May 2016, pp. 813–830. [CrossRef]
- Chakravarthy, B.K., et al. “Review on charging methods and charging solutions for Electric Vehicles.” E3S Web of Conferences, vol. 547, 2024, p. 03001. [CrossRef]
- Motoaki, Yutaka. “Location-allocation of Electric Vehicle Fast Chargers—Research and Practice.” World Electric Vehicle Journal, vol. 10, no. 1, 6 Mar. 2019, p. 12. [CrossRef]
- Amariei, “Tesla’s Largest Supercharger Station Is Open, Has Solar Canopies and Pull-Through Spots,” autoevolution, Sep. 05, 2023. https://www.autoevolution.com/news/tesla-s-largest-supercharger-station-is-open-has-solar-canopies-and-pull-through-spots-220629.html.
- “Terrible Herbst | Quartzsite, AZ | EV Station,” PlugShare. https://www.plugshare.com/location/545099.
- “Smith’s Kingman AZ | Kingman, AZ | EV Station,” PlugShare. https://www.plugshare.com/location/315440.
- O. I. Asensio, K. Alvarez, A. Dror, E. Wenzel, C. Hollauer, and S. Ha, “Real-time Data from Mobile Platforms to Evaluate Sustainable Transportation Infrastructure,” Nature Sustainability, vol. 3, no. 6, pp. 463–471, Jun. 2020. [CrossRef]
- D. Rempel, C. Cullen, M. M. Bryan, and G. V. Cezar, “Reliability of Open Public Electric Vehicle Direct Current Fast Chargers,” SSRN Electronic Journal, Apr. 2022. [CrossRef]
- “Electrify America is a liability,” Kia EV Forum, Sep. 26, 2023. https://www.kiaevforums.com/threads/electrify-america-is-a-liability.6182/.
- “Electrify America charging issues - More RAN stations because I don’t want to deal with this nonsense.,” Rivian Forums, Dec. 30, 2020. https://www.rivianforums.com/forum/threads/electrify-america-charging-issues-more-ran-stations-because-i-dont-want-to-deal-with-this-nonsense.
- “Electrify America Chargers - OEMs Need to Step In,” BMW i4 Forum, Aug. 20, 2022. https://www.i4talk.com/threads/electrify-america-chargers-oems-need-to-step-in.5559/page-5.
- Karanam, Vaishnavi Chaitanya and G. Tal, “How Disruptive are Unreliable Electric Vehicle Chargers? Empirically Evaluating the Impact of Charger Reliability on Driver Experience,” Mar. 2024. [CrossRef]
- “Weight and Size of Tractor Trailers,” Maryland Personal Injury Lawyers, Sep. 05, 2023. https://www.millerandzois.com/practice-areas/maryland-truck-accident-lawyer/maryland-truck-accident-law/weight-tractor-trailer/#:~:text=The%20average%20empty%20tractor%20trailer.
- Mikheenkova et al., “Ageing of High Energy Density Automotive Li-Ion Batteries: The Effect of Temperature and State-of-Charge,” Journal of the Electrochemical Society, vol. 170, no. 8, Aug. 2023. [CrossRef]
- J. Nájera, J. R. Arribas, R. M. de Castro, and C. S. Núñez, “Semi-empirical ageing model for LFP and NMC Li-ion battery chemistries,” Journal of Energy Storage, no. 72, Nov. 2023. [CrossRef]
- S. Ohneseit et al., “Thermal and Mechanical Safety Assessment of Type 21700 Lithium-Ion Batteries with NMC, NCA and LFP Cathodes–Investigation of Cell Abuse by Means of Accelerating Rate Calorimetry (ARC),” Batteries, vol. 9, no. 5, p. 237, Apr. 2023. [CrossRef]
- M. Brand et al., “Electrical safety of commercial Li-ion cells based on NMC and NCA technology compared to LFP technology,” World Electric Vehicle Journal, vol. 6, no. 3, pp. 572–580, Sep. 2013. [CrossRef]
- J. Schöberl, M. Ank, M. Schreiber, N. Wassiliadis, and M. Lienkamp, “Thermal runaway propagation in automotive lithium-ion batteries with NMC-811 and LFP cathodes: Safety requirements and impact on system integration,” eTransportation, vol. 19, Jan. 2024. [CrossRef]
- J. Gustafsson, “Study for development of a modular battery pack for use in off-highway vehicles at sub zero temperature,” Degree Project, Chalmers University of Technology, 2024. Available: https://odr.chalmers.se/items/0528c630-3d42-42bd-bfeb-80fe9093ab29.
- Contemporary Amperex Technology Co., Limited, “Product Specification of 150Ah Cell,” Contemporary Amperex Technology Co., Limited. Available: https://batteryfinds.com/wp-content/uploads/2021/06/CATL-150Ah-Lithium-Iron-PhosphateLiFePO4-LFP-Battery-Cells-Product-Datasheet.pdf.
- Electrify America, “2023 Annual Report to the Environmental Protection Agency,” Electrify America. https://media.electrifyamerica.com/assets/documents/original/1156-SummaryDeck2023AnnualReportNational.pdf.
- R. Backhaus, “Cell Development for the Batteries of Future Electric Vehicles,” MTZ worldwide, vol. 84, no. 10, pp. 8–13, Sep. 2023. [CrossRef]
- F. Lambert, “Electrify America has now deployed Tesla Powerpacks at over 140 charging stations,” Electrek, Dec. 02, 2021. https://electrek.co/2021/12/02/electrify-america-deployed-tesla-powerpacks-over-140-charging-stations/.
- Kane, Mark. “Hyundai’s E-GMP Can Use 400/800v DC Chargers but What Is the Efficiency?” InsideEVs, 2 Dec. 2020, insideevs.com/news/457967/hyundai-egmp-400-800v-dc-chargers-efficiency/.
- K. H. Edelmoser and F. A. Himmelstoss, “High Efficiency DC-to-AC Power Inverter with Special DC Interface,” Automatika : časopis za automatiku, mjerenje, elektroniku, računarstvo i komunikacije, vol. 46, no. 3–4, pp. 143–148, Jan. 2006, Available: https://hrcak.srce.hr/4394.
- M. Safayatullah, M. T. Elrais, S. Ghosh, R. Rezaii, and I. Batarseh, “A Comprehensive Review of Power Converter Topologies and Control Methods for Electric Vehicle Fast Charging Applications,” IEEE Access, vol. 10, Apr. 2022. [CrossRef]
- J. Kurowicki, “2024 Chevy Silverado EV Is the New Champ of Our Fast-Charging Test, Second in Range,” Car and Driver, Jun. 21, 2024. https://www.caranddriver.com/news/a61207618/2024-chevy-silverado-ev-charging-range-acceleration-test/.
- P. Holderith, “Here’s An Exceedingly Nerdy Explanation of GM’s Ultium Battery System,” Motor1.com, Apr. 26, 2024. https://www.motor1.com/features/717675/gm-ultium-battery-deep-dive/.
- J. Dow, “First seen Cybertruck charging curve disappoints, but is that the whole story?,” Electrek, Dec. 31, 2023. https://electrek.co/2023/12/31/first-seen-cybertruck-charging-curve-disappoints-but-is-that-the-whole-story/.
- Delta Electronics (Netherlands) BV, “DC Charger / UFC 500,” Delta Electronics. https://filecenter.deltaww.com/Products/download/21/2101/Catalogue/EVCS_Ultra%20Fast%20Charger%20UFC500_Leaflet_EU_20240305.pdf.
- Tesla, “North American Charging Standard,” Tesla, 2022. https://tesla-cdn.thron.com/static/HXVNIC_North_American_Charging_Standard_Technical_Specification_TS-0023666_HFTPKZ.pdf?xseo=&response-content-disposition=inline%3Bfilename%3D%22North-American-Charging-Standard-Technical-Specification-TS-0023666.pdf%22.
- J. Dhilipan, N. Vijayalakshmi, D. B. Shanmugam, R. Jai Ganesh, S. Kodeeswaran, and S. Muralidharan, “Performance and efficiency of different types of solar cell material – A review,” Materials Today: Proceedings, vol. 66, no. 3, pp. 1295–1302, 2022. [CrossRef]
- National Renewable Energy Laboratory, “Global Horizontal Solar Irradiance,” NREL, 2018. https://www.nrel.gov/gis/assets/images/nsrdb-v3-ghi-2018-01.
- J. L. Kafka and M. A. Miller, “A climatology of solar irradiance and its controls across the United States: Implications for solar panel orientation,” Renewable Energy, vol. 135, pp. 897–907, May 2019. [CrossRef]
- V. Ramasamy et al., “U.S. Solar Photovoltaic System and Energy Storage Cost benchmarks, with Minimum Sustainable Price analysis: Q1 2022,” National Renewable Energy Laboratory, Sep. 2022. Available: https://www.nrel.gov/docs/fy22osti/83586.pdf.
- Porsche, “Up to 678 km without a charging stop,” Porsche Newsroom. https://newsroom.porsche.com/en/press-kits/taycan/Die-Reichweite-und-das-Laden.html.
- Audi, “Audi e-tron GT DC Converter,” Audi Parts USA. https://parts.audiusa.com/p/Audi__e-tron-GT/DC-CONVERTER-TRANSFORM/109142843/9J1959663BG.html?clickSource=relatedProduct.
- MDS Power, “VTC1550-12 VTC1550 DC/DC Converter 100-400VDC to 12VDC 100A,” MDS Power. https://www.mdspower.com/vtc1550-dc-dc-converter-100-400vdc-to-12vdc-110a-vtc1550-12.
- Phoenix Contact, “DC charging cable,” Phoenix Contact. https://www.phoenixcontact.com/en-us/products/dc-charging-cable-ev-t1g2cc-dc80a-70m6asbk11-1236563?type=pdf.
- Y. A. El Idrissi, “How Much Do Solar Panels Weigh? A Complete Guide To Solar Panels Weight | RenewableWise,” Renewable Wise, Oct. 31, 2021. https://www.renewablewise.com/how-much-do-solar-panels-weigh/.
- Battery Finds, “3.2V 150Ah LiFePO4 Prismatic Battery CATL Cells,” Battery Finds. https://batteryfinds.com/product/catl-150ah-lifepo4-battery-cells/.
- Norstar Company, “How Much Does a Truck Trailer Cost?,” Norstar, Jul. 07, 2023. https://norstarcompany.com/blog/how-much-does-a-truck-trailer-cost/.
- E. A. Sanchez, “Charger Beware: The Byzantine, Inconsistent Terms of EV Charging,” The Watt Car, May 30, 2024. https://www.thewattcar.com/home/charger-beware-the-byzantine-inconsistent-terms-of-ev-charging.
- T. Gamage, G. Tal, and A. T. Jenn, “The costs and challenges of installing corridor DC Fast Chargers in California,” Case Studies on Transport Policy, vol. 11, p. 100969, Mar. 2023. [CrossRef]
- Mouser Electronics, “500A Liquid Cooled Charging Cables,” Mouser Electronics. https://www.mouser.com/c/?marcom=185939334.
Figure 1.
PlugShare map showing available public DCFCs (orange pins) in and around Phoenix, AZ (bottom right) and Las Vegas, NV (top left). Note the lack of chargers along US Highways 60 and 93 (green) and Interstate 40 (red).
Figure 1.
PlugShare map showing available public DCFCs (orange pins) in and around Phoenix, AZ (bottom right) and Las Vegas, NV (top left). Note the lack of chargers along US Highways 60 and 93 (green) and Interstate 40 (red).
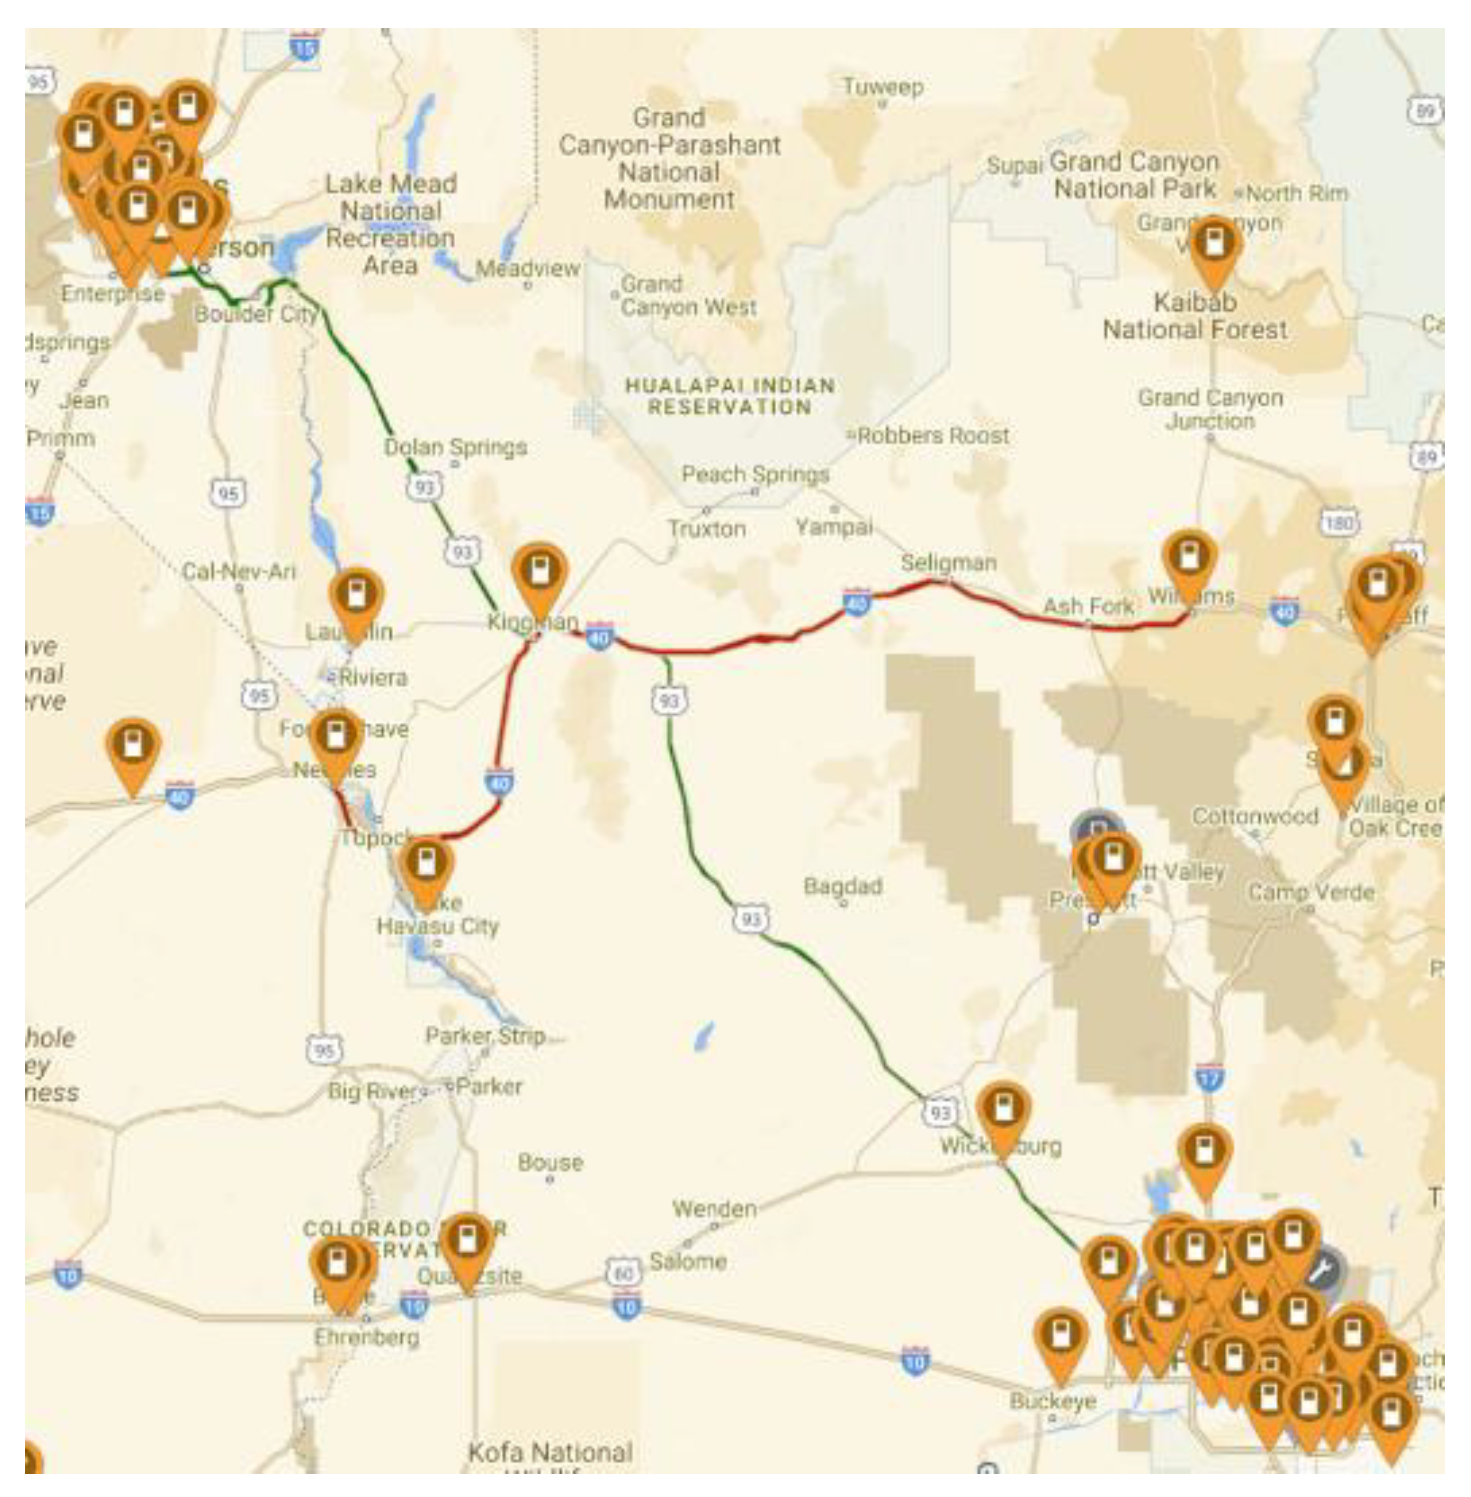
Figure 2.
Artist’s rendering of the charge trailer highlighting a 10-stall design with the solar canopy. The final design would target 6 stalls.
Figure 2.
Artist’s rendering of the charge trailer highlighting a 10-stall design with the solar canopy. The final design would target 6 stalls.
Disclaimer/Publisher’s Note: The statements, opinions and data contained in all publications are solely those of the individual author(s) and contributor(s) and not of MDPI and/or the editor(s). MDPI and/or the editor(s) disclaim responsibility for any injury to people or property resulting from any ideas, methods, instructions or products referred to in the content. |
© 2025 by the authors. Licensee MDPI, Basel, Switzerland. This article is an open access article distributed under the terms and conditions of the Creative Commons Attribution (CC BY) license (http://creativecommons.org/licenses/by/4.0/).
Copyright: This open access article is published under a Creative Commons CC BY 4.0 license, which permit the free download, distribution, and reuse, provided that the author and preprint are cited in any reuse.


