
Submitted:
02 September 2024
Posted:
04 September 2024
You are already at the latest version
Abstract
In this work, we develop a detailed analysis of the current panorama for electric vehicle charging technology, focusing on the various levels and types of charging protocols and used connectors. We propose a charging station for electric cars powered by solar photovoltaic energy, performing the analysis of the solar resource in the selected location, sizing the photovoltaic power plant to cover the demand completely, and exploring different configurations such as grid connection or physical and virtual electric energy storage. Despite the current development applying for specific working conditions, operating voltage, charging rate, power demand, etc., the proposed configuration is modular, adaptable, and resilient. The simulated system operates within the 360 V to 800 V range of continuous current for charging the electric vehicles, with a selectable power range between 20 and 180 kW. The basic layout includes four charging poles, each servicing all working voltages. An oversized PV plant powers the charging station at any time of the year, saving money compared to the alternative of the electric storage unit. In addition, we build simulation tools and algorithms that optimize the design of future projects, providing a solid basis for sustainable energy infrastructure planning and design.
Keywords:
Electric vehicle
; Charging station
; Technology
; Modular design
; PV power plant
; Simulation
; Sizing
Introduction
Today, the continuous growth of carbon emissions, which are responsible for climatic change, requires a transitional process to power sources more respectful of the environment. Among the feasible solutions to implement this process, renewable energy sources are a priority for politicians, technicians, energy developers, and citizens.
The global GHG emissions to the atmosphere come from the industrial, commercial, residential, and transportation sectors; this last one contributes 30% of the total emissions, representing a significant fraction [1,2]. The implementation of electric vehicles represents a positive action in the process of reducing greenhouse gas emissions [3,4,5].
People opposing the transformation of the vehicle fleet from fossil fuel engines to electric motors argue that the required electricity to charge the electric vehicle battery comes from fossil fuel power plants, generating carbon emissions in the energy generation process [6,7,8]. Therefore, it is necessary to power the electric vehicle charging stations from energy plants powered by renewable energies like photovoltaic plants, wind farms, geothermal and hydroelectric power plants, etc. [9,10,11,12]
The atmosphere's increased pollution level is a relevant problem in cities where the concentration of particles harmful to health is higher due to the high vehicle density. Local authorities apply measurements to reduce these particle emissions by promoting and implementing laws, norms, and regulations to favor electric vehicle use and penalizing conventional fossil fuel engine cars [13,14,15].
The European Union leads the transportation sector electrification process, elaborating a protocol about the infrastructure of alternative fuels, which specifically includes the following action (sic) [16]:
“Starting in 2025, fast electric vehicle charging stations, with a minimum power of 150 kW for light vehicles and small vans, should be implemented every 60 km in the main European Union traffic corridors; the so-called Trans-European Transportation Network (RTE-T)”.
“The charging stations for heavy vehicles, with a minimum charging power of 350 kW, should also be implemented every 60 km in the basic RTE-T network and every 100 km in the enlarged global RTE-T network, should be completed by 2030”.
The European directive looks to solve the problem of low number of charging stations in some countries that are far away from completing the directions included in the protocol; one of the most relevant cases is Spain, the fourth economy of the European Union with only thirty thousand charging stations in the national transportation network, far below the European Union average. To make matters worse, more than 25% of the charging stations are out of order, aggravating the problem of vehicle fleet electrification [17]. The Spanish case is not the only one in the European Union territory, as we show in Figure 1. We notice that some other countries suffer from the same low density of electric vehicle charging stations [18].
Readers can notice the difference between Norway (highest level) and Romania (lowest level), with a factor of 30 in the charging point density. On the other hand, countries in the high-density range, Norway, Iceland, Denmark, and Sweden, only represent 0.65% of the global charging points in the European Union since the population density in these countries is very low, reinforcing the need to implement a dense electric vehicle charging station network to compete with fossil fuel engine cars.
Another issue for consideration is the high number of low charging rate points, 83%, with a maximum output power of 22 kW, representing a one-hour charging for a driving range of 100 km (60 miles) in a standard electric vehicle, what discourages the drivers of using electric cars in long way trips [19].
Despite the many obstacles to implementing electric vehicles in modern society, the number of cars powered by electricity is continuously growing, as shown in Figure 2. This situation generates a conflict because the charging stations do not grow at the same rate as electric vehicle sales.
Charging Point
An electric vehicle charging point characterizes by the charging rate, the charging mode and the charging connector. The charging rate is regulated by the norms SAE J1772 [21,22] and IEC 61851-1 [23]; the first includes three types of rate and the second four types. Table 1 shows the specifications of the different charging rates depending on the power supply.
Charging Rate
Level 1 corresponds to a domestic power socket with a maximum power supply of 2 kW. Level 2 requires a specific power socket for electric vehicle charging with a maximum power supply of 19.2 kW. These two levels operate in alternate monophasic current. Level 3 corresponds to a fast charging rate and operates only in triphasic alternate current up to 350 kW power supply. The level 3 charging points are in road or street public charging stations. Extreme Fast Charging, or ultra-fast charging, is an extension of the fast charging rate for power supply above 350 kW; this type of charging point is scarce.
Charging Mode
The IEC defines four operational modes for electric vehicle charging depending on the specifications and configuration: alternate or continuous current, maximum charging current, voltage, power, and connection type.
In levels 1 to 3, the charging mode uses alternate current (AC), monophasic for levels 1 and 2, and triphasic for level 3, as mentioned before. The operating voltage ranges from 220 V for level 1 to 480 V for level 3. Levels 2 and 3 also operate with intermediate voltages of 360 and 400 V. Power supply is 7.6, 15.3, and 120 kW for levels 1, 2, and 3, respectively. In the XFC mode, the current ranges up to 400 ADC (continuous current), and the voltage operates between 600 and 1000 VDC.
Figure 3 shows the various types of charging modes.
Charging Socket
Level 1 does not require a specific socket for charging the electric vehicle; the charging point can use a domestic one; nevertheless, levels 2 and 3, and the XFC mode, require a specific socket of the type shown in Figure 4 and Figure 5.
DC socket type allows higher charging voltage and current, operating at power supply up to 350-400 kW. This configuration reduces the charging time for a 100 km driving range in a standard electric vehicle from 1 hour in AC mode to 15 minutes in DC mode.
Solar Power Supply
A sustainable charging station for electric vehicles should collect energy from renewable power sources like photovoltaic, wind, geothermal, hydroelectric, and others. Since analyzing every renewable power plant is out of focus in this work, we prioritize photovoltaic power plants as the primary energy source for powering the charging station prototype.
Photovoltaic power plant location is selected from the solar radiation database provided by the Geographical Information System (GIS) from the European Commission Service for Photovoltaic Systems (PVGIS) [26]. The selection criteria are based on maximizing the monthly average solar radiation on site; following this criteria, the photovoltaic array is oriented to the Equator and tilted 35º. Figure 6 shows the monthly solar radiation distribution in the selected location.
Considering a uniform behavior over time, we calculate the daily average solar radiation, obtaining (Table 2):
Because solar radiation changes every day, we apply the estimated daily average value for the calculations.
Energy Demand
The energy demand depends on the number of charging points, the maximum power supply at every charging point, the daily operating time, and the daily occupancy factor. Considering a charging pole with four charging points, one per power supply, a 14 hours daily operating time, and a 75% occupancy factor, the daily energy demand is (Table 3):
Photovoltaic Array Design
The photovoltaic array consists of a set of PV panels grouped in series and parallel to generate the required voltage and current. We select a panel of 460 W with 21% efficiency. Figure 7 shows the PV panel’s electric response.
Technical characteristics for the PV panel are provided by the manufacturer (Table 4).
Because the temperature evolves daily, we have retrieved data from the National Meteorological Service (AEMET) for the selected location [29]; therefore, we can estimate the temperature correction for the operational PV panel voltage and current. The maximum and minimum temperatures over the year are listed below.
- Minimum average monthly temperature: -1.0º C (January)
- Maximum average monthly temperature: 33.5º C (July)
- Maximum yearly absolute temperature: 43.5º C (August, 10th)
- Minimum yearly absolute temperature: -12.5º C (January, 12th)
Applying the following equation, we determine the PV panel operating temperature [30]:
T is the operating temperature, with subscripts cell and amb accounting for PV cell and ambient, NOCT is the Normal Operating Cell Temperature, referred to as the standard temperature of 25º C, and G is the solar radiation level.
According to equation 1, and applying values for maximum and minimum temperatures, the operating PV panel temperature is (Table 5)
Since the working temperature modifies the output voltage and current, we should apply the correction factor for these two parameters to obtain the operational values for the working temperature. The new values for the voltage and current derive from the expressions [30]:
V and I are the PV panel voltage and current, and coefficients α and β are the temperature correction factors for voltage and current. Subscripts M and cell account for maximum power point and PV cell, and superscripts STD, min, and max correspond to standard working conditions and minimum and maximum cell temperature.
Using data from Table 6, we can determine the PV array energy generation by applying the expression:
PPV is the PV panel’s peak power, sph is the sun’s peak hours, and ηT is the global efficiency including electric and thermal losses.
The global efficiency in a standard PV array is about 80% (ηT=0.8) [31].
The PV array configuration depends on the charging station operating voltage. Because the electric vehicle manufacturers disagree on a common voltage, we decided to operate with a standard 400 V for the PV array and line transmission and convert this voltage into the required one at the charging point, depending on the pole configuration.
Combining the output voltage for a single panel with the global 400 V voltage for the power supply to the charging station, the number of serial PV panels is:
If we round the result from equation 5, the effective number is 9.
Repeating the process for the current, considering the maximum power supply required by the charging station (Table 3), the number of parallel strings is:
If we round the result from equation 5, the effective number is 87.
Therefore, the PV array configuration results in a set of 87 parallel strings of 9 panels in series for a total of 783 panels, which generate a global output power of 347.65 kW, 0.5% above the required value.
The above calculation is valid for a single pole with four charging points of power supply, as shown in Table 3; if the charging station includes multiple charging poles, we should resize the system according to the number of poles. In the next section, we develop the case of numerous charging poles in a charging station.
Charging Station Layout Engineering
The charging station layout engineering is based on a modular functioning that can be replicated and enlarged depending on current requirements. As we have mentioned before, the basic unit is a charging pole with four sockets, one per power supply; this configuration permits the charging of four electric vehicles simultaneously, provided the charging power requirements are different for each one, slow (22 kW), medium (48 kW), fast (96 kW), and extra fast (180 kW) charging rate. The supply voltage range is 360 to 800 V. Table 7 summarizes the main characteristics of the charging station layout.
The charging station operates at direct current (DC) since it allows higher charging rate than alternate current.
The basic design of the charging station includes four charging poles with four sockets for each pole. Figure 8 shows the voltage supply for each pole and socket.
We observe that one charging pole is exclusively dedicated to a voltage supply of 360 V (first from the left) and another to 400 V (second from the left) because these are the most common electric vehicle motor voltages in the vehicle fleet. The other two charging poles combine a voltage supply from 400 V to 800 V due to the lower number of electric vehicles with 480 and 800 V electric motors.
Since the electric transmission line operates at 135 kV alternate current, the engineering requires a multiple voltage conversion; to do so, we use a first voltage conversion from 135 kV to 10 kV and a second conversion from 10 kV to 400 V. These two conversions are in alternate current. The reason for converting high to low voltage in two steps is to reduce energy losses since a drastic voltage reduction increases energy losses in the voltage converter. A higher number of voltage conversions in more than two steps would require multiple voltage converters, meaning higher investment and maintenance costs. Therefore, the two-step voltage conversion optimizes the energy losses to investment ratio. Figure 9 shows the voltage conversion layouts engineering.
According to the previous statement of reducing the transmission line voltage conversion in two steps, the electric engineering operates with a reference voltage. We evaluate to operate at 360, 400, 480 or 800 V as reference voltage, analyzing the energy losses derived from the initial conversion from 10 kV to the selected voltage, and from this value to the required ones at the pole sockets. The analysis concludes that the optimum reference value is 400 V.
Once the voltage lowers to 400 VAC, we convert it into direct current using specific rectifiers depending on the voltage supply; therefore, the electric circuit engineering requires four types of voltage rectifiers: 400 VAC to 360 VDC, 400 VAC to 400 VDC, 400 VAC to 480 VDC, and 400 VAC to 800 VDC. We decided to duplicate every type of rectifier to avoid unexpected service stops in case of failure.
PV Power Plant Layout Engineering
Based on data for a single charging pole, shown in the Energy demand section, and considering the charging station layout from Figure 9, the prototype requires a global power of 1776 kW, corresponding to four charging poles of 444 kW each. On the other hand, if we transport this power at the 400 VDC corresponding to the PV array output voltage, as described in a previous section, the energy losses are enormous; indeed, for every kilometer of transmission line from the PV power plant to the charging station, operating under these values, we have the following power losses:
Nevertheless, if we operate at high voltage, 135 kV, the power losses reduce to:
The new value represents a negligible power loss amount.
Since the basic PV array layout produces 347.65 kW, we need to replicate this basic configuration to reach the global power; therefore, the number of PV array blocks in the PV power plant matrix is:
Because of the fractional number, two options arise for the PV power plant configuration; the first is to install five blocks with the same characteristics as for the PV array and a smaller PV array to complete the fractional number or to design five identical PV array blocks incrementing the number of PV panels in each block regarding the original configuration.
Since the voltage conversion from 400 VDC to 135 kV alternate current is too high, we decided to group every two serial strings in pairs, doubling the string output voltage, reducing the voltage conversion factor, and lowering the energy losses at the DC/AC converter.
Table 8 summarizes the PV power plant characteristics of the two options.
Configuration B uses more PV panels, 4140 versus 3969 for configuration A, but its design is less complex since it uses the same structure for every block. On the other hand, configuration B generates 1837.5 kW versus 1782.0 kW for the A-configuration, a 3% higher, representing a safety factor in case of increasing demand at the charging station. Therefore, we decide to adopt the B-configuration as the reference for our prototype.
The PV power plant uses an area of 3054 m2, corresponding to a rectangular space of 61.08 m x 50 m, as shown in Figure 10.
Figure 10 shows a simulated view of the PV power plant prototype layout; therefore, the number of parallel rows and serial strings do not correspond to current values.
The PV power plant uses four DC/AC converters model INGECON® SUN 330TL M12 from the INGETEAM company [32], for a total of 24 inputs and 12 MPPT units; however, due to design specifications, the converters only use 20 inputs and 10 MPPT units.
Every converter output connects to the voltage transformation station that elevates the voltage to 135 kV for the transmission line. The process develops in two steps; the first elevates the voltage from 800 VDC to 10 kV alternate current and the second from 10 to 135 kV AC. Figure 11 shows the schematic representation of the voltage transformation process.
Transmission Line to Charging Station Electric Engineering
Electric connection between the transmission line and the charging station depends on the power source, renewable energy plant, grid, or storage unit. Therefore, there may be an alternating current bus configuration, a direct current bus configuration, or a combination of both. We can see the AC and DC bus configurations in Figure 12 and Figure 13.
AC bus configuration is characterized by an AC/AC transformer that reduces the 135 kV from line transmission to 10 kV in the AC bus. The 10 kV alternate current is then converted into direct current at the reference voltage, 400 V, using an AC/DC converter; the process is replicated in three lines to service the final DC voltage supply sockets at 360, 480, and 800 volts.
DC bus configuration is characterized by an AC/AC transformer that reduces the 135 kV from the line transmission to 10 kV and an AC/DC converter, which reduces the 10 kV alternate current into 400 volts direct current at the DC bus. The 400 V is reduced to 360 V or elevated to 480 or 800 V using the corresponding DC/DC converter to service the final DC voltage supply sockets at 360, 480, and 800 volts.
Charging Station Wiring Design and Engineering
The voltage drop in the transmission lines is due to the Joule effect. We need to size the wires correctly to minimize the energy losses during transmission. The wire section derives from the expression [33,34,35]:
S is the wire section, I is the transported current, and ΔV is the voltage drop percentage.
Because the national legislation differs for every country, we selected a 1.5% voltage drop percentage, a current value admitted in many Western countries [36,37]. Since we operate with different power and voltage supply values, we size the wire section according to every configuration. Considering a 5 m length for every power supply hose, the wire sizing is (Table 9):
Simulation
We run a simulation process based on the engineering design to validate the proposed prototype. The simulation uses data from previous development and focuses on determining the feasibility of the system and its autonomy.
The first simulation step evaluates the solar energy coverage factor, defined as the ratio between the photovoltaic power generation and energy demand. Considering the data from the designed PV power plant and the charging station, calculated in previous sections, we obtain the following results (Figure 14):
The proposed PV power plant produces a solar photovoltaic energy coverage factor above 100% for the entire year except in December, where the coverage factor barely reaches 88%. The coverage factor in January was 99%, near the required 100% to ensure the functioning of the charging station. On the other hand, the energy excess generated from February to November can be stored in electric batteries and used in January and December to warranty the complete energy coverage from the PV power plant. The power supply is guaranteed because the coverage factor exceeds the 100% coverage factor in various months of the year.
We also run a daily energy coverage to verify the system feasibility; to do so, we evaluate the daily hourly evolution for the characteristic day of every month. We only show the results for the lowest and highest energy coverage moths to validate the simulation process (Figure 15).
Horizontal line in Figure 15 represents the charging station energy demand, which is considered constant. Bars represent the photovoltaic power supply. It is clear that solar photovoltaic power does not cover the energy demand from sunset to sunrise (night hours); nevertheless, this is the period of lowest activity at the charging station matching with the time the charging station requires low or none energy because of the few charging sockets used. On the other hand, the excess of power generation in the central day hours, from 10 to 16 in the poorest month (left side), and from 9 to 17 in the best month (right side) compensates for the lack or absence of photovoltaic power supply.
Energy Compensation
Based on statistical data from many countries, the occupancy of charging poles in an electric vehicle charging station follows human activity, which reduces drastically at night hours (Figure 16) [38,39,40,41]. Therefore, the lack or absence of solar photovoltaic power is minimized and compensated by the excess in daily central hours.
Combining the maximum power demand and the occupancy factor, the daily energy demand distribution in the charging station yields (Figure 17):
The bars in Figure 17 represent the PV power supply (orange), the charging station energy demand (blue), and the energy balance (green). We observe that some green bars are negative, indicating a lack of power supply from the PV power plant during these hours; nevertheless, the cumulative negative energy balance is partially or compensated by the hours when the PV power supply exceeds the energy demand from the charging station.
We analyzed the daily energy balance compensation for every month, and we found that only in January and December monthly energy balance results negative; however, if we extend the energy balance compensation throughout the year, the result becomes positive, indicating the system is energetically feasible provided we implement a storage unit to compensate negative and positive monthly energy balance.
Energy Storage Engineering Design and Sizing
We have only two months with negative energy balance, December and January; therefore, we determine the cumulative energy balance for these two months. Because the two months are consecutive, the storage unit energy capacity should match the cumulative energy balance.
Using data from the simulation, the cumulative energy balance for the two months is -952.7 kWh. The battery capacity is given by [42]:
Cn, Vbat , and ξ are the battery nominal capacity, operating voltage and energy capacity, respectively.
Considering the battery operates at the reference voltage for the system, 400 V, the nominal capacity is:
This capacity corresponds to a discharge current of 119 A, matching a discharge rate at 20 hours.
Battery capacity, however, depends on the discharge rate according to the expression [43]:
Cr is the current battery capacity for a given discharge rate, and fC is the capacity correction factor, which is expressed as:
Pt is the power demand and b is a coefficient that depends on the type of battery. For lithium-ion batteries, b=0.0148, and for lead-acid ones, b=0.1701 [44]
Retrieving data from the simulation for the maximum negative power demand:
Therefore, the corrected battery capacity for the storage unit is:
The lead-acid battery capacity is 37% higher; however, the lithium-ion battery costs 40% more, compensating for it. We, therefore, base the selection on maintenance and replacement costs, where lithium-ion batteries are cheaper; our selection is a lithium-ion battery block of 2500 Ah at 400 V.
No single cell fulfills the mentioned capacity and voltage; therefore, we design the battery block by grouping lithium-ion cells in series and parallel to fit the required values. The commercial units may reach up to 22.1 kWh per battery block, grouping cells of 3 Ah and 4.2 volts per cell. The battery block configuration consists of 19 parallel strings of 95 cells for a total energy capacity of 22.7 kWh. The final battery layout consists of 16 blocks of 22.7 kWh coupled in parallel to reach the required energy capacity of 363.3 kWh for negative energy balance compensation.
Control Unit
The charging station operates automatically without on-site operator supervision. Users manipulate the charging socket following instructions specifically addressed to guide the users to recharge the electric vehicle according to their needs. The charging protocol appears on the charging pole screen, where the users may select the charging mode and the charging parameters like the driving range, charging time, charging rate, and operational voltage.
The charging process develops according to one of the following parameters to be selected by the user: charging time, specific driving range, or battery capacity percentage. If the parameter does not correspond to electric vehicle battery characteristics, the protocol shows an error and asks the user again to introduce a valid value for the selected parameter.
Once the user selects the parameter and introduces a valid value, the protocol asks the user to choose the charging power depending on the electric vehicle battery voltage (see Table 7). The protocol calculates the charging parameters depending on the charging rate and shows the relevant charging process parameter on the charging pole screen for the user’s information.
Figure 20 shows the protocol ruling the charging process.
Conclusions
Using renewable energy sources to supply electric vehicles makes this transport solution sustainable, resilient, and future-proof. The design proposed in this work covers current and future standards for electric cars, also making it possible to replicate it in different locations, increasing or decreasing the number of stations and the generator to meet demand based on the expected influx and the solar resource present at the location.
In places where solar resources are high and with great potential for use in electric vehicle charging infrastructures, this work demonstrates the feasibility of its use as an alternative to traditional energy sources, with CO2 emissions, which are increasingly falling into disuse.
The modular design allows for expansions, either in the number of stations or in the supply power, at a relatively low cost, making this installation especially attractive.
The independence from external sources, battery packs, or grid connection allows this type of installation to adapt to areas where access to the grid is complex, expensive, or impossible, as well as in areas where the power supply from the grid is subject to periodic failures or interruptions.
This independence also makes expansions of the installation economically feasible because they do not require the expansion of the supply network, which in many cases limits the installation or expansion of renewable energies. The greater complexity of systems connected to the grid with or without a storage unit makes them more prone to failure and requires higher maintenance.
For all the above reasons, electric vehicle charging stations powered by photovoltaic solar energy are a solution for the present and future, not requiring a grid connection to build an installation suitable for the present and future electric mobility standards.
References
- Albuquerque, F. D., Maraqa, M. A., Chowdhury, R., Mauga, T., & Alzard, M. (2020). Greenhouse gas emissions associated with road transport projects: current status, benchmarking, and assessment tools. Transportation Research Procedia, 48, 2018-2030. [CrossRef]
- Andrés, L., & Padilla, E. (2018). Driving factors of GHG emissions in the EU transport activity. Transport Policy, 61, 60-74. [CrossRef]
- Casals, L. C., Martinez-Laserna, E., García, B. A., & Nieto, N. (2016). Sustainability analysis of the electric vehicle use in Europe for CO2 emissions reduction. Journal of cleaner production, 127, 425-437. [CrossRef]
- Taljegard, M., Thorson, L., Odenberger, M., & Johnsson, F. (2020). Large-scale implementation of electric road systems: Associated costs and the impact on CO2 emissions. International Journal of Sustainable Transportation, 14(8), 606-619. [CrossRef]
- Sudjoko, C., Sasongko, N. A., Utami, I., & Maghfuri, A. (2021, November). Utilization of electric vehicles as an energy alternative to reduce carbon emissions. In IOP Conference Series: Earth and Environmental Science (Vol. 926, No. 1, p. 012094). IOP Publishing. [CrossRef]
- Li, P., Xia, X., & Guo, J. (2022). A review of the life cycle carbon footprint of electric vehicle batteries. Separation and Purification Technology, 296, 121389. [CrossRef]
- Xia, X., Li, P., Xia, Z., Wu, R., & Cheng, Y. (2022). Life cycle carbon footprint of electric vehicles in different countries: A review. Separation and Purification Technology, 301, 122063. [CrossRef]
- Muha, R., & Perosa, A. (2018). Energy consumption and carbon footprint of an electric vehicle and a vehicle with an internal combustion engine. Transport Problems, 13. [CrossRef]
- Reed, G. F., Grainger, B. M., Sparacino, A. R., Kerestes, R. J., & Korytowski, M. J. (2012, May). Advancements in medium voltage DC architecture development with applications for powering electric vehicle charging stations. In 2012 IEEE Energytech (pp. 1-8). IEEE.
- Danese, A., Torsæter, B. N., Sumper, A., & Garau, M. (2022). Planning of high-power charging stations for electric vehicles: A review. Applied Sciences, 12(7), 3214. [CrossRef]
- Singh, A., & Letha, S. S. (2019). Emerging energy sources for electric vehicle charging station. Environment, Development and Sustainability, 21, 2043-2082. [CrossRef]
- Eze, V. H. U., Eze, M. C., Ogbonna, C. C., Ugwu, S. A., Emeka, K., & Onyeke, C. A. (2021). Comprehensive Review of Recent Electric Vehicle Charging Stations. Global Journal of Scientific and Research Publications, 1(12), 16-23.
- Reche, C., Querol, X., Alastuey, A., Viana, M., Pey, J., Moreno, T., ... & Quincey, P. (2016). New considerations for PM, Black Carbon and particle number concentration for air quality monitoring across different European cities. In Air Quality (pp. 203-244). Apple Academic Press. [CrossRef]
- Molina, M. J., & Molina, L. T. (2004). Megacities and atmospheric pollution. Journal of the Air & Waste Management Association, 54(6), 644-680. [CrossRef]
- Colls, J., & Tiwary, A. (2017). Air pollution: measurement, modelling and mitigation. CRC Press.
- Dimosthenis Mammonas. Infrastructure for the alternative fuels: the Council adopts new regulations to increase charging stations and refueling in Europe. European Union Council, July, 25th 2023. https://www.consilium.europa.eu/es/press/press-releases/2023/07/25/alternative-fuels-infrastructure-council-adopts-new-law-for-more-recharging-and-refuelling-stations-across-europe/ [Accessed online: 02/09/2024].
- Inactive electric vehicle charging points in Spain as of the third quarter of 2023, by autonomous community. Transportation & Logistics. Vehicles & Road Traffic. Statista. https://www.statista.com/statistics/1446152/spain-inactive-ev-chargers-by-autonomous-community/ [Accessed online: 02/09/2024].
- Foley, A. M., Winning, I. J., & Gallachóir, B. Ó. Ó. (2010, September). State-of-the-art in electric vehicle charging infrastructure. In 2010 IEEE Vehicle Power and Propulsion Conference (pp. 1-6). IEEE. [CrossRef]
- ANFAC. https://anfac.com/categorias_publicaciones/informe-anual/ [Accessed online: 02/09/2024].
- IEA (2022), Global EV Outlook 2022, IEA, Paris https://www.iea.org/reports/global-ev-outlook-2022 [Accessed online: 02/09/2024].
- SAE J1772. SAE International (2017-10-13). "SAE Electric Vehicle and Plug in Hybrid Electric Vehicle Conductive Charge Coupler J1772_201710" (DOC). SAE International. Retrieved 2022-11-14.
- "Basics of SAE J1772". Open EVSE. Retrieved 2022-07-13.
- IEC 61851-1. Van Den Bossche, P. (2010). IEC 61851-1: Electric vehicle conductive charging system-Part 1: General requirements. In 2 (pp. 1-99). Iec.
- S. S. G. Acharige, M. E. (2023). S. S. G. Acharige, M. E. Haque, M. T. Arif, N. Hosseinzadeh, K.Review of Electric Vehicle Charging Technologies, Standards, Architectures, and Converter Configurations. IEEE Access, vol 11., 41218-41255. [CrossRef]
- EV Charging Connector Types: A Complete Guide. Electric Vehicle Energy Storage Company (EVESCO). https://www.power-sonic.com/blog/ev-charging-connector-types/ [Accessed online: 02/09/2024].
- PHOTOVOLTAIC GEOGRAPHICAL INFORMATION SYSTEM. PVGIS. European Commission (01/03/2022) https://re.jrc.ec.europa.eu/pvg_tools/es/ [Accessed online: 25/02/2024].
- García-Badell, J. J. (1982). Cálculo de la energía solar. (IGME, Ed.) https://books.google.es/books?hl=es&lr=&id=P_bLE_m-ik4C&oi=fnd&pg=PA7&dq=calculo+temperatura+operacion+celula+fotovoltaica&ots=d1bOUWXGU9&sig=sNXlLXsQY5jcWw4Lu4IAi2XsgmE#v=onepage&q=calculo%20temperatura%20operacion%20celula%20fotovoltaica&f=false [Accessed online: 26/04/2024].
- ATERSA. https://atersa.shop/app/uploads/2023/12/MU-M6M-6x20-M7-10BB-GS-ES-A-440-460W_460W-1.pdf [Accessed online: 18/08/2024].
- Meteorological State Agency. AEMET. https://www.aemet.es/es/serviciosclimaticos/datosclimatologicos/valoresclimatologicos [Accessed online: 29/08/2024].
- Luque, A., & Hegedus, S. (Eds.). (2011). Handbook of photovoltaic science and engineering. John Wiley & Sons.
- Luis Vilariño García, J. V. (2014). RENDIMIENTO GLOBAL DE SISTEMAS FOTOVOLTAICOS CONECTADOS A LA RED ELECTRICA. TECNOLOGI@ y DESARROLLO, XII, 20-24.
- INGECON® SUN 330TL M12. Ingeteam. Electrifying a Sustainable Future. https://www.ingeteam.com/es-es/sectores/energia-fotovoltaica/p15_24_727/330-350tl-m12.aspx [Accessed online: 01/09/2024].
- Blinov, I., Zaitsev, I. O., & Kuchanskyy, V. V. (2020). Problems, methods and means of monitoring power losses in overhead transmission lines. In Systems, Decision and Control in Energy I (pp. 123-136). Cham: Springer International Publishing.
- Harting, C. (2010). Ac transmission line losses. AC Transm. Line Losses, 24.
- Wang, H., Wang, L., Wang, Y., Xue, H., Yang, C., & Yan, T. (2012, May). The electric energy loss in overhead ground wires of 110kV six-circuit transmission line on the same tower. In IEEE PES Innovative Smart Grid Technologies (pp. 1-5). IEEE.
- How Much Power Loss in Transmission Lines. CHNT. Empower the World. https://chintglobal.com/blog/how-much-power-loss-in-transmission-lines/ [Accessed online: 02/09/2024].
- Jordan Wirfs-Brock. Lost In Transmission: How Much Electricity Disappears Between A Power Plant And Your Plug?. Inside Energy. IE. https://insideenergy.org/2015/11/06/lost-in-transmission-how-much-electricity-disappears-between-a-power-plant-and-your-plug/ [Accessed online: 02/09/2024].
- Trends in Electric Vehicle Charging. International Energy Agency (IEA). Global EV Outlook 2024. https://www.iea.org/reports/global-ev-outlook-2024/trends-in-electric-vehicle-charging [Accessed online: 02/09/2024].
- Ma, T. Y., & Faye, S. (2022). Multistep electric vehicle charging station occupancy prediction using hybrid LSTM neural networks. Energy, 244, 123217. [CrossRef]
- Ma, T. Y., & Faye, S. (2021). Multistep electric vehicle charging station occupancy prediction using mixed LSTM neural networks. arXiv preprint arXiv:2106.04986. arXiv:2106.04986.
- Lydia Douaidi, Sidi-Mohammed Senouci, Ines El Korbi, Fouzi Harrou. Predicting Electric Vehicle Charging Stations Occupancy: A Federated Deep Learning Framework. VTC2023-Spring, Jun 2023, Florence (IT), Italy. pp.1-5, ff10.1109/VTC2023-Spring57618.2023.10199832ff. ffhal-04286114v2f.
- Linden, D. (1995). Handbook of batteries. In Fuel and energy abstracts (Vol. 4, No. 36, p. 265).
- Armenta-Deu, C. (2003). Prediction of battery behaviour in SAPV applications. Renewable Energy, 28(11), 1671-1684. [CrossRef]
- Armenta-Deu, C., Carriquiry, J. P., & Guzman, S. (2019). Capacity correction factor for Li-ion batteries: Influence of the discharge rate. Journal of Energy Storage, 25, 100839. [CrossRef]
Figure 1.
Electric vehicle charging points density in the European Union (public access) (point’s number per million of habitants) [19].
Figure 1.
Electric vehicle charging points density in the European Union (public access) (point’s number per million of habitants) [19].
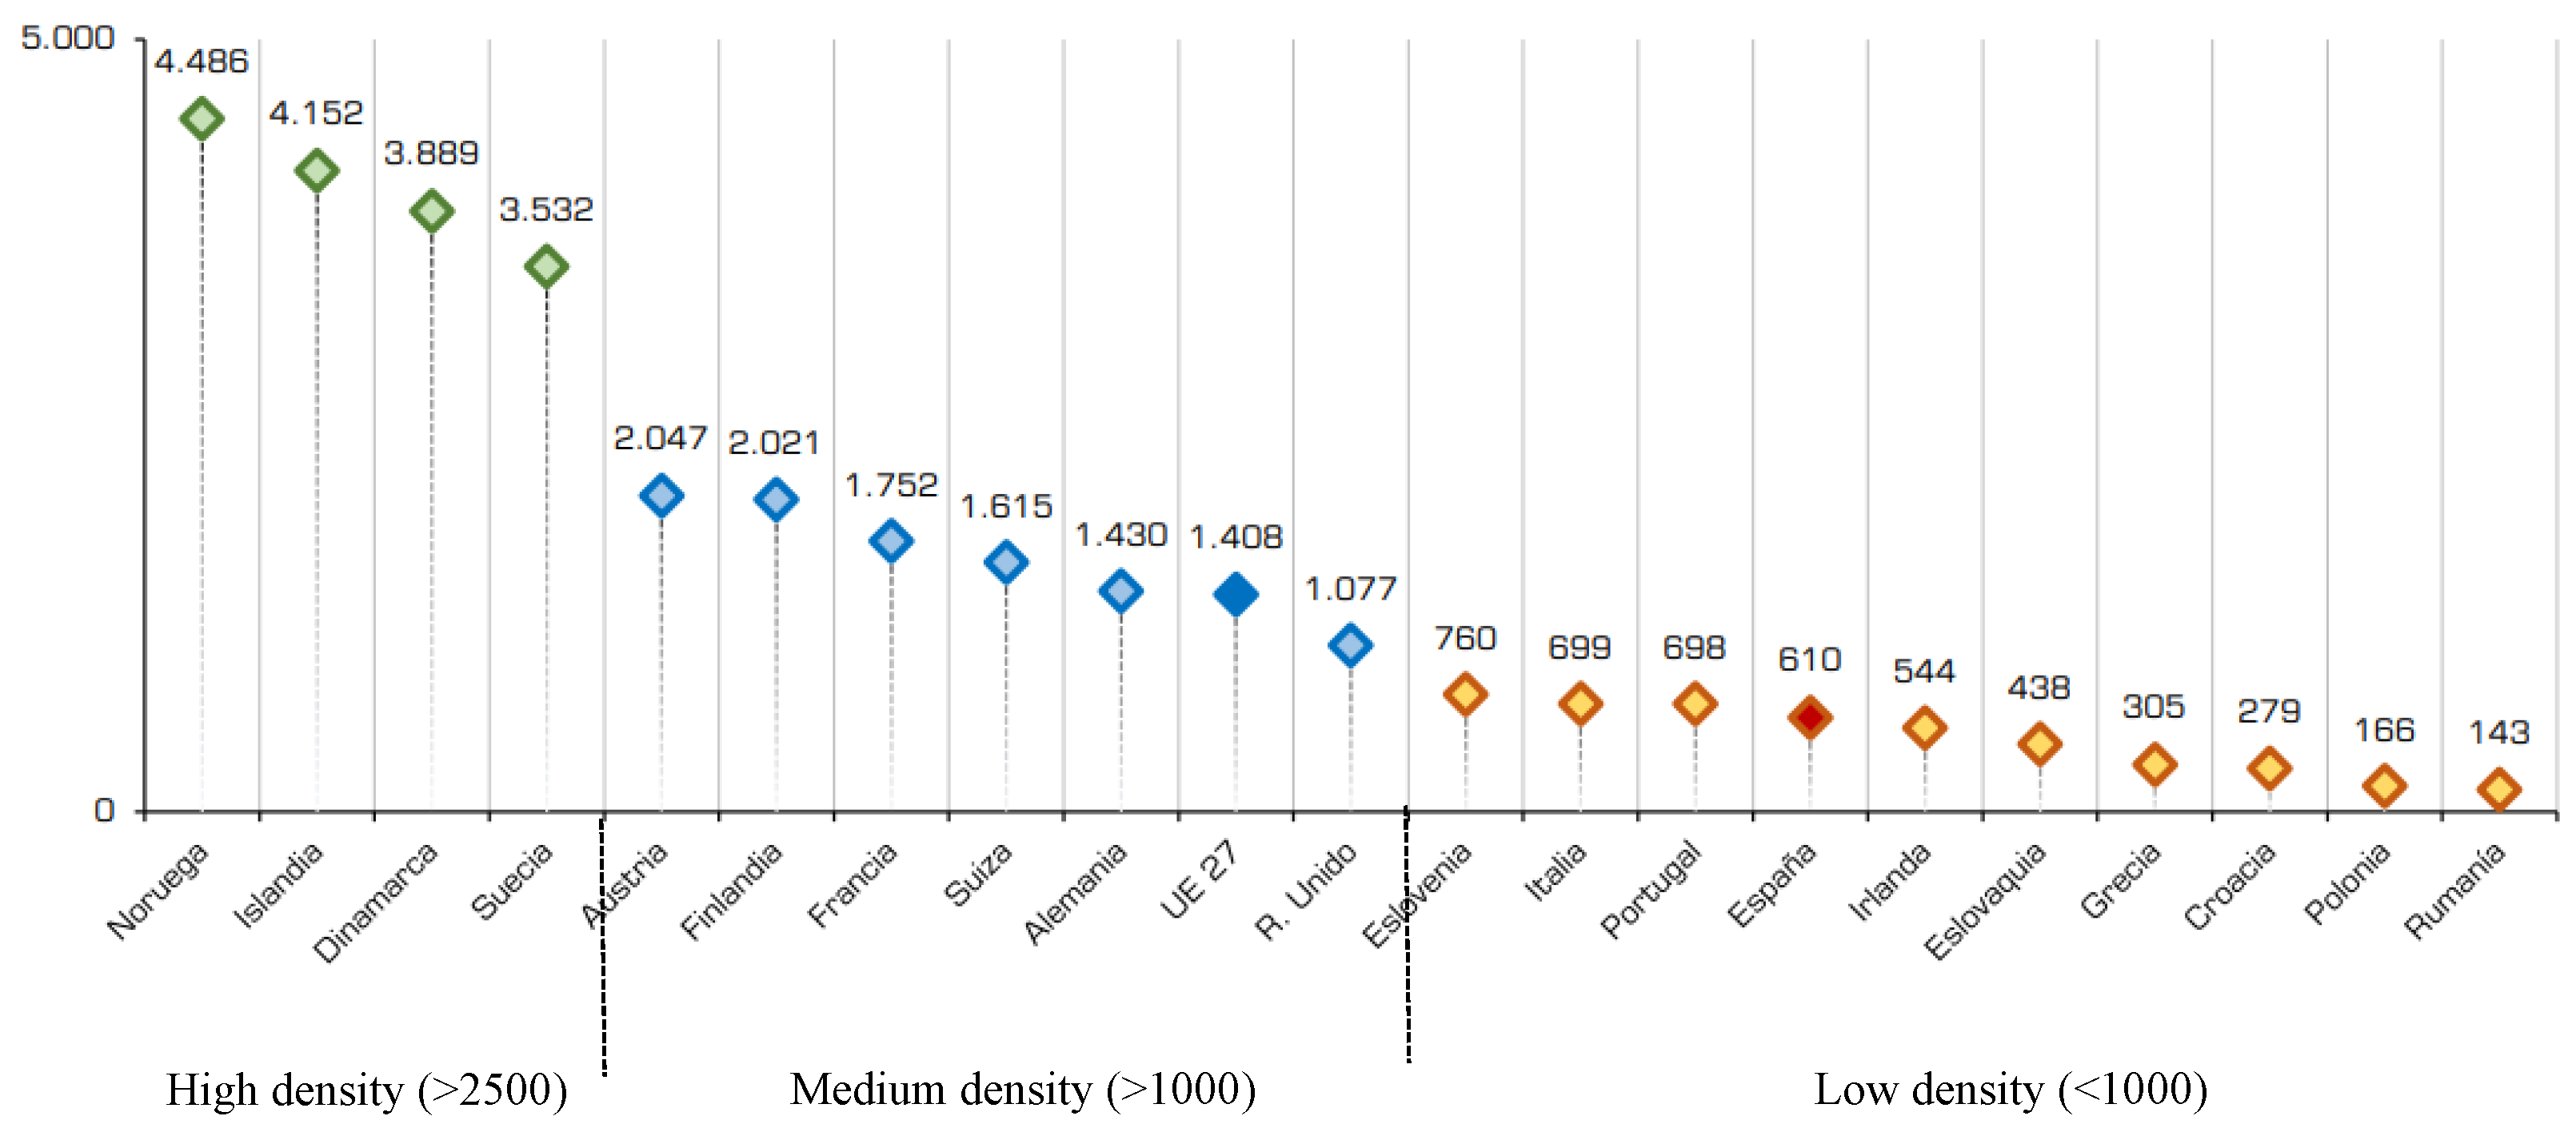
Figure 2.
Global Electric Car Stock (2012-2021) [20].
Figure 2.
Global Electric Car Stock (2012-2021) [20].
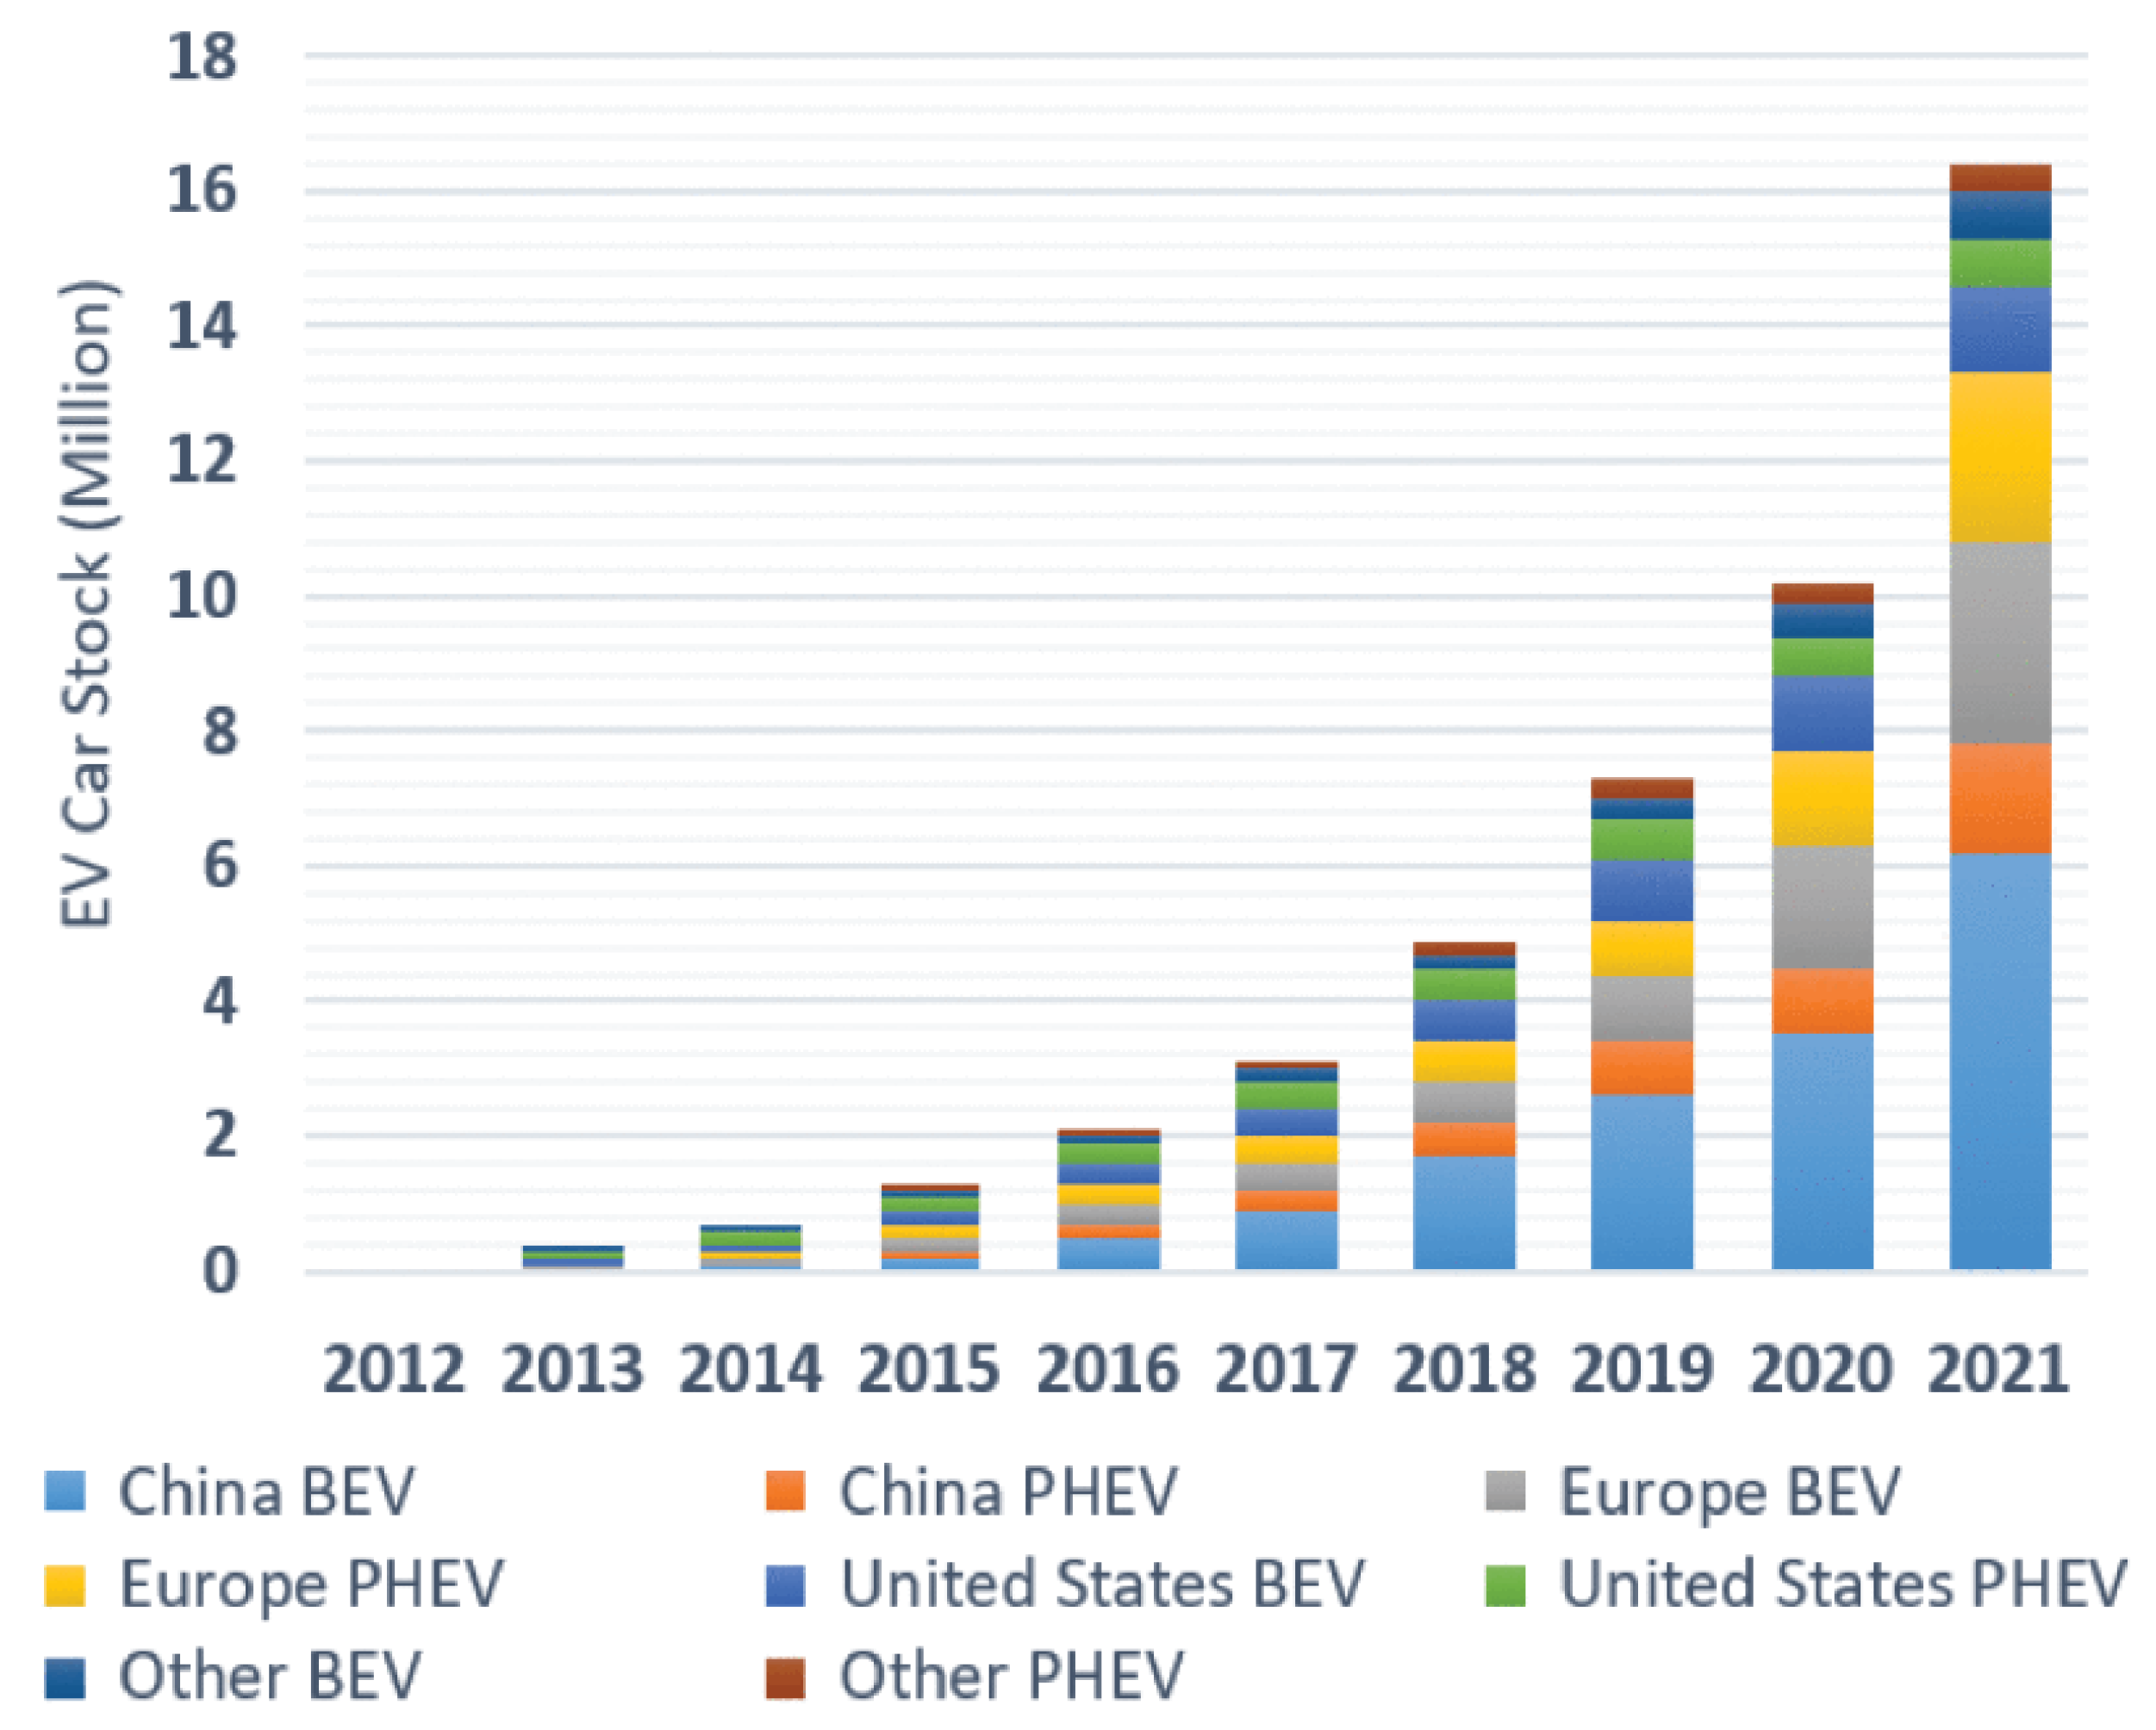
Figure 3.
Electric vehicle charging modes [24].
Figure 3.
Electric vehicle charging modes [24].
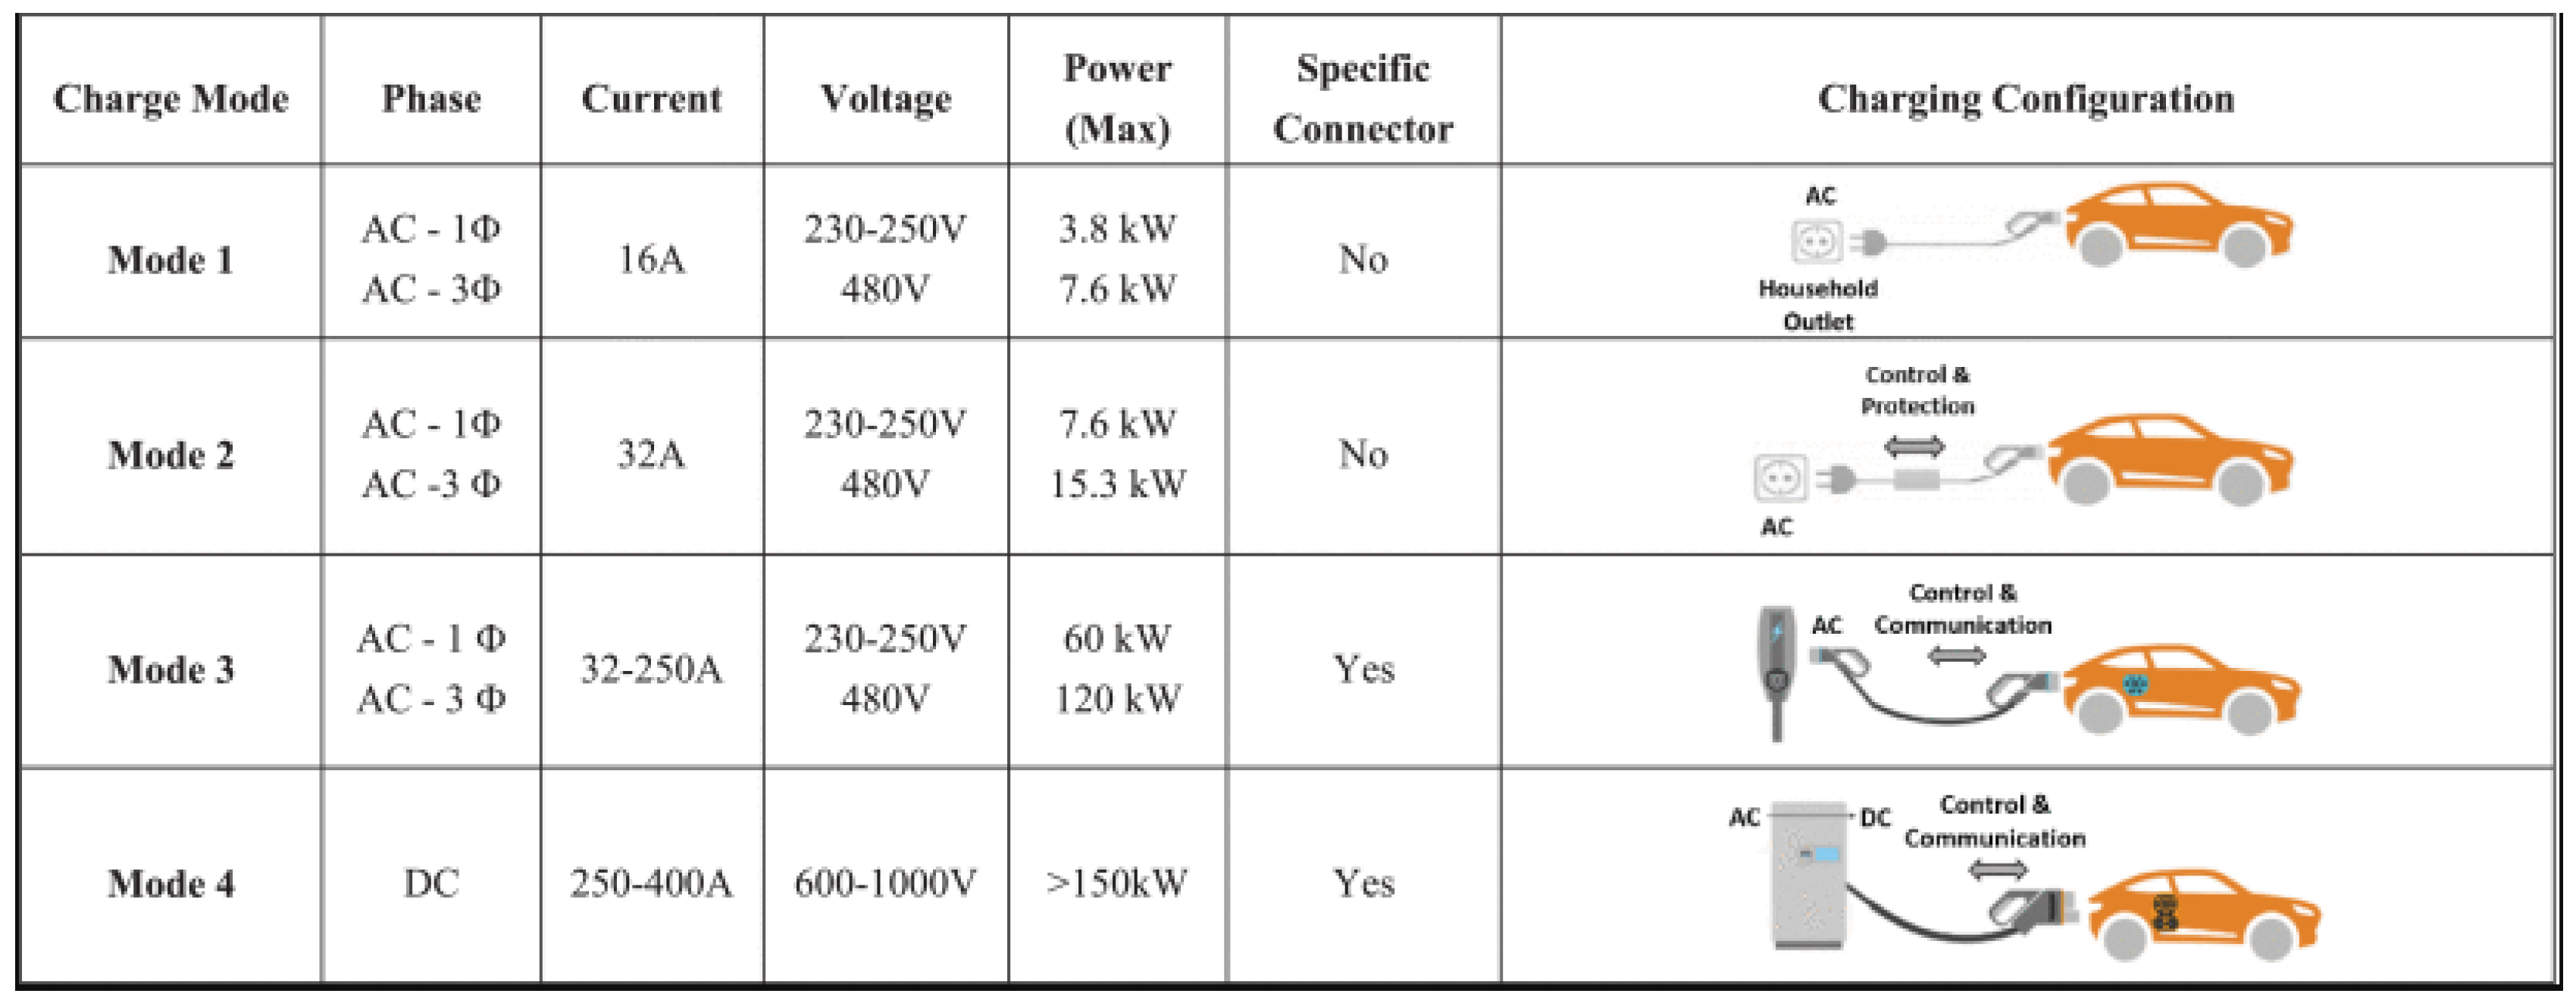
Figure 4.
Socket types for electric vehicle charging in alternate current (AC) [25].
Figure 4.
Socket types for electric vehicle charging in alternate current (AC) [25].
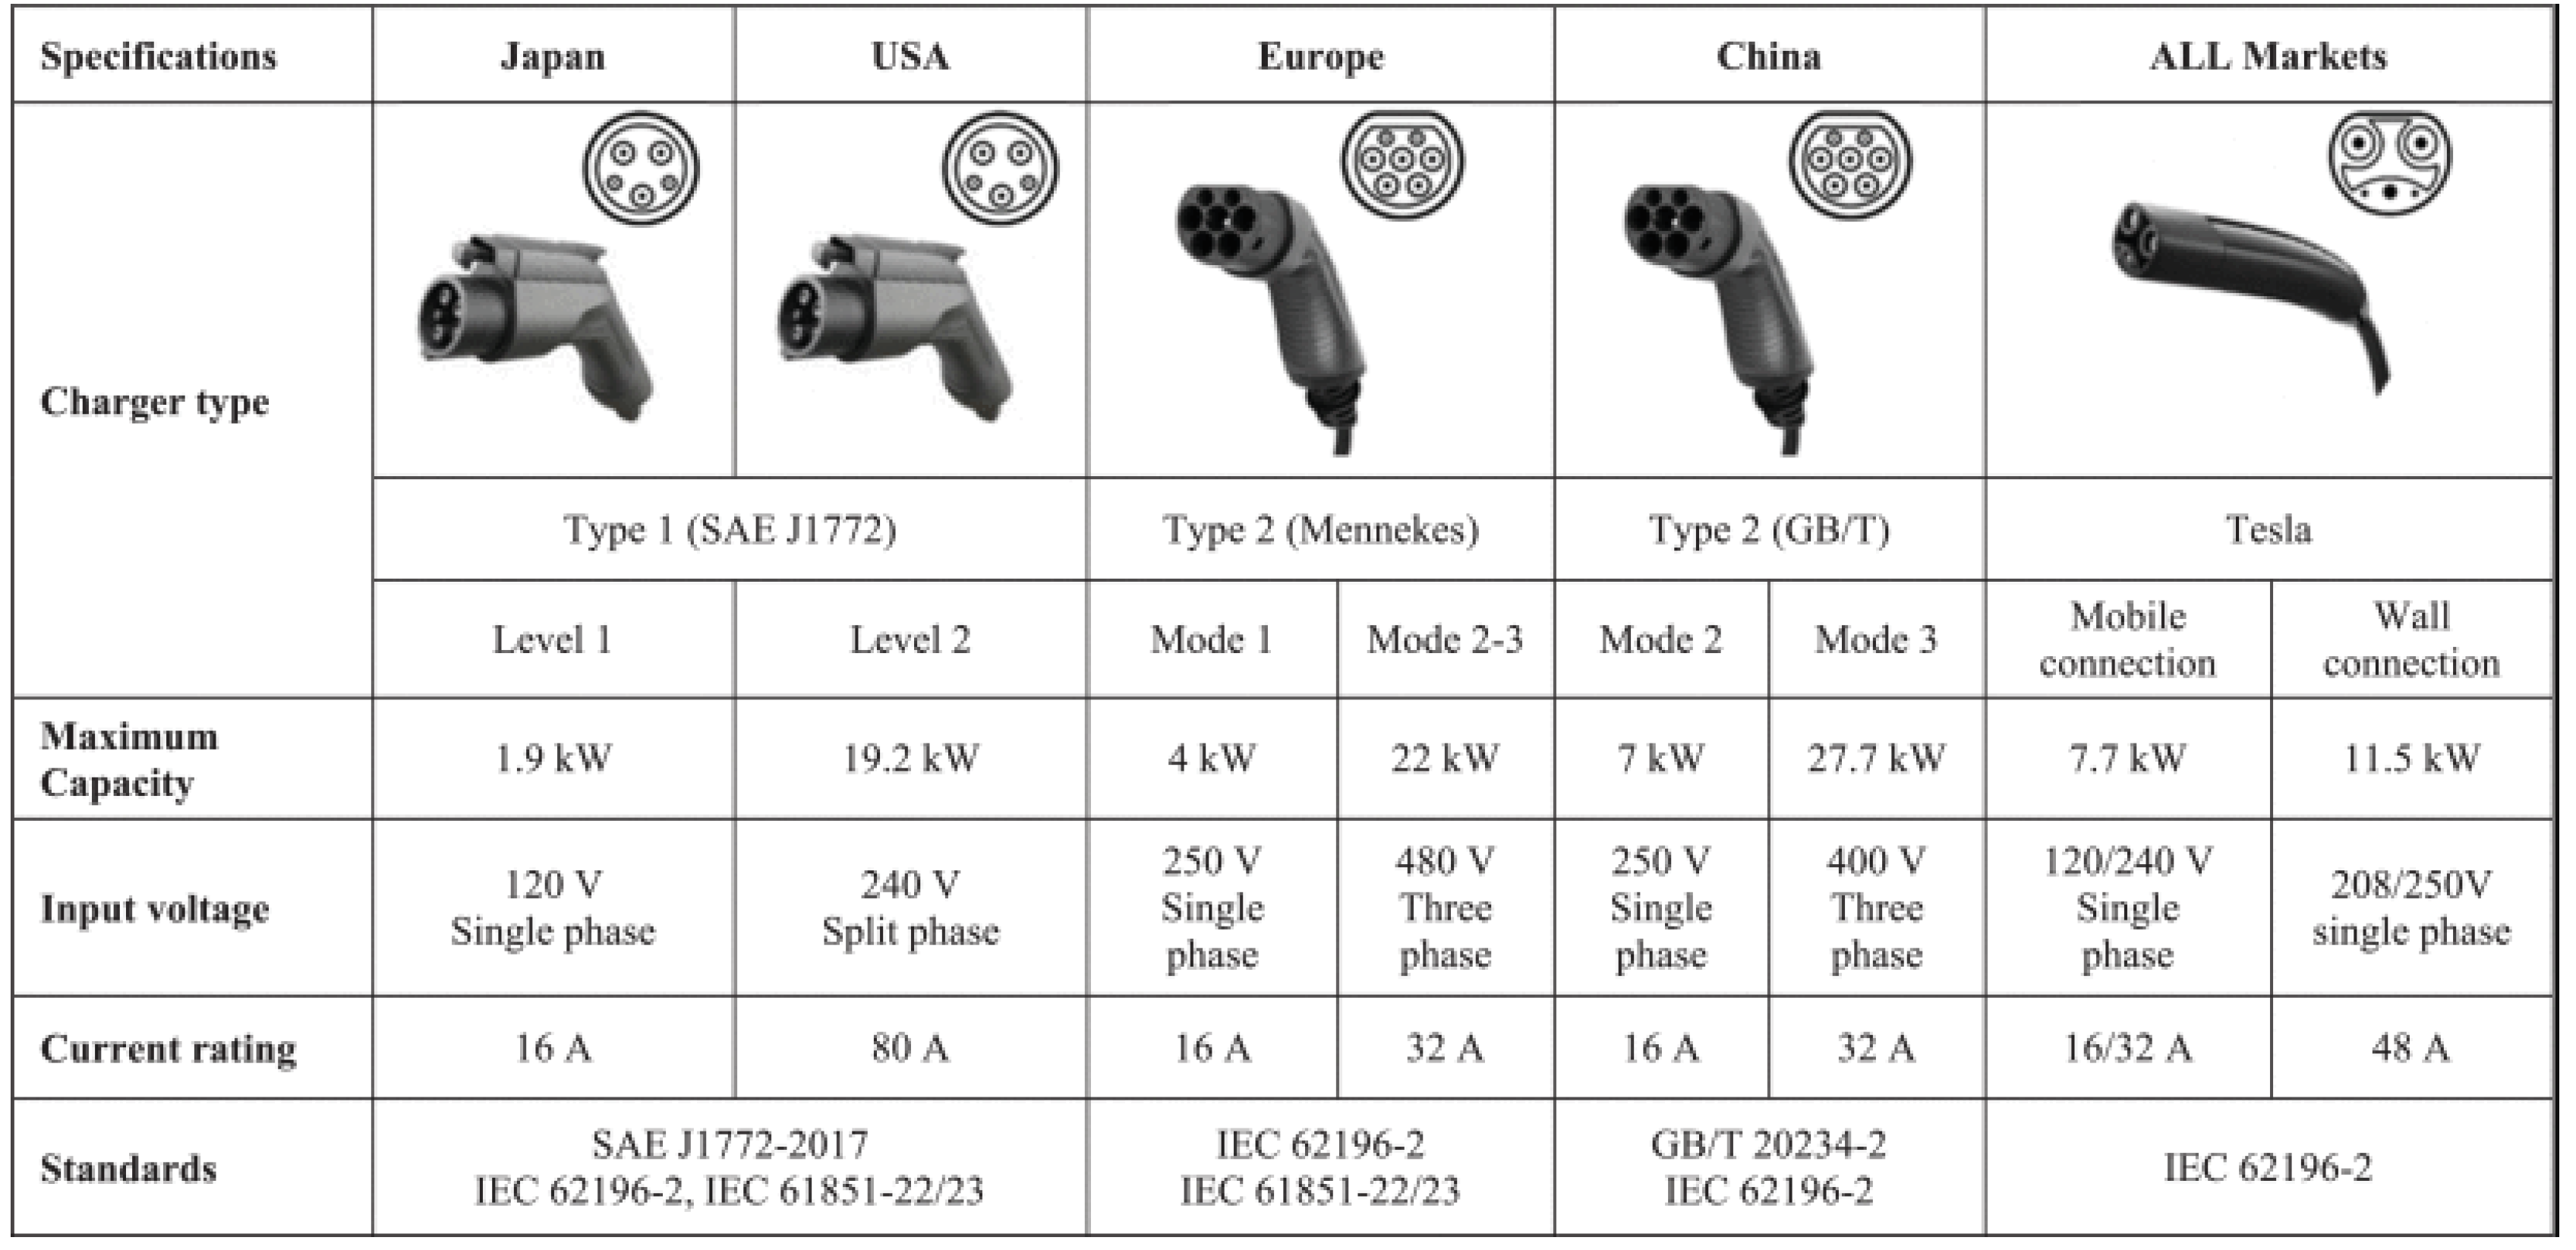
Figure 5.
Socket types for electric vehicle charging in continuous current (DC) [25].
Figure 5.
Socket types for electric vehicle charging in continuous current (DC) [25].
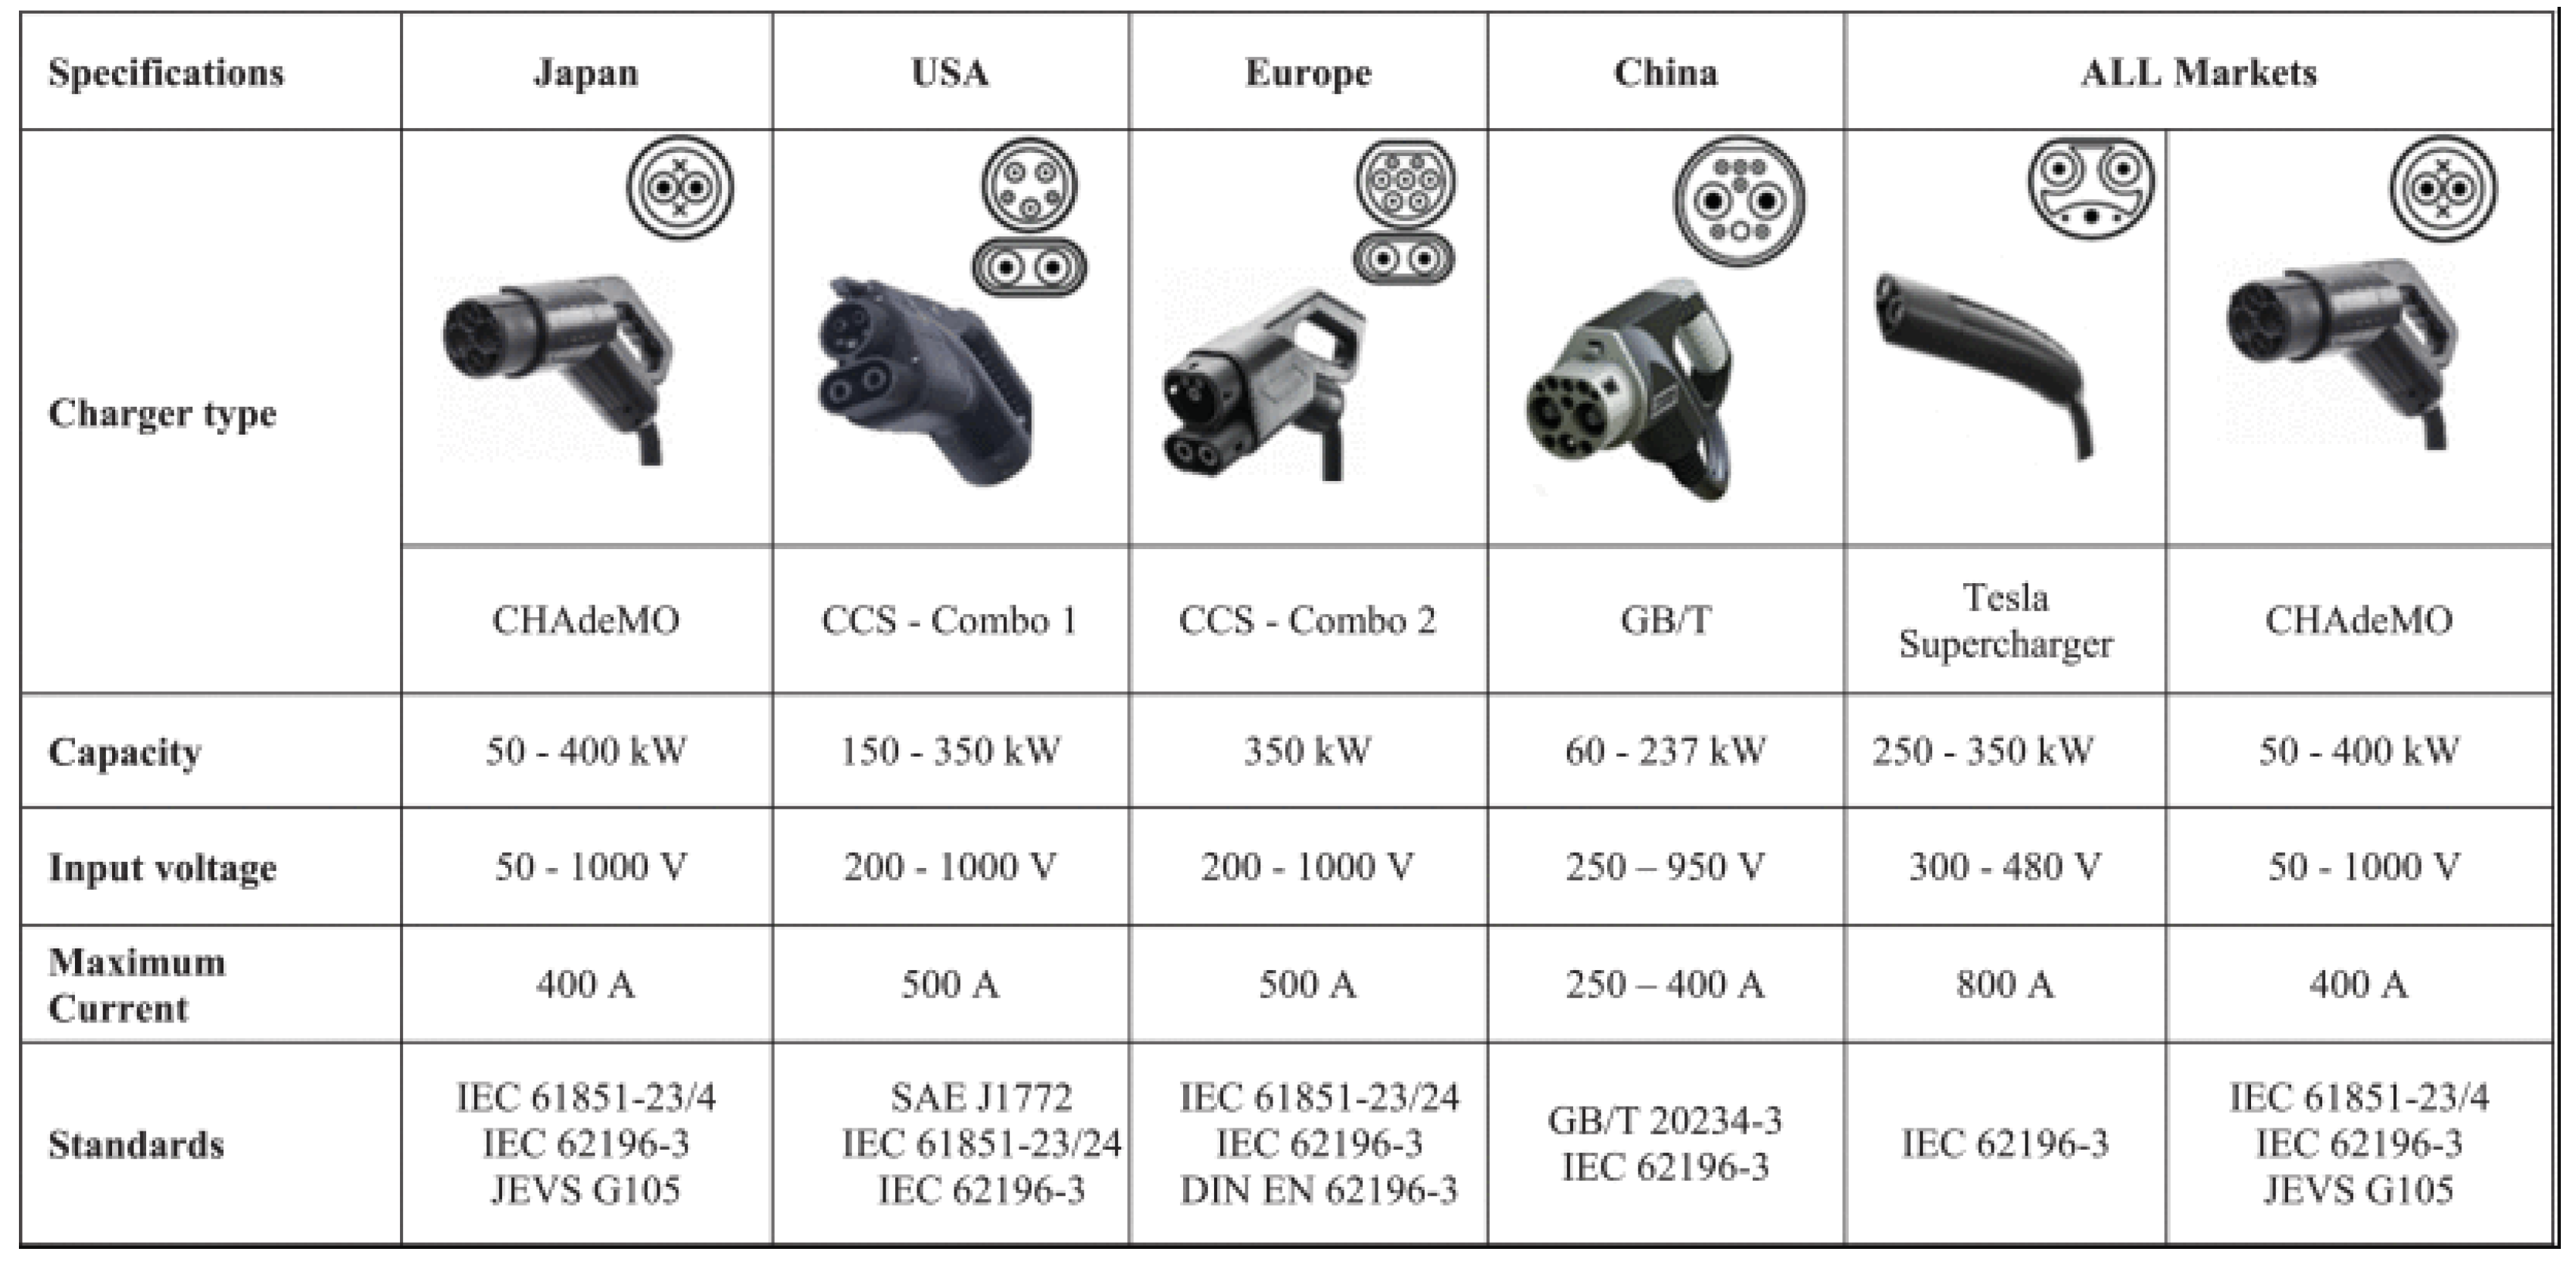
Figure 6.
Monthly distribution of solar radiation [27].
Figure 6.
Monthly distribution of solar radiation [27].
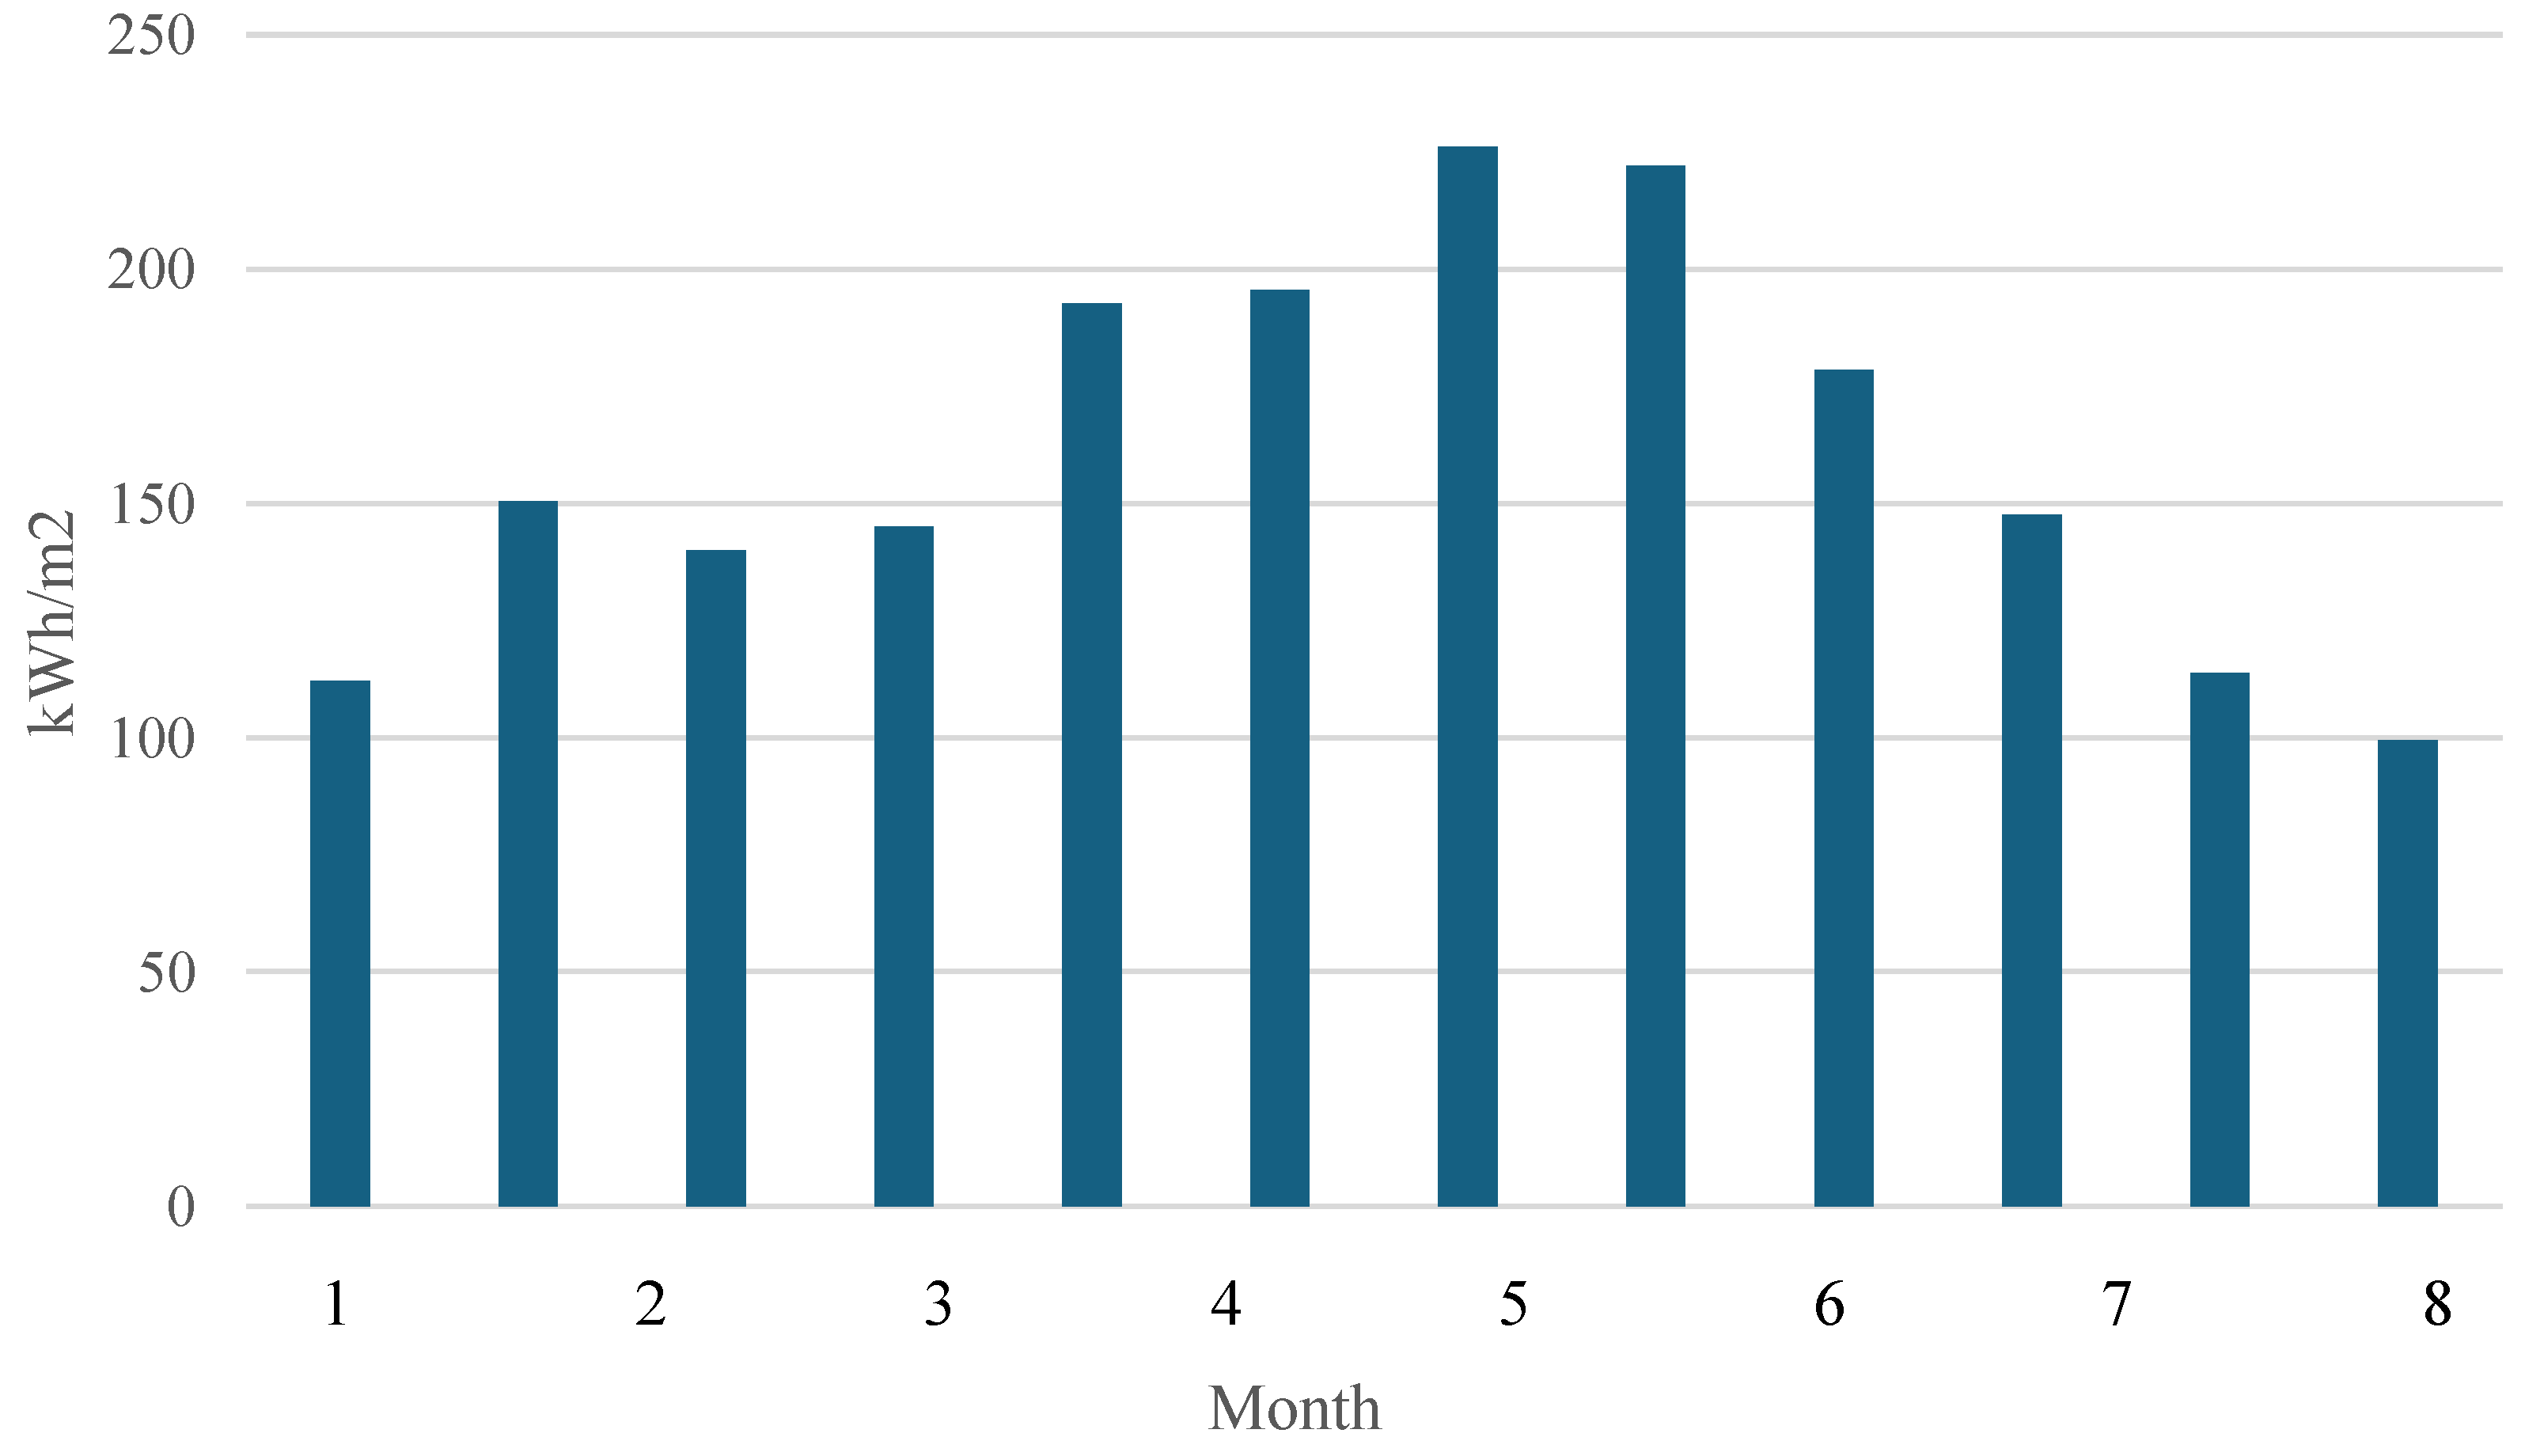
Figure 7.
PV panel electric response (I-V curve). Left: temperature dependence; Right: Solar radiation level dependence.
Figure 7.
PV panel electric response (I-V curve). Left: temperature dependence; Right: Solar radiation level dependence.
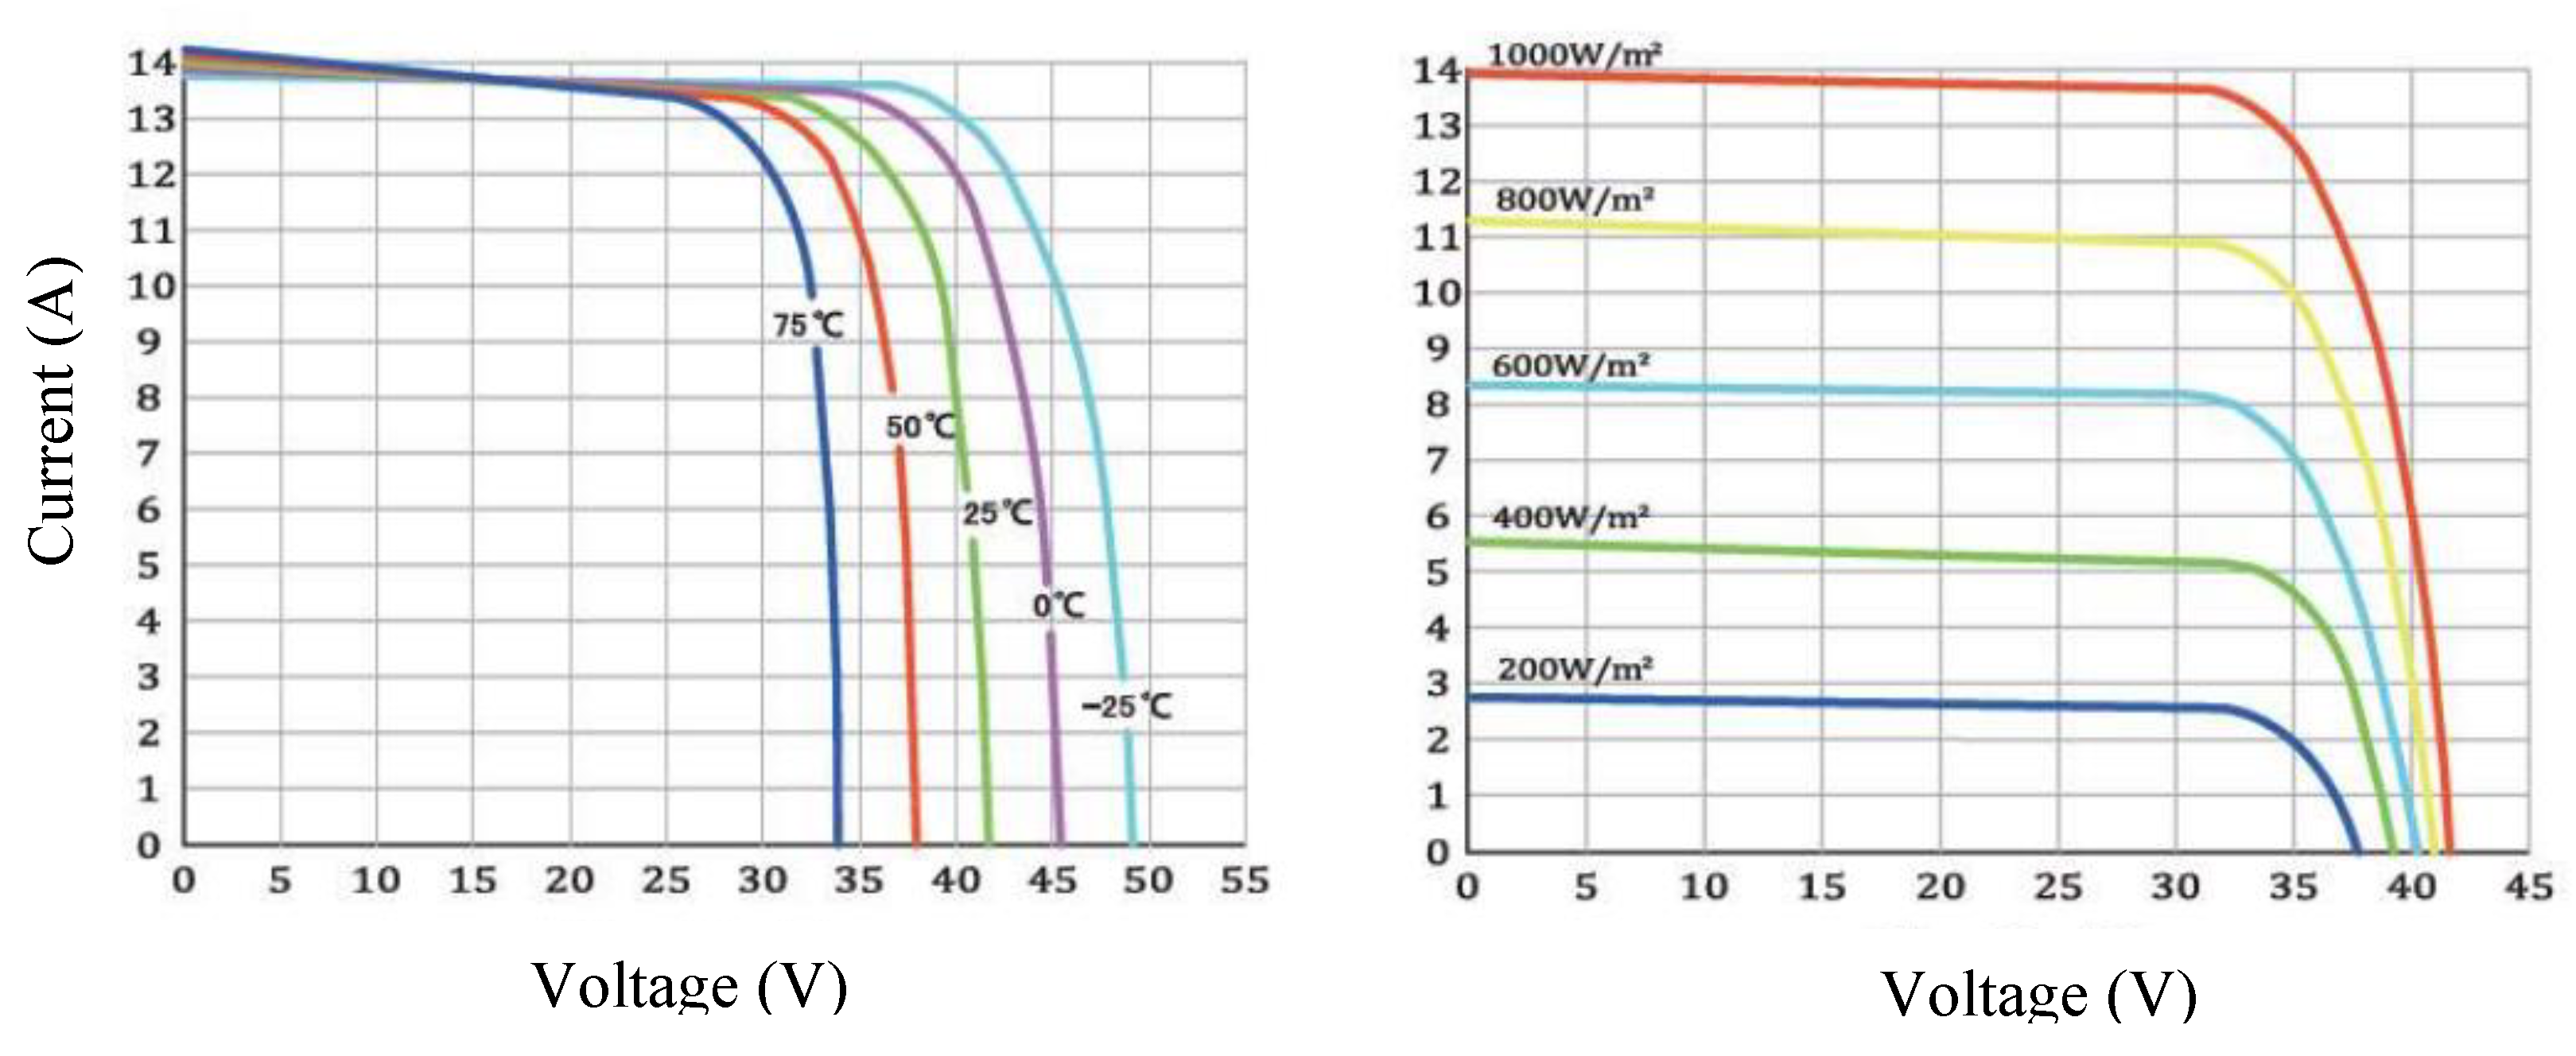
Figure 8.
Voltage supply distribution at every pole and socket for the charging station prototype.
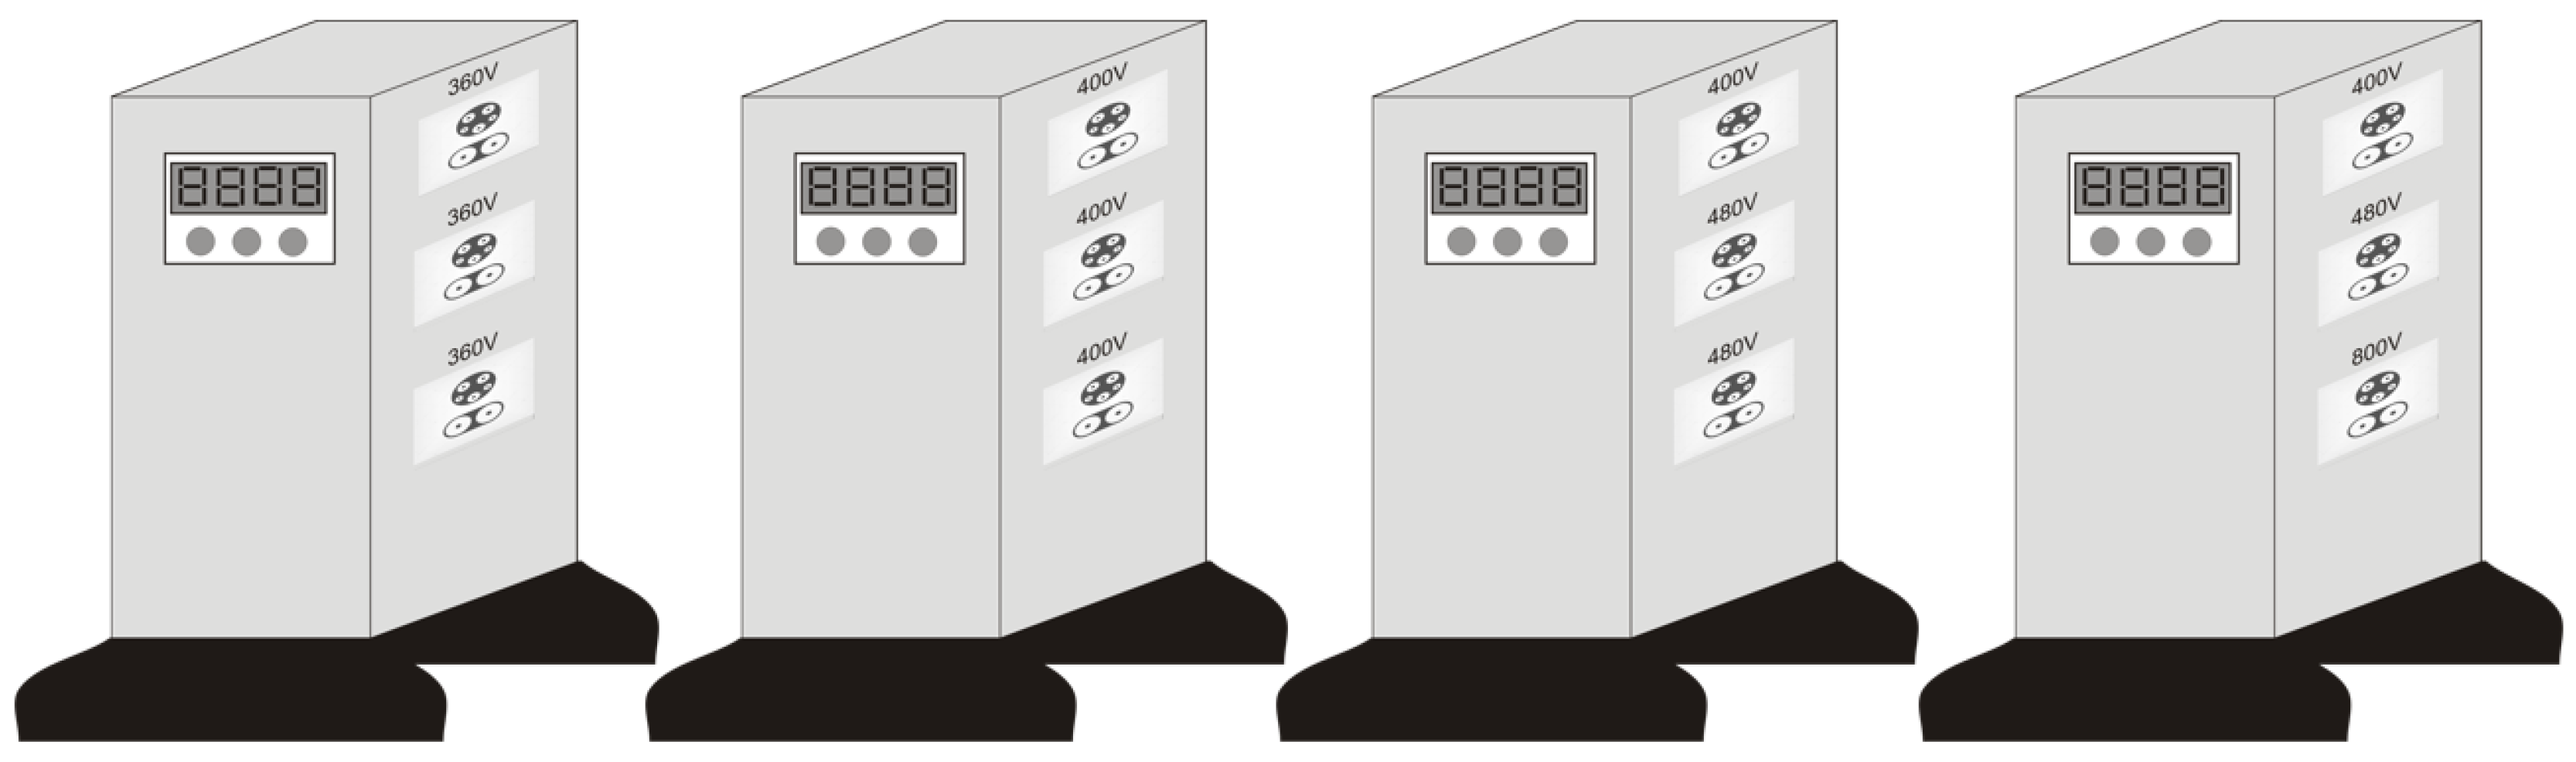
Figure 9.
Voltage conversion layouts engineering for the charging station prototype.
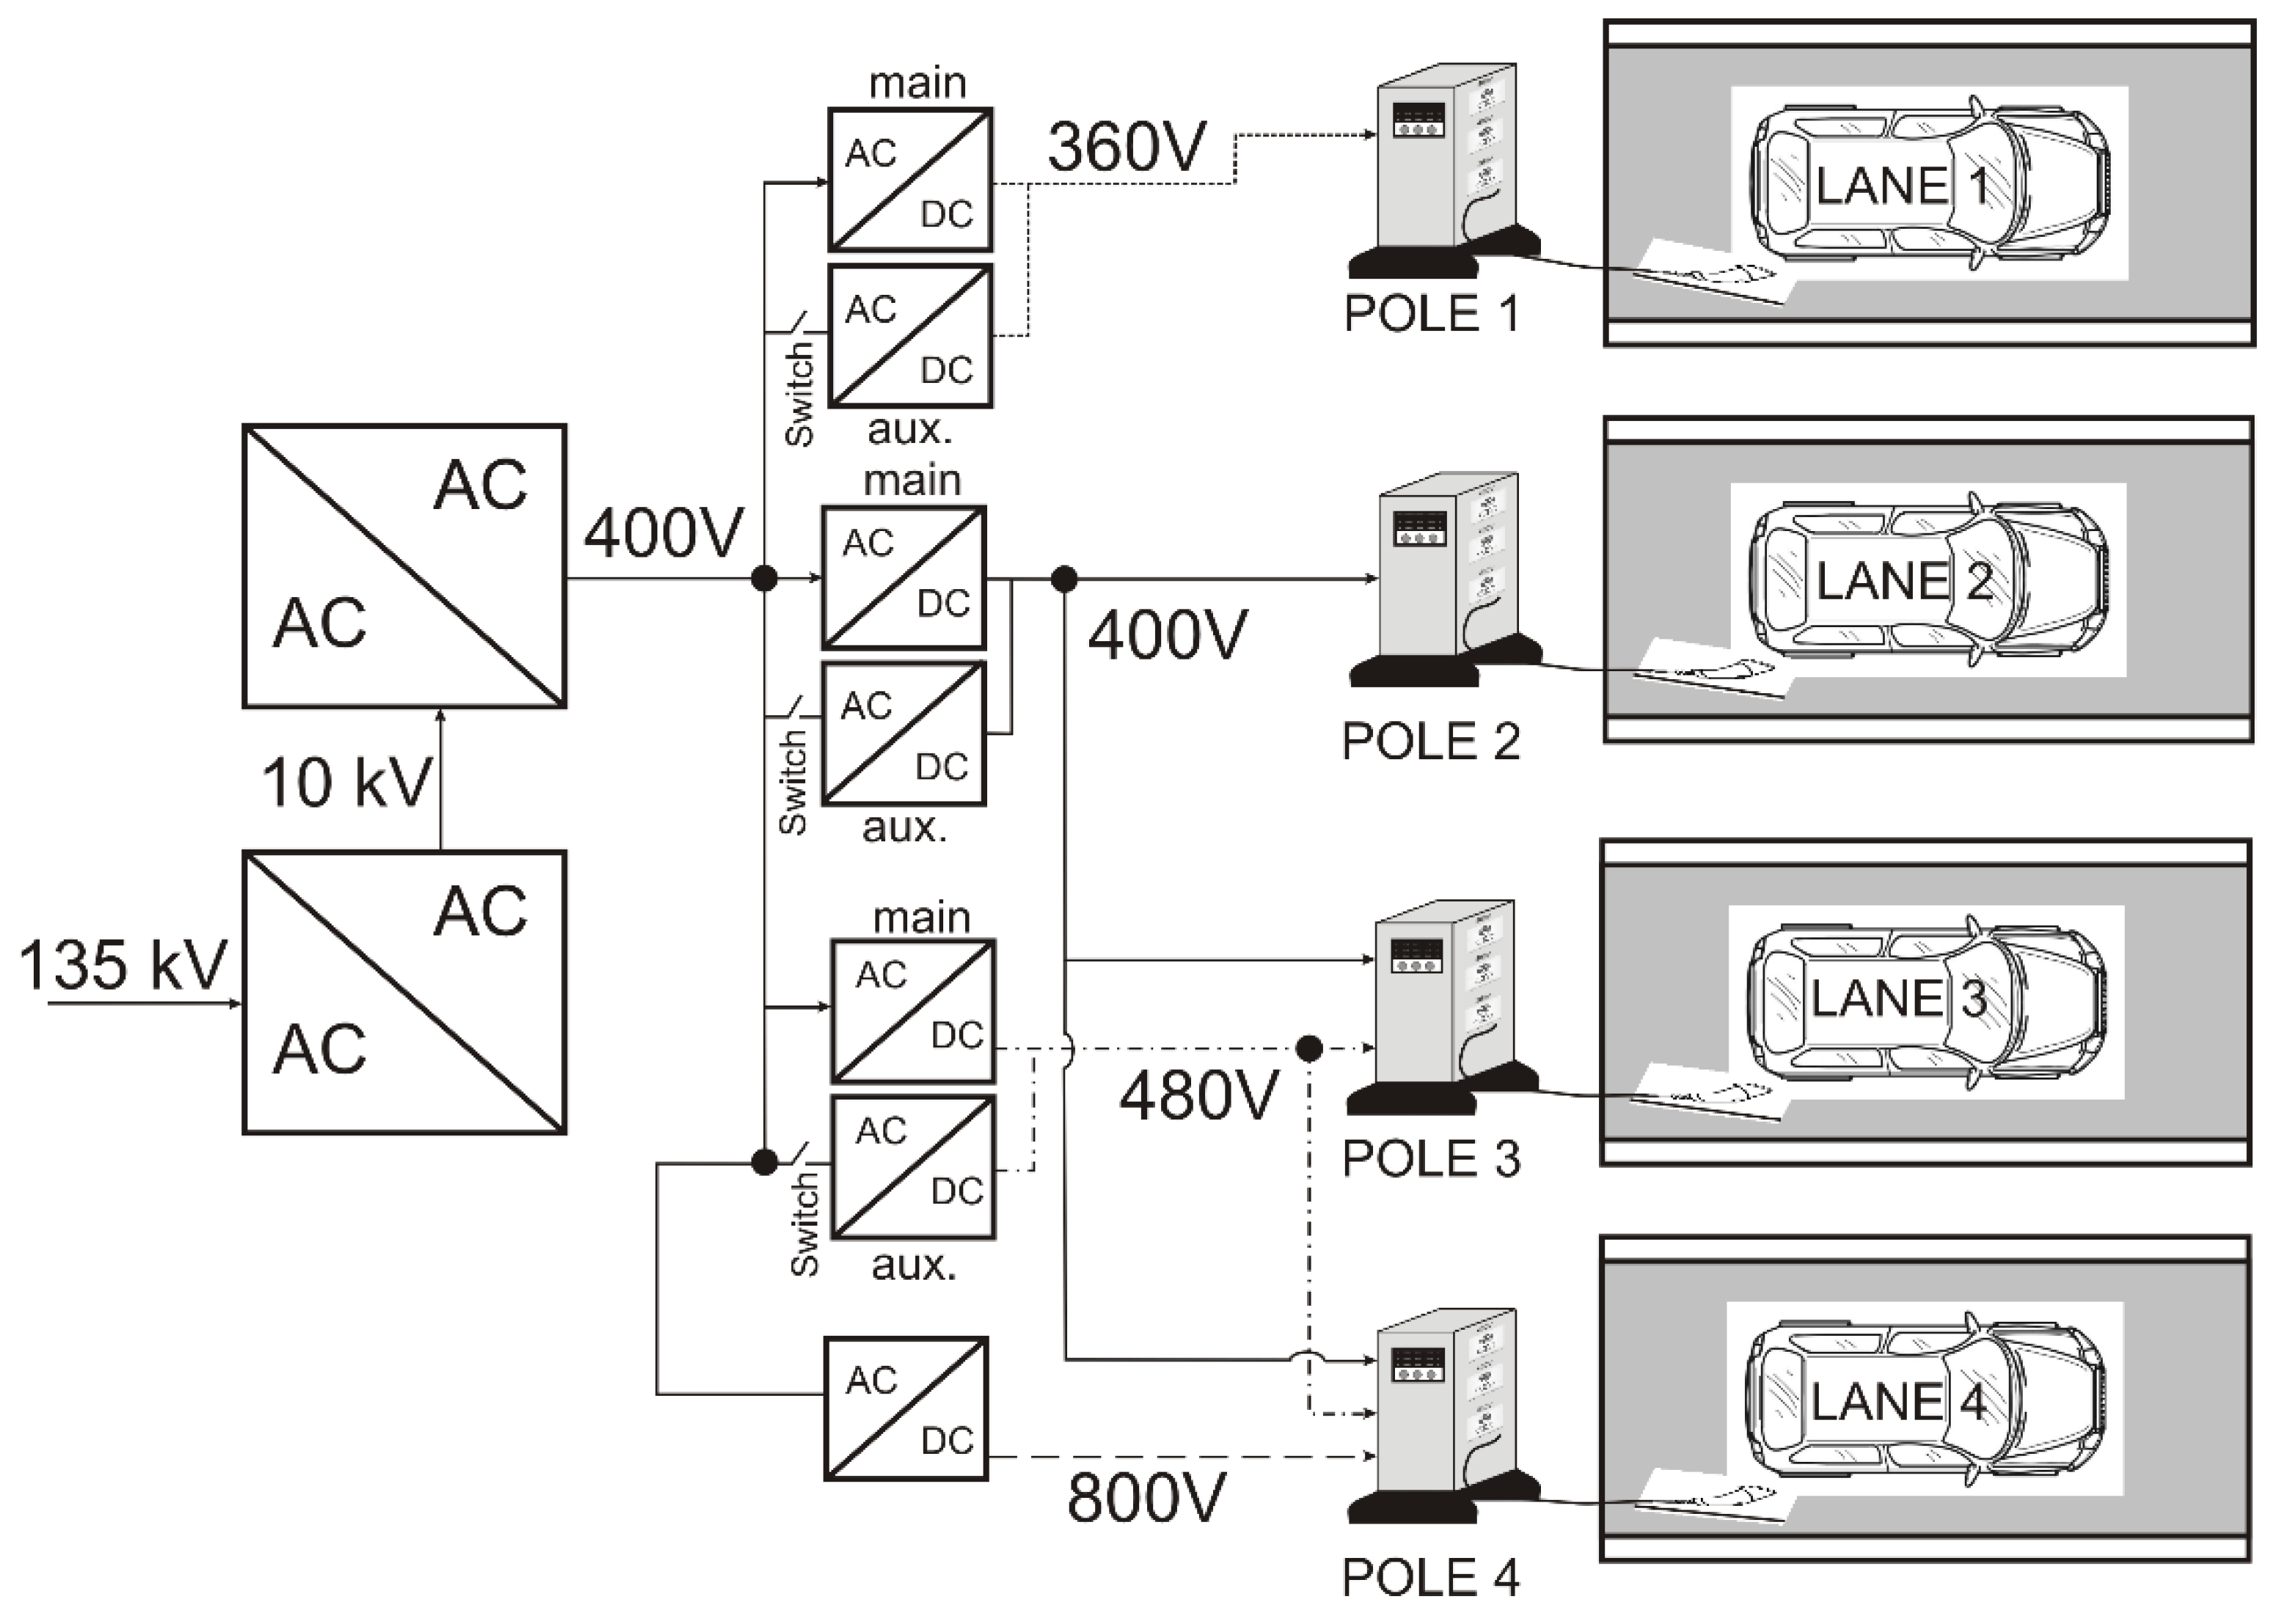
Figure 10.
Schematic representation of the PV power plant layout.
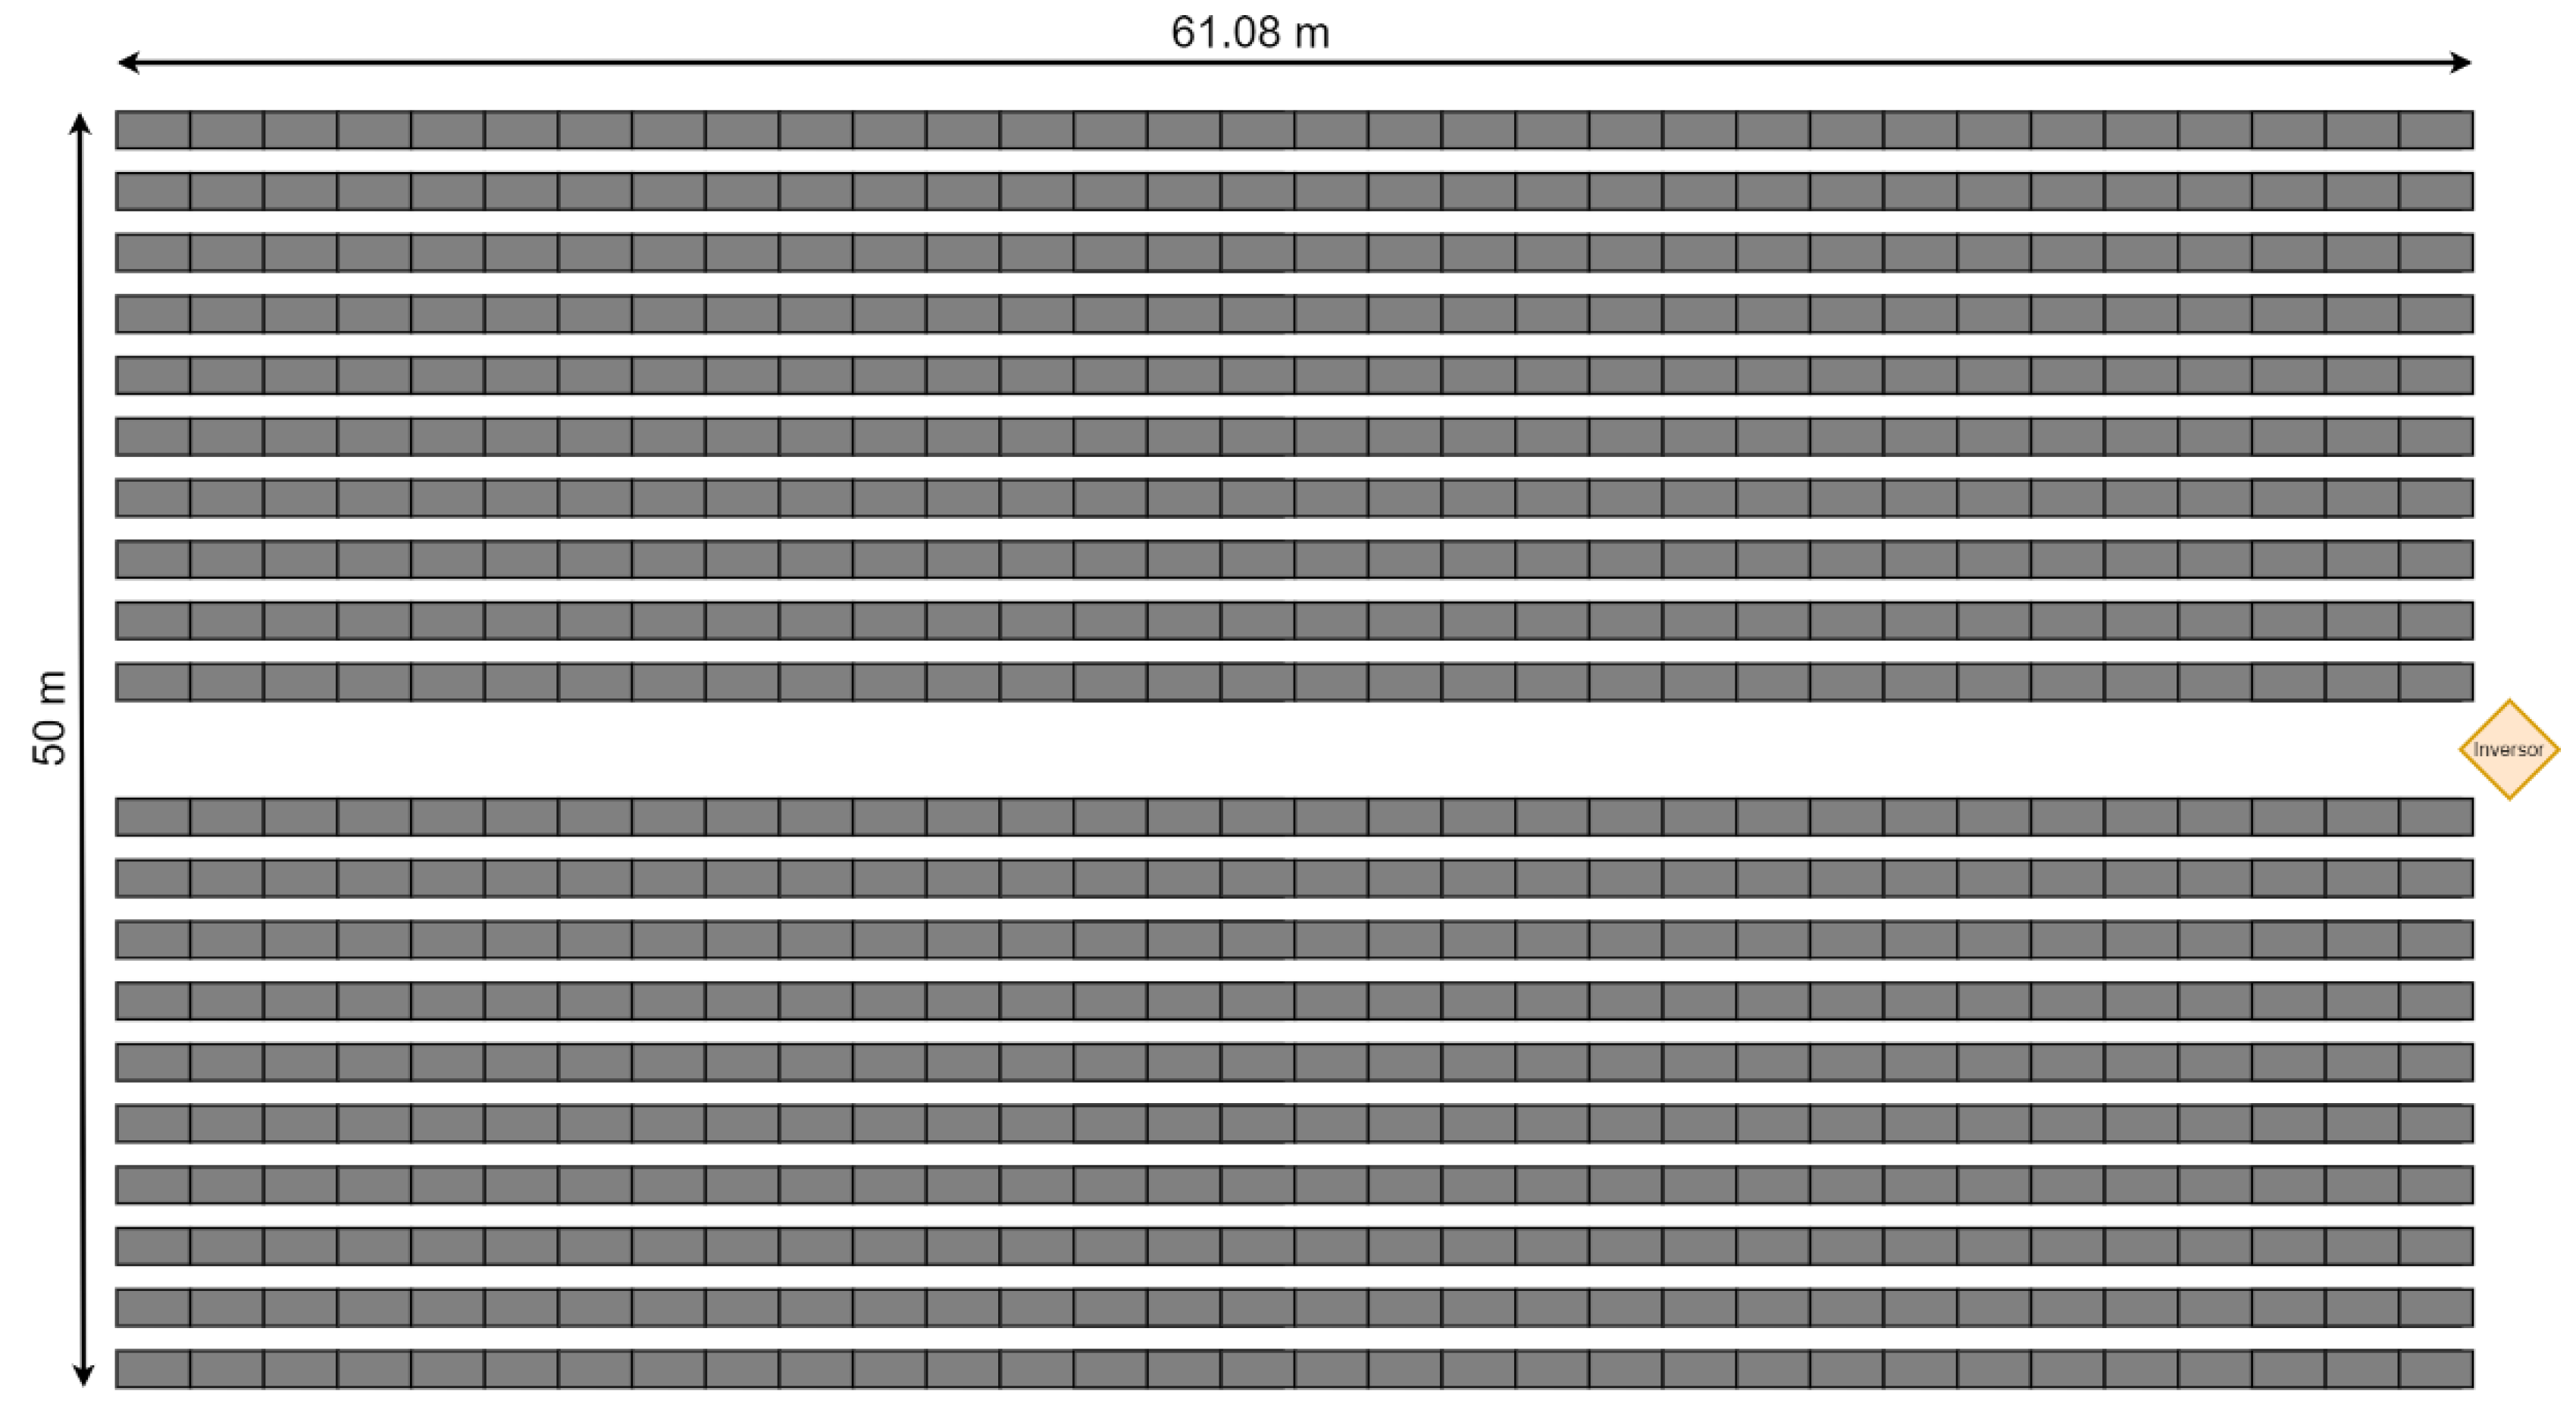
Figure 11.
Schematic view of the voltage transformation process at the PV power plant.
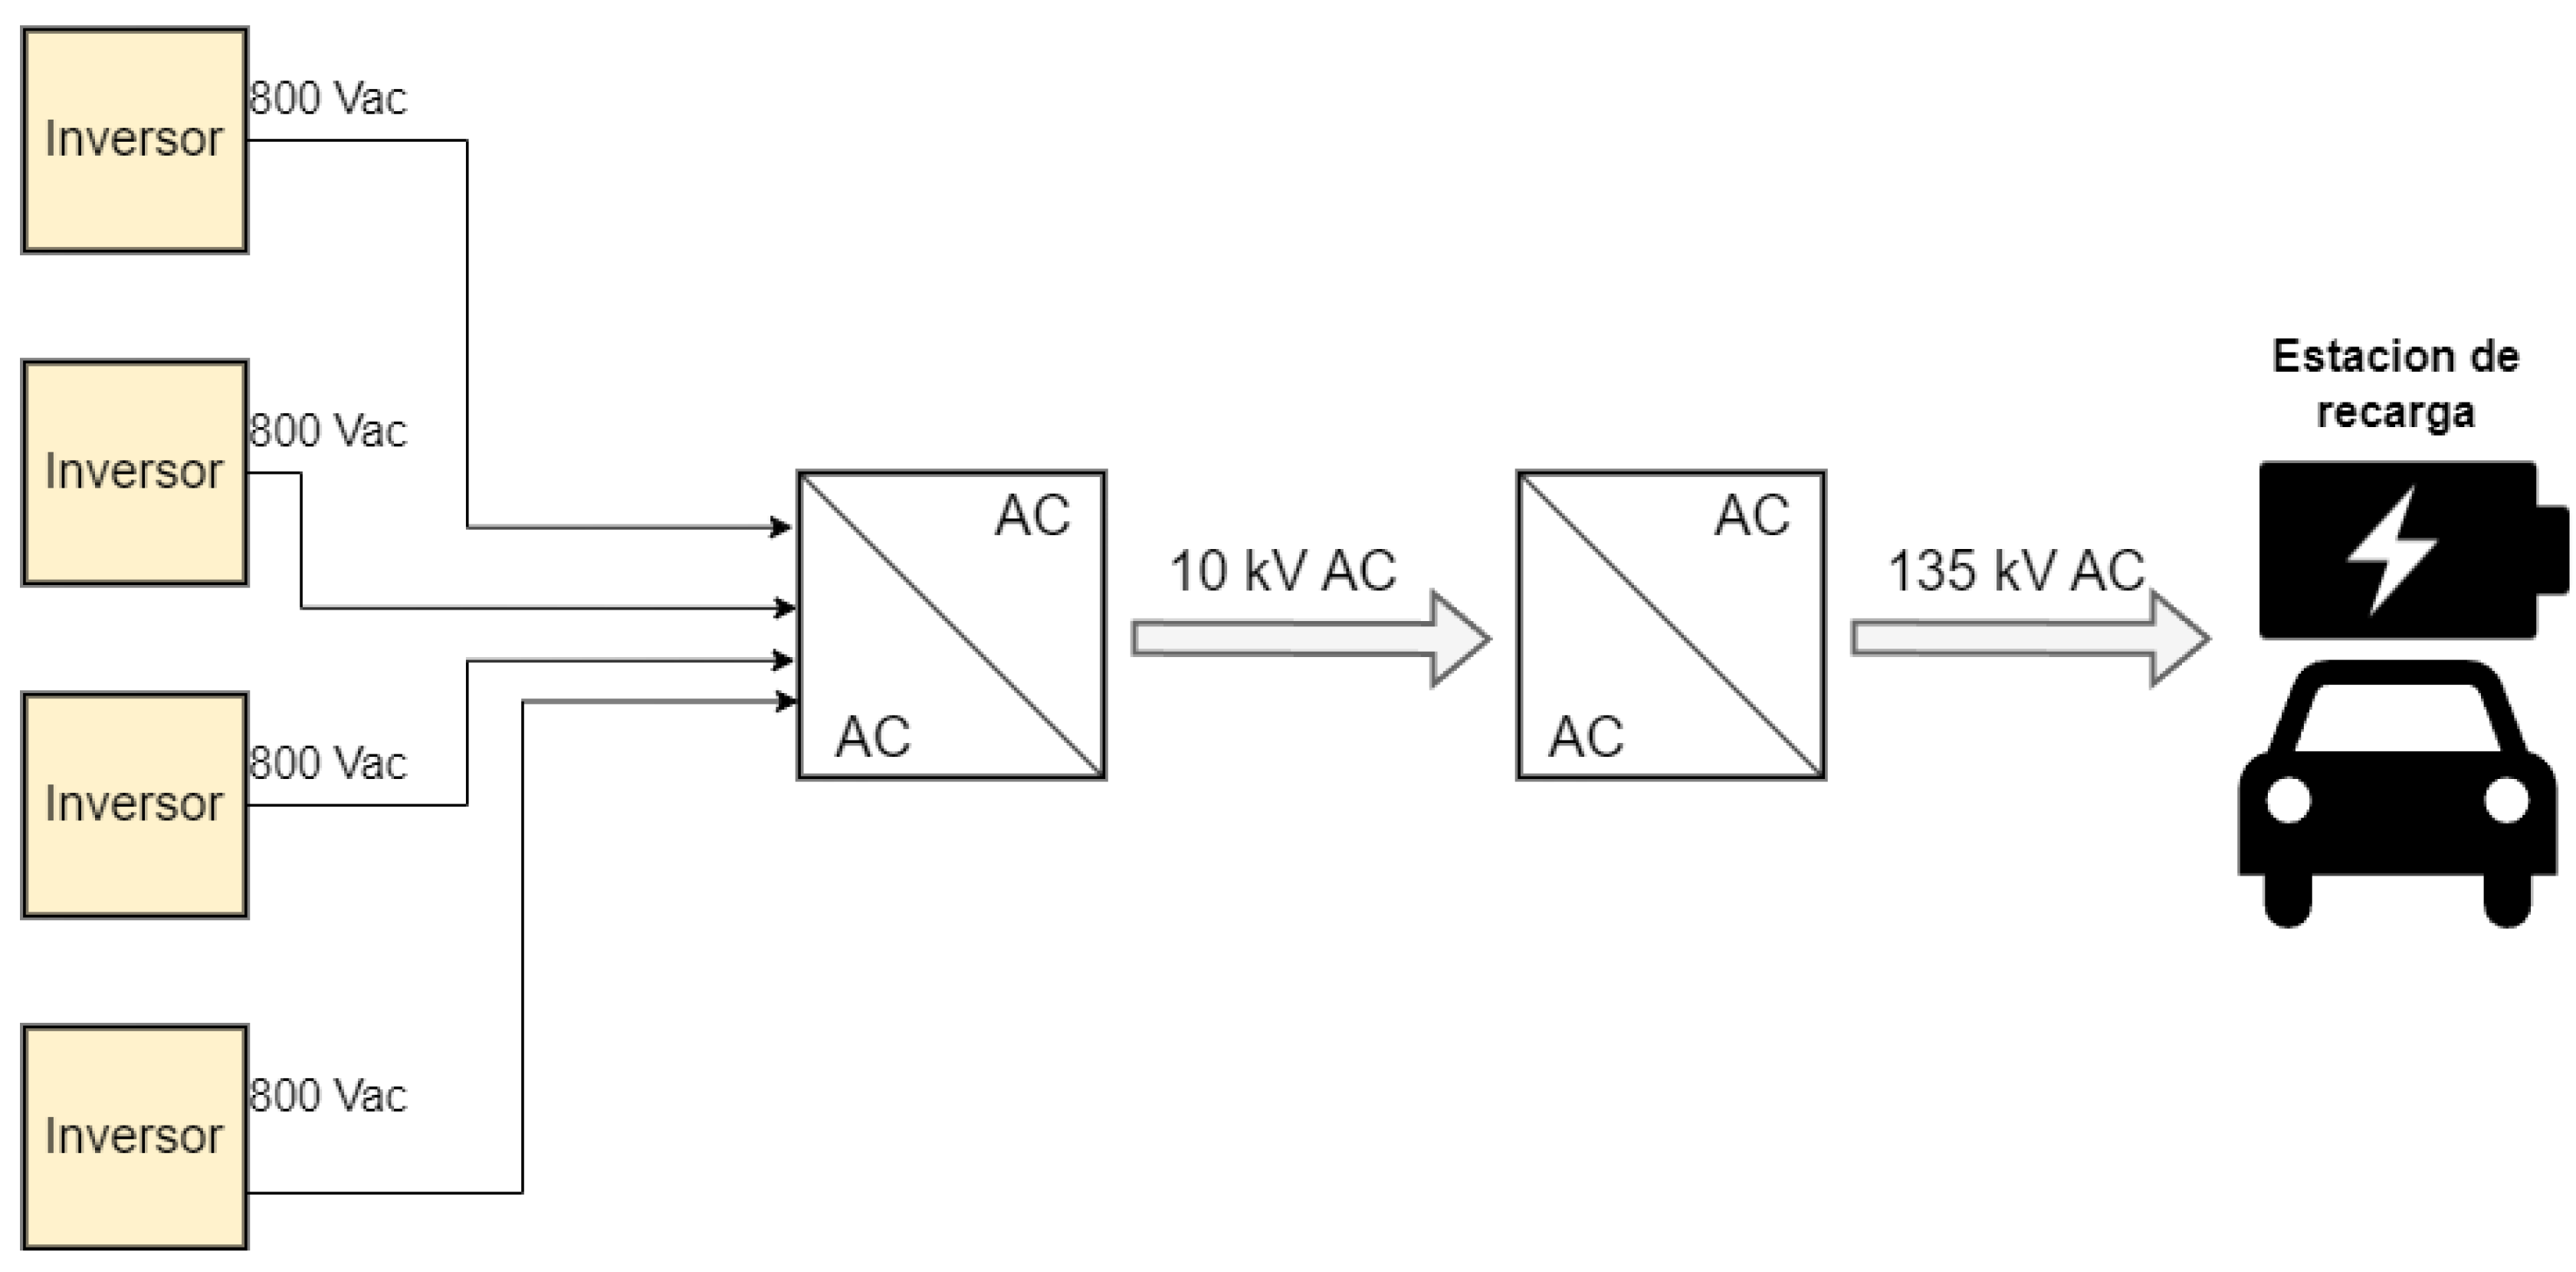
Figure 12.
AC bus configuration for the transmission line to charging station connection.
Figure 13.
DC bus configuration for the transmission line to charging station connection.
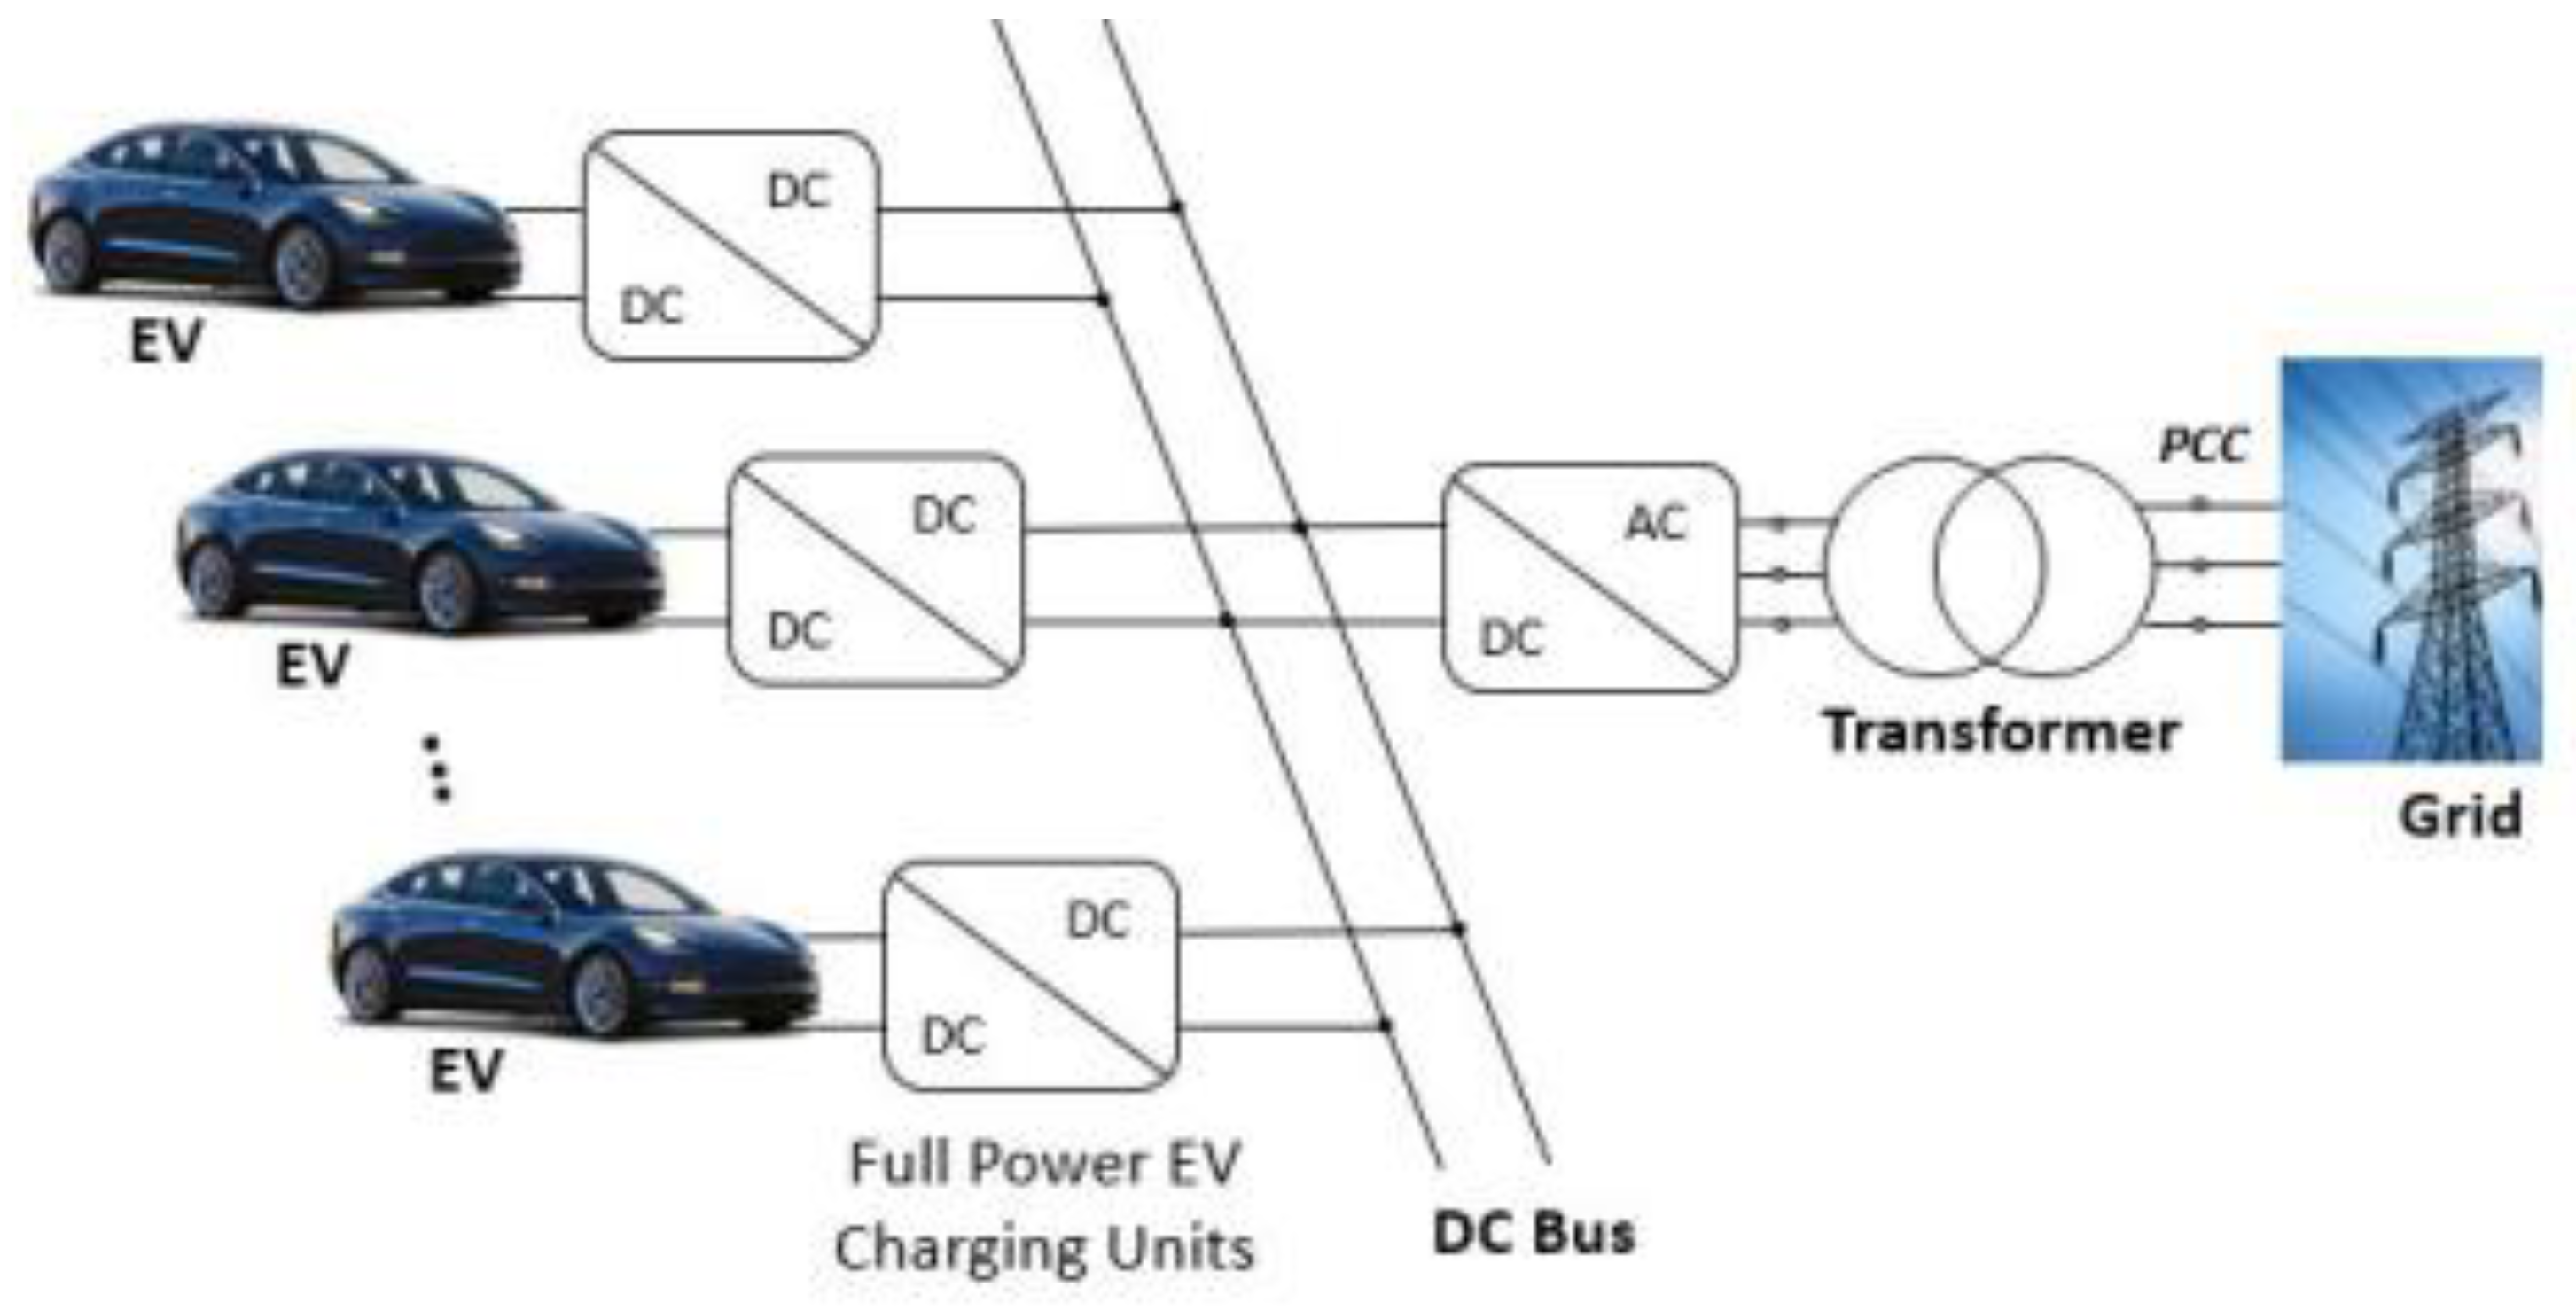
Figure 14.
Monthly solar photovoltaic energy coverage factor.
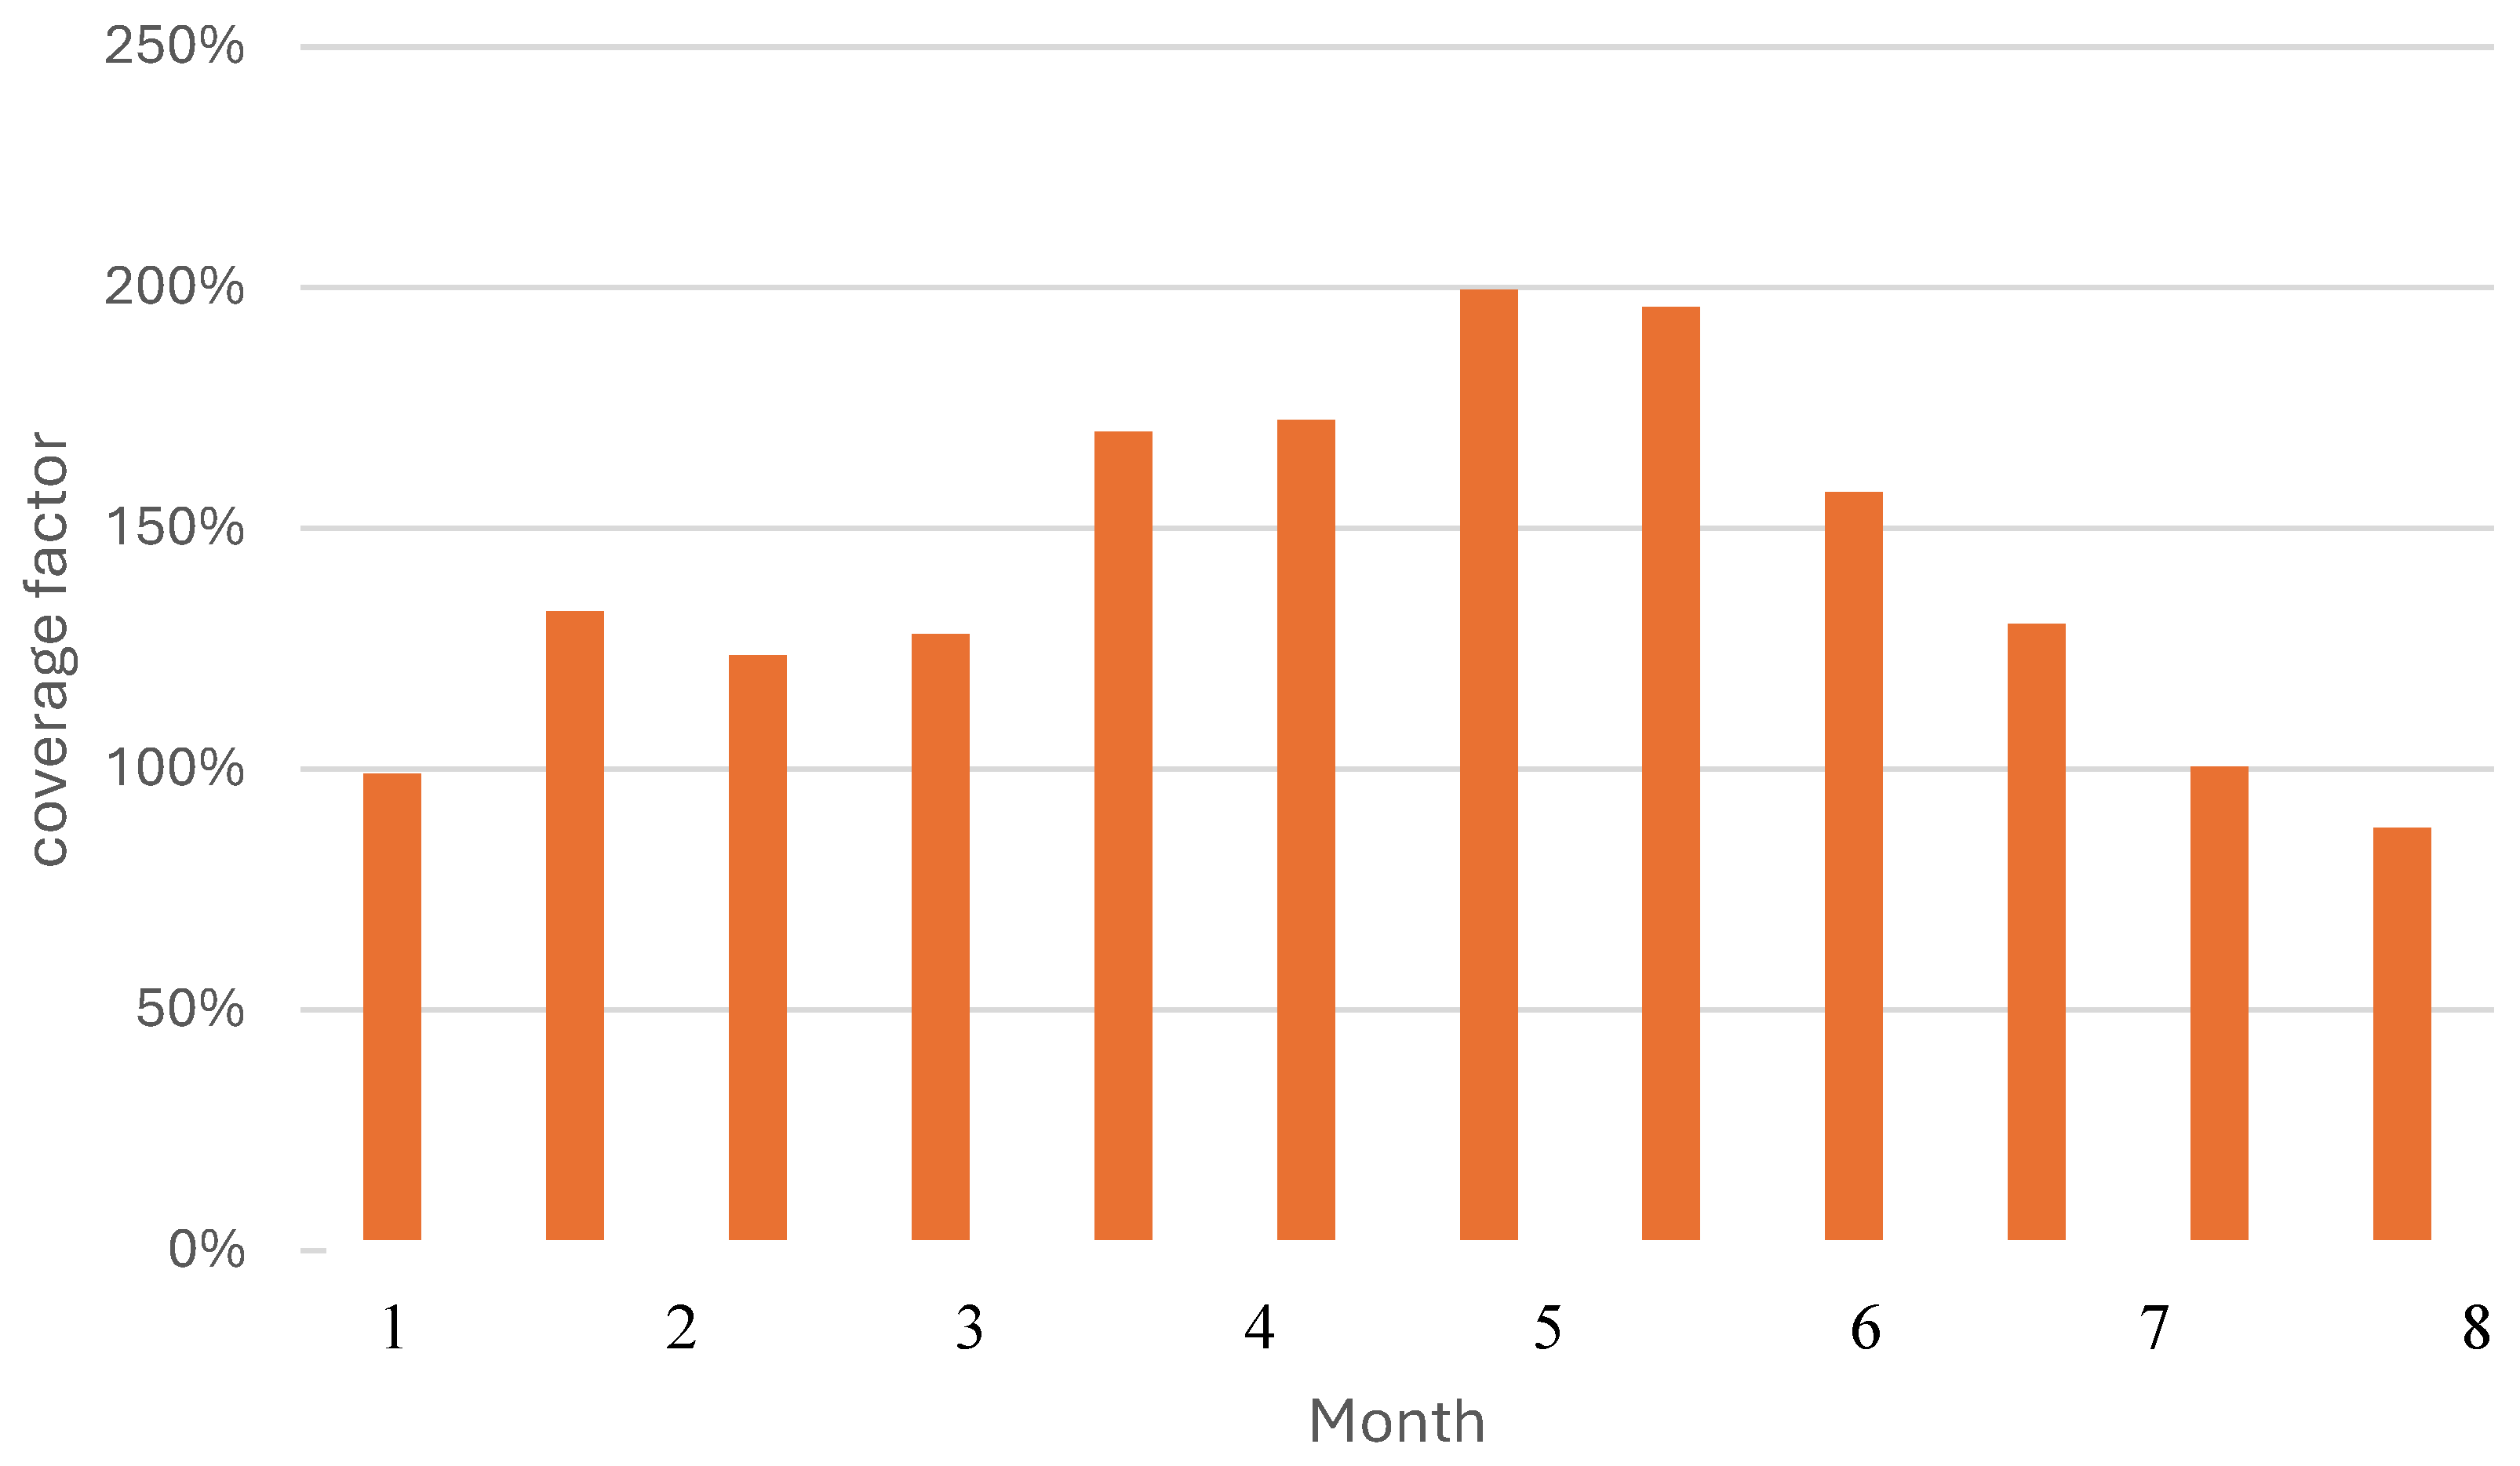
Figure 15.
Hourly evolution of power generation and energy demand. Left side: lowest PV power generation; Right side: highest PV power generation.
Figure 15.
Hourly evolution of power generation and energy demand. Left side: lowest PV power generation; Right side: highest PV power generation.
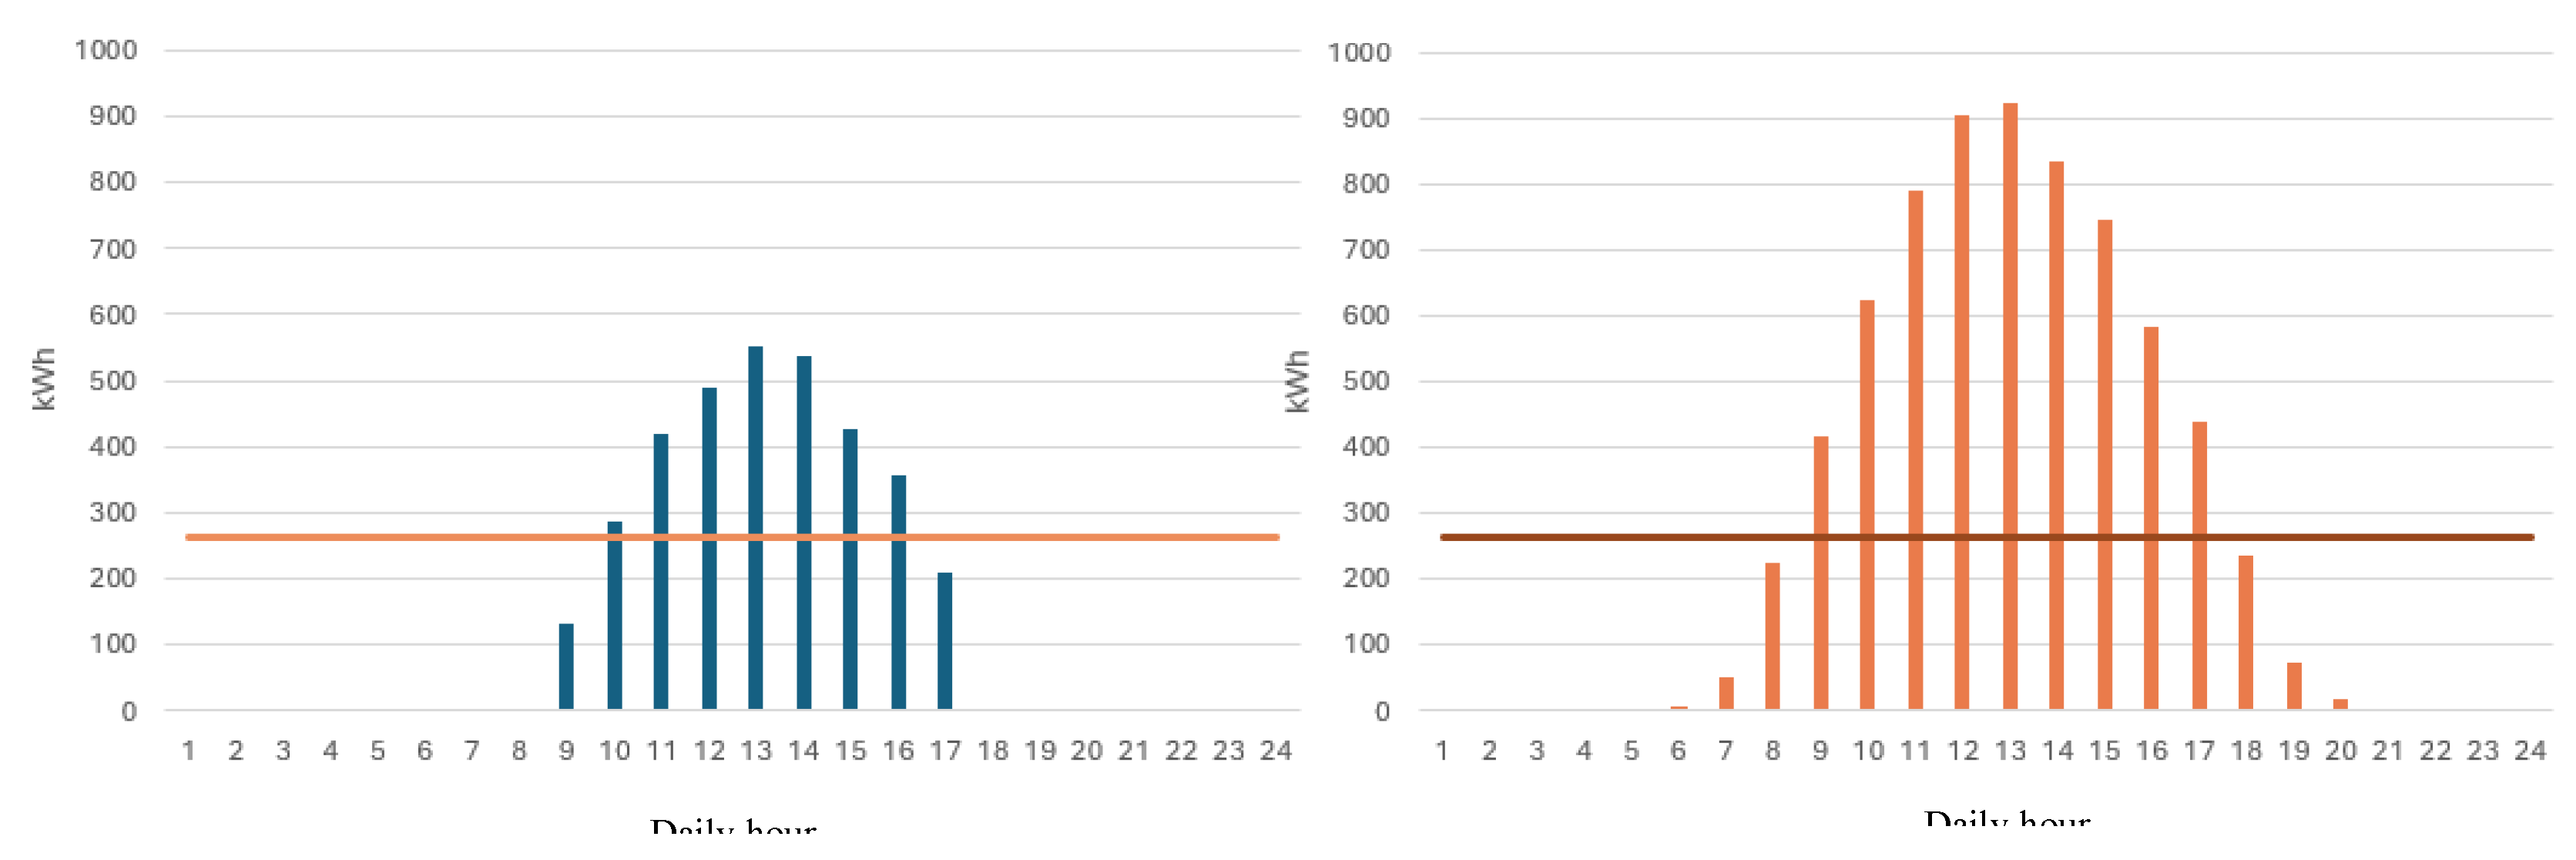
Figure 16.
Charging station daily hourly occupancy factor.
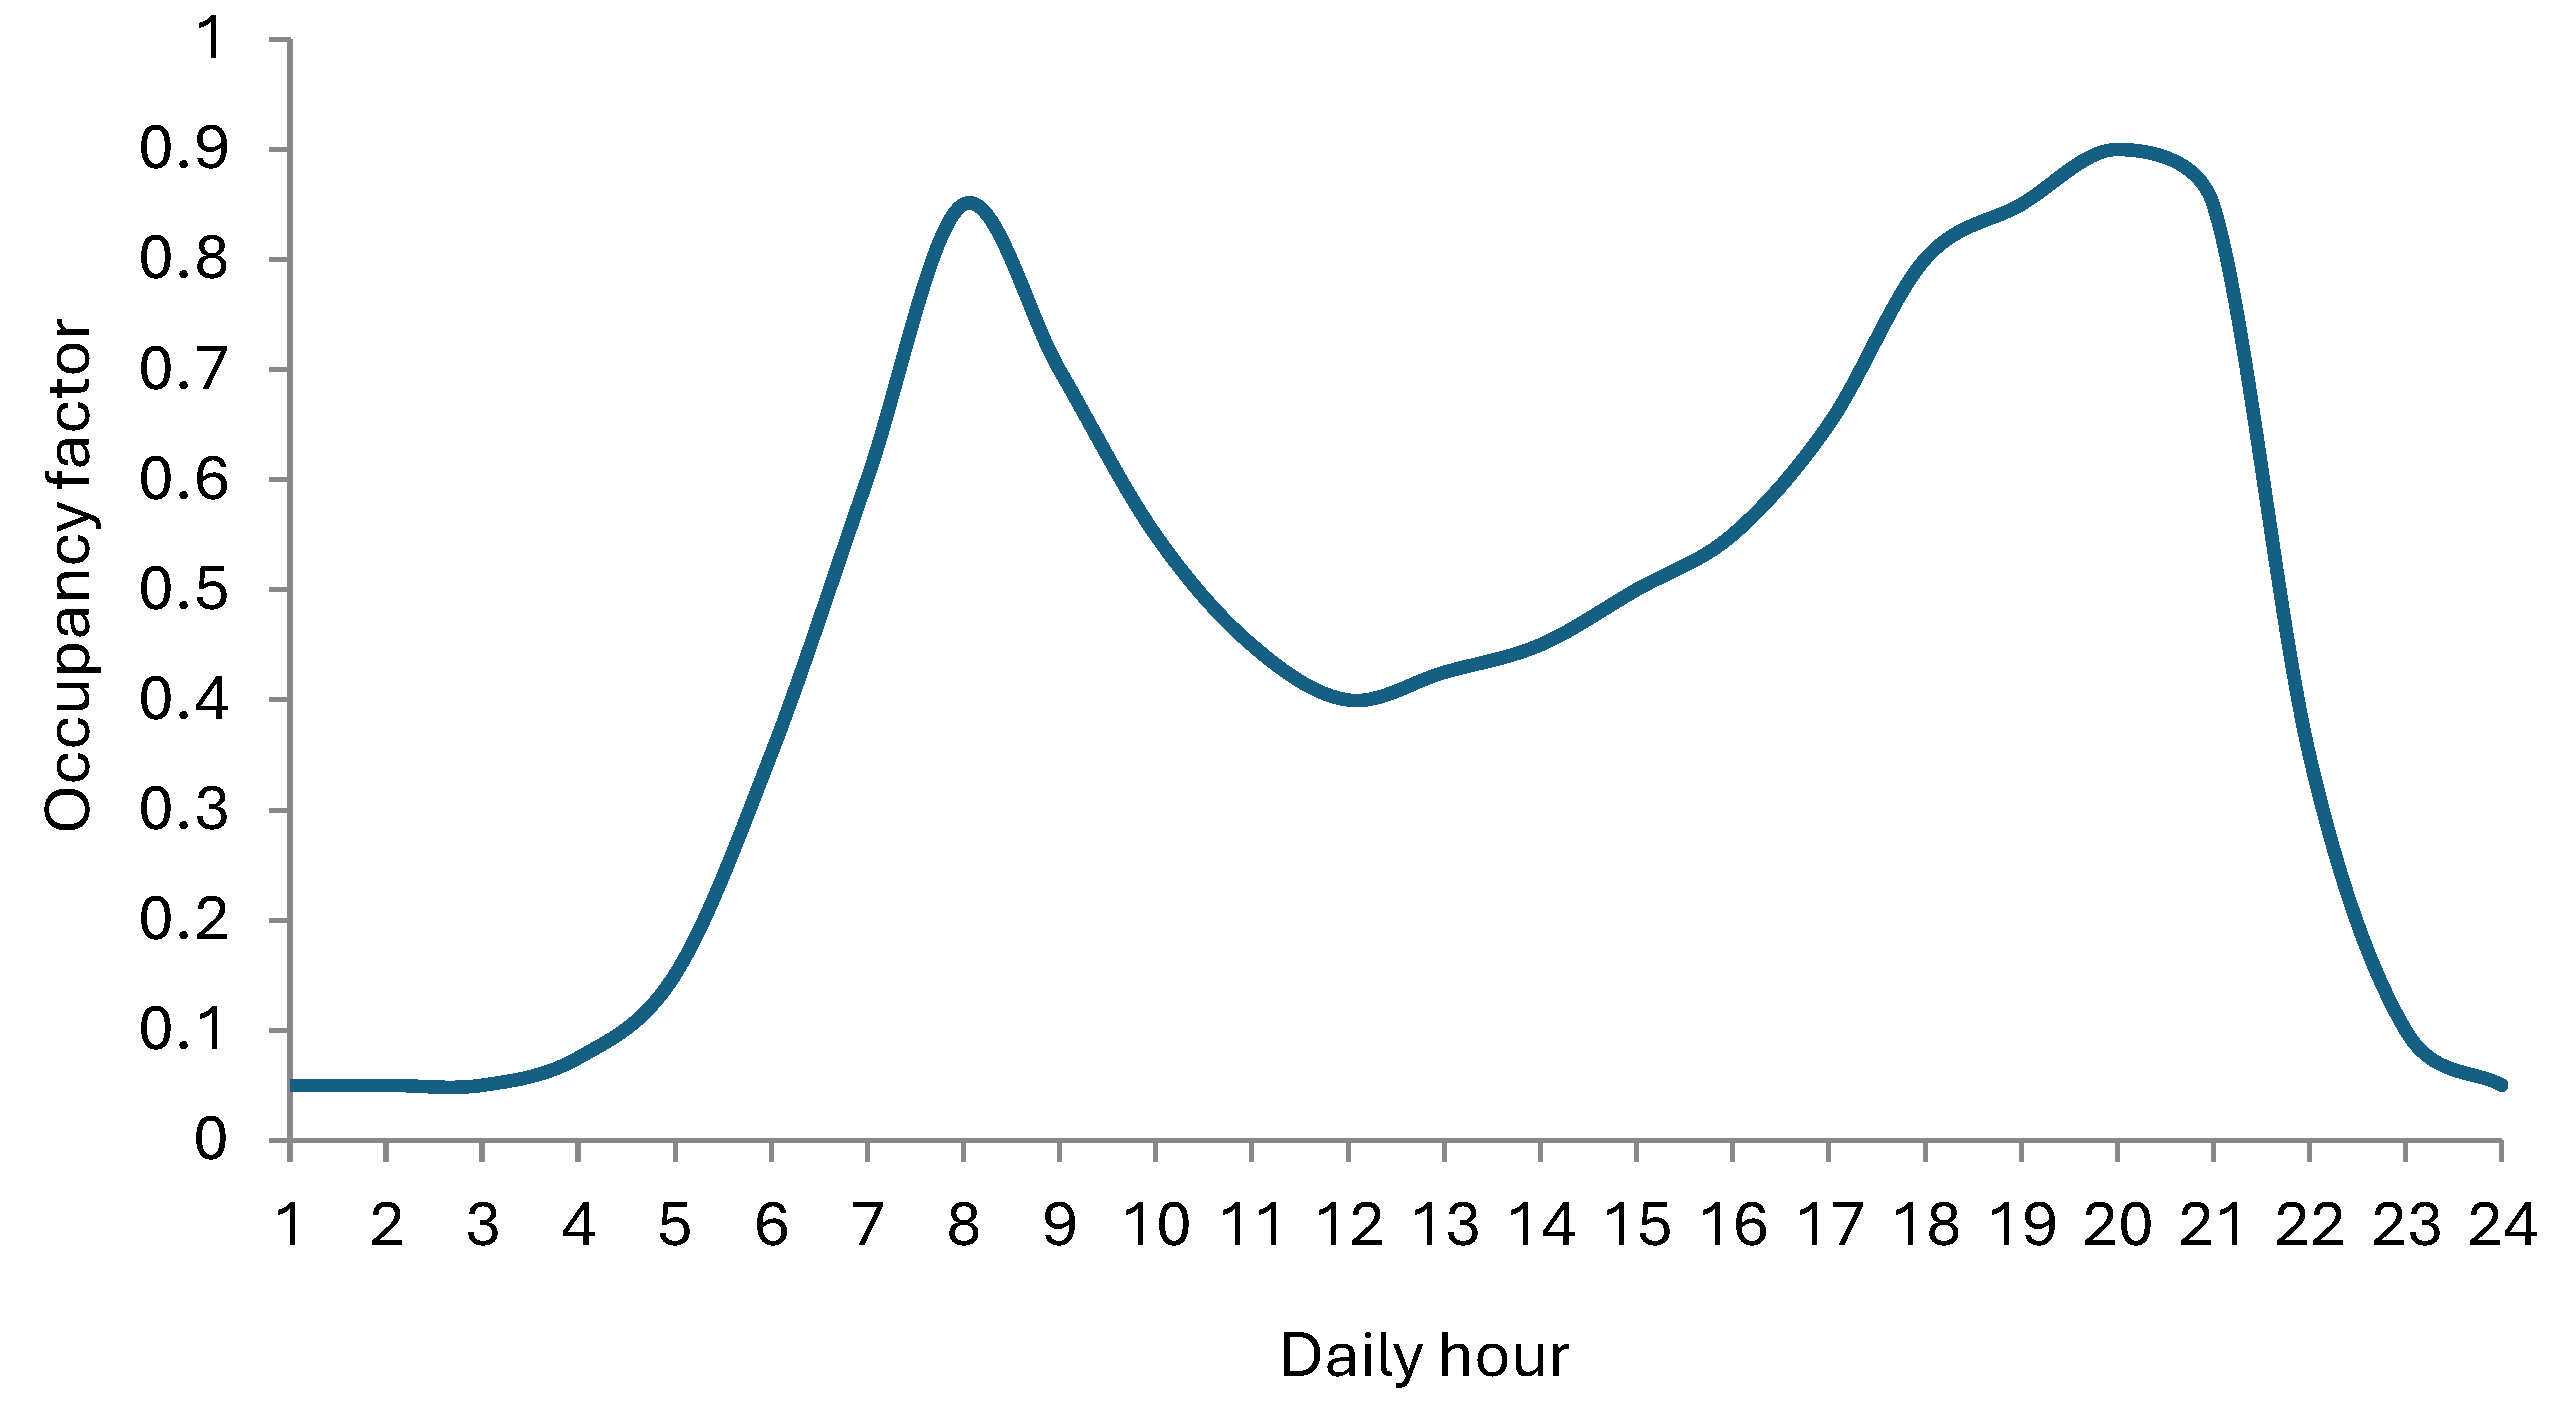
Figure 17.
Daily hourly energy evolution for the system prototype. Left hand: lowest PV power supply. Right hand: highest PV power supply.
Figure 17.
Daily hourly energy evolution for the system prototype. Left hand: lowest PV power supply. Right hand: highest PV power supply.
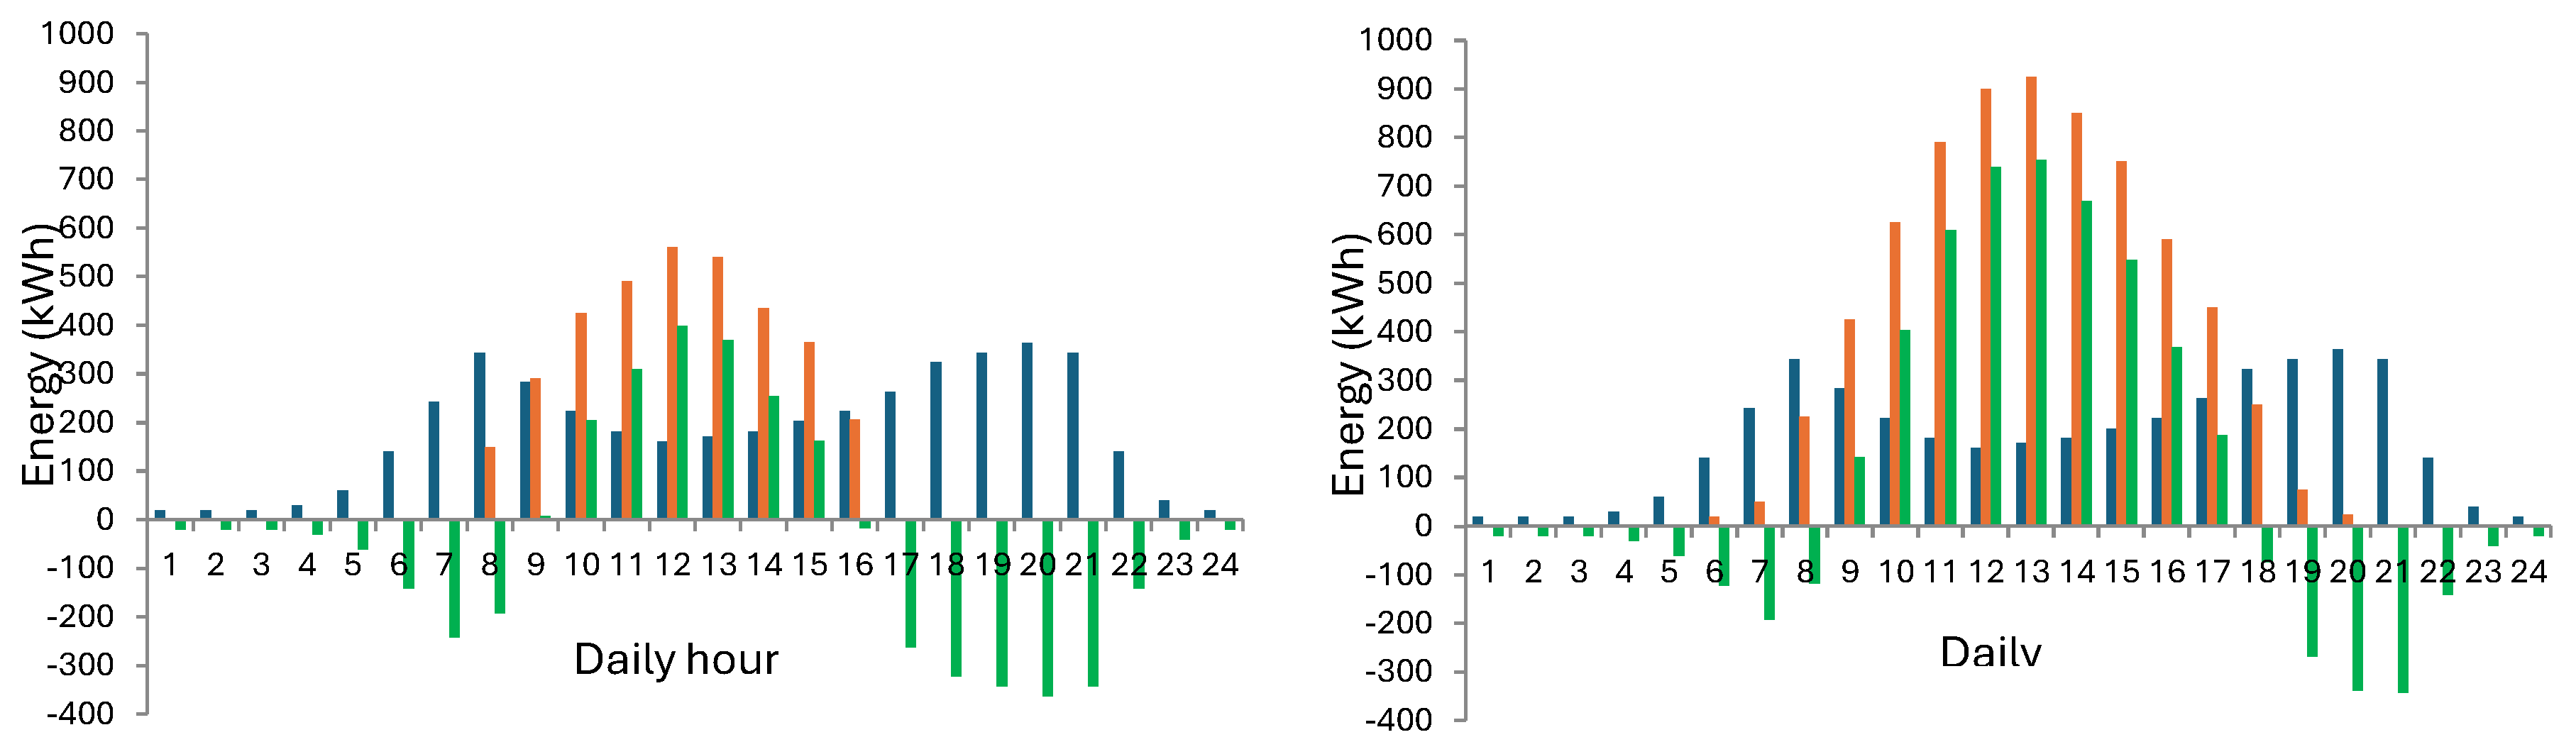
Figure 18.
Schematic view of the battery block.
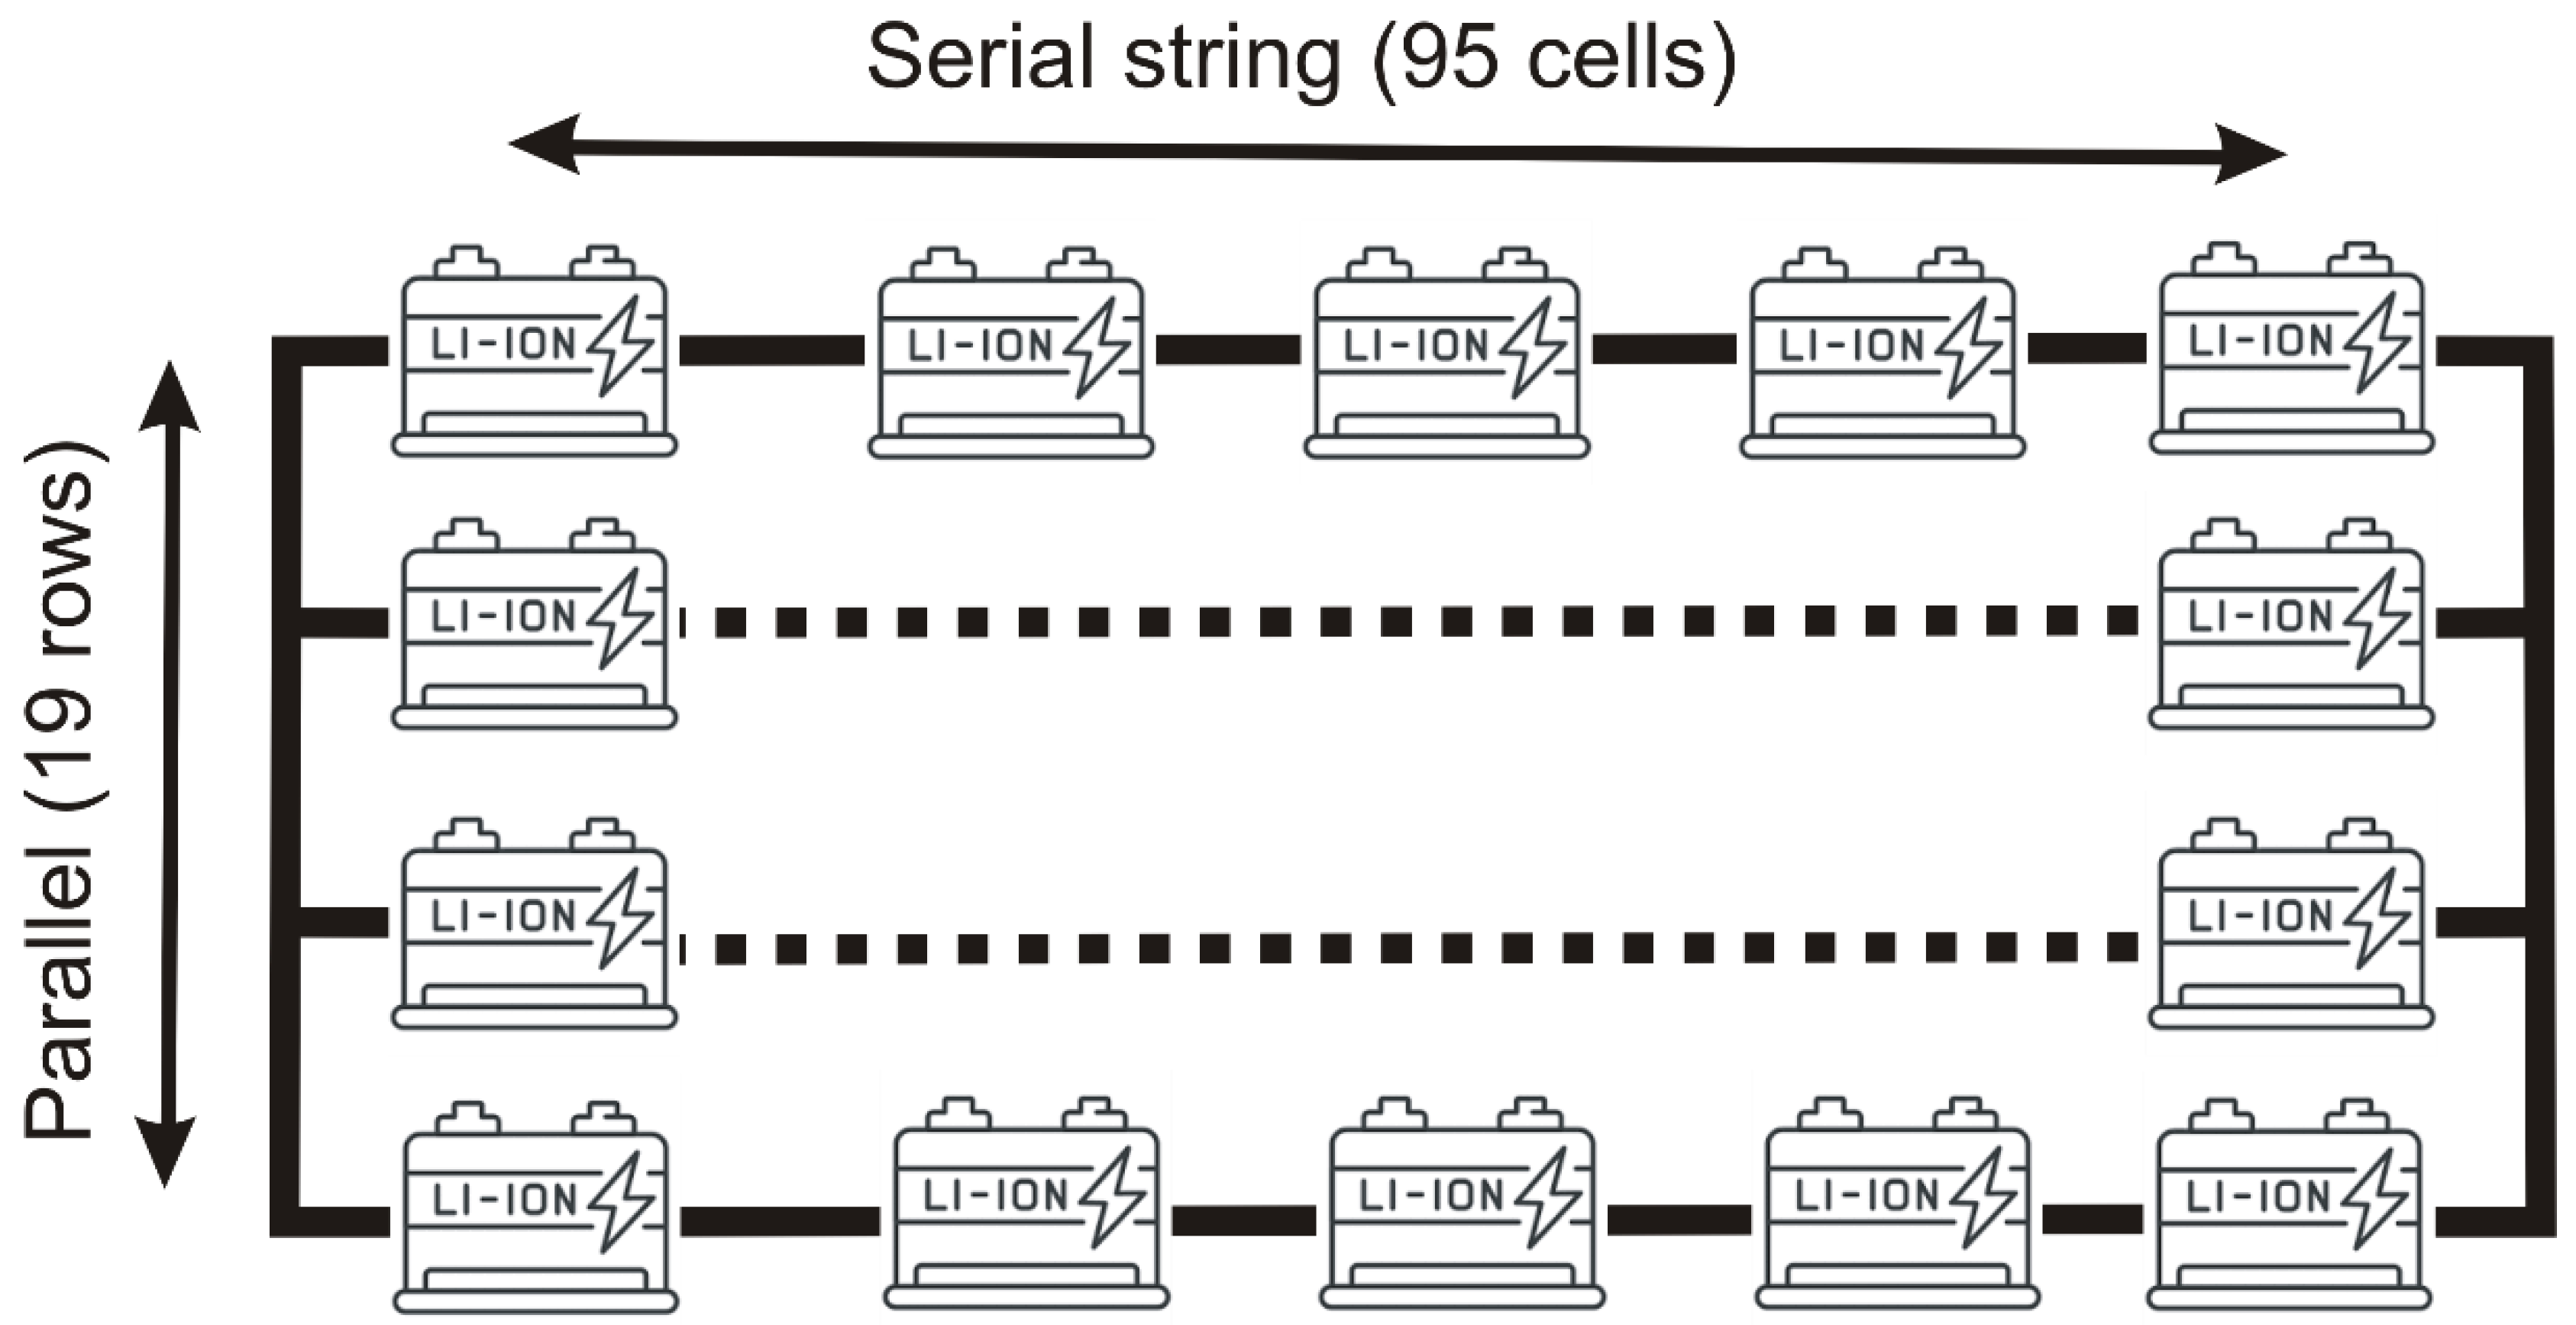
Figure 19.
Engineering design of the storage unit.
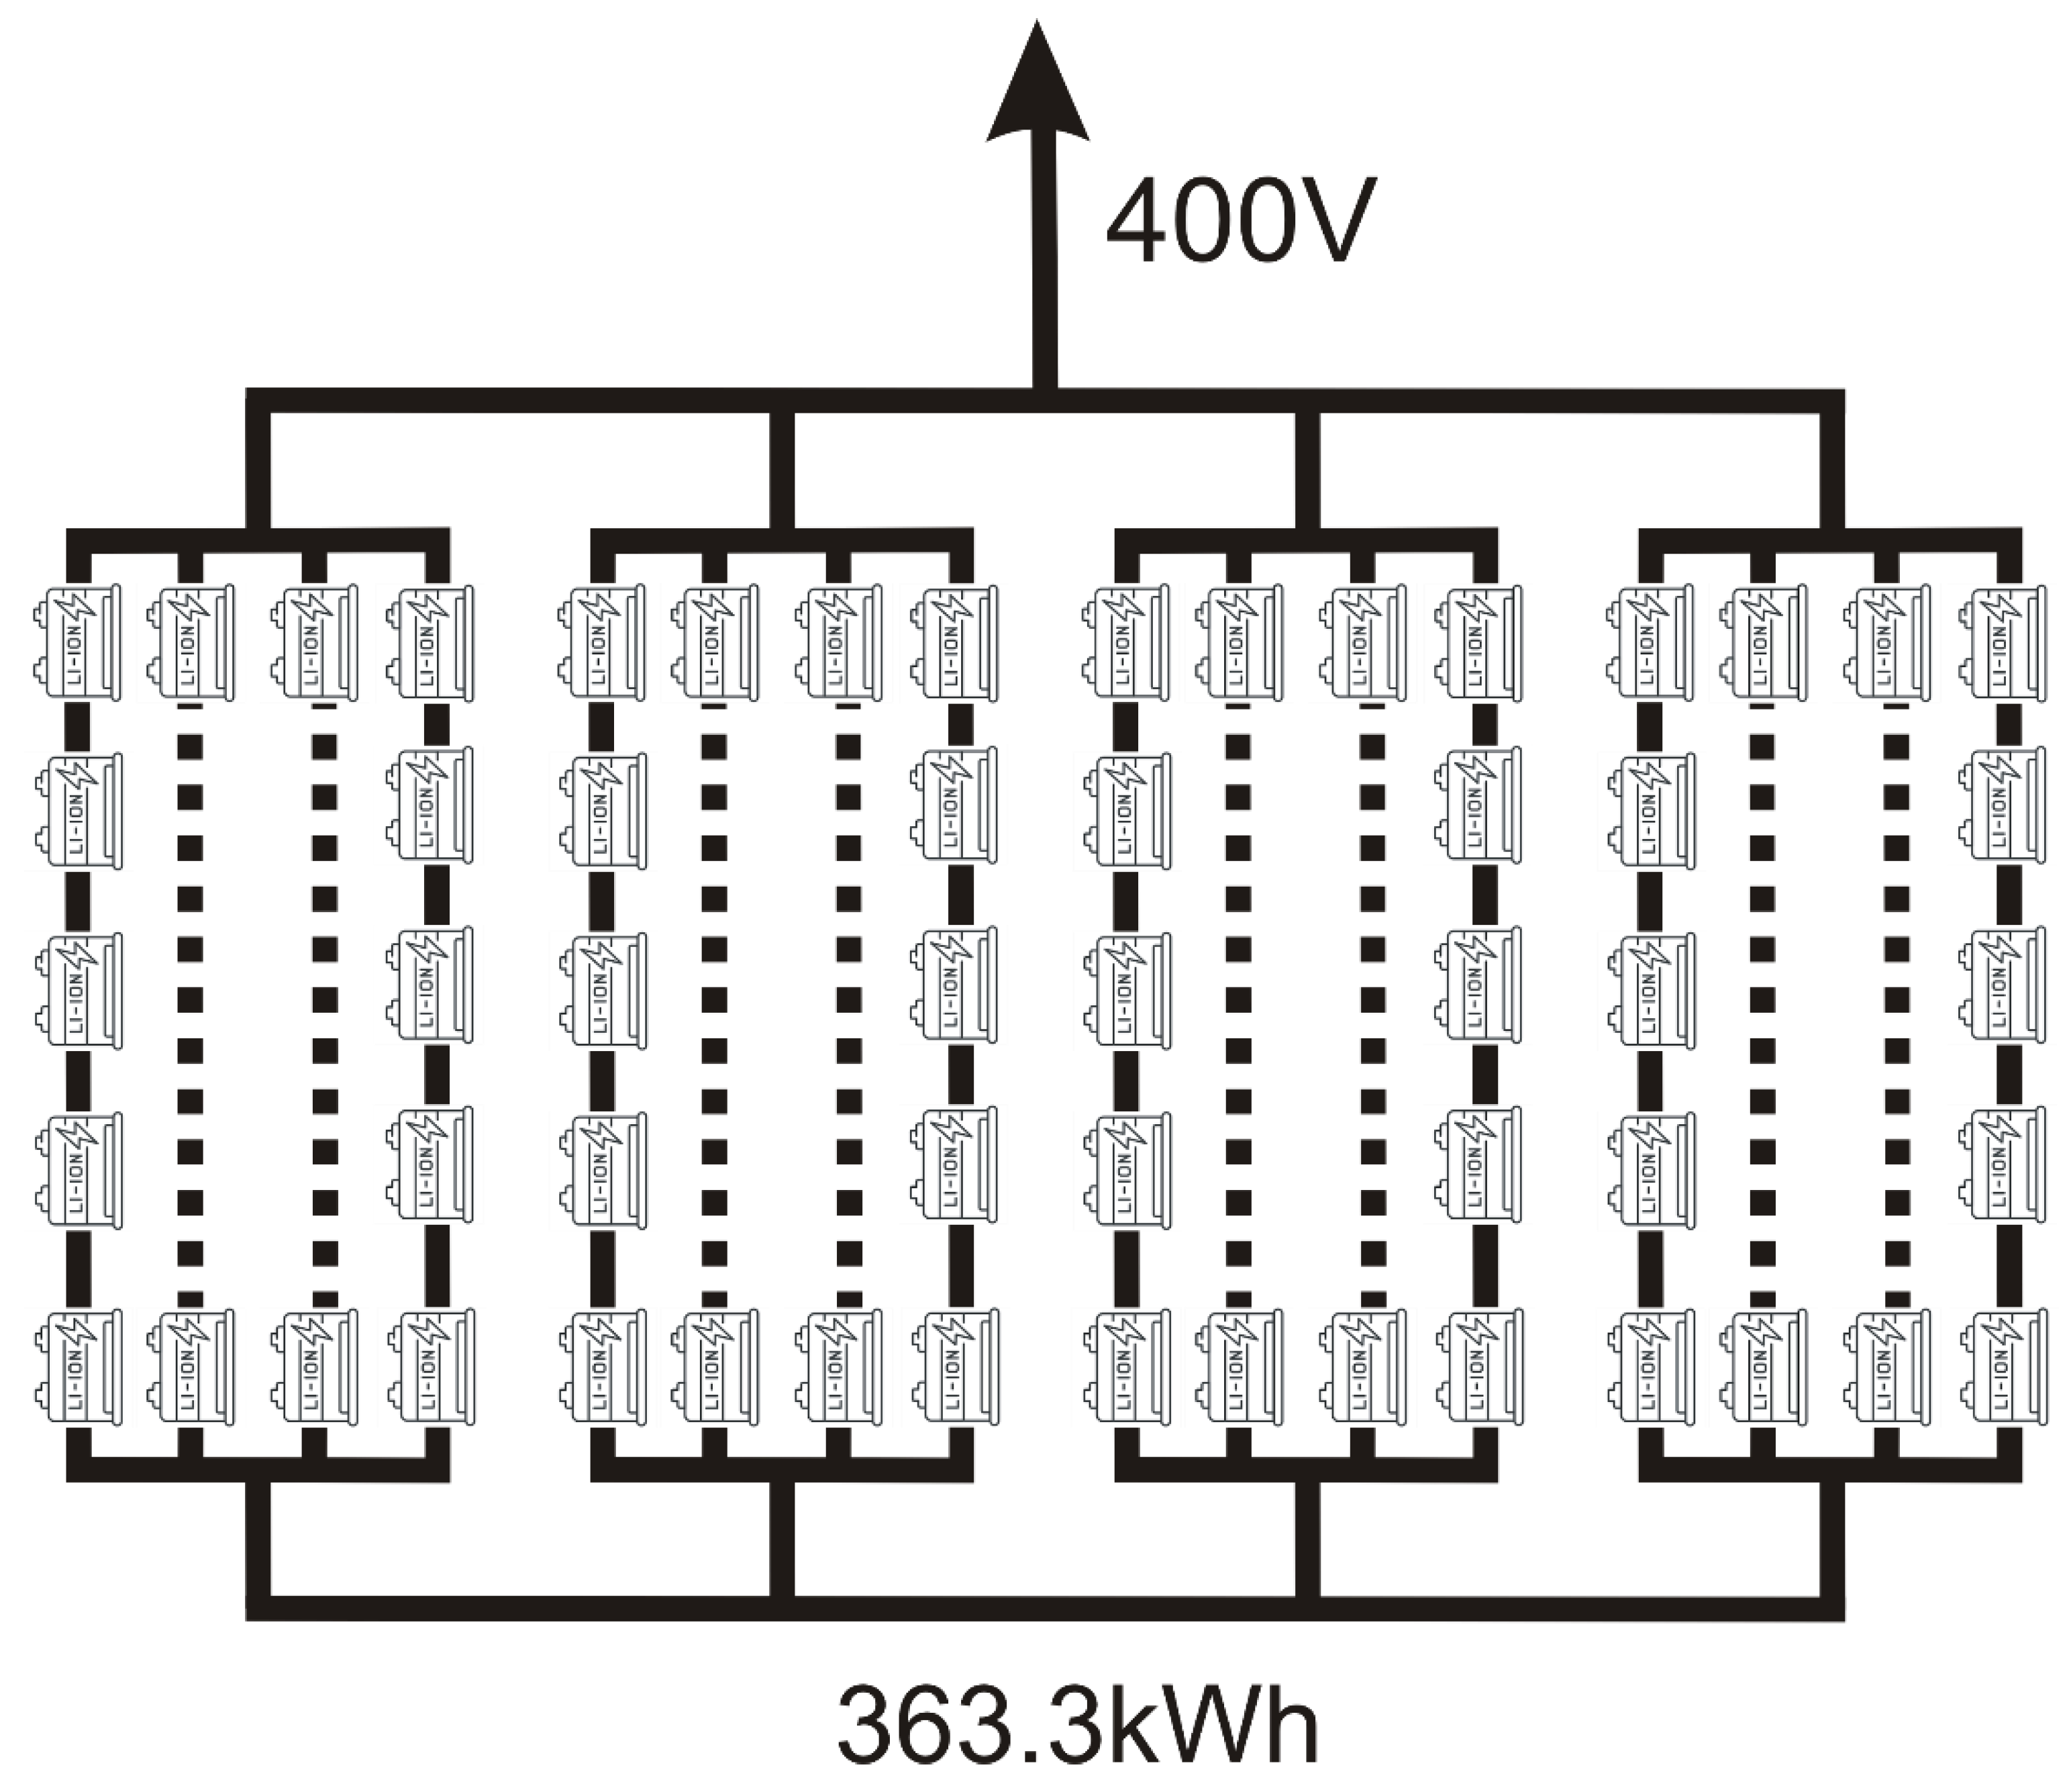
Figure 20.
Charging process protocol flow rate.
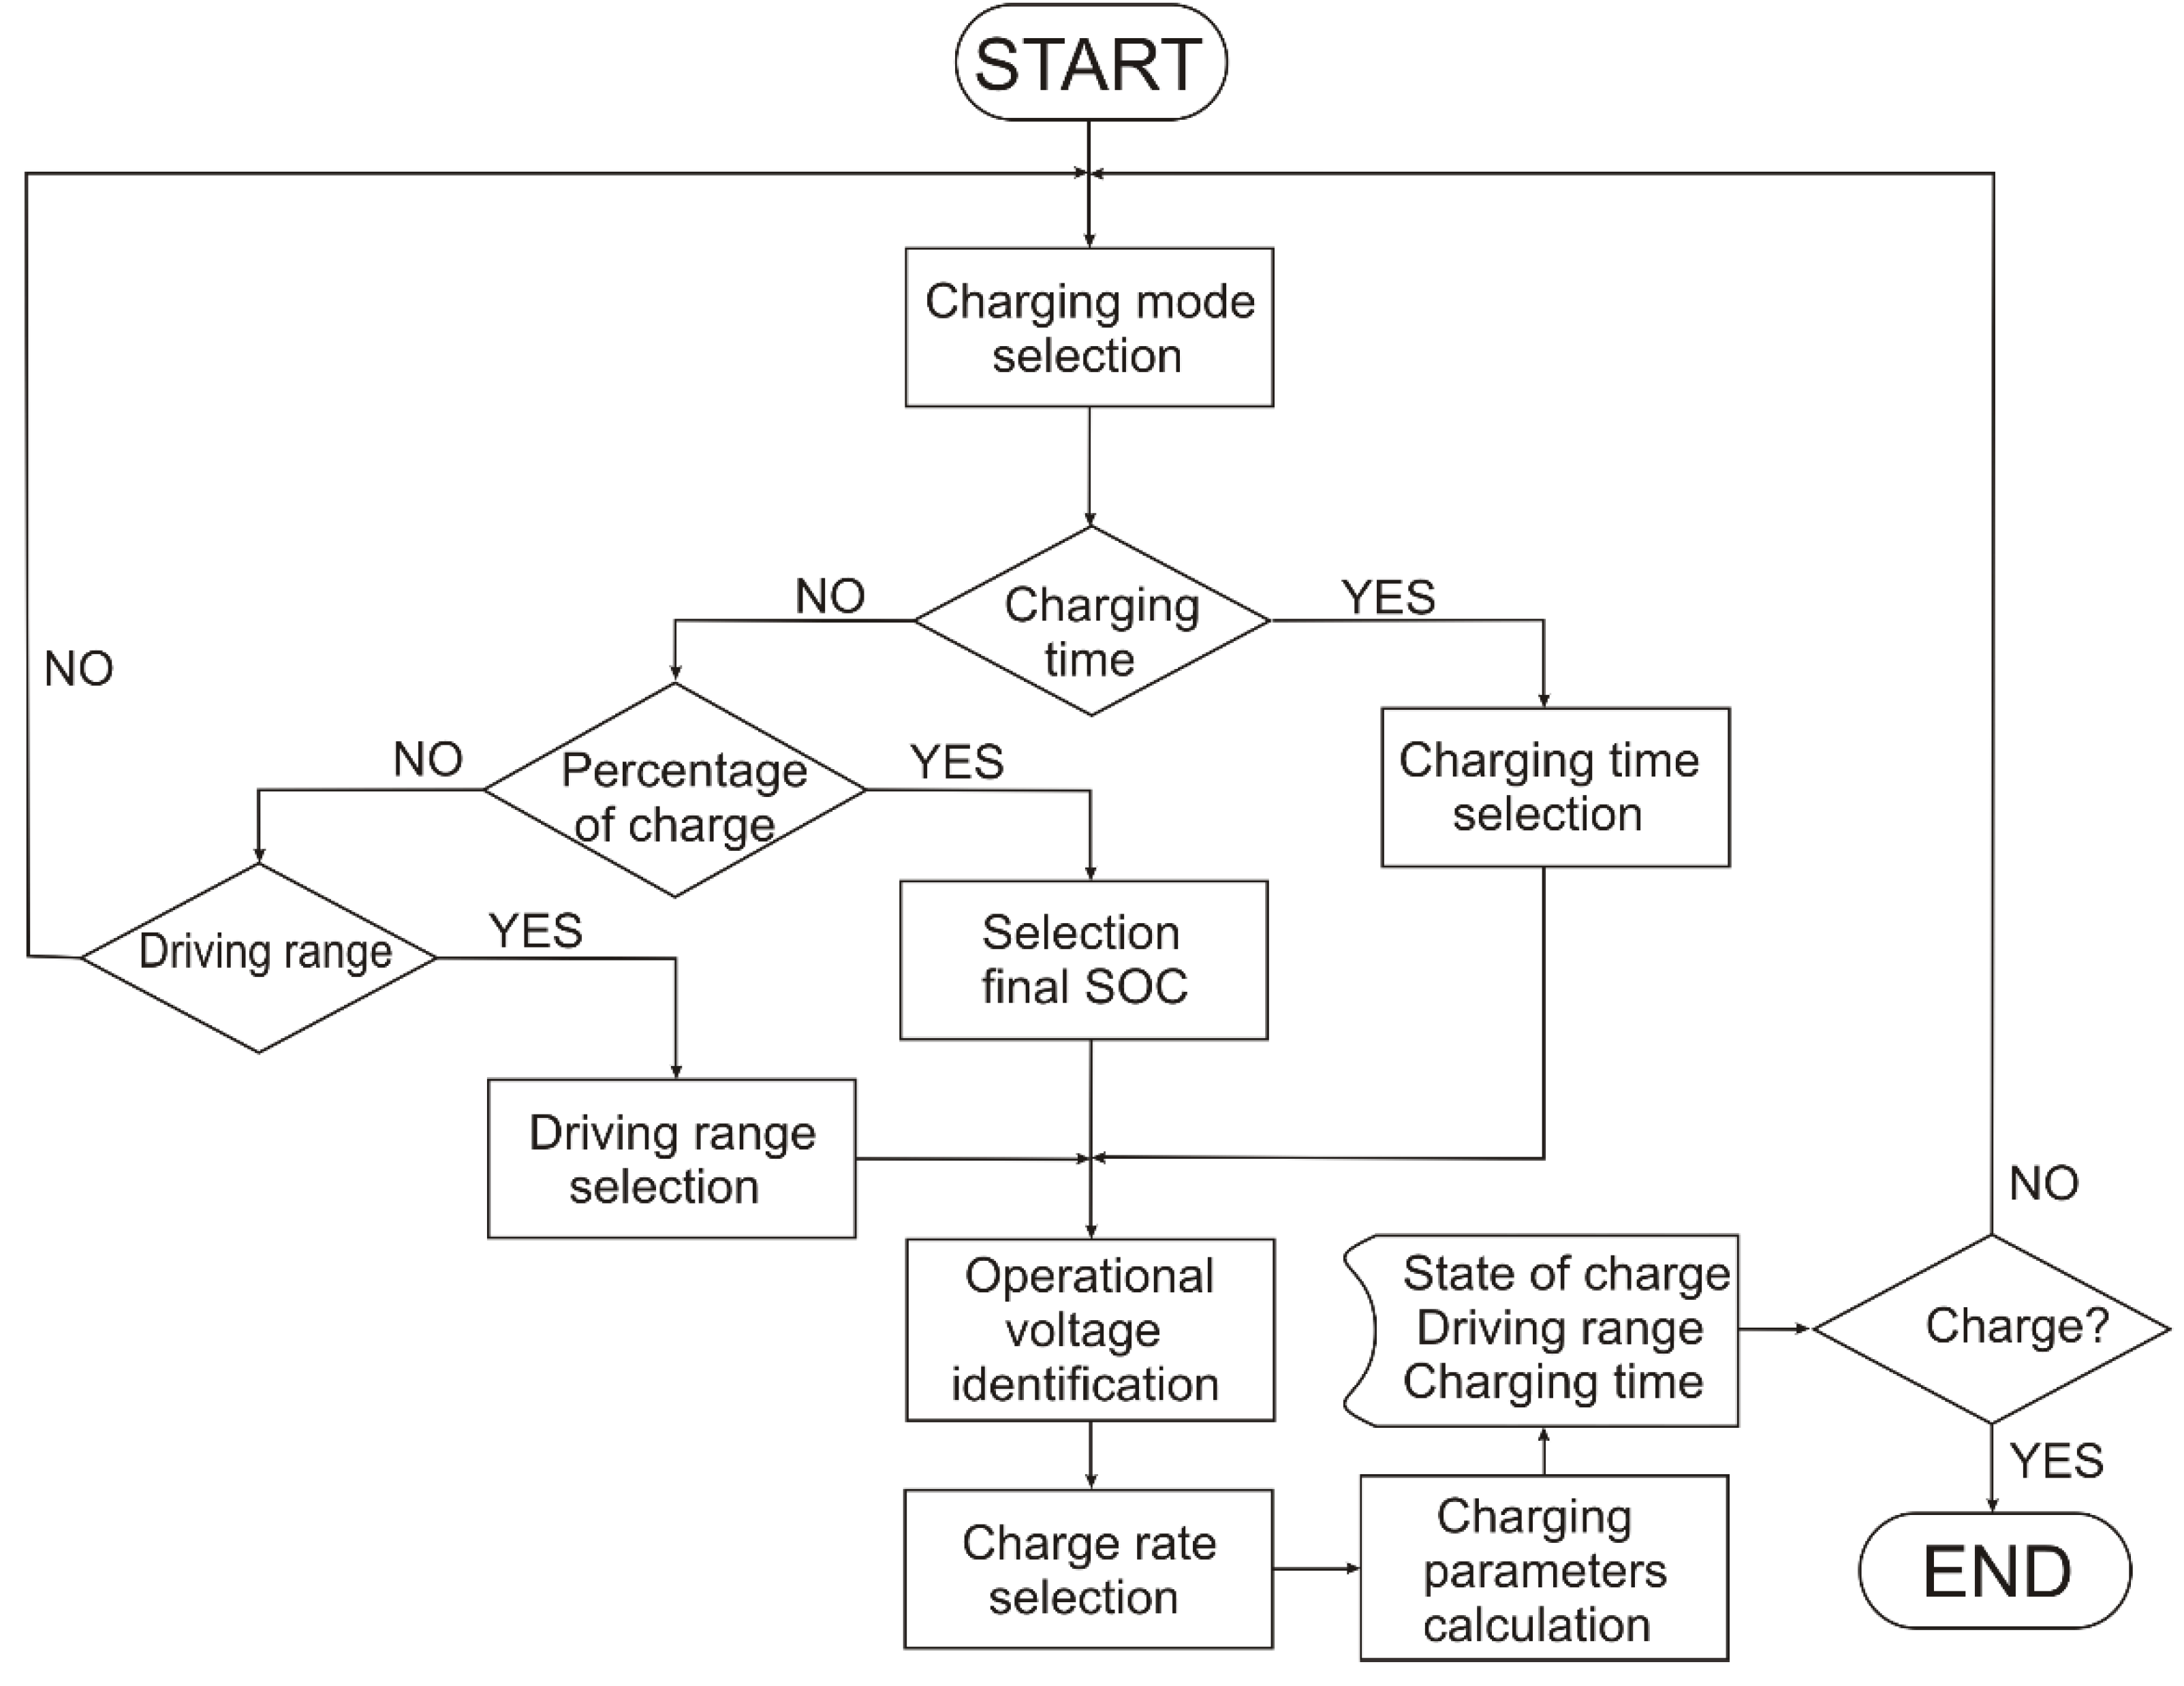

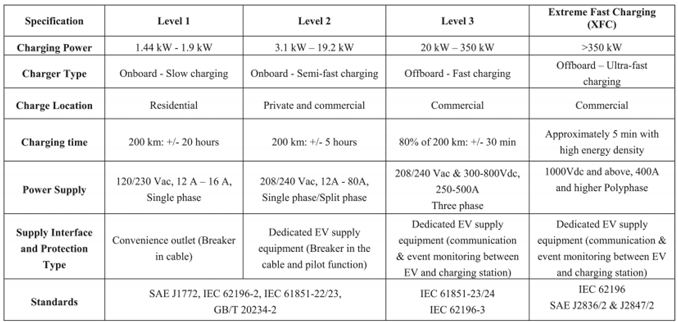
Table 2.
Estimated average monthly and daily solar radiation in the selected location.
| Month | Monthly average (kWh/m2) | Daily average (kWh/m2) |
| January | 112,13 | 3,74 |
| February | 150,45 | 5,02 |
| March | 140,02 | 4,67 |
| April | 145,05 | 4,84 |
| May | 192,73 | 6,42 |
| June | 195,55 | 6,52 |
| July | 226,09 | 7,54 |
| August | 222,10 | 7,40 |
| September | 178,51 | 5,95 |
| October | 147,50 | 4,92 |
| November | 113,85 | 3,80 |
| December | 99,48 | 3,32 |
Table 3.
Daily energy demand (charging station).
| Charging point number | Maximum power supply (kW) | Daily energy demand (kWh) |
| 1 | 22 | 308 |
| 2 | 48 | 672 |
| 3 | 96 | 1344 |
| 4 | 180 | 2520 |
| Total | 346 | 4844 |
Table 4.
PV panel technical characteristics [28].
Table 4.
PV panel technical characteristics [28].
| Parameter | Value |
| Maximum Power | 460 Wp |
| Voltage at maximum power | 35.10 V |
| Current at maximum power | 13.11 A |
| Open Circuit Voltage | 41.65 V |
| Short Circuit Current | 13.99 A |
| Efficiency | 21.25 |
| Power tolerance | 0/+5 |
| PV array maximum voltage | DC 1.500 V |
Table 5.
PV panel working temperature.
| Condition | Value |
| Maximum | 69.8º C |
| Minimum | 8.9º C |
Table 6.
PV panel electric operating parameters.
| Parameter | Value |
| Voltage (V) | 46.00 |
| Current (A) | 9.65 |
| Power (W) | 444 |
Table 7.
Electric characteristics of the charging station.
| Power (kW) | 22 | 48 | 96 | 180 | ||||||||
| Voltage (V) | 360 | 400 | 480 | 360 | 400 | 480 | 400 | 480 | 800 | 400 | 480 | 800 |
| Current (A) | 61 | 55 | 45 | 133 | 120 | 100 | 266 | 200 | 60 | 450 | 375 | 225 |
Table 8.
PV power plant characteristics (per block).
| Configuration | PV array blocks | PV panels number | Serial string number | Parallel row number | Output voltage (V) | Output current (A) | Global output power (kW) |
| A | 5 | 783 | 18 | 44 | 828 | 424.6 | 351.6 |
| 1 | 90 | 18 | 3 | 828 | 28.95 | 24 | |
| B | 5 | 792 | 18 | 46 | 828 | 443.9 | 367.5 |
Table 9.
Wire sizing for the charging points.
| Power (kW) | 22 | 48 | 96 | 180 | ||||||||
| Voltage (V) | 360 | 400 | 480 | 360 | 400 | 480 | 400 | 480 | 800 | 400 | 480 | 800 |
| Current (A) | 61 | 55 | 45 | 133 | 120 | 100 | 266 | 200 | 60 | 450 | 375 | 225 |
| Section (mm2) | 25 | 25 | 25 | 60 | 50 | 35 | 150 | 120 | 25 | 300 | 240 | 120 |
| % losses in 5m | 0.8 | 0.7 | 0.5 | 1.38 | 1.34 | 1.33 | 2.21 | 2.24 | 1.34 | 3.15 | 2.73 | 1.97 |
Disclaimer/Publisher’s Note: The statements, opinions and data contained in all publications are solely those of the individual author(s) and contributor(s) and not of MDPI and/or the editor(s). MDPI and/or the editor(s) disclaim responsibility for any injury to people or property resulting from any ideas, methods, instructions or products referred to in the content. |
© 2024 by the authors. Licensee MDPI, Basel, Switzerland. This article is an open access article distributed under the terms and conditions of the Creative Commons Attribution (CC BY) license (http://creativecommons.org/licenses/by/4.0/).
Copyright: This open access article is published under a Creative Commons CC BY 4.0 license, which permit the free download, distribution, and reuse, provided that the author and preprint are cited in any reuse.


