Submitted:
01 November 2025
Posted:
03 November 2025
You are already at the latest version
Abstract
This cross-sectional study investigated the associations between the acute phase proteins (APP) serum amyloid A (SAA) and haptoglobin (Hp), herd-level factors, and the seroprevalence of respiratory pathogens in Estonian dairy herds. Serum samples were analysed from 938 cows (95 herds) and 921 heifers (94 herds). Seroprevalence was tested for bovine herpesvirus 1 (BHV-1), bovine respiratory syncytial virus (BRSV), bovine parainfluenza virus 3, bovine viral diarrhoea virus, bovine coronavirus, bovine adenovirus, and Mycoplasma bovis (M. bovis). Farm visits included questionnaires on herd management practices. Linear random-intercept regression models showed higher serum SAA concentrations in cows from farms with BHV-1 seroprevalence of >50% and on BRSV- positive farms (p < 0.05), while farms employing a veterinarian had lower serum SAA concentrations. Cows had higher serum Hp concentrations in M. bovis-positive herds (p = 0.030). In heifers, serum SAA concentrations increased with low to moderate BHV-1 seroprevalence, decreased with higher M. bovis seroprevalence, and were higher in free-stall or mixed housing compared to tie-stall housing. Heifers’ serum Hp concentrations were lower in BHV-1-positive herds but higher in herds with breeding bulls and larger herd sizes. To conclude, APP could offer valuable insights into herd infectious disease status, supporting their use in herd-level monitoring.
Keywords:
bovine respiratory disease
; acute phase proteins
; heifers
; cows
1. Introduction
Bovine respiratory disease (BRD) represents a significant health concern in cattle industry, giving rise to substantial morbidity, mortality, and economic challenges. Moreover, it exerts adverse effects on growth and feed conversion rate [1]. The disease occurs in cattle across all age groups and commonly involve both viral and bacterial pathogens. Environmental stressors, management practices, and weakened host defences also play significant roles in its occurrence [2,3].
Over the years, several viruses have been associated with BRD, including bovine herpesvirus 1 (BHV-1), bovine respiratory syncytial virus (BRSV), bovine parainfluenza virus 3 (PIV-3), bovine viral diarrhoea virus (BVDV), bovine coronavirus (BCV), and bovine adeno-virus (BAV) [4,5]. Major viral respiratory pathogens, such as BHV-1 and BRSV [6,7], along with Mycoplasma spp. [8], generally trigger clinical respiratory disease by damaging lung tissues, making animals more susceptible to secondary bacterial infections [9]. These viral pathogens, together with bacterial pathogens like Pasteurella multocida [10] and Mannheimia haemolytica [11], have been linked to increased serum acute phase proteins (APP) concentrations in cattle in both naturally occurring respiratory infections and experimental trials.
APP are components of the broader systemic reaction known as the acute phase response which can be triggered during infectious and inflammatory processes [12]. Haptoglobin (Hp) and serum amyloid A (SAA) are important bovine APP whose concentrations increase in the blood during acute phase response [13]. While serum SAA concentration rise rapidly during acute rather than chronic inflammation [14], serum Hp concentration increases more slowly and is linked to the severity of the disease and the presence of bacterial pathogens invading the respiratory tract [6,13].
APP as diagnostic inflammatory markers and mediators of immune response are of great importance both in humans and production animals. In humans, APP such as C-reactive protein and SAA are widely used as biomarkers to diagnose and monitor the progress of inflammatory conditions, particularly in atherosclerosis and cardiovascular diseases [15]. In production animals, SAA and Hp can reflect the overall herd health and welfare status of cows [11,16] whereas in pigs, Hp, C-reactive protein, and SAA have been identified as sensitive indicators of infection [17].
As dairy operations grow larger globally, there is an increasing need for tests to assess overall herd health and welfare. Estonian dairy cattle herds, where BHV-1, BVDV, BRSV and Mycoplasma bovis (M. bovis) are endemic [18], offer an ideal population for studying co-infections of respiratory pathogens. Moreover, the majority of Estonian dairy herds are large-scale with intensive production systems [18]. These factors make it feasible to investigate how circulation of respiratory pathogens interacting with farm management practices affect APP profiles in cows and heifers, which can offer clarity into the role of different pathogens and management approaches in herd health and welfare.
Thus, the objective of this study was to identify the relationship between infection prevalence and various farm level factors including management practices, and their associations with serum APP levels in dairy cattle.
2. Material and Methods
2.1. Study Design
This cross-sectional study is based on samples collected during a study by [19], conducted between September 2006 and April 2008. The study aimed to estimate herd-level and within-herd prevalence of BHV-1 and BVDV, and to identify risk factors for BHV-1 infection in Estonian dairy herds. The study sample consisted of 103 herds with 20 or more dairy cows (Figure 1). These herds were selected randomly from different size categories (20–99; 100–199; 200–399; ≥400 cows). In each of the selected herds, blood samples from a representative sample (sample size considerations are presented in Table 1) were collected to estimate within herd seroprevalence of BHV-1 in cows and young stock older than 6 months. In total, 9,637 blood samples were taken. Additionally, during the herd visits, questionnaires were filled out to gather comprehensive herd-level data to understand the risk factors related to farming practices.
Blood (serum) samples collected from individual animals were later used for testing for other BRD pathogens and for APP analysis for the present study. The number of samples tested for each pathogen and sample size considerations are presented in Table 1.
Of the 103 sampled herds, a subset of 95 herds was used for APP analysis by testing 10 randomly selected serum samples from each herd. Herds were eligible if they had at least 10 heifers (>6 months old; n = 94 herds) and at least 10 cows (n = 95 herds) with usable serum samples (Figure 1). Both heifers and cows were tested from the same herds, except for one herd where only cows were sampled because the heifer selection criterion was not met.
2.2. Sampling of Animals and Sample Analysis
Blood samples were collected from the coccygeal vein of animals (> 6 months of age) using vacuum tubes with clotting activator (Vacuette, Austria). Serum samples were stored at room temperature for 24 h before transport to the National Centre for Laboratory Research and Risk Assessment (LABRIS) for immediate serology for BHV-1 and BVDV. The left-over serum sample aliquots were stored at -20°C until further analysis at Estonian University of Life Sciences (EMÜ). Serum samples initially selected for testing were screened for quality, and 31 grossly haemolysed samples were excluded (including 19 from heifers and 12 from cows). The final sample sizes for APP analysis was 921 heifers’ (average 9.8, min-max: 5-10 samples per farm) and 938 cow serum samples (average 9.9, min-max: 7-10 samples per farm). The antibody detection for selected pathogens was performed using commercial ELISA test kits listed in Table 1. All antibody analyses were performed following the manufacturer's instructions.
Serum SAA concentration was measured with a commercially available ELISA kit (Phase SAA kit, Tridelta Ltd., Ireland), according to the manufacturer’s instructions for cattle. Initially, all samples were diluted 1:1,000 (for heifers) and to 1:500 (for cattle). Highest standard curve concentrations of 150 mg/l were used. Detection limit of the kit was 0.3 mg/l.
The concentration of Hp was determined using the haemoglobin binding assay described by [22], with the modification of tetramethylbenzidine (0.06 mg/ml) used as chromogen [23]. Pooled and lyophilised aliquots of bovine acute-phase serum were used to produce standard curves for assay by serial dilution. To calibrate the assay, a bovine sample with a known Hp concentration provided by the European Commission Concerted Action Project (number QLK5-CT-1999-0153) was used. The range of the standard curve was 0.03-2.10 g/l. The intra- and inter-assay coefficients of variations were ˂11% and ˂14% for SAA and ˂12% and ˂14% for Hp, respectively.
2.3. Statistical Analysis
To understand the association between seroprevalence of respiratory pathogens, herd-level factors and APP, four linear random-intercept regression models were built, with log-transformed SAA and inverse square root-transformed Hp as outcome variables for cows and heifers. A causal diagram (Figure 2) was composed using DAGitty to identify causal relationships between variables, and potential confounders [24].
For each pathogen, the 95% confidence intervals for prevalence estimates were calculated by using Exact (Clopper-Pearson) proportion method using Stata/IC 14.2 software (StataCorp LP, College Station, TX, USA). To understand between-herd variability of serum APP concentrations, intra-class correlation coefficients (ICC) were calculated. Farm was included as a random effect in the models to account for variability across farms, assuming an exchangeable covariance structure. The within-herd prevalences of the tested pathogens were categorised into three groups (0%, 1–50%, and >50%) to perform group comparisons across herds with different infection levels and sufficient herd numbers in each group for statistical analyses; these variables were included in the models as fixed effects. For M. bovis and PIV-3, the number of herds with 0% prevalence was very low. To form three prevalence categories, a low prevalence group (0–30%) was created. The within-herd prevalences of respiratory pathogens and other herd-level factors were included as predictors. All variables considered in the model selection process are listed in Tables S3 and S4. The age of the animal was included as a continuous predictor in the models, and a squared term for age was added to the SAA models to capture non-linear relationships. Haemolysis can influence APP concentrations, thus categorised as none, slight, or marked, was included in all models to control for sample quality by including this as fixed effect. The herd size was considered as a confounder and added to the model as fixed effect to clarify associations between predictors and APP concentrations. If herd-level prevalence of a particular infection was not associated with APP, the animal-level antibody status was included in the model (based on the causal diagram; Figure 2) and retained in the models if significant.
Predictors were initially screened through univariable analyses, and those with a p-value ≤ 0.2 were considered for multivariable modelling. A step-wise backward elimination approach was used to develop the final multivariable models, assessing the significance of each predictor and systematically removing the least significant ones. The significance threshold for retaining predictors in the multivariable model was set at a p-value of ≤0.05. No significant interactions were found in any of the models.
Confounding effects of the herd factors were assessed by testing whether removing a variable led to a change of ≥15% in the coefficient estimates of other predictors. Model linearity assumptions were verified using scatter plots and normality plots of standardized residuals. All statistical analyses were conducted using Stata/IC 14.2 software.
3. Results
Serum concentrations of SAA and Hp varied between cows and heifers, with increased concentration observed in cows for both measured APP. The mean serum SAA concentration was 16.6 mg/l in cows and 8.8 mg/l in heifers, and a similar trend was observed for Hp, with mean concentrations of 0.23 g/l in cows and 0.13 g/l in heifers. Distribution of these APP with median and interquartile range are shown in Figure 3.
Herd-level and mean within-herd prevalence (%) of respiratory viruses and Mycoplasma bovis antibodies in cows and heifers are presented in supplementary Table S1 and Table S2.
According to the multivariable linear regression model, cows’ serum SAA concentrations were higher on farms with BHV-1 seroprevalence over 50% (p < 0.001; Table 2) and on farms positive for BRSV (1-50%, p = 0.038; >50%, p = 0.006; Table 2) compared to negative farms. Additionally, herd sizes of 50-99 (p = 0.006; Table 2) and >399 cows (p = 0.009; Table 2) were associated with a higher serum SAA concentration in cows, compared to small herds with less than 50 cows. SAA concentrations were lower on farms that employ their own veterinarian (Table 2). Cows’ serum Hp concentrations were increased in M. bovis positive cow herds (p = 0.030; Table 3).
Heifers’ serum concentrations of SAA were increased in herds with low to moderate seroprevalence (1-50%) of BHV-1 antibodies (p = 0.030; Table 4) compared to herds that were seronegative to BHV-1. Heifers’ serum SAA concentrations were decreased (p = 0.013; Table 4) in herds with high (>50%) seroprevalence of M. bovis antibodies compared to herds with low (0-30%) seroprevalence. Additionally, free-stall (p = 0.029) and mixed housing systems (p = 0.023) were associated with increased serum SAA concentrations in heifers compared to tie-stall housing (Table 4). Heifers’ serum Hp concentrations were decreased in herds which were positive for BHV-1 antibodies (1-50%, p = 0.040; >50%, p = 0.018; Table 5) compared to herds with heifers negative for BHV-1 antibodies. Heifers’ serum Hp concentration was increased (p = 0.038; Table 5) if a breeding bull was used with heifers in the herd. The larger number of heifers in the herd was associated with increased serum Hp concentrations (p = 0.001; Table 5).
4. Discussion
This study examined associations between serum APP concentrations in heifers and cows and the seroprevalence of respiratory pathogens in dairy herds. It also provides insight into the spread of respiratory pathogens in Estonian dairy farms at the time of sampling. The prevalence estimates and the associated disease impact on herd inflammatory status support the implementation of farm-level control measures against cattle respiratory diseases and serve as a baseline for future monitoring and comparisons.
4.1. Seroprevalence of Infections Associated with APP in Cows and Heifers
Cows from herds with a high BHV-1 seroprevalence (>50%) had increased serum SAA concentrations compared to cows from herds with low to moderate BHV-1 seroprevalence (1-50%) or those from BHV-1-negative herds. Following exposure to viral pathogens, SAA concentrations in blood rise rapidly, signalling an acute-phase response as the immune system quickly responds to the infection [7,25]. When SAA concentrations remain high for extended periods, it may indicate a more severe and sustained inflammatory response [6,7]. In herds where BHV-1 is widespread, the virus can become dormant and then reactivate, especially under stressful conditions [26]. This reactivation and shedding may lead to repeated virus circulation, driving a continuous inflammatory response that is measurable in the increased SAA concentrations in animals.
In cows, increased serum SAA concentrations were significantly lower in cows from BRSV-negative herds compared to those from herds with BRSV presence, supporting findings from earlier studies on BRSV infection and SAA [6,7]. BRSV is widespread in Europe and is one of the important causes of respiratory disease in Estonian dairy cows [27]. In previously unexposed herds, BRSV can trigger acute respiratory disease outbreaks in young and adult cattle [28]. The virus can circulate within the herd, and rapidly spread probably in case of low herd immunity, followed by temporary decline of spread in cases as immunity builds up again [27,29]. The virus induces clinical respiratory disease by damaging lung tissue and triggering a prolonged immune response [30,31] as indicated by increased SAA concentrations.
Cows in M. bovis seropositive herds had increased serum Hp concentrations. M. bovis infection in dairy cows often leads to bronchopneumonia, mastitis, and arthritis [32]. After infection, cows may become subclinical carriers, with bacteria colonizing the mucosal surfaces of the respiratory and reproductive tract, or mammary glands [33], potentially triggering an inflammatory response.
In heifers, increased serum SAA concentrations were associated with herds having low to moderate BHV-1 seroprevalence (1-50%). However, no significant difference in SAA concentrations was observed in high BHV-1 seroprevalence herds (>50%) compared to BHV-1 negative herds. This difference may reflect the dynamics of virus spread: in herds with low to moderate prevalence, there is a substantial proportion of naive animals, creating optimal conditions for viral circulation and thus higher inflammatory responses. Conversely, in high-prevalence herds (>50%), earlier widespread exposure of the virus may result in potentially reduced susceptibility over time. Since this was a cross-sectional study, samples may have been collected during the virus's latent phase, leading to lower SAA concentrations among heifers at the time of sampling.
In heifers, decreased serum Hp concentrations were associated with both low to moderate (1-50%) and high (>50%) BHV-1 seroprevalence herds. Hp binds free haemoglobin to mitigate its effects, and minor haemorrhagic injuries from respiratory infections like BHV-1 may drive this binding, reducing serum Hp concentrations [13,34]. In herds with active BHV-1 circulation, Hp binding may be more pronounced, as seen in similar studies where mild stressors like transport or minor infections led to decreased Hp concentrations [35,36].
In herds with high M. bovis seroprevalence (>50%), heifers had decreased serum SAA concentrations compared to heifers from herds with seroprevalence of 50% and less. Previous studies have shown that M. bovis antibodies can be detected in calves as young as two months with respiratory disease and transmission among young stock is likely [37,38]. Heifers can also carry M. bovis subclinically, testing positive without visible symptoms [39]. Since SAA concentration in the blood rises rapidly after respiratory infection [7], chronic or subclinical infections in the herd may not trigger a pronounced response, and serum concentrations of SAA may remain low in these herds. Additionally, the higher herd-level M. bovis seroprevalence observed in heifers in our study reflects higher respiratory disease burden in this age group than in cows (Table S2). Similar results were reported by [40], where heifers were seropositive to M. bovis in 60.0% of the herds studied, whereas cows were positive in 33.0% of the herds. In a separate study by Mõtus et al. [18] in large-scale Estonian dairy herds, 48.3 % of herds were positive to M. bovis. Moreover, differences in testing methods and clinical manifestations in M. bovis infection (respiratory in heifers, mastitis in cows; [41]) may produce different APP response.
No association was found between serum SAA or Hp concentrations in cows and heifers and the herd antibody status of BVDV, BAV, PIV-3, and BCV. This finding suggests that these pathogens may have a lesser impact on APP response in herds where BHV-1, BRSV or M. bovis are present. Similar results were reported by Nikunen et al. [10], who found no associations between the tested viruses in their study (PIV-3, BRSV, BCV, bovine adenovirus-3, and bovine adenovirus-7) and APP, despite viral seroconversions in calves; however, the results were based on individual-level seroconversion data rather than the herd level.
In both heifers and cows, higher age was associated with decreased serum SAA concentrations, while Hp concentrations showed an increase with age in heifers, and cows showed only marginal evidence of serum Hp increase with age. Therefore, age-related variation should be controlled in the model to account for its possible confounding effects.
4.2. Herd-Level Factors Associated with APP in Cows and Heifers
In our study, larger herd size (>399) was associated with increased serum SAA concentrations in cows. Large herds carry a greater risk of introducing infections to previously unexposed cows compared to smaller herds [42] because young stock is often raised separately and introduced to the main herd around the time of first calving. This practice creates a continuous influx of susceptible animals, which can sustain ongoing pathogen circulation [27]. Moreover, larger herds typically involve more frequent animal movements and group rearrangements, increasing contact between animals with varying immunity and thereby facilitating virus transmission. Frequent regrouping can also induce social and environmental stress, increasing cows´ susceptibility to infections and potentially triggering the reactivation of latent viruses [43].
The presence of a veterinarian employed on the farm was associated with decreased serum SAA concentrations in cows, likely due to the earlier detection of health issues and the implementation of more timely and effective treatments.
Heifers in free and mixed stalls had increased serum SAA concentrations compared to those reared in tie stalls. In free and mixed stalls, increased contact between animals likely facilitates the spread of respiratory pathogens. Frequent regrouping in these systems may support infection transmission, while larger group sizes and potential overcrowding can contribute to increased stress. Moreover, since serum APP concentrations are non-specific markers of inflammation [13] and can increase due to factors like physical stress, transport, and weaning [44]. Other unmeasured factors may have influenced the serum APP concentrations in heifers.
We further found that the use of breeding bulls in heifers was associated with increased serum Hp concentrations. The presence of breeding bulls may cause more stress for heifers compared to artificial insemination [45]. While no specific studies comparing Hp concentrations between breeding methods were found, the correlation between increased cortisol and Hp concentrations suggests that the heightened stress from natural mating could potentially lead to higher Hp concentrations [46]. Furthermore, the use of a breeding bulls often involves frequent regrouping, which can facilitate the spread of infections. Venereal infections, such as IBR, BVDV, and M. bovis, may also be transmitted from bull to heifer during breeding as well as between animals through contact with an infected bull [47].
A limitation of this study is the potential presence of unmeasured infections and non-infectious factors could influence APP concentrations. Also, due to the cross-sectional study design, we cannot draw any conclusions about the causal associations between the seroprevalence of respiratory pathogens and serum SAA and Hp concentrations. Furthermore, the time of seroconversion is unknown, and antibodies against certain pathogens can persist for extended periods, so seropositivity does not necessarily mean a recent infection [48].
5. Conclusions
The presence of respiratory pathogens such as BHV-1, BRSV, and M. bovis in herds, was associated with increased APP concentrations in dairy cows and heifers, indicating that herd’s infection burden can be assessed using serum APP concentrations. Moreover, cows from farms with an in-house veterinarian had lower serum SAA concentrations, whereas free or mixed-stall housed heifers showed higher serum SAA than tie-stall heifers. Serum Hp concentrations were higher in heifers from farms that used a breeding bull compared to heifers that were inseminated artificially. These results emphasize that herd-level factors can influence APP concentration, thus providing valuable insights into herd disease status and overall herd health.
Supplementary Materials
The following supporting information can be downloaded at the website of this paper posted on Preprints.org, Supplemental Table S1: Herd-level and mean within-herd prevalence (%) of respiratory viruses and Mycoplasma bovis antibodies among cows from 95 Estonian dairy farms; Supplemental Table S2: Herd-level and mean within-herd prevalence (%) of respiratory viruses and Mycoplasma bovis antibodies among heifers from 94 Estonian dairy herds; Supplemental Table S3: Herd-level (herds n = 95) categorical variables used to investigate their associations with cows’ serum amyloid A (SAA) and haptoglobin (Hp) concentrations; Supplemental Table S4: Herd-level (herds n = 94) categorical variables used to investigate their associations with heifers’ serum amyloid A (SAA) and haptoglobin (Hp) concentrations.
Author Contributions
Conceptualization, T.O.; methodology, A.T., R.K., K.M. and T.O; validation, R.K.; formal analysis, R.K., and T.O.; investigation, A.T., A.A., L.T., K.M., A.V., and T.O.; resources, K.M., A.V. and T.O.; data curation, A.T., R.K. and T.O.; writing—original draft preparation, R.K.; writing—review and editing, all authors; visualization, R.K. and T.O.; supervision, K.M., A.V. and T.O.; project administration, T.O.; funding acquisition, T.O. All authors have read and agreed to the published version of the manuscript.
Funding
This study was supported financially by the Estonian Ministry of Agriculture (Research contract 34-23) and by an institutional research project (number IUT8-1) of the Estonian Ministry of Education.
Institutional Review Board Statement
The samples used in the present study were collected as part of a survey conducted from September 2006 to April 2008 [19]. At the time of sample collection, ethical approval for blood sampling was not required in Estonia, and the European legislation on animal research implemented into national law in 2013 was not yet applicable [49]. Therefore, ethics approval was not required for the present study. However, all ethical procedures were strictly followed, and blood sample collection was carried out by an experienced veterinarian following good veterinary practice and animal welfare requirements.
Informed Consent Statement
Not applicable.
Data Availability Statement
The data that support the findings of this study are available from the corresponding author upon reasonable request.
Acknowledgments
The authors would like to thank all the participating dairy farms and their staff. We also express our gratitude to the staff of LABRIS for their assistance with the laboratory work.
Conflicts of Interest
The authors declare no conflict of interest.
References
- Nicola, I.; Cerutti, F.; Grego, E.; Bertone, I.; Gianella, P.; D’Angelo, A.; Peletto, S.; Bellino, C. Characterization of the upper and lower respiratory tract microbiota in Piedmontese calves. Microbiome 2017, 5, 152. [Google Scholar] [CrossRef] [PubMed]
- Fernández, M.; Ferreras, M.D.C.; Giráldez, F.J.; Benavides, J.; Pérez, V. Production significance of bovine respiratory disease lesions in slaughtered beef cattle. Animals 2020, 10, 1770. [Google Scholar] [CrossRef] [PubMed]
- Cuevas-Gómez, I.; McGee, M.; Sánchez, J.M.; O’Riordan, E.; Byrne, N.; McDaneld, T.; Earley, B. Association between clinical respiratory signs, lung lesions detected by thoracic ultrasonography and growth performance in pre-weaned dairy calves. Ir. Vet. J. 2021, 74, 7. [Google Scholar] [CrossRef] [PubMed]
- Callan, R.J.; Garry, F.B. Biosecurity and bovine respiratory disease. Vet. Clin. North Am. Food Anim. Pract. 2002, 18, 57–77. [Google Scholar] [CrossRef]
- Grisset, G.P.; White, B.J.; Larson, R.L. Structured literature review of responses of cattle to viral and bacterial pathogens causing bovine respiratory disease complex. J. Vet. Intern. Med. 2015, 29, 770–780. [Google Scholar] [CrossRef]
- Heegaard, P.M.; Godson, T.L.; Toussaint, M.J.; Tjørnehøj, K.; Larsen, L.E.; Viuff, B.; Rønsholt, L. The acute phase response of haptoglobin and serum amyloid A (SAA) in cattle undergoing experimental infection with bovine respiratory syncytial virus. Vet. Immunol. Immunopathol. 2000, 77, 151–159. [Google Scholar] [CrossRef]
- Orro, T.; Pohjanvirta, T.; Rikula, U.; Huovilainen, A.; Alasuutari, S.; Sihvonen, L.; Pelkonen, S.; Soveri, T. Acute phase protein changes in calves during an outbreak of respiratory disease caused by bovine respiratory syncytial virus. Comp. Immunol. Microbiol. Infect. Dis. 2011, 34, 23–29. [Google Scholar] [CrossRef]
- Maunsell, F.P.; Donovan, G.A. Mycoplasma bovis infections in young calves. Vet. Clin. North Am. Food Anim. Pract. 2009, 25, 139–177. [Google Scholar] [CrossRef]
- Guterbock, W.M. The impact of BRD: the current dairy experience. Anim. Health Res. Rev. 2014, 15, 130–134. [Google Scholar] [CrossRef]
- Nikunen, S.; Härtel, H.; Orro, T.; Neuvonen, E.; Tanskanen, R.; Kivelä, S.L.; Sankari, S.; Aho, P.; Pyörälä, S.; Saloniemi, H.; Soveri, T. Association of bovine respiratory disease with clinical status and acute phase proteins in calves. Comp. Immunol. Microbiol. Infect. Dis. 2007, 30, 143–151. [Google Scholar] [CrossRef]
- Gånheim, C.; Hultén, C.; Carlsson, U.; Kindahl, H.; Niskanen, R.; Waller, K.P. The acute phase response in calves experimentally infected with bovine viral diarrhoea virus and/or Mannheimia haemolytica. J. Vet. Med. B Infect. Dis. Vet. Public Health 2003, 50, 183–190. [Google Scholar] [CrossRef] [PubMed]
- Thielen, M.A.; Mielenz, M.; Hiss, S.; Zerbe, H.; Petzl, W.; Schuberth, H.J.; Seyfert, H.M.; Sauerwein, H. Short communication: Cellular localization of haptoglobin mRNA in the experimentally infected bovine mammary gland. J. Dairy Sci. 2007, 90, 1215–1219. [Google Scholar] [CrossRef] [PubMed]
- Petersen, H.H.; Nielsen, J.P.; Heegaard, P.M.H. Application of acute phase protein measurements in veterinary clinical chemistry. Vet. Res. 2004, 35, 163–187. [Google Scholar] [CrossRef] [PubMed]
- Horadagoda, N.U.; Knox, K.M.G.; Gibbs, H.A.; Reid, S.W.J.; Horadagoda, A.; Edwards, S.E.R.; Eckersall, P.D. Acute phase proteins in cattle: discrimination between acute and chronic inflammation. Vet. Rec. 1999, 144, 437–441. [Google Scholar] [CrossRef]
- Delanghe, J.R.; Langlois, M.R.; De Bacquer, D.; Mak, R.; Capel, P.; Van Renterghem, L.; De Backer, G. Discriminative value of serum amyloid A and other acute-phase proteins for coronary heart disease. Atherosclerosis 2002, 160, 471–476. [Google Scholar] [CrossRef]
- Saco, Y.; Bassols, A. Acute phase proteins in cattle and swine: A review. Vet. Clin. Pathol. 2023, 52 Suppl 1, 50–63. [Google Scholar] [CrossRef]
- Pomorska-Mól, M.; Markowska-Daniel, I.; Kwit, K.; Stępniewska, K.; Pejsak, Z. C-reactive protein, haptoglobin, serum amyloid A and pig major acute phase protein response in pigs simultaneously infected with H1N1 swine influenza virus and Pasteurella multocida. BMC Vet. Res. 2013, 9, 14. [Google Scholar] [CrossRef]
- Mõtus, K.; Rilanto, T.; Viidu, D.A.; Orro, T.; Viltrop, A. Seroprevalence of selected endemic infectious diseases in large-scale Estonian dairy herds and their associations with cow longevity and culling rates. Prev. Vet. Med. 2021, 192, 105389. [Google Scholar] [CrossRef]
- Raaperi, K.; Nurmoja, I.; Orro, T.; Viltrop, A. Seroepidemiology of bovine herpes virus 1 (BHV1) infection among Estonian dairy herds and risk factors for the spread within herds. Prev. Vet. Med. 2010, 96, 74–81. [Google Scholar] [CrossRef]
- Sergeant, E.S.G. Epitools Epidemiological Calculators. Ausvet. Available online: http://epitools.ausvet.com.au (accessed on 5 September 2025).
- Hove, H. Serological analysis of a small herd-sample to predict presence or absence of animals persistently infected with bovine viral diarrhoea virus (BVDV) in dairy herds. Res. Vet. Sci. 1992, 53, 320–323. [Google Scholar] [CrossRef]
- Makimura, S.; Suzuki, N. Quantitative determination of bovine serum haptoglobin and its elevation in some inflammatory diseases. Nihon Juigaku Zasshi 1982, 44, 15–21. [Google Scholar] [CrossRef] [PubMed]
- Alsemgeest, S.P.M.; Kalsbeek, H.C.; Wensing, T.; Koeman, J.P.; Van Ederen, A.M.; Gruys, E. Concentrations of serum amyloid-A (SAA) and haptoglobin (HP) as parameters of inflammatory diseases in cattle. Vet. Q. 1994, 16, 21–23. [Google Scholar] [CrossRef] [PubMed]
- Textor, J.; van der Zander, B.; Gilthorpe, M.K.; Liskiewicz, M.; Ellison, G.T.H. Robust causal inference using directed acyclic graphs: The R package dagitty. Int. J. Epidemiol. 2016, 45, 1887–1894. [Google Scholar] [CrossRef] [PubMed]
- Eckersall, P.D.; Bell, R. Acute phase proteins: Biomarkers of infection and inflammation in veterinary medicine. Vet. J. 2010, 185, 23–27. [Google Scholar] [CrossRef]
- Muylkens, B.; Thiry, J.; Kirten, P.; Schynts, F.; Thiry, E. Bovine herpesvirus 1 infection and infectious bovine rhinotracheitis. Vet. Res. 2007, 38, 181–209. [Google Scholar] [CrossRef]
- Raaperi, K.; Bougeard, S.; Aleksejev, A.; Orro, T.; Viltrop, A. Association of herd BHV-1 seroprevalence with respiratory disease in youngstock in Estonian dairy cattle. Res. Vet. Sci. 2012, 93, 641–648. [Google Scholar] [CrossRef]
- Sarmiento-Silva, R.E.; Nakamura-Lopez, Y.; Vaughan, G. Epidemiology, molecular epidemiology and evolution of bovine respiratory syncytial virus. Viruses 2012, 30, 3452–3467. [Google Scholar] [CrossRef]
- Klem, T.B.; Gulliksen, S.M.; Lie, K.I.; Løken, T.; Østerås, O.; Stokstad, M. Bovine respiratory syncytial virus: Infection dynamics within and between herds. Vet. Rec. 2013, 173, 476. [Google Scholar] [CrossRef]
- Hägglund, S.; Svensson, C.; Emanuelson, U.; Valarcher, J.F.; Alenius, S. Dynamics of virus infections involved in the bovine respiratory disease complex in Swedish dairy herds. Vet. J. 2006, 172, 320–328. [Google Scholar] [CrossRef]
- Saif, L.J. Bovine respiratory coronavirus. Vet. Clin. N. Am. Food Anim. Pract. 2010, 26, 349–364. [Google Scholar] [CrossRef]
- Dudek, K.; Nicholas, R.A.J.; Szacawa, E.; Bednarek, D. Mycoplasma bovis infections—occurrence, diagnosis and control. Pathogens 2020, 9, 640. [Google Scholar] [CrossRef]
- Rosengarten, R.; Citti, C.; Glew, M.; Lischewski, A.; Droeße, M.; Much, P.; Winner, F.; Brank, M.; Spergser, J. Host-pathogen interactions in mycoplasma pathogenesis: virulence and survival strategies of minimalist prokaryotes. Int. J. Med. Microbiol. 2000, 290, 15–25. [Google Scholar] [CrossRef] [PubMed]
- Eaton, J.W.; Brandt, P.; Mahoney, J.R., Jr.; Lee, J.T. Haptoglobin: a natural bacteriostat. Science 1982, 215, 691–693. [Google Scholar] [CrossRef] [PubMed]
- Arthington, J.D.; Eicher, S.D.; Kunkle, W.E.; Martin, F.G. Effect of transportation and commingling on the acute-phase protein response, growth, and feed intake of newly weaned beef calves. J. Anim. Sci. 2003, 81, 1120–1125. [Google Scholar] [CrossRef] [PubMed]
- Seppä-Lassila, L.; Orro, T.; Lassen, B.; Lasonen, R.; Autio, T.; Pelkonen, S.; Soveri, T. Intestinal pathogens, diarrhoea and acute phase proteins in naturally infected dairy calves. Comp. Immunol. Microbiol. Infect. Dis. 2015, 41, 10–16. [Google Scholar] [CrossRef]
- Petersen, M.B.; Wawegama, N.K.; Denwood, M.; Markham, P.F.; Browning, G.F.; Nielsen, L.R. Mycoplasma bovis antibody dynamics in naturally exposed dairy calves according to two diagnostic tests. BMC Vet. Res. 2018, 14, 258. [Google Scholar] [CrossRef]
- Penterman, P.M.; Holzhauer, M.; van Engelen, E.; Smits, D.; Velthuis, A.G.J. Dynamics of Mycoplasma bovis in Dutch dairy herds during acute clinical outbreaks. Vet. J. 2022, 283–284, 105841. [Google Scholar] [CrossRef]
- Petersen, M.B.; Pedersen, L.; Pedersen, L.M.; Nielsen, L.R. Experience of antibody testing against Mycoplasma bovis in adult cows in commercial Danish dairy cattle herds. Pathogens 2020, 9, 637. [Google Scholar] [CrossRef]
- Kaura, R.; Dorbek-Kolin, E.; Loch, M.; Viidu, D.A.; Orro, T.; Mõtus, K. Association of clinical respiratory disease signs and lower respiratory tract bacterial pathogens with systemic inflammatory response in preweaning dairy calves. J. Dairy Sci. 2024, 107, 5988–5999. [Google Scholar] [CrossRef]
- Cantón, G.; Llada, I.; Margineda, C.; Urtizbiría, F.; Fanti, S.; Scioli, V.; Fiorentino, M.A.; Louge Uriarte, E.; Morrell, E.; Sticotti, E.; Tamiozzo, P. Mycoplasma bovis-pneumonia and polyarthritis in feedlot calves in Argentina: First local isolation. Rev. Argent. Microbiol. 2022, 54, 299–304. [Google Scholar] [CrossRef]
- Waseem, S.; de Jong, E.; McCubbin, K.D.; Biesheuvel, M.M.; van der Meer, F.J.U.M.; De Buck, J.; Lhermie, G.; Hall, D.C.; Kalbfleisch, K.N.; Kastelic, J.P.; Orsel, K.; Barkema, H.W. Herd-level prevalence of bovine leukemia virus, Salmonella Dublin, and Neospora caninum in Alberta, Canada, dairy herds using ELISA on bulk tank milk samples. J. Dairy Sci. 2024, 107, 8313–8328. [Google Scholar] [CrossRef] [PubMed]
- El-Mayet, F.; Jones, C. Stress Can Induce Bovine Alpha-Herpesvirus 1 (BoHV-1) Reactivation from Latency. Viruses 2024, 16, 1675. [Google Scholar] [CrossRef] [PubMed]
- Kim, M.H.; Yang, J.Y.; Upadhaya, S.D.; Lee, H.J.; Yun, C.H.; Ha, J.K. The stress of weaning influences serum concentrations of acute-phase proteins, iron-binding proteins, inflammatory cytokines, cortisol, and leukocyte subsets in Holstein calves. J. Vet. Sci. 2011, 12, 151–157. [Google Scholar] [CrossRef] [PubMed]
- Koenneker, K.; Schulze, M.; Pieper, L.; Jung, M.; Schmicke, M.; Beyer, F. Comparative assessment of the stress response of cattle to common dairy management practices. Animals 2023, 13, 2115. [Google Scholar] [CrossRef]
- Huzzey, J.M.; Nydam, D.V.; Grant, R.J.; Overton, T.R. Associations of prepartum plasma cortisol, haptoglobin, fecal cortisol metabolites, and nonesterified fatty acids with postpartum health status in Holstein dairy cows. J. Dairy Sci. 2011, 94, 5878–5889. [Google Scholar] [CrossRef]
- Givens, M.D. Review: Risks of disease transmission through semen in cattle. Animal 2018, 12, 165–171. [Google Scholar] [CrossRef]
- Van der Poel, W.H.; Langedijk, J.P.; Kramps, J.A.; Middel, W.G.; Brand, A.; Van Oirschot, J.T. Serological indication for persistence of bovine respiratory syncytial virus in cattle and attempts to detect the virus. Arch. Virol. 1997, 142, 1681–1696. [Google Scholar] [CrossRef]
- Riigiteataja. Animal Protection Act (Consolidated version as of Jan. 1, 2023). Riigi Teataja. Available online: https://www.riigiteataja.ee/en/eli/ee/505102023013/consolide (accessed on 5 September 2025).
Figure 1.
Flowchart showing the study herd selection principles and study sample selection for acute phase proteins analysis.
Figure 1.
Flowchart showing the study herd selection principles and study sample selection for acute phase proteins analysis.
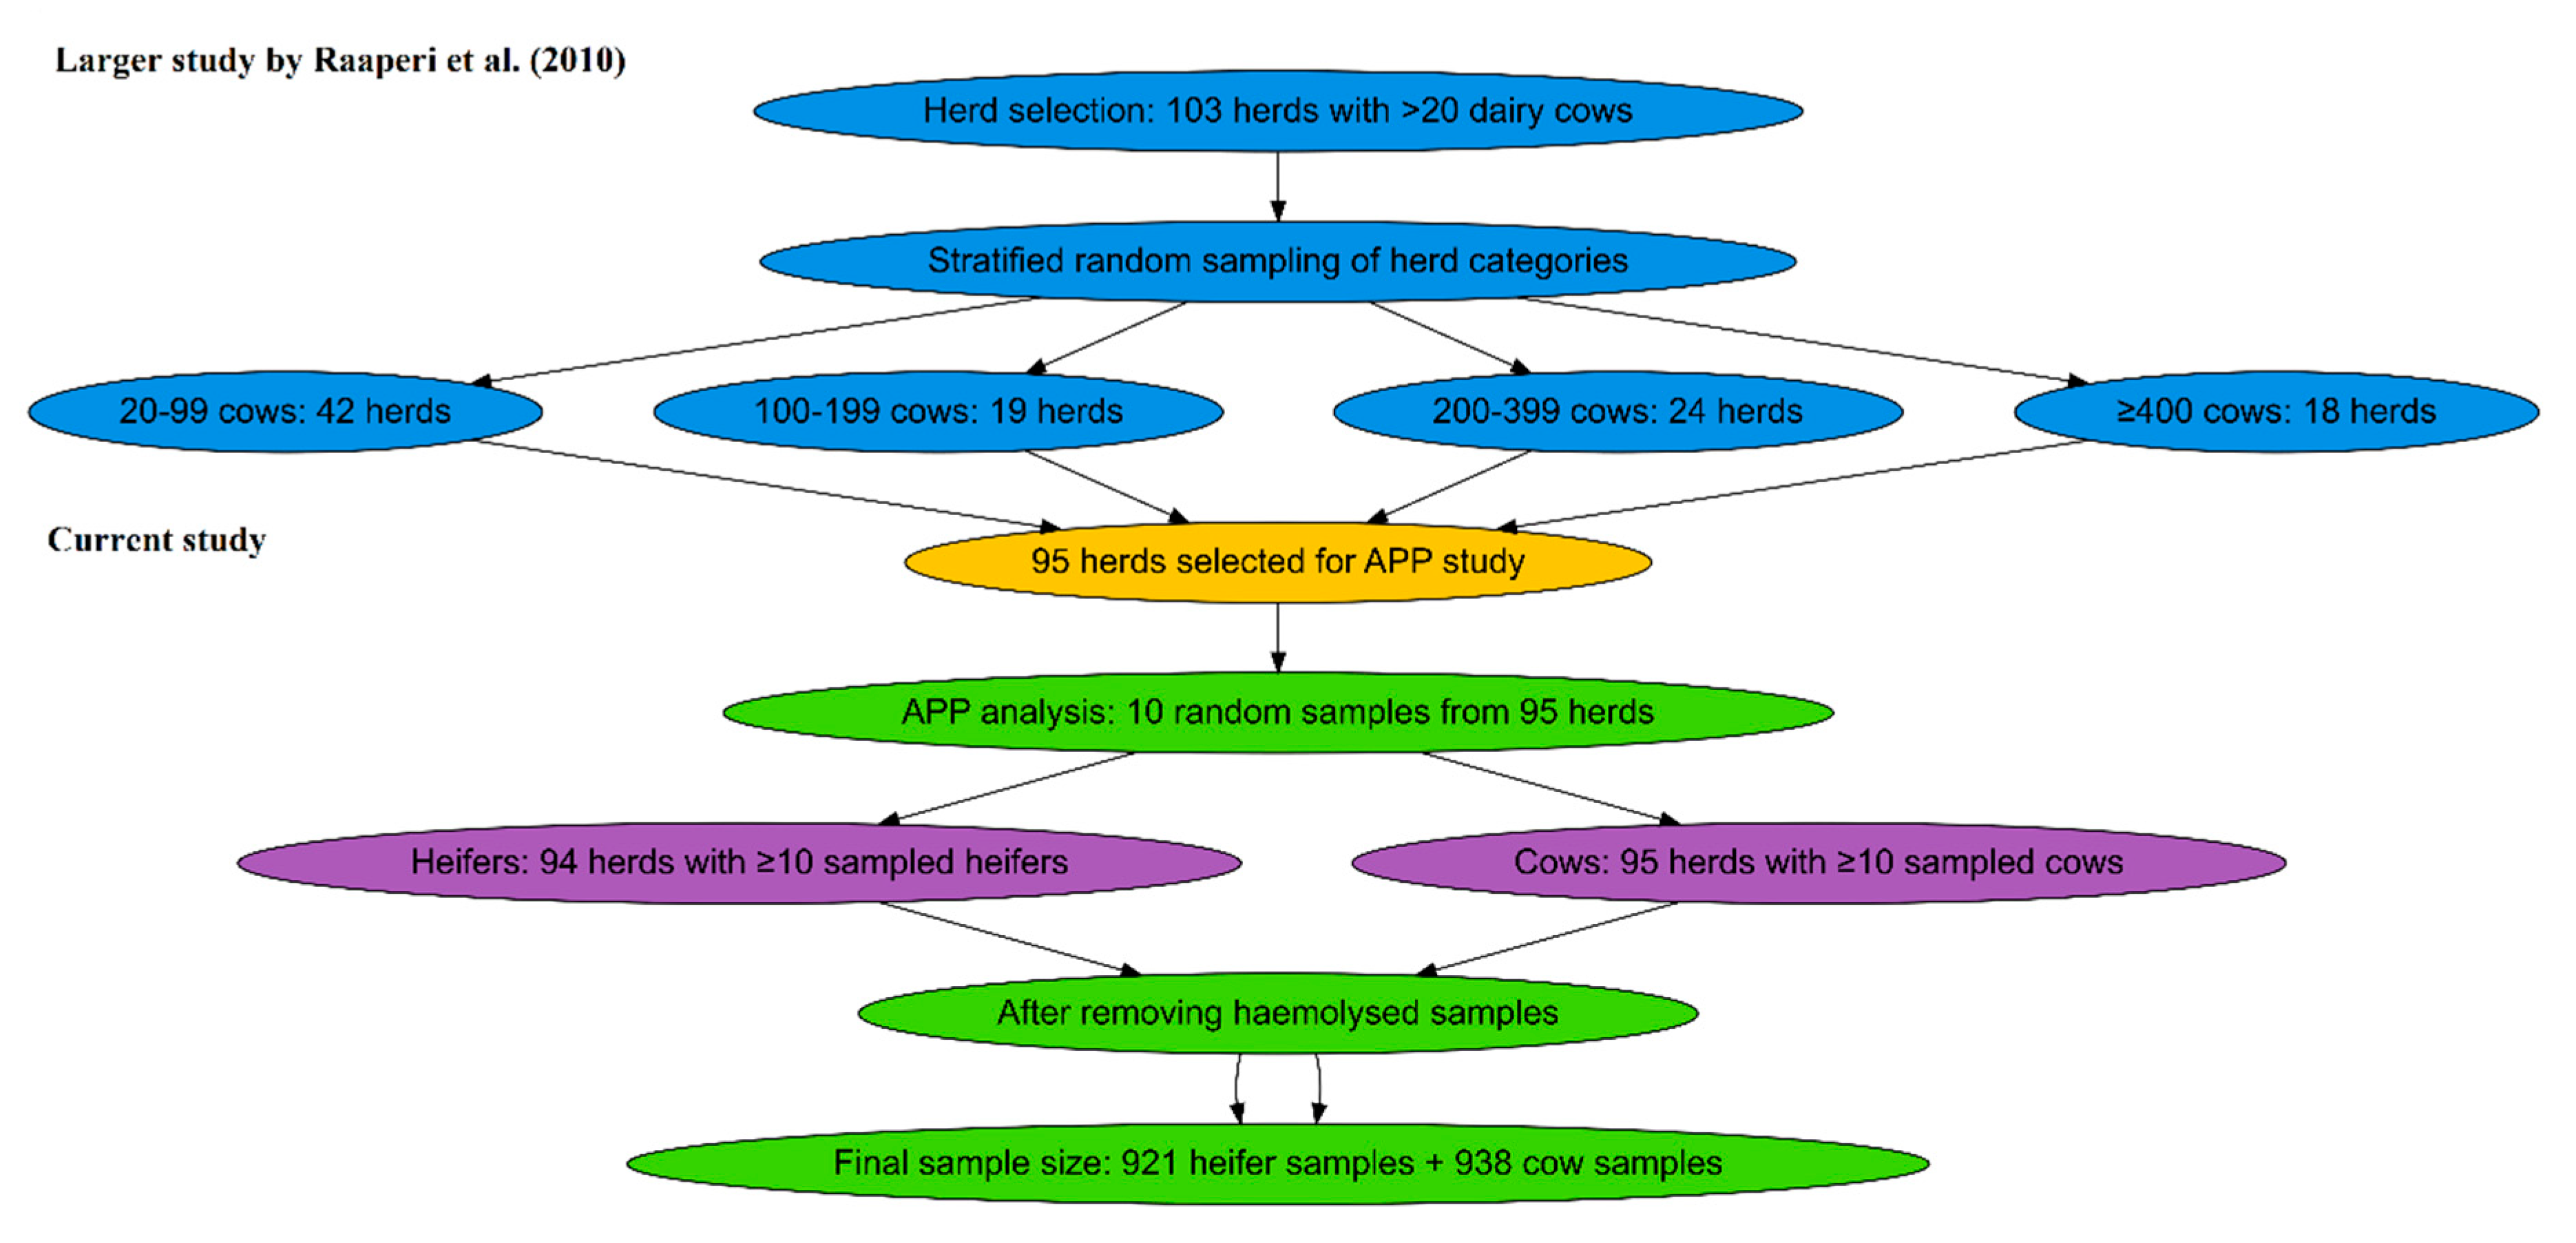
Figure 2.
Causal diagram showing the hypothesized causal relationships between herd-level factors, within-herd prevalence’s of respiratory pathogens, and APP. Age at sampling was included as an additional variable influencing APP independently (DAGitty; [24]).
Figure 2.
Causal diagram showing the hypothesized causal relationships between herd-level factors, within-herd prevalence’s of respiratory pathogens, and APP. Age at sampling was included as an additional variable influencing APP independently (DAGitty; [24]).
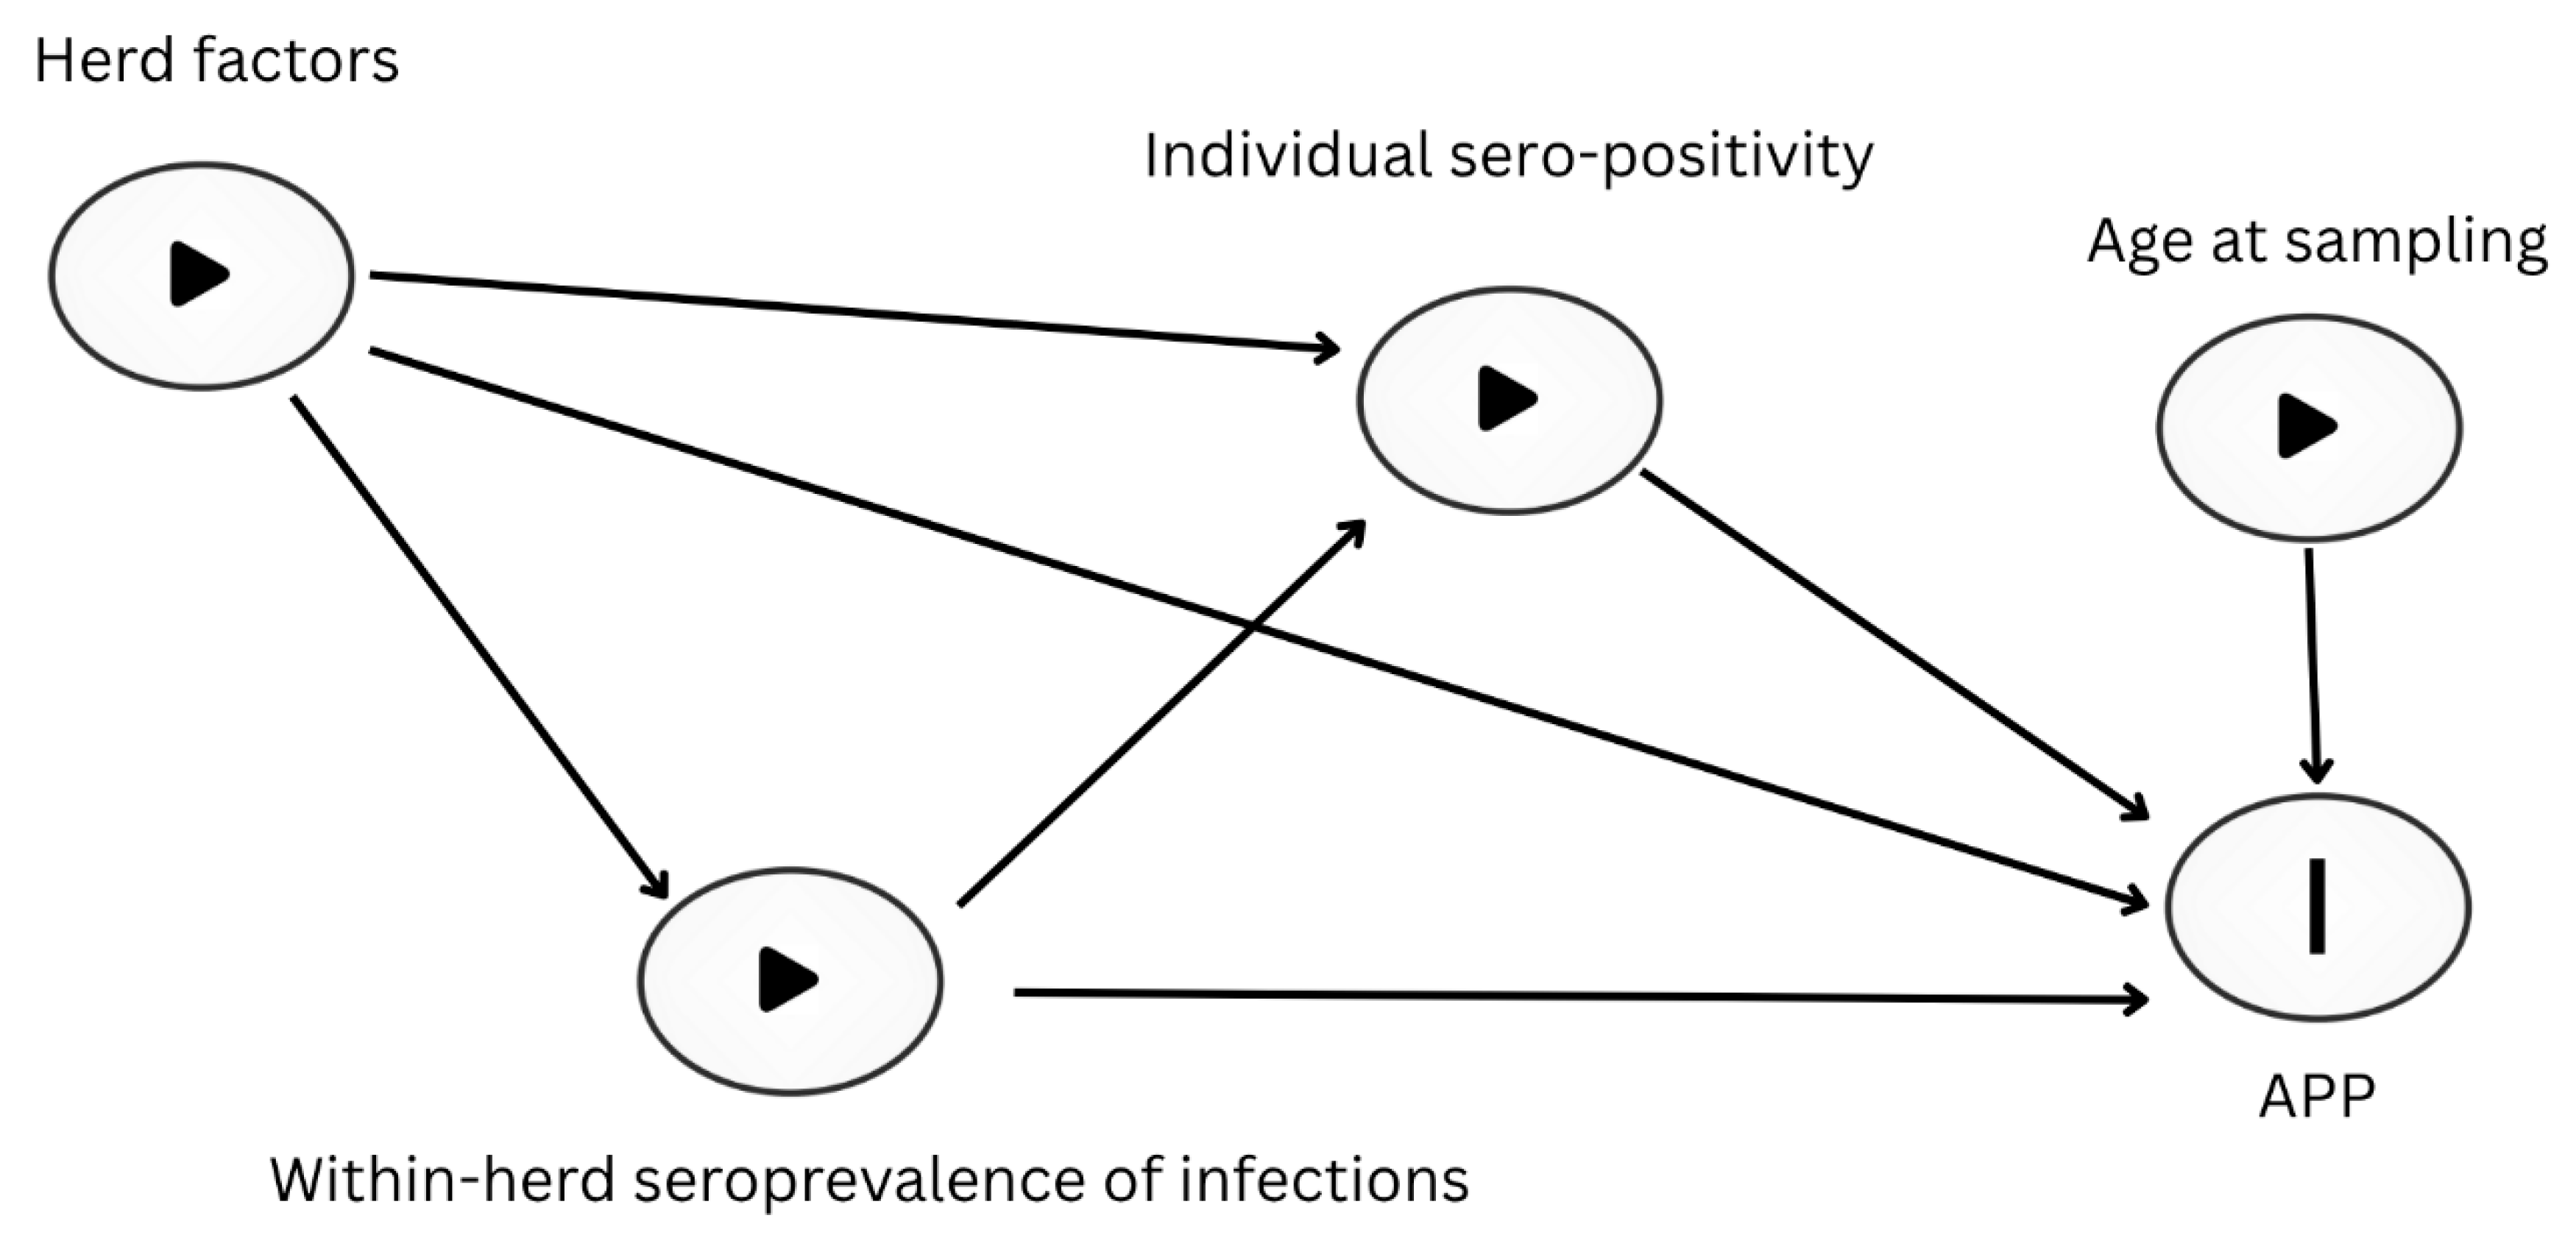
Figure 3.
Boxplots showing the serum concentrations of SAA (mg/l) and Hp (g/l) in sampled heifers and cows (n = 921 and n = 938, respectively). The boxplots show the median, interquartile range, and mean values (represented by circles).
Figure 3.
Boxplots showing the serum concentrations of SAA (mg/l) and Hp (g/l) in sampled heifers and cows (n = 921 and n = 938, respectively). The boxplots show the median, interquartile range, and mean values (represented by circles).
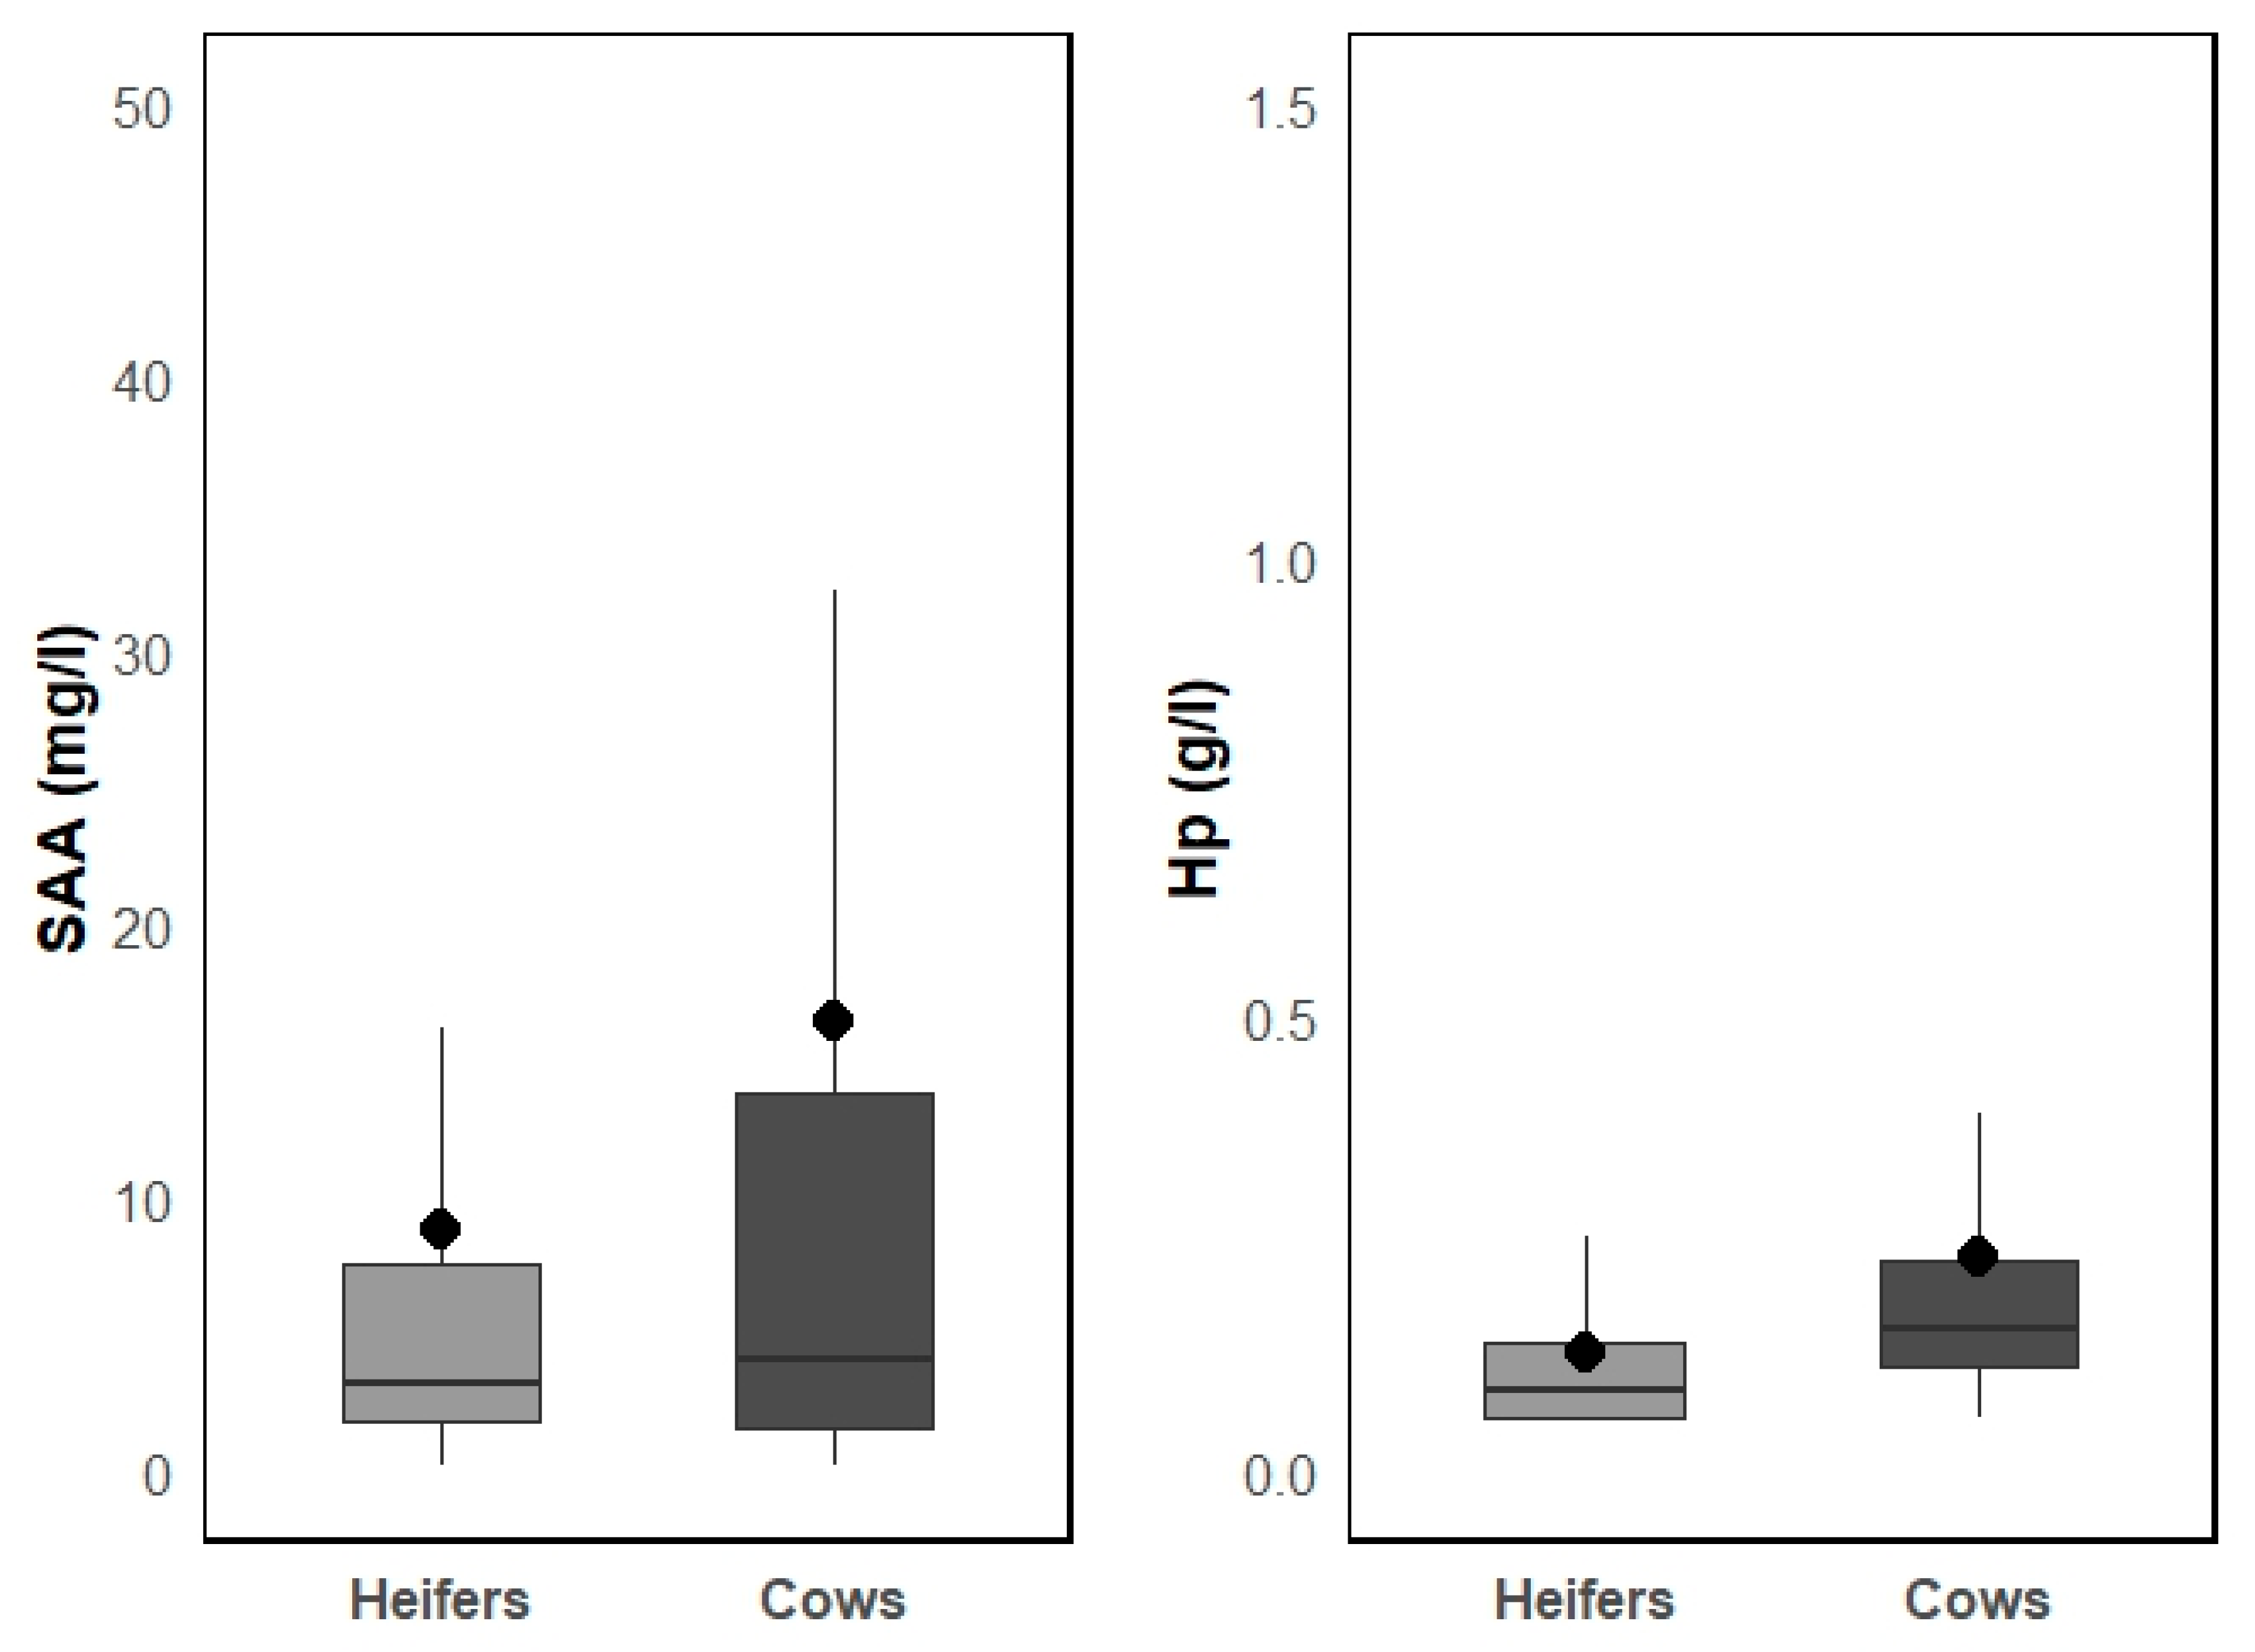

Table 1.
Serological testing of different pathogens in the study with sampling principles, sample sizes and ELISA test kits information.
Table 1.
Serological testing of different pathogens in the study with sampling principles, sample sizes and ELISA test kits information.
| Pathogen | Animals tested | Sample size considerations | Diagnostic test for antibodies (Se1; Sp2 %) |
|---|---|---|---|
| BHV-13 | Cows and heifers |
Sample size for prevalence estimation: Expected prevalence of the infection was based on prior information when available. Otherwise, expected prevalence of 50% for youngstock and 75% for cows were assumed with 10% accepted error. In previously known negative herds, sample size for detection of the infection in the herd was calculated using 5% expected prevalence, and 95% confidence level (Epitools; [20]). Average sample size per herd was 50 for cows (range: 16–116) and 55 for heifers (range: 11–237) [19]. |
IDEXX IBR gB X3 (IDEXX Laboratories) (96.0; 99.0) |
| BVDV4 | Heifers | Spot testing of the herd to define the herd BVDV status regarding persistent infection: 10 animals per herd. A herd was considered suspect for containing persistently infected animals if at least six out of 10 young animals tested positive for BVDV antibodies [21]. Detection of minimum prevalence: 28% with 95% confidence [19]. | PrioCheck BVDV Ab (Prionics AG, Switzerland) (98.0; 99.0) |
|
M. bovis5, BRSV6 |
Cows and heifers |
Sample size to estimate within-herd prevalence: Minimum detectable prevalence (design prevalence): 27% in cows, 15% in heifers with 95% confidence (Epitools3). Average sample size per herd was 9.8 for cows (min-max: 8–10) and 18.6 for heifers (min-max: 10–20). |
BIO K 260 (Bio-X Diagnostics, Belgium) (49.1; 89.6), SVANOVIR BRSV-Ab (Boehringer Ingelheim Svanova) (94.6; 100.0) |
| PIV-37, BCV8, BAV9 |
Heifers |
Sample size to estimate within-herd prevalence: Detection of minimum prevalence: 15% with 95% confidence (Epitools3). Average sample size per herd was 18.6 (min-max: 11–20). |
SVANOVIR PIV3-Ab (Boehringer Ingelheim Svanova) (95.4; 98.5), SVANOVIR BCV-Ab (Boehringer Ingelheim Svanova) (84.6; 100.0), Adenovirus-Ab (IDEXX, USA) (Not available) |
1 sensitivity; 2 specificity; 3 bovine herpesvirus 1; 4 bovine viral diarrhoea virus 5 Mycoplasma bovis; 6 bovine respiratory syncytial virus; 7 bovine parainfluenza virus 3; 8 bovine coronavirus; 9 bovine adenovirus.
Table 2.
Results of linear regression mixed model (farm included as random factor) of associations between herd-level variables and cows’ serum amyloid A (SAA) concentrations (mg/l) after logarithmical transformation. Data from 938 cows from 95 dairy farms were included (n = cows/farms).
Table 2.
Results of linear regression mixed model (farm included as random factor) of associations between herd-level variables and cows’ serum amyloid A (SAA) concentrations (mg/l) after logarithmical transformation. Data from 938 cows from 95 dairy farms were included (n = cows/farms).
| Variable | Coeff. | SE | p-value | Wald test p-value |
| Age of cows (year) | -0.242 | 0.109 | 0.027 | |
| Age of cow squared (year) | 0.023 | 0.009 | 0.011 | |
| Within-herd prevalence of BHV-1 in cows: | <0.001 | |||
| 0% (n = 365/37) | 0 | |||
| 1-50% (n = 256/26) | 0.219 | 0.160 | 0.172 | |
| >50% (n = 317/32) | 0.729 | 0.169 | <0.001 | |
| Within-herd prevalence of BRSV in cows: | 0.021 | |||
| 0% (n = 178/18) | 0 | |||
| 1-50% (n = 209/21) | 0.404 | 0.195 | 0.038 | |
| >50% (n = 551/56) | 0.504 | 0.182 | 0.006 | |
| Veterinarian is an employee of the farm: | ||||
| No (n = 741/72) | 0 | |||
| Yes (n = 197/20) | -0.542 | 0.184 | 0.003 | |
| Herd size: | 0.011 | |||
| <50 (n = 237/24) | 0 | |||
| 50-99 (n = 140/14) | 0.541 | 0.198 | 0.006 | |
| 100-199 (n = 140/14) | 0.043 | 0.203 | 0.831 | |
| 200-399 (n = 220/22) | 0.369 | 0.190 | 0.052 | |
| >399 (n = 201/21) | 0.570 | 0.217 | 0.009 | |
| Constant | 1.228 | 0.333 | <0.001 |
Intra-class correlations coefficient (ICC) for farm = 0.338 and p < 0.002 for random effect. Abbreviations: SE – standard error; BHV-1 - bovine herpesvirus 1; BRSV - bovine respiratory syncytial virus.
Table 3.
Results of linear regression mixed model (farm included as random factor) of associations between herd-level variables and cows’ haptoglobin (Hp) concentrations (g/l) after 1/square root transformation1. Data from 938 cows from 95 dairy farms were included (n = cows/farms).
Table 3.
Results of linear regression mixed model (farm included as random factor) of associations between herd-level variables and cows’ haptoglobin (Hp) concentrations (g/l) after 1/square root transformation1. Data from 938 cows from 95 dairy farms were included (n = cows/farms).
| Variable | Coeff. | SE | p-value | Wald test p-value |
| Age of cows (years) | -0.021 | 0.011 | 0.056 | |
| Cow M. bovis status: | ||||
| Negative (n = 664) | 0 | |||
| Positive (n = 274) | -0.105 | 0.048 | 0.030 | |
| Haemolysis in serum sample: | <0.001 | |||
| No haemolysis (n = 763) | 0 | |||
| Slight haemolysis (n = 120) | -0.436 | 0.066 | <0.001 | |
| Marked haemolysis (n = 55) | -0.898 | 0.093 | <0.001 | |
| Herd size: | 0.291 | |||
| <50 (n = 237/24) | 0 | |||
| 50-99 (n = 140/14) | -0.015 | 0.083 | 0.852 | |
| 100-199 (n = 140/14) | 0.107 | 0.082 | 0.193 | |
| 200-399 (n = 220/22) | 0.027 | 0.072 | 0.706 | |
| >399 (n = 201/21) | -0.077 | 0.074 | 0.302 | |
| Constant | 2.744 | 0.078 | <0.001 |
Intra-class correlations coefficient (ICC) for farm = 0.130 and p < 0.012 for random effect. 1 Because of inverse transformation minus coefficient means positive effect. Abbreviations: SE – standard error; Mycoplasma (M.) bovis.
Table 4.
Results of linear regression mixed model (farm included as random factor) of associations between herd-level variables and heifers’ serum amyloid A (SAA) concentrations (mg/l) after logarithmical transformation. Data from 921 heifers from 94 dairy farms were included (n = heifers/farms).
Table 4.
Results of linear regression mixed model (farm included as random factor) of associations between herd-level variables and heifers’ serum amyloid A (SAA) concentrations (mg/l) after logarithmical transformation. Data from 921 heifers from 94 dairy farms were included (n = heifers/farms).
| Variable | Coeff. | SE | p-value | Wald test p-value |
| Age of heifers (months) | -0.082 | 0.025 | 0.001 | |
| Age of heifers squared (months) | 0.002 | 0.0006 | 0.001 | |
| Number of heifers at farm x 100 | 0.052 | 0.027 | 0.058 | |
| Haemolysis in serum sample: | <0.001 | |||
| No haemolysis (n = 661) | 0 | |||
| Slight haemolysis (n = 181) | -0.171 | 0.098 | 0.083 | |
| Marked haemolysis (n = 79) | -0.572 | 0.138 | <0.001 | |
| Within-herd prevalence of BHV-1 in heifers: | 0.007 | |||
| 0% (n = 543/56) | 0 | |||
| 1-50% (n = 269/27) | 0.386 | 0.132 | 0.004 | |
| >50% (n = 109/11) | -0.036 | 0.206 | 0.861 | |
|
Within-herd prevalence of M. bovisin heifers: |
0.003 | |||
| 0-30% (n = 119/13) | 0 | |||
| 31-50% (n = 356/36) | -0.065 | 0.182 | 0.719 | |
| >50% (n = 446/45) | -0.446 | 0.179 | 0.013 | |
| Housing system for heifers: | 0.043 | |||
| Tie stall (n = 240/24) | 0 | |||
| Free stall (n = 232/24) | 0.350 | 0.16 | 0.029 | |
| Mixed (n = 449/46) | 0.319 | 0.14 | 0.023 | |
| Constant | 1.864 | 0.287 | <0.001 |
Intra-class correlations coefficient (ICC) for farm = 0.275 and p < 0.001 for random effect. Abbreviations: SE – standard error; BHV-1 - bovine herpesvirus 1; Mycoplasma (M.) bovis.
Table 5.
Results of linear regression mixed model (farm included as random factor) of associations between herd-level variables and heifers’ serum haptoglobin (Hp) concentrations (g/l) after 1/square root transformation1. Data from 921 heifers and 94 farms were included (n = heifers/farms).
Table 5.
Results of linear regression mixed model (farm included as random factor) of associations between herd-level variables and heifers’ serum haptoglobin (Hp) concentrations (g/l) after 1/square root transformation1. Data from 921 heifers and 94 farms were included (n = heifers/farms).
| Variable | Coeff.1 | SE | p-value | Wald test p-value |
| Age of heifers (months) | -0.013 | 0.005 | 0.007 | |
| Number of heifers at farm x 100 | -0.069 | 0.022 | 0.001 | |
| Haemolysis of sample: | <0.001 | |||
| No haemolysis (n = 661) | 0 | |||
| Slight haemolysis (n = 181) | -0.843 | 0.082 | <0.001 | |
| Marked haemolysis (n = 79) | -1.551 | 0.116 | <0.001 | |
| Within-herd prevalence of BHV-1 in heifers: | 0.023 | |||
| 0% (n = 543/56) | 0 | |||
| 1-50% (n = 269/27) | 0.224 | 0.109 | 0.040 | |
| >50% (n = 109/11) | 0.398 | 0.169 | 0.018 | |
| Use of a breeding bull in heifers: | ||||
| No (n = 594/60) | 0 | |||
| Yes (n = 327/34) | -0.205 | 0.098 | 0.038 | |
| Constant | 4.061 | 0.119 | <0.001 |
Intra-class correlations coefficient (ICC) for farm = 0.275 and p < 0.001 for random effect. 1 Because of inverse transformation minus coefficient means positive effect. Abbreviations: SE – standard error; BHV-1 - bovine herpesvirus 1.
Disclaimer/Publisher’s Note: The statements, opinions and data contained in all publications are solely those of the individual author(s) and contributor(s) and not of MDPI and/or the editor(s). MDPI and/or the editor(s) disclaim responsibility for any injury to people or property resulting from any ideas, methods, instructions or products referred to in the content. |
© 2025 by the authors. Licensee MDPI, Basel, Switzerland. This article is an open access article distributed under the terms and conditions of the Creative Commons Attribution (CC BY) license (http://creativecommons.org/licenses/by/4.0/).
Copyright: This open access article is published under a Creative Commons CC BY 4.0 license, which permit the free download, distribution, and reuse, provided that the author and preprint are cited in any reuse.


