Preprint
Article

This version is not peer-reviewed.

Understanding Gameplay Acceleration Ability, Using Static Start Assessments. Have We Got It Right?

Submitted:

31 October 2025

Posted:

03 November 2025

You are already at the latest version

Abstract

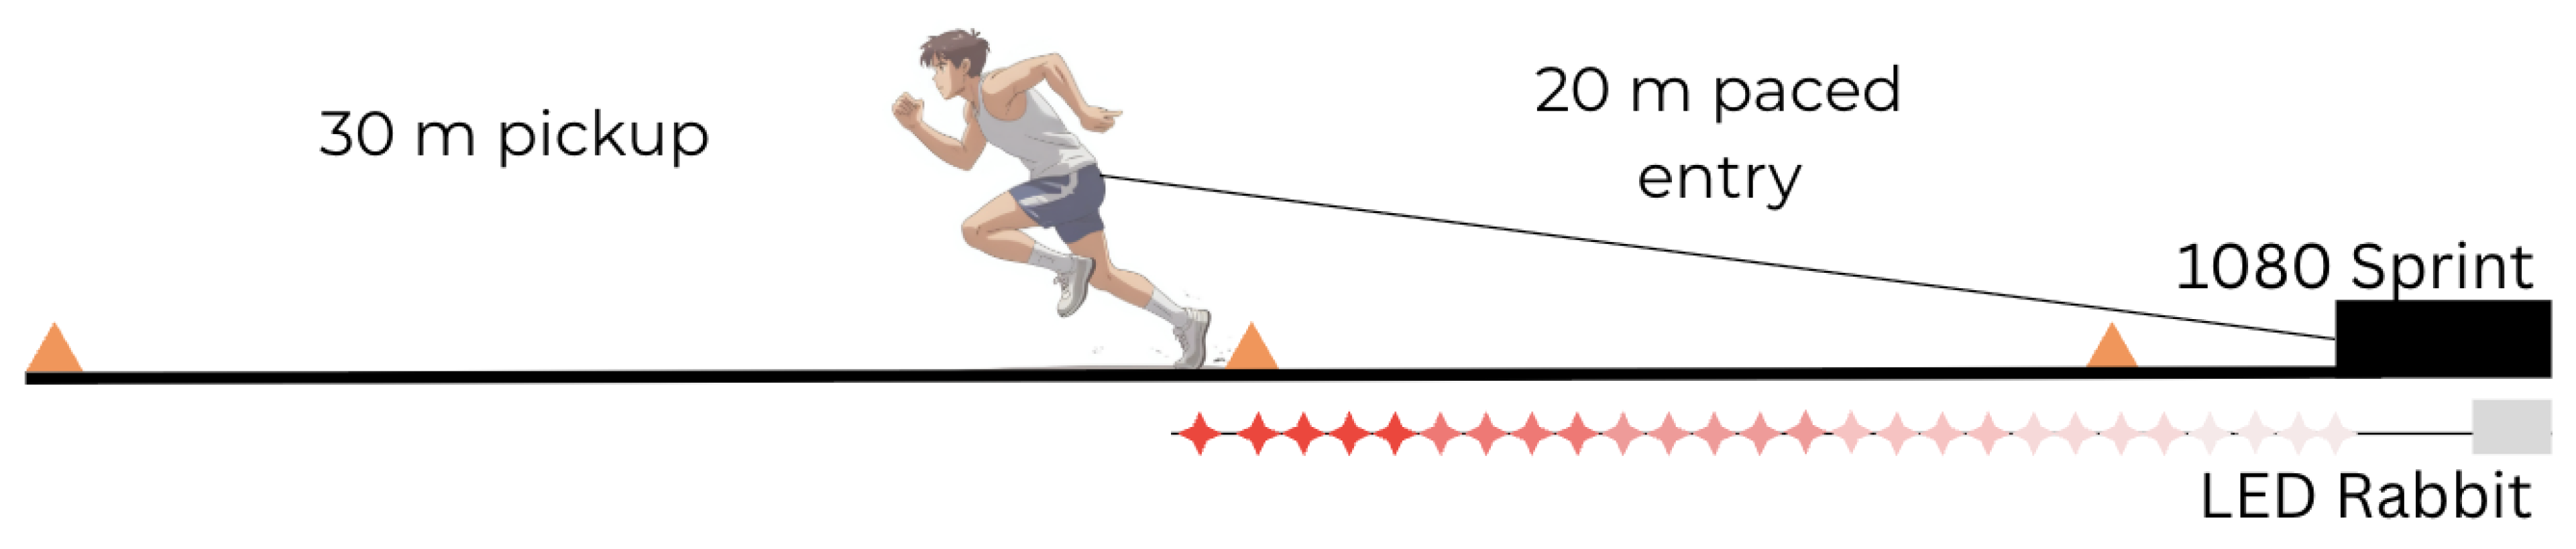
Despite athletes initiating sprints from dynamic starts during gameplay, sprint performance is traditionally measured from a static position. This article aimed to determine whether static start or “pickup” acceleration are related or relatively independent motor qualities by assessing their relationship and examining how athletes’ rank order changes between static and pickup conditions. Thirty-one male athletes (20.3 ± 5.3 years) completed two 30 m sprints from a static start and two 30 m pickup accelerations following 20 m paced entries at 1.5 and 3.0 m/s, regulated by an LED system. Peak acceleration (amax) was measured via a horizontal linear position encoder (1080 Sprint). The shared variance between amax from the static and pickup starts was R2 =11.6-39.6%, indicating, for the most part, a great amount of unexplained variance. The shared variance between pickup acceleration entry velocities was R2 = 16.8%. Visual analysis of an individualized rank order table confirmed that, for the most part, the fastest static start athletes differed from the fastest pickup athletes. In summary, static and pickup acceleration seem relatively distinct motor abilities, most likely requiring a paradigm shift in strength and conditioning practice in terms of acceleration assessment and development.

Keywords: 
;  ;  ;  ;  
Subject: 
Physical Sciences  -   Other

1. Introduction

Defined as the change in velocity over time (a = Δv⁄Δt), acceleration is central to decisive plays in team sports, such as contesting loose balls and creating scoring chances, and differentiates higher-performing athletes (Breddy, 2018; Faude et al., 2012; Haugen et al., 2014). In team sports, acceleration is often performed from a rolling start, termed a ‘pickup’. These accelerations are initiated from a submaximal entry velocity existing on a continuum spanning low to high velocities (e.g., walk-to-run) in relatively short bursts of effort (Duthie et al., 2006; Varley, 2013). While the frequency of non-stationary accelerations varies across sports (Gabbett, 2012), they consistently occur more often than sprints initiated from a static start (Haugen et al., 2014; Varley, 2013). In elite rugby, for instance, over half of all accelerations (53.4 ± 5.5%) begin from a walking-to-standing speed (0–1.9 m/s), with an additional 31.8 ± 5% initiated from a jogging start (>1.9 m/s) (Lacome et al., 2014). Given the common nature of pickup acceleration in gameplay, assessing acceleration capability from a rolling start would be logically valid. Practitioners however, commonly assess sprint acceleration from a static start (Cross et al., 2015; Lahti et al., 2020; Morin et al., 2019), likely due to tradition, the challenge of standardizing the entry velocity, and a general lack of understanding of pickup acceleration. Additionally, it may be based on the contention, that both static and pickup acceleration are similar motor qualities, and therefore do not need to be assessed independently. Whether this is actually the case is unknown and provides the focus of this article.
Outside of a select few studies specific to sport (Breddy, 2018; Jakeman et al., 2023; Sonderegger et al., 2016; Young et al., 2018), most existing research on pickup acceleration stems from gait-transition studies in rehabilitation and biomechanics (De Smet et al., 2009; Segers et al., 2014; Segers et al., 2013), leaving the broader understanding of its determinants and relationship to static acceleration unclear. For example, the researchers who examine gait transitions primarily examine pickup acceleration using gradual rather than instantaneous acceleration (Segers et al., 2006; Segers et al., 2007). The select few who have examined a “spontaneous overground acceleration” or “burst transition” have limitations, including a lack of standardized entry velocity, failure to ask performers to achieve maximal acceleration, often terminating trials at a jogging pace, and, importantly, a lack of comparison with general sprint ability(Segers et al., 2014; Segers et al., 2013). Authors who have investigated pickup acceleration in sporting contexts have determined that maximal acceleration (amax) decreases with the increase in entry velocity (Breddy, 2018; Sonderegger et al., 2016) with Sonderegger finding a strong association between entry velocity and maximal acceleration (r = 0.98), but no researchers have investigated whether static start and pickup acceleration amax are related or independent motor skills.
Given the paucity of research in the area, the assumption is that most practitioners believe that those athletes that have good static start acceleration will have good pickup acceleration; however, this may not be the case. Drawing parallels from strength research, where static and dynamic strength measures reflect related but distinct qualities (Berger, 2013), it is plausible that these acceleration modes differ in terms of their neuromechanical determinants. A simple statistical approach to test this contention, is to test the strength of association between the amax quantified from both types of testing. The purpose of this article therefore is to examine whether sprinting initiated from static and pickup starts share similar motor qualities. We hypothesize that pickup acceleration and static start acceleration are relatively independent motor qualities, and if this is the case then a paradigm shift in how acceleration is assessed may be needed.

2. Materials and Methods

2.1. Experimental Approach to the Problem

Thirty-one team sport athletes performed two 30-m maximum-effort sprint accelerations from a static start and four 30-m maximal pickup accelerations with paced entries (2 x 1.5 m/s and 2 x 3.0 m/s). Distance and velocity-time measures were extracted for each trial using a linear position encoder (1080 Sprint, 1080 Motion AB, Lidingö, Sweden) to capture spatiotemporal data at 333 Hz. Correlation coefficients and coefficients of determination (R2) were used to describe the strength of the association and shared variance between conditions. Finally, a rank-order analysis was performed on individualized data to compare static and pickup acceleration capabilities.

2.2. Subjects

Thirty-one injury-free male team sport athletes (age 20.3 ± 5.3 years; stature 1.82 ± 0.09 m; body mass 80.1 ± 17.1 kg) from American football, n=10; baseball, n=8; basketball, n=4; track and field (200 and 400m), n=4; soccer, n=3; professional ultimate frisbee (AUDL) n=1; Gaelic football, n=1 all with >1 year of training experience participated in this study. Before testing, athletes were instructed to refrain from intense exercise for 24 h prior. Written informed consent was obtained from each participant. Ethical approval for the study was granted by the AUT Ethics Committee (Approval Number 21/437).

2.3. Procedures

Athletes performed two 30 m static sprints and six randomized 30 m pickup accelerations (2 x 1.5, 2 x 3.0, and 2 x 4.5 m/s entry velocities, but only 1.5 and 3.0 m/s entries were analyzed due to the fastest entry velocity inducing greater line sway in the tether, obscuring analysis of the breakpoint by increasing the incidence of false steps on the signal. These entry speeds were selected because they aligned closely with the sprint velocity thresholds defined by GPS unit manufacturers, and similar values have been used in related pickup acceleration research (Cullen et al., 2017; Sonderegger et al., 2016; Sweeting et al., 2017), allowing for comparison with other studies. Subjects were attached to a linear position encoder via a tether and waist harness, and entries were paced by an LED system (LED Rabbit, BV Systems, LLC, Shawnee, KS). For each pickup, athletes started at the beginning of the runway and were asked to maintain a paced entry until approaching the 20 m cones, then maximally accelerate through to the end of the 30 m pickup zone. During pilot testing, a minimum distance of 13 m was established as the distance needed to ensure a consistent entry velocity. The 1080 Sprint provided displacement/time-series data at a 1 kg load (isotonic mode) to minimize impedance to the athlete and provide tension on the tether (Feser et al., 2022). The rest between trials was a minimum of 5 min. The 50 m sprint setup (see Figure 1) consisted of a 0-20 m paced zone, used for establishing the pickup entry velocity, and a 30 m pickup zone. For static start trials, athletes using the same track and tether setup, participants also performed a 30 m sprint from the same starting point as the pickup trials. The LED system was configured to “Multiple” mode, stabilizing the entry velocity over the 25 m strip. Trials were allocated randomly via an Excel spreadsheet (Microsoft Excel, Microsoft, Redmond, WA, USA). The instructions to the subjects were, “After the LED Rabbit starts, accelerate to match the speed of the light and maintain this pace until approaching the end of the first cones. After this distance, maximally accelerate through the last series of cones.” If participants failed to maintain the pace set by the LED, the trial was discarded. Trials that were removed were repeated after the appropriate rest interval. The average of each sprint condition was used for subsequent analysis. The testing procedures used to determine amax and the split times have been found to be reliable previously (Pryer et al., 2025) with coefficients of variation of less than 4.75% for all variables of interest.

2.4. Data Analysis

For each athlete, all static and pickup trials were extracted and used to form the average amax for static and pickup entry velocities. Each trial was extracted and processed similarly, except for the manual determination of the pickup point. Raw distance and velocity-time data were exported from the 1080 Motion web portal, unmodified, for static starts. After visual screening, each trial was analyzed in MATLAB (MATLAB R2022, MathWorks, Natick, MA, USA) using a 4th-order 0.5 Hz Butterworth lowpass filter. Two, 5, 10, and 20 m splits were extracted, vmax, and amax, with only amax used in this analysis. For all trials, amax was the highest acceleration value seen on the ascending limb of the filtered velocity-time waveform. The pickup point was selected after a sudden increase in velocity between 13 and 20 m during pickup trials. Additionally, the 5 m mean entry velocity before the pickup was collected and analyzed, compared to the prescribed entry to verify the fidelity of the trial entry velocity.

2.5. Statistical Analysis

An a priori sample size estimate was conducted to determine the number of participants required for the correlational analysis. Using G*Power, a conservative estimate was derived using the correlation-based model with an anticipated correlation of 0.70, an alpha level of 0.05, and a power of 0.80. This approach yielded a minimum requirement of 14 participants to detect a statistically significant correlation. Data were analyzed for normality, and outliers were removed. Means and standard deviations were used to quantify the centrality and spread of data. To determine the strength of the association between static and pickup acceleration, a correlational analysis using Pearson’s r at an alpha level of p < 0.05 was conducted in JASP (Version 0.18.1, University of Amsterdam, Amsterdam, NL). Thresholds for correlations were reported as: 0.0 to 0.3 (or 0.0 to -0.3), negligible; 0.3 to 0.5 (-0.3 to -0.5), low; 0.5 to 0.7 (-0.5 to -0.7), moderate; 0.7 to 0.9 (-0.7 to -0.9), high; 0.9 to 1.0 (-0.9 to -1.0), very high (Moore, 2021). Coefficients of determination (R2) indicated the shared variance between variables. For the rank-order analysis, athletes were manually sorted and ranked from highest to lowest by their amax values, determined from their static start, and then matched across different entry velocities in an Excel spreadsheet.

3. Results

The mean amax values were: static start = 4.52 ± 0.58 m/s2; 1.5 m/s: amax 3.21 ± 0.28; 3.0 m/s: amax 2.36 ± 0.24 m/s2. The correlations between static and pickup acceleration for amax are detailed in Table 1. For amax, correlations between static start and pickup acceleration ranged from 0.34 to 0.63, corresponding to a shared variance of 11.6-39.6%. The shared variance between the different amax entry velocities was 16.8%.
The variability in the rank order of subjects from fastest to slowest for static start amax is shown in Table 2. The static start rankings appear to have little influence on an individual’s pickup acceleration rankings, as no clear visual trends are observable in this table. For example, the amax ranking for athlete B43 was 3rd for the static start, 10th for the 1.5 m/s entry condition, and 30th for the 3.0 m/s entry velocity.

4. Discussion

Of primary interest was determining whether static start and pickup acceleration were similar motor qualities and therefore could be assessed and trained in the same manner. Primary findings were: 1) there was a great deal of unexplained variance between static and pickup acceleration amax R2 = 11.6-39.6%; 2) the shared variance between pickup acceleration entry velocities was 16.8%; and, 3) no systematic visual trends were observed between static start and pickup acceleration ranking of athletes.
Only two research groups (Breddy, 2018; Sonderegger et al., 2016) have investigated pickup acceleration, using a methodology similar to that employed in this study. Sonderegger et al. (2016) reported values of 6.01 ± 0.55, 4.33 ± 0.40, 3.20 ± 0.49, and 2.29 ± 0.34 m/s2 for entry velocities of 0 m/s (static start), 1.6, 3.0, and 4.1 m/s. The entry velocities were similar across studies; however, the amax values in this study were lower (~26%) than those reported by Sonderegger et al. (2016). Breddy et al. used a wider range of entry velocities (3–7 m/s, excluding the 1.5 m/s condition used here); however, their athletes did not maintain target entry velocities, the authors reporting a mean entry of 4.29 ± 0.52 m/s for the 3 m/s trial, whereas the mean entry velocity in this study was 3.20 ± 0.18 m/s, making direct comparison problematic given the effect of entry velocity in flow on metrics. Despite the increased entry velocity, they reported a mean amax comparable to that in this study (2.34 ± 0.35 m/s vs 2.36 ± 0.24 m/s). The differences between studies in terms of the variables of interest, can be likely explained by a) subjects’ training status, Sonderegger’s subjects were highly trained junior male soccer players, whereas Breddy used elite developmental Premier League soccer players; and/or, b) the different technologies used for data collection (linear position encoder vs. local position measurement system and GPS).
This study aimed to ascertain if static and pickup acceleration were relatively similar motor qualities; the findings suggested this was not the case, given the low shared variance, 11.6-39.6% for amax. This is the first study to explore the relationships between static and pickup acceleration across different velocities, which limits the ability to compare findings with other research. Furthermore, it was thought that those with good pickup acceleration ability would rank highly across all entry velocities. Once more, such a contention was unfounded; the shared variance was low (16.8%) between the 1.5 m/s and 3.0 m/s entries for amax. Again, no other researchers have investigated the relationship between pickup acceleration entry velocities, making comparisons problematic. Nonetheless, practitioners must consider assessing and training pickup acceleration differently from static start acceleration. It is quite likely that pickup acceleration has a set of physical and technical demands that differ from the static start acceleration, which have yet to be identified and could provide direction for future research.
When viewed as a group, amax values were significantly different and decreased with faster entries. However, on an individual level, amax values varied substantially across different entry velocities, with some athletes performing better than their counterparts from a static start and worse at a walking or jogging start. A visual analysis of Table 2 confirms the relative independence of static and pickup acceleration across the different entry velocities, the static start ranking had little influence on the pickup acceleration ranking. For example, the amax ranking for athlete B43 was 3rd for the static start, 10th for the 1.5 m/s entry condition, and 30th for the 3.0 m/s entry velocity. The low shared variance and variability in ranking indicate that performance in static starts should not be used to predict pickup acceleration ability.

Practical Applications

In summary, static start and pickup acceleration performance are relatively distinct motor abilities, given the minimum shared variance. Practitioners must be cognizant that excelling at static start acceleration does not guarantee proficiency across non-static starts and vice versa. Consequently, the assessment and training methods need to differ to understand and develop the two motor qualities optimally. For example, an assessment for deriving pickup acceleration metrics has been outlined in this paper; however, the information remains rudimentary, and a deeper understanding of step kinematics and kinetics, particularly during the approach, transition, and pickup steps, is needed. Technology, such as that used in this study, combined with videography, can provide a deeper understanding of the step-by-step mechanical determinants of pickup acceleration, if such assessments are found to be reliable. In that case, understanding what distinguishes athletes with good pickup acceleration from those with less skill is the natural next step for researchers and coaches seeking to understand and develop this motor quality. Armed with this information, the coach will have a greater appreciation of the technical and physical factors important to optimizing pickup acceleration performance. This deeper level of mechanical understanding regarding pickup acceleration is currently in its infancy, and there appears to be a plethora of research opportunities to add value to the knowledge base of pickup acceleration.
No outside funding was received for this study.
This manuscript is original and not previously published in any form, including on preprint servers, nor is it being considered elsewhere until a decision is made as to its acceptability by the Biomechanics Editorial Review Board.
This manuscript has been read and approved by all the listed co-authors and meets the requirements of co-authorship as specified in the Authorship Guidelines.
Prior written permission has been obtained for the reproduction of previously published material.
No conflicts of interest have been noted.

Contributions

Conceptualization, MP, JC, and AU; methodology, MP, JC, and AU; software, JN; validation, MP, JC., and AU.; formal analysis, MP and JN.; investigation, MP.; resources, NM, CS, and SB.; data curation, MP and JN.; writing—original draft preparation, MP.; writing—review and editing, MP, JC, AU, NM, CS, SB.; visualization, MP, JN, and AU.; supervision, JC, JN, and AU.; project administration, MP, JC, and AU; All authors have read and agreed to the published version of the manuscript.

Informed Consent

Written informed consent has been obtained from the patient(s) to publish this paper.

IRB Approval

The study was conducted in accordance with the Declaration of Helsinki, and the protocol was approved by the Ethics Committee of AUT 21/437 on 18/2/2022.

Acknowledgments

Thanks to Matt Cross for his leadership in the early stages of this project, and to Sean Barger, Chris Slocum, and Nick Mascioli for their assistance with data collection procedures.

Disclosures

The authors have no conflicts of interest to report.

References

  1. Berger, R. A. (2013). Comparison of Static and Dynamic Strength Increases. Research Quarterly. American Association for Health, Physical Education and Recreation, 33(3), 329-333. [CrossRef]
  2. Breddy, S. (2018). The effect of starting velocity on maximal acceleration capacity in elite level youth football players. [Masters, University of Glasgow].
  3. Cross, M. R., Brughelli, M., Brown, S. R., Samozino, P., Gill, N. D., Cronin, J. B., & Morin, J. B. (2015). Mechanical properties of sprinting in elite rugby union and rugby league. Int J Sports Physiol Perform, 10(6), 695-702. [CrossRef]
  4. Cullen, B. D., Roantree, M. T., McCarren, A. L., Kelly, D. T., O’Connor, P. L., Hughes, S. M., Daly, P. G., & Moyna, N. M. (2017). Physiological Profile and Activity Pattern of Minor Gaelic Football Players. J Strength Cond Res, 31(7), 1811-1820. [CrossRef]
  5. De Smet, K., Segers, V., Lenoir, M., & De Clercq, D. (2009). Spatiotemporal characteristics of spontaneous overground walk-to-run transition. Gait Pos, 29(1), 54-58. [CrossRef]
  6. Duthie, G. M., Pyne, D. B., Marsh, D. J., & Hooper, S. L. (2006). Sprint patterns in rugby union players during competition. J Strength Cond Res, 20(1), 208-214. [CrossRef]
  7. Faude, O., Koch, T., & Meyer, T. (2012). Straight sprinting is the most frequent action in goal situations in professional football. J Sports Sci, 30(7), 625-631. [CrossRef]
  8. Feser, E., Lindley, K., Clark, K. P., Bezodis, N., Korfist, C., & Cronin, J. (2022). Comparison of two measurement devices for obtaining horizontal force-velocity profile variables during sprint running. Intl J of Sports Sci & Coach. [CrossRef]
  9. Gabbett, T. J. (2012). Sprinting patterns of National Rugby League competition. J Strength Cond Res, 26(1), 121-130. [CrossRef]
  10. Haugen, T., Tonnessen, E., Hisdal, J., & Seiler, S. (2014). The role and development of sprinting speed in soccer. Int J Sport Physiol Perform, 9(3), 432-441. [CrossRef]
  11. Jakeman, B., Clothier, P. J., & Gupta, A. (2023). Transition from upright to greater forward lean posture predicts faster acceleration during the run-to-sprint transition. Gait Post, 105, 51-57. [CrossRef]
  12. Lacome, M., Piscione, J., Hager, J. P., & Bourdin, M. (2014). A new approach to quantifying physical demand in rugby union. J Sport Sci, 32(3), 290-300. [CrossRef]
  13. Lahti, J., Jimenez-Reyes, P., Cross, M. R., Samozino, P., Chassaing, P., Simond-Cote, B., Ahtiainen, J., & Morin, J. B. (2020). Individual Sprint Force-Velocity Profile Adaptations to In-Season Assisted and Resisted Velocity-Based Training in Professional Rugby. Sports (Basel), 8(5). [CrossRef]
  14. Moore, D. (2021). The basic practice of statistics (9th ed.). W. H. Freeman and Company.
  15. Morin, J. B., Samozino, P., Murata, M., Cross, M. R., & Nagahara, R. (2019). A simple method for computing sprint acceleration kinetics from running velocity data: Replication study with improved design. J Biomech, 94, 82-87. [CrossRef]
  16. Pryer, M., Cronin, J., Neville, J., & Uthoff, A. (2025). Effect of entry velocity on pickup acceleration performance. Int J of Strength and Cond, 5(1). [CrossRef]
  17. Segers, Aerts, Lenoir, & Clercq, D. (2006). Spatiotemporal characteristics of the walk-to-run and run-to-walk transition when gradually changing speed. Gait Post, 24(2), 247-254. [CrossRef]
  18. Segers, Caekenberghe, V., Clercq, D., & Aerts. (2014). Kinematics and dynamics of burst transitions. J Motor Behav, Vol. 46(Issue 4), 10. [CrossRef]
  19. Segers, Lenoir, Aerts, & Clercq, D. (2007). Kinematics of the transition between walking and running when gradually changing speed. Gait Post, 26(3), 349-361. [CrossRef]
  20. Segers, Smet, D., Caekenberghe, V., Aerts, & Clercq, D. (2013). Biomechanics of spontaneous overground walk-to-run transition. J Exp Biol, 216(Pt 16), 3047-3054. [CrossRef]
  21. Sonderegger, K., Tschopp, M., & Taube, W. (2016). The challenge of evaluating the intensity of short actions in soccer: A new methodological approach using percentage acceleration. PLoS One, 11(11), e0166534. [CrossRef]
  22. Sweeting, A. J., Cormack, S. J., Morgan, S., & Aughey, R. J. (2017). When Is a Sprint a Sprint? A Review of the Analysis of Team-Sport Athlete Activity Profile. Frontiers in Physiology, 8, 432. [CrossRef]
  23. Varley, M. (2013). Acceleration and fatigue in soccer-thesis Institute of Sport, Exercise and Active Living (ISEAL), Victoria University, Melbourne, Australia].
  24. Young, W. B., Duthie, G. M., James, L. P., Talpey, S. W., Benton, D. T., & Kilfoyle, A. (2018). Gradual vs. maximal acceleration: Their influence on the prescription of maximal speed sprinting in team sport athletes. Sports (Basel), 6(3). [CrossRef]
Figure 1. Sprint lane setup for pickup and static start acceleration testing.
Preprints 183203 g001
Table 1. Pearson’s correlation matrix for static-start and pickup acceleration amax.
Static start
amax
1.5 m/s
amax

3.0 m/s
amax
Static start
amax
0.63
(p=<0.001)
0.34
(p=0.06)
1.5 m/s
amax
0.63
(p=<0.001)
0.41
(p=0.02)
3.0 m/s
amax
0.34
(p=0.06)
0.41
(p=0.02)
Note: p = p-value; bold denotes significant values.
Table 2. Rank order of athletes across static and pickup starts.
Static start entry 1.5 m/s entry 3.0 m/s entry
Mean entry velocity (m/s) - 1.62± 0.10 3.20± 0.18
Athlete rank (amax; m/s2) rank (amax; m/s2) rank (amax; m/s2)
B05 1 (6.05) 1 (3.93) 6 (2.58)
B02 2 (5.66) 13 (3.24) 4 (2.66)
B43 3 (5.28) 10 (1.93) 30 (1.93)
B14 4 (5.19) 16 (3.18) 18 (2.33)
B07 5 (5.10) 19 (3.14) 7 (2.52)
B11 6 (5.05) 14 (3.23) 12 (2.44)
B46 7 (5.04) 2 (3.67) 1 (2.82)
B16 8 (4.99) 26 (2.24) 21 (2.24)
B08 9 (4.89) 4 (3.51) 9 (2.51)
B03 10 (4.77) 6 (3.44) 5 (2.64)
B13 11 (4.76) 5 (3.49) 17 (2.35)
B10 12 (4.69) 12 (3.26) 10 (2.50)
B18 13 (4.53) 24 (3.09) 28 (2.09)
B17 14 (4.50) 3 (3.63) 24 (2.19)
B19 15 (4.47) 7 (3.40) 31 (1.92)
B42 16 (4.35) 22 (3.11) 3 (2.76)
B01 17 (4.34) 9 (3.34) 2 (2.80)
B34 18 (4.339) 11 (3.28) 13 (2.44)
B59 19 (4.32) 17 (3.16) 23 (2.21)
B12 20 (4.29) 15 (3.22) 14 (2.41)
B15 21 (4.25) 8 (3.36) 19 (2.32)
B36 22 (4.21) 18 (3.142) 11(2.46)
B39 23 (4.15) 21(3.13) 16 (2.36)
B40 24 (4.03) 28 (3.00) 20 (2.24)
B44 25 (4.02) 20 (3.139) 8 (2.52)
B37 26 (3.95) 25 (3.04) 26 (2.12)
B45 27 (3.93) 30 (2.75) 27 (2.11)
B60 28 (3.92) 27 (3.01) 22 (2.21)
B38 29 (3.91) 31 (2.46) 25 (2.15)
B57 30 (3.69) 23 (2.40) 15 (2.40)
B58 31 (3.52) 29 (2.06) 19 (2.06)
Mean amax (m/s2) 4.52 ± 0.58 3.21 ± 0.28 2.36 ± 0.24
Note: m/s, meters per second; m/s2, meters per second squared; amax, maximal acceleration.
Disclaimer/Publisher’s Note: The statements, opinions and data contained in all publications are solely those of the individual author(s) and contributor(s) and not of MDPI and/or the editor(s). MDPI and/or the editor(s) disclaim responsibility for any injury to people or property resulting from any ideas, methods, instructions or products referred to in the content.
Copyright: This open access article is published under a Creative Commons CC BY 4.0 license, which permit the free download, distribution, and reuse, provided that the author and preprint are cited in any reuse.
Prerpints.org logo

Preprints.org is a free preprint server supported by MDPI in Basel, Switzerland.

Subscribe

Disclaimer

Terms of Use

Privacy Policy

Privacy Settings

© 2025 MDPI (Basel, Switzerland) unless otherwise stated