
Submitted:
18 August 2025
Posted:
19 August 2025
You are already at the latest version
Abstract
Objective: This study aimed to experimentally investigate the biomechanical and performance differences between the Grab Start (GS) and the Kick Start (KS) with each leg on the kickplate (KSR, KSL) in Bi-Finswimming (BFS). It focused on the effect of foot placement on the OSB11 starting block to determine potential performance advantages and contribute evidence-based recommendations for optimizing start techniques in competitive BFS. Methods: Thirteen national-level finswimmers (7 males, 6 females; age: 17.7 ± 2.1 years) voluntarily participated. Each athlete performed two trials of three start techniques (GS, KSR, KSL) over three days in randomized order. Four synchronized cameras recorded video data. Performance metrics (time to 5 m, 15 m, 25 m, reaction time, block time (BT), flight time (FT), and entry characteristics) along with joint angles (hip, knee, ankle), were analyzed using Kinovea software. Results: No significant gender differences were found (p > 0.05). Significant differences emerged between the starting techniques, with KS showing faster times (p < 0.001). BT was significantly longer in GS compared to KS (p < 0.001), while FT was shorter in GS (p = 0.002). Faster T5, T15, and T25 were associated with increased flight distance and longer FT in KSL. Conclusions: The findings suggest that the Kick Start technique generally outperforms the Grab Start, especially in block time, in Bi-Finswimming. It is recommended that this technique be legalized by CMAS for competition use.
Keywords:
finswimming
; OSB11
; diving
; dominant leg
; preferred leg
1. Introduction
Finswimming (FS) is a competitive aquatic sport that requires specialized technical skills and equipment. A notable discipline within FS is Bi-Finswimming (BFS), which was officially incorporated into the competition program of the World Underwater Federation in 2007 [1]. The BFS primarily employs a freestyle swimming technique, with athletes utilizing a pair of standardized fins composed of homogeneous rubber and a snorkel [1]. The start phase is pivotal among the critical determinants of performance in competitive conventional swimming (CS) and FS, particularly in sprint events where minor time differences can significantly influence race outcomes [2]. Since the OSB11 starting platform was introduced, with its new inclined kickplate at the back, considerable research in CS has focused on analyzing and comparing different starting techniques, particularly highlighting the distinctions between the traditional grab start (GS), the track start (TS), and the kick start (KS) [3,4]. Nevertheless, the initiation on the OSB11 starting platform is occasionally referred to as either a track start (TS) or a kick start (KS) in the relevant literature [5,6].
Previous research in CS has thoroughly examined start performance, highlighting crucial variables such as reaction time (RT), block time (BT), flight time (FT), body entry time (BET) in the water, and the times at 5, 15, and 25 meters [7]. Several studies have investigated the influence of the adjustable kickplate on body positioning and start biomechanics, reporting significant differences between GS and KS, particularly regarding horizontal impulse and force production during the block phase [3,8]. Furthermore, the block time associated with the KS is reportedly shorter than that of the GS, primarily due to the horizontal reaction force produced by the hands and rear leg during the initial movement phase [9]. While the GS is typically linked to limited horizontal propulsion during the block departure phase, this aspect is considered disadvantageous in CS, as it prolongs the flight phase and increases the non-propulsive distance covered before water entry [9]. Although the KS has been the subject of several investigations in CS, relatively few studies have focused specifically on its kinematic characteristics and detailed performance impact at distances of 5, 10, and 15 meters, respectively [2].
The functional distinction between the front and rear legs during the KS arises from the inclined kickplate, which alters the lever arm mechanics and rear leg positioning [10]. By generating a significant horizontal impulse during the initial block phase, the rear leg contributes to the take-off horizontal velocity [11], which has been reported to account for 81% of the variance in start performance during the overwater phase [5]. Conversely, the front leg predominantly provides a vertical impulse, influencing vertical launch velocity and optimizing the water entry angle [12]. A distinctive feature of the KS is the simultaneous force application by both upper and lower limbs, creating a closed kinetic chain where arm and leg forces interact synergistically [12].
Despite the extensive body of research on CS start, there remains a significant gap in the literature concerning BFS start, especially since the CMAS regulations still allow the use of the GS. To date, only two studies have examined start techniques in FS. Liashenko et al. (2019) conducted a broader kinematic analysis, evaluating reaction time, horizontal flight velocity, and acceleration across CS, monofin swimming, and BFS. The findings revealed distinct velocity and acceleration profiles among athletes, indicating that start performance varies according to the swimming discipline and fin type [13]. Also, Stavrou and Voutselas (2024) investigated variations in hand placement in starting block during GS with the monofin but did not analyze other kinematic parameters [14]. These results emphasize the need for further biomechanical research into FS starts. The objective of this study is to conduct an experimental investigation into the biomechanical and performance disparities between the GS and the KS in the BFS. This investigation will be the first to examine these disparities while the dominant leg is positioned at either the front or the rear of the starting block.
2. Materials and Methods
2.1. Participants
The prediction of the required sample size (n) was conducted using G*Power 3.1.9.7 (Universität Düsseldorf) for Windows [15]. To detect significant differences between two groups (males and females) across three starting techniques, GS, KS with the right leg on the kickplate (KSR), and KS with the left leg on the kickplate (KSL), a medium effect size of 0.60 was established. Power analysis indicated that a minimum sample size of 12 participants would be necessary to achieve a statistical power of approximately 63%. This would provide a modest probability of rejecting the null hypothesis under these conditions.
The present study involved thirteen (n = 13) national level finswimmers (7 males and 6 females) who voluntarily participated in the experiment. The participants’ demographic and anthropometric characteristics were as follows (mean ± SD): age = 17.7 ± 2.1 years; height (H) = 1.75 ± 0.09 m; weight (W) = 69.6 ± 12.5 kg. Additionally, data on preferred leg placement on the kickplate and European shoe size (fin size – S) were recorded (Table 1).
Before the experimental procedures began, all participants and their parents and coaches, were thoroughly informed about the study’s purpose and protocol. During data collection, all participants were healthy, injury free, and well rested. The study protocol received approval from the Local Ethics Research Committee of the School of Physical Education and Sport Science at Serres, Aristotle University of Thessaloniki (ERC-007/2025, 14 March 2025) and was conducted in accordance with the Declaration of Helsinki. For underage participants, informed written consent was obtained from their legal guardians.
2.2. Experimental Procedure
Initial assessments included age, height, weight, and identifying each participant’s preferred leg placement on the kickplate of the starting block (Table 1). Height was measured using a portable stadiometer (Tanita HR001, Tanita Corporation, China), while weight was recorded with a digital scale (Tanita RD-545 HR, Tanita Corporation, China). The experimental trials took place in a 50-m indoor swimming pool, where the water temperature was kept between 25–26 °C and the ambient temperature ranged from 22–25 °C. Before the experimental procedure, all participants completed a standardized precompetition warmup, followed by a 10-min rest interval protocol, with the protocol outlined by Jimenez-Perez [16].
Each finswimmer completed two attempts for each of the three starting techniques: the first attempt served as a familiarization trial, while the second was used to collect performance data. The three starting conditions, GS, KSR, and KSL (Figure 1), were evaluated on separate days (a total of three testing days), with a 10 min rest period between the two attempts conducted each day.
The order of start techniques was randomized for each participant using a counterbalanced design to minimize potential order effects and systematic bias. All trials were conducted under simulated race conditions, closely replicating official competition settings in accordance with CMAS regulations.
2.3. Video Recording
A total of four cameras were utilized to record each fin swimmer’s start in a simultaneous manner. These cameras were meticulously synchronized using an LED light positioned directly in front of them. This LED light served as a standardized visual start signal for all the recording systems (Figure 2).
The first and second cameras (C1 and C2) were positioned at a height of 1.70 meters above the surface of the pool deck and at a horizontal distance of 3 meters on either side of the starting block. The third camera (C3) was positioned underwater at a depth of 0.90 meters and a horizontal distance of 5 meters from the side wall of the pool. A fourth camera (C4) was positioned at the side of the pool deck, 15 meters from the starting block and at a height of 0.5 meters (Figure 2).
The start signal was given by an electronic horn precisely synchronized with four LED lights. Each LED was positioned directly in front of one of the four cameras, providing a simultaneous visual cue. This setup allowed exact timing alignment between the start signal and the video recordings from all camera angles.
2.4. Recording Equipment
Data acquisition was performed using three cameras (GoPro Hero 9) and one underwater camera (GoPro Hero 12), all operating at a frame rate of 50 frames per second (fps). The cameras featured 23.6 megapixel image sensors and HyperSmooth 3.0 stabilization, capable of recording up to 240 fps at 1080p resolution, up to 60 fps at 4K, and a maximum resolution of 5K at 30 fps.
2.5. Parameters Analysis
The timing of the distances of 5 m, 15 m, and 25 m were recorded (T5GS, T5KSR, T5KSL, T15GS, T15KSR, T15KSL, T25GS, T25KSR, and T25KSL). The 5-m and 15-m times were recorded using cameras C1 and C3, respectively, measuring the interval from the LED flash (start signal) to the moment the finswimmer’s snorkel crossed the corresponding virtual 5 m or 15 m line. The 25-m time was measured manually using handheld stopwatches at the point when the snorkel crossed the virtual 25 m line. Two trained timekeepers operated independent handheld electronic stopwatches, and their recordings were averaged for analysis.
Video recordings were analyzed using Kinovea software, a validated tool for two-dimensional motion analysis widely used in biomechanical research [17]. Each parameter was extracted separately for the three start techniques (GS, KSR, and KSL), contributing to a comprehensive evaluation of start-phase performance in finswimming. Reaction time defined as the interval between the start signal to the first observable movement (RTGS, RTKSR, and RTKSL). Block time defined as the total time the athlete remained in contact with the starting block after the start signal (BTGS, BTKSR, and BTKSL). Flight distance was defined as the horizontal distance from the block to the point where the swimmer’s fingertips touched the water (FDGS, FDKSR, and FDKSL). The flight time was defined as the interval between the moment the swimmer’s fins lost contact with the starting block and the moment his fingertips first touched the water (FTGS, FTKSR, and FTKSL). Additionally, the angle of body entry into the water was measured (BEAGS, BEAKSR, and BEAKSL). Body entry time was defined as the time from initial fingertip contact with the water surface until complete submersion of the body and fins (BETGS, BETKSR, and BETKSL). Diving depth was recorded at a distance of 5-m from the wall (DGS, DKSR, and DKSL). The distance covered during the underwater phase was recorded (UWGS, UWKSR, and UWKSL). Finally, the number of underwater dolphin kicks performed from entry to breakout was recorded (DKGS, DKKSR, and DKKSL).
A series of additional kinematic parameters were recorded, including joint angles, which were marked on anatomical landmarks corresponding to each joint. The following joint angles were measured: hip angle in GS (HAGS), front leg hip angles in KSR and KSL (FHAKSR and FHAKSL) back leg hip angles in KSR and KSL (BHAKSR and BHAKSL), knee angle in GS (KAGS), front leg knee angles in KSR and KSL (FKAKSR and FKAKSL), back leg knee angles in KSR and KSL ( BKAKSR and BKAKSL ), ankle angle in GS (AAGS) and front leg ankle angles in KSR and KSL (FAAKSR and FAAKSL), and back leg ankle angles in KSR and KSL (BAAKSR and BAAKSL).
2.6. Statistical Analysis
All values are shown as mean ± SD. Descriptive statistics and a test of normality (Shapiro–Wilk) for all the variables were used. Additionally, the measurements were checked for homogeneity and sphericity via Box’s test of equality of covariance and Mauchly’s test, respectively. In case of lack of Sphericity, a Greenhouse Geisser analysis was considered. A two-way analysis of variance (ANOVA) (start type × gender) with repeated measures was utilized to analyze the following variables: T5, T15, and T25, RT, BT, FD, FT, BEA, BET, D, UW, DK were recorded, checking for possible within- or between-subject effects. Possible statistically significant differences were analyzed via Syntax, making pairwise comparisons between groups with Bonferroni’s post hoc test. A paired sample t–test was used to verify the variation between the HA, KA, AA between front or rear legs in KS. The effect size (ES) with Pillai’s partial Eta square (η2) was estimated (η2p; small ≥ 0.01, medium ≥ 0.06, large ≥ 0.14) [18]. Also, correlations between dependent (type of start) and independent variables (start-examined variables) were examined through bivariate Pearson’s r analysis. The statistical analysis was performed with the software SPSS, Version 25.0 (Armonk, NY: IBM Corp). The level of significance was set at α = 0.05.
3. Results
According to the Shapiro–Wilk test (for samples ≤ 30 participants), the data were normally distributed (p > 0.05). Thus, parametric analyses were followed for all examined variables. Additionally, according to Box’s and Mauchly’s tests, respectively, the data of the finswimmers’ start, and performance variables showed homogeneity and sphericity (p > 0.05). For FTGS, FTKSR, and FTKSL, which did not meet the sphericity criterion (p < 0.05), a Greenhouse-Geisser sphericity analysis was conducted. Moreover, there was no statistically significant difference between gender (p > 0.05) in all examined parameters. For this reason, the analysis was conducted for both genders combined for all parameters.
The analysis of the data indicated that the T5GS was significantly extended than the T5KSR and T5KSL (1.79 ± 0.13 vs 1.66 ± 0.14 and 1.68 ± 0.13 s, respectively, p < 0.001, η2 = 0.6), the T15GS from the T15KSR, T15KSL (6.0 ± 0.45 vs 5.86 ± 0.40 and 5.88 ± 0.44 s, respectively, p < 0.001, η2 = 0.5) and the T25GS was significantly extended than the T25KSR and T25KSL (10.74 ± 0.74 vs 10.64 ± 0.73 and 10.61 ± 0.71 s, respectively, p < 0.05, η2 = 0.3). The BTGS was significantly extended than BTKSR and BTKSL (0.83 ± 0.04 vs 0.71 ± 0.08 and 0.69 ± 0.06 s, respectively, p < 0.001, η2 = 0.8). The FTGS was significantly shorter than FTKSR and FTKSL (0.22 ± 0.07 vs 0.26 ± 0.06 and 0.28 ± 0.06 s, respectively, p = 0.002, η2 = 0.4). Apart from the parameters that showed significant differences, no statistically significant differences were observed among the remaining variables across the three starting conditions (Table 2).
Table 3 presents the results of the correlation analysis, revealing several significant relationships between performance outcomes and kinematic variables. Faster times at T5, T15, and T25 were positively associated with greater anthropometric parameters (H, W, and S), as well as with increased FDGS, FDKSR, FDKSL across the three start types, extended flight time in FTKSL, and shorter BETKSL. Additionally, shorter BTGS was linked to longer FDGS and FTGS, while shorter BTKSL was associated with longer FTKSL. Longer FDGS, FDKSR, FDKSL were each correlated with longer FTGS, FTKSR, FTKSL and smaller BEAGS, BEAKSR, BEAKSL, respectively. Specifically, a longer FDKSL was associated with a faster BETKSL, and a longer FTKSL corresponded with a reduced BETKSL. Furthermore, a smaller BEAKSL was also linked to a faster BETKSL. Greater BEAKSR and BEAKSL were associated with superior DKSR and DKSL, respectively. Lastly, higher DKSR and DKSL values were positively correlated with extended UWKSR and UWKSL and were further associated with a greater number of DKKSR and DKKSL, respectively.
4. Discussion
In the present study, most of the results will be discussed in comparison with data from the literature on CS, as this is the first study conducted on BFS. Significant differences were observed in performance over the 5, 15, and 25 m distances in BFS when different starting techniques were employed. Specifically, times at 5, 15, and 25 meters were significantly faster with the KSR and KSL starts compared to the GS (1.66 ± 0.14 s and 1.68 ± 0.13 s vs. 1.79 ± 0.13 s; 5.86 ± 0.40 s and 5.88 ± 0.44 s vs. 6.00 ± 0.45 s; 10.64 ± 0.73 s and 10.61 ± 0.71 s vs. 10.74 ± 0.74 s, respectively). A comparable approach to the present study was identified in the work of Silveira et al. (2018), in which it was observed that front and rear KS resulted in faster performance times at the 5 m compared to GS (1.90 ± 0.19 s and 1.89 ± 0.16 s vs. 1.98 ± 0.15 s, respectively), suggesting a potential advantage of this technique during the initial phase of the start [3]. Similar values to the present study found in the Honda et al. (2012) study (≅1.63 s) in KS with different kickplate position [19]. Similar values to ours at 15 m after GS (5.70 ± 0.50 s) were found by Stavrou and Voutselas (2024) [14]. In contrast, the findings of Vantorre et al. (2010a) in CS indicate an absence of disparities in the 15 m start time performance between the GS and TS (≅ 6.5 s) indicating that the different sport and the different type of the starting block influence the times in the 15 m [7]. Similar times were found at KS in CS at 15 m, as reported by Burkhardt et al. (2023) (≅ 7.0 s), where differences from changing from preferred to non-preferred leg position appeared to have a negative effect on starting performance, regardless of whether the stronger leg was in front or behind [8]. Also, Murrell and Dragunas (2012) report, in their introduction, that analysis of kinematic data in previous studies had shown no difference in start times to finger entry, 6.07 m, 10 m or 15 m between GS and TS [6]. In another study, by Tor et al. (2014), examined the KS where male swimmers achieved times at 5 m and 15 m (1.47 ± 0.05 s and 6.12 ± 0.16 s respectively) while female swimmers recorded 1.67 ± 0.08 s and 7.07 ± 0.28 s, respectively [2].
The RT should be as short as possible, while the movement phases in the block biomechanics of the swim start must last long enough to maximize the swimmer’s impulse to reach high horizontal velocity [7,20]. In the present study, no statistically significant differences were observed in RT among the GS, KSR, and KSL techniques (0.21 ± 0.02 s vs. 0.22 ± 0.02 s vs. 0.20 ± 0.03 s, respectively). These findings align with previous research in competitive swimming, where the start technique did not significantly affect RT. Vantorre et al. (2010a) reported similar RT values between the GS (0.20 ± 0.03 s) and the traditional TS (0.20 ± 0.02 s) [7]. Also, according to the study by Blanksby et al. (2002), the type of start did not significantly affect RT. The study revealed no statistically significant differences between the techniques. The pre-intervention measurements indicated a mean reaction time of 0.21 ± 0.05 s for the GS, and 0.23 ± 0.04 s for the TS. Following the intervention, the techniques demonstrated improvements of approximately 0.19 s [9].
The BT was significantly briefer in the KSR and KSL compared to the GS (0.71 ± 0.08 s and 0.69 ± 0.06 s vs. 0.83 ± 0.04 s, respectively), indicating a faster detachment of the finswimmer from the starting block. These findings align with those in CS, where the GS technique is also associated with prolonged BT. Lee et al. (2012) documented a shorter BT during the TS (0.79 ± 0.05 s) than the GS (0.84 ± 0.07 s) and attributed this difference to the location of the center of mass. They reported that, in the GS, the center of mass is positioned further back from the edge of the block, requiring more time for forward displacement and the initiation of propulsion. In contrast, in the TS, placing one’s foot closer to the edge of the block shifts the center of mass forward, allowing for a quicker transition into the take-off phase [21]. Compared to the traditional GS, the KS reduced the on-block time [22,23]. According to the study by Welcher et al. (2008), a statistically significant difference was observed in BT between the GS = 0.87 ± 0.05 s and the rear-weighted TS = 0.87 ± 0.08 s vs. the front-weighted TS = 0.80 ± 0.06 s, with the front-weighted TS demonstrating a faster block time compared to the other two start variations [24]. In contrast, the study by Blanksby et al. (2002), the type of start did not significantly affect BT. The results showed no statistically significant differences between techniques, as the pre-intervention measurements indicated a mean block time of 0.86 ± 0.07 s for the GS, and 0.88 ± 0.08 s for the TS. Following the intervention, the techniques demonstrated improvements of approximately 0.83 s [9]. Nevertheless, evidence suggests that KS techniques facilitate more immediate acceleration, possibly due to the shorter BT and the more advantageous positioning of the body’s center of mass.
The FD remained comparable between the GS vs KRS vs KSL (2.9 ± 0.3 m vs 2.9 ± 0.3 m vs 3.0 ± 0.4 m) while the GS exhibited a shorter FT compared to the KSR and KSL (0.22 ± 0.07 s vs 0.26 ± 0.06 s and 0.28 ± 0.06 s). Regarding FD, the study by Jorgić et al. (2010) revealed that the FD of the GS (3.21 ± 0.17 m) is approximately 0.23 m greater than that of the TS (2.98 ± 0.13 m) [25]. Studies by Tor et al. (2015b) and Honda et al. (2012) measured a similar FD (≅2.96 m and 2.74, respectively) [19,26] as in our study. Our results differed significantly from those of Stavrou and Voutselas (2024) (130.3 ± 9.1 cm) [14] probably due to the measurement method. The shorter FT of the GS is consistent with previous studies on conventional swimming starts, which have shown that TS are linked to longer FT due to differences in push-off angles and the body’s center of mass position during the take-off phase. Cicenia et al. (2019) investigated FT across three different kick plate positions and found no statistically significant differences between groups with the FT was approximately 0.30 s just about our own findings [27]. This phenomenon may be explained by a higher initial horizontal take-off velocity in the GS, possibly due to the symmetrical foot placement that allows for a more powerful push-off from the block [10]. Matúš et al. (2021) support the idea that asymmetrical stances often result in a more vertical and less linear push-off, leading to longer FT without increasing FD [4].
Regarding the BEA, no statistically significant differences were observed between the GS, KSR and KSL (41 ± 8° vs 42 ± 5° vs 39 ± 6°). The literature does not provide clear data directly comparing the entry angle between the GS and the KS. However, it is considered that the flight trajectory followed by the athletes may influence the angle of entry. Jorgić et al. (2010) observed that the BEA in the GS (33.33 ± 5.13°) is approximately 4 degrees greater than in the TS (29.33 ± 5.51°). Their study found that the BEAs are significantly smaller than those observed in our study, but similarly no statistically significant difference in BEA measurement was found between GS and TS [25]. Similar, in the study conducted by Silveira et al. (2018), the BEA was found to be 36.9° ± 5.1° for the GS, 37.3° ± 3.6° for the Front TS, 37.5° ± 4.1° for the Rear TS, 37.8° ± 4.0° for the Front KS, and 36.8° ± 5.0° for the Rear KS. Although slight variations were observed between techniques, these differences were not statistically significant, suggesting that BEA alone may not serve as a key differentiating factor across start variations [3]. Furthermore, Lee et al. (2012) conducted a study that examined the BEA in both GS and TS techniques. The study concluded that there was no statistically significant difference between them in terms of entry angles of 37.6 ± 5.9° for the GS and 40.9 ± 3.9° for the TS [21]. In the study by Thanopoulos et al. (2012), no statistically significant differences in BEA were observed between the GS and TS techniques for either male (44.22° ± 5.58° vs. 43.85° ± 4.48°) or female swimmers (45.18° ± 4.02° vs. 44.79° ± 4.00°) and no gender difference was observed, consistent with the findings of the present study. Overall, the findings indicate that BEA remains relatively consistent across start techniques and genders, a fact that athletes can adapt both starting styles for effective body entries in water [28].
Regarding the ΒΕΤ, no statistically significant differences were observed among the three starting techniques examined in the present study (GS = 0.37 ± 0.02 s vs KSR = 0.37 ± 0.03 s vs KSL = 0.37 ± 0.05 s. Guimaraes and Hay (1985) and Hay (1988) concluded that BET is more important to the start phase than either block time or flight time (explaining 95% of the variance of the starting time for r = 0.97) [29,30,31]. Based on the results presented by Silveira et al. (2018), the BET was reported as 0.35 ± 0.04 s for the GS, 0.35 ± 0.05 s for the Front TS, 0.34 ± 0.04 s for the Rear TS, 0.35 ± 0.04 s for the Front KS, and 0.33 ± 0.04 s for the Rear KS [3]. Also, as reported by Vantorre et al. (2010a), the BET into the water did not significantly differ based on the start technique, with entry times recorded as 0.28 ± 0.04 s for the GS and 0.27 ± 0.12 s for the TS [7]. These findings are very close to ours (note that our measurements included the time it took for the fins were submerged), although slight variations were observed among the different start techniques, these differences were not statistically significant, indicating that BET alone may not be a critical factor in distinguishing start performance across start styles [3,7].
No statistically significant differences were documented in the D (GS = 0.92 ± 0.12 m, KSR = 0.93 ± 0.27 m, and KSL = 0.92 ± 0.30 m), in the UW (GS = 13.4 ± 0.8 m, KSR 13.2 ± 1.1 m, and KSL 13.3 ± 0.9 m), and in the DK (8 ± 1 dolphin kicks for all starting types). The study by Matúš and Kandráč (2020) found that maximum D upon water entry varied (0.75 to 0.92 m) based on the swimmer’s starting position and the OSB12 kick plate setting [32]. A recent study by Matúš et al. (2021) found that the maximum underwater depth was 0.90 m. This aligns with recommendations from Tor et al. (2015a), who researched optimizing underwater trajectories. They suggest that swimmers should aim for a maximum depth of about 0.92 m to reduce velocity loss during the underwater phase [4,5]. UW is more likely influenced by post-entry technique, body alignment, and propulsion efficiency during the glide and dolphin kick phases than by the initial start method. In accordance with the findings and recommendations set out by Tor et al. (2015b), it is recommended that swimmers extend UW and delay the initiation of the first undulatory kick at approximately 6.6 m, with an aim to minimize the velocity lost during the underwater phase and enhance performance [26]. According to Veiga et al. (2014, 2022), the number of DK exhibited significant variation depending on the experimental condition. Calculations indicated that the number of underwater DK at 15 m ranged from 8 to 12 kicks in the underwater segments of the start and turns [33,34].
The HA, KA, and AA for GS were 29 ± 4°, 141 ± 9°, and 97 ± 7°, respectively. No statistically significant differences were found between KSR and KSL in FHA (26 ± 4° vs. 24 ± 3°), BHA (37 ± 4° vs. 40 ± 5°), FKA (144 ± 9° vs. 141 ± 9°), BKA (85 ± 10° vs. 87 ± 13°), FAA (103 ± 8° vs. 101 ± 7°), and BAA (77 ± 8° vs. 72 ± 10°). In the present study, the level of HA was found to be marginally elevated in GS relative to KS, with the range of values observed aligning closely with the extant literature on CS for GS and TS, as reported in the study by Vantorre et al. (2011) (26–30°) [35]. In contrast, the studies conducted by Matúš and Kandráč (2020) and Matúš et al. (2021) revealed that the range of HA in KS varied from 41° to 48° [4,32]. With regard to the KA in GS, the present study’s findings exhibited a considerable divergence from those reported by Stavrou and Voutselas (2024), who determined a value of 107.1 ± 8.9° [14]. In consideration of the KA in KS, the findings of the study of Matuš et al. (2020) in CS offer a relevant result obtained in our study. The study’s objective was to compare starts on the OSB12 starting block in different kickplate positions and to neutral-weighted and rear-weighted. The study’s findings indicated that the lowest and highest front and rear knee angles (124.8° ± 1.9° to 132.7° ± 1.8°, and 76.7° ± 1.5° to 96.0° ± 1.6°, respectively) were observed [32]. The KAs at the KS that were observed in the present study appear to be within the appropriate range. These observations are corroborated by the findings of Matúš et al. (2021) in CS, who posit that the angles of the front and rear knees are 135° – 140° and 75° – 85°, respectively [4].
The correlation analysis revealed several statistically significant relationships between performance indicators (times at 5, 15, and 25 m) and both anthropometric parameters and kinematic start components. Faster T5, T15, and T25 times were correlated with greater H, W, and S, according to previous research [29], increased FD across all start types was in line in Ruschel et al. (2007) study for GS (r = - 0.482) [36], extended FTKSL as in Vantorre et al. (2010a) study (r = -0.31, p = 0.05) [7], however, Ruschel et al. (2007) reported that there is no correlation between FT and T15 (r = 0.039) [36], and shorter BETKSL. The findings of the present study suggest that swimmers with greater anthropometric characteristics have the potential to attain enhanced performance, which was associated with extended FT and shorter BET during KS executed with the left leg positioned on the kickplate. In our study there was a lack of correlation of T5-15-25 with KA or BT which had been observed in previous studies [4,7,24], however, the findings were consistent with those reported by Ruschel et al. (2007), who observed a correlation between T15 and BT (r = -0.115) in GS [36].
A shorter BTGS was associated with longer FDGS and FTGS. Similarly, a shorter BTKSL was linked to a longer FTKSL, indicating a trade-off between time spent on the block and the effectiveness of the flight phase. Vantorre et al. (2010b) posit that the block phase must be sufficiently prolonged to optimize the impulse, thereby ensuring that the swimmer exits the block with the greatest possible horizontal velocity [37].
Also, correlation analysis showed that lengthier FD was significantly associated with extended FT, and smaller BEA in all start types. Taladriz et al. (2015) observed that, although the KS produced a higher deceleration rate than the GS, this phenomenon resulted in the swimmers experiencing a lower acceleration rate when their feet left the block [23]. This finding suggests that enhancing take-off capabilities may enable augmented horizontal displacement in the air without compromising entry efficiency. Specifically, a greater FDKSL was associated with a more rapid BETKSL, and a prolonged FTKSL was correlated with a diminished BETKSL. In accordance with the assertions put forward by Vantorre et al. (2014), the generation of sufficient momentum is imperative in ensuring entry into the water at a considerable velocity [30].
A smaller BEAKSL was found to be associated with a faster BETKSL. Vantorre et al. (2014) report that in order to manage the angular momentum generated during the block phase, swimmers have the capacity to make a start with a reduced angular momentum [30] indicating that swimmers who enter the water at a shallower angle may do so more expeditiously. In contrast, a positive correlation was observed between larger BEAKSR and BEAKSL and more DKSR and DKSL, respectively. This finding suggests that, in the case of KS, the larger the BEA, the greater the body’s emergence, thereby enhancing the efficacy of subsequent dolphin kicks. As asserted by Tor et al. (2015a), the act of entering the water at a flatter angle can be counteracted if the swimmer fails to sustain velocity during the underwater phase. This is attributable to an augmented amount of resistance exerted on the swimmer [5]. Finally, deeper DKSR and DKSL were strongly correlated with extended UWKSR and UWKSL, and with a greater number of DKKSR and DKKSL, respectively. These findings suggest that swimmers capable of deeper underwater trajectory generating more dolphin kicks can sustain underwater propulsion for longer durations [38].
In contrast to previous studies, our research found no significant correlations between body angles and any performance or kinematic variables. Slawson et al. (2012) reported strong positive correlations between rear knee angle and peak force in both horizontal (r = 0.701) and vertical directions (r = 0.688), as well as a moderate correlation between rear knee angle and peak horizontal force (r = 0.511) [10]. Similarly, Matuš et al. (2021) identified significant associations between start posture, particularly head, ankle, knee, and shoulder positions, and early race performance. Notably, the front ankle angle correlated with block time (r = 0.63), while back knee (r = 0.56) and front ankle angles (r = 0.51) were also linked to 5 m time [4].
Based on the results and correlation analysis presented, we can summarize that the KS, particularly the KSL, appears to be the most effective and superior technique for finswimmers and consistently achieved faster times at 5m, 15m, and 25m [39]. This indicates a more powerful and efficient start phase in short- and mid-range distances. Shorter BTKSL were observed in KSL, indicating that a faster transition of the block means more time profit. Longer FDKSL and longer FTKSL were positively correlated with performance. KSL allowed swimmers to travel further and stay airborne longer, improving the water entry angle and speed. Higher BEAKSL correlated with better DKSL and UW. This makes the KSL more advantageous for maximizing underwater efficiency before breaking out. Even though the majority of the finswimmers (11 out of 13) indicated that their right foot was both strong and preferable and placed on the kickplate, it has been demonstrated that when it is positioned at the edge in front, it appears to enhance the start. In the [40] study there was a similar preference with the left leg most preferred as the rear foot regularly used during a kick start (6 vs 4 swimmers), thereby underscoring the significance of the left leg positioned on the kickplate and the right at the front edge of the block as preferable and strong leg.
The study’s limitations included the inability to ascertain the position of the body’s center of mass on the starting board and the position of the kickplate. The previously mentioned data would enable the formulation of more comprehensive conclusions. It can be concluded that these results would facilitate a more precise determination of the optimal start for finswimmers.
4.1. Recommendations for Coaches and Bi-Finswimmers
Prioritize KS over GS in case of CMAS permitting this start. It is effective especially in sprint events, where start phases heavily impact overall race time. Emphasize KSL that yielded the fastest times at 5m, 15m, and 25m and showed significant correlations with powerful underwater phases. Develop explosive strength and RT to reduce block time. Improve the effectiveness of DK and ensure that the permissible UW was fully utilized. Assess leg dominance to decide between KSR and KSL. Furthermore, it is a good idea to train both sides in younger swimmers to promote bilateral skill development.
5. Conclusions
The study’s findings indicate that the Kick Start technique generally provides superior performance advantages over the Grab Start, particularly in terms of block time in Bi-Finswimming. It is recommended that the aforementioned be legalized by CMAS. However, the performance of the start is multifactorial and is profoundly influenced by anthropometric variables, flight kinematics, block exit dynamics, and underwater kicking efficiency. Nevertheless, individualized assessments remain paramount, as certain athletes may demonstrate superior performance with the preferable start based on biomechanics and comfort.
Author Contributions
Conceptualization, G.K. and G.T.; methodology, G.K.; software, G.K. and A. P.; validation, G.T., A.P. and I.K.; formal analysis, G.K.; investigation, G.K.; resources, G.K.; data curation, G.K.; writing—original draft preparation, G.K.; writing—review and editing, G.T.; visualization, G.K.; supervision, G.T.; project administration, G.T. All authors have read and agreed to the published version of the manuscript.
Funding
This research received no external funding.
Institutional Review Board Statement
The study was conducted in accordance with the Declaration of Helsinki and approved by the Local Ethics Research Committee of the School of Physical Education and Sport Science at Serres, Aristotle University of Thessaloniki (ERC-007/2025), 14 March 2025 for studies involving humans.
Informed Consent Statement
Informed consent was obtained from all subjects involved in the study.
Data Availability Statement
The data that supports the findings of this study are available upon request to the corresponding author.
Conflicts of Interest
The authors declare no conflicts of interest.
References
- CMAS. Finswimming Rules – Version 2024_01_EN. Available online: https://www.cmas.org/media/pdf/CMAS%20Finswimming%20Rules_V2024_01_EN.pdf (accessed on 18 July 2025).
- Tor, E.; Pease, D.L.; Ball, K.A. Characteristics of an elite swimming start. In Proceedings of the Biomechanics and Medicine in Swimming XII; Canberra, Australia, 18–22 April 2014; pp. 257–263. [Google Scholar]
- Silveira, R.P.; Guimarães, C.R.; Moreira, A.; et al. Key determinants of time to 5 m in different ventral swimming start techniques. Eur. J. Sport Sci. 2018, 18, 1317–1326. [Google Scholar] [CrossRef]
- Matúš, I.; Ružbarský, P.; Vadašová, B. Key parameters affecting kick start performance in competitive swimming. Int. J. Environ. Res. Public Health 2021, 18, 11909. [Google Scholar] [CrossRef]
- Tor, E.; Pease, D.L.; Ball, K.A. Key parameters of the swimming start and their relationship to start performance. J. Sports Sci. 2015, 33, 1313–1321. [Google Scholar] [CrossRef]
- Murrell, D.; Dragunas, A. A comparison of two swimming start techniques from the Omega OSB11 starting block. West. Undergrad. Res. J. Health Nat. Sci. 2012, 3. Available online: https://ir.lib.uwo.ca/wurjhns/vol3/iss1/4 (accessed on 8 August 2025). [CrossRef]
- Vantorre, J.S.L.; Seifert, L.; Fernandes, R.J.; Vilas-Boas, J.P.; Chollet, D. Biomechanical influence of start technique preference for elite track starters in front crawl. Open Sports Sci. J. 2010, 3, 137–139. [Google Scholar] [CrossRef]
- Burkhardt, D.; Alberty, M.; Fernandez-Fernandez, J.; et al. Key performance indicators and leg positioning for the kick-start in competitive swimmers. Sports Biomech. 2023, 22, 752–766. [Google Scholar] [CrossRef]
- Blanksby, B.; Nicholson, L.; Elliott, B. Swimming: Biomechanical analysis of the grab, track and handle swimming starts: an intervention study. Sports Biomech. 2002, 1, 11–24. [Google Scholar] [CrossRef]
- Slawson, S.E.; Conway, P.P.; Cossor, J.M.; West, A.A.; Chatard, J.C. The effect of knee angle on force production in swimming starts using the OSB11 block. Procedia Eng. 2012, 34, 801–806. [Google Scholar] [CrossRef]
- Takeda, T.; Sakai, S.; Takagi, H.; Okuno, K.; Tsubakimoto, S. Contribution of hand and foot force to take-off velocity for the kick-start in competitive swimming. J. Sports Sci. 2017, 35, 565–571. [Google Scholar] [CrossRef] [PubMed]
- Sakai, S.; Takeda, T.; Tsubakimoto, S.; et al. Kinetics of four limb joints during kick-start motion in competitive swimming. Sports Biomech. 2024, 23, 1606–1624. [Google Scholar] [CrossRef] [PubMed]
- Liashenko, A.M.; Dielova, I.O.; Omelchenko, T.O. Comparative analysis of starting technique in competitive swimming and finswimming. Theory Method Phys. Educ. Sports 2019, 19, 159–167. [Google Scholar] [CrossRef]
- Stavrou, V.; Voutselas, V. Which start is faster in finswimming? Turk. J. Kinesiol. 2018, 4, 16–18. [Google Scholar] [CrossRef]
- Faul, F.; Erdfelder, E.; Lang, A.G.; Buchner, A. G*Power 3: A flexible statistical power analysis program for the social, behavioral, and biomedical sciences. Behav. Res. Methods 2007, 39, 175–191. [Google Scholar] [CrossRef]
- Jimenez-Perez, I.; De Jesus, K.; Gomez, A.; et al. Pre-exercise skin temperature evolution is not related with 100 m front crawl performance. J. Therm. Biol. 2021, 98, 102926. [Google Scholar] [CrossRef]
- Karpiński, J.; Antosiak-Cyrak, K.; Krzykała, M.; et al. The effects of a 6-week core exercise program on swimming performance of national level swimmers. PLOS ONE 2020, 15, e0227394. [Google Scholar] [CrossRef]
- Hopkins, W.G.; Marshall, S.W.; Batterham, A.M.; Hanin, J. Progressive statistics for studies in sports medicine and exercise science. Med. Sci. Sports Exerc. 2009, 41, 3–13. [Google Scholar] [CrossRef] [PubMed]
- Honda, K.; Satou, K.; Ogita, F. The effect of starting position on elite swim start performance using an angled kick plate. In Proceedings of the International Society of Biomechanics in Sports (ISBS); Melbourne, Australia, 2–6 July 2012. [Google Scholar]
- Breed, R.V.P.; Young, W.B. The effect of a resistance training programme on the grab, track and swing starts in swimming. J. Sports Sci. 2003, 21, 213–220. [Google Scholar] [CrossRef] [PubMed]
- Lee, C.-Y.; Huang, C.-F.; Lee, C.-W. Biomechanical analysis of the grab and track swimming starts. In Proceedings of the International Society of Biomechanics in Sports (ISBS); 2012.
- Biel, K.; Smith, J.; Novak, A. Kinematic analysis of take-off performance in elite swimmers: New OSB11 versus traditional starting block. In Proceedings of the Biomechanics and Medicine in Swimming XI, Oslo, Norway; 2010. [Google Scholar]
- Taladriz, S. Effect of rear foot and back plate in the swimming start performance. In Contemporary Swim Start Research; Smith, A., Ed.; Sports Science Press: Berlin, Germany, 2017; pp. 76–88. [Google Scholar]
- Welcher, R.L.; Hinrichs, R.N.; George, T.R. Front- or rear-weighted track start or grab start: Which is the best for female swimmers? Sports Biomech. 2008, 7, 100–113. [Google Scholar] [CrossRef]
- Jorgić, B.; Stanković, R.; Đurović, M. The kinematic analysis of the grab and track start in swimming. Facta Univ. Ser. Phys. Educ. Sport 2010, 8, 31–36. [Google Scholar]
- Tor, E.; Pease, D.L.; Ball, K.A. Comparing three underwater trajectories of the swimming start. J. Sci. Med. Sport 2015, 18, 725–729. [Google Scholar] [CrossRef]
- Cicenia, A.; Oster, M.; Mokha, M. Kick plate position and track start biomechanics in elite swimmers. J. Exerc. Nutr. 2019, 2, 83. [Google Scholar] [CrossRef]
- Thanopoulos, V.; Malliou, P.; Donti, O.; et al. Differences in the efficiency between the grab and track starts for both genders in Greek young swimmers. J. Hum. Kinet. 2012, 32, 43–50. [Google Scholar] [CrossRef] [PubMed]
- Guimaraes, A.C.S.; Hay, J.G. A mechanical analysis of the grab starting technique in swimming. J. Appl. Biomech. 1985, 1, 25–35. [Google Scholar] [CrossRef]
- Vantorre, J.; Chollet, D.; Seifert, L. Biomechanical analysis of the swim-start: a review. J. Sports Sci. Med. 2014, 13, 223–231. [Google Scholar]
- Hay, J.G. The status of research on the biomechanics of swimming. In Swimming Science V; Terauds, J., Bedingfield, E.W., Eds.; University Publishers: Baltimore, MD, USA, 1988; pp. 3–14. [Google Scholar]
- Matúš, I.; Kandráč, R. Kinematic analysis of the kick start from OSB12. Phys. Act. Rev. 2020, 8, 86–96. [Google Scholar] [CrossRef]
- Veiga, S.; Cala, A.; Frutos, P.G.; Navarro, E. Comparison of starts and turns of national and regional level swimmers by individualized-distance measurements. Sports Biomech. 2014, 13, 285–295. [Google Scholar] [CrossRef]
- Veiga, S.; Roig, A.; Gatta, G.; Rodriguez, F.A. Effects of extended underwater sections on the physiological and biomechanical parameters of competitive swimmers. Front. Physiol. 2022, 13, 815766. [Google Scholar] [CrossRef]
- Vantorre, J.; Seifert, L.; Vilas-Boas, J.P.; Fernandes, R.; Bideau, B.; Nicolas, G.; Chollet, D. Biomechanical analysis of starting preference for expert swimmers. In Proceedings of the XXIX International Conference on Biomechanics in Sports (ISBS); Porto, Portugal, 4–8 July 2011; published as: Portug. J. Sport Sci. 2011, 11 (Suppl. 2), 415–418. [CrossRef]
- Ruschel, C.; Haupenthal, A.; Pereira, S.M.; Roesler, H. Kinematical analysis of the swimming start: block, flight and underwater phases. In Proceedings of the XXV International Symposium on Biomechanics in Sports (ISBS); Ouro Preto, Brazil, 23–27 August 2007. [Google Scholar]
- Vantorre, J.; Seifert, L.; Fernandes, R.J.; Vilas-Boas, J.P.; Chollet, D. Kinematical profiling of the front crawl start. Int. J. Sports Med. 2010, 31, 16–21. [Google Scholar] [CrossRef]
- Whitten, P. Should we limit the underwater fly? Swimming World & Junior Swimming 1997, 38, 34–36. [Google Scholar]
- Beretić, I.; Đurović, M.; Okičić, T. Influence of the back plate on kinematical starting parameter changes in elite male Serbian swimmers. Facta Univ. Ser. Phys. Educ. Sport 2012, 10, 135–140. [Google Scholar]
- Barlow, H.; Abbiss, C.; Middleton, K.; editors. The effect of different kick start positions on OMEGA OSB11 blocks on free swimming time to 15 m in developmental level swimmers. Hum. Mov. Sci. 2014, 34, 178–186. [Google Scholar] [CrossRef] [PubMed]
Figure 1.
Grab Start (GS) and Kick Start with the left leg on the kickplate (KSL).
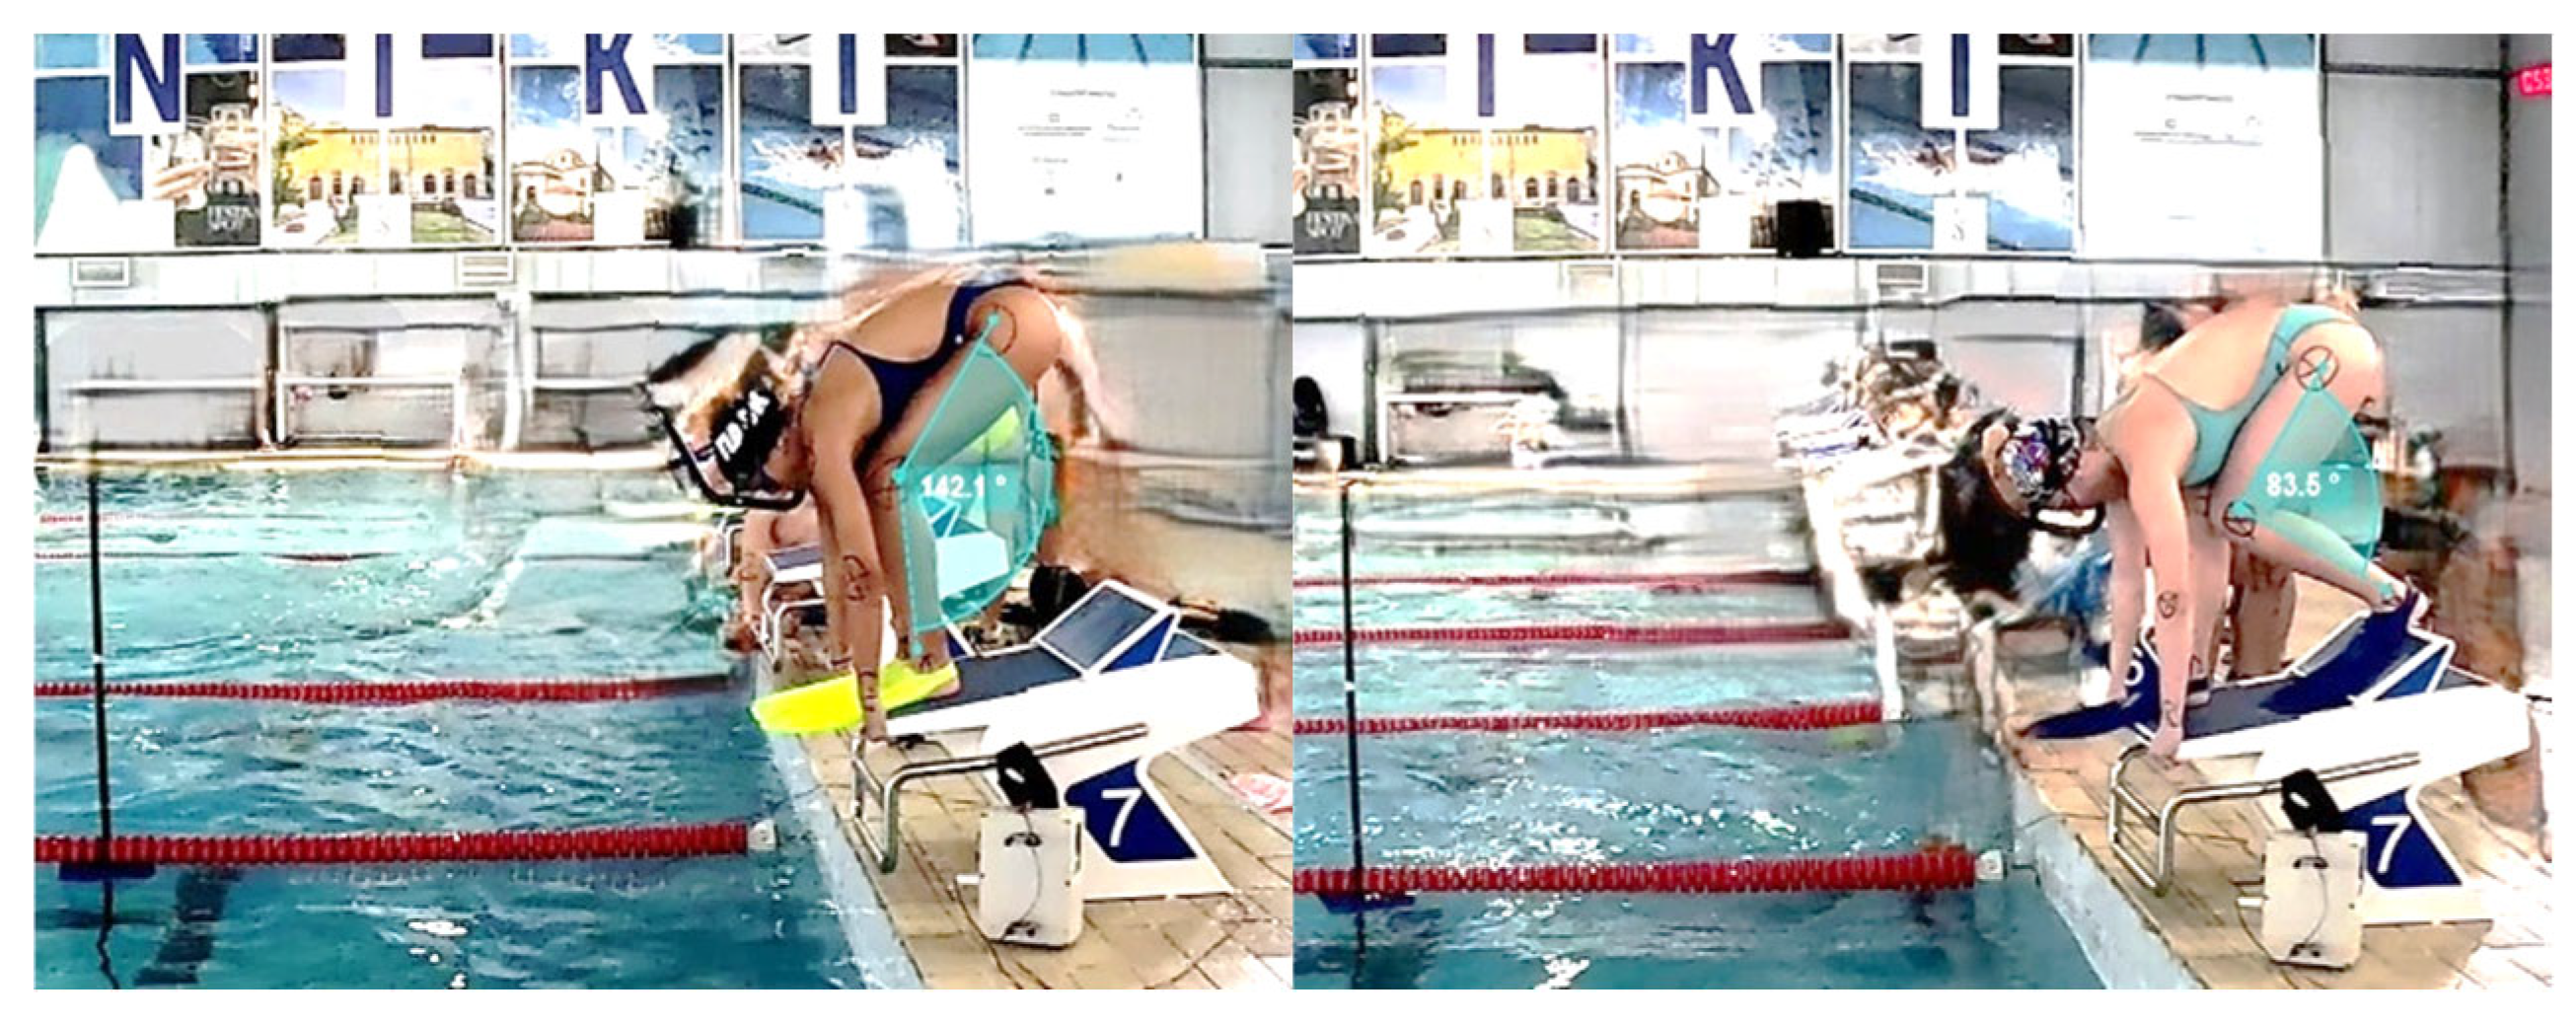
Figure 2.
Four fully synchronized cameras recorded the start of the finswimming.
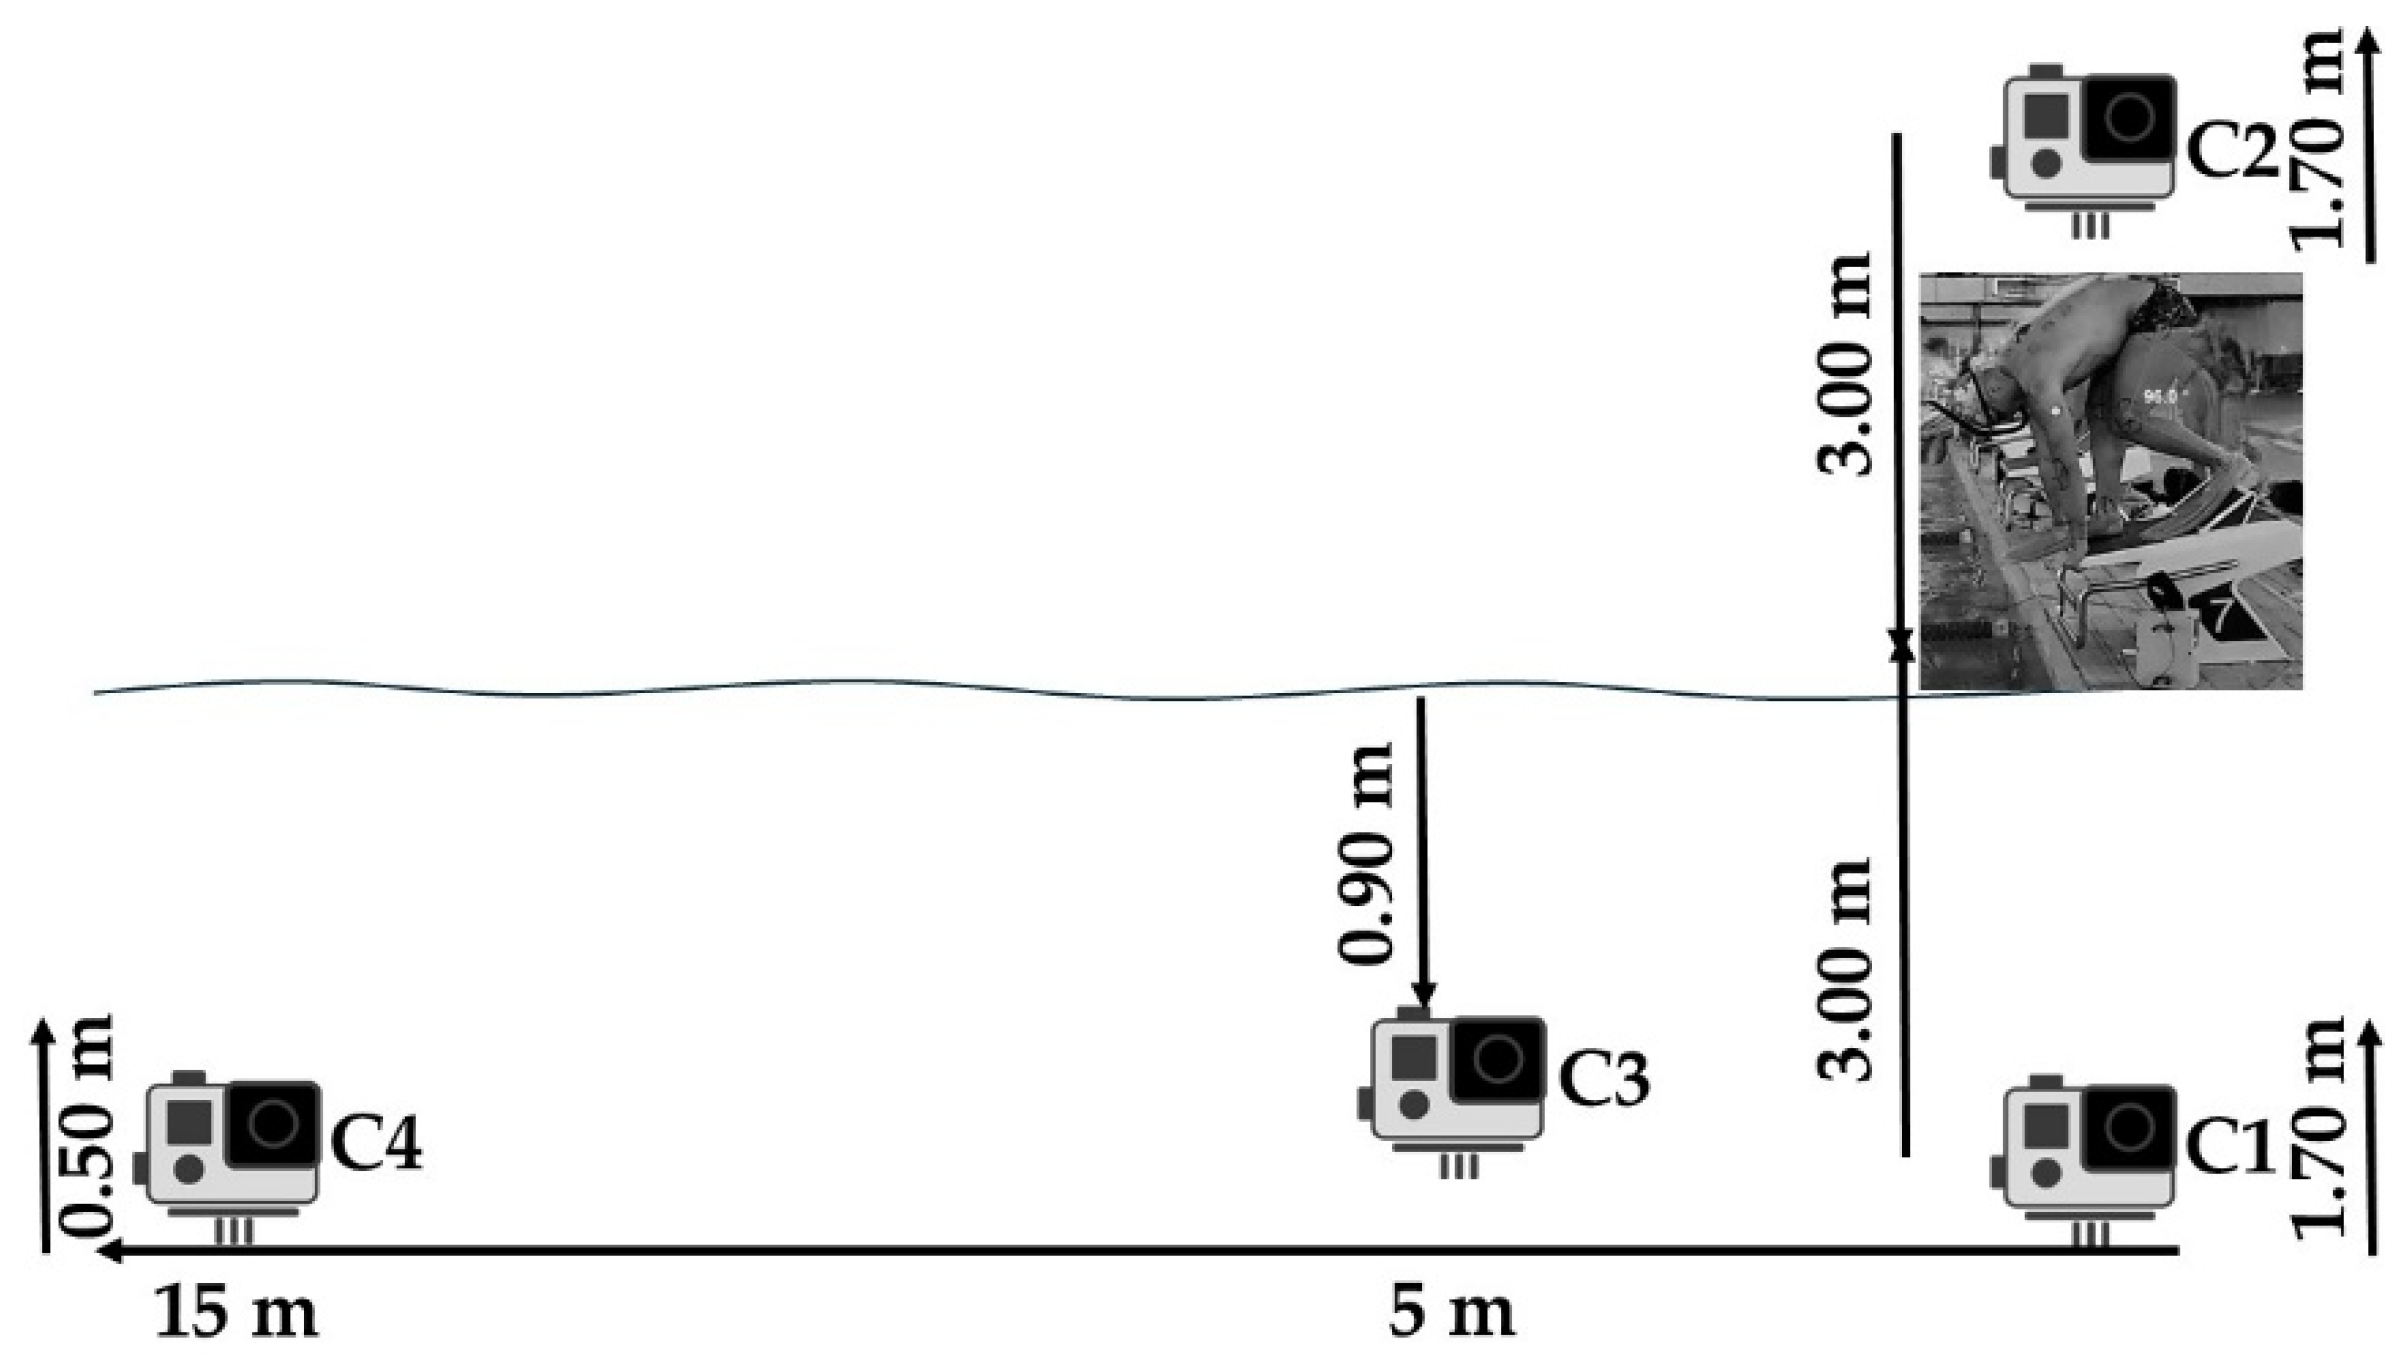

Table 1.
The demographic and anthropometric characteristics of the participants are presented.
| Athletes | Genter |
Age (y) |
Height (m) |
Weight (kg) |
Preferred leg on the kickplate |
Size of fins |
| 1 | M | 17.7 | 1.88 | 85.3 | R | 44 |
| 2 | M | 17.3 | 1.75 | 65.6 | R | 41 |
| 3 | M | 18.4 | 1.70 | 69.4 | R | 41 |
| 4 | M | 15.7 | 1.83 | 73.2 | R | 41 |
| 5 | M | 19.5 | 1.88 | 87.2 | R | 44 |
| 6 | M | 16.6 | 1.83 | 83.5 | R | 44 |
| 7 | M | 23.4 | 1.77 | 86.4 | L | 41 |
| 8 | F | 17.2 | 1.70 | 67.2 | R | 38 |
| 9 | F | 16.0 | 1.70 | 58.6 | R | 38 |
| 10 | F | 15.5 | 1.57 | 50.7 | R | 38 |
| 11 | F | 16.9 | 1.69 | 58.3 | R | 38 |
| 12 | F | 16.7 | 1.71 | 62.1 | R | 38 |
| 13 | F | 19.2 | 1.68 | 57.4 | L | 38 |
y = years; m = meters; kg = kilograms; M = male; F = female; R = right leg; L = left leg.
Table 2.
The mean ± SD is used to show the values of times, lengths and angles in the present study.
Table 2.
The mean ± SD is used to show the values of times, lengths and angles in the present study.
| Parameters /// Start type | GS | KSR | KSL |
| T5 - Time 5m (s) | 1.79 ± 0.13 ** | 1.66 ± 0.14 | 1.68 ± 0.13 |
| T15 - Time 15m (s) | 6.00 ± 0.45 ** | 5.86 ± 0.40 | 5.88 ± 0.44 |
| T25 - Time 25m (s) | 10.74 ± 0.74 * | 10.64 ± 0.73 | 10.61 ± 0.71 |
| RT - Reaction time (s) | 0.21 ± 0.02 | 0.22 ± 0.02 | 0.20 ± 0.03 |
| BT - Block time (s) | 0.83 ± 0.04 ** | 0.71 ± 0.08 | 0.69 ± 0.06 |
| FD - Flight distance (m) | 2.9 ± 0.3 | 2.9 ± 0.3 | 3.0 ± 0.4 |
| FT - Flight time (s) | 0.22 ± 0.07 ** | 0.26 ± 0.06 | 0.28 ± 0.06 |
| BEA - Angle of body entry (o) | 41 ± 8 | 42 ± 5 | 39 ± 6 |
| BET - Body entry time (s) | 0.37 ± 0.02 | 0.37 ± 0.03 | 0.37 ± 0.05 |
| D - Diving depth (m) | 0.92 ± 0.12 | 0.93 ± 0.27 | 0.92 ± 0.30 |
| UW - Underwater distance (m) | 13.4 ± 0.8 | 13.2 ± 1.1 | 13.3 ± 0.9 |
| DK - Dolphin kicks (n) | 8 ± 1 | 8 ± 1 | 8 ± 1 |
| HA - Hip angle (o) | 29 ± 4 | ||
| FHA - Front hip angle (o) | 26 ± 4 | 24 ± 3 | |
| BHA - Back hip angle (o) | 37 ± 4 | 40 ± 5 | |
| KA - Knee angle (o) | 141 ± 9 | ||
| FKA - Front knee angle (o) | 144 ± 9 | 141 ± 9 | |
| BKA - Back knee angle (o) | 85 ± 10 | 87 ± 13 | |
| AA - Ankle angles (o) | 97 ± 7 | ||
| FAA - Front ankle angles (o) | 103 ± 8 | 101 ± 7 | |
| BAA - Back ankle angles (o) | 77 ± 8 | 72 ± 10 |
GS = Grab start; KSR = the right leg on the kickplate; KSL = the left leg on the kickplate; s = seconds; m = meters; o = degrees; **p < 0.001; *p < 0.05. Asterisks denote significant differences from the other two starting techniques.
Table 3.
Notable correlations among the examined parameters. It is important to note that the correlations refer to the parameters belonging to each start type.
Table 3.
Notable correlations among the examined parameters. It is important to note that the correlations refer to the parameters belonging to each start type.
| Parameters / Start type | GS | KSR | KSL |
| Pearson’s r / p | Pearson’s r / p | Pearson’s r / p | |
| T5—H | -.720 / 0.006 | -.716 / 0.006 | |
| T15—H | -.675 / 0.011 | -.587 / 0.035 | -.618 / 0.024 |
| T25—H | -.738 / 0.004 | -.682 / 0.010 | -.723 / 0.005 |
| T5—W | -.798 / 0.001 | -.680 / 0.011 | |
| T15—W | -.792 / 0.001 | -.762 / 0.002 | -.751 / 0.003 |
| T25—W | -.838 / 0.000 | -.774 / 0.002 | -.773 / 0.002 |
| T5—S | -.704 / 0.007 | -.756 / 0.003 | |
| T15—S | -.741 / 0,004 | -.726 / 0,005 | -.711 / 0,006 |
| T25—S | -.813 / 0,001 | -.803 / 0,001 | -.828 / 0,000 |
| T5—FD | -.738 / 0.004 | -.768/ 0.002 | -.798 / 0.001 |
| T15—FD | -.667 / 0.013 | -.855 / 0.000 | -.769 / 0.002 |
| T25—FD | -.670 / 0.012 | -.798 / 0.001 | -.806 / 0.001 |
| T5—FT | -.707 / 0.007 | ||
| T15—FT | -.663 / 0.013 | ||
| T25—FT | -.691 / 0.009 | ||
| T5—BET | .652 / 0.016 | ||
| T15—BET | 696 / 0.008 | ||
| T25—BET | .690 / 0.009 | ||
| BT—FD | -.616 / 0.025 | ||
| BT—FT | -.694 / 0.008 | -.656 / 0.015 | |
| FD —FT | .751 / 0.003 | .638 / 0.019 | .745 / 0.003 |
| FD—BEA | -.579 / 0.038 | -.638 / 0.019 | -.691 / 0.009 |
| FD—BET | -.727 / 0.005 | ||
| FT—BET | -.773 / 0.002 | ||
| BEA—BET | .652 / 0.016 | ||
| BEA—D | .709 / 0.007 | .604 /0.029 | |
| D—UW | .692 / 0.009 | .587 / 0.035 | |
| D—DK | .568 / 0.043 | .701 / 0.008 |
GS = grab start; KSR = the right leg on the kickplate; KSL = the left leg on the kickplate; T5, T15, T25 = times at 5, 15, and 25 m; H = height; W = weight; S = European fin size; FD = flight distance; FT = flight time; BET = time of the body entry in the water; BT = time on the starting block; BEA = angle of the body entry; D = diving depth; UW = underwater glide; DK = dolphin kicks.
Disclaimer/Publisher’s Note: The statements, opinions and data contained in all publications are solely those of the individual author(s) and contributor(s) and not of MDPI and/or the editor(s). MDPI and/or the editor(s) disclaim responsibility for any injury to people or property resulting from any ideas, methods, instructions or products referred to in the content. |
© 2025 by the authors. Licensee MDPI, Basel, Switzerland. This article is an open access article distributed under the terms and conditions of the Creative Commons Attribution (CC BY) license (http://creativecommons.org/licenses/by/4.0/).
Copyright: This open access article is published under a Creative Commons CC BY 4.0 license, which permit the free download, distribution, and reuse, provided that the author and preprint are cited in any reuse.


