
Submitted:
31 October 2025
Posted:
03 November 2025
You are already at the latest version
Abstract
Introduction : ADT is routinely combined with radiotherapy (RT) for intermediate- and high-risk prostate cancer. While prostate shrinkage may facilitate planning, prospective CT-based, patient-level estimates over short, workflow-relevant intervals are scarce. Methods: We conducted a prospective study of 47 patients starting luteinizing hormone–releasing hormone agonist (LHRHa) therapy (leuprolide, 6-month depot). Prostate volumes were independently contoured by three blinded radiation oncologists on paired CT scans at baseline and ~8 weeks post-injection. The primary outcomes were the mean relative volume change and the proportion achieving a clinically relevant reduction (≥15%). PSA and testosterone were recorded at both time points; correlations and exploratory univariable logistic regression for ≥15% reduction were performed at the patient level. Results: Mean relative volume reduction ranged from −18.5% to −21.3% across observers; ≥60% of patients met the ≥15% threshold (RT-A 61.7%, RT-B 66.0%, RT-C 74.5%). PSA and testosterone decreased substantially (e.g., median PSA from 9.64 to 1.84 ng/mL) and were moderately correlated (Spearman ρ=0.43, p=0.002; Pearson r=0.51, p< 0.001). No baseline clinical, histologic, or biochemical variable reached statistical significance for predicting ≥15% volume reduction; % PSA change showed a non-significant trend (OR 1.03; 95% CI 1.00–1.07; p=0.076). Conclusions: Short-course LHRHa induced consistent CT-measured cytoreduction, with most patients achieving ≥15% shrinkage within 8 weeks. Prostate downsizing was reproducible across readers and accompanied by marked PSA and testosterone declines, although biochemical responses did not predict volumetric change. These findings support incorporating a short neoadjuvant “window” before RT simulation and highlight the need for larger studies to refine predictors and compare agonist vs antagonist trajectories.
Keywords:
prostate cancer
; LHRHa
; ADT
; leuprolide
; CT
; radiotherapy planning
; cytoreduction
; organs at risk
; PSA
; testosterone
1. Introduction
Prostate cancer (PC) is the second most frequently diagnosed malignancy in men worldwide; in Spain, 32,967 new cases were recorded in 2022 [1]. For men with unfavorable-intermediate to very-high-risk localized disease, combining androgen deprivation therapy (ADT) with radiotherapy (RT) is endorsed across major clinical guidelines [2,3,4]. Although adding ADT to RT consistently improves survival in these groups, the optimal sequencing of ADT relative to RT (neoadjuvant vs concurrent/adjuvant) remains debated [5,6].
Beyond systemic control, ADT can shrink the prostate, yet the magnitude, timing, and inter-patient variability of this anatomical change are not well defined in a way that is directly actionable for RT planning [7]. Prior reports mixed modalities and schedules—e.g., ultrasound pre-ADT then CT post-ADT, or mpMRI pre-ADT then CT for planning—so pre/post volume was rarely measured with the same method, limiting validity for simulation workflows [8,9]. In routine practice, by contrast, CT is the universal, workflow-defining platform within RT departments: widely available, standardized across centers, and ultimately the imaging on which target and OAR contours are finalized.
Contemporary randomized evidence further suggests that when short-course ADT is combined with prostate-only RT, concurrent/adjuvant sequencing yields superior long-term oncologic outcomes compared with a neoadjuvant-first approach of equal duration (e.g., improved progression- or metastasis-free survival without excess grade ≥3 GI/GU toxicity) [5,6]. This evidence base creates a practical opportunity for a brief “mini-neoadjuvant” window—i.e., a short, time-limited interval to capture CT-quantified downsizing that facilitates dosimetry and OAR sparing—while preserving the oncologically favored concurrent/adjuvant backbone thereafter. However, standardized CT-based data specifying how much and how fast prostates shrink over short, workflow-relevant intervals remain scarce.
Against this background, we conducted a prospective evaluation of LHRH-agonist ADT (Leuprolide), using paired CT at ~8 weeks with independent delineations by three observers to (i) quantify prostate volume change at the patient level, (ii) estimate the proportion achieving a pre-specified clinically relevant reduction (≥15%), and (iii) explore who, when, and how much shrinkage occurs by relating volumetric change to concurrent PSA/testosterone dynamics and baseline clinical factors. By anchoring the analysis in CT—the modality that ultimately guides RT delivery—this study aims to provide immediately translatable evidence to refine simulation timing and personalize treatment planning.
2. Materials and Methods
2.1. Study Design
A prospective observational study was conducted including a cohort of 47 patients with localized PC, all evaluated by multidisciplinary oncologic committees. For those cases in which a combined treatment strategy with ADT and RT was recommended, patients were invited to participate during their first visit to the Radiation Oncology Department.
Patient recruitment took place between October 2023 and October 2024. All patients met predefined inclusion and exclusion criteria (available in the supplementary material). The study protocol was reviewed and approved by the Scientific Committee of the Hospital Universitario de Terrassa and received ethics approval from the Institutional Review Board (CEIm) under code 01-23-100-099. The study is also registered at ClinicalTrials.gov under ID NCT06184464. All participants signed informed consent in accordance with ethical and regulatory standards.
2.2. Procedure
Hormonal treatment consisted exclusively of Leuprolide acetate in atrigel formulation (Eligard®, 6-month depot), with no prior administration of oral antiandrogens (e.g., bicalutamide).
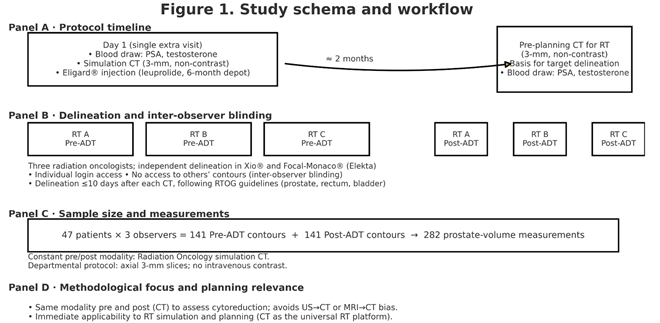
Each patient underwent two computed tomography (CT) scans:
The first CT scan was performed on Day 1 of the study, during a single visit to the Radiation Oncology Department. On that day, patients underwent blood sampling for PSA and testosterone, followed by the simulation CT scan, and finally Eligard® was administered by the department’s nursing staff. This initial scan was the only additional procedure outside routine clinical practice.
The second CT scan was performed two months after Eligard® injection, and corresponds to the standard scan used for target volume delineation prior to RT planning.
Both CT scans were performed with 3 mm axial slices, without intravenous contrast, using departmental protocols.
The prostate gland was independently contoured by three radiation oncologists, using the Xio® and Focal-Monaco® (Elekta) treatment planning systems with individualized login access. Each physician performed their contouring without access to the contours created by the other observers, thus ensuring inter-observer blinding and independence.
Each observer completed the delineation within 10 days after each scan, using available clinical history and following the RTOG guidelines for contouring of the prostate and organs at risk (rectum and bladder).
Given the inclusion of 47 patients, and the participation of three observers per patient, a total of:
141 pre-ADT prostate contours, and
141 post-ADT prostate contours
were obtained, amounting to a total of 282 prostate volume measurements.
2.3. Collected Variables
The following clinical and pathological variables were collected prior to radiotherapy:
Medical history (including hypertension, diabetes, dyslipidemia, cardiovascular disease, and combinations).
PSA level at time of diagnostic biopsy.
Date of biopsy.
Histologic data by lobe: Gleason score, number of affected cores, and total number of cores (right and left lobes).
Prostate volume (in cubic centimeters) as estimated by transrectal ultrasound.
Prostate volume (in cubic centimeters) as estimated by multiparametric MRI.
Presence of perineural invasion.
Radiologic classification from multiparametric MRI.
Risk group classification (low, intermediate, high).
In addition, the following study-specific variables were recorded:
- Date of first visit.
- Date of pre-ADT (baseline) simulation CT scan.
- Date of post-ADT simulation CT scan.
- PSA and testosterone levels prior to Eligard® injection.
- PSA and testosterone levels prior to radiotherapy planning (2 months post-ADT).
- Prostate volume according to each observer on both pre- and post-ADT CT scans.
- Acute genitourinary and gastrointestinal toxicities, classified according to CTCAE v5.0.
2.4. Follow-Up
After treatment completion, patients will continue routine follow-up every 6 months through either Urology or Radiation Oncology outpatient clinics, up to 10 years from the time of diagnosis, in accordance with institutional protocols.
Follow-up evaluations will include monitoring for biochemical recurrence, as well as early and late toxicities potentially related to RT or ADT. The time to testosterone recovery will also be tracked as a secondary outcome.
2.5. Sample Size Justification
At the time of study design, no prior references were available regarding the expected variability in percent prostate-volume change after ADT, nor a validated threshold of clinically meaningful reduction. We pre-specified that a ≥15% reduction could be considered clinically relevant.
Percent change was defined as:
%Δ= post-ADT volume -baseline volume x 100 (negative values indicate reduction)
baseline volume
Based on conservative assumptions (SD ≈ 40% at the patient level), a sample of 47 patients yields an estimated standard error ≈ 5.8% and a 95% CI half-width ≈ 11.4% for the mean % change, which we deemed acceptable for an exploratory estimation study. Multiple delineations per patient (total 282) increase precision for variance components and enable robust inter-observer agreement assessment (ICC), but are not counted as independent patients.
For context only, a traditional hypothesis-testing framework would require ~128 patients for 80% power to detect a mean change of −15% versus 0% (two-sided α=0.05), which informed future confirmatory planning.
2.6. Statistical Analysis
Analyses were performed at the patient level. Categorical variables were reported as absolute and relative frequencies (%), and continuous variables as mean ± SD or median (IQR), depending on distribution. Paired baseline vs post-ADT comparisons used the paired t-test or, when normality was not supported (Shapiro–Wilk), the Wilcoxon signed-rank test. Categorical variables were compared using the chi-square test or Fisher’s exact test. Statistical significance was set at p<0.05. Analyses were performed using IBM SPSS Statistics version 29.
3. Results
3.1. Baseline Characteristics
A total of 47 patients with localized prostate cancer were included. The median age at the time of the first visit was 76 years (IQR: 72–79; range: 55–86). The median PSA at diagnosis was 9.64 ng/mL
The prostate volume measured by multiparametric MRI had a median of 46.0 cc (IQR: 35.5–63.2), with values ranging between 20 and 113 cc.
Perineural invasion was reported in 34.0% of patients.
In terms of histological classification, the distribution according to the ISUP system was as follows: ISUP 1 (10.6%), ISUP 2: 20 patients (42.6%), ISUP 3 (Gleason 4+3): 15 patients (31.9%), ISUP 4 (Gleason ≥ 4+4): 7 patients (14.9%)
With respect to clinical risk group stratification, 25 patients (53.2%) were classified as intermediate risk and 22 patients (46.8%) as high risk, based on guideline-concordant definitions.

Table 1.
Baseline characteristics of the study population (n=47).
| Variable | Value |
| Age (years) | 76.0 (IQR: 72.0–79.0) |
| PSA at diagnosis (ng/mL) | 9.64 (IQR: 5.98–15.40) |
| Prostate volume by MRI (cc) | 46.0 (IQR: 35.5–63.2) |
| Perineural invasion | 34.0% |
| ISUP 1 (Gleason 3+3) | 5 / 47 (10.6%) |
| ISUP 2 (Gleason 3+4) | 20 / 47 (42.6%) |
| ISUP 3 (Gleason 4+3) | 15 / 47 (31.9%) |
| ISUP 4 (Gleason ≥ 4+4) | 7 / 47 (14.9%) |
| Risk group: Low | 2 / 47 (4.3%) |
| Risk group: Intermediate | 25 / 47 (53.2%) |
| Risk group: High | 22 / 47 (46.8%) |
Footnotes: Values are median (IQR) or n/N (%), unless otherwise specified.
3.2. Prostate Volume Before and After LHRHa
Before the initiation of LHRHa treatment, the mean prostate volume varied depending on the observer, ranging from 42.6 cc (RT A) to 55.4 cc (RT C). This initial variability among observers reflects expected differences in anatomical interpretation, despite the use of standardized contouring guidelines.
After two months of treatment with Eligard®, all observers documented a clear reduction in gland volume:
For RT A, prostate volume decreased from 42.6 ± 17.4 cc to 35.2 ± 15.7 cc, with a mean absolute reduction of 7.4 cc, equivalent to a mean relative reduction of 18.5%.
RT B reported a reduction of 10.7 cc, representing the greatest mean relative reduction (21.3%) among the three specialists.
In the case of RT C, volume decreased from 55.4 ± 24.3 cc to 44.7 ± 20.4 cc, with a mean relative reduction of 19.4%.
In all cases, the median percentage reduction exceeded the clinically relevant threshold of 15%, indicating that the majority of patients exhibited a favorable anatomical response after two months of hormonal therapy.
Table 2.
Prostate volume before and after ADT by observer (n=47).
| RT A | RT B | RT C | |
| Prostate volume pre-ADT (mean ± SD, cc) | 42.6 ± 17.4 | 50.4 ± 22.2 | 55.4 ± 24.3 |
| Prostate volume post-ADT (mean ± SD, cc) | 35.2 ± 15.7 | 39.7 ± 18.4 | 44.7 ± 20.4 |
| Absolute volume reduction (cc) | 7.4 | 10.7 | 10.6 |
| Mean relative reduction (%) | 18.5 ± 11.2 | 21.3 ± 10.4 | 19.4 ± 9.3 |
| Median relative reduction (%) | 16.1 | 20.6 | 18.8 |
Footnotes: Relative change defined as (post−baseline)/baseline×100; negative values indicate reduction.(Negative values indicate reduction; “relative change” defined as (post−baseline)/baseline ×100.).
3.3. Proportion of Patients with ≥15% Prostate Volume Reduction
The number of patients achieving a ≥15% reduction in prostate volume was analyzed for each of the three independent observers. This threshold was used to identify patients who demonstrated a clinically relevant anatomical response following ADT.
According to RT A, 29 out of 47 patients (61.7%) had a prostate volume reduction ≥15%. According to RT B, the number increased to 31 patients (66.0%).According to RT C, 35 patients (74.5%) met or exceeded the threshold.
The remaining patients did not reach the 15% reduction threshold and were classified as non-responders for this criterion.
Table 3.
Proportion of patients achieving ≥15% prostate volume reduction by observer (n=47).
| Observer | Patients with ≥15% reduction | Patients with <15% reduction | % with ≥15% reduction |
| RT A | 29 | 18 | 61.7% |
| RT B | 31 | 16 | 66.0% |
| RT C | 35 | 12 | 74.5% |
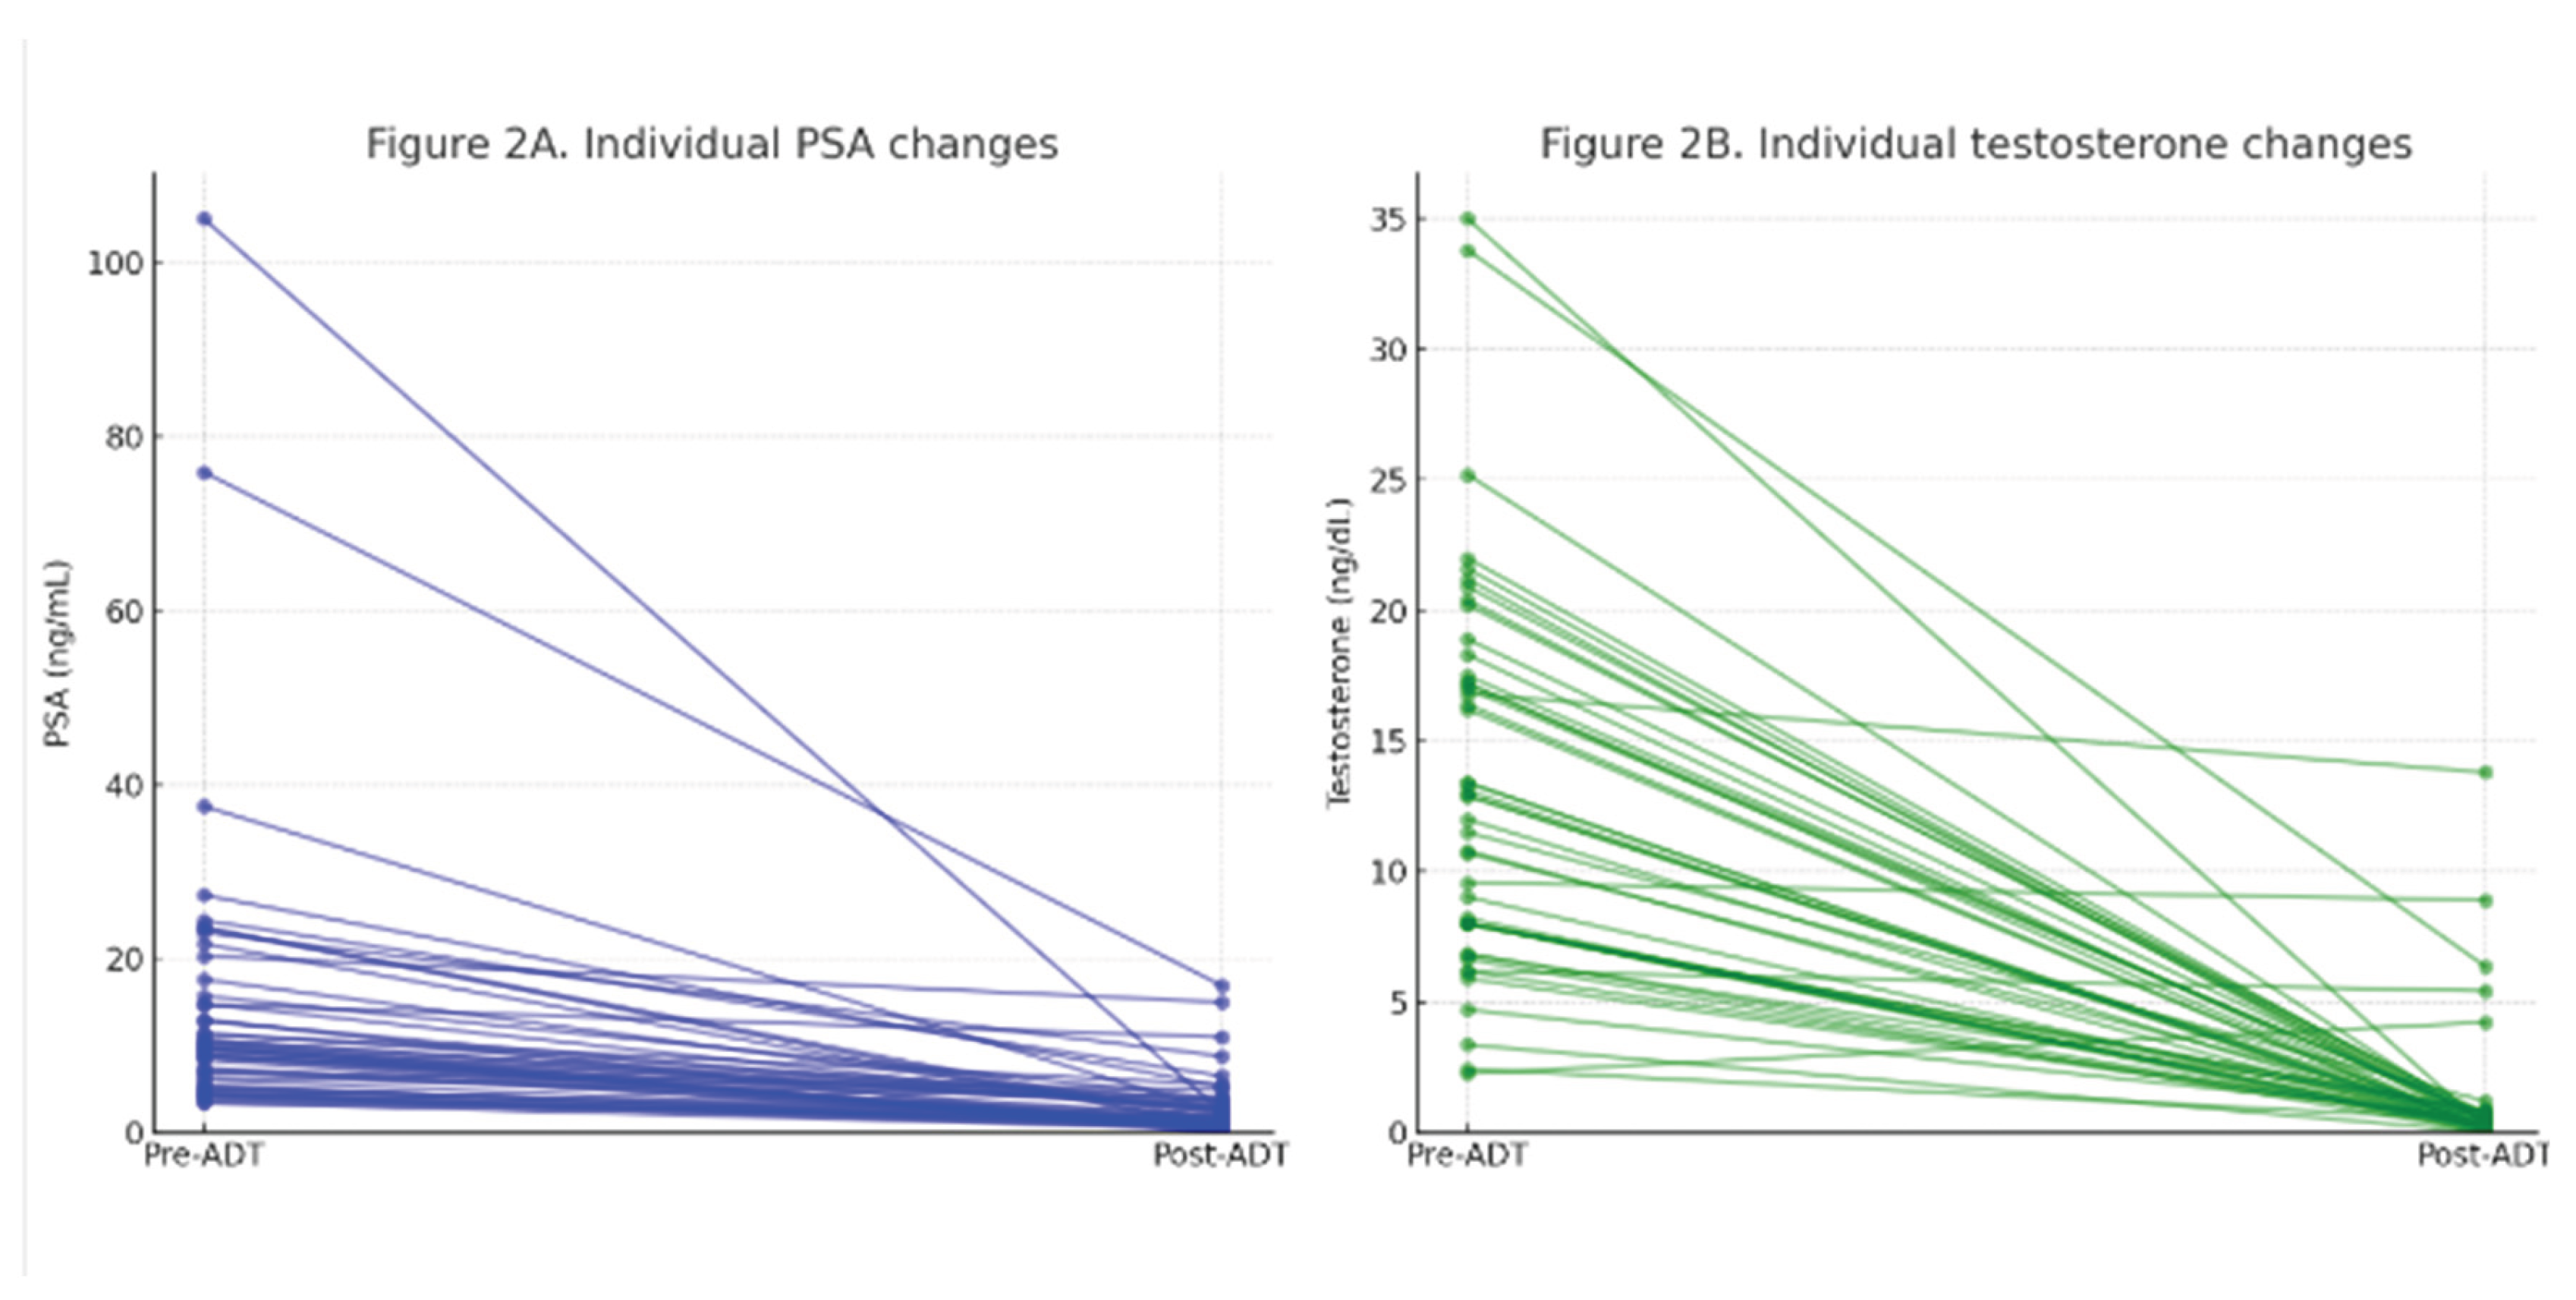
3.4. Reduction in PSA and Testosterone Following Hormonal Therapy
PSA and testosterone values were analyzed both before the initiation of therapy with Eligard® and two months after administration. The results are shown in Table 4, including means, medians, and reduction ranges.
The median baseline PSA was 9.64 ng/mL, with a mean of 14.91 ng/mL. After treatment, PSA decreased to a median of 1.84 ng/mL and a mean of 2.95 ng/mL. The mean percentage reduction in PSA was 76.1% ± 18.9, with a median of 79.1%.
For testosterone, the mean pre-treatment level was 13.2 ng/dL (median: 12.0), while the post-treatment value dropped to a mean of 1.15 ng/dL (median: 0.39). The mean percentage reduction in testosterone was 86.6% ± 33.4, with a median of 97.1%.
Additionally, the proportion of patients reaching different thresholds of hormonal reduction was calculated. These results are summarized in Table 5.
Figure 1.
A. Individual PSA response to short-course LHRH agonist (paired pre- vs post-ADT). Figure 2B. Individual testosterone suppression after short-course LHRH agonist (paired pre- vs post-ADT).
Figure 1.
A. Individual PSA response to short-course LHRH agonist (paired pre- vs post-ADT). Figure 2B. Individual testosterone suppression after short-course LHRH agonist (paired pre- vs post-ADT).
3.5. Correlation Between PSA and Testosterone Reduction
A correlation analysis was performed to assess whether the percentage reduction in PSA levels was associated with the percentage reduction in testosterone following ADT. Both Spearman’s (non-parametric) and Pearson’s (parametric) correlation coefficients were calculated using data from all evaluable patients with complete hormonal data.
The analysis revealed a moderate and statistically significant positive correlation between the two variables. Specifically, patients who experienced greater reductions in testosterone levels tended to also exhibit more pronounced reductions in PSA.
These findings suggest a proportional relationship between the degree of androgen suppression and the decline in PSA levels in response to LHRHa therapy.
Table 6.
Correlation between % reduction in PSA and testosterone (n = 47).
| Correlation test | Correlation coefficient (r) | p-value |
| Spearman | 0.43 | 0.002 |
| Pearson | 0.51 | <0.001 |
Univariable Logistic Regression Analysis
A univariable logistic regression analysis was conducted to explore potential predictors of achieving a ≥15% reduction in prostate volume following ADT. The independent variables included age, baseline PSA, percentage reduction in PSA, baseline testosterone, percentage reduction in testosterone, MRI-based prostate volume, percentage of positive biopsy cores, presence of perineural invasion (PNI), ISUP Gleason grade, and clinical risk group, no variable reached p<0.05.
However, a trend toward association was observed for percentage reduction in PSA, which approached statistical significance (p = 0.076), suggesting a potential relationship to be explored in future analyses with larger cohorts.
Complete results are summarized in Table 7
4. Discussion
Our prospective evaluation focused on the magnitude and consistency of prostate volume change with LHRH-agonist ADT (leuprolide), assessed by paired CT at ~8 weeks and replicated across three independent readers. We observed a coherent cytoreductive signal—mean relative volume reductions of ~18–21% and ≥60% of patients reaching the pre-defined ≥15% threshold—accompanied by substantial PSA and testosterone declines and a moderate correlation between their percent changes, indicating aligned anatomical and biochemical effects.
Beyond documenting shrinkage, these findings are clinically meaningful for RT planning. Smaller prostate volumes can improve target coverage and reduce the likelihood that bladder and rectum are encompassed within high- or intermediate-dose regions, thereby supporting more favorable dose–volume metrics [7] . Consistent with this rationale, prior work has linked neoadjuvant ADT to improved dosimetry and lower toxicity in IMRT settings [9,10]. Although the magnitude of cytoreduction observed here (~8 weeks) is lower than that reported with longer courses, the direction and consistency across observers indicate that even time-limited volume reduction can be leveraged to optimize planning and potentially mitigate adverse effects.
These results are also consistent with literature describing ADT-associated prostate shrinkage, with reported magnitudes comparable to those seen here. Langenhuijsen et al. documented substantial reductions over approximately three months with smaller additional changes thereafter, supporting the pragmatic use of time-limited courses when pre-radiotherapy cytoreduction is intended [11]. Studies addressing lower urinary tract symptoms (LUTS) further suggest that anatomical shrinkage can translate into symptomatic benefit, particularly in patients with moderate–severe baseline burden, albeit with domain-specific variability [12,13]. While we did not capture LUTS or quality-of-life outcomes, baseline symptom profiling remains relevant when tailoring ADT duration and expectations.
In routine practice, treatment planning is CT-based, and many centers cannot systematically acquire mpMRI at 2–3 months. While mpMRI remains central for tumor characterization, its functional contrasts may diminish after ADT, potentially reducing lesion conspicuity [12]. Our CT-centric approach reflects real-world workflows and underscores a practical point: biochemical response is not a surrogate for volumetric response. In this cohort, PSA and testosterone fell markedly and correlated, yet neither independently predicted achieving the ≥15% cytoreduction threshold. This decoupling has implications for scheduling and for how clinicians infer anatomical change from laboratory kinetics; volumetric assessment should not be assumed based solely on PSA suppression.
Regarding predictors of cytoreduction, previous work has highlighted baseline prostate volume as a key determinant [13]. In our exploratory univariable analysis—including clinical, histologic, and biochemical variables—no factor reached statistical significance for predicting a ≥15% volume reduction; the trend for percent PSA change (p=0.076) is hypothesis-generating and merits testing in larger datasets and multivariable models.
Strengths of this study include its prospective design; paired imaging with standardized contouring; three independent, blinded readers supporting reproducibility; and homogeneous pharmacologic exposure with depot leuprolide.
Crucially, these planning-centric findings can be integrated with the survival-focused evidence base: a short neoadjuvant window to capture CT-verified downsizing for simulation, immediately followed by concurrent/adjuvant ADT in line with randomized/meta-analytic [5,6]. This hybrid, workflow-aware strategy reconciles anatomical optimization with evidence-based systemic timing and may help standardize simulation schedules in everyday practice
4.1. Limitations
LUTS and quality-of-life outcomes were not collected, restricting clinical interpretation beyond anatomical and biochemical responses. The moderate sample size limits power for predictor discovery and precludes robust multivariable modeling. Inter-observer variability—although expected and explicitly reported—underscores the need for further standardization and for advanced segmentation tools. A notable interpretive advantage is that no antiandrogen (e.g., bicalutamide) was used at initiation, allowing the observed PSA and testosterone declines to be attributed to leuprolide alone and highlighting the magnitude of biochemical suppression alongside volumetric effects. In a forthcoming study, we will acquire the second CT at approximately three months to enable direct comparison with the ~8-week time point reported here and to better characterize the time course of cytoreduction.
4.2. Future Directions
Building on these data, we are expanding the cohort to refine predictors of cytoreduction and to evaluate whether newer LHRH antagonists, which often induce a more rapid PSA decline, display distinct early volumetric trajectories. Prospective designs that integrate standardized functional outcomes (e.g., LUTS scales) and leverage imaging- and AI-assisted segmentation should enhance volumetric assessment and response prediction, ultimately enabling more precise, patient-tailored radiotherapy planning.
Clinical Trial Registration
ClinicalTrials.gov NCT06184464.
Author Contributions
Conceptualization, N.F., M.G.-R., and S.P.-R.; Methodology, N.F., M.G.-R., and S.P.-R.; Validation, N.F., M.G.-R., and S.P.-R.; Formal analysis, N.F. and M.G.-R.; Investigation, N.F., M.G.-R., S.P.-R., J.M.S., A.D., M.P.M., S.C.d.P., I.D.-Á., and F.C.; Resources, Hospital Universitario de Terrassa; Data curation, N.F. and M.G.-R.; Writing—original draft, N.F.; Writing—review & editing, all authors; Visualization, N.F.; Supervision, M.G.-R., S.P.-R., and F.C.; Project administration, N.F.; Registration, N.F. (NCT06184464).
Funding
This research received no external funding.
Institutional Review Board Statement
The study was conducted in accordance with the Declaration of Helsinki and approved by the Institutional Review Board (CEIm) of Hospital Universitario de Terrassa (protocol 01-23-100-099).
Informed Consent Statement
Informed consent was obtained from all subjects involved in the study.
Data Availability Statement
Data supporting the findings of this study are available from the corresponding author on reasonable request, subject to institutional approvals and data-protection regulations.
Acknowledgments
We thank the Radiation Oncology and Urology teams at Hospital Universitario de Terrassa for their support in patient care and logistics. We also acknowledge the contribution of the treatment-planning staff for facilitating CT acquisition and anonymization for blinded delineations.
Conflicts of Interest
The authors declare no conflict of interest.
Abbreviations
| ADT | Androgen deprivation therapy |
| CT | Computed tomography |
| GI | Gastrointestinal |
| GU | Genitourinary |
| IMRT | Intensity-modulated radiotherapy |
| LHRH | Luteinizing hormone–releasing hormone |
| LHRHa | Luteinizing hormone–releasing hormone agonist |
| LLOQ | Lower limit of quantification |
| LUTS | Lower urinary tract symptoms |
| MFS | Metastasis-free survival |
| mpMRI | Multiparametric magnetic resonance imaging |
| OAR | Organ at risk |
| PC | Prostate Cancer |
| PSA | Prostate-specific antigen |
| RT | Radiotherapy |
References
- Bray, F.; Laversanne, M.; Sung, H.; Ferlay, J.; Siegel, R.L.; Soerjomataram, I.; Jemal, A. Global Cancer Statistics 2022: GLOBOCAN Estimates of Incidence and Mortality Worldwide for 36 Cancers in 185 Countries. CA Cancer J. Clin. 2024, 74, 229–263. [Google Scholar] [CrossRef] [PubMed]
- National Comprehensive Cancer Network (NCCN). NCCN Clinical Practice Guidelines in Oncology: Prostate Cancer; Version 2.2025. Plymouth Meeting, PA, USA, 2025. Available online: https://www.nccn.org (accessed on 30 September 2025).
- Cornford, P.; van den Bergh, R.C.N.; Briers, E.; Van den Broeck, T.; Brunckhorst, O.; Darraugh, J.; Eberli, D.; De Meerleer, G.; De Santis, M.; Farolfi, A.; et al. EAU–EANM–ESTRO–ESUR–ISUP–SIOG Guidelines on Prostate Cancer—2024 Update. Part I: Screening, Diagnosis, and Local Treatment with Curative Intent. Eur. Urol. 2024, 86, 148–163. [Google Scholar] [CrossRef] [PubMed]
- Raychaudhuri, R.; Lin, D.W.; Montgomery, R.B. Prostate Cancer: A Review. JAMA 2025, 333, 1433–1446. [Google Scholar] [CrossRef] [PubMed]
- Spratt, D.E.; Malone, S.; Roy, S.; Grimes, S.; Eapen, L.; Morgan, S.C.; et al. Prostate Radiotherapy with Adjuvant Androgen Deprivation Therapy (ADT) Improves Metastasis-Free Survival Compared with Neoadjuvant ADT: An Individual Patient Meta-Analysis. J. Clin. Oncol. 2021, 39, 136–144. [Google Scholar] [CrossRef] [PubMed]
- Ma, T.M.; Sun, Y.; Malone, S.; Roach, M., 3rd; Dearnaley, D.; Pisansky, T.M.; et al. Sequencing of Androgen-Deprivation Therapy of Short Duration with Radiotherapy for Nonmetastatic Prostate Cancer (SANDSTORM): A Pooled Analysis of 12 Randomized Trials. J. Clin. Oncol. 2023, 41, 881–892. [Google Scholar] [CrossRef] [PubMed]
- Gleave, M.E.; Goldenberg, S.L.; Chin, J.L.; Warner, J.; Saad, F.; Klotz, L.H.; Jewett, M.; Kassabian, V.; Chetner, M.; Dupont, C.; Van Rensselaer, S.; Canadian Uro-Oncology Group. Randomized comparative study of 3 versus 8-month neoadjuvant hormonal therapy before radical prostatectomy: biochemical and pathological effects. J Urol. 2001, 166, 500–506. [Google Scholar] [CrossRef] [PubMed]
- Kucway, R.; Vicini, F.; Huang, R.; Stromberg, J.; Gonzalez, J.; Martinez, A. Prostate volume reduction with androgen deprivation therapy before interstitial brachytherapy. J Urol. 2002, 167, 2443–2447. [Google Scholar] [CrossRef] [PubMed]
- Sanghani, M.V.; Schultz, D.; Tempany, C.M. , et al. Quantifying the change in endorectal magnetic resonance imaging-defined tumor volume during neoadjuvant androgen suppression therapy in patients with prostate cancer. Urology 2003, 62, 487–491. [Google Scholar] [CrossRef] [PubMed]
- Jethwa, K.R.; Furutani, K.M.; Mynderse, L.A.; Wilson, T.M.; Choo, R.; King, B.F.; Bergstralh, E.; Davis, B.J. Predictors of Prostate Volume Reduction Following Neoadjuvant Cytoreductive Androgen Suppression. J. Contemp. Brachytherapy 2016, 8, 371–378. [Google Scholar] [CrossRef] [PubMed]
- Serizawa, I.; Kozuka, T.; Soyano, T.; Sasamura, K.; Kamima, T.; Kunogi, H.; Numao, N.; Yamamoto, S.; Yonese, J.; Yoshioka, Y. Impact of Neoadjuvant Androgen Deprivation Therapy on Toxicity in Intensity-Modulated Radiation Therapy for Prostate Cancer. J. Radiat. Res. 2024, 65, 693–700. [Google Scholar] [CrossRef] [PubMed]
- Bang, W.J.; Kim, H.; Oh, C.Y.; Jo, J.K.; Cho, J.S.; Shim, M. Clinical Significance of Prostate Volume and Testosterone Reduction on Lower Urinary Tract Symptoms in Patients with Prostate Cancer Undergoing Androgen Deprivation Therapy. Sci. Rep. 2022, 12, 18535. [Google Scholar] [CrossRef] [PubMed]
- Washino, S.; Hirai, M.; Saito, K.; Kobayashi, Y.; Arai, Y.; Miyagawa, T. Impact of Androgen Deprivation Therapy on Volume Reduction and Lower Urinary Tract Symptoms in Patients with Prostate Cancer. Low Urin. Tract Symptoms 2018, 10, 57–63. [Google Scholar] [CrossRef] [PubMed]
- Langenhuijsen, J.F.; van Lin, E.N.; Hoffmann, A.L.; Spitters-Post, I.; Witjes, J.A.; Kaanders, J.H.; et al. Neoadjuvant Androgen Deprivation for Prostate Volume Reduction: The Optimal Duration in Prostate Cancer Radiotherapy. Urol. Oncol. 2011, 29, 52–57. [Google Scholar] [CrossRef] [PubMed]
- Björeland, U.; Nyholm, T.; Jonsson, J.; Skorpil, M.; Blomqvist, L.; Strandberg, S.; et al. Impact of Neoadjuvant Androgen Deprivation Therapy on Magnetic Resonance Imaging Features in Prostate Cancer before Radiotherapy. Phys. Imaging Radiat. Oncol. 2021, 17, 117–123. [Google Scholar] [CrossRef] [PubMed]
Table 4.
PSA and testosterone before and after ADT (n=47).
| Parameter | Mean ± SD | Median | Min–Max |
| PSA pre-ADT (ng/mL) | 14.91 ± 17.96 | 9.64 | 3.46–105.00 |
| PSA post-ADT (ng/mL) | 2.95 ± 3.55 | 1.84 | 0.02–16.90 |
| % PSA reduction | 76.1 ± 18.9% | 79.1% | 25.2%–99.8% |
| Testosterone pre-ADT (ng/dL) | 13.21 ± 7.39 | 12.00 | 2.26–35.00 |
| Testosterone post-ADT (ng/dL) | 1.15 ± 2.57 | 0.39 | 0.02–13.80 |
| % Testosterone reduction | 86.6 ± 33.4% | 97.1% | –87.2%–99.8% |
Footnotes: Units per laboratory reporting; percent change as above.
Table 5.
Proportion of patients by prespecified hormonal reduction thresholds.
| Hormonal reduction category | % of patients |
| PSA reduction ≥75% | 59.6% |
| PSA reduction ≥90% | 23.4% |
| Testosterone reduction ≥85% | 87.2% |
| Testosterone reduction ≥90% | 78.7% |
Table 7.
Univariable logistic regression for predictors of ≥15% prostate volume reduction.
| Variable | Odds Ratio (OR) | 95% CI | p-value |
| Age | 0.97 | 0.91–1.04 | 0.289 |
| PSA at diagnosis | 0.99 | 0.96–1.03 | 0.352 |
| % PSA reduction | 1.03 | 1.00–1.07 | 0.076 |
| Baseline testosterone | 1.01 | 0.91–1.13 | 0.815 |
| % Testosterone reduction | 1.01 | 0.99–1.03 | 0.183 |
| Prostate volume by MRI | 0.99 | 0.96–1.03 | 0.617 |
| Perineural invasion (PNI) | 1.73 | 0.45–6.72 | 0.424 |
| % positive biopsy cores | 0.99 | 0.95–1.03 | 0.576 |
| Highest ISUP Gleason grade | 0.88 | 0.53–1.47 | 0.625 |
| Clinical risk group | 1.11 | 0.57–2.15 | 0.759 |
Disclaimer/Publisher’s Note: The statements, opinions and data contained in all publications are solely those of the individual author(s) and contributor(s) and not of MDPI and/or the editor(s). MDPI and/or the editor(s) disclaim responsibility for any injury to people or property resulting from any ideas, methods, instructions or products referred to in the content. |
© 2025 by the authors. Licensee MDPI, Basel, Switzerland. This article is an open access article distributed under the terms and conditions of the Creative Commons Attribution (CC BY) license (http://creativecommons.org/licenses/by/4.0/).
Copyright: This open access article is published under a Creative Commons CC BY 4.0 license, which permit the free download, distribution, and reuse, provided that the author and preprint are cited in any reuse.


