
Submitted:
27 October 2025
Posted:
03 November 2025
You are already at the latest version
Abstract
The nucleation, growth, and surface deposition of poly(2,2,2-trifluoroethyl methacrylate) [poly(TFEMA)] were investigated across three thermodynamic regimes of a supercritical CO₂–toluene system. A ternary mixture of 20 wt% toluene + 79 wt% scCO₂ + 1 wt% poly(TFEMA) at 40 °C was exposed to a fluorine-doped tin oxide (FTO) surface for 30 min at pressures placing the solution in (i) a one-phase region (15.86 MPa), (ii) the cloud point (12.37 MPa), and (iii) a two-phase region (8.96 MPa). Using the Altunin–Gadetskii–Haar–Gallagher–Kell (AG–HGK) equation of state (EOS), the corresponding CO₂ densities are 793.86, 729.15, and 477.83 kg m⁻3. Scanning electron microscopy (SEM) and particle-size analysis (sample sizes N = 852–1177) show particle-size distributions (PSDs) that are well described by a lognormal form: the mean diameter increases monotonically with decreasing pressure (1.767 µm → 2.605 µm → 2.863 µm), while dispersion tightens slightly near the cloud point (coefficient of variation, CV: ≈0.47 → 0.44) and then broadens strongly in the two-phase region (CV ≈ 1.02). Morphologies transition from sparse, compact islands (one-phase) to agglomerated, necked spheres (cloud point) and finally to hierarchical populations containing hollow/pitted large particles (two-phase). These outcomes are consistent with a phase-state-controlled shift in nucleation pathways: from heterogeneous surface nucleation in the one-phase regime to homogeneous nucleation with agglomeration at the cloud point, and to homogeneous nucleation with coalescence and solvent capture in the two-phase regime. The results provide a mechanistic basis and practical design rules for pressure-programmable control of fluoropolymer coatings prepared from scCO₂/aromatic-cosolvent systems.
Keywords:
supercritical carbon dioxide (scCO2)
; toluene cosolvent
; poly(TFEMA)
; cloud point
; homogeneous nucleation
; heterogeneous nucleation
; coalescence
; particle-size distribution
; fluoropolymer coatings
; fluorine-doped tin oxide (FTO)
1. Introduction
Controlling polymer nucleation pathways and the resulting particle and film morphologies is central to applications spanning superhydrophobic (anti-wetting) and antifouling coatings [1,2,3], optical control of haze and clarity [4], membranes [5,6,7], and particle-based functional interfaces [8]. scCO2 is an attractive medium for such control because it combines liquid-like density with gas-like diffusivity, low viscosity, and nearly zero surface tension [9,10,11,12], properties that can be tuned by modest changes in pressure, temperature, or entrainer content to modulate supersaturation, nucleation barriers, and thus particle and film morphology [13,14,15]. These attributes, together with closed-loop recovery and residue-free venting, reduce volatile organic compound (VOC) emissions and align with green-chemistry principles [16,17]. In both industrial and academic settings, scCO2 has enabled extraction [18,19,20,21,22], impregnation [23,24], templated porosity [25], microcellular foams [26], polymer synthesis [27], thin-film deposition [28,29,30,31,32], thin-film processing [33,34,35], and nanomaterials synthesis—from oxide nanoparticles [36,37] and energy materials [38] to exfoliated layered materials [39,40]. Despite these advantages, neat scCO2 is a relatively weak solvent for polar solutes, and many polymers dissolve only sparingly without formulation aids [9,41].
A well-chosen organic cosolvent can broaden the solvency window of scCO2 by strengthening solvent–solute interactions, shifting cloud points, and tuning interfacial properties, while preserving recyclability and residue-free venting [42,43,44,45,46,47,48]. Consistent with this, molecular-dynamics studies show that nonpolar entrainers (e.g., toluene, cyclohexane) promote polymer dispersion in scCO2, whereas strongly hydrogen-bonding cosolvents underperform due to self-association [49]. Among aromatics, toluene is especially practical: it enhances the solubility of methacrylic species and remains compatible with scCO2-rich phases across accessible processing conditions [50,51]. The scCO2–toluene system is underpinned by extensive thermophysical data: pressure–density–temperature relations, vapor–liquid equilibria, critical loci, and accurate equations of state, which allow the precise placement of operating points near the critical region [50,51,52,53,54]. As shown in Figure 1, toluene is an aprotic aromatic; its delocalized system strengthens dispersive interactions with ester carbonyls without promoting strong hydrogen-bond networks, consistent with reports that hydrogen-bonding entrainers (e.g., methanol) restructure solvation in modified scCO2 [46] and that specific cosolvent–solute interactions drive the largest solvency gains in supercritical fluids [42], thereby broadening scCO2 solvency while allowing facile cosolvent removal upon venting.
Fluoropolymers have widespread use in coatings and films due to their low-surface-energy hydrophobicity, outstanding chemical and corrosion resistance, UV and weathering durability, thermal stability, and excellent dielectric insulation [55,56,57]. They can exhibit significant solubility in dense scCO2 under appropriate temperature–pressure conditions [41,43]. Within this class, poly(TFEMA) is an appealing target for supercritical processing. As highlighted in Figure 2, the repeat unit presents an ester carbonyl (C=O) and a terminal CF3 on a 2,2,2-trifluoroethyl pendant—CO2-philic motifs associated with enhanced compatibility in scCO2-rich media [58]. Elevated scCO2 activity further plasticizes the methacrylate backbone, effectively depressing and increasing chain mobility during growth and coalescence [59]. In our recent cloud-point study at 31.5–50 ℃, adding toluene monotonically reduced the dissolution pressure of poly(TFEMA) by up to about 40% at 20 wt% entrainer, thereby expanding practical processing windows for deposition and particle formation [60]. Consistent with broader trends, fluorinated (meth)acrylate copolymers exhibit solvent-dependent critical-solution behavior and molecular-weight-sensitive cloud points in supercritical fluorinated solvents [61]. Poly(TFEMA) has been precipitated as nano- and microparticles and as hydrophobic coatings from supercritical solutions without persistent solvent burdens [8,62]. Previous work from our group demonstrated scCO2-enabled perovskite crystallization and the incorporation of polymers into perovskite films at low temperature, connecting phase-controlled processing to improved functional performance [23,63,64,65,66].
The thermodynamic phase state of the processing medium governs the route from dissolved solute to precipitated particles and films. Classical nucleation theory indicates that, in dilute single-phase solutions with favorable solvent–solute interactions, homogeneous nucleation rates are vanishingly small because the free-energy barrier is high [67,68]. Crossing a phase boundary into a two-phase region increases supersaturation and lowers this barrier so that bulk (homogeneous) nucleation becomes competitive [68,69]. At all states, pre-existing surfaces reduce the barrier and often dominate the kinetics, so heterogeneous nucleation can operate in both single- and two-phase regimes [69,70,71]. Once nuclei form, growth and coarsening reflect the prevailing transport: under diffusion-controlled ripening, the system evolves toward a self-similar size distribution with a sharp upper cutoff and a mean radius that increases characteristically with time [72]. During depressurization of a supercritical-fluid solvent, solvent pockets trapped within the polymer phase can outgas, leaving pits or hollows typical of gas-blown polymers [3,5,7]. This framework provides a direct mapping from thermodynamic state to nucleation pathway and, ultimately, to the particle-size and morphology observables we measure.
Although scCO2 processing of fluorinated (meth)acrylates is well documented, the relationship between thermodynamic phase and particle nucleation and surface deposition remains underdeveloped. Here, we hold composition and temperature constant (40 ℃) and vary only pressure to traverse the one-phase, cloud-point, and two-phase regimes in a scCO2–toluene–poly(TFEMA) system. Pressures were selected from our cloud-point measurements to ensure reproducible placement in each regime [60]. We show that the phase state deterministically selects the dominant nucleation pathway—heterogeneous surface nucleation in the one-phase regime; homogeneous nucleation with agglomeration at the cloud point; and accelerated homogeneous nucleation with coalescence in the two-phase regime—driving a systematic shift in particle size, dispersion, and morphology.
These results establish some processing guidelines to tune fluoropolymer particle size, dispersion, and porosity in scCO2 with aromatic cosolvents, thereby providing practical design rules for coatings and particle fabrication.
2. Results and Discussion
2.1. Phase-State Control of Deposition (Overview)
Poly(TFEMA) was deposited onto FTO substrates from a ternary mixture of 20 wt% toluene + 1 wt% poly(TFEMA) + 79 wt% scCO2 at 40 ℃ for 30 min at three different pressures selected to place the fluid in the one-phase region (15.86 MPa, ≈2,300 psi), at the cloud point (12.37 MPa, ≈1,794.5 psi), and in the two-phase region (8.96 MPa, ≈1,300 psi), respectively. Pressure was thus used to tune the CO2 density and solvency at fixed composition and temperature (EOS-based densities used for mass balances are reported in Section 3.5).
The size distributions and morphology of the deposited particles at each phase state were measured and are consistent with lognormal statistics, typical of diffusion-limited, multiplicative growth in polymer precipitation. However, the mean size, dispersion, spatial organization, and surface morphology varied strongly with phase state. The data reveal a progression from heterogeneous surface-mediated nucleation with sparse, flattened surface islands (one-phase region), to the onset of homogeneous nucleation in solution with spherical particle agglomeration (cloud point), and finally to extensive coalescence with solvent capture and depressurization-induced gas-release features that yield pitted large particles (two-phase region). The cloud-point condition was established from independent phase-monitor measurements (Figure 12), with full details provided in Section 3.4.
2.2. One-Phase Region
At 40 ℃ and 15.86 MPa the ternary mixture resides in a one-phase state (Figure 12A). Under these conditions, poly(TFEMA) remains fully dissolved throughout the 30 min deposition period; homogeneous nucleation is, therefore, expected to be absent and particle formation is limited to heterogeneous surface nucleation. The representative SEM micrograph in Figure 3 exhibits the diagnostic hallmarks of this regime: (i) a sparse, essentially monolayer coverage with center–to–center spacings of multiple diameters; (ii) near-circular polymer islands rather than spherical particles, indicating surface-mediated heterogeneous nucleation and lateral growth rather than homogeneous nucleation and growth in solution followed by deposition; and (iii) the absence of particle clusters or agglomerates. Taken together, this morphology is consistent with heterogeneous surface nucleation and growth.
Figure 4 shows the particle-size distribution (PSD) for deposition from the one-phase region. The histogram is unimodal with a pronounced peak at m and a gently decaying right tail extending to –m. The arithmetic descriptors are m and m for particles (coefficient of variation ), indicating a moderately narrow dispersion. Two qualitative features are diagnostic. First, the absence of a secondary peak or a low-diameter shoulder argues against homogeneous nucleation in solution. Second, the scarcity of very large particles shows that heterogeneous surface nucleation was initiated broadly and uniformly across the FTO surface. These statistical signatures mirror the morphology in Figure 3, where most particles fall between 1 and m and only occasionally approach the m scale bar. Sampling precision is high (standard error of the mean m; 95% CI m), supporting reliable cross-condition comparisons.
The physical origin of the observed deposition from the one-phase solution is consistent with heterogeneous, surface-mediated nucleation followed by diffusion-limited growth. During the 30 min deposition period the polymer remains dissolved (high bulk free-energy barrier), so nucleation can only occur at FTO surface sites. Once initiated, polymer islands grow laterally at the edges by diffusive supply from their local environment, giving rise to the familiar lognormal distribution with a short right tail.
As a whole, the SEM morphology and the PSD indicate surface-mediated nucleation and diffusion-limited growth yielding isolated, compact deposition sites with a relatively narrow size distribution. We adopt this one-phase deposition result as the baseline for the comparisons that follow, and next examine how particle formation and surface deposition occur in the cloud-point and two-phase regions.
2.3. Cloud-Point Condition
At 40 ℃ and 12.37 MPa the ternary mixture resides near the cloud point (Figure 12B). The cloud point was established optically using the phase monitor and is defined here as the first appearance of persistent haze. This turbidity reflects polymer-rich domains produced by bulk homogeneous nucleation, which scatter light and account for the visible haze, marking entry into the two-phase region. The SEM micrograph in Figure 5 shows ensembles of agglomerated spherical particles and a noticeable increase in particle number density and size compared to the one-phase region (Figure 3). The grape-like clusters of well-formed, spherical particles indicate solution nucleation and growth with agglomeration and limited coalescence.
Figure 6 is a histogram that illustrates the PSD. The data follow a lognormal distribution, consistent with multiplicative, diffusion-limited particle growth. The distribution is unimodal with a pronounced peak at m and a right tail extending to –m. The arithmetic descriptors are m and m for (), indicating a broader, upward-shifted dispersion relative to the one-phase baseline (m; mode m). The absence of a low-diameter shoulder or a secondary peak argues against prolonged, multi-epoch nucleation, and the coexistence of necked contacts with a still-unimodal PSD indicates limited coalescence that forms bridges without erasing particulate identity. Sampling precision is high (standard error m; 95% CI m), supporting reliable cross-condition comparisons.
Relative to the one-phase deposition, the mean diameter increased by (2.605/1.767), and the overall particle morphology evolved from islands to spheres, indicating a transition from heterogeneous surface nucleation and two-dimensional lateral growth to homogeneous nucleation and three–dimensional growth and agglomeration during the 30 min deposition period. Mechanistically, the cloud point lowers the free-energy barrier and critical radius enough for bulk nuclei to appear (accounting for the macroscopic haze in Figure 12B).
2.4. Two-Phase Region
At 40 ℃ and 8.96 MPa the ternary mixture resides in the two-phase region (see Figure 12C). Under these conditions solvency is poor and both the critical radius and the nucleation barrier are further reduced in comparison to the cloud-point condition. Therefore, during the 30 min deposition period, particle formation is dominated by homogeneous nucleation and rapid growth in solution, followed by surface deposition. Because of the rapid formation of the solid polymer phase, solvent can become trapped inside the polymer particles. During the subsequent depressurization step, the trapped CO2 and toluene near the particle surface can escape, forming the crater-like voids observed in the SEM micrograph in Figure 7. This figure shows abundant spherical particles with sizes ranging from submicron to over 10 m, often displaying surface craters. Particle agglomeration is noticeably reduced in comparison to the cloud-point deposition, as agglomeration was likely replaced by coalescence, resulting in the very large particles seen in the figure.
Figure 8 is a histogram illustrating the PSD for deposition in the two-phase region. The PSD is broad and strongly right-skewed, and follows a lognormal distribution. The upper tail extends to m, and the arithmetic descriptors are m and m for (). Sampling precision remains adequate for cross-condition comparisons (standard error m; 95% CI m). The extreme right tail in Figure 7 suggests particle coalescence in solution prior to and during deposition.
2.4.1. Origin of Crater-Like Pits (Outgassing Mechanism)
The craters observed on the largest particles arise from outgassing during cooling and depressurization. As the external pressure is lowered, a positive pressure differential is created between the trapped solvent regions within the polymer particles and the surface. When the pressure differential exceeds the stress necessary to overcome the viscoelastic polymer barrier, local rupture vents the pocket, leaving an open crater. Solvent regions trapped deep within the bulk of the larger particles may remain trapped or outgas slowly over time rather than vent through surface rupture.
2.5. Quantitative Cross-Condition Comparison and Mechanistic Synthesis
Figure 9 shows the particle-diameter range for each of the pressure regions. A logarithmic scale was used to help visualize the comparison since the PSDs varied significantly under the three different regions. Three quantitative patterns emerge. First, the mean diameter increases monotonically as the pressure decreases at a fixed temperature, rising from 1.767 m to 2.605 m to 2.863 m for the one-phase, cloud-point, and two-phase conditions, respectively. Second, particle dispersion is non-monotonic: it narrows slightly at the cloud point relative to the one-phase region (CV vs. 0.47) and then broadens sharply in the two-phase region (CV ). We attribute the modest narrowing at the cloud point to a change in the primary nucleation mechanism, from heterogeneous surface nucleation to the onset of homogeneous bulk nucleation. Third, the two-phase distribution shows a clear separation between the mean and the median together with numerous large-diameter outliers, consistent with the emergence of particle coalescence.
The statistical contrasts in the boxplots align with the regime-specific behavior established earlier. In the one-phase region, bulk nucleation and growth is absent, and the PSD is determined by heterogeneous nucleation at the surface. We also note that the surface-nucleated particles appear as flat, two-dimensional islands rather than spherical particles. Therefore, the PSD would be shifted lower in comparison to the other two regions if mass instead of diameter were used for the comparison. At the cloud point, bulk homogeneous nucleation dominates and is responsible for the observed clustered spheres with limited coalescence. In the two-phase region, nucleation is predominantly homogeneous and rapid, generating a dense population of primary droplets that coalesce in solution, trapping solvent and resulting in a much larger upper range of particle diameters. During depressurization, outgassing of dissolved CO2 and toluene produces the observed craters in the larger particles.
The pressure dependence is consistent with classical nucleation ideas: decreasing pressure at fixed temperature raises supersaturation, lowers the free-energy barrier and critical radius, and accelerates nucleation. Surface nucleation maintains a strong heterogeneous contribution at higher pressures, while deep two-phase deposition adds a more substantial homogeneous component. Post-nucleation mass transfer then amplifies dispersion, and the final vent step imprints gas-release signatures on the largest particles. Together, these effects account for the systematic rise in mean size, the slight tightening at the cloud point, and the subsequent broadening with a heavy upper tail.
Sampling precision supports cross-condition inference. The 95% confidence intervals for the mean diameters are m for the one-phase condition with , m for the cloud point with , and m for the two-phase condition with .
From a particle-design perspective:
- One-phase operation favors compact, relatively uniform deposits with minimal interparticle interaction.
- Cloud-point operation increases coverage and shifts sizes upward while retaining a single mode and only modest dispersion.
- Two-phase operation yields the broadest dispersions and the largest outliers as a result of coalescence and vent-induced hollowing.
3. Materials and Methods
3.1. Materials
- Carbon dioxide (CO2), obtained from Airgas (Philadelphia, PA, USA); certified purity 99.9995%.
- Poly(2,2,2-trifluoroethyl methacrylate) [poly(TFEMA); trifluoroethyl methacrylate homopolymer], obtained from Specific Polymers (Castries, France). Supplier data: , , .
- Toluene (C7H8; 99.8%), obtained from Sigma-Aldrich (St. Louis, MO, USA).
- Fluorine-doped tin oxide (FTO) coated glass substrates, 25 mm × 25 mm, obtained from Ossila Ltd (Solpro Business Park, Windsor Street, Sheffield, S4 7WB, UK).
Unless otherwise stated, all materials were used as received without further purification.
3.2. Substrate Preparation
Fluorine-doped tin oxide (FTO) substrates were cleaned using a multistep protocol to remove organic and particulate contaminants, improve wettability, and ensure reproducible polymer deposition. The procedure was as follows:
- Initial wash: Substrates were washed with a solution of deionized (DI) water and Alconox detergent (Powder Precision Cleaner, Sigma-Aldrich), then rinsed with DI water and placed into a polypropylene substrate cleaning rack (Ossila, Product Code E102).
- Ultrasonic cleaning with Hellmanex: The rack was placed in a Branson Ultrasonic Cleaner (Model 1510; Branson Ultrasonics Corp., Wallingford, CT, USA). A Hellmanex III working solution (prepared by diluting 2 mL Hellmanex III, Ossila, in 100 mL DI water) was added to the rack compartments. The ultrasonic bath reservoir was filled with water to a level just below the top of the rack height to ensure full immersion. Sonication was performed for 15 min at ambient temperature.
- Rinsing: Substrates were removed and rinsed with DI water to remove Hellmanex residues.
- Sequential solvent sonication: Substrates were sonicated first in isopropyl alcohol (IPA, ≥99.7%, Sigma-Aldrich) for 15 min, followed by acetone (≥99.5%, Sigma-Aldrich) for 15 min.
- Final rinses and drying: After solvent sonication, substrates were rinsed with acetone and then with IPA, and quickly dried using a stream of high-pressure dry air to prevent residues or liquid spots.
- Plasma treatment: Substrates were plasma-cleaned for 4 min in a Solarus 950 advanced plasma system (Gatan Inc., Pleasanton, CA, USA). The plasma environment consisted of 75% argon and 25% oxygen at 25 psi, with feed gases of 99.995% purity.
This protocol effectively removed surface contaminants and produced a hydrophilic, high-energy surface favorable for polymer nucleation and adhesion during subsequent supercritical deposition.
3.3. Supercritical Deposition System and Instrumentation
Figure 10 is a schematic illustration of the experimental system used to deposit poly(TFEMA) onto FTO substrates from scCO2 with cosolvent at well-defined pressure–temperature conditions. The system includes components for CO2 delivery and pressurization, a high-pressure Parr deposition chamber, external heating with in situ monitoring, and a video/data acquisition chain. The primary components are:
- CO2 cylinder: High-purity CO2 was supplied from a compressed-gas cylinder via high-pressure stainless-steel tubing and a control valve to the syringe pump, providing a clean and continuous feed.
- Syringe pump: Teledyne ISCO 260D (Teledyne Isco, Lincoln, NE, USA) pressurized and delivered CO2 to the pressure vessel with precise control of delivery rate and final set pressure, enabling reproducible attainment of the one-phase, cloud-point, and two-phase conditions.
- Pump-head chiller: Neslab CFT-25 refrigerated recirculator (Neslab Instruments Inc., Portsmouth, NH, USA) cooled the syringe pump head to increase CO2 density during each loading cycle, thereby increasing the mass delivered per stroke and reducing the number of charging iterations needed to reach the target vessel pressure.
- High-pressure vessel: Parr 4768 reactor (Parr Instrument Company, Moline, IL, USA) housed the substrates, polymer, cosolvent, and scCO2 during deposition (nominal capacity 600 mL). The effective working volume was experimentally determined by an Archimedes displacement procedure to be 424.89 mL. Key specifications: head style VGR; maximum working pressure 3000 psi at 350 ℃; maximum working temperature 350 ℃ with flat PTFE gasket.
- Heating and temperature monitoring: A Staco Variac autotransformer (Model 3PN1010B; Staco Energy Products Co., Dayton, OH, USA; input 120 V, output 0–140 V, 12 A, 1.4 kVA) powered a heavy-duty heating tape (HTS/Amptek AWD-051-060, Stafford, TX, USA; 120 V, 312 W) wrapped around the vessel to regulate temperature. The internal temperature was measured with a J-type thermocouple inserted through the head of the vessel (the rod extending into the chamber) and read on an OMEGA HH506 digital thermometer (Omega Engineering Inc., Norwalk, CT, USA).
- Pressure monitoring: The vessel pressure was measured using an OMEGA PX309-10KGI pressure transducer with readout on an OMEGA DP400TP high-speed panel meter (Omega Engineering Inc., Norwalk, CT, USA). The combined system precision was of full scale (including linearity, hysteresis, and repeatability), providing reliable real-time control.
- Video monitoring: A Vanxse CCTV Mini HD 1/3 CCD 960H Auto Iris Camera (Model BX2812; Shenzhen Kaixing Security Technology Co., Ltd., Shenzhen, China; NTSC) recorded the HH506 (temperature) and DP400TP (pressure) displays. The signal passed through a NOVPEAK BNC CCTV S-Video to VGA converter (Model UPD39 E01A; SQdeal) and an ATCCPYDM VGA-to-USB 2.0 capture card (Model V2U-LO) prior to transfer to the computer.
- Data acquisition: Video files containing synchronized pressure and temperature readings were captured and archived for each run using OBS Studio 30.0.2 (OBS Project, open-source). These time-stamped recordings were used for post hoc frame-by-frame analysis to verify vessel conditions and improve the accuracy of the reported experimental values across all deposition regimes.
Collectively, the system allows for control of pressure–temperature trajectories to access the one-phase, cloud-point, and two-phase states at 40 ℃. The effective volume of the pressure vessel determined experimentally, combined with equation-of-state CO2 densities [54], enabled quantitative mass balances for scCO2 loading. The ISCO 260D with pump-head chilling reduced charging iterations and improved run-to-run repeatability; the Variac/tape-heater with thermocouple feedback maintained stable isothermal deposition; and the PX309 transducer with DP400TP readout provided full-scale accuracy for reliable set-point control. Time-stamped recordings captured in OBS Studio 30.0.2 created a complete audit trail of temperature and pressure histories, underpinning reproducibility and post hoc verification of all reported conditions.
3.4. Cloud-Point References and Set-Point Selection
Cloud-point information was used to establish the three deposition pressures (one-phase, cloud-point, two-phase) at 40 ℃ (313.15 K). We chose 313.15 K to maintain continuity with our prior cloud-point study at the same temperature [60], which provides the reference trend used here. In the present experiments, the toluene content remained at 20 wt%, while the polymer fraction was reduced from 3 to 1 wt% (the balance being an increase in CO2). Because toluene strengthens CO2 solvency for poly(TFEMA), we expect the cloud point to be less sensitive to small changes in polymer fraction in the ternary solution compared to neat CO2. Therefore, the potential change in the cloud point in the ternary solution as the polymer concentration is reduced from 3 wt% to 1 wt% was estimated from independent neat-CO2 measurements.
Cloud points were measured for poly(TFEMA) in neat CO2 at 2, 3, and 5 wt% over 304.65–323.15 K (31.5–50 ℃). These neat-CO2 data were used to determine the sensitivity to polymer fraction at 313.15 K and thus define the uncertainty range when moving from 3 to 1 wt% polymer at fixed 20 wt% toluene. The full dataset is summarized in Table 1.
Cloud points for Table 1 were obtained with a variable-volume phase monitor (30 mL quartz-window syringe-pump cell; Supercritical Fluid Technologies, Inc., Newark, DE, USA; SFT) using the reversible-turbidity criterion: stepwise decompression from a verified one-phase state to the first persistent haze by CCD imaging, followed by re-compression to recover clarity. Each entry is the mean of at least six independent determinations at fixed composition and temperature.
Using the 313.15 K row in Table 1, the local dependence of cloud-point pressure on polymer mass fraction in neat CO2 is estimated by a secant finite difference between 2 and 5 wt%:
Consequently, reducing the polymer from 3 to 1 wt% is expected to lower by MPa (about ). To transfer the 3 wt% reference to 1 wt% in the ternary solution, we define a composition-transfer envelope equal to the full spread of the neat-CO2 values at 313.15 K across 2–5 wt% about the 3 wt% point ( wt%): (that is, ). This envelope intentionally exceeds the actual 2 wt% decrement used here and therefore builds in safety margin.
Figure 11 complements Table 1 by showing the near-linear increase of with temperature in neat CO2 and the modest upward shift with increasing polymer fraction; the absolute spread at 313.15 K is only 0.41 MPa (23.46–23.05 MPa), consistent with the adopted envelope.
To obtain a single working band for set-point choice, we combine (i) the composition-transfer envelope with (ii) the cloud-point measurement repeatability, (based on cycles per point). Treating these as independent contributions and combining by root-sum-of-squares yields an overall relative uncertainty of . Applying this to the 12.37 MPa reference at 313.15 K gives a cloud band of 12.12–12.62 MPa for the mixture with 20 wt% toluene + 1 wt% poly(TFEMA) + 79 wt% CO2. Operationally, we interpret any isobar that lies within this band as “at the cloud point” for the 1 wt% polymer ternary; isobars that lie well above or below the band are assigned to the one-phase or two-phase fields, respectively. The band and the three isothermal deposition pressures are summarized in Figure 12.
Figure 12.
Cloud-point reference for 20 wt% toluene + 1 wt% poly(TFEMA) + 79 wt% CO2 at 313.15 K. Error bars denote the working band. Phase-monitor images illustrate (A) one-phase, (B) cloud point, and (C) two-phase regions under the deposition conditions.
Figure 12.
Cloud-point reference for 20 wt% toluene + 1 wt% poly(TFEMA) + 79 wt% CO2 at 313.15 K. Error bars denote the working band. Phase-monitor images illustrate (A) one-phase, (B) cloud point, and (C) two-phase regions under the deposition conditions.
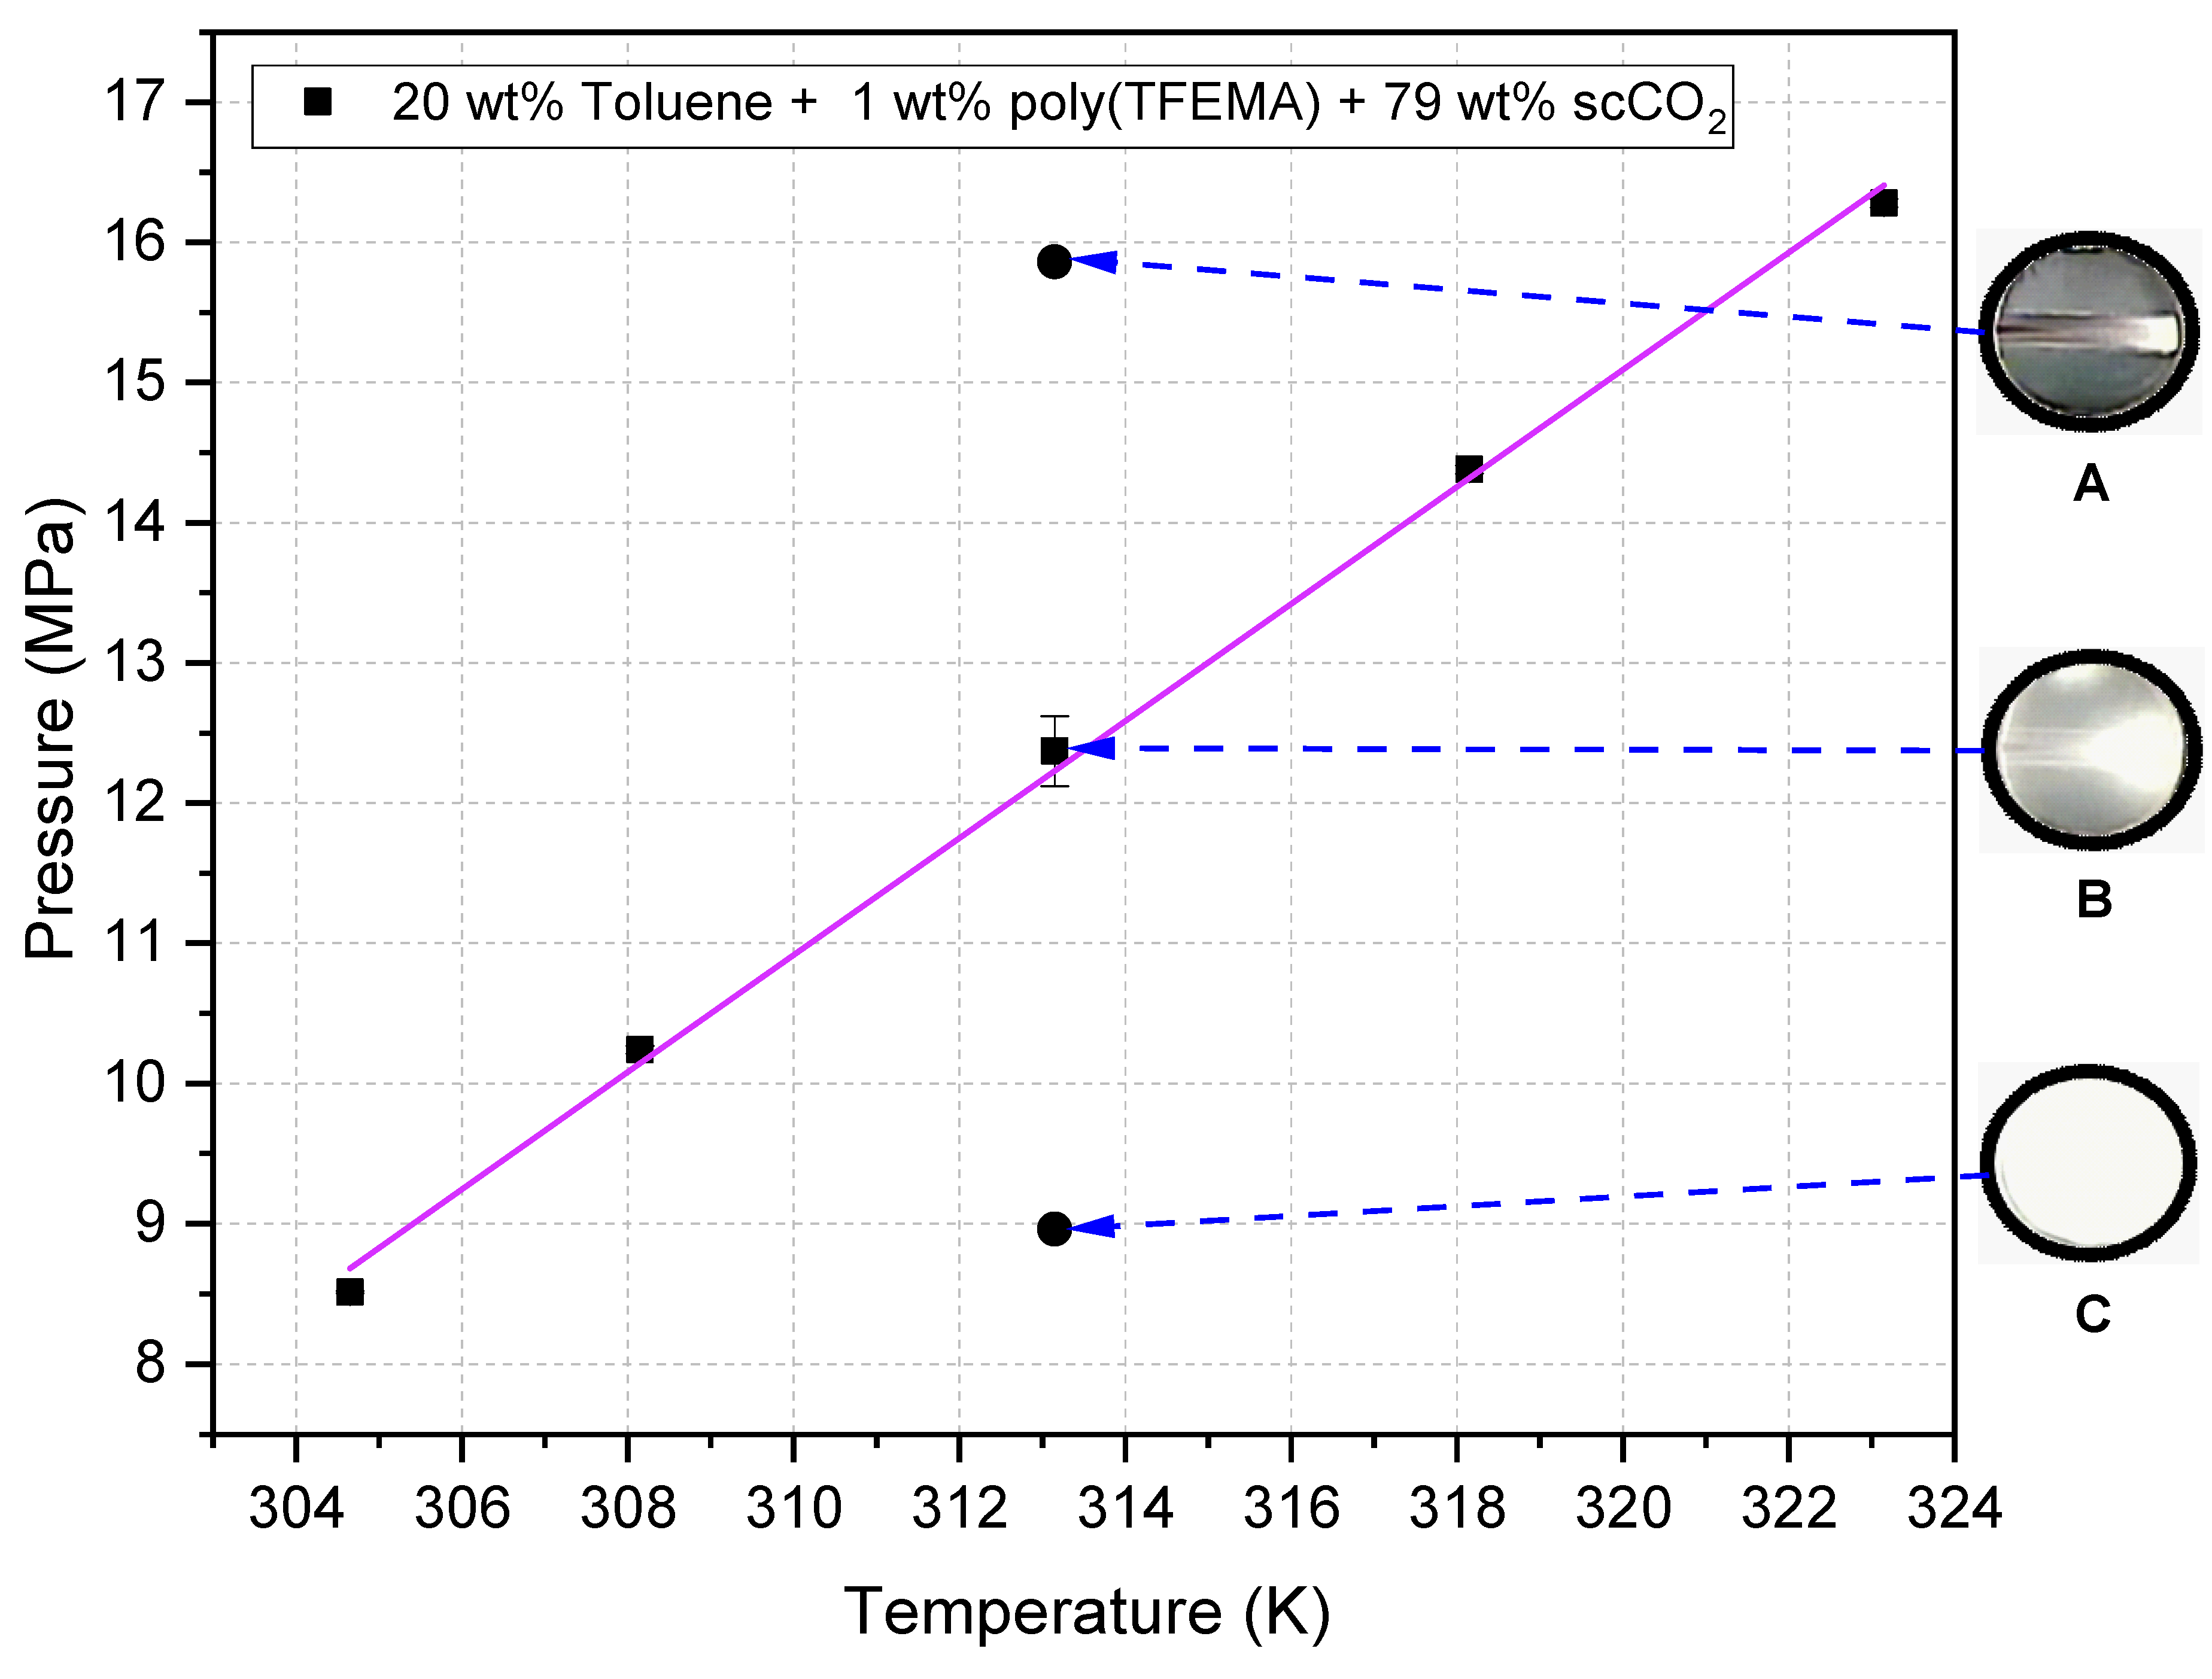
Figure 12 shows how the cloud-point reference was applied. The solid line and square symbols are carried over from the earlier 3 wt% polymer dataset [60]; in the present context, the vertical error bars on those points represent the conservative uncertainty range applied to the 1 wt% case. The dashed horizontal lines locate the three isobars used for deposition at 313.15 K. Their positions relative to the reference at 313.15 K identify the sampled phase fields: (A) at 15.86 MPa corresponds to the one-phase region, (B) at 12.37 MPa lies within the transfer band and is therefore taken as the cloud point, and (C) at 8.96 MPa falls in the two-phase region where turbidity persists. The accompanying CCD images (A–C) provide direct visual confirmation of these assignments, showing respectively a clear one-phase state, the onset of turbidity, and a fully phase-separated system.
Finally, depositions were performed at 15.86, 12.37, and 8.96 MPa (all at 313.15 K), corresponding to one-phase, cloud-point, and two-phase operation, respectively. The one-phase and two-phase set points lie more than 3.1 MPa above and below the 12.12–12.62 MPa band, ensuring unambiguous phase-state assignment, while the cloud-point set point is intentionally centered within the band (Table 2).
3.5. Deposition Procedures and Compositions
Deposition experiments were executed at the three isothermal pressures identified in Figure 12 for the mixture containing 20 wt% toluene + 1 wt% poly(TFEMA) + 79 wt% scCO2 at 40 ℃ (313.15 K). As labeled in Figure 12, these are: (A) 15.86 MPa in the one-phase region, (B) 12.37 MPa at the cloud point (first persistent haze), and (C) 8.96 MPa in the two-phase region. Panels A–C are CCD snapshots through the quartz window of the variable-volume phase monitor (30 mL syringe-pump cell; SFT) and illustrate the optical criteria used to confirm the targeted regime during each run.
Consistent with our prior protocol [60], the scCO2 mass at each set point was calculated from the pure-CO2 density, , using the Altunin–Gadetskii base EOS with the Haar–Gallagher–Kell near-critical correction (AG–HGK) for CO2, following the formulation of Pitzer and Schreiber [54], at 313.15 K and the measured isothermal pressure for each condition; this density was then multiplied by the vessel’s effective volume (424.89 mL). In doing so, we neglected mixture-density corrections and the small volume displaced by the charged toluene and polymer. Attempts to obtain gravimetrically with an interposed transfer vessel were confounded by low , extended thermal equilibration, and cosolvent and polymer backflow; we therefore assign a conservative uncertainty to . Toluene and polymer amounts were then set to maintain 20 wt% and 1 wt%, respectively. The resulting solute and solvent conditions for each phase region are summarized in Table 3.
Common operating protocol (applies to all three conditions).
- Charge and fixturing. Dispense the prescribed toluene volume (Table 3) into the open vessel using a beaker and calibrated pipette. Mount one cleaned substrate on each of the top three rack levels; place the weighed poly(TFEMA) on the fourth level, directly beneath the lowest substrate.
- Sealing and heating. Install the head; tighten bolts in a star pattern in 5 lb-ft increments to a final torque of 25 lb-ft (∼34 N·m). Apply heat with a Variac-driven tape and equilibrate at 40 ℃ (313.15 K).
- CO2 introduction and purge. With the syringe pump set to 20 mL min−1, pressurize to ∼3.45 MPa (∼500 psi), then purge three times by venting to ∼2.07 MPa (∼300 psi) and repressurizing to remove air and moisture while retaining polymer and toluene (outlet valve cracked only minimally).
- Stabilization. Resume CO2 addition and follow the pressure path specific to the targeted regime (as specified in Pressure paths and rationale, below). Start the 30 min deposition clock only when both temperature (313.15 K) and pressure are stable.
Pressure paths and rationale.
- One-phase, 15.86 MPa. Pressurize directly at 20 mL min−1 to 15.86 MPa at 313.15 K; close the inlet valve to isolate; hold 30 min. This sets a homogeneous one-phase state throughout the treatment, consistent with the clear-field phase-monitor image in Figure 12A.
- Cloud point, 12.37 MPa. First pressurize to ≈12.62 MPa at 313.15 K (one-phase region) to ensure complete dissolution; then reduce slowly to 12.37 MPa by cracking the outlet valve to minimize solvent or polymer loss; hold 30 min. The visual endpoint is the first persistent haze captured through the phase monitor (Figure 12B), our reversible-turbidity criterion.
- Two-phase, 8.96 MPa. First pressurize to ≈12.41 MPa at 313.15 K to dissolve polymer; then decompress slowly to 8.96 MPa; hold 30 min. The phase monitor shows sustained turbidity at this isobar (Figure 12C), confirming operation in the polymer-saturated two-phase region.
Post-treatment handling.
- Immerse the vessel in an ice–water bath (0 ℃) while sealed to precipitate toluene from the supercritical phase and quench further mass transfer.
- When the external thermometer reads ∼16 ℃, vent slowly and continuously to ambient pressure, remove the head, and retrieve the substrates for ex situ characterization.
The dashed lines and annotated images in Figure 12 therefore serve a dual role: they document the optical criteria used to identify the one-phase, cloud-point, and two-phase regimes at 313.15 K, and they verify that the operational pressure paths above consistently place the system in those regimes during the 30 min deposition window.
3.6. SEM Preparation and Imaging
Prior to imaging, FTO substrates bearing poly(TFEMA) deposits were sputter-coated with gold using a Polaron Plasma Sputter Coating System (Quorum Technologies, UK). The chamber was evacuated to ∼10 Pa, the discharge current stabilized at ∼10 mA, and sputtering proceeded for 60 s. SEM imaging was performed on a Hitachi SU-70 Ultra High-Resolution Analytical Field-Emission SEM (Hitachi High-Technologies, Japan; Schottky emitter) in secondary-electron mode at 5.0 kV. Representative micrographs in Figure 3, Figure 5, and Figure 7 show particle morphology and surface coverage for the one-phase, cloud-point, and two-phase regimes, respectively.
4. Conclusions
Poly(TFEMA) particle nucleation, growth, and surface deposition were studied in the one-phase, cloud-point, and two-phase regimes from a solution of fixed composition (20 wt% toluene + 1 wt% poly(TFEMA) + 79 wt% scCO2) at 313.15 K. One-phase deposition yielded sparse, compact surface islands indicative of heterogeneous nucleation and lateral growth along the edges of the nucleated surface islands; cloud-point deposition showed the emergence of homogeneous nucleation in solution with spherical particles and agglomeration; and two-phase deposition produced rapid homogeneous nucleation and particle coalescence, revealing very large particles with surface craters indicative of solvent rupture sites during venting. Fluoropolymers are used in many applications, and the ability to tailor particle nucleation and growth using thermodynamic phase control to alter solvation could provide a useful processing tool for particle design. The experimental results presented here could help guide a comprehensive theoretical nucleation model for this system, but that is beyond the scope of the current investigation.
References
Author Contributions
Conceptualization, J.R.Z. and G.C.T.; methodology, J.R.Z. and G.C.T.; investigation, J.R.Z.; formal analysis, J.R.Z. and G.C.T.; writing—original draft preparation, J.R.Z.; writing—review and editing, J.R.Z. and G.C.T.; supervision, G.C.T. All authors have read and agreed to the published version of the manuscript.
Funding
This research received no external funding.
Institutional Review Board Statement
Not applicable.
Informed Consent Statement
Not applicable.
Data Availability Statement
Data supporting the findings of this study are available from the corresponding author upon reasonable request.
Acknowledgments
The authors gratefully acknowledge the Nanomaterials Characterization Center at Virginia Commonwealth University for access to sputter coating, plasma cleaning, and SEM facilities. The authors thank Carl Mayer, Ph.D. (NCC Scientist) and Dmitry Pestov, Ph.D. (Senior NCC Scientist) for expert assistance and guidance.
Conflicts of Interest
The authors declare no conflicts of interest.
Abbreviations
| AG–HGK | Altunin–Gadetskii–Haar–Gallagher–Kell (equation of state for CO2) | |
| CCD | Charge-coupled device (camera) | |
| CV | Coefficient of variation () | |
| DI | Deionized (water) | |
| EOS | Equation of state | |
| FTO | Fluorine-doped tin oxide | |
| IPA | Isopropyl alcohol | |
| IQR | Interquartile range | |
| PDI | Polydispersity index | |
| PSD | Particle-size distribution | |
| PTFE | Polytetrafluoroethylene | |
| scCO2 | Supercritical carbon dioxide | |
| SEM | Scanning electron microscopy | |
| TFEMA | 2,2,2-trifluoroethyl methacrylate (poly(TFEMA) denotes the homopolymer) | |
| Glass transition temperature | ||
| Symbol | Description | Units |
| P | Pressure | MPa |
| T | Temperature | K (or ℃) |
| CO2 density (EOS) | kg m−3 | |
| Mass of scCO2 charged | g | |
| Mass of toluene charged | g | |
| Volume of toluene charged | mL | |
| Mass of poly(TFEMA) | g | |
| Polymer mass fraction | wt% | |
| Cloud-point pressure | MPa | |
| N | Sample size (particle count) | – |
| Mean particle diameter | m | |
| Standard deviation of diameter | m | |
| Coefficient of variation () | – | |
| Critical nucleus radius | nm (or m) | |
| Nucleation free-energy barrier | J |
References
- Ovaskainen, L.; Rodriguez-Meizoso, I.; Birkin, N.A.; Howdle, S.M.; Gedde, U.; Wågberg, L.; Turner, C. Towards superhydrophobic coatings made by non-fluorinated polymers sprayed from a supercritical solution. The Journal of Supercritical Fluids 2013, 77, 134–141. [Google Scholar] [CrossRef]
- Vasylyshyn, T.; Patsula, V.; Filipová, M.; Konefal, R.L.; Horák, D. Poly(glycerol monomethacrylate)-encapsulated upconverting nanoparticles prepared by miniemulsion polymerization: morphology, chemical stability, antifouling properties and toxicity evaluation. Nanoscale Adv. 2023, 5, 6979–6989. [Google Scholar] [CrossRef]
- Lv, C.; Liao, X.; Zou, F.; Tang, W.; Xing, S.; Li, G. Generating porous polymer microspheres with cellular surface via a gas-diffusion confined scCO2 foaming technology to endow the super-hydrophobic coating with hierarchical roughness. Chemical Engineering Journal 2022, 442, 136192. [Google Scholar] [CrossRef]
- Zhu, H.; Wang, W.; Wang, Y.; Lin, Z.; Ji, H.; Chen, X.; Li, G.; Ma, Y.; Xie, L. Preparation of PP/PC Light-Diffusing Materials with UV-Shielding Property. Polymer Composites 2023, 44, 5553–5566. [Google Scholar] [CrossRef]
- Zhang, A.; Zhang, Q.; Bai, H.; Li, L.; Li, J. Polymeric nanoporous materials fabricated with supercritical CO 2 and CO 2-expanded liquids. Chemical Society Reviews 2014, 43, 6938–6953. [Google Scholar] [CrossRef]
- Barroso, T.; Temtem, M.; Casimiro, T.; Aguiar-Ricardo, A. Development of pH-responsive poly(methylmethacrylate-co-methacrylic acid) membranes using scCO2 technology. Application to protein permeation. The Journal of Supercritical Fluids 2009, 51, 57–66. [Google Scholar] [CrossRef]
- Scholes, C.A.; Kanehashi, S. Polymeric membrane gas separation performance improvements through supercritical CO2 treatment. Journal of Membrane Science 2018, 566, 239–248. [Google Scholar] [CrossRef]
- Ratcharak, O.; Sane, A. Surface coating with poly(trifluoroethyl methacrylate) through rapid expansion of supercritical CO2 solutions. The Journal of Supercritical Fluids 2014, 89, 106–112. [Google Scholar] [CrossRef]
- Leitner, W. Designed to dissolve. Nature 2000, 405, 129–130. [Google Scholar] [CrossRef]
- Zhang, X.; Heinonen, S.; Levänen, E. Applications of supercritical carbon dioxide in materials processing and synthesis. RSC Advances 2014, 4, 61137–61152. [Google Scholar] [CrossRef]
- Tomasko, D.L.; Li, H.; Liu, D.; Han, X.; Wingert, M.J.; Lee, L.J.; Koelling, K.W. A Review of CO2 Applications in the Processing of Polymers. Industrial & Engineering Chemistry Research 2003, 42, 6431–6456. [Google Scholar] [CrossRef]
- Tutek, K.; Masek, A.; Kosmalska, A.; Cichosz, S. Application of Fluids in Supercritical Conditions in the Polymer Industry. Polymers 2021, 13, 729. [Google Scholar] [CrossRef]
- Kortsen, K.; Fowler, H.R.; Jacob, P.L.; Krumins, E.; Lentz, J.C.; Souhil, M.R.; Taresco, V.; Howdle, S.M. Exploiting the tuneable density of scCO2 to improve particle size control for dispersion polymerisations in the presence of poly(dimethyl siloxane) stabilisers. European Polymer Journal 2022, 168, 111108. [Google Scholar] [CrossRef]
- Hakuta, Y.; Hayashi, H.; Arai, K. Fine particle formation using supercritical fluids. Current Opinion in Solid State and Materials Science 2003, 7, 341–351. [Google Scholar] [CrossRef]
- Yan, H.; Sato, T.; Komago, D.; Yamaguchi, A.; Oyaizu, K.; Yuasa, M.; Otake, K. Electrochemical Synthesis of a Polypyrrole Thin Film with Supercritical Carbon Dioxide as a Solvent. Langmuir 2005, 21, 12303–12308. [Google Scholar] [CrossRef] [PubMed]
- Medina-Gonzalez, Y.; Camy, S.; Condoret, J.S. scCO2/Green Solvents: Biphasic Promising Systems for Cleaner Chemicals Manufacturing. ACS Sustainable Chemistry & Engineering 2014, 2, 2623–2636. [Google Scholar] [CrossRef]
- Wood, C.D.; Tan, B.; Zhang, H.; Cooper, A.I. Chapter 21 - Supercritical Carbon Dioxide as a Green Solvent for Polymer Synthesis. In Thermodynamics, Solubility and Environmental Issues; Letcher, T.M., Ed.; Elsevier: Amsterdam, 2007; pp. 383–396. [Google Scholar] [CrossRef]
- Khanyile, A.; Andrew, J.; Paul, V.; Sithole, B. A comparative study of supercritical fluid extraction and accelerated solvent extraction of lipophilic compounds from lignocellulosic biomass. Sustainable Chemistry and Pharmacy 2022, 26, 100608. [Google Scholar] [CrossRef]
- do Espirito Santo, A.T.; Siqueira, L.M.; Almeida, R.N.; Vargas, R.M.F.; do N Franceschini, G.; Kunde, M.A.; Cappellari, A.R.; Morrone, F.B.; Cassel, E. Decaffeination of yerba mate by supercritical fluid extraction: Improvement, mathematical modelling and infusion analysis. The Journal of Supercritical Fluids 2021, 168, 105096. [Google Scholar] [CrossRef]
- Marco, I.D.; Riemma, S.; Iannone, R. Supercritical Carbon Dioxide Decaffeination Process: a Life Cycle Assessment Study. Chemical Engineering Transactions 2017, 57, 1699–1704. [Google Scholar] [CrossRef]
- Zhang, H.; Huang, T.; Liao, X.; Zhou, Y.; Chen, S.; Chen, J.; Xiong, W. Extraction of Camphor Tree Essential Oil by Steam Distillation and Supercritical CO2 Extraction. Molecules 2022, 27. [Google Scholar] [CrossRef]
- Yıldırım, M.; Erşatır, M.; Poyraz, S.; Amangeldinova, M.; Kudrina, N.O.; Terletskaya, N.V. Green Extraction of Plant Materials Using Supercritical CO2: Insights into Methods, Analysis, and Bioactivity. Plants 2024, 13. [Google Scholar] [CrossRef]
- Handy, K.; Tepper, G.C. Incorporation of Poly(TFEMA) in Perovskite Thin Films Using a Supercritical Fluid. Molecules 2023, 28. [Google Scholar] [CrossRef]
- von Schnitzler, J.; Eggers, R. Mass transfer in polymers in a supercritical CO2-atmosphere. Journal of Supercritical Fluids 1999, 16, 81–92. [Google Scholar] [CrossRef]
- Furtado, A.I.; Bonifácio, V.D.B.; Viveiros, R.; Casimiro, T. Design of Molecularly Imprinted Polymers Using Supercritical Carbon Dioxide Technology. Molecules 2024, 29, 926. [Google Scholar] [CrossRef]
- Naguib, H.E.; Park, C.B.; Song, S.W. Effect of Supercritical Gas on Crystallization of Linear and Branched Polypropylene Resins with Foaming Additives. Industrial & Engineering Chemistry Research 2005, 44, 6685–6691. [Google Scholar] [CrossRef]
- Luna-Bárcenas, G.; Mawson, S.; Takishima, S.; DeSimone, J.M.; Sanchez, I.C.; Johnston, K.P. Phase behavior of poly(1,1-dihydroperfluorooctylacrylate) in supercritical carbon dioxide. Fluid Phase Equilibria 1998, 146, 325–337. [Google Scholar] [CrossRef]
- Blackburn, J.M.; Long, D.P.; Cabañas, A.; Watkins, J.J. Deposition of Conformal Copper and Nickel Films from Supercritical Carbon Dioxide. Science 2001, 294, 141–145. [Google Scholar] [CrossRef]
- Cabañas, A.; Long, D.P.; Watkins, J.J. Deposition of Gold Films and Nanostructures from Supercritical Carbon Dioxide. Chemistry of Materials 2004, 16, 2028–2033. [Google Scholar] [CrossRef]
- Rasadujjaman, M.; Watanabe, M.; Kondoh, E. Codeposition of Cu/Ni thin films from mixed precursors in supercritical carbon dioxide solutions. Japanese Journal of Applied Physics 2014, 53, 5–7. [Google Scholar] [CrossRef]
- Pandiyarajan, S.; Hsiao, P.J.; Liao, A.H.; Ganesan, M.; Manickaraj, S.S.M.; Lee, C.T.; Huang, S.T.; Chuang, H.C. Influence of ultrasonic combined supercritical-CO2 electrodeposition process on copper film fabrication: Electrochemical evaluation. Ultrasonics Sonochemistry 2021, 74, 105555. [Google Scholar] [CrossRef] [PubMed]
- Ganesan, M.; Liu, C.C.; Pandiyarajan, S.; Lee, C.T.; Chuang, H.C. Post-supercritical CO2 electrodeposition approach for Ni-Cu alloy fabrication: An innovative eco-friendly strategy for high-performance corrosion resistance with durability. Applied Surface Science 2022, 577, 151955. [Google Scholar] [CrossRef]
- Hosokawa, S.; Tomita, E.; Kanehashi, S.; Ogino, K. Study on effect of supercritical CO2 on structural ordering and charge transporting property in thiophene-based block copolymer. Japanese Journal of Applied Physics 2022, 61, 021001. [Google Scholar] [CrossRef]
- Marie Sajfrtová, Marie Cerhová, V. J.V.D.S.D.L.M. The effect of type and concentration of modifier in supercritical carbon dioxide on crystallization of nanocrystalline titania thin films. The Journal of Supercritical Fluids 2018, 133, 211–217. [Google Scholar] [CrossRef]
- Wei, M.; Wang, K.; Yanagida, M.; Sugihara, H.; Morris, M.A.; Holmes, J.D.; Zhou, H. Supercritical fluid processing of mesoporous crystalline TiO2 thin films for highly efficient dye-sensitized solar cells. Journal of Materials Chemistry 2007, 17, 3888–3893. [Google Scholar] [CrossRef]
- Sanli, D.; Bozbag, S.E.; Erkey, C. Synthesis of nanostructured materials using supercritical CO2: Part I. Physical transformations. Journal of Materials Science 2012, 47, 2995–3025. [Google Scholar] [CrossRef]
- Kaleva, A.; Heinonen, S.; Nikkanen, J.P.; Levänen, E. Synthesis and Crystallization of Titanium Dioxide in Supercritical Carbon Dioxide (scCO2). In Proceedings of the IOP Conference Series: Materials Science and Engineering. IOP Publishing, Vol. 175; 2017; p. 012034. [Google Scholar] [CrossRef]
- Wei, T.Y.; Chen, C.H.; Chien, H.C.; Lu, S.Y.; Hu, C.C. A Cost-Effective Supercapacitor Material of Ultrahigh Specific Capacitances: Spinel Nickel Cobaltite Aerogels from an Epoxide-Driven Sol-Gel Process. Advanced Materials 2010, 22, 347–351. [Google Scholar] [CrossRef]
- Pu, N.W.; Wang, C.A.; Sung, Y.; Liu, Y.M.; Ger, M.D. Production of few-layer graphene by supercritical CO2 exfoliation of graphite. Materials Letters 2009, 63, 1987–1989. [Google Scholar] [CrossRef]
- Wang, Y.; Zhou, C.; Wang, W.; Zhao, Y. Preparation of Two Dimensional Atomic Crystals-BN, WS2 and MoS2 by Supercritical CO2 Assisted with Ultrasonic. Industrial & Engineering Chemistry Research. [CrossRef]
- Rindfleisch, F.; DiNoia, T.P.; McHugh, M.A. Solubility of Polymers and Copolymers in Supercritical CO2. The Journal of Physical Chemistry 1996, 100, 15581–15587. [Google Scholar] [CrossRef]
- Ekart, M.P.; Bennett, K.L.; Ekart, S.M.; Gurdial, G.S.; Liotta, C.L.; Eckert, C.A. Cosolvent Interactions in Supercritical Fluid Solutions. AIChE Journal 1993, 39, 235–248. [Google Scholar] [CrossRef]
- Beckman, E.J. Supercritical and near-critical CO2 in green chemical synthesis and processing. The Journal of Supercritical Fluids 2004, 28, 121–191. [Google Scholar] [CrossRef]
- Ting, Y.S.; Hsieh, C.M. Prediction of solid solute solubility in supercritical carbon dioxide with organic cosolvents from the PR+COSMOSAC equation of state. Fluid Phase Equilibria 2016. [Google Scholar] [CrossRef]
- Ren, H.; Song, J.; Xu, Q.; Yin, J. Solubility of the silver nitrate in supercritical carbon dioxide with ethanol and ethylene glycol as double cosolvents: Experimental determination and correlation. Chinese Journal of Chemical Engineering 2018. [Google Scholar] [CrossRef]
- Gurina, D.L.; Antipova, M.L.; Odintsova, E.G.; Petrenko, V.E. The study of peculiarities of parabens solvation in methanol- and acetone-modified supercritical carbon dioxide by computer simulation. The Journal of Supercritical Fluids 2017, xxx, xxx–xxx. [Google Scholar] [CrossRef]
- Tomasko, D.L.; Knutson, B.L.; Pouillot, F.; Liotta, C.L.; Eckert, C.A. Spectroscopic study of structure and interactions in cosolvent-modified supercritical fluids. The Journal of Physical Chemistry 1993, 97, 11823–11834. [Google Scholar] [CrossRef]
- Yang, H.; Zhong, C. Modeling of the solubility of aromatic compounds in supercritical carbon dioxide–cosolvent systems using SAFT equation of state. Journal of Supercritical Fluids 2005, 33, 99–106. [Google Scholar] [CrossRef]
- Zhang, G.; Wu, T.; Li, J.; Pang, Q.; Yang, H.; Liu, G.; Huang, H.; Zhu, Y. Dynamics Simulation of the Effect of Cosolvent on the Solubility and Tackifying Behavior of PDMS Tackifier in Supercritical CO2 Fracturing Fluid. Colloids and Surfaces A: Physicochemical and Engineering Aspects 2023, 662, 130985. [Google Scholar] [CrossRef]
- Haifei Zhang, Zhimin Liu, B. H. Critical points and phase behavior of toluene-CO2 and toluene-H2-CO2 mixture in CO2-rich region. Journal of Supercritical Fluids 2000, 18, 185–192. [Google Scholar] [CrossRef]
- Hiroaki Matsukawa, Tomoya Tsuji, K. O. Measurement of the Density of Carbon Dioxide/Toluene Homogeneous Mixtures and Correlation with Equations of State. Journal of Chemical Thermodynamics 2022, 164, 106618. [Google Scholar] [CrossRef]
- Jialong Wu, Qinmin Pan, G. L.R. Pressure-Density-Temperature Behavior of CO2/Acetone, CO2/Toluene, and CO2/Monochlorobenzene Mixtures in the Near-Critical Region. Journal of Chemical and Engineering Data 2004, 49, 976–979. [Google Scholar] [CrossRef]
- Rowane, A.J.; Mallepally, R.R.; Bamgbade, B.A.; Newkirk, M.S.; Baled, H.O.; Burgess, W.A.; Gamwo, I.K.; Tapriyal, D.; Enick, R.M.; McHugh, M.A. High-temperature, high-pressure viscosities and densities of toluene. The Journal of Chemical Thermodynamics 2017, 115, 34–46. [Google Scholar] [CrossRef]
- Pitzer, K.S.; Schreiber, D.R. Improving equation-of-state accuracy in the critical region; equations for carbon dioxide and neopentane as examples. Fluid Phase Equilibria 1988, 41, 1–17. [Google Scholar] [CrossRef]
- Ameduri, B. Fluoropolymers: the right material for the right applications. Chemistry–A European Journal 2018, 24, 18830–18841. [Google Scholar] [CrossRef]
- Ciardelli, F.; Rubino, G.; Ranieri, G.; Licciulli, A.; Laviano, R. Fluorinated polymeric materials for the protection of monumental buildings. Macromolecular Symposia 2000, 152, 211–222. [Google Scholar] [CrossRef]
- Leivo, E.; Wilenius, T.; Kinos, T.; Vuoristo, P.; Mäntylä, T. Properties of thermally sprayed fluoropolymer PVDF, ECTFE, PFA and FEP coatings. Progress in Organic Coatings 2004, 49, 69–73. [Google Scholar] [CrossRef]
- Kwon, S.; Bae, W.; Lee, K.; Byun, H.S.; Kim, H. High Pressure Phase Behavior of Carbon Dioxide + 2,2,2-Trifluoroethyl Methacrylate and + Poly(2,2,2-trifluoroethyl methacrylate) Systems. Journal of Chemical & Engineering Data 2007, 52, 89–92. [Google Scholar] [CrossRef]
- Kwon, S.; Bae, W.; Kim, H. The Effect of CO2 in Free-radical Polymerization of 2,2,2-Trifluoroethyl Methacrylate. Korean Journal of Chemical Engineering 2004, 21, 910–914. [Google Scholar] [CrossRef]
- Zelaya, J.R.; Tepper, G.C. Cloud Point Behavior of Poly(trifluoroethyl methacrylate) in Supercritical CO2–Toluene Mixtures. Molecules 2025, 30. [Google Scholar] [CrossRef]
- Byun, H.S.; Kim, C.R.; Yoon, S.D. Cloud-point measurement of binary and ternary mixtures for the P(MMA-co-PnFPA) in supercritical fluoric solvents. The Journal of Supercritical Fluids 2017, 120, 226–239. [Google Scholar] [CrossRef]
- An-hou Xu, Lu-qing Zhang, J. c.M.Y.m.M.B.G.S.x.Z. Preparation and surface properties of poly(2,2,2-trifluoroethyl methacrylate) coatings modified with methyl acrylate. Journal of Coatings Technology and Research 2016, 13, 795–804. [Google Scholar] [CrossRef]
- Annohene, G.; Tepper, G. Moisture Stability of Perovskite Solar Cells Processed in Supercritical Carbon Dioxide. Molecules 2021, 26, 7570. [Google Scholar] [CrossRef]
- Annohene, G.; Tepper, G.C. Efficient perovskite solar cells processed in supercritical carbon dioxide. The Journal of Supercritical Fluids 2021, 171, 105203. [Google Scholar] [CrossRef]
- Annohene, G.; Pascucci, J.; Pestov, D.; Tepper, G.C. Supercritical fluid-assisted crystallization of CH3NH3PbI3 perovskite films. The Journal of Supercritical Fluids 2020, 156, 104684. [Google Scholar] [CrossRef]
- Annohene, G.; Tepper, G.C. Low temperature formation of CH3NH3PbI3 perovskite films in supercritical carbon dioxide. Journal of Supercritical Fluids 2019, 154, 104604. [Google Scholar] [CrossRef]
- Oxtoby, D.W. Homogeneous nucleation: theory and experiment. Journal of Physics: Condensed Matter 1992, 4, 7627. [Google Scholar] [CrossRef]
- Kalikmanov, V.I., Classical Nucleation Theory. In Nucleation Theory; Springer Netherlands: Dordrecht, 2013; pp. 17–41. [CrossRef]
- Kashchiev, D. Nucleation; Elsevier, 2000.
- Kalikmanov, V.I., Heterogeneous Nucleation. In Nucleation Theory; Springer Netherlands: Dordrecht, 2013; pp. 253–276 [CrossRef]
- Liu, X. Heterogeneous nucleation or homogeneous nucleation? The Journal of Chemical Physics 2000, 112, 9949–9955. [Google Scholar] [CrossRef]
- Lifshitz, I.M.; Slyozov, V.V. The kinetics of precipitation from supersaturated solid solutions. Journal of physics and chemistry of solids 1961, 19, 35–50. [Google Scholar] [CrossRef]
Figure 1.
Toluene depictions: expanded Kekulé form (left) and aromatic shorthand indicating a delocalized system (right). Aprotic and -polarizable, toluene is compatible with scCO2-rich phases and broadens the solvency window, shifting cloud points.
Figure 1.
Toluene depictions: expanded Kekulé form (left) and aromatic shorthand indicating a delocalized system (right). Aprotic and -polarizable, toluene is compatible with scCO2-rich phases and broadens the solvency window, shifting cloud points.
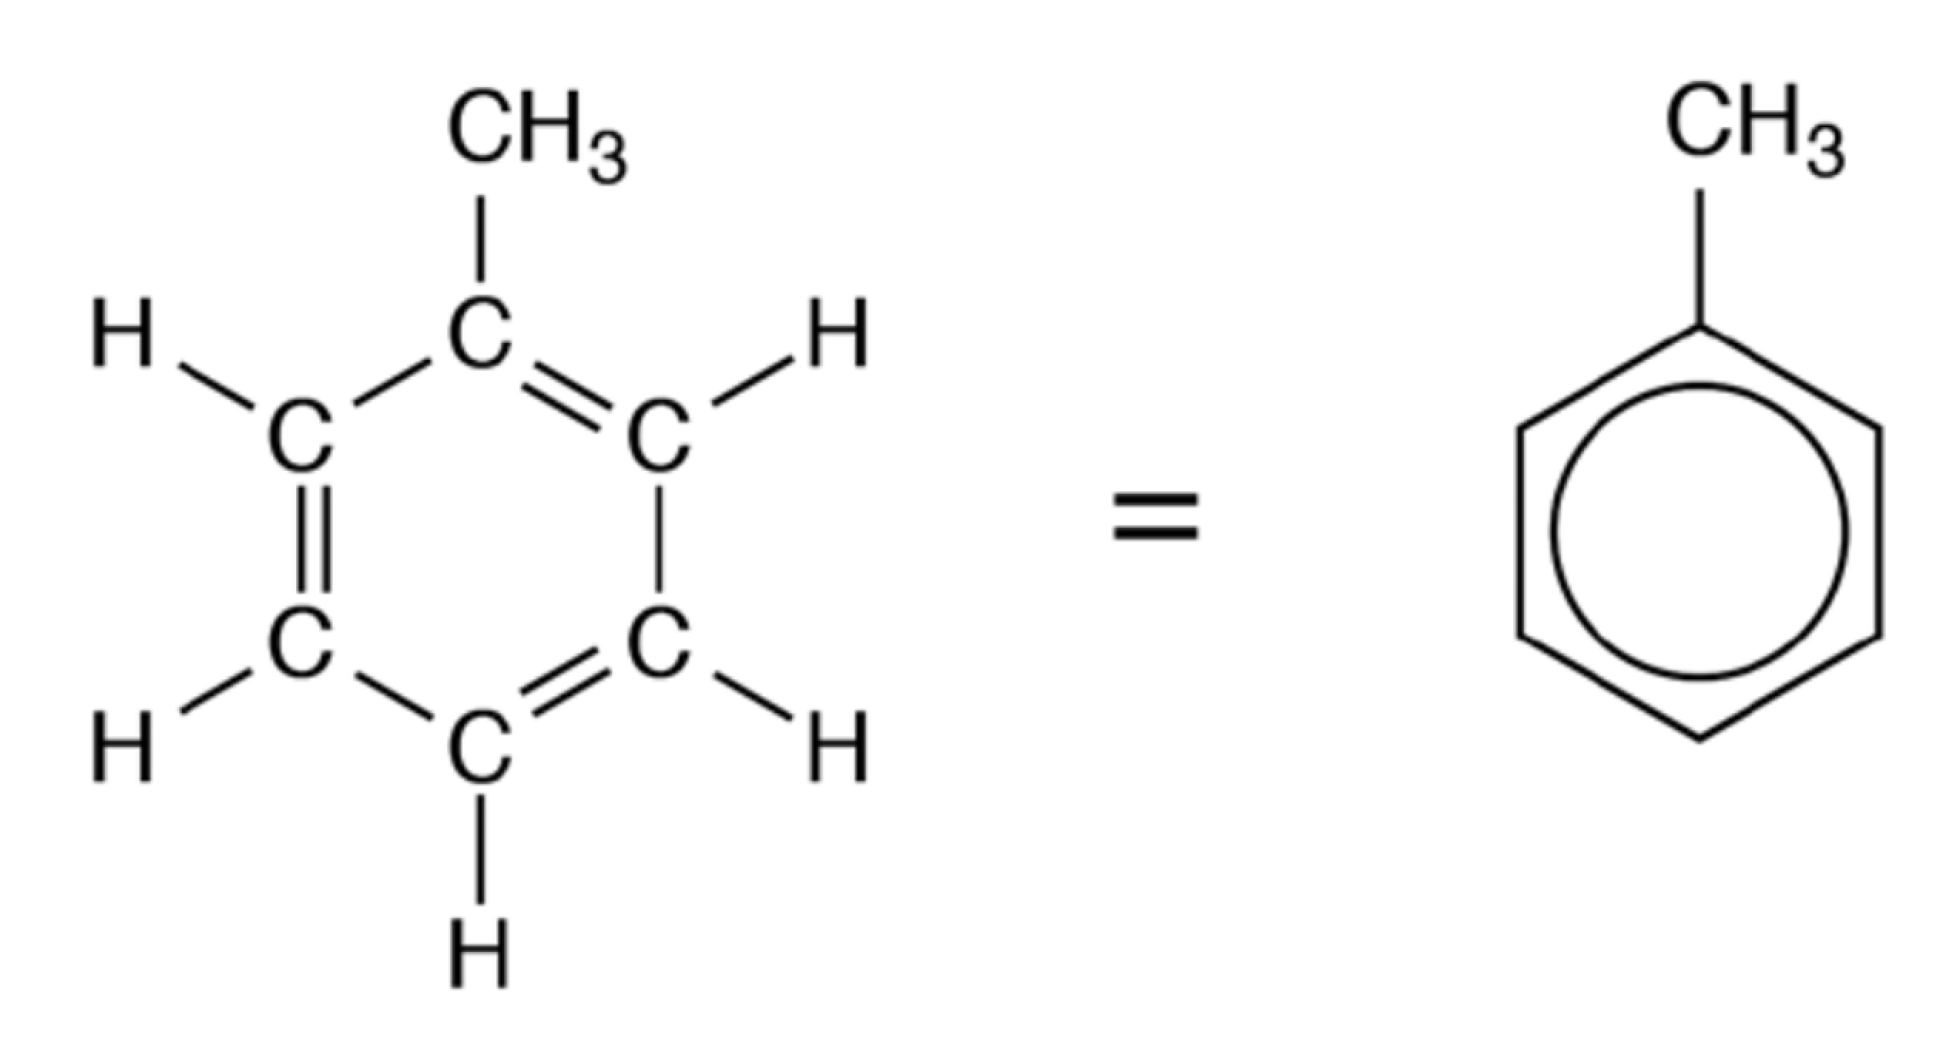
Figure 2.
Repeat unit of poly(TFEMA): a methacrylate backbone bearing a 2,2,2-trifluoroethyl ester pendant. The carbonyl (C=O) and terminal CF3 groups are CO2-philic motifs associated with compatibility in scCO2-rich phases.
Figure 2.
Repeat unit of poly(TFEMA): a methacrylate backbone bearing a 2,2,2-trifluoroethyl ester pendant. The carbonyl (C=O) and terminal CF3 groups are CO2-philic motifs associated with compatibility in scCO2-rich phases.
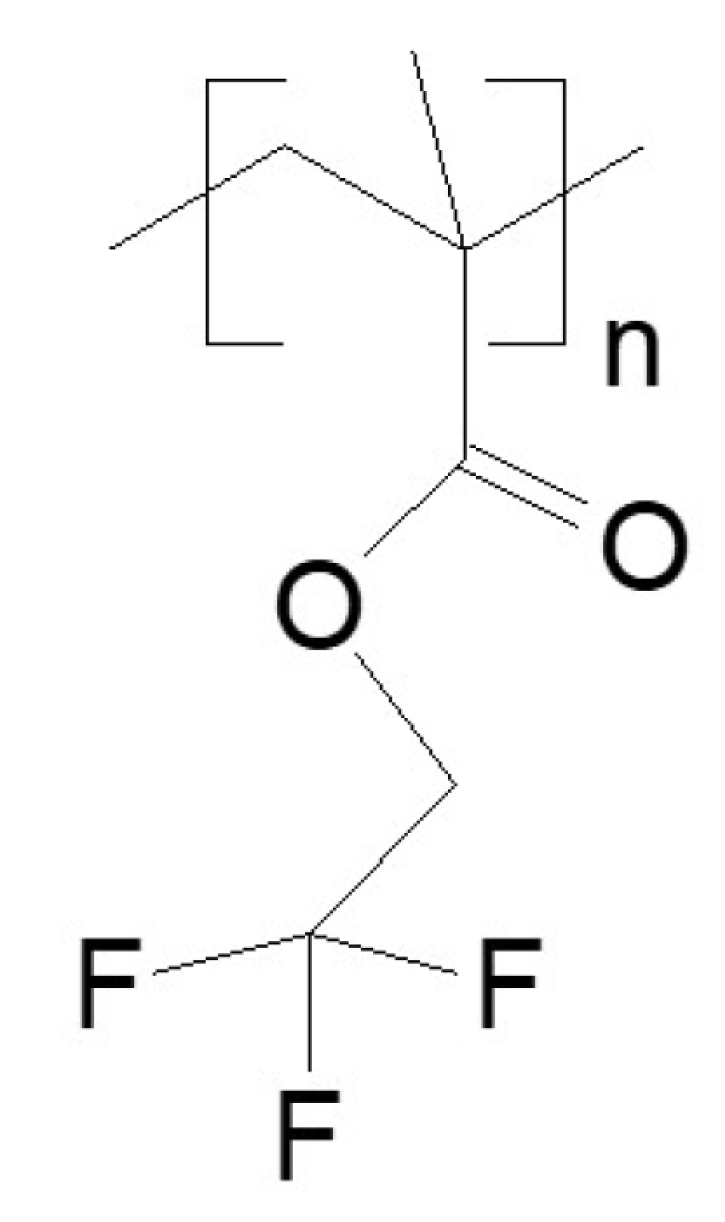
Figure 3.
SEM image of the one-phase region (40 ℃, 15.86 MPa) showing sparse, near-circular poly(TFEMA) islands on FTO with minimal necking.
Figure 3.
SEM image of the one-phase region (40 ℃, 15.86 MPa) showing sparse, near-circular poly(TFEMA) islands on FTO with minimal necking.
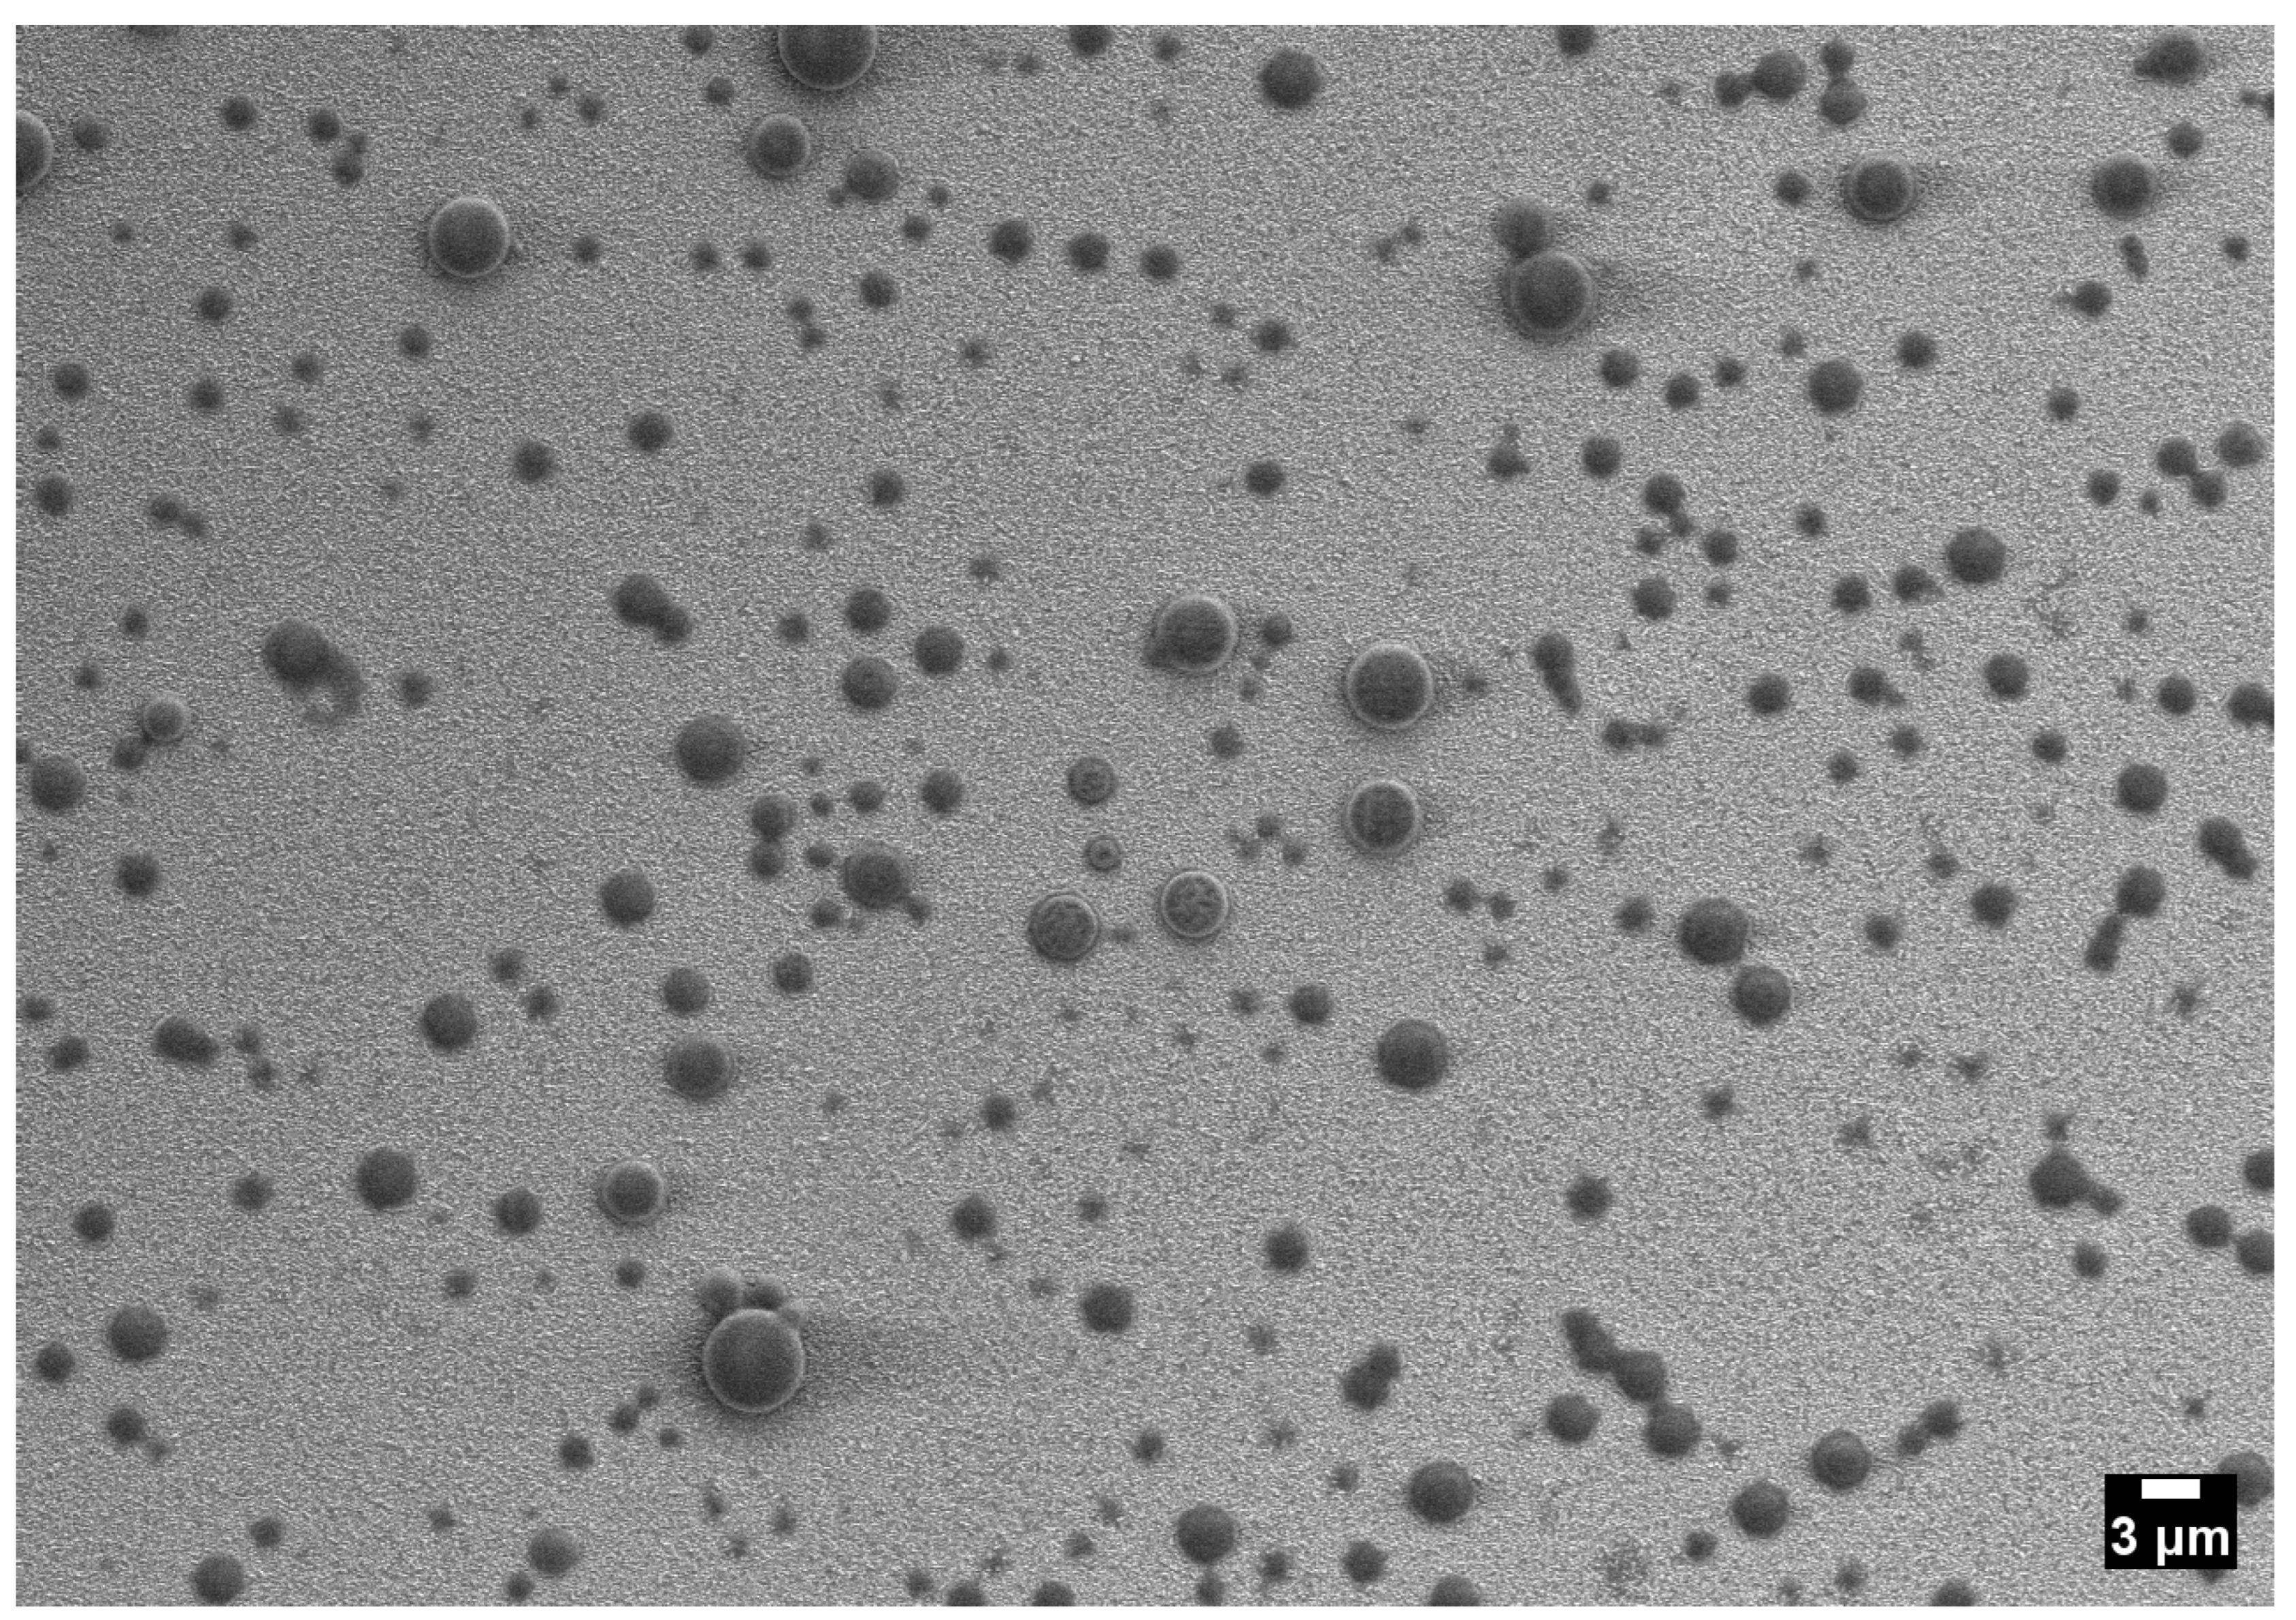
Figure 4.
PSD in the one-phase region (40 ℃, 15.86 MPa), following a lognormal distribution: m, m, , and ; histogram mode m.
Figure 4.
PSD in the one-phase region (40 ℃, 15.86 MPa), following a lognormal distribution: m, m, , and ; histogram mode m.
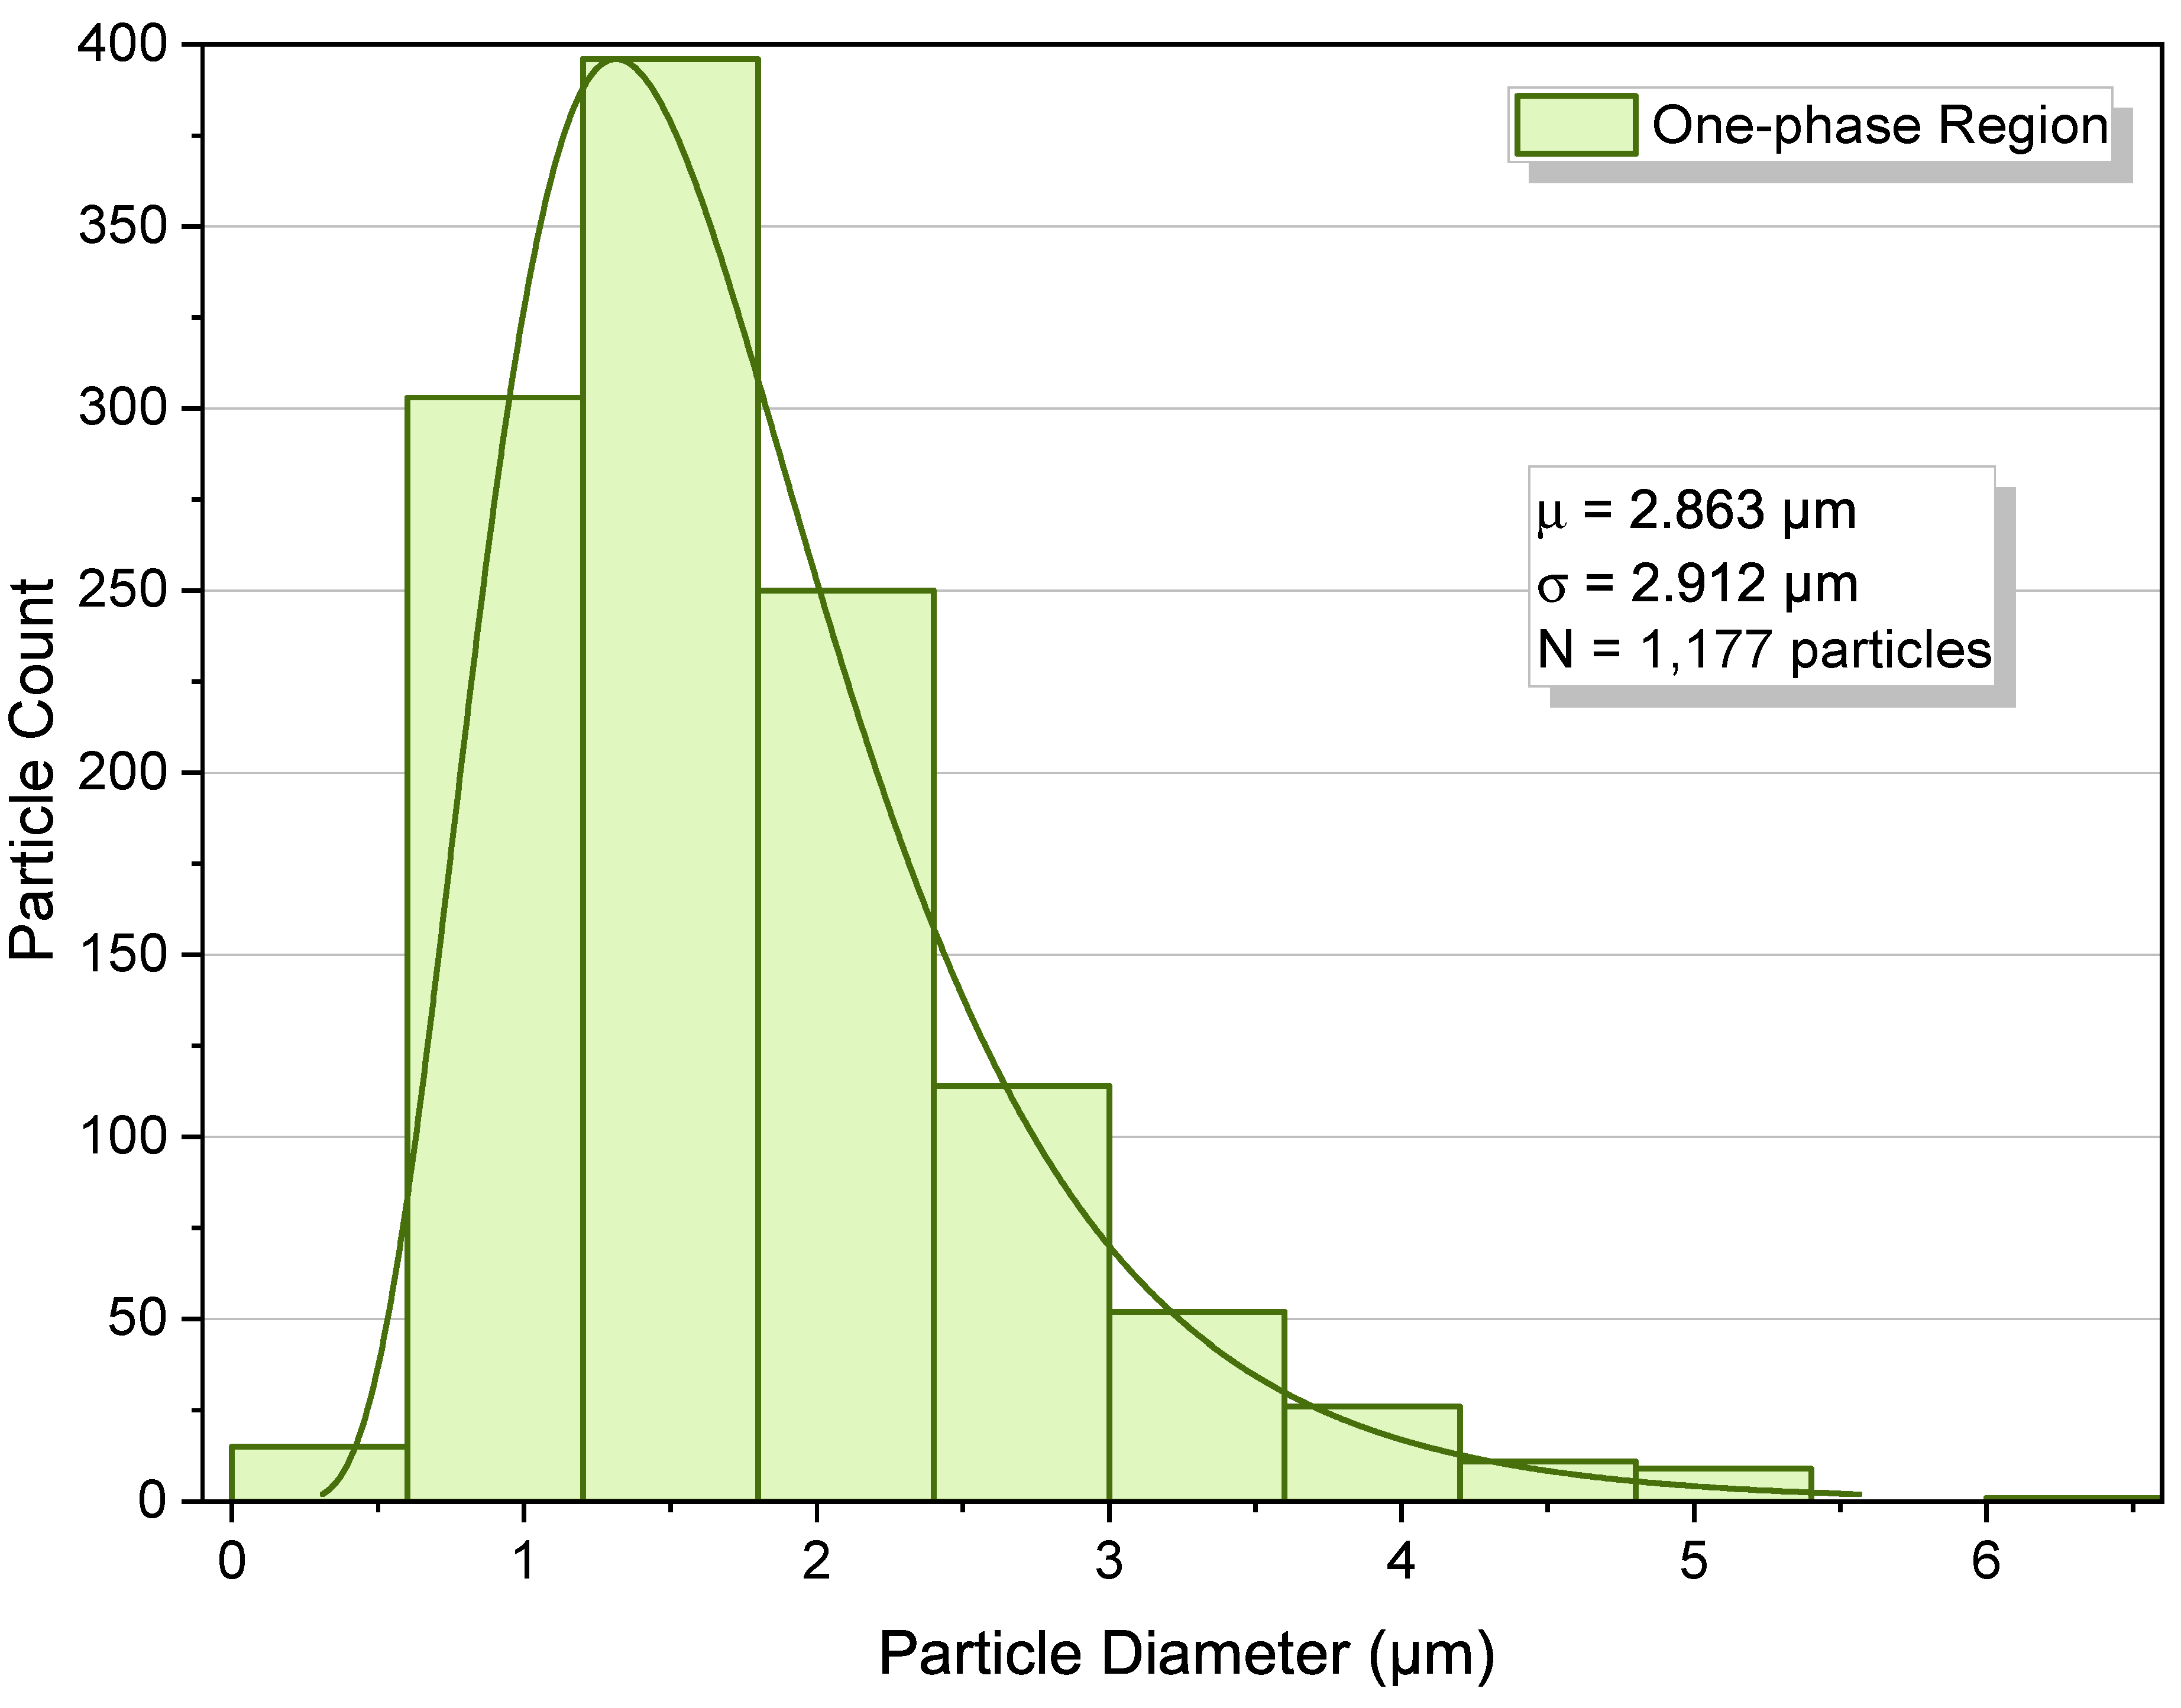
Figure 5.
SEM image of the cloud-point condition (40 ℃, 12.37 MPa) showing clustered spherical agglomerates of poly(TFEMA) on FTO.
Figure 5.
SEM image of the cloud-point condition (40 ℃, 12.37 MPa) showing clustered spherical agglomerates of poly(TFEMA) on FTO.
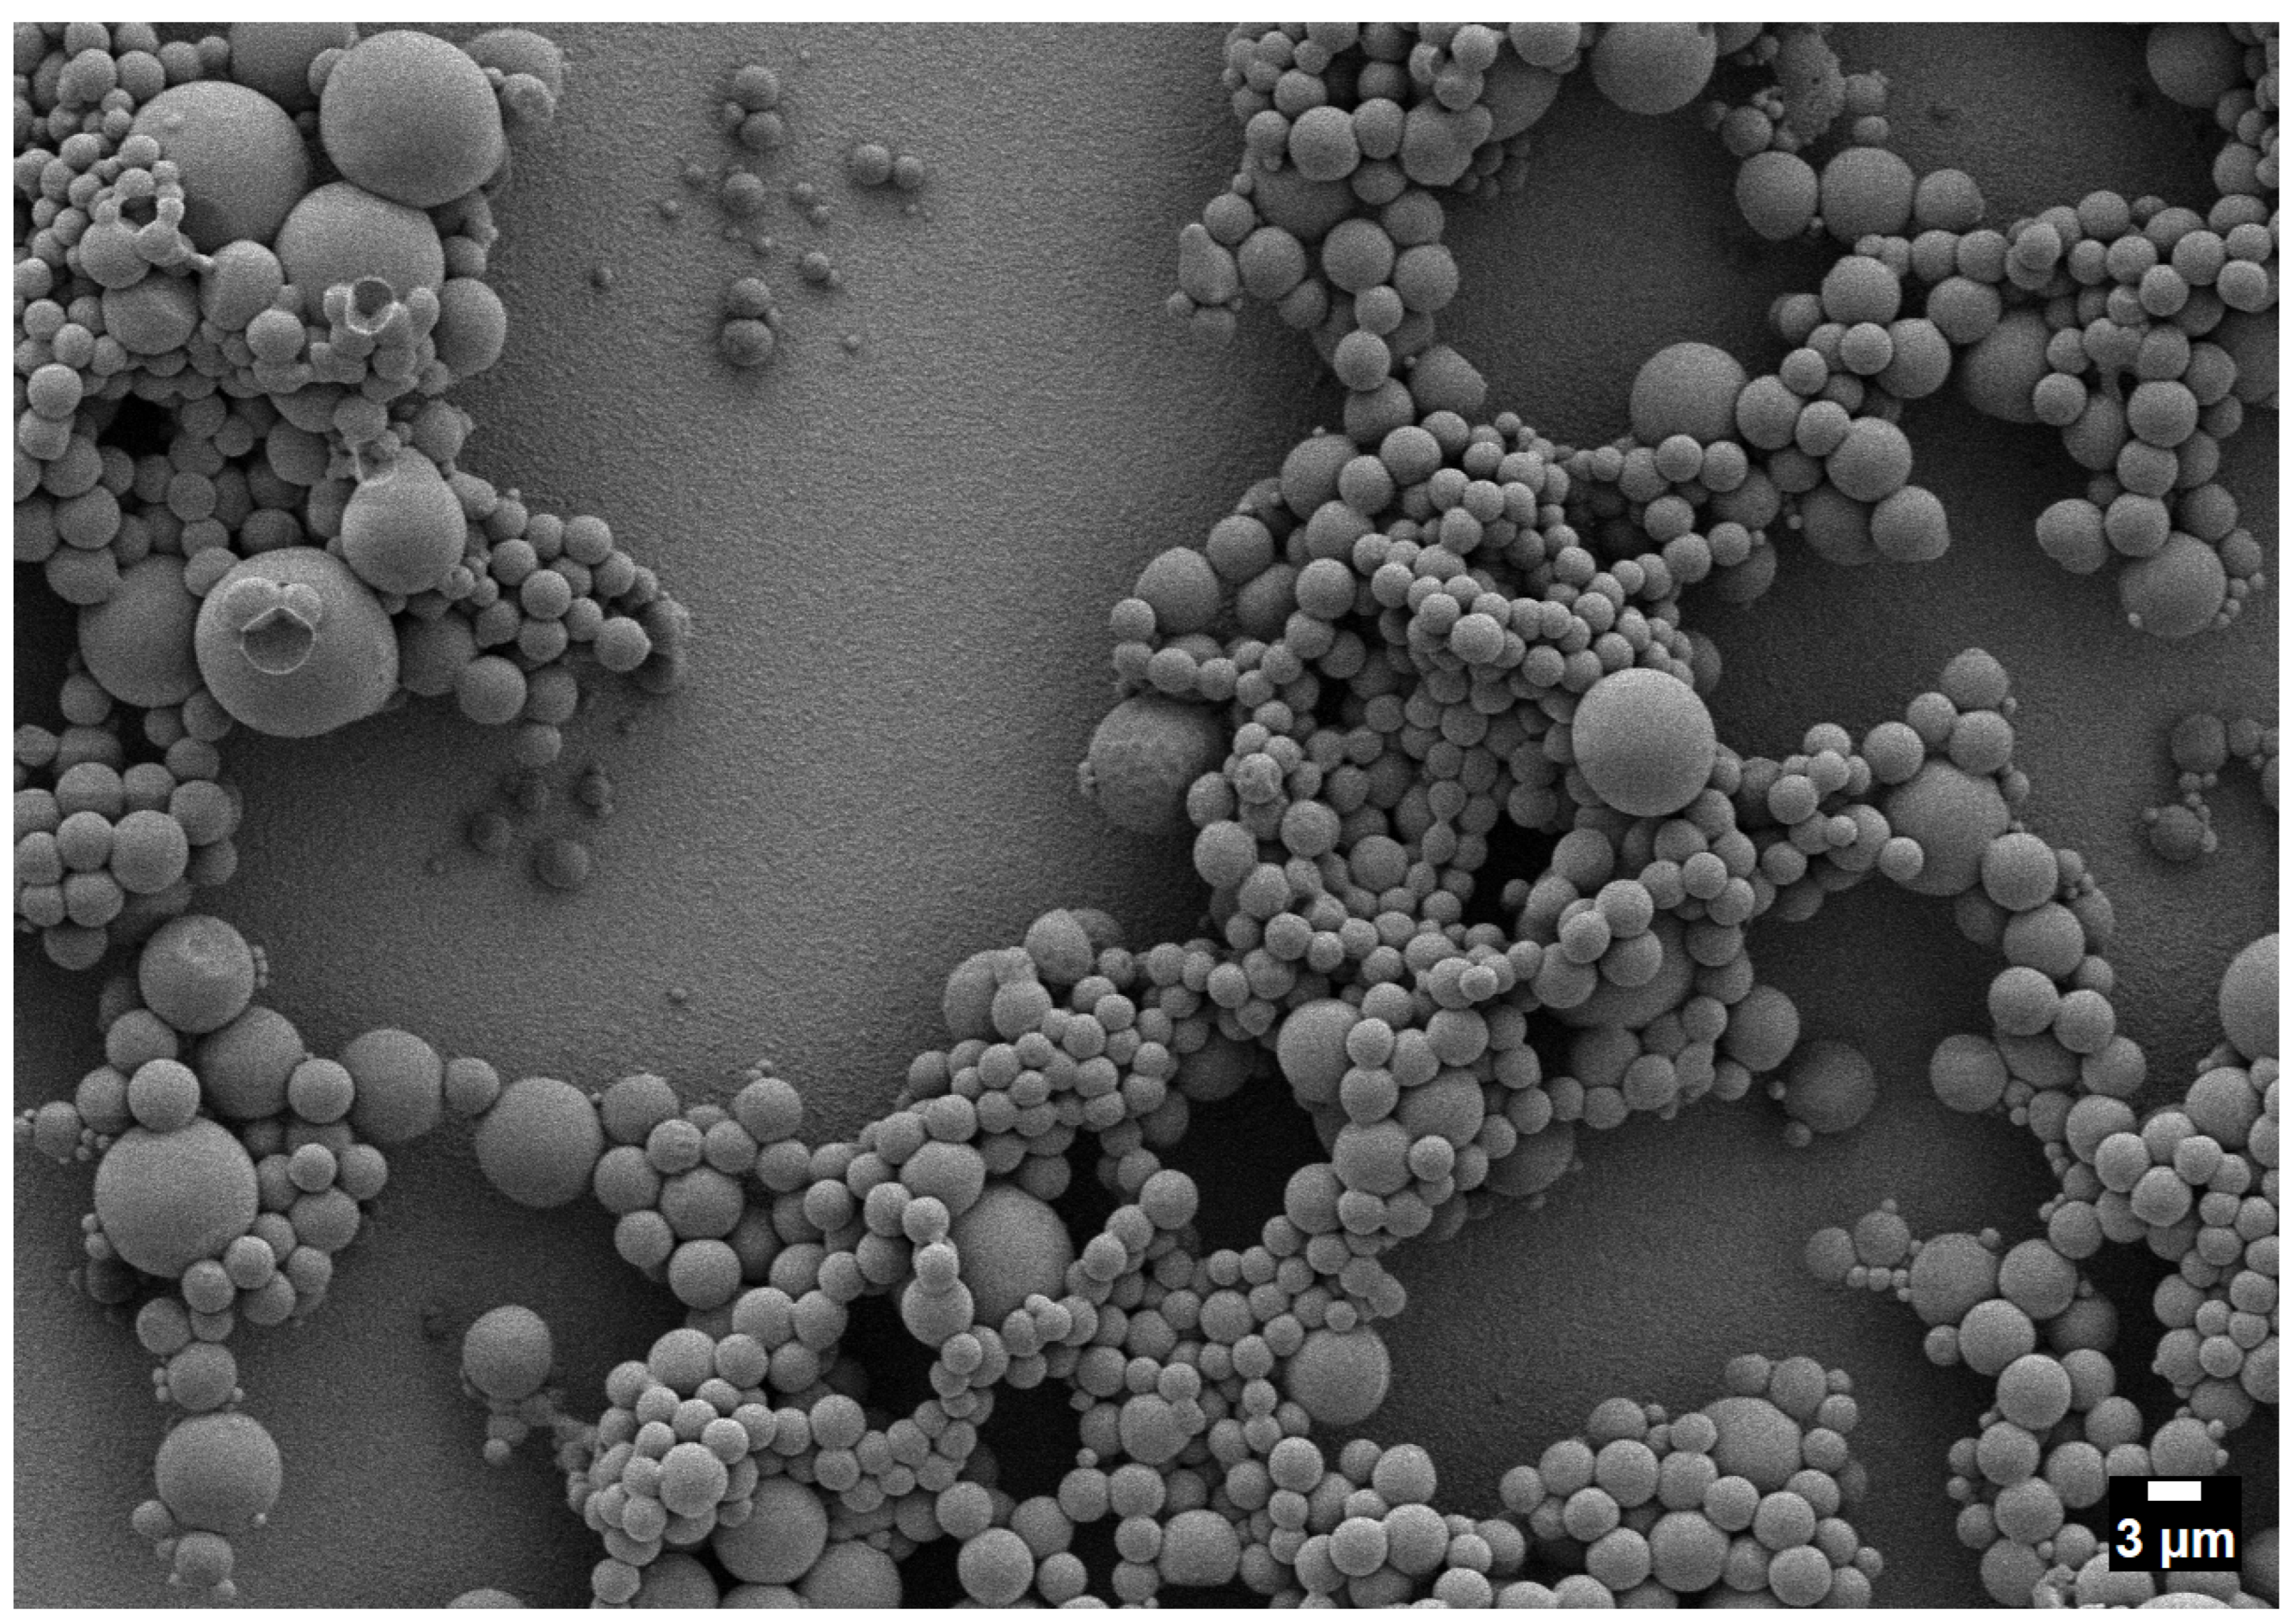
Figure 6.
PSD at the cloud point (40 ℃, 12.37 MPa), following a lognormal distribution: m, m, , ; histogram mode m.
Figure 6.
PSD at the cloud point (40 ℃, 12.37 MPa), following a lognormal distribution: m, m, , ; histogram mode m.
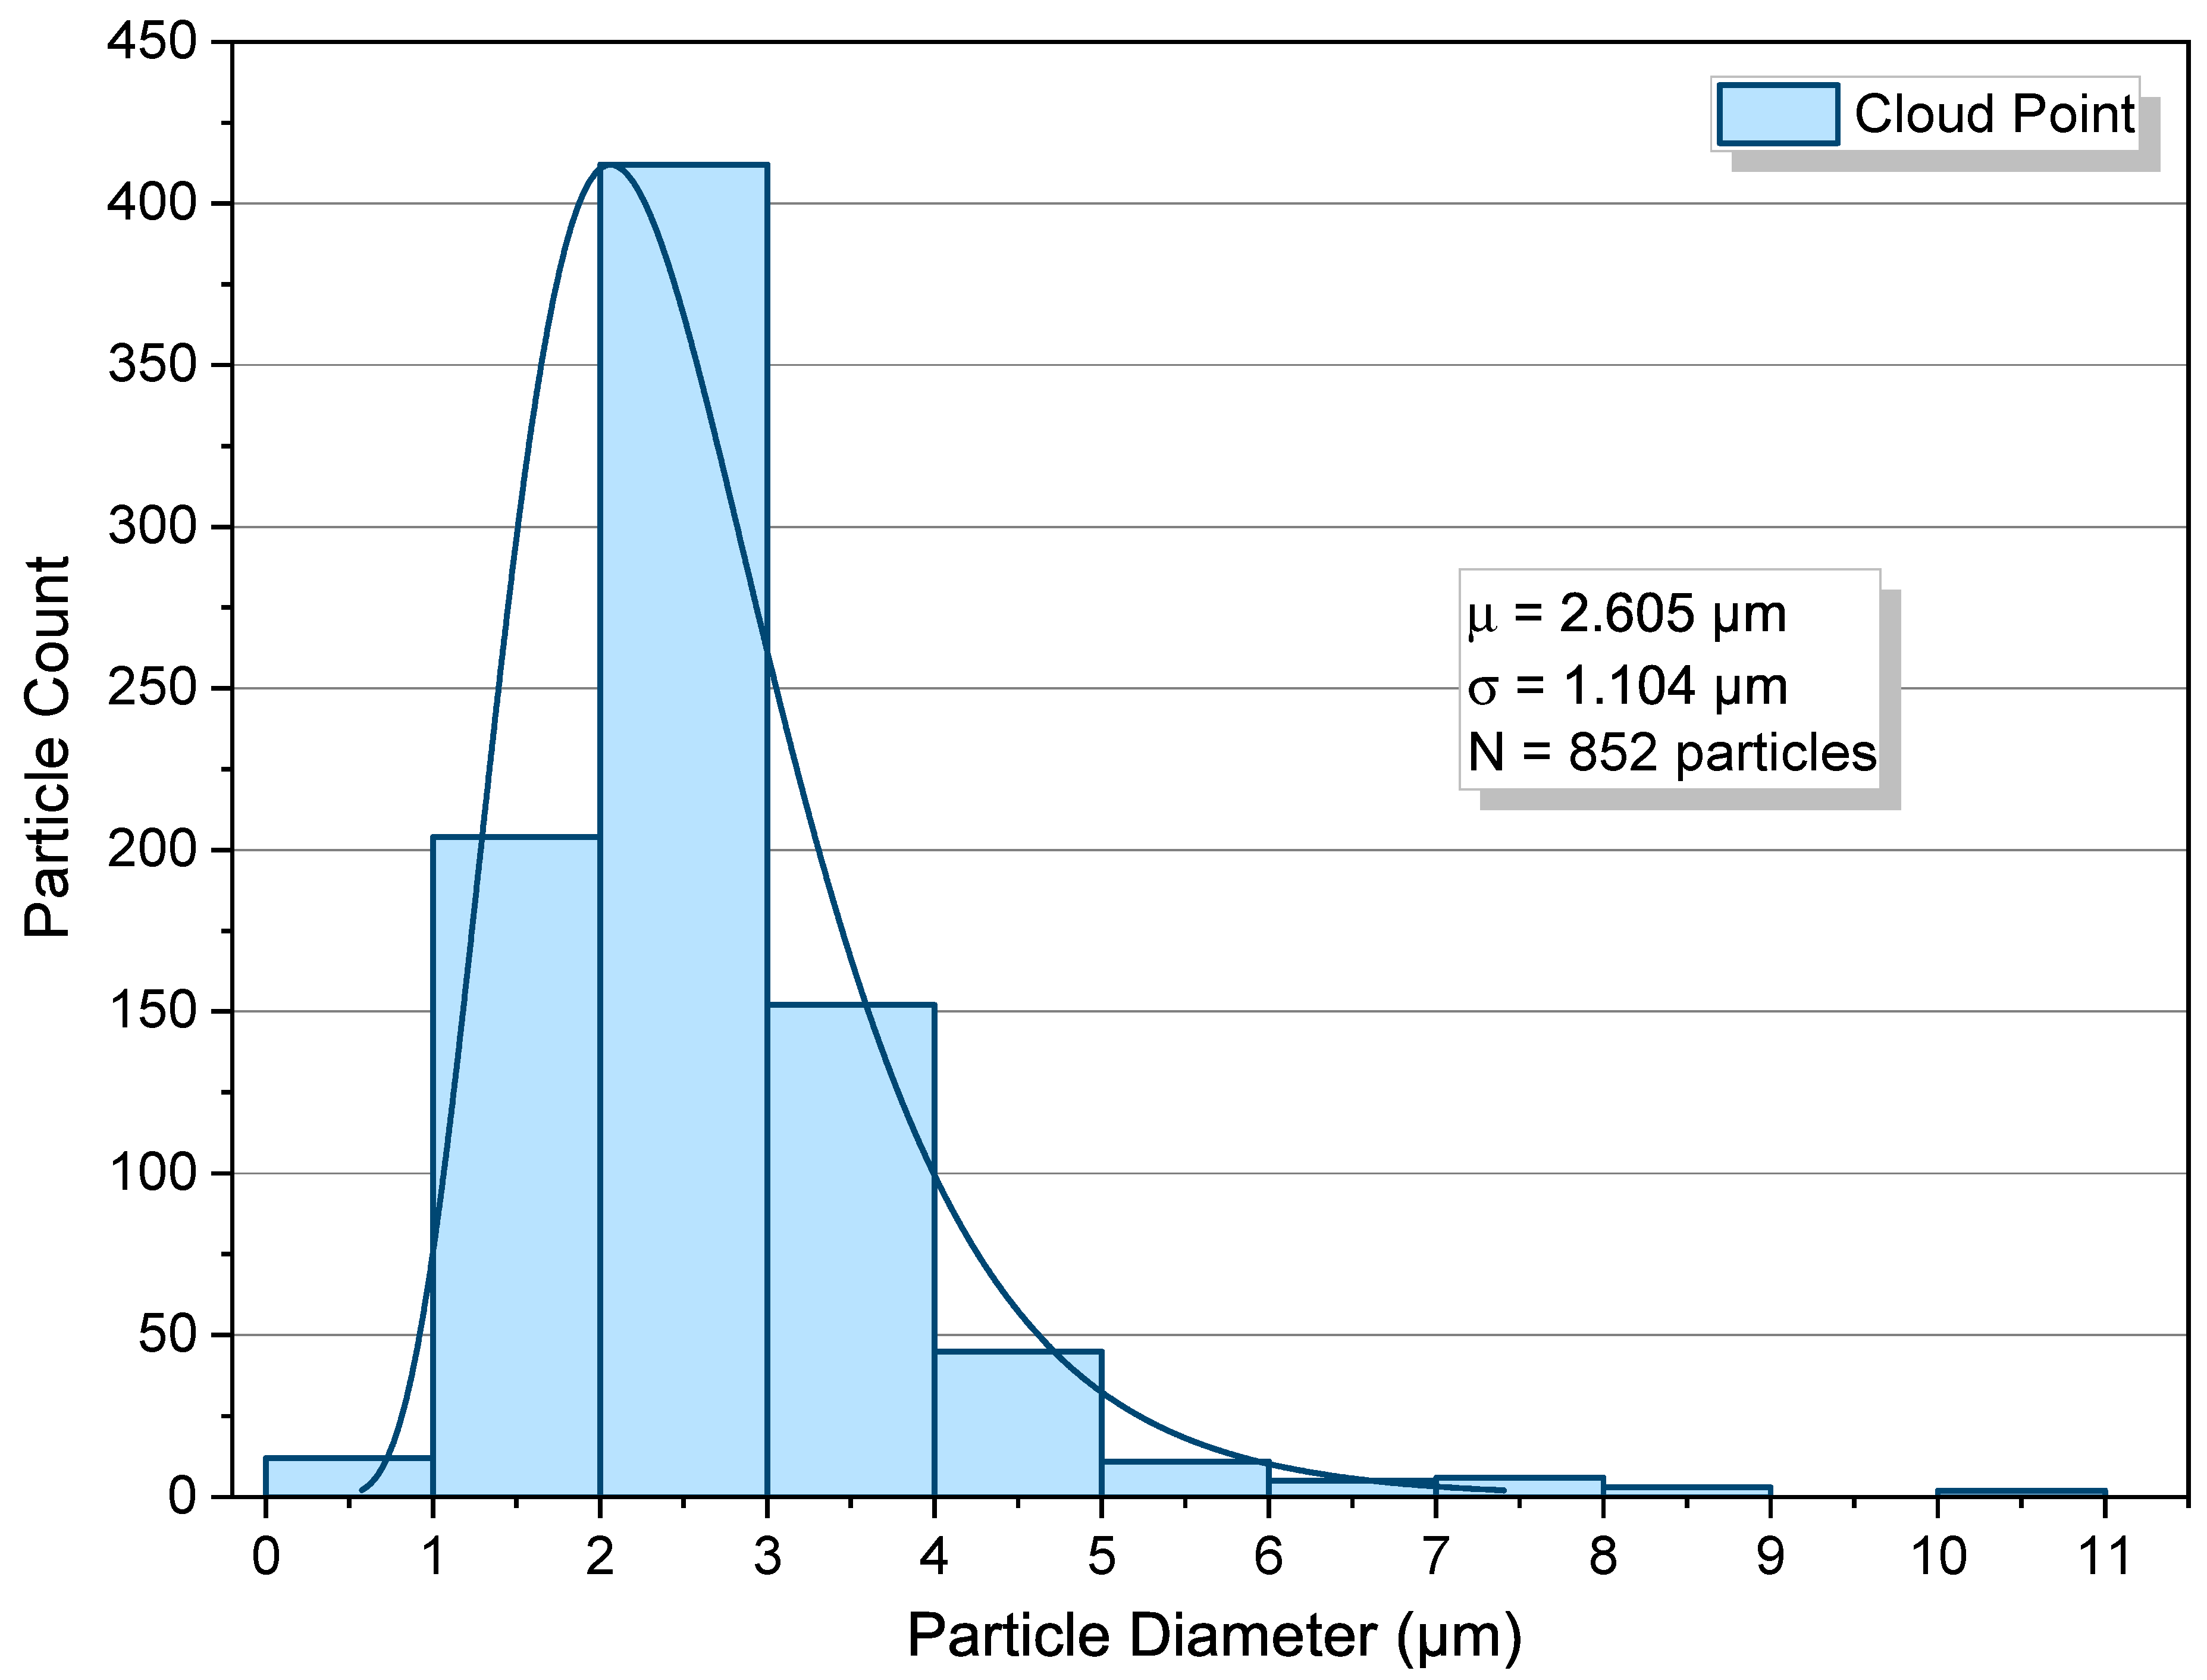
Figure 7.
SEM image of the two-phase region (40 ℃, 8.96 MPa) showing a hierarchical particle population on FTO: numerous small spheres alongside large hollow or pitted poly(TFEMA) particles.
Figure 7.
SEM image of the two-phase region (40 ℃, 8.96 MPa) showing a hierarchical particle population on FTO: numerous small spheres alongside large hollow or pitted poly(TFEMA) particles.
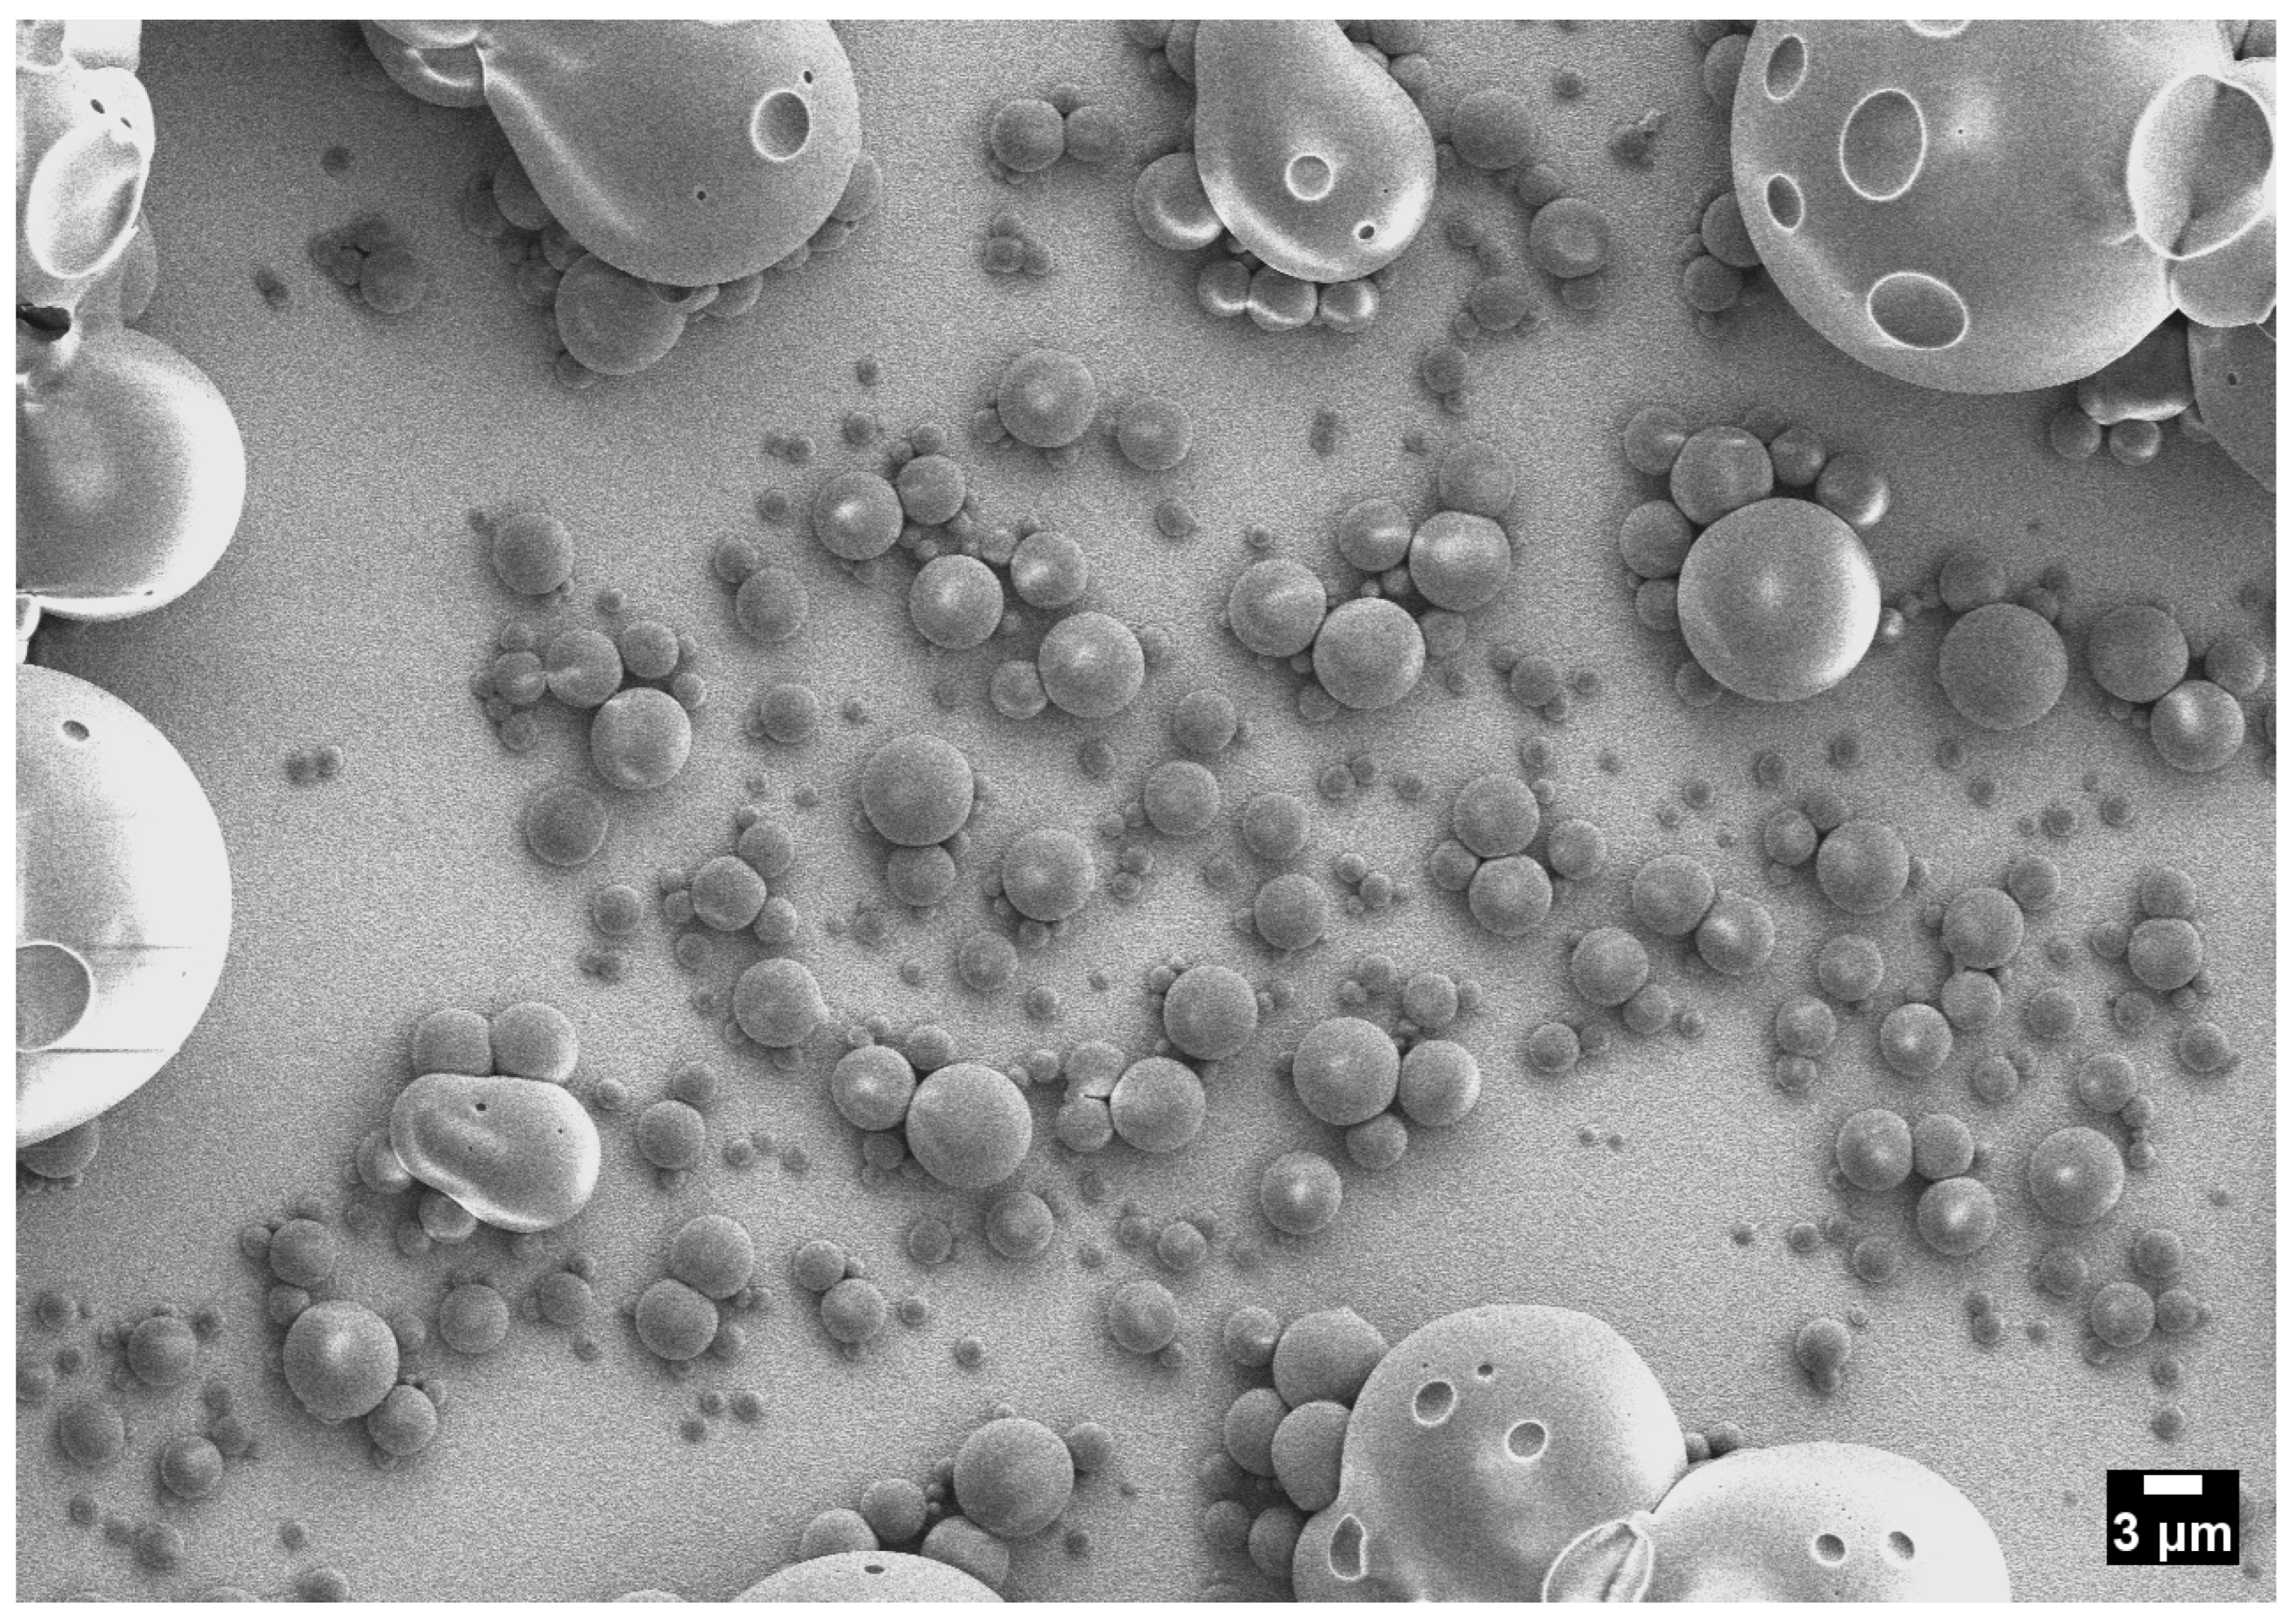
Figure 8.
PSD in the two-phase region (40 ℃, 8.96 MPa), well described by a lognormal fit; broad, right-skewed with a heavy upper tail to m. m, m, , .
Figure 8.
PSD in the two-phase region (40 ℃, 8.96 MPa), well described by a lognormal fit; broad, right-skewed with a heavy upper tail to m. m, m, , .
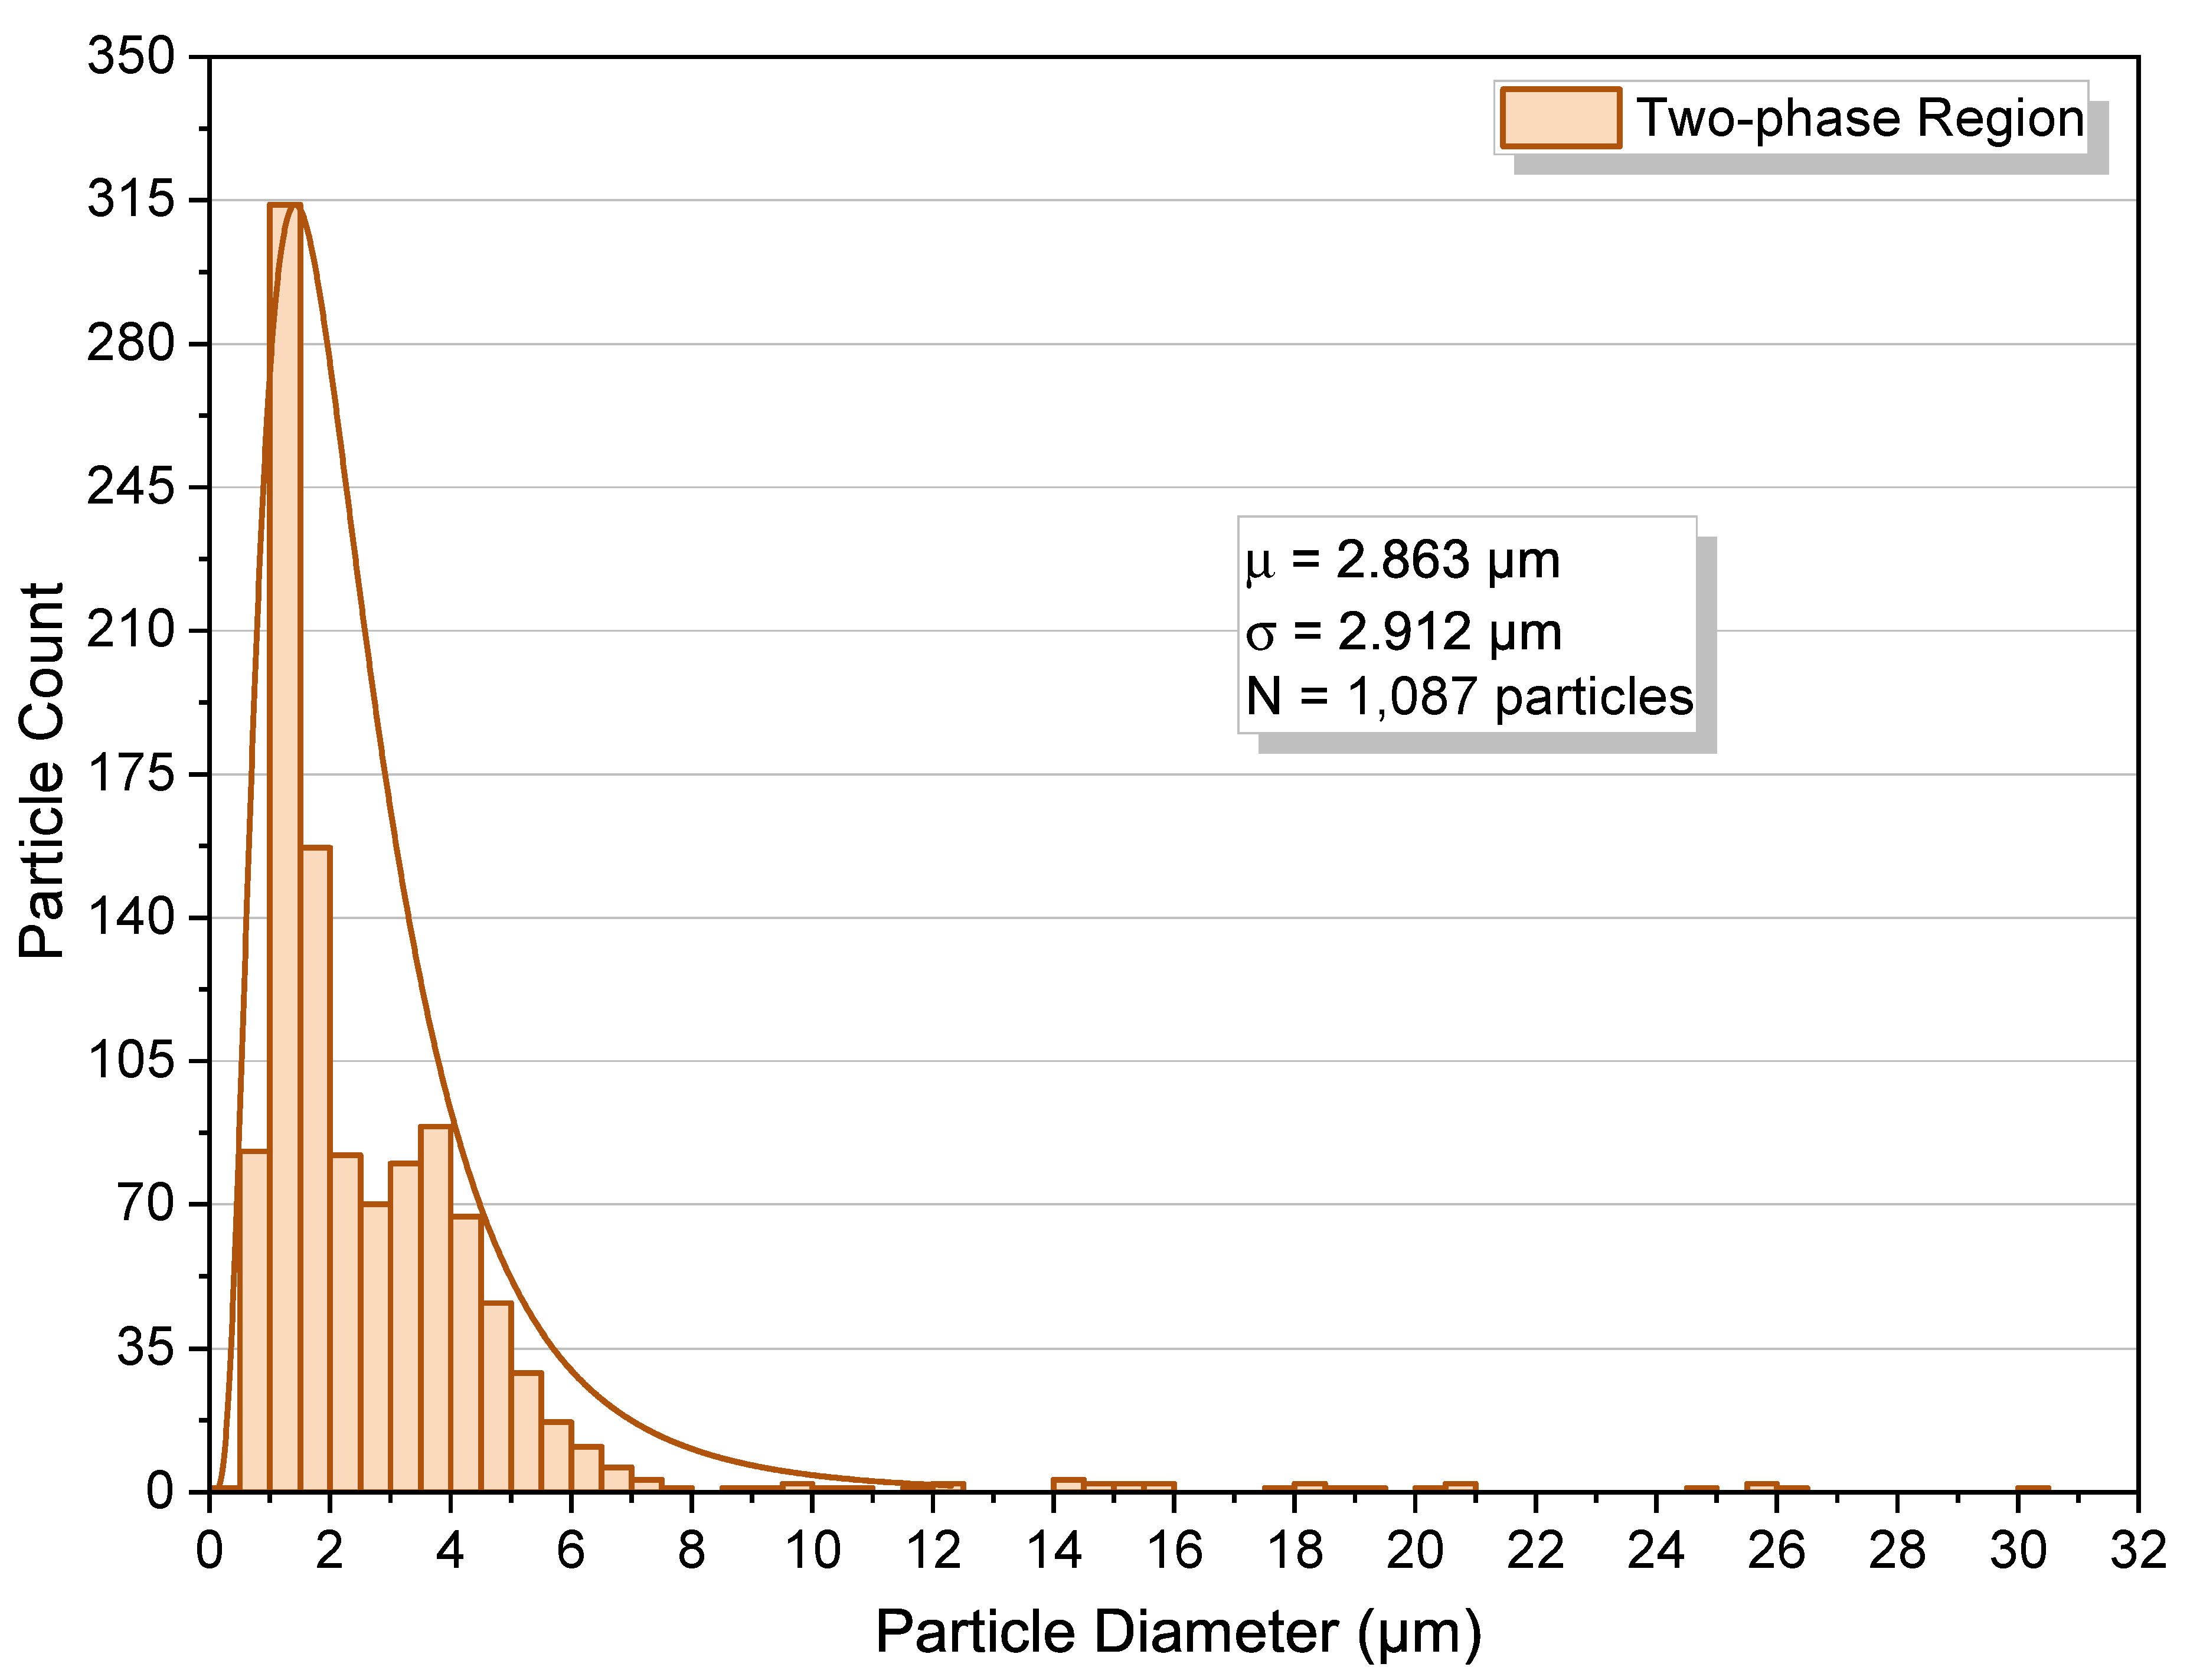
Figure 9.
Log-scaled boxplots of poly(TFEMA) particle diameters at 40 ℃ in the one-phase (15.86 MPa), cloud-point (12.37 MPa), and two-phase (8.96 MPa) regions. Boxes show the interquartile range (IQR) with the median as a solid line; squares indicate the mean; whiskers extend to 1.5× IQR; and diamonds denote outliers.
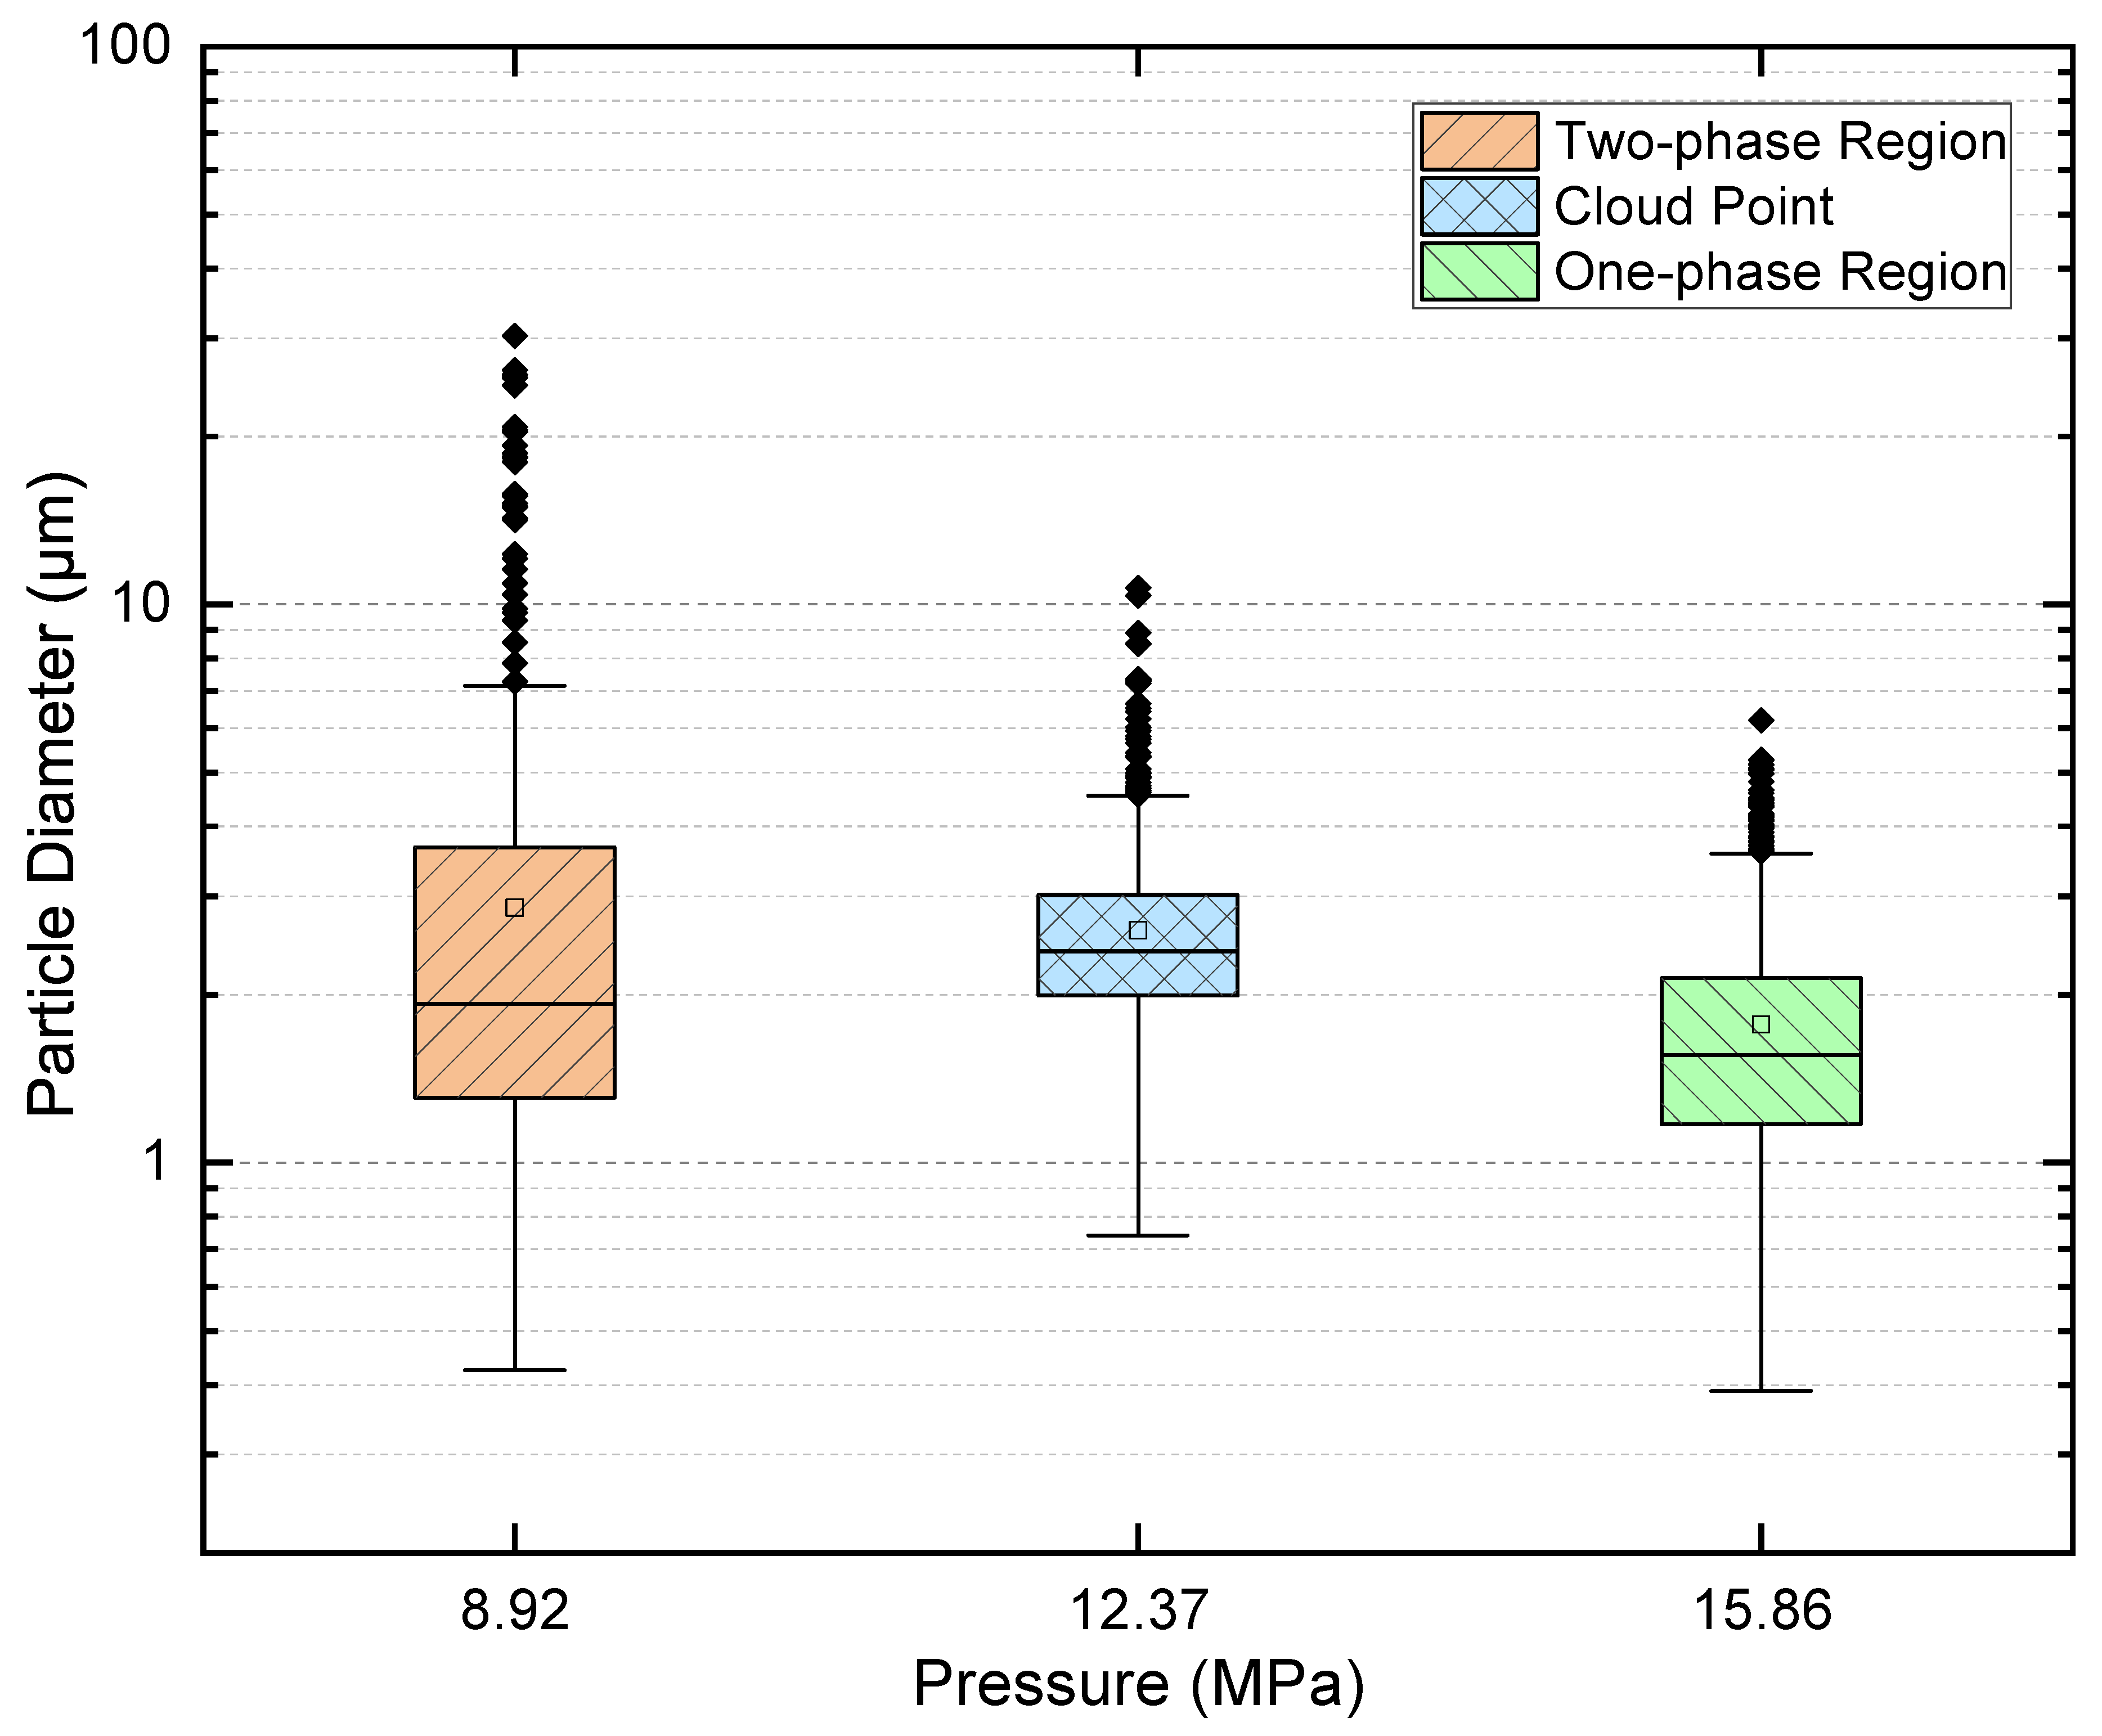
Figure 10.
Schematic diagram illustrating the primary components used to study the deposition of poly(TFEMA) in scCO2 with toluene cosolvent, operated at one-phase, cloud-point, and two-phase conditions.
Figure 10.
Schematic diagram illustrating the primary components used to study the deposition of poly(TFEMA) in scCO2 with toluene cosolvent, operated at one-phase, cloud-point, and two-phase conditions.
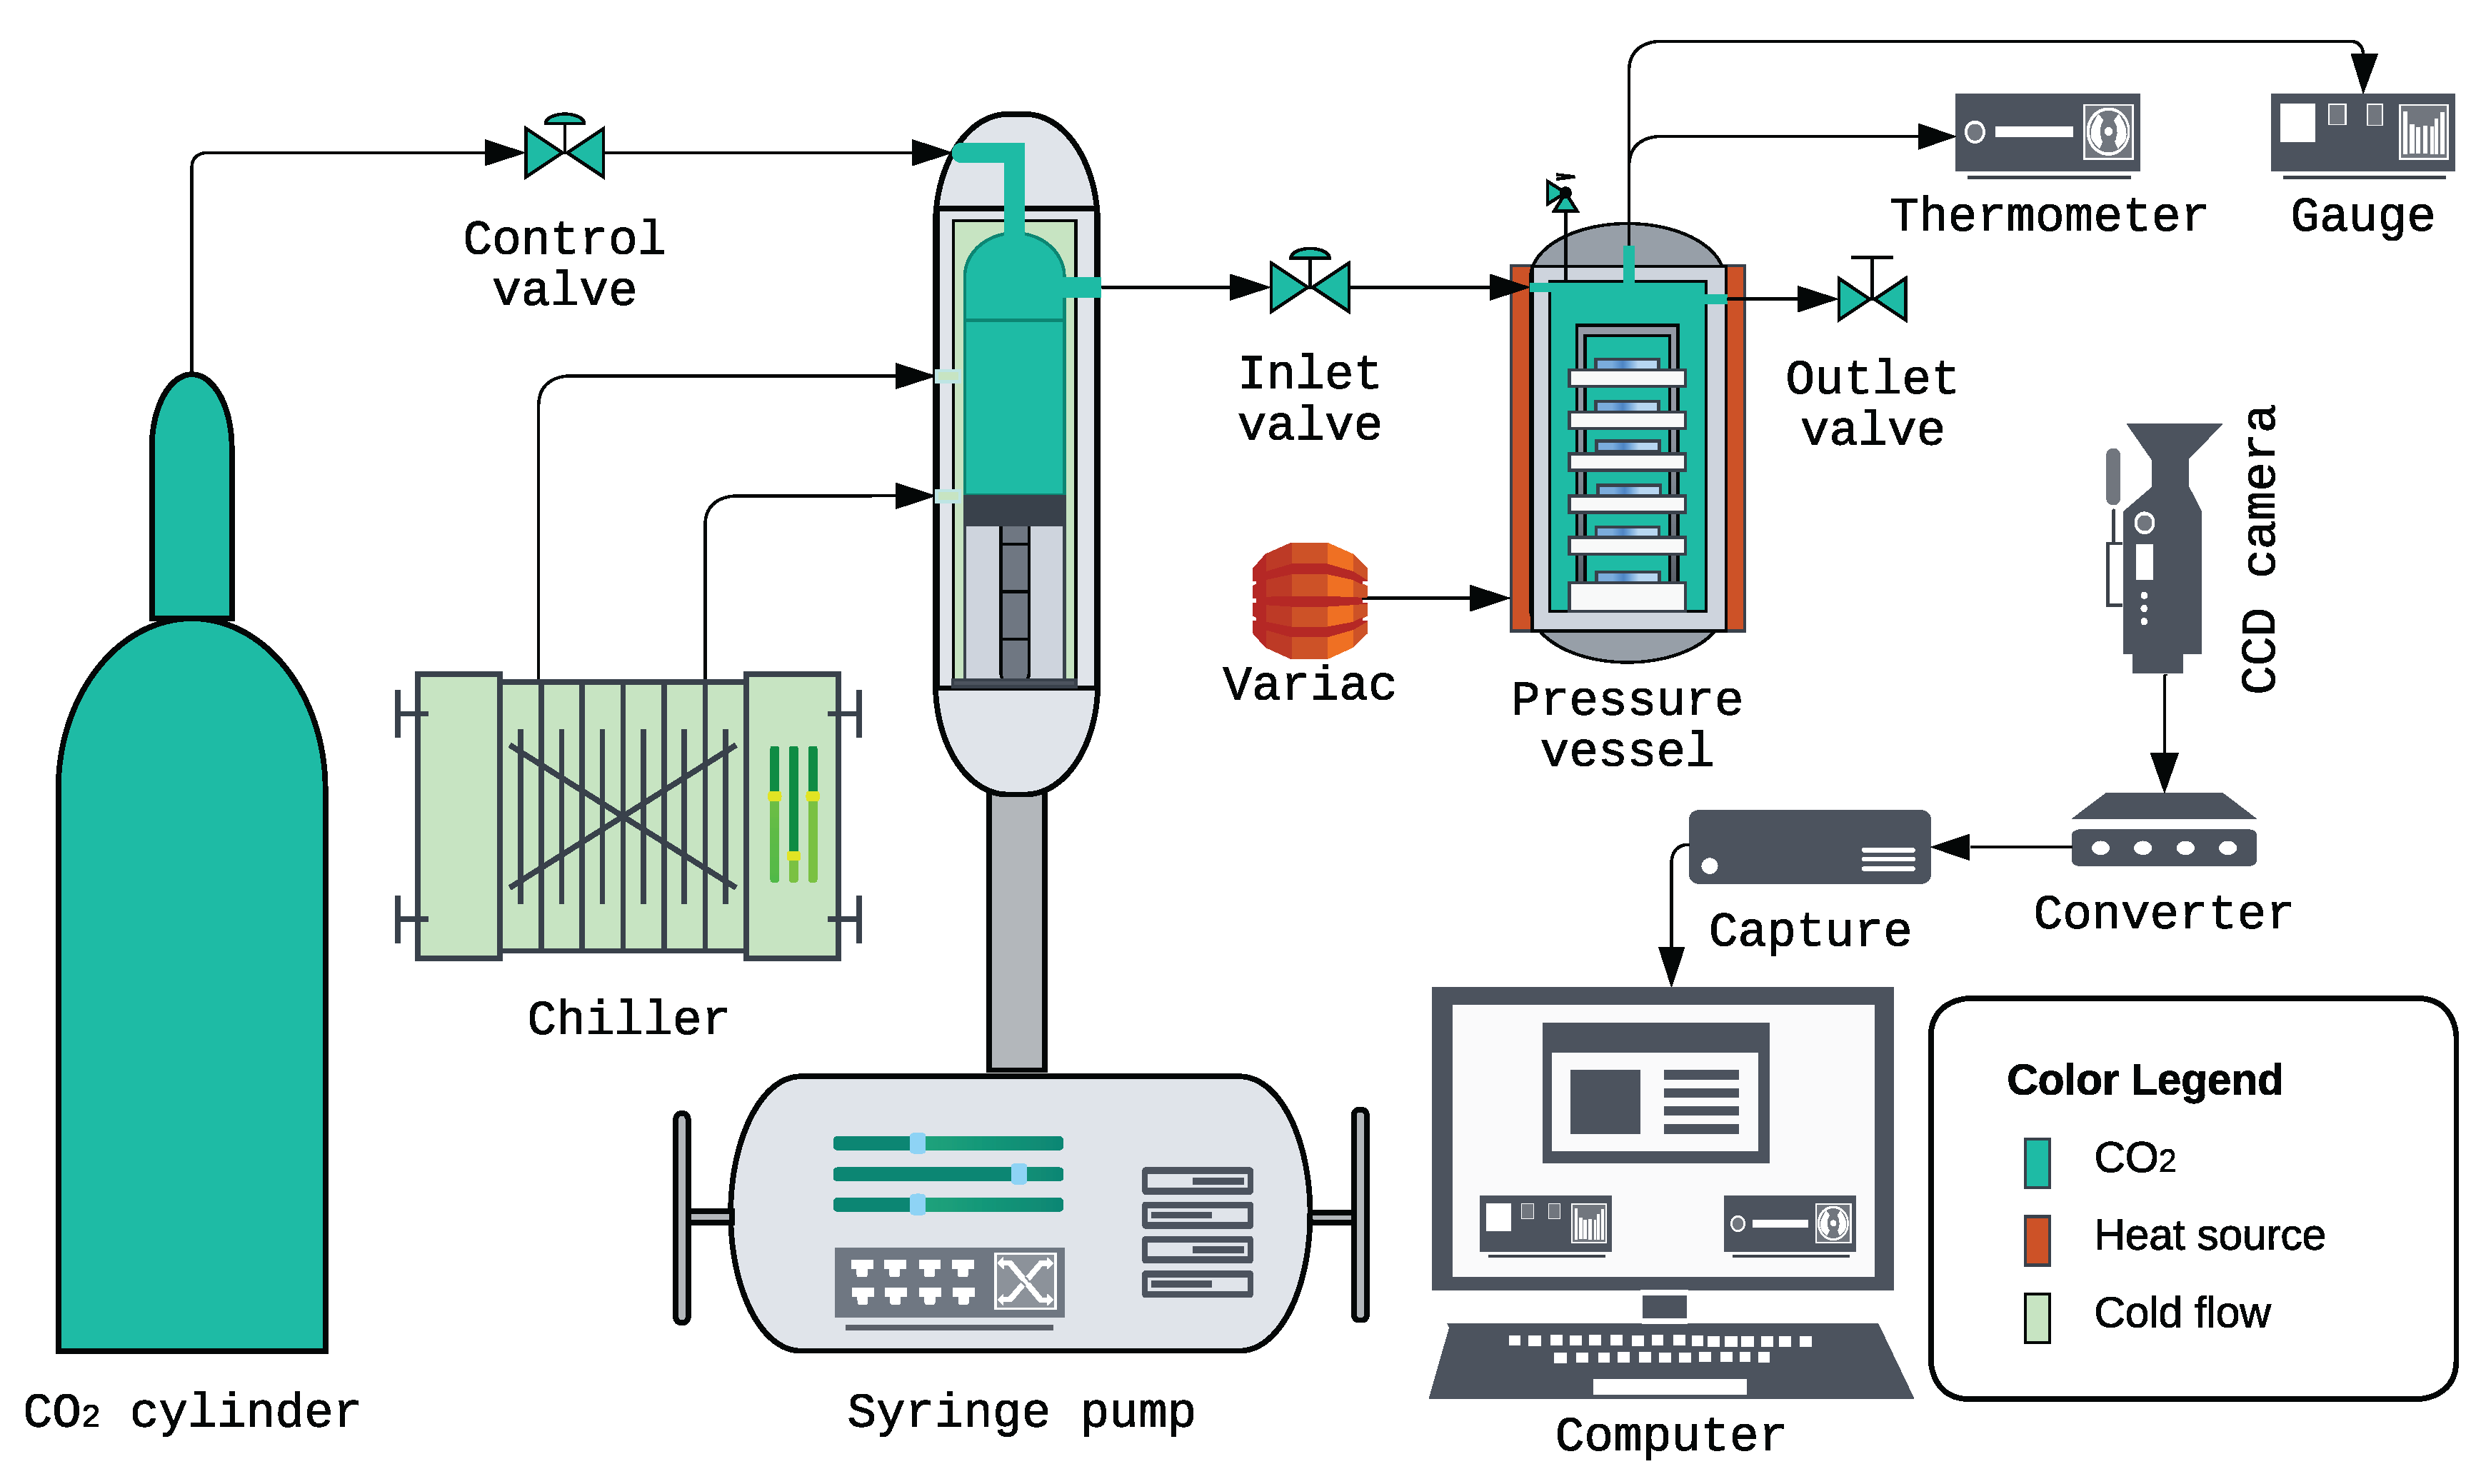
Figure 11.
Cloud-point pressure vs. temperature for 2, 3, and 5 wt% poly(TFEMA) in scCO2. Error bars are within of the reported value. The 3 wt% trend was reported previously in our previous publication and is reused here solely for comparison [60].
Figure 11.
Cloud-point pressure vs. temperature for 2, 3, and 5 wt% poly(TFEMA) in scCO2. Error bars are within of the reported value. The 3 wt% trend was reported previously in our previous publication and is reused here solely for comparison [60].
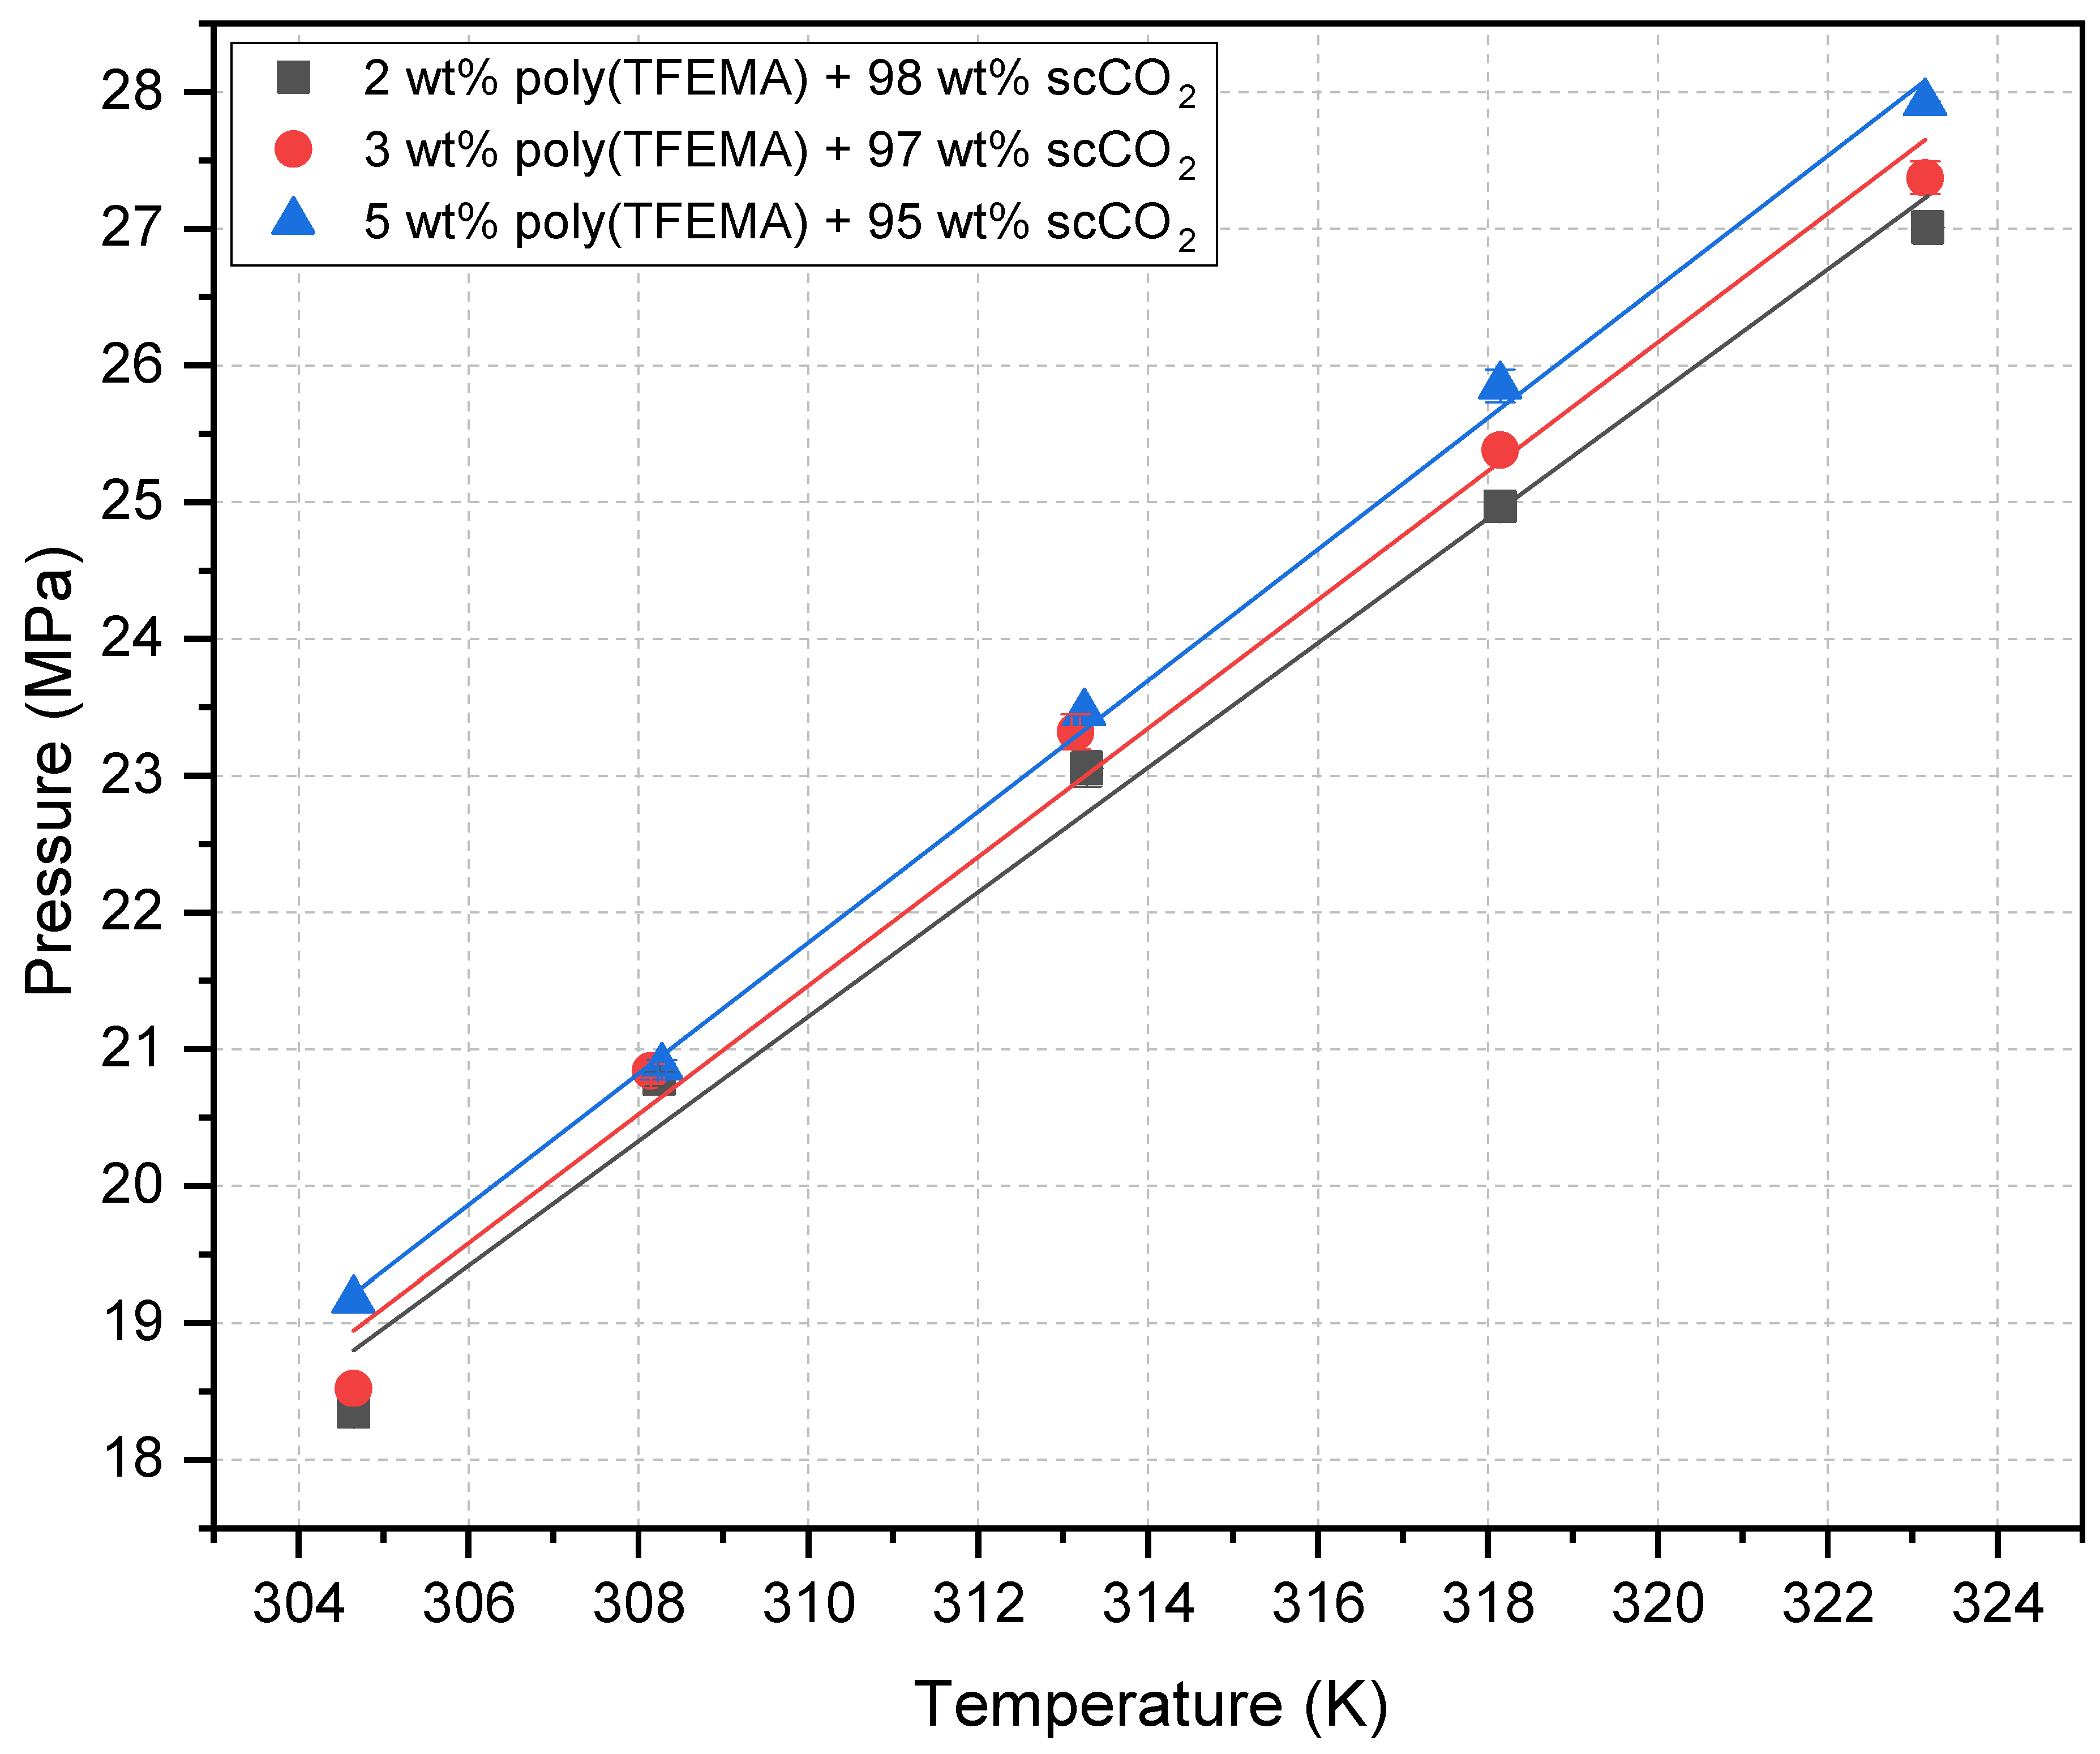

Table 1.
Poly(TFEMA) cloud-point pressures in neat CO2. Mean of measurements per entry (repeatability ). The 313.15 K row is used to estimate the polymer–fraction sensitivity at the deposition temperature.
Table 1.
Poly(TFEMA) cloud-point pressures in neat CO2. Mean of measurements per entry (repeatability ). The 313.15 K row is used to estimate the polymer–fraction sensitivity at the deposition temperature.
| Temperature (K) | Cloud point pressure (MPa) | ||
|---|---|---|---|
| 2 wt% poly(TFEMA) | 3 wt% poly(TFEMA)a | 5 wt% poly(TFEMA) | |
| 304.65 | 18.35 | 18.52 | 19.17 |
| 308.15 | 20.78 | 20.84 | 20.87 |
| 313.15 | 23.05 | 23.32 | 23.46 |
| 318.15 | 24.97 | 25.38 | 25.85 |
| 323.15 | 27.01 | 27.37 | 27.92 |
| a 3 wt% values from our previous publication [60] | |||
Table 2.
Phase-state assignment at 313.15 K for 20 wt% toluene + 1 wt% poly(TFEMA) + 79 wt% CO2.
| Pressure (MPa) | Classification |
|---|---|
| 15.86 | One-phase |
| 12.37 | Cloud point |
| 8.96 | Two-phase |
Table 3.
Charges and scCO2 properties used for polymer deposition at 313.15 K (40 ℃) for the mixture with 20 wt% toluene + 1 wt% poly(TFEMA) + 79 wt% scCO2.
Table 3.
Charges and scCO2 properties used for polymer deposition at 313.15 K (40 ℃) for the mixture with 20 wt% toluene + 1 wt% poly(TFEMA) + 79 wt% scCO2.
| Regime | P (MPa) | (kg ) | (g) | (g) | (mL) | (g) |
|---|---|---|---|---|---|---|
| One-phase | 15.86 | 793.8639 | 337.3009 | 85.3926 | 99.0289 | 4.2696 |
| Cloud point | 12.37 | 729.1488 | 309.8044 | 78.4314 | 90.9562 | 3.9216 |
| Two-phase | 8.96 | 477.8338 | 203.0244 | 51.3990 | 59.6064 | 2.5699 |
Disclaimer/Publisher’s Note: The statements, opinions and data contained in all publications are solely those of the individual author(s) and contributor(s) and not of MDPI and/or the editor(s). MDPI and/or the editor(s) disclaim responsibility for any injury to people or property resulting from any ideas, methods, instructions or products referred to in the content. |
© 2025 by the authors. Licensee MDPI, Basel, Switzerland. This article is an open access article distributed under the terms and conditions of the Creative Commons Attribution (CC BY) license (http://creativecommons.org/licenses/by/4.0/).
Copyright: This open access article is published under a Creative Commons CC BY 4.0 license, which permit the free download, distribution, and reuse, provided that the author and preprint are cited in any reuse.


