
Submitted:
30 June 2025
Posted:
01 July 2025
You are already at the latest version
Abstract
Achieving carbon neutrality requires not only reducing CO₂ emissions but also capturing atmospheric CO₂. Direct air capture (DAC) using amine-based adsorbents has emerged as a promising approach. In this study, we developed amine–epoxy/poly(vinyl alcohol) (AE/PVA) nanofibers via electrospinning and in situ thermal polymerization. PVA was incorporated to enhance spinnability, and B-staging of AE enabled fiber formation without inline heating. We systematically investigated the effects of electrospinning parameters, epoxy-to-amine ratios (E/A), and the degree of PVA saponification on CO₂ adsorption performance. Thinner fibers, obtained by adjusting spinning conditions, exhibited faster adsorption kinetics due to increased surface area. Varying the E/A revealed a trade-off between adsorption capacity and low-temperature desorption efficiency, with secondary amines offering a balanced performance. Additionally, highly saponified PVA improved thermal durability by minimizing side reactions with amines. These findings highlight the importance of optimizing fiber morphology, chemical composition, and polymer properties to enhance the performance and stability of AE/PVA nanofibers for DAC applications.
Keywords:
carbon capture
; nanofiber
; amine-epoxy
; electrospinning
; poly(vinyl alcohol)
1. Introduction
Carbon dioxide (CO2) is said to be the gas that has the greatest impact on global warming [1,2,3]. Since the Industrial Revolution [4], CO2 emissions have continued to increase due to the large-scale use of fossil fuels such as oil, coal, and natural gas. In particular, high-concentration CO2 is contained in large quantities in exhaust gas from thermal power plants and factories. Amine absorption has long been used as a method to capture CO2 from the exhaust gas of high CO2 concentration and reduce carbon emissions [5,6]. However, simply capturing CO2 from exhaust gas is not enough to achieve carbon neutrality by 2050 [7]. It is essential to capture CO2 that has been released into the atmosphere in the past and make it carbon negative. Therefore, direct air capture (DAC) [8] has attracted attention as a technology that can directly capture CO2 already emitted into the atmosphere.
DAC is a technology that adsorbs very dilute CO2 in the atmosphere (currently around 400 ppm) onto an adsorbent and then captures it by heating and reducing pressure. After capturing CO2, methods such as highly concentrating it and storing it underground using CCS (Carbon Capture and Storage) technology can be applied. Presently, the most promising approach for DAC is to apply liquid amines to porous materials such as mesoporous silica [9]. The high specific surface area of porous materials allows the chemical adsorption of amines to work more effectively [10]. In addition, applying liquid amines to porous materials allows them to be treated like solid materials. However, amines have problems such as being easily volatilized at high temperatures, being easily washed away by moisture, having low heat resistance, and being easily oxidized [11,12]. This is because liquid amines generally contain a large number of primary amines, which have low molecular weights and are easily degraded by oxidation reactions. In addition, primary amines are highly reactive and easily adsorb CO2, but they require high energy for desorption due to their high desorption temperature [13].
In our previous reports, the fabrication of amine–epoxy/poly(vinyl alcohol) (AE/PVA) fibers with an average diameter of approximately 400 nm was achieved via in situ thermal curing during the electrospinning process [14]. Alternatively, the AE/PVA nanofibers were successfully prepared without the need for inline heating by controlling the B-stage of the amine–epoxy reaction. The resulting fibers exhibited diameters ranging from 500 to 700 nm. Using a varnish solution with a low B-stage degree, it was difficult to maintain the fibrous morphology through electrospinning alone, and inline thermal curing was required [15].
In this report, we investigated the effect of fiber diameter, epoxy-to-amine ratio (E/A), and degree of PVA Saponification on CO₂ adsorption properties of AE/PVA nanofiber webs prepared through electrospinning to explore the optimum conditions for fabricating the absorbent for DAC. Firstly, we investigated how variations in electrospinning conditions and formulation of AE/PVA nanofibers influence their CO₂ adsorption performance. For neat PVA materials, it has been reported that fiber diameter can be controlled by adjusting the concentration of the aqueous PVA solution, applied voltage, and the distance between the nozzle and the collector [16,17]. Based on this, the authors employed the same spinning solution for the AE/PVA system and systematically varied the applied voltage and the syringe-to-collector distance to examine their effects on fiber diameter and CO₂ adsorption behavior.
Furthermore, the authors explored the effect of varying the E/A from 0.3 to 0.55, which had previously been fixed at 0.5 to balance thermal stability and adsorption/desorption kinetics. Prior studies have shown that the E/A influences a trade-off among adsorption capacity, adsorption rate, and low-temperature desorption, depending on the degree of amine substitution.
Lastly, the authors also examined the influence of the degree of saponification of PVA, which was introduced to improve spinnability. The terminal group composition of PVA varies depending on its degree of saponification, with lower saponification resulting in a higher proportion of acetate groups. It is known that under thermal conditions, such as in-situ thermal-curing in the spinning process or heat treatment of prepared webs, these acetate groups react with secondary amines to form amide bonds [18,19,20].
2. Materials and Methods
2.1. Materials
The chemical structures of the materials used to manufacture the nanofibers are shown in Figure 1 (a) – (g). As an epoxy, 1,7-octadiene diepoxide (ODE) (purity >97%, Tokyo Chemical Industry Co., Ltd., Tokyo, Japan), ethylene glycol diglycidyl ether (EDE) (purity >99%, EX-810, Nagase ChemteX Corporation, Osaka, Japan) and 1,3-Bis (N,N-diglycidyl aminomethyl) cyclohexane (T-C) (purity >98%, TETEAD-C, Mitsubishi Gas Chemical Co, INC., Tokyo, Japan), N,N,N’,N’-tetraglycidyl-m-xylenediamine (T-X) (purity >98%, TETRAD-X, Mitsubishi Gas Chemical Co, INC., Tokyo, Japan) were used. As an amine, triethylenetetramine (TETA) (purity >99%, Tokyo Chemical Industry Co., Ltd., Tokyo, Japan) and polyethyleneimine (PEI) (purity 98-100%, SP-006, Nippon Shokubai Co. Ltd., Tokyo, Japan) were used.
It is well-known that upon heating, a mixture of amine and epoxy undergoes a reaction where primary amines are converted to secondary amines, accompanied by crosslinking-induced solidification, thereby enhancing the thermal stability of the amines. Additionally, to impart spinnability to the spinning solution, the prepared amine-epoxy mixture was blended with an aqueous solution of poly(vinyl alcohol) (PVA) (PVA-117: purity > 93%, molecular weight 76,000, degree of saponification 99%; PVA-217: purity > 94%, molecular weight 83,000, degree of saponification 88%, Kuraray Co., Ltd., Tokyo, Japan) shown in Table 1. The molecular weight of PVA was calculated based on the degree of polymerization and the degree of saponification provided in the catalog. The degree of polymerization was expressed as m+n, where m represents the number of saponified units and n the number of residual acetate units. The degree of saponification was defined as:
Degree of saponification (%) = m / (m+n) × 100
Using these parameters, the molecular weight M of PVA was estimated by the following equation:
where Mvinyl alcohol = 44.05 g/mol and Mvinyl acetate = 86.09 g/mol are the molecular weights of the vinyl alcohol and vinyl acetate units.
M = m⋅Mvinyl alcohol + n⋅Mvinyl acetate
The amine value is an index indicating the amount of amine groups (–NH₂, –NHR, –NR₂) present in a substance, typically expressed in milligrams of KOH equivalent per gram of sample. Regarding the amines used in this study, the amine equivalent of TETA is 27.3 g/mol. According to the catalog value, the polyethyleneimine has a molecular weight of 600, an amine content of 20 mmol/g, and a molar ratio of 35:35:30 for the primary, secondary, and tertiary amines obtained by NMR analysis. The primary amine equivalents in polyethyleneimine were estimated to be 142.9 g/mol based on the amine content of 20 mmol/g and the composition of the primary amine of 35%. Meanwhile, the epoxy equivalent weight was calculated by dividing the molecular weight of the epoxy by the number of epoxy functional groups. Based on this value, the primary amine value is determined, and the amount of epoxy required to react with half (0.5 equivalent) of the primary amines is subsequently calculated. The epoxy equivalents of ODE, EDE, T-C, and T-X were 71.1 g/mol, 87.1 g/mol, 102.0 g/mol, and 99.0 g/mol, respectively.
2.2. Electrospinning Equipment and Conditions
Electrospinning was conducted using an electric field spinning apparatus (NEU, Kato Tech, Kyoto, Japan) equipped with a fixed cylindrical collector as shown in Figure 2. Initially, the prepared amine-epoxy/PVA solution was loaded into a 5 mL syringe fitted with a 22 G needle, and electrospinning was performed at an extrusion rate of 0.46- 1.36 mL/h, a nozzle-collector distance of 80-200 mm, and an applied voltage of 8-20 kV. A heat gun was employed to thermally enhance the in-situ polymerization of the amine-epoxy system during the spinning process, following the approach described in our previous study [14]. The air flow from the heat gun was directed at a 45-degree angle relative to the axis between the spinning solution ejection needle and the collector, at a speed of 3.48 m/min.
2.3. Analysis of the Prepared Web
2.3.1. Scanning Electron Microscopy (SEM)
The morphology of the prepared web was examined using a scanning electron microscope (SU-3800, HITACHI High-Tech Co., Tokyo, Japan) at magnifications of x1000, x3000, x5000, and x10000. The mean fiber diameter was quantified from the acquired images using image analysis software (ImageJ).
2.3.2. Infrared Absorption Analysis
The evolution of the chemical reaction was monitored through the analysis of functional group alteration using an FT-IR spectrometer (Nicolet iS5, FT-IR, Thermo Fisher Scientific Inc., Waltham, Massachusetts, USA).
2.3.3. BET Specific Surface Area
The BET specific surface area is the surface area of a fiber web per unit mass analyzed based on the amount of gas adsorption (the BET method). The measurement was conducted using a surface area and porosity analyzer (TriStar II Plus 3030, Micromeritics Inc., Norcross, Georgia, USA) with krypton as the analysis gas.
2.3.4. Adsorption/Desorption Test
The adsorption and desorption measurement system is schematically represented in Figure 3. The system comprises a 10% CO2/N2 gas cylinder, a N2 gas cylinder, a N2 gas humidifier, a gas mixing chamber, a mass flow controller, a gas analyzer for measuring CO2 concentration, a sample tube, and a water bath. The dry N2 gas supplied from the cylinder was partially humidified via bubbling and subsequently mixed with 10% CO2/N2 dry gas. The flow rate of each gas was precisely controlled by a mass flow controller and mixed within the gas chamber to achieve a final CO2 concentration of 400 ppm, a temperature of 20 °C, a relative humidity of 50%, and a total flow rate of 300 mL/min. Prior to adsorption/desorption testing, the fabricated fiber web was annealed in a vacuum oven (VOS-310C, EYELA, Tokyo, Japan) at 60 °C for 2 hours to remove water and CO2. A CO2/N2 mixture containing 400 ppm CO2, corresponding to the contemporary atmospheric CO2 concentration on Earth, was introduced into a sample tube containing 50 mg of the specimen. Initially, the sample tube was immersed in 80 °C water to facilitate CO2 desorption, followed by immersion in 20 °C water for 1000 minutes to enable CO2 adsorption. The CO2 concentrations in the inlet and outlet gases were continuously monitored using a CO2 analyzer (LI-850, MEIWAFOSIS, Tokyo, Japan). The adsorption amount was determined by integrating the differential CO2 concentrations between the inlet and outlet gases throughout the experimental duration. Desorption characteristics were analyzed in a similar manner by tracking the CO2 concentration variations after immersing the sample tube in 65 °C water. The desorption ratio was subsequently evaluated based on the quantity of desorbed CO2 at 50 °C, 65 °C, 80 °C over a period of 90 minutes for each.
The Avrami equation was employed to analyze the adsorption kinetics of the DAC sorbents because CO₂ adsorption involves complex mechanisms beyond a simple first-order reaction, including surface reactions and internal diffusion. The Avrami model [21] allows the adsorption progress to be expressed as a function of time, making it suitable for evaluating both the adsorption rate and the underlying mechanisms. Furthermore, it provides a high degree of fitting accuracy to experimental data, making it a reliable tool for assessing sorbent performance.
3. Results
3.1. Effect of Fiber Diameter in the CO2 Adsorption Test
Samples with varying fiber diameters were prepared by adjusting the applied voltage and the distance between the collector and syringe, using a spinning solution described below. For the prepared nano-fiber webs, a CO2 adsorption test was performed.
The spinning solution comprised EDE:T-X=8:2 for AE and AE:PVA-117 at 7 wt% aqueous solution with a 1:10 ratio, resulting in an AE weight ratio in the resultant AE/PVA fiber of 58 wt%. The AE/PVA nanofibers were produced by mixing the spinning solution at room temperature and electrospinning with a heat gun set to 120 °C under inline heating conditions. As shown in Table 2, when the distance was increased and the voltage was high, the resulting fibers were thinner, likely due to the enhanced stretching effect. Conversely, when the distance was short and the voltage was high, the drawing force was strong, and the time to reach the collector was short, resulting in thicker fibers due to insufficient stretching.
Figure 4 (a) shows the relationship between time and adsorption amount with respect to fiber diameter, while Figure 4 (b) presents the relationship between mean fiber diameter and the half-time of adsorption, which is the time it takes to reach half of the saturated adsorption amount, analyzed based on the Avrami model. Thinner fibers exhibited higher adsorption rates. This is attributed to the larger surface area of thin fibers, which allows for greater surface adsorption and reduced effect of internal diffusion of CO2 over time. In contrast, thicker fibers are likely to have prolonged adsorption times due to the dominance of internal CO2 diffusion, which is time-consuming. These findings indicate that producing AE/PVA nanofibers with a thin and homogeneous fiber diameter is crucial for enhancing adsorption rates.
It is generally considered that there is a correlation between fiber diameter and specific surface area. Figure 5 (a) shows the theoretical and experimental specific surface area values as a function of fiber diameter for electro-spun fibers. The theoretical curve (blue) was calculated assuming a material density of 1.1 g/cm³. Experimental data points (red) were obtained for fibers of various diameters prepared by varying electrospinning parameters such as applied voltage, syringe tip-to-collector distance, syringe gauge, and solution feed rate, while maintaining the same polymer composition. These results deviate notably from the theoretical values. For instance, in the case of AE/PVA nanofibers with a diameter of 400 nm and a density of 1.1 g/cm³, the theoretical BET specific surface area is 9.1 m²/g. In contrast, the measured values in this study ranged from 1 to 5.4 m²/g. This discrepancy is likely due to the fiber diameter distribution and adhesion between fibers, which reduces the accessible surface area.
Figure 5 (b) shows the relationship between the adsorption half-time and the mean fiber diameter. A mild correlation was found between the CO2 adsorption rate and fiber diameter. As discussed above, this indicates that the thinner the fiber, the more the amine exposed on the surface contributes directly to CO2 adsorption. On the other hand, it is thought that the AE/PVA nanofiber with a thick fiber diameter took longer to adsorb CO2 because CO2 adsorption by internal diffusion, not just the surface, is dominant. While the adsorption rate increases with thinner fiber diameters, other factors, such as the porosity (density) of the fiber web, may also play a significant role. Higher porosity is believed to facilitate CO2 permeance with lower pressure loss and improve CO2 adsorption efficiency due to reduced tortuosity.
3.2. Effect of Epoxy-To-Amine Ratio in the CO2 Adsorption/Desorption Test
In the previous sections, to maintain low temperature desorption for superior heat resistance, the ratio of epoxy to amine was fixed with E/A = 0.5 after forming the secondary amines through the chemical reaction of all primary amines with epoxy. In this section, the influence of E/A on spinnability, adsorption/desorption characteristics, and durability was verified by controlling the E/A from 0.3 to 0.55. The spinning conditions were all the same: applied voltage was 10 kV/8 cm, and the temperature of inline heating was 110 °C, for all samples shown in Table 3.
| E/A | 0.3 | 0.4 | 0.5 | 0.55 |
| EDE (g) | 0.8 | 0.8 | 0.8 | 0.8 |
| T-X (g) | 0.2 | 0.2 | 0.2 | 0.2 |
| SP-006 (g) | 2.67 | 2.00 | 1.60 | 1.45 |
| PVA 7 wt% Aq. Solution (g) | 33.0 | 27.0 | 23.4 | 22.1 |
| EDE : T-X | 8:2 | 8:2 | 8:2 | 8:2 |
| AE : PVA Aq. Solution | 1:9 | 1:9 | 1:9 | 1:9 |
| AE/(AE+PVA) (wt%) | 61 | 61 | 61 | 61 |
Properties of the obtained fibers are summarized in Table 4. It can be seen that the higher the E/A, the higher the Tg. This is thought to be due to the three-dimensional cross-linking of the amine and epoxy, which strengthens the molecular framework and suppresses molecular motion. In addition, the higher the E/A, i.e., the lower the amount of amine, which is the CO2 adsorption site, the saturation adsorption amount in the CO2 adsorption test decreased because the epoxy group reacts with the amine.
Figure 6 shows the results of CO2 adsorption and desorption tests. At E/A = 0.3, despite the thick fiber diameter of 865 nm, the adsorption rate is very fast due to the high adsorption performance of primary amines. Similarly, E/A = 0.4 has a thick fiber diameter of 661 nm, but the adsorption rate is fast. However, at E/A = 0.3 to 0.4, where a large amount of primary amine remains, the amount of desorption at 50 °C (from 990 min to 1100 min) is low due to the high absorbability of the primary amine, reducing the low-temperature desorption property and showing that adsorption and desorption performance are trade-offs. On the other hand, for the E/A = 0.5 sample, which contains only secondary amines, the desorption characteristic at 50 °C was high, with an analysed saturated desorption ratio of 52%. In addition, for the sample with a high E/A of 0.55, some tertiary amines existing in the sample are not involved in adsorption from secondary amines, so the amount of adsorption is reduced. Since the remaining adsorption ratio after desorption at 50 °C was equivalent to E/A = 0.5, it was considered that the tertiary amines do not have any positive influence in terms of desorption characteristics.
For the retention ratio of adsorbed amount after the heat treatment for 200 hours at 85 °C, higher E/A had a higher retention ratio. Reduction of the retention ratio is thought to be due to the decrease of the adsorption site by the reduction of primary amines, which are vulnerable to oxidation. Oxidation resistance can be improved by the formation of secondary amines through chemical reaction with epoxy.
Furthermore, the low-temperature desorption at 50 °C exhibited a high desorption ratio of approximately 50% with E/A ranging from 0.5 to 0.55, clearly indicating that secondary amines demonstrate superior low-temperature desorption compared to primary amines. Additionally, at 65 °C, the desorption properties were nearly equivalent within the E/A range of 0.4 to 0.55, thereby confirming the advantage of secondary amination at low temperatures of 50 °C. These findings suggest that secondary amination of amines not only enhances oxidation resistance but also contributes significantly to low-temperature desorption properties. To achieve optimal adsorption and desorption performance, it is important to note that the glass transition temperature (Tg) of the sorbent needs to be close to the operating temperature during DAC. Generally, when the sorbent temperature exceeds Tg, molecular mobility increases, facilitating CO₂ desorption. Therefore, a lower Tg is desirable for CO₂ adsorption; however, if Tg is too low, the handling of the solid sorbent becomes difficult. Consequently, E/A = 0.5 is considered to offer the best balance between adsorption and desorption performance, with a Tg closest to the adsorption temperature and high oxidative stability. In conclusion, the control of E/A to convert all primary amines to secondary amines was verified to be essential.
3.3. Effect of the Degree of Saponification of PVA
Since amine and epoxy alone do not possess sufficient spinnability, poly(vinyl alcohol) (PVA) was selected as a spinnability-enhancing material. PVA exhibits varying properties depending on its molecular weight and degree of saponification. The degree of saponification represents the proportion of saponification during PVA synthesis, with higher values indicating a greater conversion of acetic acid groups to hydroxyl groups. It is well-established that a higher degree of saponification in PVA correlates with increased crystallinity and higher solution viscosity. Accordingly, the materials listed in Table 5 were electro-spun with an applied voltage of 10 kV and 8 cm between the syringe and the collector, under in-line heating conditions at a temperature of 120 °C. Using the obtained webs, the effect of the degree of saponification of PVA on the adsorption characteristics and heat resistance durability of AE/PVA nanofibers was investigated.
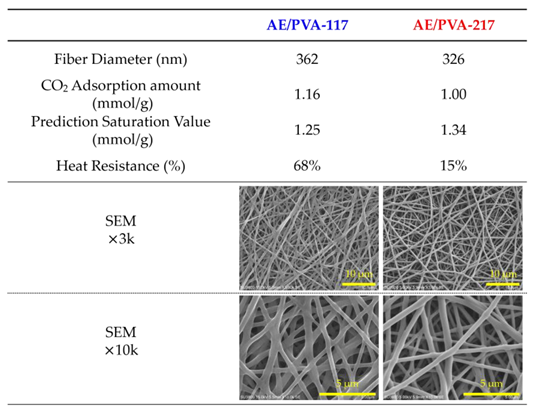
Table 6 shows nanofibers with PVA saponification degrees of 99 (PVA-117) and 88 (PVA-217), as well as the results of their adsorption tests when AE/PVA nanofibers were prepared. Even using PVA with different degrees of saponification, AE/PVA nanofibers with almost the same diameter of 350 nm could be prepared. As for adsorption performance, the adsorption amount after 990 min is 1.16 mmol/g for PVA-117 and 1.00 mmol/g for PVA-217, and the adsorption performance can be said to be almost the same. Regarding the thermal durability, as shown in Figure 7, however, the adsorption test for the webs before and after being stored at 85 °C for 200 hours revealed that the adsorption characteristics differed greatly depending on the degree of saponification of PVA. Compared to AE/PVA-117, AE/PVA-217 shows a significant decrease in the amount of saturation adsorption after the heat treatment. As shown in Figure 8, FT-IR measurements of the fiber web before and after heat resistance test exhibited that AE/PVA-217 showed a large decrease in the peak of the acetyl group at 1750 cm-1, and a large increase in the peak of the amide group around 1600 cm-1. It was speculated that the acetyl group of PVA reacted with the secondary amine and was amidated as shown in Figure 9. As a result, it is considered that the secondary amine, which is the adsorption site, decreased, and the amount adsorbed decreased. Based on these results, it was decided to use PVA-117, which has a low acetic acid group or a high degree of saponification, as a spinning material. The selected PVA-117, which does not react with primary or secondary amines, does not inhibit CO2 adsorption, and is water-soluble and inexpensive, is ideal for AE/PVA nanofibers as a material to impart spinnability.
4. Discussion
This study revealed that CO₂ adsorption behavior in AE/PVA nanofibers is governed by multiple interrelated factors—namely, fiber diameter, the epoxy-to-amine ratio (E/A), and the degree of PVA saponification. These findings elucidate the design principles for optimizing sorbent performance in direct air capture (DAC) applications.
The influence of fiber diameter was particularly evident in the CO₂ adsorption rate. Finer nanofibers exhibited accelerated adsorption due to their higher specific surface area and enhanced exposure of amine functionalities. The correlation between fiber diameter and adsorption kinetics, including adsorption half-time, underscores the advantage of producing homogeneously thin fibers. However, the measured BET surface areas were significantly lower than theoretical predictions, suggesting that morphological factors such as fiber adhesion and diameter distribution limit accessible surface area, an issue warranting further process refinement.
The modulation of the E/A demonstrated a classic trade-off in amine-based sorbents. Lower E/A, which retains more primary amines, yielded fast adsorption but poor low-temperature desorption characteristics, while higher E/A (up to 0.5) facilitated secondary amine formation, achieving better desorption behavior and oxidative stability. E/A = 0.5 was identified as the optimal condition, balancing kinetic performance, desorption efficiency, and material stability.
Additionally, the degree of PVA saponification played a critical role in long-term thermal durability. The presence of residual acetate groups in lower-saponified PVA led to amide bond formation with secondary amines during heat treatment, as evidenced by FT-IR analysis. This undesirable side reaction decreased the available amine sites for CO₂ capture. Consequently, highly saponified PVA-117 was deemed the superior spinnability enhancer due to its chemical inertness and compatibility.
Collectively, the interplay between formulation and processing conditions has a decisive impact on sorbent performance. Tailoring these parameters allows for strategic enhancement of DAC efficiency, underscoring the material’s potential for scalable deployment.
5. Conclusions
This study systematically investigated the influence of fiber diameter, epoxy-to-amine ratio (E/A), and the degree of PVA saponification on the CO₂ adsorption behavior of electro-spun AE/PVA nanofibers. The results confirmed that: 1) Thinner fibers significantly accelerated adsorption by increasing accessible surface area, 2) An E/A of 0.5 optimized the balance between adsorption capacity, desorption efficiency, and thermal durability, and 3) Highly saponified PVA prevented detrimental side reactions with amines, improving long-term stability. These insights provide a foundation for the rational design of high-performance sorbents in DAC applications, emphasizing the importance of simultaneous control over fiber morphology, chemical composition, and thermal compatibility
Author Contributions
Conceptualization, Chisato Okada; methodology, Chisato Okada, Midori Takasaki; validation, Chisato Okada and Zongzi Hou; formal analysis, Chisato Okada; investigation, Chisato Okada; resources, Chisato Okada; data curation, Chisato Okada; writing—original draft preparation, Chisato Okada; writing—review and editing, Hiroaki Imoto, Kensuke Naka, Takeshi Kikutani and Midori Takasaki; supervision, Hiroaki Imoto, Kensuke Naka, Takeshi Kikutani and Midori Takasaki.
Acknowledgments
We wish to thank Nitto Denko Corporation for their significant support. I'm so thankful to have a supportive colleague. Finally, we are grateful to the referees for their useful comments.
Conflicts of Interest
“The authors declare no conflicts of interest.”.
References
- Stocker, T. F.; Qin, D.; Plattner, G.-K.; Tignor, M.; Allen, S. K.; Boschung, J.; Nauels, A.; Xia, Y.; Bex, V.; Midgley, P. M. (Eds.). Climate Change 2013: The Physical Science Basis. Contribution of Working Group I to the Fifth Assessment Report of the Intergovernmental Panel on Climate Change; Cambridge University Press: Cambridge, United Kingdom and New York, NY, USA, 2013; 1535 pp.
- Lenssen, N. J. L.; Schmidt, G. A.; Hansen, J. E.; Menne, M. J.; Persin, A.; Ruedy, R.; Zyss, D. Improvements in the GISTEMP Uncertainty Model. J. Geophys. Res. Atmos. 2019, 124, 6307–6326. [Google Scholar] [CrossRef]
- Ye, J.; Dimitratos, N.; Rossi, L. M.; Thonemann, N.; Beale, A. M.; Wojcieszak, R. Hydrogenation of CO₂ for Sustainable Fuel and Chemical Production. Science 2024, 384, 34–41. [Google Scholar] [CrossRef] [PubMed]
- Etheridge, D. M.; Steele, L. P.; Langenfelds, R. L.; Francey, R. J.; Barnola, J. M.; Morgan, V. I. Historical CO₂ Records from the Law Dome DE08, DE08-2, and DSS Ice Cores. J. Geophys. Res. Atmos. 1996, 101, 4115–4128. [Google Scholar] [CrossRef]
- Shi, X.; Xiao, H.; Lackner, K. S.; Chen, B. Tying Amines Down for Stable CO₂ Capture. Science 2020, 368, 928–932. [Google Scholar] [CrossRef]
- Yamada, H. Amine-Based Capture of CO₂ for Utilization and Storage. Polym. J. 2020, 52, 1007–1015. [Google Scholar] [CrossRef]
- Stechemesser, A.; Koch, N.; Mark, E.; Dilger, E.; Klösel, P.; Menicacci, L.; Nachtigall, D.; Pretis, F.; Ritter, N.; Schwarz, M.; Vossen, H.; Wenzel, A. Climate Policies That Achieved Major Emission Reductions: Global Evidence from Two Decades. Science 2024, 384, 112–118. [Google Scholar] [CrossRef] [PubMed]
- Chen, Y.; Wu, R.; Hsu, P.-C. Perspective on Distributed Direct Air Capture: What, Why, and How? npj Mater. Sustain. 2025, 4, 56. [Google Scholar] [CrossRef]
- Jung, H.; Jo, D. H.; Lee, C. H.; Chung, W.; Shin, D.; Kim, S. H. Vapor-Phase-Infiltrated AlOx/PIM-1 “Hybrid Scaffolds” as Solution Processable Amine Supports for CO₂ Adsorption. Energy Fuels. 2014, 28, 3994–4001. [Google Scholar] [CrossRef]
- Yu, H.; Wang, W.; Liu, M.; Zhao, T.; Lin, R.; Hou, M.; Kou, Y.; Chen, L.; Elzatahry, A. A.; Zhang, F.; Zhao, D.; Li, X. Versatile Synthesis of Dendritic Mesoporous Rare Earth–Based Nanoparticles. Sci. Adv. 2022, 8, 2356. [Google Scholar] [CrossRef] [PubMed]
- Zoannou, K.-S.; Sapsford, D. J.; Griffiths, A. J. Thermal Degradation of Monoethanolamine and Its Effect on CO₂ Capture Capacity. Int. J. Greenhouse Gas Control 2013, 17, 423–430. [Google Scholar] [CrossRef]
- Lepaumier, H.; Picq, D.; Carrette, P.-L. New Amines for CO₂ Capture. I. Mechanisms of Amine Degradation in the Presence of CO₂. Ind. Eng. Chem. Res. 2009, 48, 9061–9067. [Google Scholar] [CrossRef]
- Zhao, M.; Huang, L.; Gao, Y.; Wang, Z.; Liang, S.; Zhu, X.; Wang, Q.; He, H.; O’Hare, D. Design of Ultra-Stable Solid Amine Adsorbents and Mechanisms of Hydroxyl Group-Dependent Deactivation for Reversible CO₂ Capture from Flue Gas. Nano-Micro Lett. 2025, 17, 170. [Google Scholar] [CrossRef] [PubMed]
- Okada, C.; Hou, Z.; Imoto, H.; Naka, K.; Kikutani, T.; Takasaki, M. In Situ Polymerization Electrospinning of Amine–Epoxy/Poly(vinyl alcohol) Nanofiber Webs for Direct CO₂ Capture from the Air. ACS Omega 2024, 9, 50466–50475. [Google Scholar] [CrossRef] [PubMed]
- Okada, C.; Hou, Z.; Imoto, H.; Naka, K.; Kikutani, T.; Takasaki, M. Utilizing B-stage Amine-Epoxy in Electrospinning of Amine-Epoxy/Poly(vinyl alcohol) Nanofiber Webs for Direct CO2 Capture from the Air. J. Fiber Sci. Technol. Accepted for publication.
- Elkasaby, M.; Hegab, H. A.; Mohany, A.; Rizvi, G. M. Modeling and Optimization of Electrospinning of Polyvinyl Alcohol (PVA). Adv. Theory Simul. 2017, 1, 1800069. [Google Scholar] [CrossRef]
- Ji, D.; Lin, Y.; Guo, X.; Ramasubramanian, B.; Wang, R.; Radacsi, N.; Jose, R.; Qin, X.; Ramakrishna, S. Electrospinning of Nanofibres. Nat. Rev. Mater. 2024, 9, 1–20. [Google Scholar] [CrossRef]
- Ding, B.; Kim, H.-Y.; Lee, S.-C.; Lee, D.-R.; Choi, K.-J. Preparation and Characterization of Nanoscaled Poly(vinyl alcohol) Fibers via Electrospinning. Fibers Polym. 2002, 3, 73–79. [Google Scholar] [CrossRef]
- Lanigan, R. M.; Starkov, P.; Sheppard, T. D. Direct Synthesis of Amides from Carboxylic Acids and Amines Using B(OCH₂CF₃)₃. J. Org. Chem. 2013, 78, 4512–4523. [Google Scholar] [CrossRef] [PubMed]
- Oldenhuis, N. J.; Whittaker, A. M.; Dong, V. M. Greener Methods for Amide Bond Synthesis. In Green Chemistry in Drug Discovery; Methods in Pharmacology and Toxicology; Springer 2021, 35–96. [CrossRef]
- Darunte, L. A.; Sen, T.; Bhawanani, C.; Walton, K. S.; Sholl, D. S.; Realff, M. J.; Jones, C. W. Moving Beyond Adsorption Capacity in Design of Adsorbents for CO₂ Capture from Ultra-dilute Feeds: Kinetics of CO₂ Adsorption in Materials with Stepped Isotherms. Ind. Eng. Chem. Res. 2019, 58, 22438–22447. [Google Scholar] [CrossRef]
Figure 1.
Chemical structural formula of (a) 1,7-octadiene diepoxide (ODE), (b) ethylene glycol diglycidyl ether (EDE), (c) 1,3-bis (N,N-diglycidyl aminomethyl) cyclohexane (T-C), (d) N,N,N’,N‘,-tetraglycidyl-m-xylenediamine (T-X), (e) triethylenetetramine (TETA), (f) polyethyleneimine (PEI), and (g) poly(vinyl alcohol) (PVA).
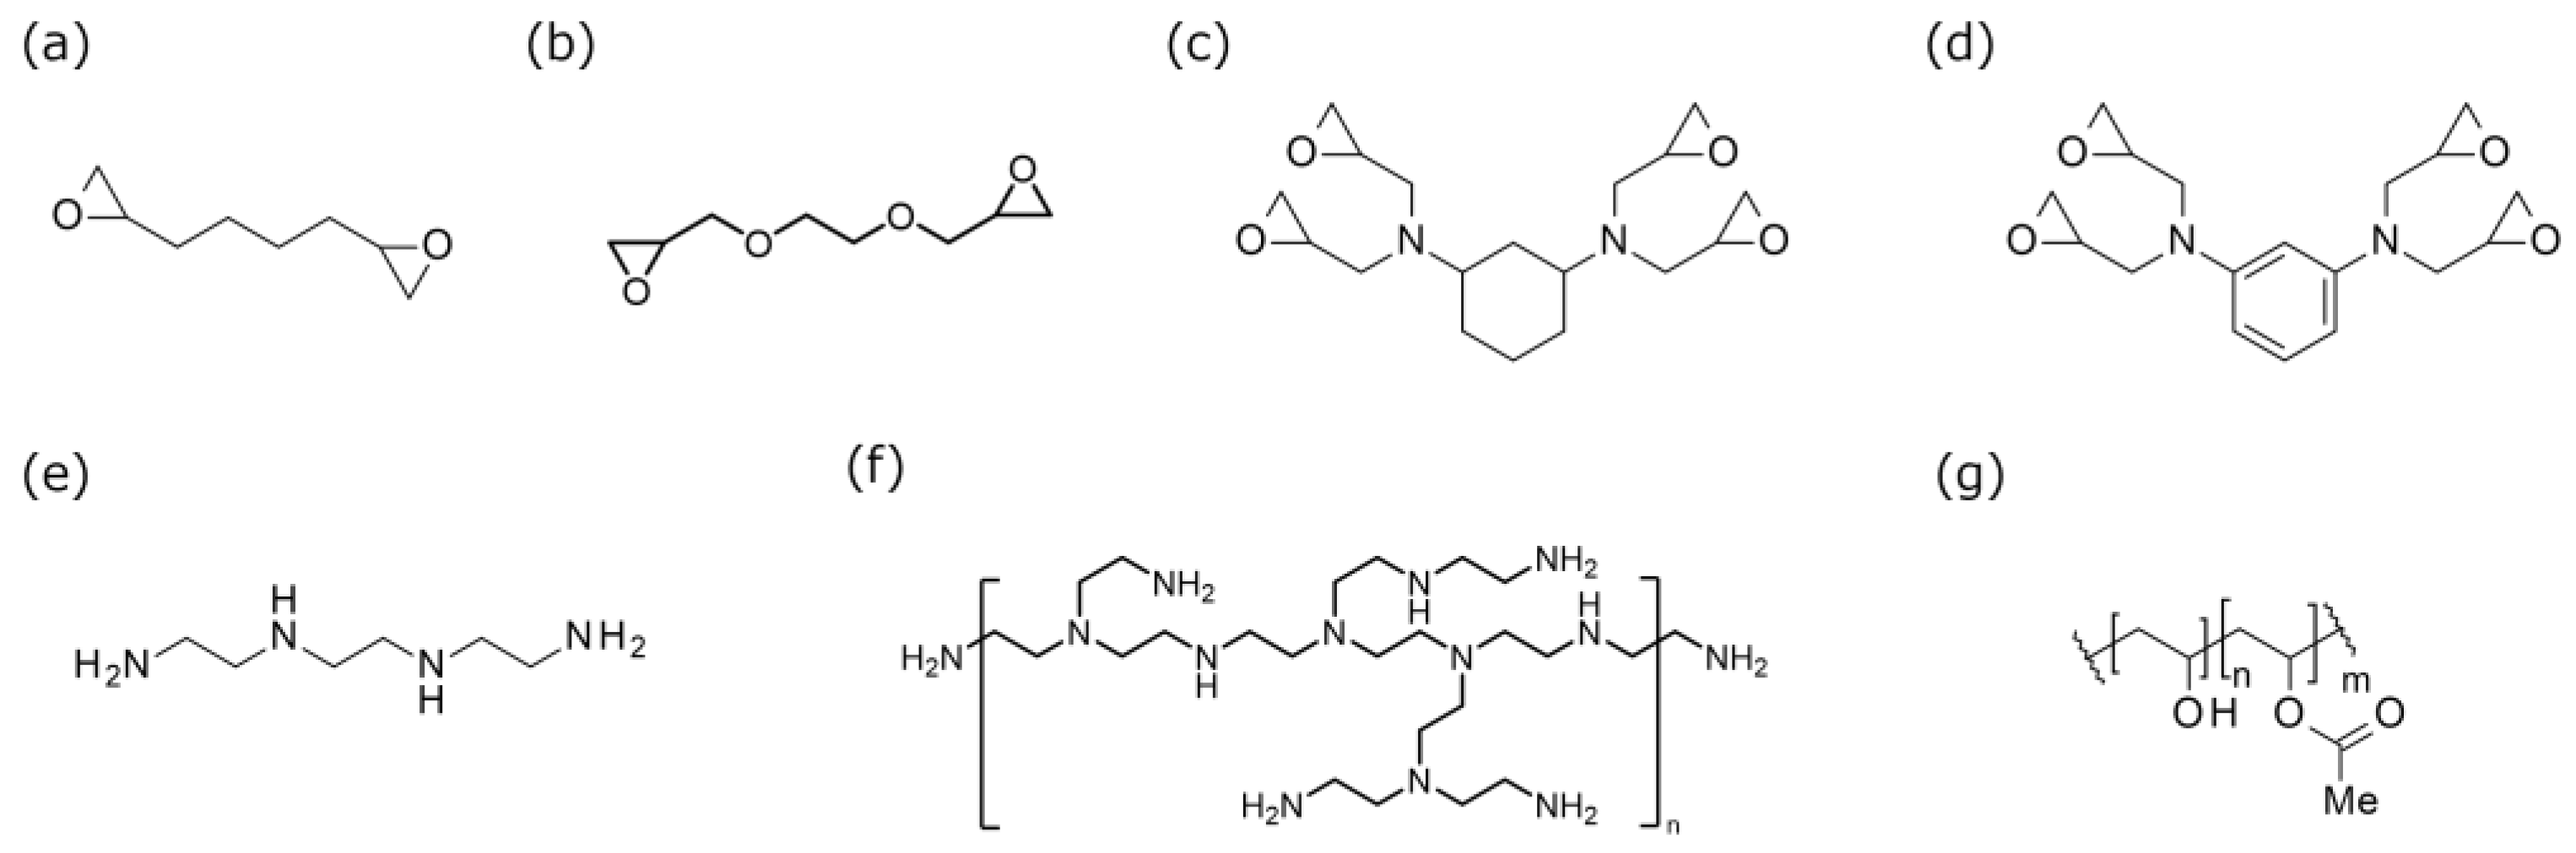
Figure 2.
Schematic illustration of the electrospinning apparatus. A heat gun is positioned between the syringe and the collector, angled at 45°, to direct heat toward the fiber formation zone. Fibers are collected on a cylindrical collector.
Figure 2.
Schematic illustration of the electrospinning apparatus. A heat gun is positioned between the syringe and the collector, angled at 45°, to direct heat toward the fiber formation zone. Fibers are collected on a cylindrical collector.
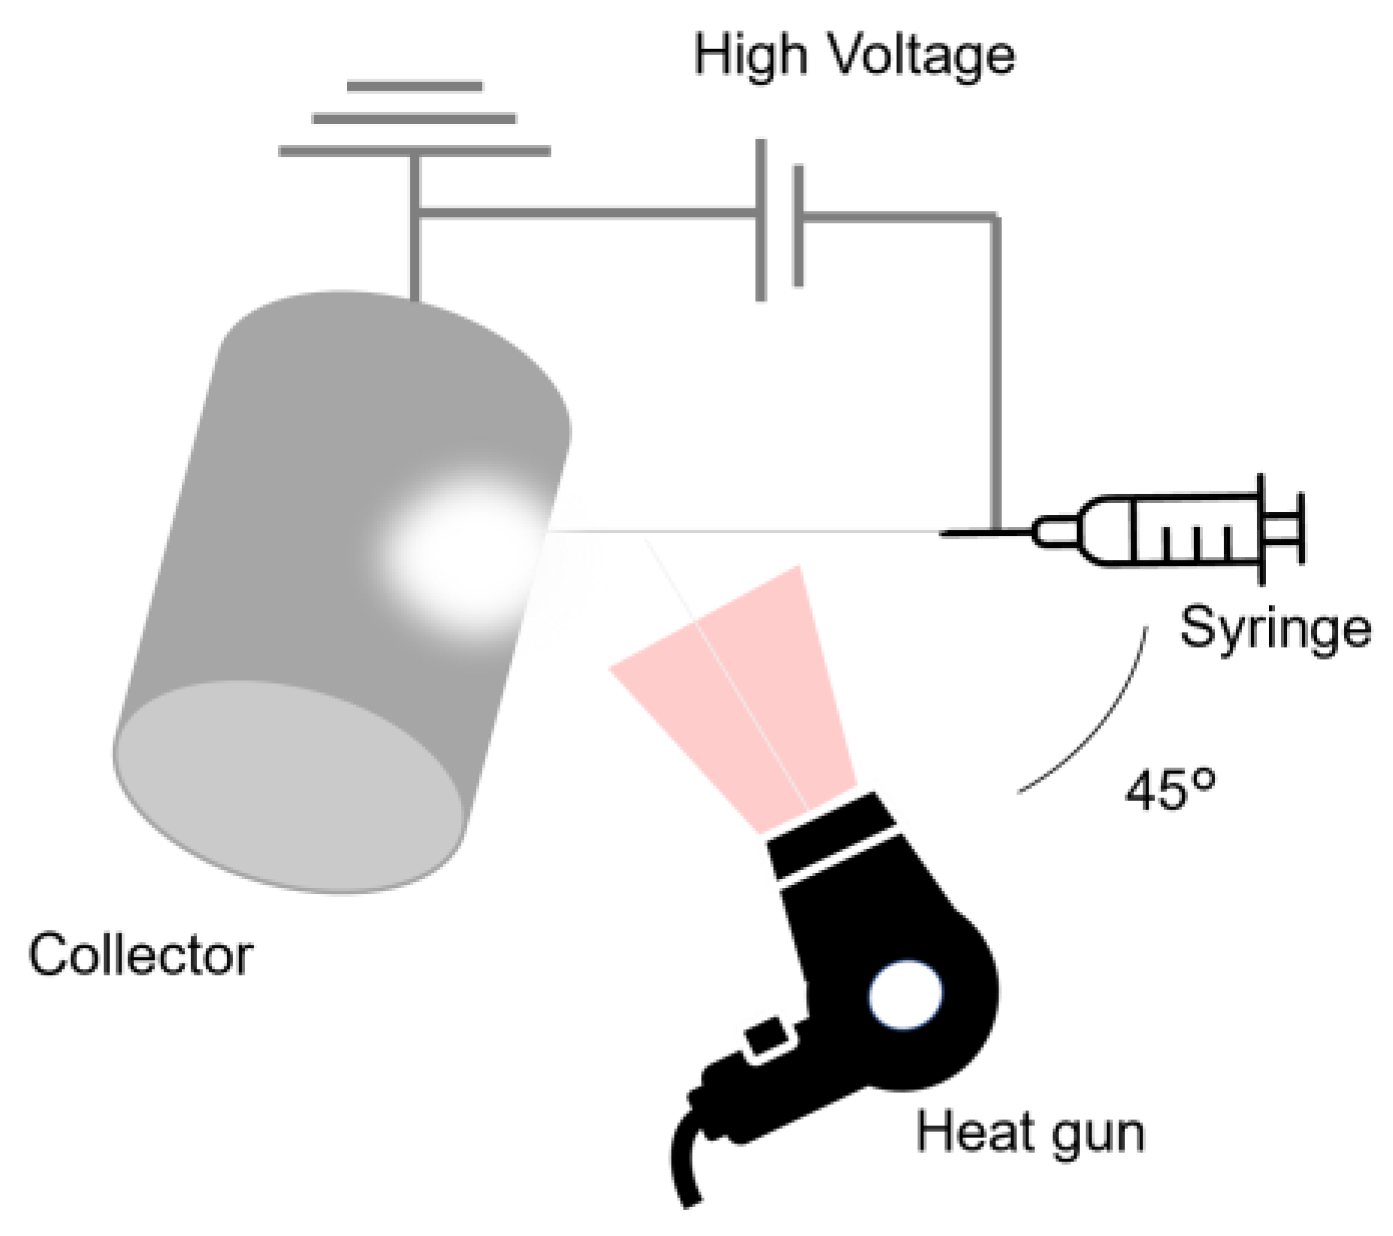
Figure 3.
Schematic diagram of the CO₂ adsorption test apparatus. Gas cylinders containing 10% CO₂/N₂ and pure N₂ are connected to mass flow controllers (MFCs). The gases are bubbled and mixed in a mixing chamber to produce a humidified gas stream at 20 °C and 50% relative humidity (RH), with a CO₂ concentration of 400 ppm. This gas is delivered to a sample placed in a water bath maintained at 20 °C, 50 °C, 65 °C, or 80 °C. CO2 concentrations are monitored before and after the sample using CO₂ analyzers.
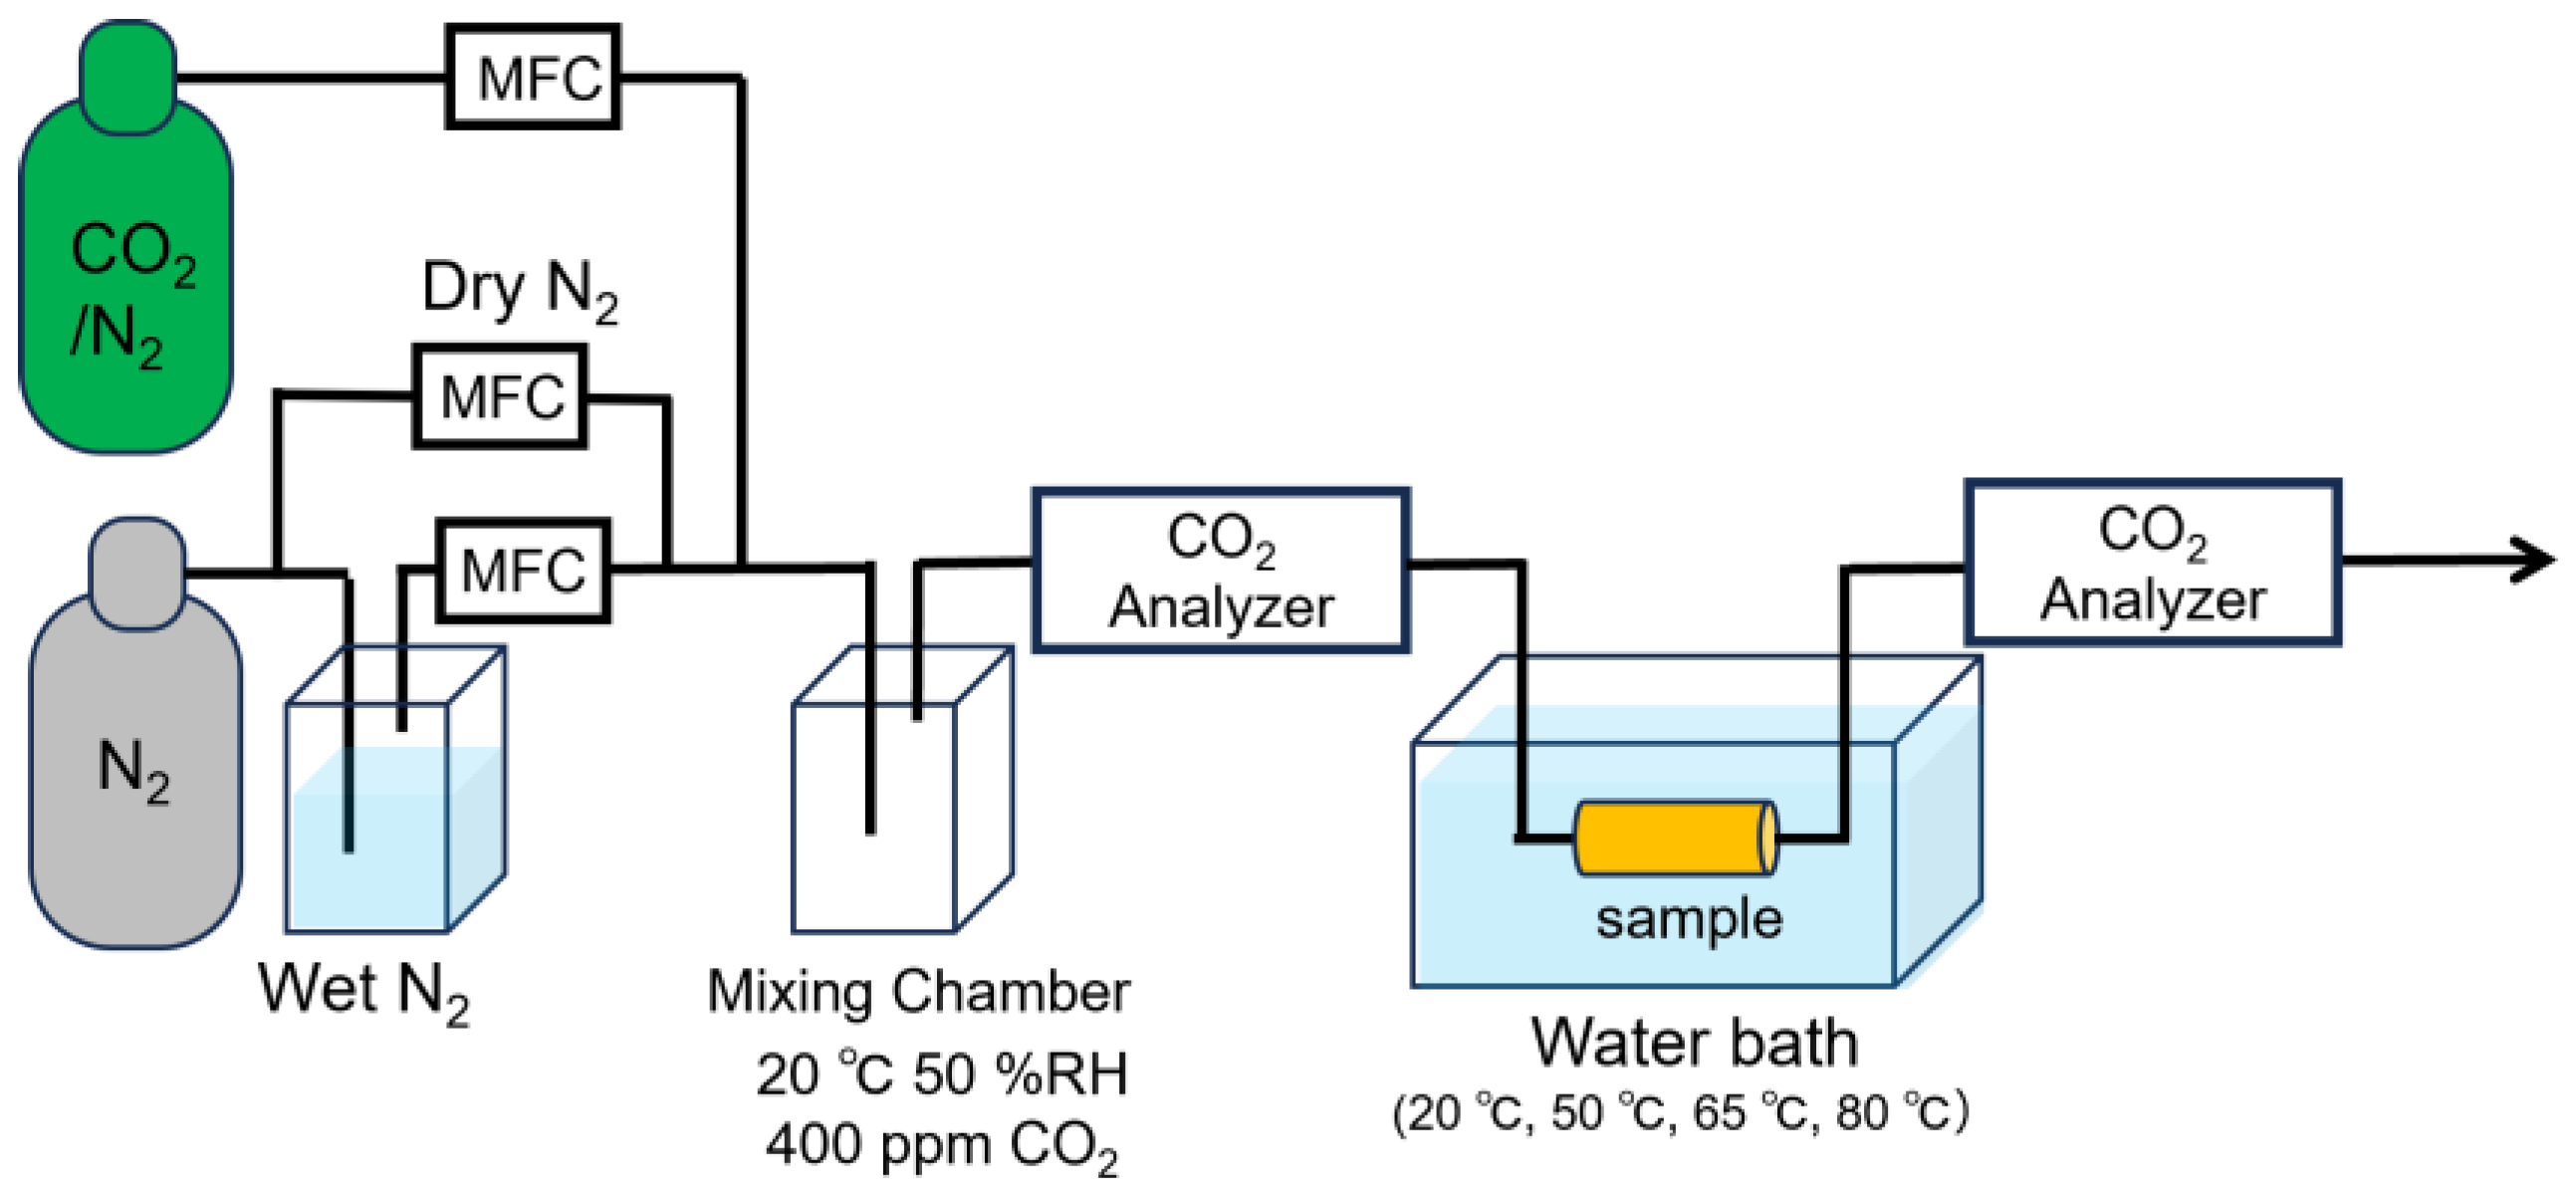
Figure 4.
(a) Time-dependent CO₂ adsorption profiles of three web samples with distinct fiber diameters. Measurements were conducted for samples with mean fiber diameters of 383 nm, 420 nm, and 454 nm. (b) Correlation between fiber diameter and CO₂ adsorption half-time.
Figure 4.
(a) Time-dependent CO₂ adsorption profiles of three web samples with distinct fiber diameters. Measurements were conducted for samples with mean fiber diameters of 383 nm, 420 nm, and 454 nm. (b) Correlation between fiber diameter and CO₂ adsorption half-time.
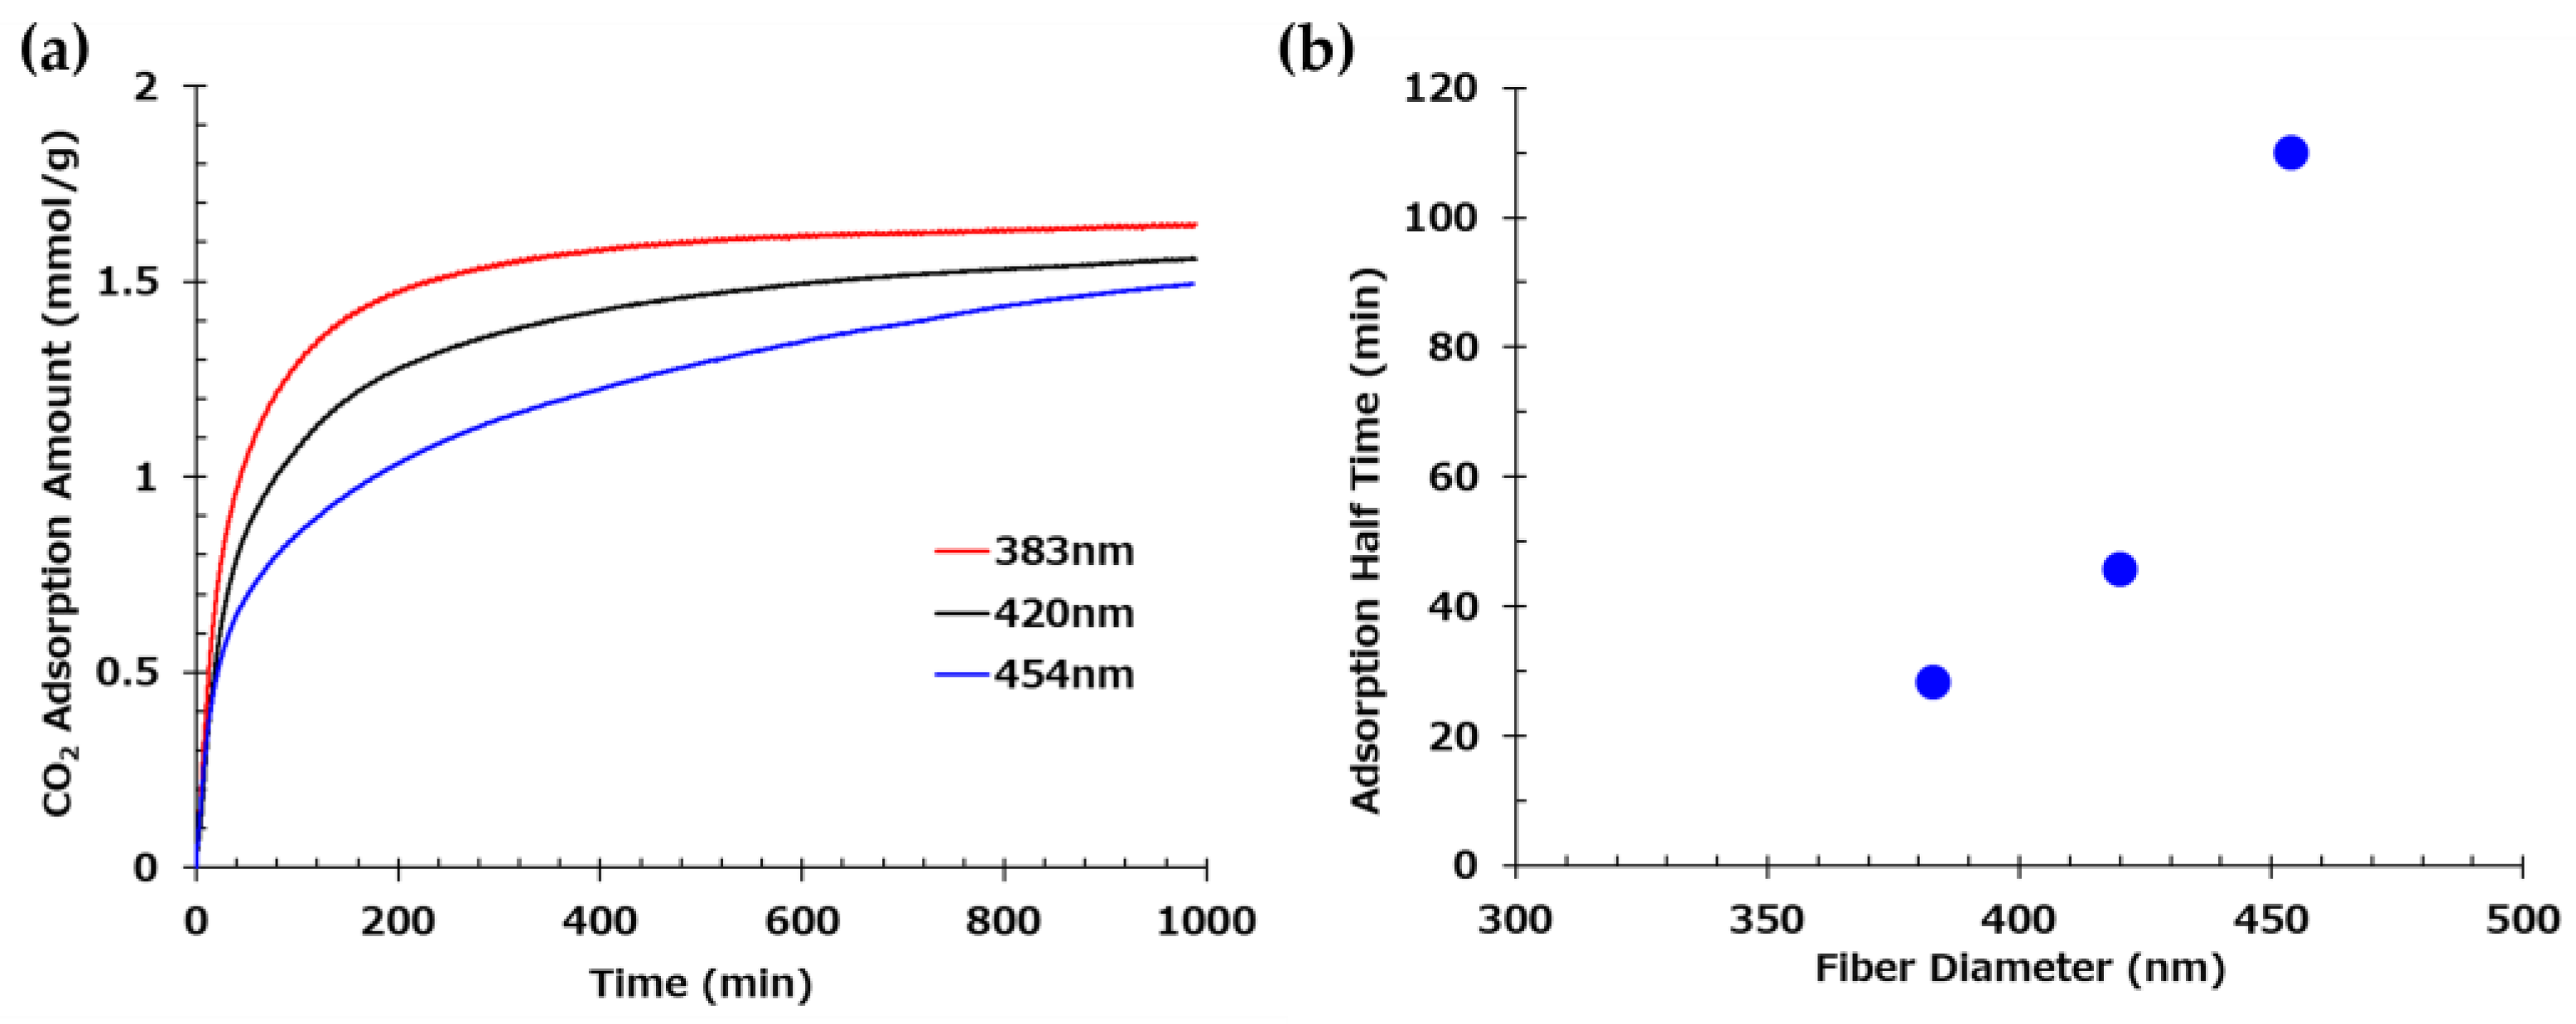
Figure 5.
(a) Theoretical and experimental values of specific surface area as a function of fiber diameter. The blue curve represents the theoretical values calculated assuming a material density of 1.1 g/cm³. Red points indicate experimentally measured values. (b) Correlation between mean fiber diameter and CO₂ adsorption half-time.
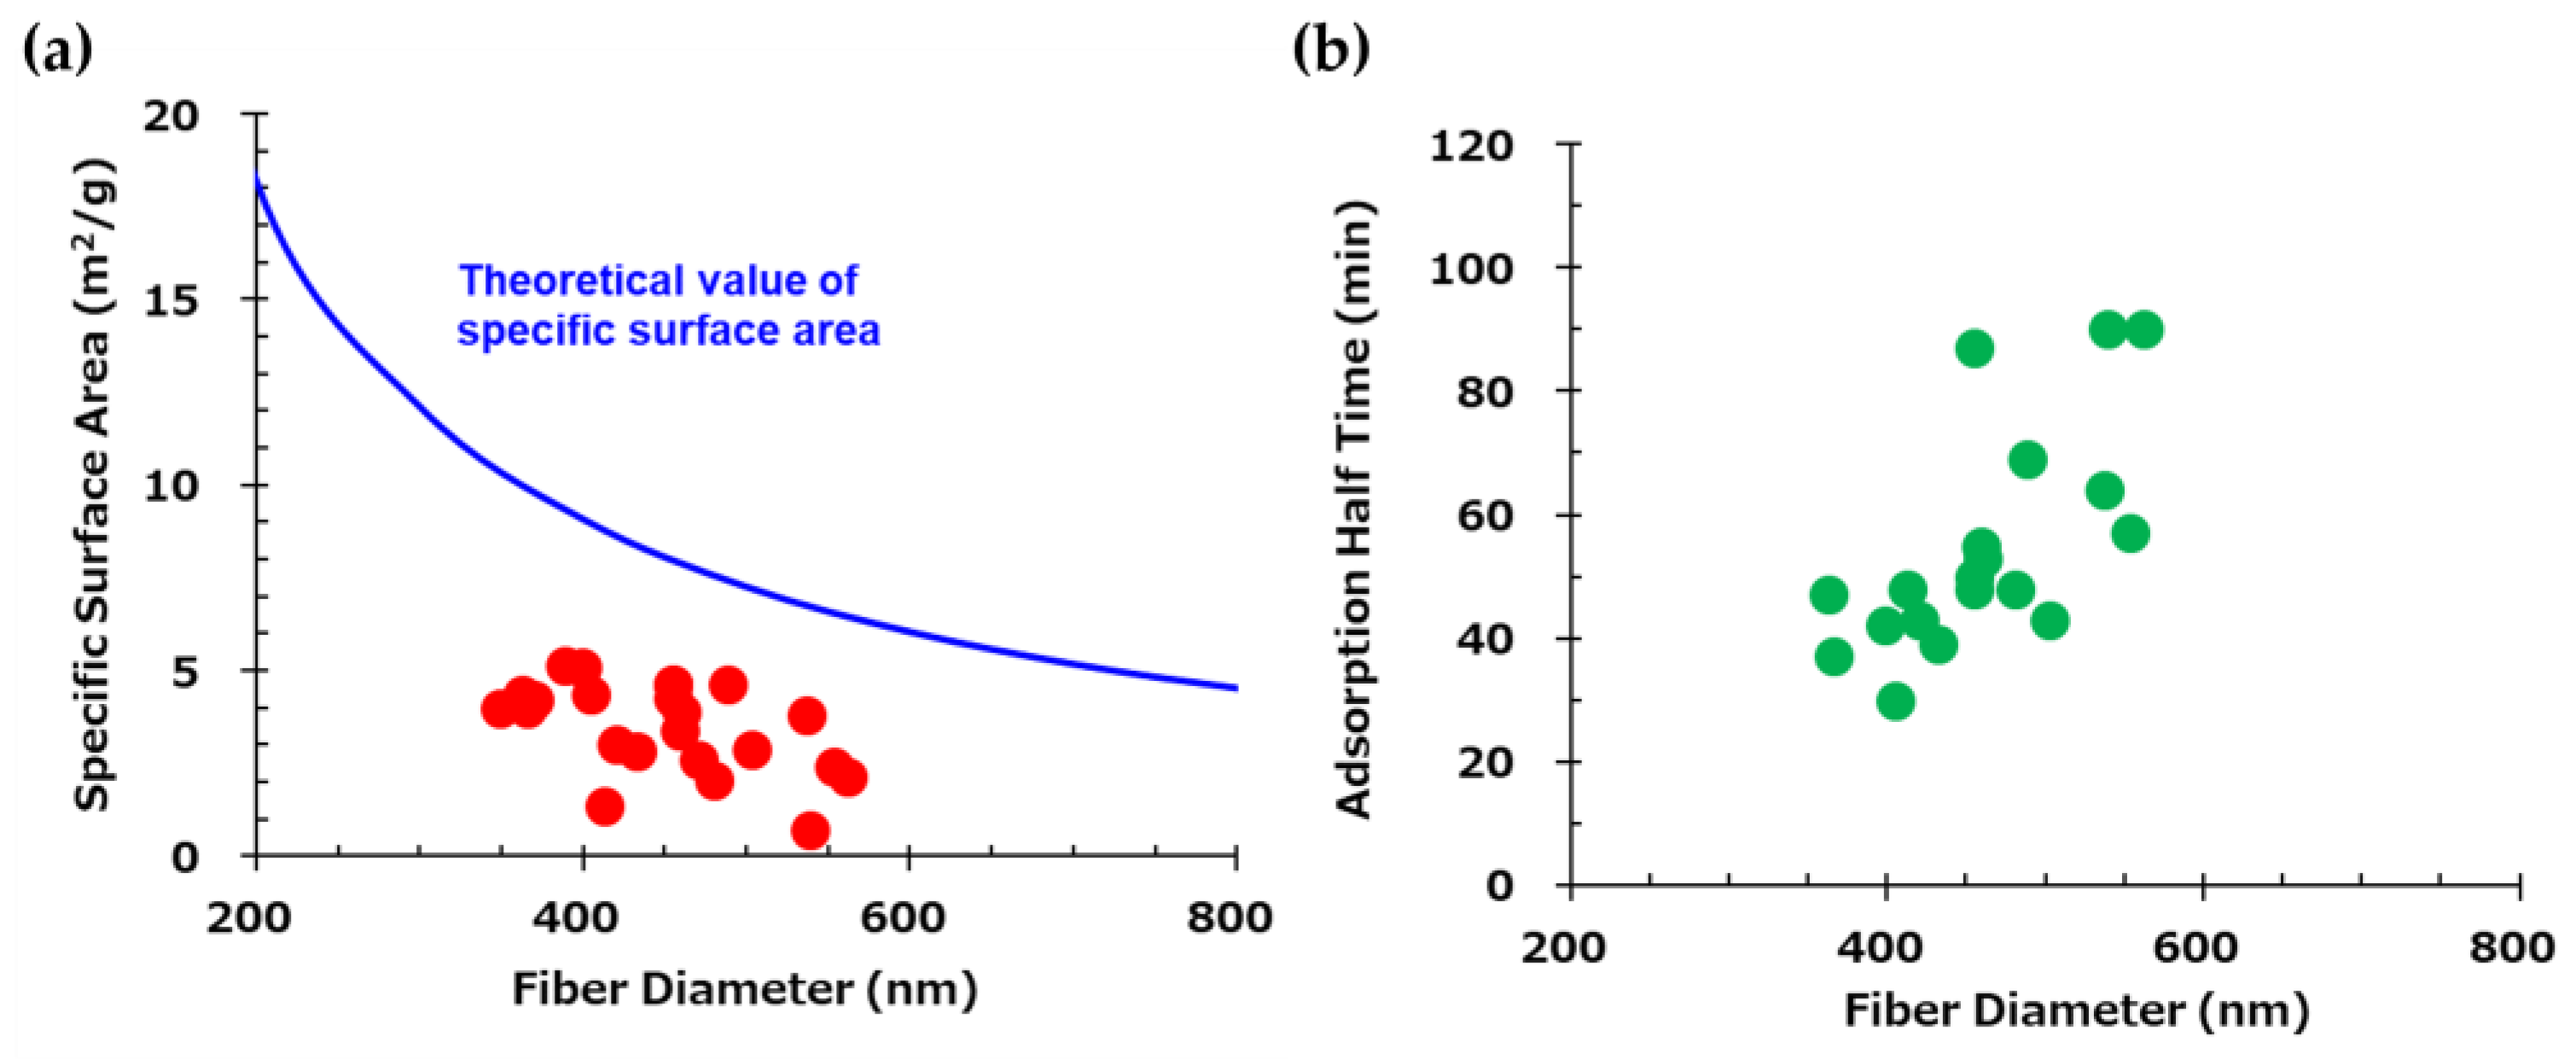
Figure 6.
CO₂ adsorption and desorption profiles of fiber samples prepared with different epoxy-to-amine ratios (E/A). The adsorption amount is plotted as a function of time for E/A of 0.3 (red), 0.4 (green), 0.5 (black), and 0.55 (blue). The temperature was varied at 20 °C for 990 min for adsorption, and at 50 °C, 65 °C, and 80 °C for desorption for 90 min each (For E/A=0.3, 110 min at 50 °C).
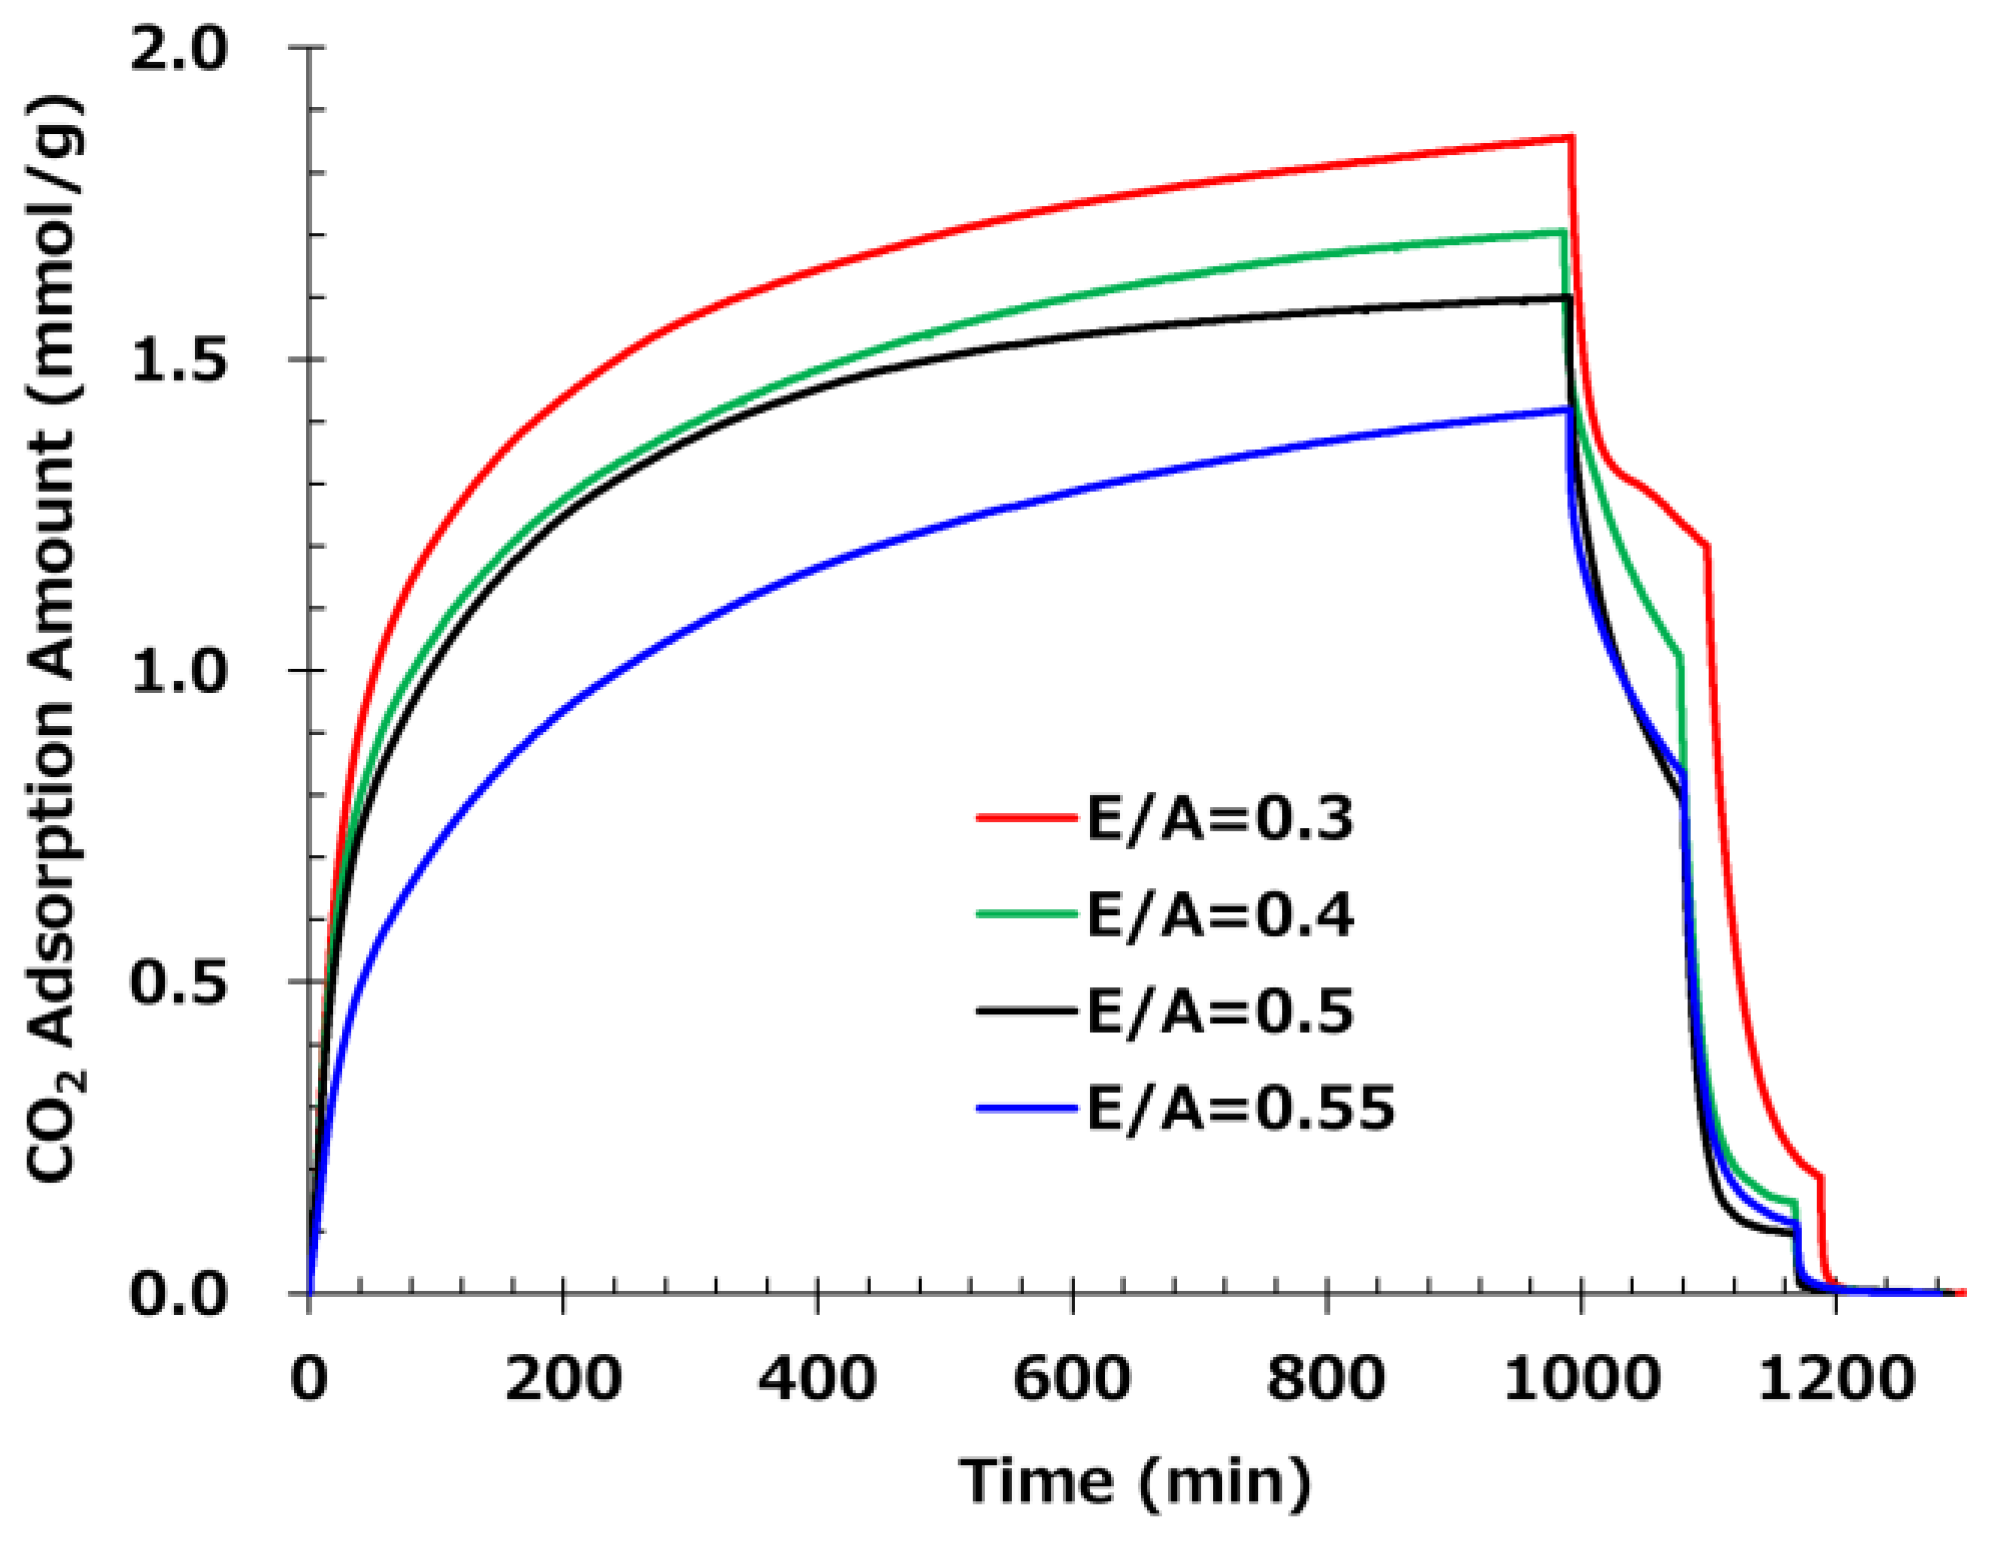
Figure 7.
(a) CO₂ adsorption profiles of AE/PVA-117 before and after heat treatment. The solid blue line represents the original AE/PVA-117 sample, while the dashed blue line corresponds to the sample after heat treatment at 85 °C for 200 hours. (b) CO₂ adsorption profiles of AE/PVA-217 before and after heat treatment. The solid red line represents the original AE/PVA-217 sample, while the dashed red line corresponds to the sample after heat treatment at 85 °C for 200 hours.
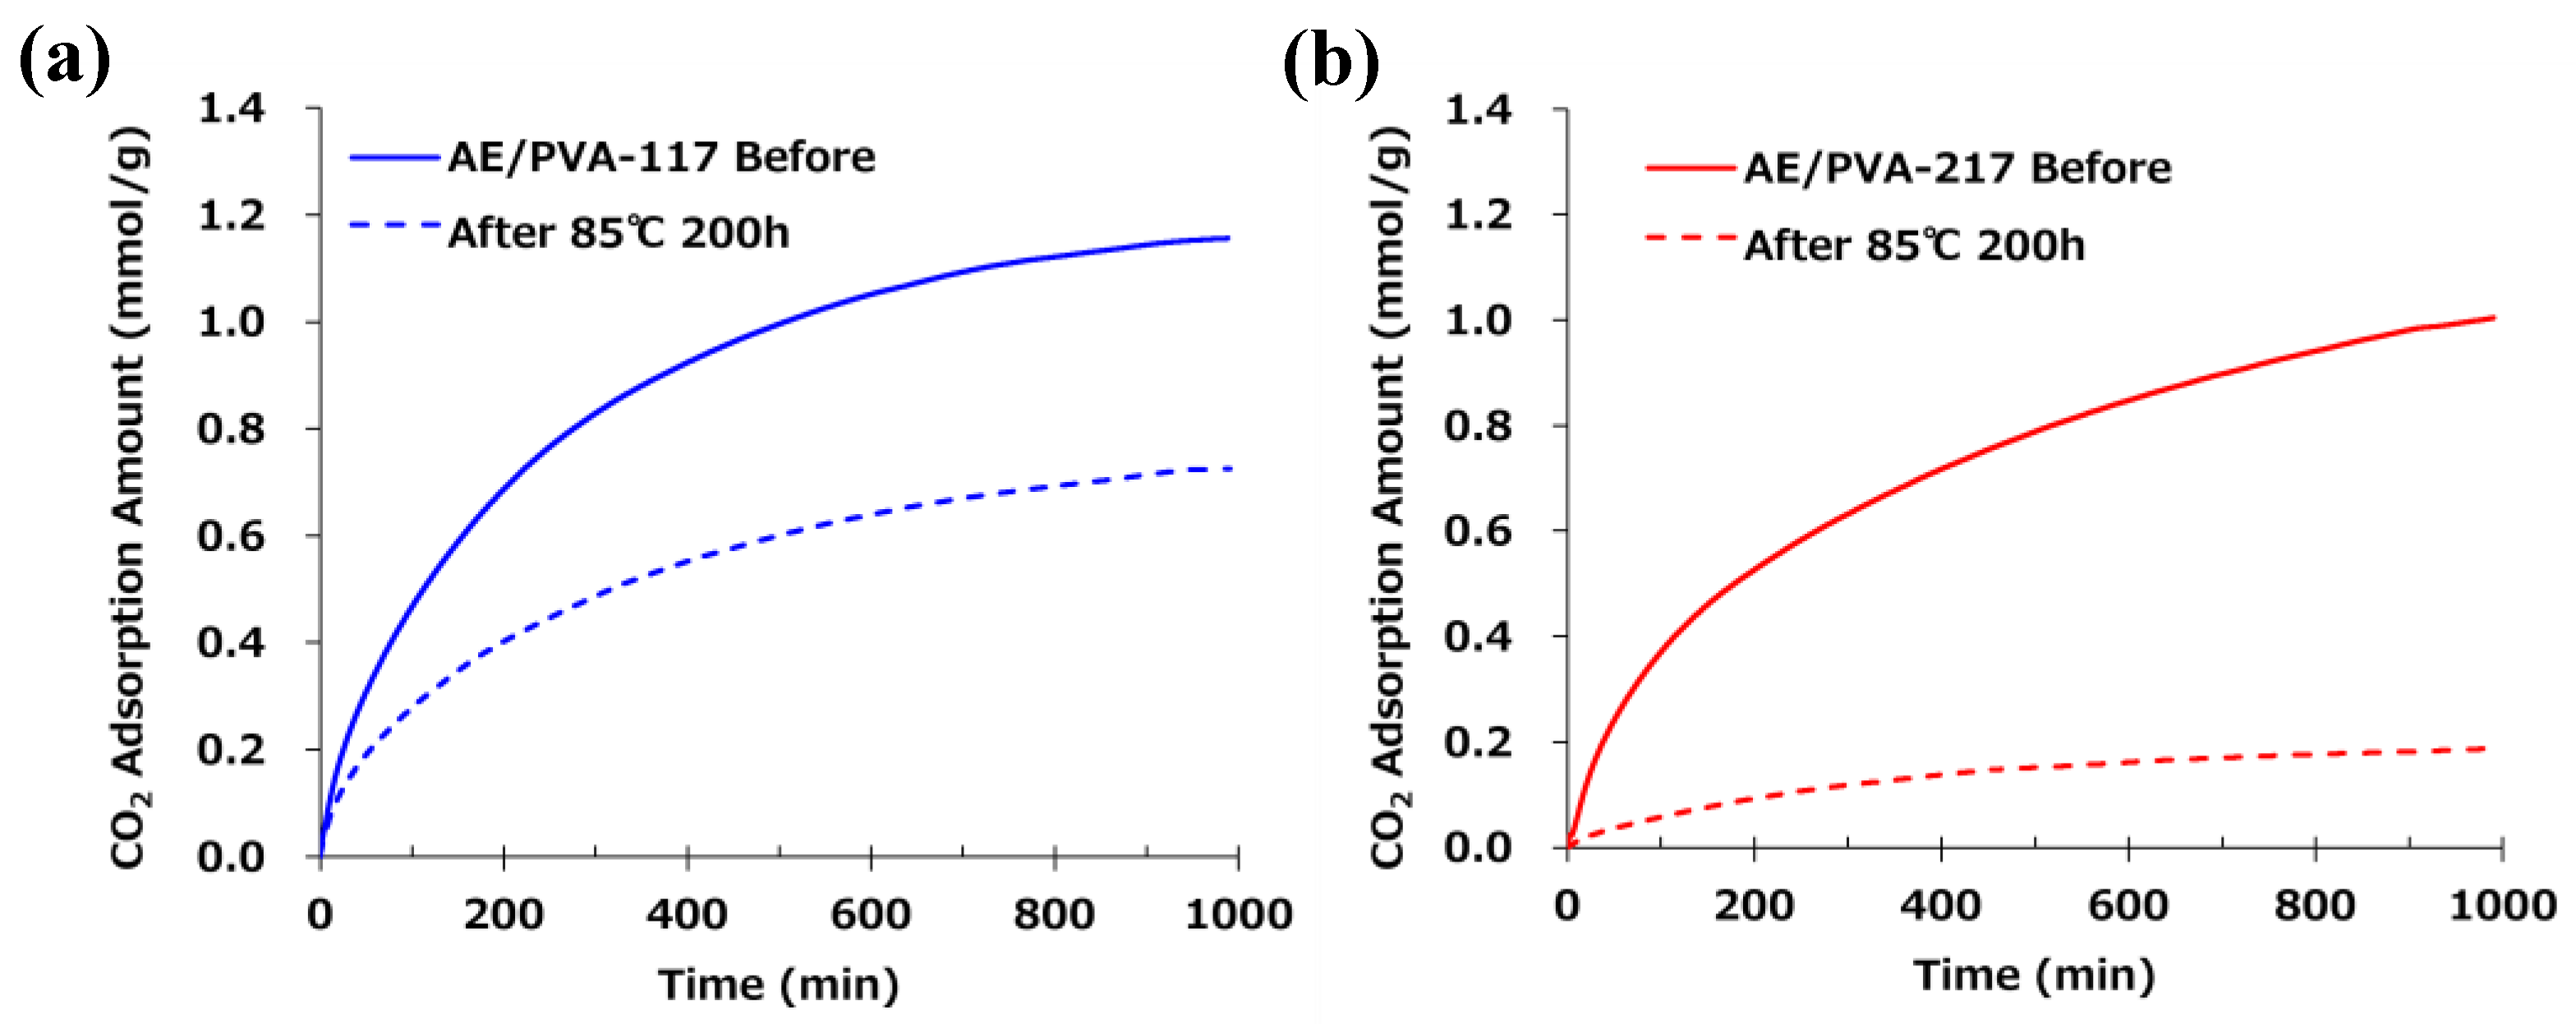
Figure 8.
FT-IR spectra of AE/PVA-117 (blue) and AE/PVA-217 (red) before and after heat treatment. Solid lines represent the original samples, and dashed lines correspond to samples after heat treatment at 85 °C for 200 hours. Enlarged FT-IR spectra of AE/PVA-117 and AE/PVA-217 in the range of 1800–1000 cm⁻¹ are inserted to highlight characteristic absorption bands. Peaks corresponding to C=O (~1700 cm⁻¹), NC=O (~1500 cm⁻¹), and –O– (~1200 cm⁻¹) are annotated.
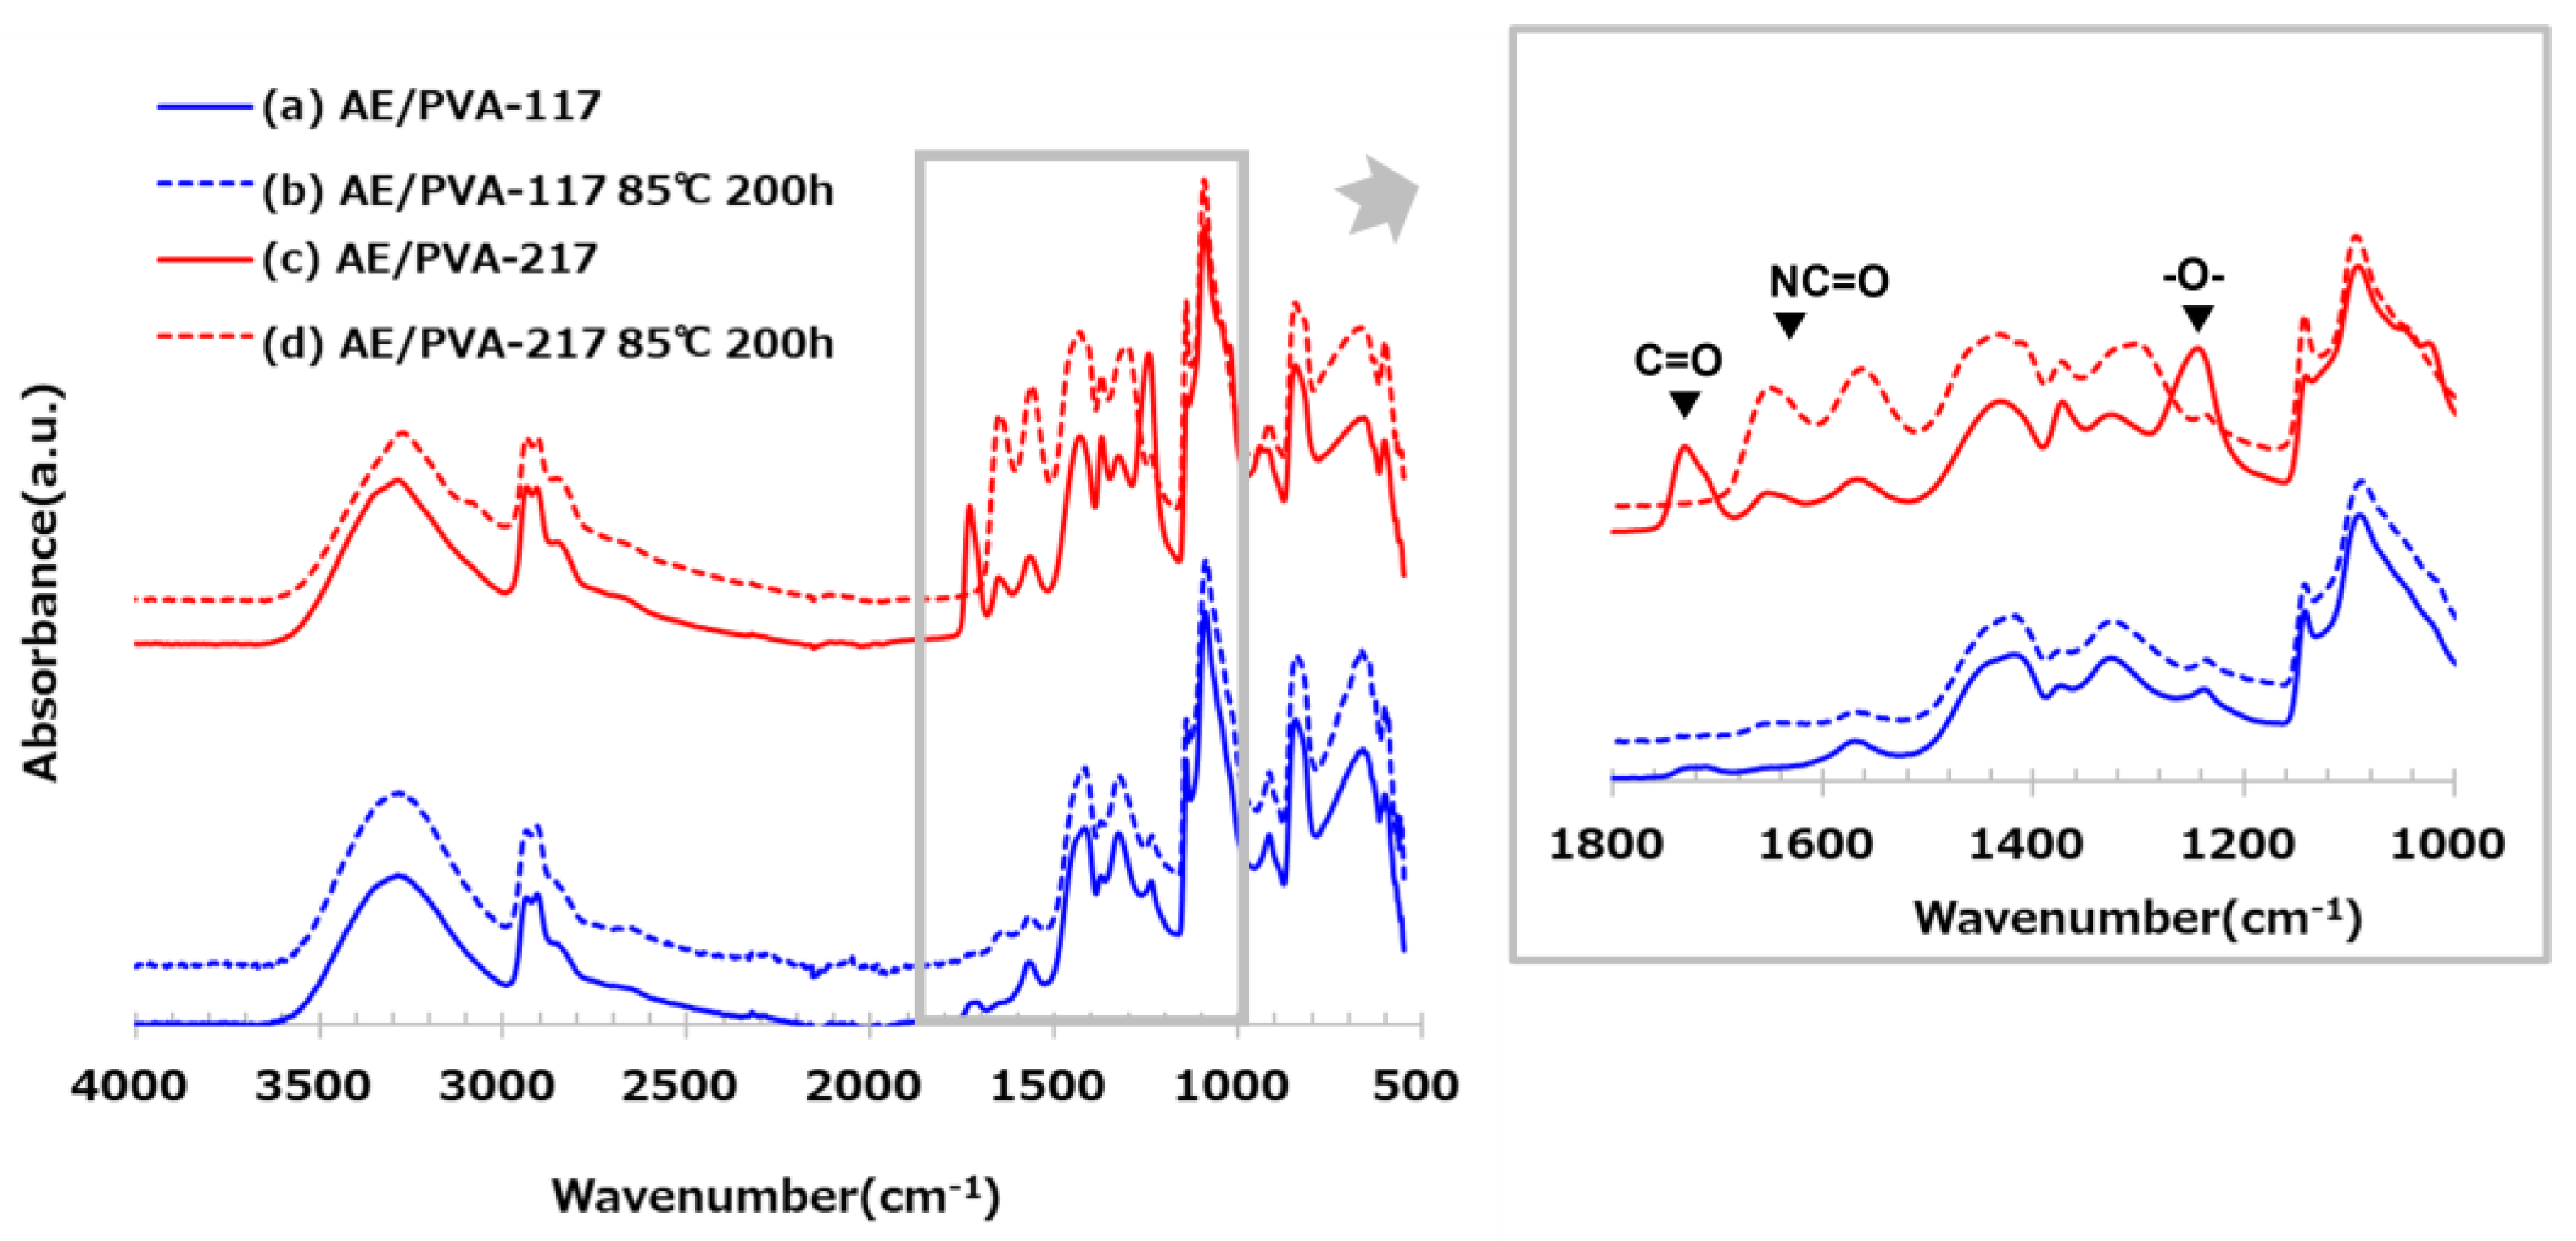
Figure 9.
Proposed reaction mechanism between the acetate groups in the PVA-based polymer and the amine groups in the curing agent. The reaction leads to the formation of amide bonds, R–C(=O) –N(–R’)–R”, as suggested by FT-IR spectral changes observed after heat treatment.
Figure 9.
Proposed reaction mechanism between the acetate groups in the PVA-based polymer and the amine groups in the curing agent. The reaction leads to the formation of amide bonds, R–C(=O) –N(–R’)–R”, as suggested by FT-IR spectral changes observed after heat treatment.
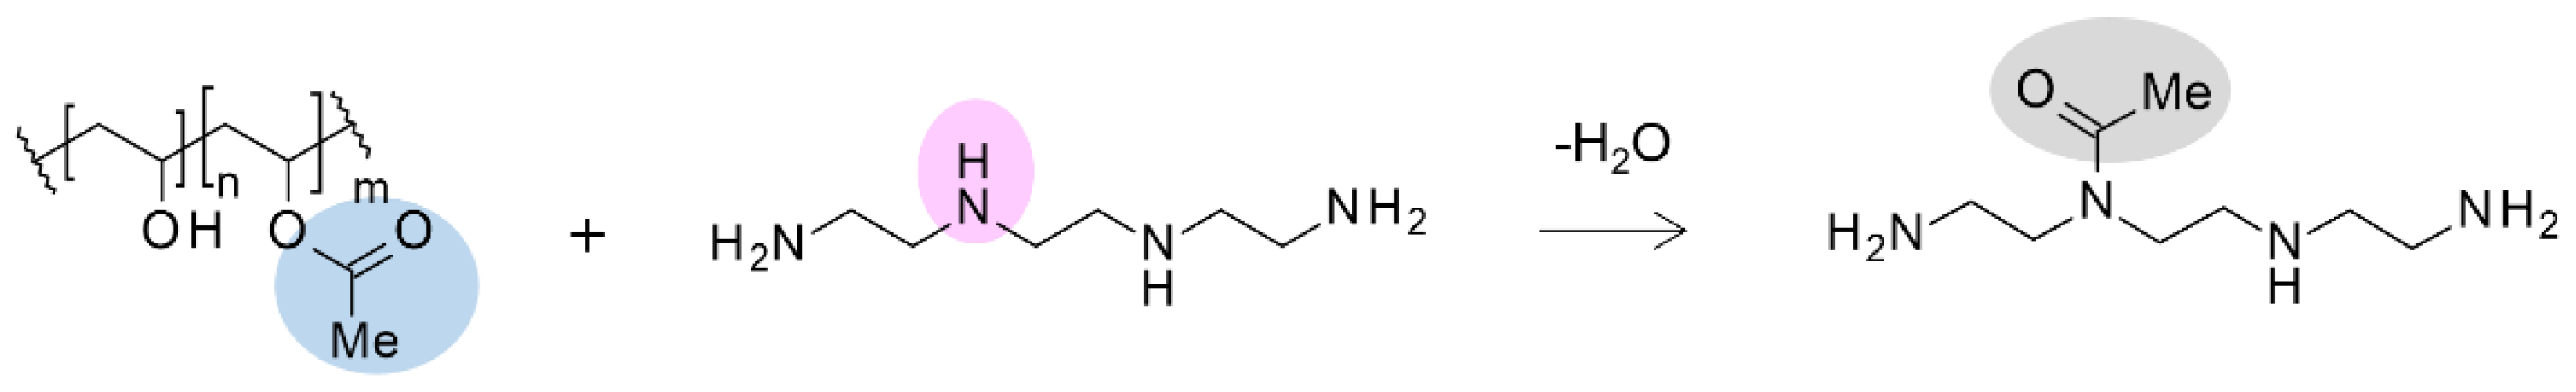

Table 1.
Degree of saponification, degree of polymerization, and molecular weight of poly(vinyl alcohol) (PVA) samples used in this study.
Table 1.
Degree of saponification, degree of polymerization, and molecular weight of poly(vinyl alcohol) (PVA) samples used in this study.
| Degree of Saponification (%) |
Degree of Polymerization |
Molecular Weight |
|
|---|---|---|---|
| PVA-117 | 99 | 1700 | 76,000 |
| PVA-217 | 88 | 1700 | 83,000 |
Table 2.
SEM images of electro-spun fibers prepared under different electrospinning conditions by varying the applied voltage and the distance between the syringe and the collector. Diameter of the spun fibers, the CO2 adsorption amount obtained through the adsorption test, and the SEM images with ×1,000, ×5,000, and x10,000 magnifications for electro-spun AE/PVA fiber are also shown.
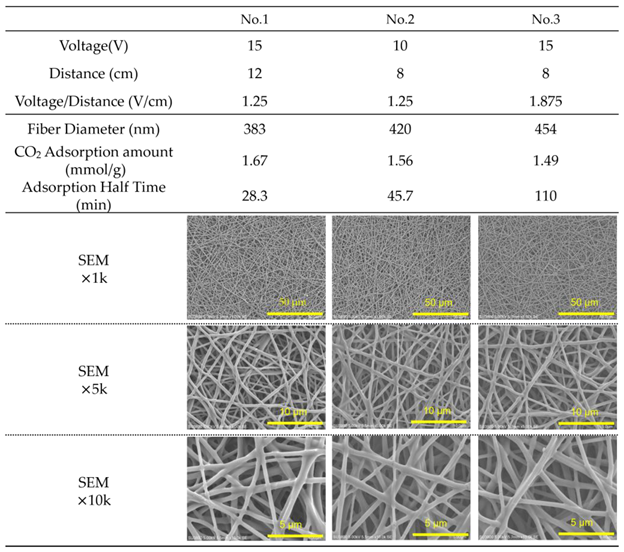
Table 4.
Fiber properties of epoxy-based materials prepared with varying epoxy-to-amine ratios (E/A). The table summarizes fiber diameter, glass transition temperature (Tg), CO₂ adsorption amount after 990 min at 20°C, predicted saturation values of adsorption based on the Avrami model, and desorption ratios after 90 min each at 50, 65, and 80 °C. (For E/A=0.3, 110 min at 50 °C). Heat resistance (Retention ratio of adsorption amount after treatment at 85 °C for 200 hours) is also included. SEM images at magnifications of ×3,000 and ×5,000 show the fiber morphologies under each condition.
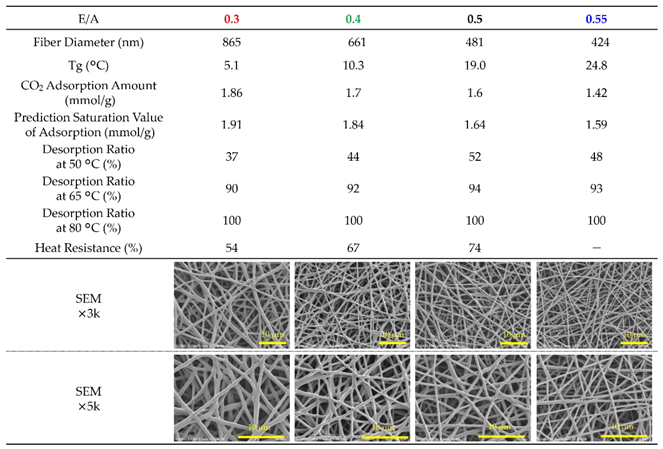
Table 5.
Compositional parameters of AE/PVA-117 and AE/PVA-217 systems. The table summarizes the amounts of ODE, T-C, TETA, and PVA solution, the ratio of ODE to T-C, the epoxy-to-amine ratio (E/A), the type of PVA used, the ratio of AE to PVA aqueous solution, and the weight percentage of AE in the resultant AE+PVA mixture.
| AE/PVA-117 | AE/PVA-217 | |
|---|---|---|
| ODE (g) | 0.8 | 0.8 |
| T-C (g) | 0.2 | 0.2 |
| TETA (g) | 1.6 | 1.6 |
| 8wt% PVA Aq. Solution (g) | 23.4 | 23.4 |
| ODE:T-C | 8:2 | 8:2 |
| E/A | 0.5 | 0.5 |
| PVA | PVA-117 | PVA-217 |
| AE:PVA 8wt% Aq. Solution | 1:9 | 1:9 |
| AE/(AE+PVA) | 58% | 58% |
Table 6.
Comparison of fiber properties between AE/PVA-117 and AE/PVA-217 systems. The table summarizes fiber diameter, CO₂ adsorption amount, predicted saturation value, and heat resistance (Retention ratio of adsorption amount after treatment at 85 °C for 200 hours). SEM images at magnifications of ×3,000 and ×10,000 are shown for each sample.
Disclaimer/Publisher’s Note: The statements, opinions and data contained in all publications are solely those of the individual author(s) and contributor(s) and not of MDPI and/or the editor(s). MDPI and/or the editor(s) disclaim responsibility for any injury to people or property resulting from any ideas, methods, instructions or products referred to in the content. |
© 2025 by the authors. Licensee MDPI, Basel, Switzerland. This article is an open access article distributed under the terms and conditions of the Creative Commons Attribution (CC BY) license (http://creativecommons.org/licenses/by/4.0/).
Copyright: This open access article is published under a Creative Commons CC BY 4.0 license, which permit the free download, distribution, and reuse, provided that the author and preprint are cited in any reuse.


