
Submitted:
30 October 2025
Posted:
31 October 2025
You are already at the latest version
Abstract
Fertile women represent a socially and medically significant patient group, yet little research has examined their rehospitalization behavior and financial burden in clinical settings. This study develops predictive and explainable artificial intelligence (AI) to forecast retention and medical costs among reproductive-age orthopedic patients. Electronic health records of 83 women (aged 15–49) at a major university hospital in Korea were analyzed. Six machine learning models were tested, and model performance was assessed using accuracy and the area under the curve (AUC). Shapley Additive Explanations (SHAP) were applied to interpret predictors of rehospitalization. Additional analyses explored determinants of patients’ total and uncovered medical costs. Random forest outperformed other models in predicting rehospitalization (AUC 0.92 vs. 0.73 for logistic regression). Key predictors included major disease, systolic blood pressure, platelet count, age, and treatment costs. Random forest also yielded lower error rates than linear regression in forecasting patients’ financial burden (RMSE/IQR for total cost: 1.05 vs. 1.14). Several factors—such as blood pressure, pulse, and hematocrit—were influential for both retention and costs. Predictive and explainable AI can support medical centers in anticipating rehospitalization and financial barriers for fertile women. By integrating medical and socioeconomic determinants, hospitals may design strategies that enhance patient retention while addressing broader societal priorities in women’s health.
Keywords:
artificial intelligence
; rehospitalization
; fertile women
; medical cost
1. Introduction
For every hospital and public healthcare institution, it is a fundamental responsibility to ensure that patients—particularly those who have required inpatient care—receive appropriate treatment in a timely manner. Among the patients, fertile women’s health management carries profound significance not only at the level of individual medical centers but also at the broader national and societal levels. From a public health perspective, low fertility has become one of the most critical issues across nations. Women’s reproductive health directly affects birth rates, which in turn determine the sustainability of national demographics and economic development. International organizations-WHO and OECD- have also emphasized that women’s health in their reproductive years should be regarded as a central priority in national health policy, guiding reforms in public healthcare and insurance systems.
From a managerial viewpoint of medical centers, fertile women represent a strategically important patient group. First, they have recurring and diverse medical needs throughout pregnancy, childbirth, and child-rearing, which makes rehospitalization and long-term follow-up highly probable. Second, fertile women often play a pivotal role in making healthcare decisions for their families, including children, spouses, and parents. Thus, managing this group not only enhances retention rates but also facilitates family-level patient acquisition, expanding the hospital’s customer base.
Taken together, these perspectives indicate that understanding fertile women’s interactions with hospitals and predicting their decisions to revisit or accept treatments are essential for pursuing a dual value creation strategy: achieving both primary(medical) and secondary (social) contributions. As with all patients, rehospitalization behavior in this group is influenced not only by their medical conditions but also by their demographic and socioeconomic status in complex ways. We propose a machine learning study to develop an artificial intelligence approach that addresses the structure of this relationship and identifies the key factors that medical centers should be aware of.
Artificial intelligence is emerging as a core prediction model for human responses including a customer’s reservation behavior. Pateints’ readmission decision has been documented in the literature in the medical domain. A recent review of 43 machine learning studies published during 2015-2019 shows that the random forest (16 articles, 37%), the artificial neural network (14 articles, 33%) and logistic regression (12 articles, 28%) were most popular machine learning approaches for the prediction of hospital readmission with an average accuracy of 70%. The predictors of these 43 studies included basic information (age, gender, marriage), socioeconomic status (insurance, income, education, employment), health conditions (subjective health, major diseases, minor diseases, comorbidity, severity), vital signs, blood indicators, past history (reservation, utilization), hospitalization route (outpatient, emergency) and medical access [1]. According to another recent review of 93 machine learning studies published during 1970-2019, these predictors were most representative variables in clinics data, Lisbon Portugal Data and Kalamata Greece Data [2].
However, little literature is available on predictive and explainable artificial intelligence for fertile women’s retention in medical centers. In this context, this study develops a machine learning approach as predictive and explainable AI to address this outcome. Specifically, we develop and test AI models that can anticipate rehospitalization (retention) among fertile women patients as well as the financial burden they are expected to face.
2. Methods
2.1. Data
Data came from electronic health records for 83 orthopedics patients in a major university hospital in South Korea, who got hospitalized before 2022 and reserved for rehospitalization in 2022. These patients are the ones who need orthopedic treatment and are the fertile women whose ages range from 15 to 49 [3]. The key dependent variables is retention (rehospitalization measured via no vs. yes in 2022. Twenty-seven predictors for year 2022 were included for each patient: (1) record variable: rehospitalization month, reservation month; (2) basic information: age, marriage (0 unmarried, 1 married, 2 widowed, 3 divorced); (3) socioeconomic status: health insurance, employment (0 unemployed, 1 on vacation, 2/3/4 1st/2nd/3rd industry, 5 other); (4) health conditions: major disease (M code), comorbidity, severity; (5) vital signs: body temperature, pulse, respiration, systolic blood pressure, diastolic blood pressure, glucose, red blood cell, white blood cell, hemoglobin, hematocrit, platelet; (6) past history: drinking, smoking, cancellation; (7) hospitalization route: outpatient, emergency; (8) geographic factor: residential area among 10 provinces; and (9) Financial constraint: expected medical cost total, cost uncovered.
2.2. Analysis
Six machine learning models were used to predict retention as rehospitalization: logistic regression, decision tree, naïve Bayes, random forest, support vector machine and artificial neural network [4,5,6,7]. See detailed explanations of these models in [7]. The 83 cases with full information were split into training and validation sets with a 75:25 ratio (62 vs. 21 cases). A criterion for the validation of the trained models were (1) accuracy for retention (the ratio of correct predictions among 257 cases), and (2) the area under the curve for retention (the area under the plot of sensitivity vs. 1—specificity).
Regarding the patients-related variables, (1) machine learning variable importance was calculated for identifying major predictors and (2) Shapley Additive Explanation (SHAP) values were derived to analyze the directions of their associations with rehospitalization. The variable importance of a predictor measures its contribution for the performance of machine learning [7]. For example, let’s assume that the variable importance of a predictor employment for retention is 0.027. Here, the contribution of the predictor is 2.7% in predicting retention. The SHAP value of a predictor for a participant measures the difference between what machine learning predicts for the probability of retention with and without the predictor [7]. For instance, suppose that (1) the SHAP values of total cost anticipated for retention have the range of (-0.12, 0.03) and (2) their mean value is positive (e.g., 0.001). Here, some participants have SHAP values as low as -0.12, and other participants have SHAP values as high as 0.03. The inclusion of this predictor (total financial cost) into machine learning will decrease or increase the probability of retention by the range of -0.12 and 0.03. Then, the max value (0.03) is to be considered as a representative estimate, given that their mean value is positive (positive association). Thus, the inclusion of the total financial cost into machine learning will increase the probability of the dependent variable (retention) by 0.03. Finally, it can be noted that R-Studio 1.3.959 (R-Studio Inc.: Boston, United States) and python 3.8.8 (Van Rossum G, Drake FL.: Scotts Valley, United States) were employed for the analysis during January 1, 2024-May 31, 2024.
3. Results
3.1. Descriptive Statistics
Table 1 presents the descriptive statistics of the variables used in model fitting. We briefly summarize them starting from categorical variables first. Among the 83 fertile women included in this study, 82% (68 patients) were rehospitalized, while 4% (3) had a prior cancellation history. More than half of the patients experienced rehospitalization in July or later (59%) or made their reservation from July onward (54%). In terms of socioeconomic characteristics, 57% (47 patients) were married, 90% (75) were covered by health insurance, 76% (63) were employed, and 77% (64) resided in Seoul.
Regarding health-related factors, 24% (20 patients) had a major disease, only 1% (1 patient) had comorbidities, and a large majority (92%, 76 patients) were classified as having high severity. Lifestyle factors included 39% (32 patients) reporting alcohol consumption and 14% (12 patients) reporting smoking. Only one patient (1%) was admitted via emergency hospitalization.
The continuous variables show that the median age was 36 years. Vital signs and laboratory measures indicated a median body temperature score of 2 (on a 0–3 scale), pulse of 41 per minute, and respiration of 7 per minute. Median blood pressure values were 22 mm Hg (systolic) and 39 mm Hg (diastolic). Median laboratory findings included glucose at 38 mg/dL, red blood cell count at 4 million/µL, white blood cell count at 6000/µL, hemoglobin at 13 g/dL, hematocrit at 39%, and platelet count at 265,000/µL. Finally, the measures for patient’s expense showed that the median was 2,640 thousand Won in total expenditures and 1,195 thousand Won in uncovered expenditures.
3.2. Explainable Artificial Intelligence on Retention
Table 2 presents the predictive performance of the different machines fitted against the fertile women patients. In Table 2, the random forest registered a much higher area under the curve compared to logistic regression for the prediction of retention (92% vs. 73%). Regarding the role of the predictors used, Figure 1 shows the relative importance of those variables used in our random forest and Table 3 shows the associated SHAP values. Based on random forest and Shapley Additive Explanations (SHAP) outcomes in Table 3 and Figure 1, retention had strong associations with the following predictors with their respective variable importance outcomes and SHAP max (or min) values for positive (or negative) associations in brackets.
We 10. variables ranked by importance: major disease [variable importance: 0.160 (SHAP: 0.061)], systolic blood pressure [0.095 (0.028)], cost total [0.094 (0.026)], platelet [0.071 (0.023)], cost uncovered [0.066 (0.028)], pulse [0.049 (0.014)], age [0.049 (0.019)], white blood cell [0.049 (-0.128)], hematocrit [0.048 (0.012)] and rehospitalization July or later [0.045 (-0.119)]. For example, a predictor cost total made a positive contribution of 9.4% for the performance of the random forest and a positive contribution of 2.6% for the probability of retention. Conversely, a predictor rehospitalization July or later made a positive contribution of 4.5% for the performance of the random forest and a negative contribution of 11.9% for the probability of retention. Here, the contributions of predictors employment and residence Seoul were positive (2.7%, 1.0%) for the performance of the random forest and negative (-1.9%, -1.1%) for the probability of retention.
3.3. Patient’s Financial Barrier and Related Feature
In the next step, we turn to the patient’s financial burden in terms of medical costs, which are financial cost(expenditure) total and cost uncovered in our data. Here, the focus is not on prediction itself but on exploring which patient characteristics are associated with higher or lower expenditures, offering the medical center potentially useful information about how economic burden may indirectly influence its patients’ rehospitalization decisions.
Linear regression and the random forest were employed to predict medical cost total and uncovered. The root mean square error divided by the interquartile range was used for measuring model accuracy. As the results, the random forest showed a slightly lower root mean square error over interquartile range compared to linear regression for the prediction of cost total/uncovered (1.05/1.03 vs. 1.14/1.35) in Table 4. Then, from the examination of the variable importance and the associated regression coefficients in Table 5 and Figure 2, we could see the major features of the patients informative about the financial cost they would bear.
The medical cost ‘total’ had strong relationships with the following predictors with their respective variable importance outcomes and coefficient estimate values (divided by 1000) in brackets: comorbidity [40047 (7838)], diastolic blood pressure [22587 (16)], platelet [22423 (0)], major disease [21558 (-250)], hematocrit [21298 (652)], hemoglobin [16622 (-1795)], emergency hospitalization [15974 (4421)], pulse [13106 (43)], rehospitalization July or later [12338 (-8)] and systolic blood pressure [11968 (1)]. For instance, a predictor comorbidity made a positive contribution of 40047 (thousand Won) for the performance of the random forest and it will increase the total medical cost by 7,838 (thousand Won). Conversely, a predictor rehospitalization July or later made a positive contribution of 12338 (thousand Won) for the performance of the random forest and it is likely to decrease 8 (thousand Won) in total expenditure. Here, the contributions of predictors, employment and residence Seoul were positive (3012 thousand Won, 2425 thousand Won) for the performance of the random forest and positive (20 thousand Won, 59 thousand Won) for medical cost total. If possible, therefore, consideration or policy attention given to these patients group would be desirable in order to increase the human beings’ quality of life, although this issue is beyond the scope of our study. The results were similar when we measured the associations between the patients’ features with cost ‘uncovered’, as given in Table 6 and Figure 3. Figure 4 and Figure 5 show the scatter plots of actual vs. predicted financial costs that patients must bear.
3.4. Explainable Artificial Intelligence Summary
In Table 7, outcomes from random forest for retention (rehospitalization) are aligned with the outcomes for medical cost total and uncovered, respectively. First, it is noteworthy that eight predictors (rehospitalization July or later, age, major disease, pulse, systolic blood pressure, white blood cell, hematocrit and platelet) ranked within the top 10 for retention, and informative about patient’s financial burden (either cost total or cost uncovered) at the same time. Indeed, those financial constraints imposed on patients were top-5 predictors for retention (rehospitalization).
Variables such as patient’s employment status and the geographic residential area (Seoul) turned out to be not important to inform the anticipated medical costs. These two features are not among the top 10 predictors for retention, which is an interesting finding given that they are widely considered to be major predictors for retention in existing literature [1,2].
Secondly, we note that the signs of some major predictors for retention were consistent with those of medical cost total. They are rehospitalization July or later (negative), age (positive), pulse (positive), systolic blood pressure (positive), white blood cell (negative) and hematocrit (positive). Here, the signs denote random forest SHAP means (multiplied by 100) for retention and linear regression coefficient estimates for medical cost total. These predictors can be considered to provide a managerial guideline for securing customer retention and for anticipating patients’ financial costs hurdle for their scheduled medical services.
4. Discussion
4.1. Summary
This study developed machine learning as predictive and explainable artificial intelligence for fertile woman’s retention and financial costs imposed on patients in a medical center. The random forest largely outperformed the other approaches. Based on random forest and Shapley Additive Explanations outcomes, patients’ whether-or-not to rehospitalize decision can be reasonably predicted by major disease (positive), systolic blood pressure (positive), platelet (positive), pulse (positive), age (positive), employment (negative) and residence Seoul (negative). From the additional analysis we conducted to explore patients’ other characteristics that might be informative about their financial cost for rehospitalization, it is found that medical cost total had significant relationships with diastolic blood pressure (positive), comorbidity (positive), hematocrit (positive), platelet (positive), age (negative), employment (positive) and residence Seoul (positive).
4.2. Contributions
This study makes the following contributions to the field of medical informatics and quantitative marketing. First, the primary contribution is that this study offers AI for predicting hospital patient’s readmission based on comprehensive set of patient’s data including both physical/medical condition and social/economic feature variables. This study also brings robust artificial intelligence for understanding patient’s financial expenditure to receive the medical treatment via re-hospitalization. As reported above, the random forest registered a much higher area under the curve compared to logistic regression for the prediction of retention (92% vs. 73%). Moreover, the random forest showed a slightly lower root mean square error over interquartile range compared to linear regression for the prediction of medical cost total/uncovered (1.05/1.03 vs. 1.14/1.35). The superior performance of the random forest has been well documented. In a previous study [12] that compared the performance outcomes of 179 models based on 121 datasets from the University of California Irvine Machine Learning Repository (http://archive.ics.uci.edu/), the random forest (with max accuracy 94%) ranked first among the 179 models, followed by the support vector machine (with max accuracy 92%). This result can be attributed to the fact that the random forest is a group of decision trees making majority votes on the dependent variable (“bootstrap aggregation”) [7]. A majority vote made by 1000 doctors would be more reliable than a vote made by 1 doctor. Likewise, a majority vote made by 1000 decision trees would be more reliable than a vote made by a single machine learning model.
Second, this study reconfirms the existing literature on age and overall health as major determinants of rehospitalization among orthopedic patients. A recent study of 30-day rehospitalization among orthopedic patients reviewed 24 original studies published after 2006 [8]. Based on this review, rehospitalization had positive associations with age and American Society of Anesthesiologist (ASA) score (overall health) in three or more original studies reviewed. In a similar context, another recent study of 90-day rehospitalization among orthopedic patients reviewed 16 original studies published after 2013 [9]. It was found in this review that rehospitalization had positive relationships with diabetes (Odds Ratio [P-value] 1.246 [0.000]) and ASA score (1.502 [0.000]) in three or more original studies reviewed. These results are consistent with those of this study: Based on random forest variable importance outcomes in this study, retention as rehospitalization had strong associations with age and overall health (represented by major disease, systolic blood pressure, platelet, pulse, white blood cell and hematocrit).
4.3. Limitations
This study comes with some limitations, which offers avenues for future research. Firstly, this study used a small sample (83 orthopedics patients) from a single center (university hospital). These patients were fertile women with the age of 15-49 [3]. The rationale for selecting this specific group was that low birth rates are the most urgent issues in many countries including South Korea [13,14,15,16,17]. Expanding data is expected to improve the validity of this study.
Secondly, multinomial classification was beyond the scope of this study. Multinomial classification can be defined as “combining multiple dependent variables into one and conducting its classification” [4,18,19]. In a previous artificial-intelligence study on diabetes and its comorbid conditions [4], for example, the dependent variable (disease comorbidity) was designed for four categories: “0” for diabetes no, comorbid disease no; “1” for diabetes no, comorbid disease yes; “2” for diabetes yes, comorbid disease no; and “3” for diabetes yes, comorbid disease yes. In a similar way, medical center can be interested in managing four groups of customers by treating the probability of retention(no vs yes) and the expected financial cost patients are to bear(low vs high), which gives rise to four management outcomes. Future research can deal with joint modeling.
Thirdly, reinforcement learning (RL) [20,21,22,23,24,25] was not considered in this study. RL is a branch of artificial intelligence, which includes three elements: (1) the environment brings rewards; (2) an agent takes actions for maximum rewards; and (3) the environment changes to the next period with given probabilities [20]. The RL agent (e.g., Alpha-Go) starts like a human agent, taking actions and maximizing rewards (e.g., the chances of victory) just based on limited information in limited periods. But the RL agent evolves far beyond the best human agent ever from the magnificent power of big data encompassing all human agents before [20]. In fact, it has been this division of RL that has popularized the notion of artificial intelligence as intelligence similar with but superior to human intelligence [20]. RL became popular in finance and health, given that it does not require unrealistic assumptions but delivers superior performance to traditional approaches [21,22]. These successes were replicated in business informatics such as conversational agents [23,24,25]. We expect more studies on the topics of customer retention, which is eventually ‘to have original patients, especially fertile women segment finish their medical care as planned’ in other medical practice areas as well.
5. Conclusions
Artificial intelligence can serve as an effective decision support system for predicting and explaining fertile woman’s retention and financial cost they should bear in a medical center.
This study highlights the critical importance of fertile women’s health for both medical institutions and society at large. At the societal level, improving reproductive-age women’s health is indispensable for addressing low fertility and ensuring demographic sustainability. At the institutional level, fertile women represent a key patient segment with high potential for rehospitalization and broad influence over family-level healthcare decisions, underscoring the need for targeted retention strategies.
Against this backdrop, our findings demonstrate that predictive and explainable AI—particularly random forest models supplemented by Shapley Additive Explanations—offers a powerful decision support system for forecasting both rehospitalization and patient financial medical expenses. By identifying the medical and socioeconomic factors that simultaneously drive retention and cost, hospitals can design strategies that balance financial sustainability with social responsibility. Anchoring on our study, we hope the future studies sheds light on agenda of “double value creation” in healthcare that simultaneously improves patient retention for solving medical problem and facilitates medical centers’ so-called a patient lifetime value as management objectives, which is really about advancing women’s health as a societal imperative. Future work should extend this framework with larger and more diverse datasets, explore multi-objective learning approaches, and integrate reinforcement learning to optimize retention and value in dynamic healthcare environments.
Author Contributions
Conceptualization, K.-S.L. and K.J.; methodology, K.-S.L. and K.J.; software, K.-S.L. and K.J.; validation, K.-S.L. and K.J.; formal analysis, K.-S.L. and K.J.; investigation, K.-S.L. and K.J.; resources, K.-S.L. and K.J.; data curation, K.-S.L. and K.J.; writing—original draft preparation, K.-S.L. and K.J.; writing—review and editing, K.-S.L. and K.J.; visualization, K.-S.L. and K.J.; supervision, K.-S.L. and K.J.; project administration, K.-S.L. and K.J.; funding acquisition, K.-S.L. All authors have read and agreed to the published version of the manuscript.
Funding
This work was supported by (1) the Korea University Anam Hospital grant (K.-S.L.) funded by Korea University. This work was also supported by the Korea Health Industry Development Institute grant [Korea Health Technology R&D Project] (No. RS-2022-KH129263) (K.-S.L.) funded by the Ministry of Health and Welfare of South Korea. This work was also supported by the Korea University Business School. The funder had no role in the design of the study, in the collection, analysis and interpretation of the data, or the writing and review of the manuscript.
Institutional Review Board Statement
This retrospective study was approved by the Institutional Review Board of Korea University Anam Hospital on 17 August 2023 (2023AN0364). All methods were performed in accordance with the relevant guidelines and regulations.
Informed Consent Statement
Patient consent was waived due to the retrospective analysis of de-identified data.
Data Availability Statement
The original contributions presented in this study are included in the article. Further inquiries can be directed to the corresponding authors.
Conflicts of Interest
The authors declare that the research was conducted in the absence of any commercial or financial relationships that could be construed as potential conflicts of interest.
References
- Huang Y, Talwar A, Chatterjee S, Aparasu RR. Application of machine learning in predicting hospital readmissions: a scoping review of the literature. BMC Med Res Methodol 2021;21:96. [CrossRef]
- Stone K, Zwiggelaar R, Jones P, Mac Parthaláin N. A systematic review of the prediction of hospital length of stay: Towards a unified framework. PLOS Digit Health 2022;1:e0000017. [CrossRef]
- World Health Organization. Total fertility rate. Accessed on August 1, 2025 at https://www.who.int/data/gho/indicator-metadata-registry/imr-details/123.
- Kim R, Kim CW, Park H, Lee KS. Explainable artificial intelligence on life satisfaction, diabetes mellitus and its comorbid condition. Sci Rep 2023;13:11651. [CrossRef]
- Cho H, Lee EH, Lee KS, Heo JS. Machine learning-based risk factor analysis of necrotizing enterocolitis in very low birth weight infants. Sci Rep. 2022;12:21407. [CrossRef]
- Cho H, Lee EH, Lee KS, Heo JS. Machine learning-based risk factor analysis of adverse birth outcomes in very low birth weight infants. Sci Rep 2022;12:12119. [CrossRef]
- Lee KS, Kim ES. Explainable artificial intelligence in the early diagnosis of gastrointestinal disease. Diagnostics. 2022;12:2740. [CrossRef]
- Bernatz JT, Tueting JL, Anderson PA. Thirty-day readmission rates in orthopedics: a systematic review and meta-analysis. PLoS One 2015;10:e0123593. [CrossRef]
- Zeng L, Cai H, Qiu A, Zhang D, Lin L, Lian X, Chen M. Risk factors for rehospitalization within 90 days in patients with total joint replacement: A meta-analysis. Medicine 2023;102:e35743. [CrossRef]
- M’endez-Su’arez M, Crespo-Tejero N. Why do banks retain unprofitable customers? A customer lifetime value real options approach. Journal of Business Research. 2021;122:621-626. [CrossRef]
- Sun Y, Liu H, Gao Y. Research on customer lifetime value based on machine learning algorithms and customer relationship management analysis model. Heliyon. 2023;9:e13384. [CrossRef]
- Fernández-Delgado M, Cernadas E, Barro S, Amorim D. Do we need hundreds of classifiers to solve real world classification problems? Journal of Machine Learning Research 2014;15:3133-3181.
- OECD. Korea’s Unborn Future: Understanding Low-Fertility Trends. OECD Publishing, Paris, 2025.
- Yun J, Kim CY, Son SH, Bae CW, Choi YS, Chung SH. Birth rate transition in the Republic of Korea: Trends and prospects. J Korean Med Sci 2022;37:e304. [CrossRef]
- Cho KA. Korea’s low birth rate issue and policy directions. Korean J Women Health Nurs 2021;27:6-9. [CrossRef]
- Cheng H, Luo W, Si S, Xin X, Peng Z, Zhou H, Liu H, Yu Y. Global trends in total fertility rate and its relation to national wealth, life expectancy and female education. BMC Public Health 2022;22:1346. [CrossRef]
- Götmark F, Andersson M. Human fertility in relation to education, economy, religion, contraception, and family planning programs. BMC Public Health 2020;20:265. [CrossRef]
- Lee KS, Park KW. Social determinants of the association among cerebrovascular disease, hearing loss and cognitive impairment in a middle-aged or older population: Recurrent neural network analysis of the Korean Longitudinal Study of Aging (2014-2016). Geriatr Gerontol Int 2019;19:711-716. [CrossRef]
- Lee KS, Park KW. Social determinants of association among diabetes mellitus, visual impairment and hearing loss in a middle-aged or old population: Artificial-neural-network analysis of the Korean Longitudinal Study of Aging (2014−2016). Geriatrics 2019;4:30. [CrossRef]
- Silver D, Huang A, Maddison CJ, Guez A, Sifre L, van den Driessche G, Schrittwieser J, Antonoglou I, Panneershelvam V, Lanctot M, Dieleman S, Grewe D, Nham J, Kalchbrenner N, Sutskever I, Lillicrap T, Leach M, Kavukcuoglu K, Graepel T, Hassabis D. Mastering the game of Go with deep neural networks and tree search. Nature 2016;529:484-489. [CrossRef]
- Hambly, B., Xu, R., Yang, H. Recent advances in reinforcement learning in finance. arXiv 2022;2112,04553. [CrossRef]
- Yu C, Liu J, Nemati S. Reinforcement learning in healthcare: A survey. arXiv 2019;1908,08796. [CrossRef]
- Dognin P, Padhi I, Melnyk I, Das P. ReGen: Reinforcement learning for text and knowledge base generation using pretrained language models. Proceedings of the 2021 Conference on Empirical Methods in Natural Language Processing 2021 November 7-11, 1084-1099.
- Pang JC, Yang SH, Li K, Zhang J, Chen XH, Tang N, Yu Y. Knowledgeable agents by offline reinforcement learning from large language model rollouts. arXiv 2024;2404,09248. [CrossRef]
- Wang Y, Yang Q, Zeng Z, Ren L, Liu L, Peng B, Cheng H, He X, Wang K, Gao J, Chen W, Wang S, Du SS, Shen Y. Reinforcement learning for reasoning in large language models with one training example. arXiv 2025;2504,20571. [CrossRef]
Figure 1.
Random Forest Variable Importance Results—Retention.
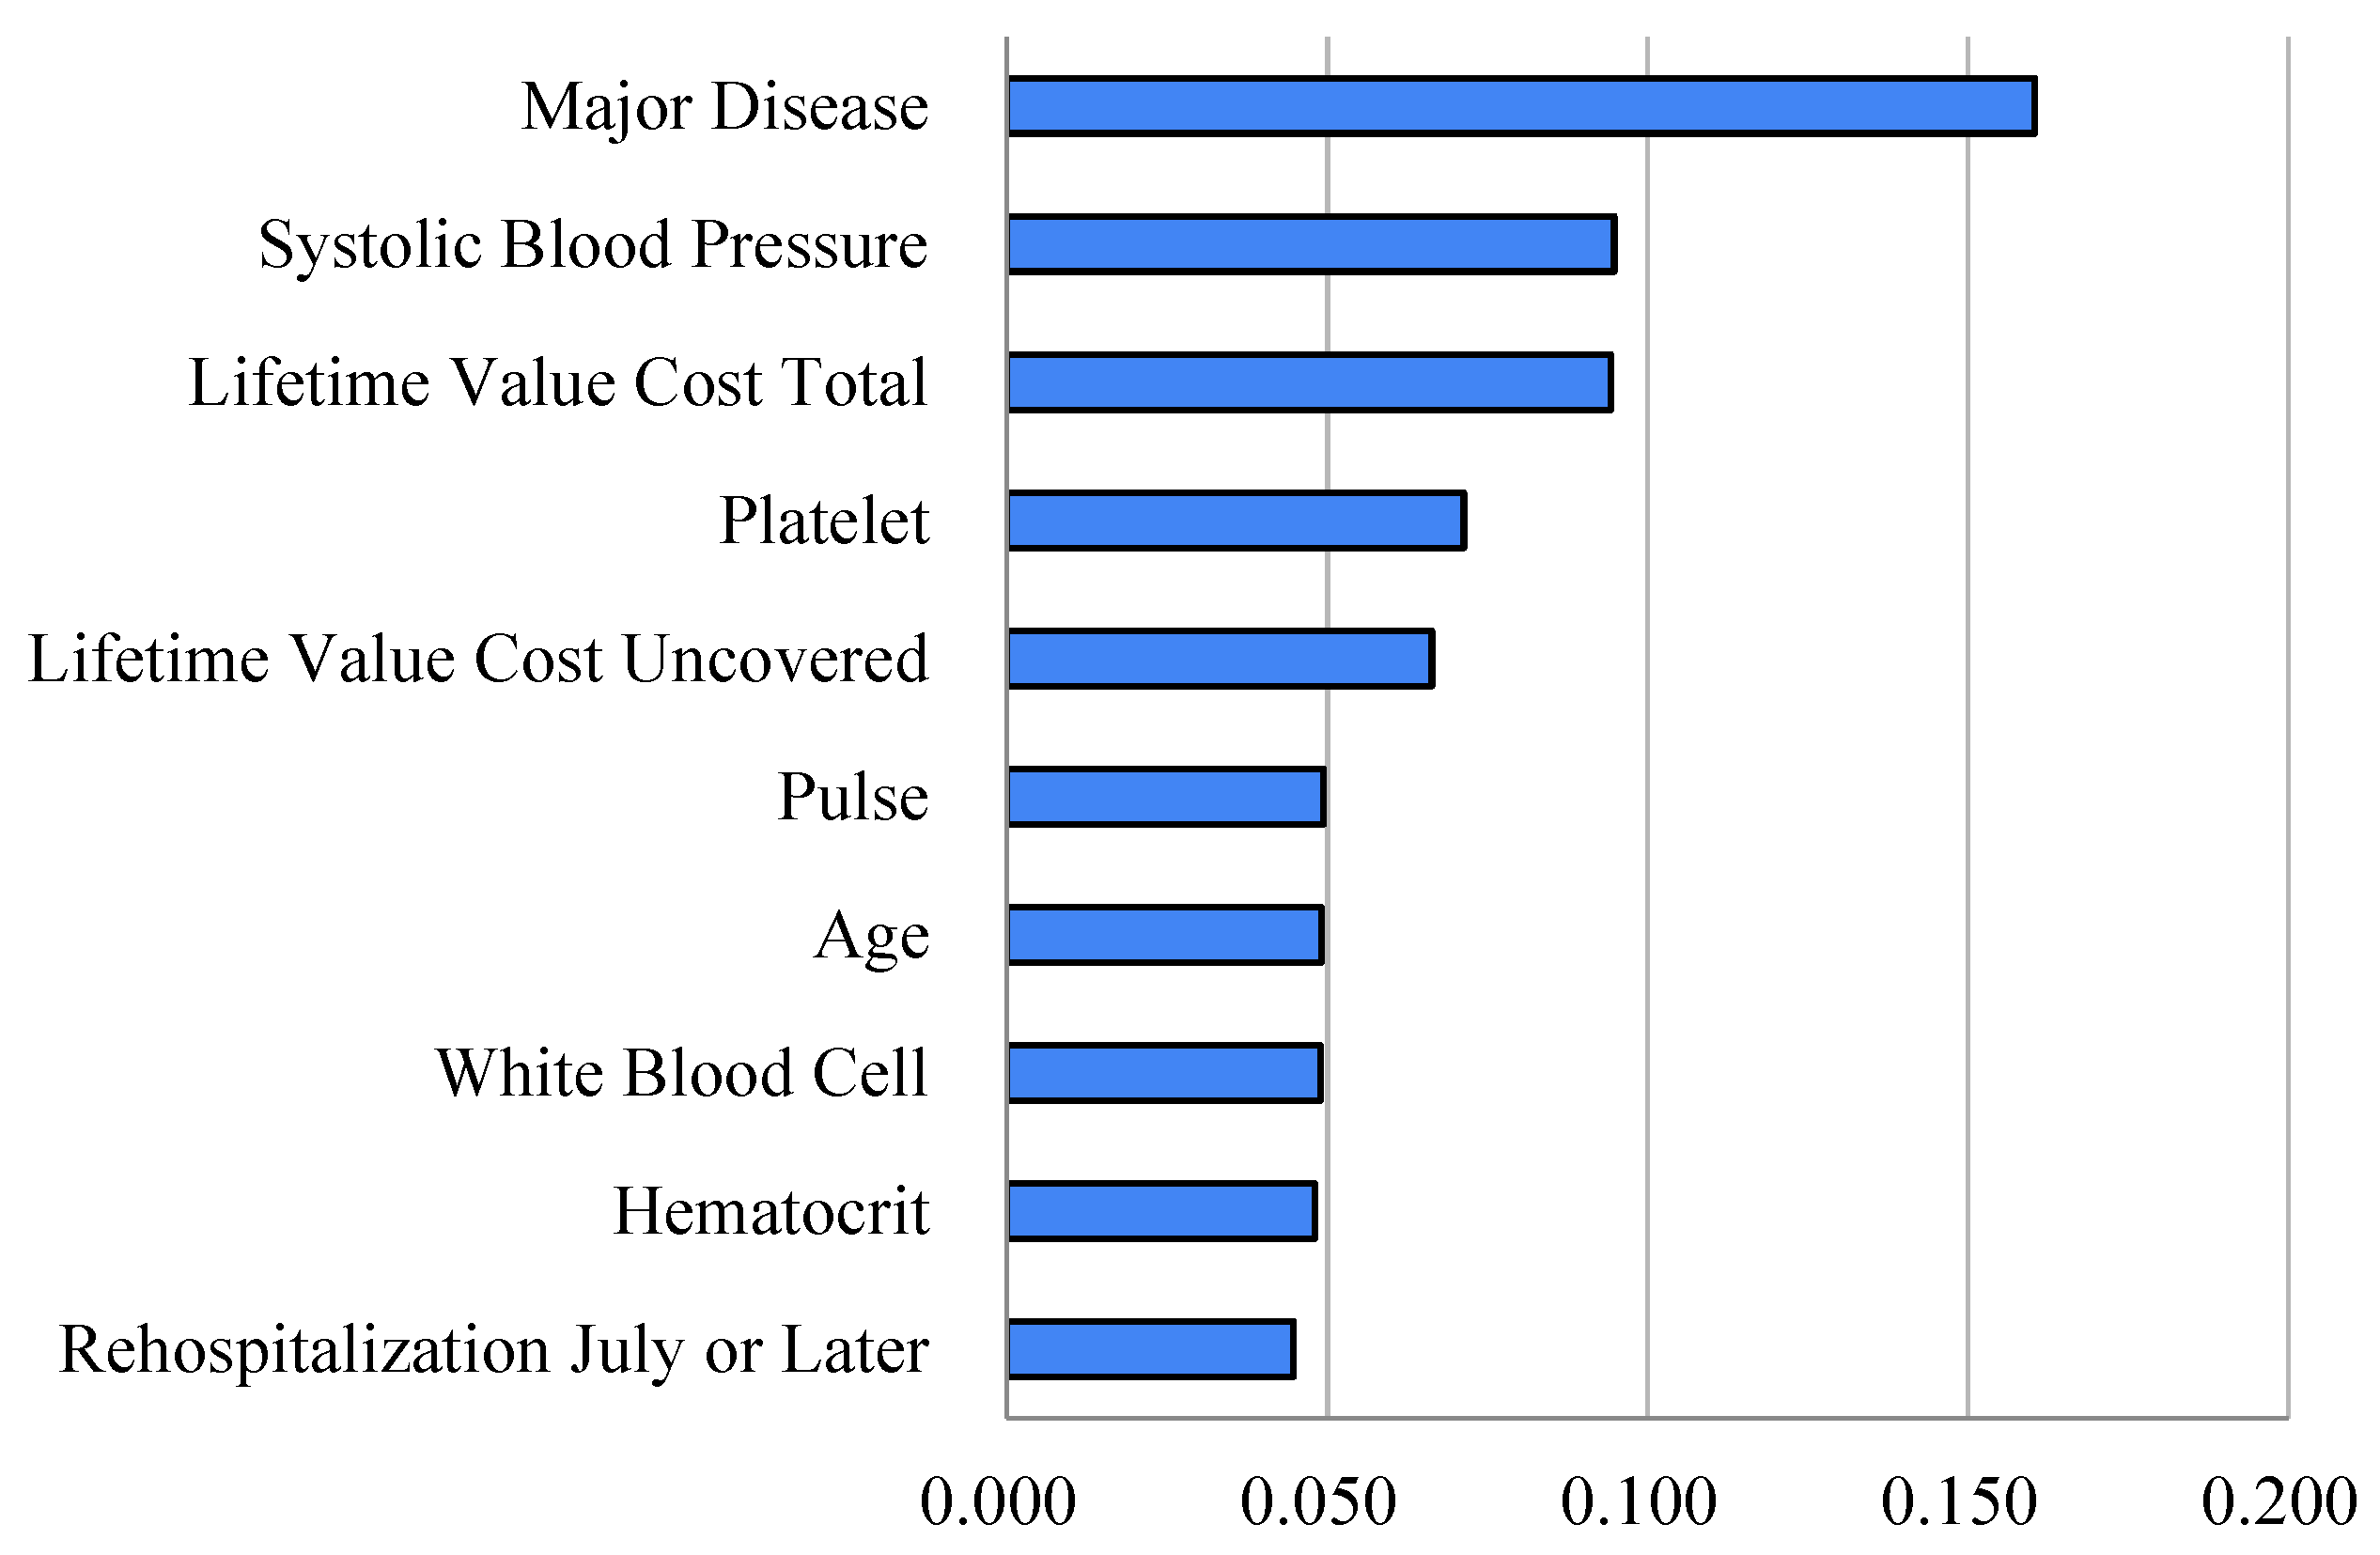
Figure 2.
Random Forest Variable Importance Results—Cost Total.
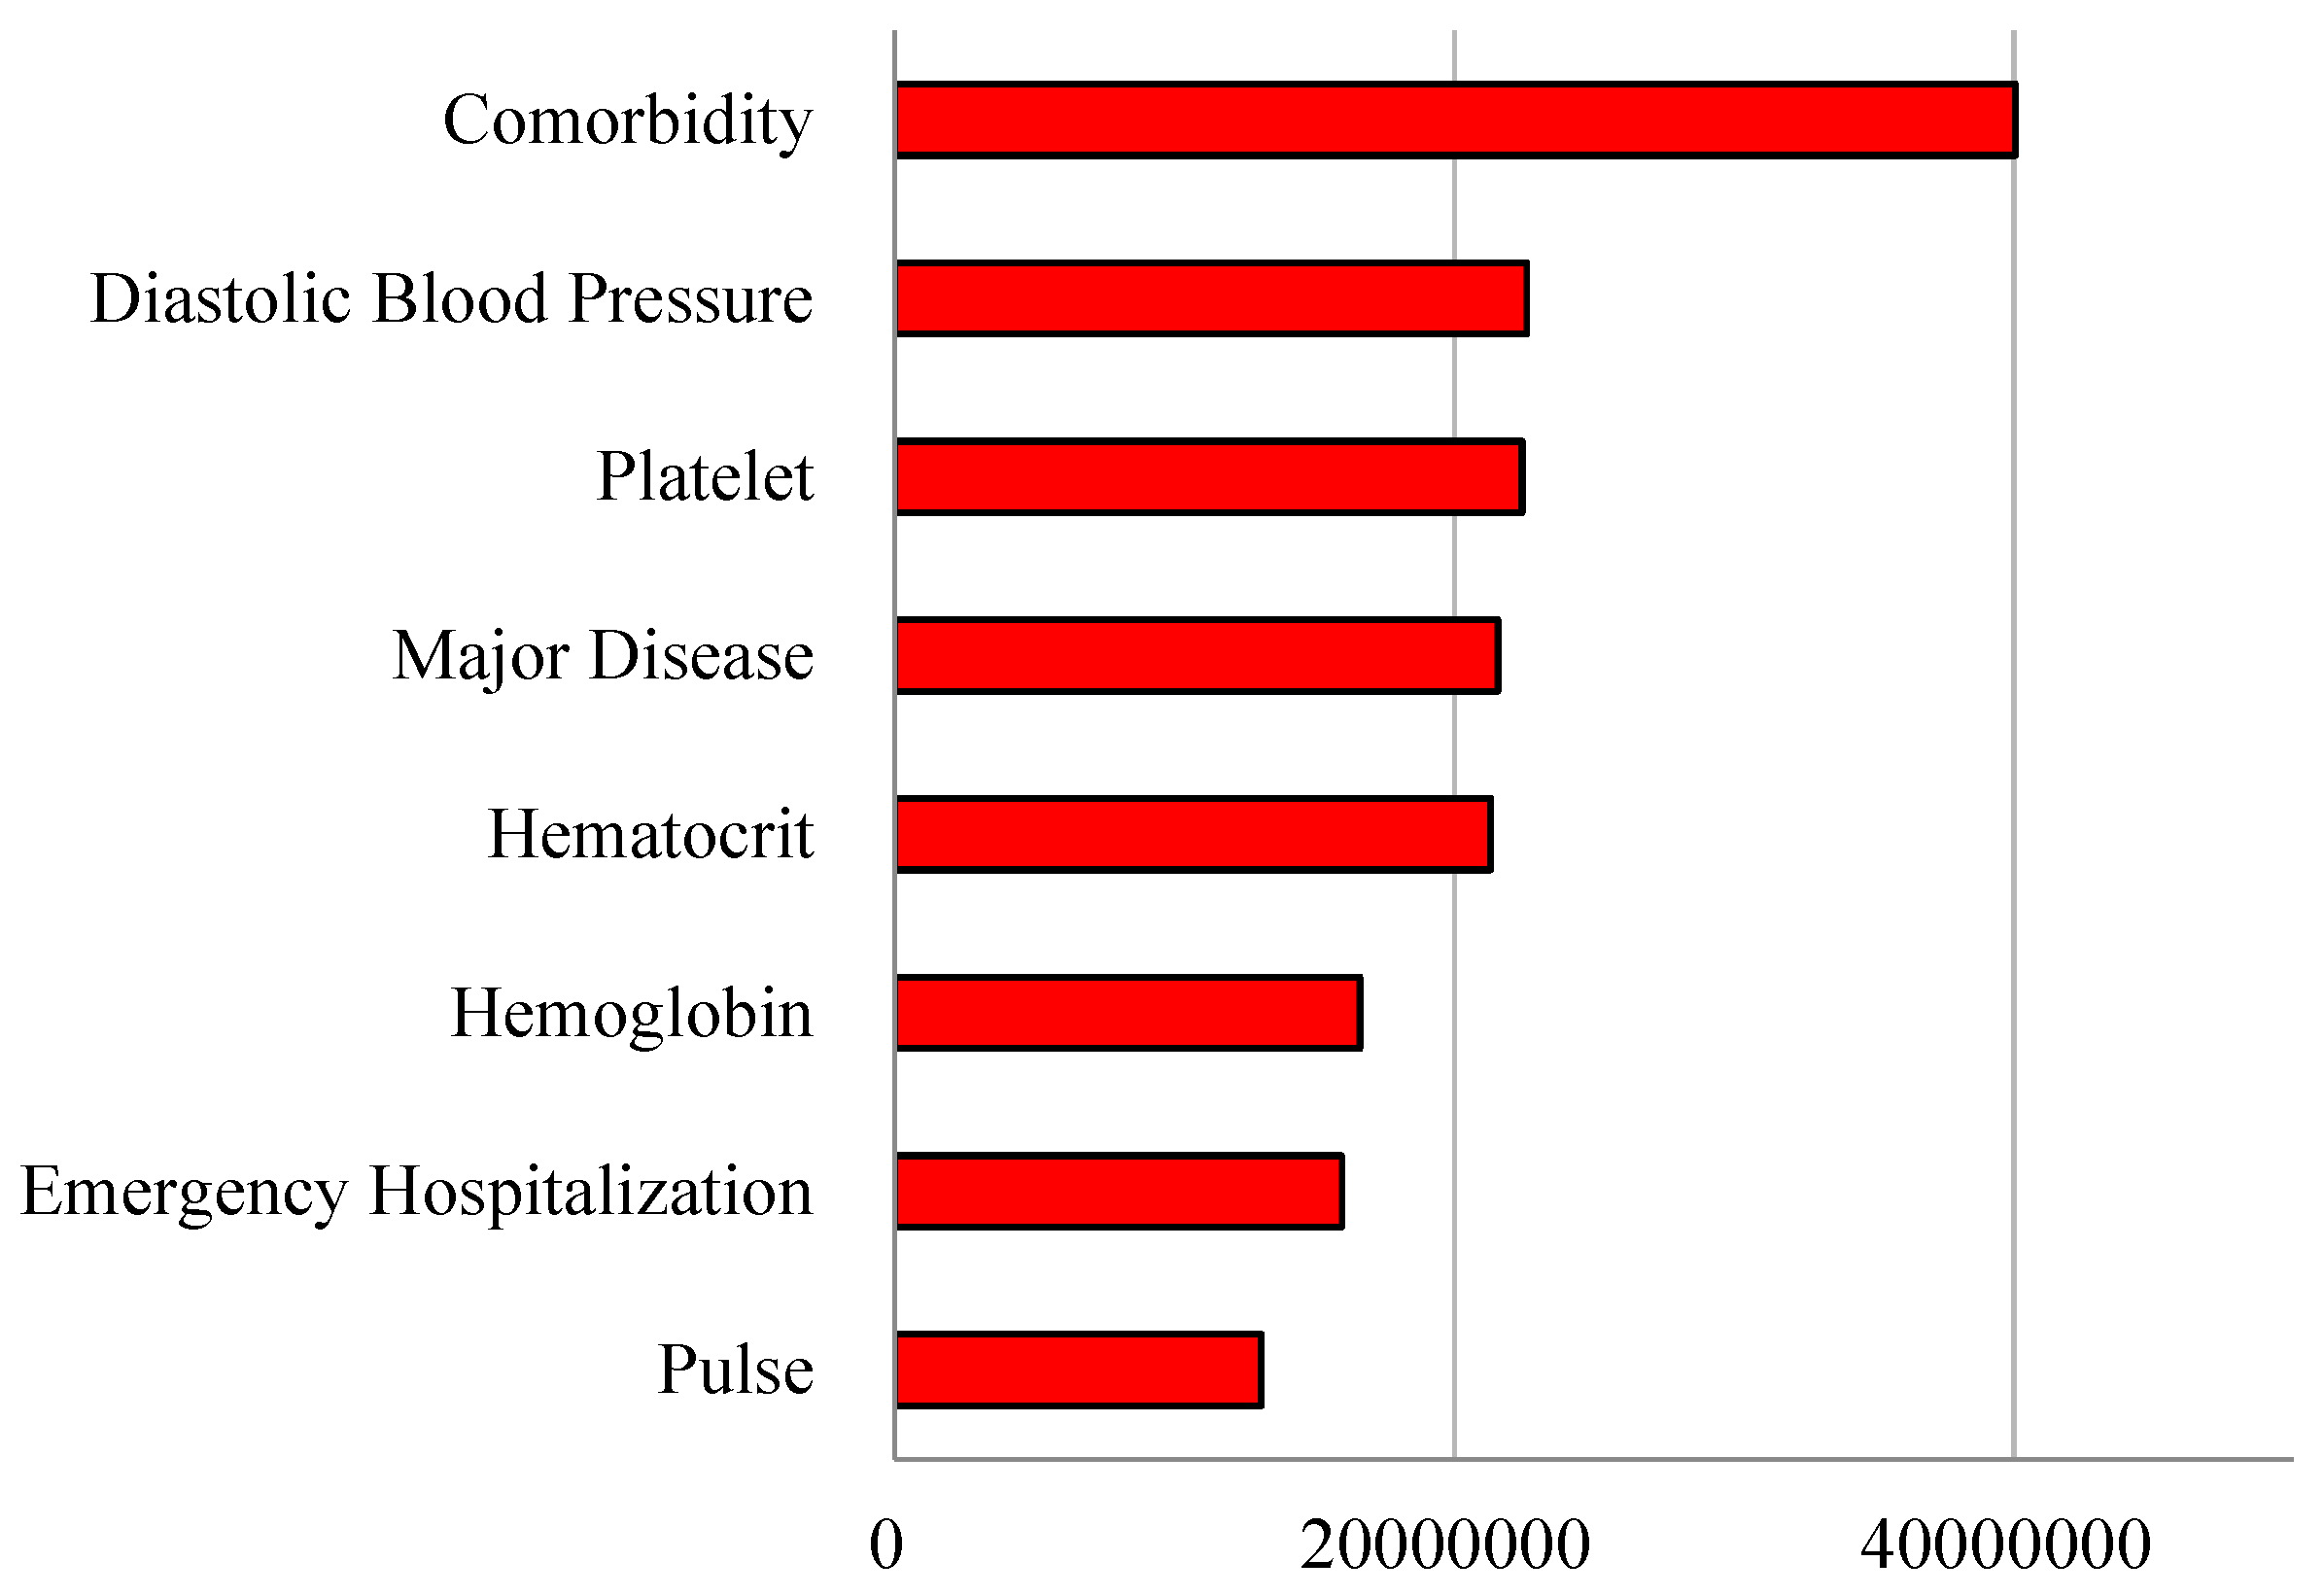
Figure 3.
Random Forest Variable Importance Results—Cost Uncovered.
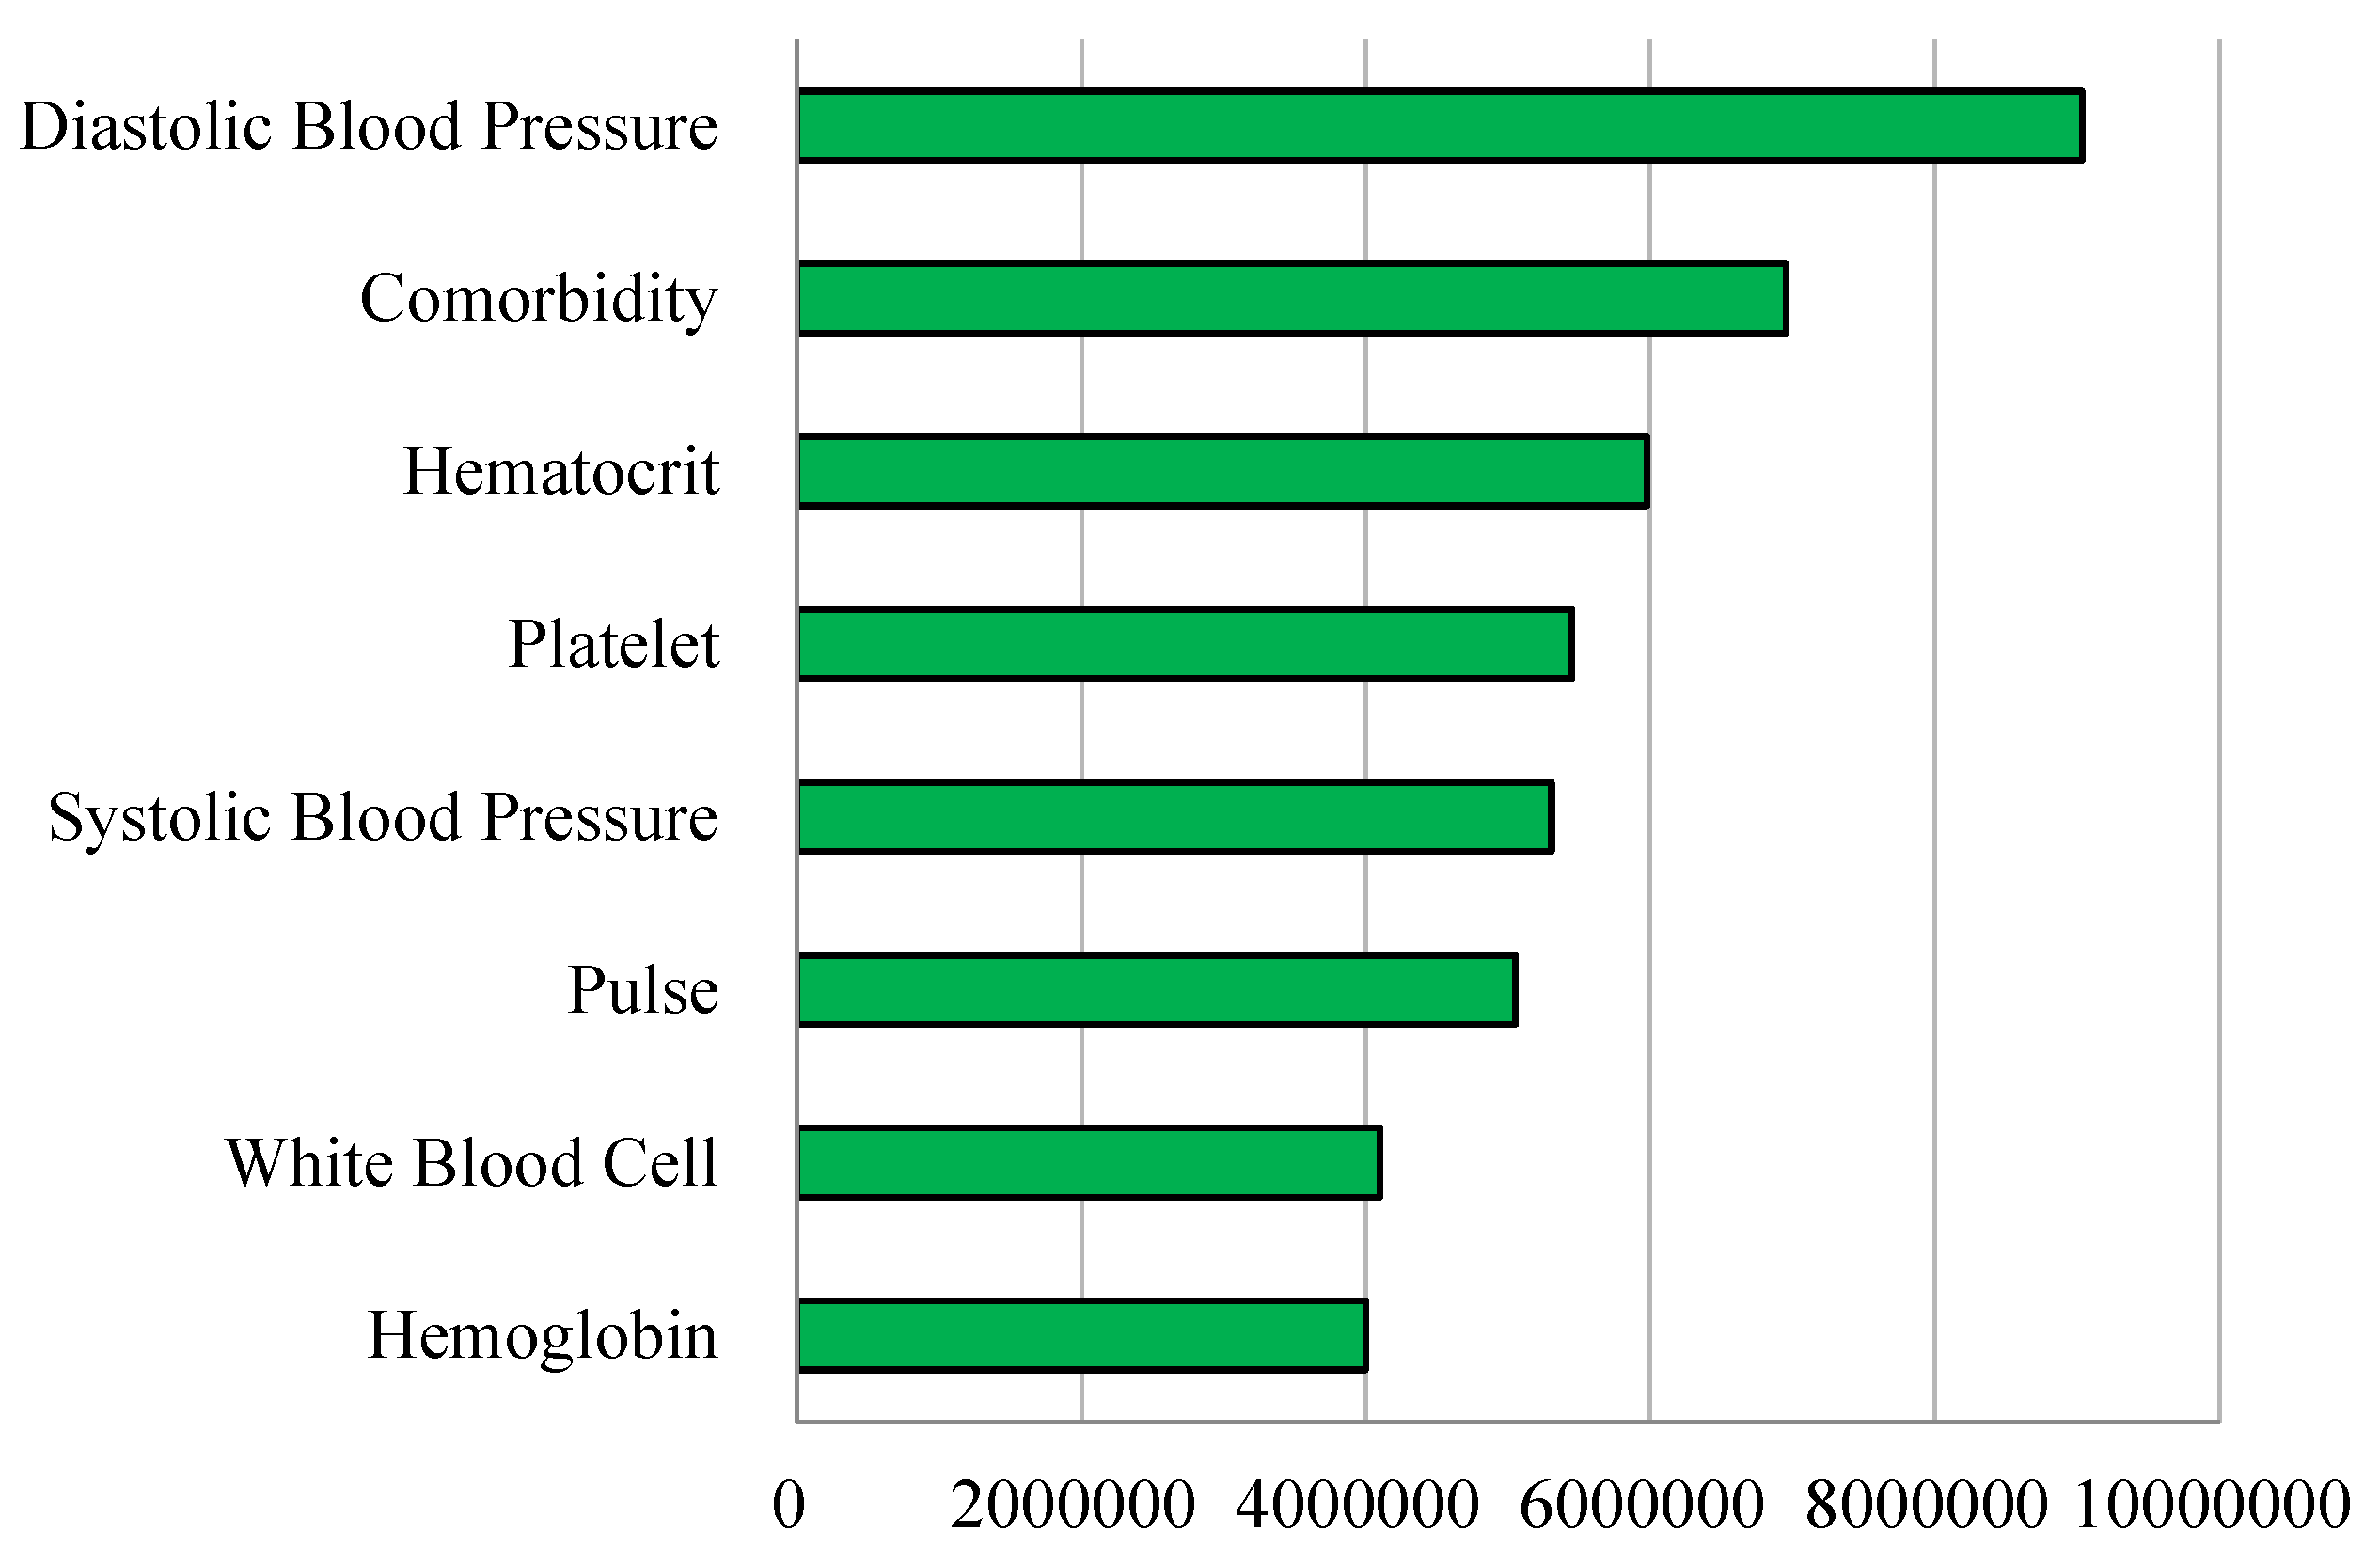
Figure 4.
Scatter Plot—Cost Total.
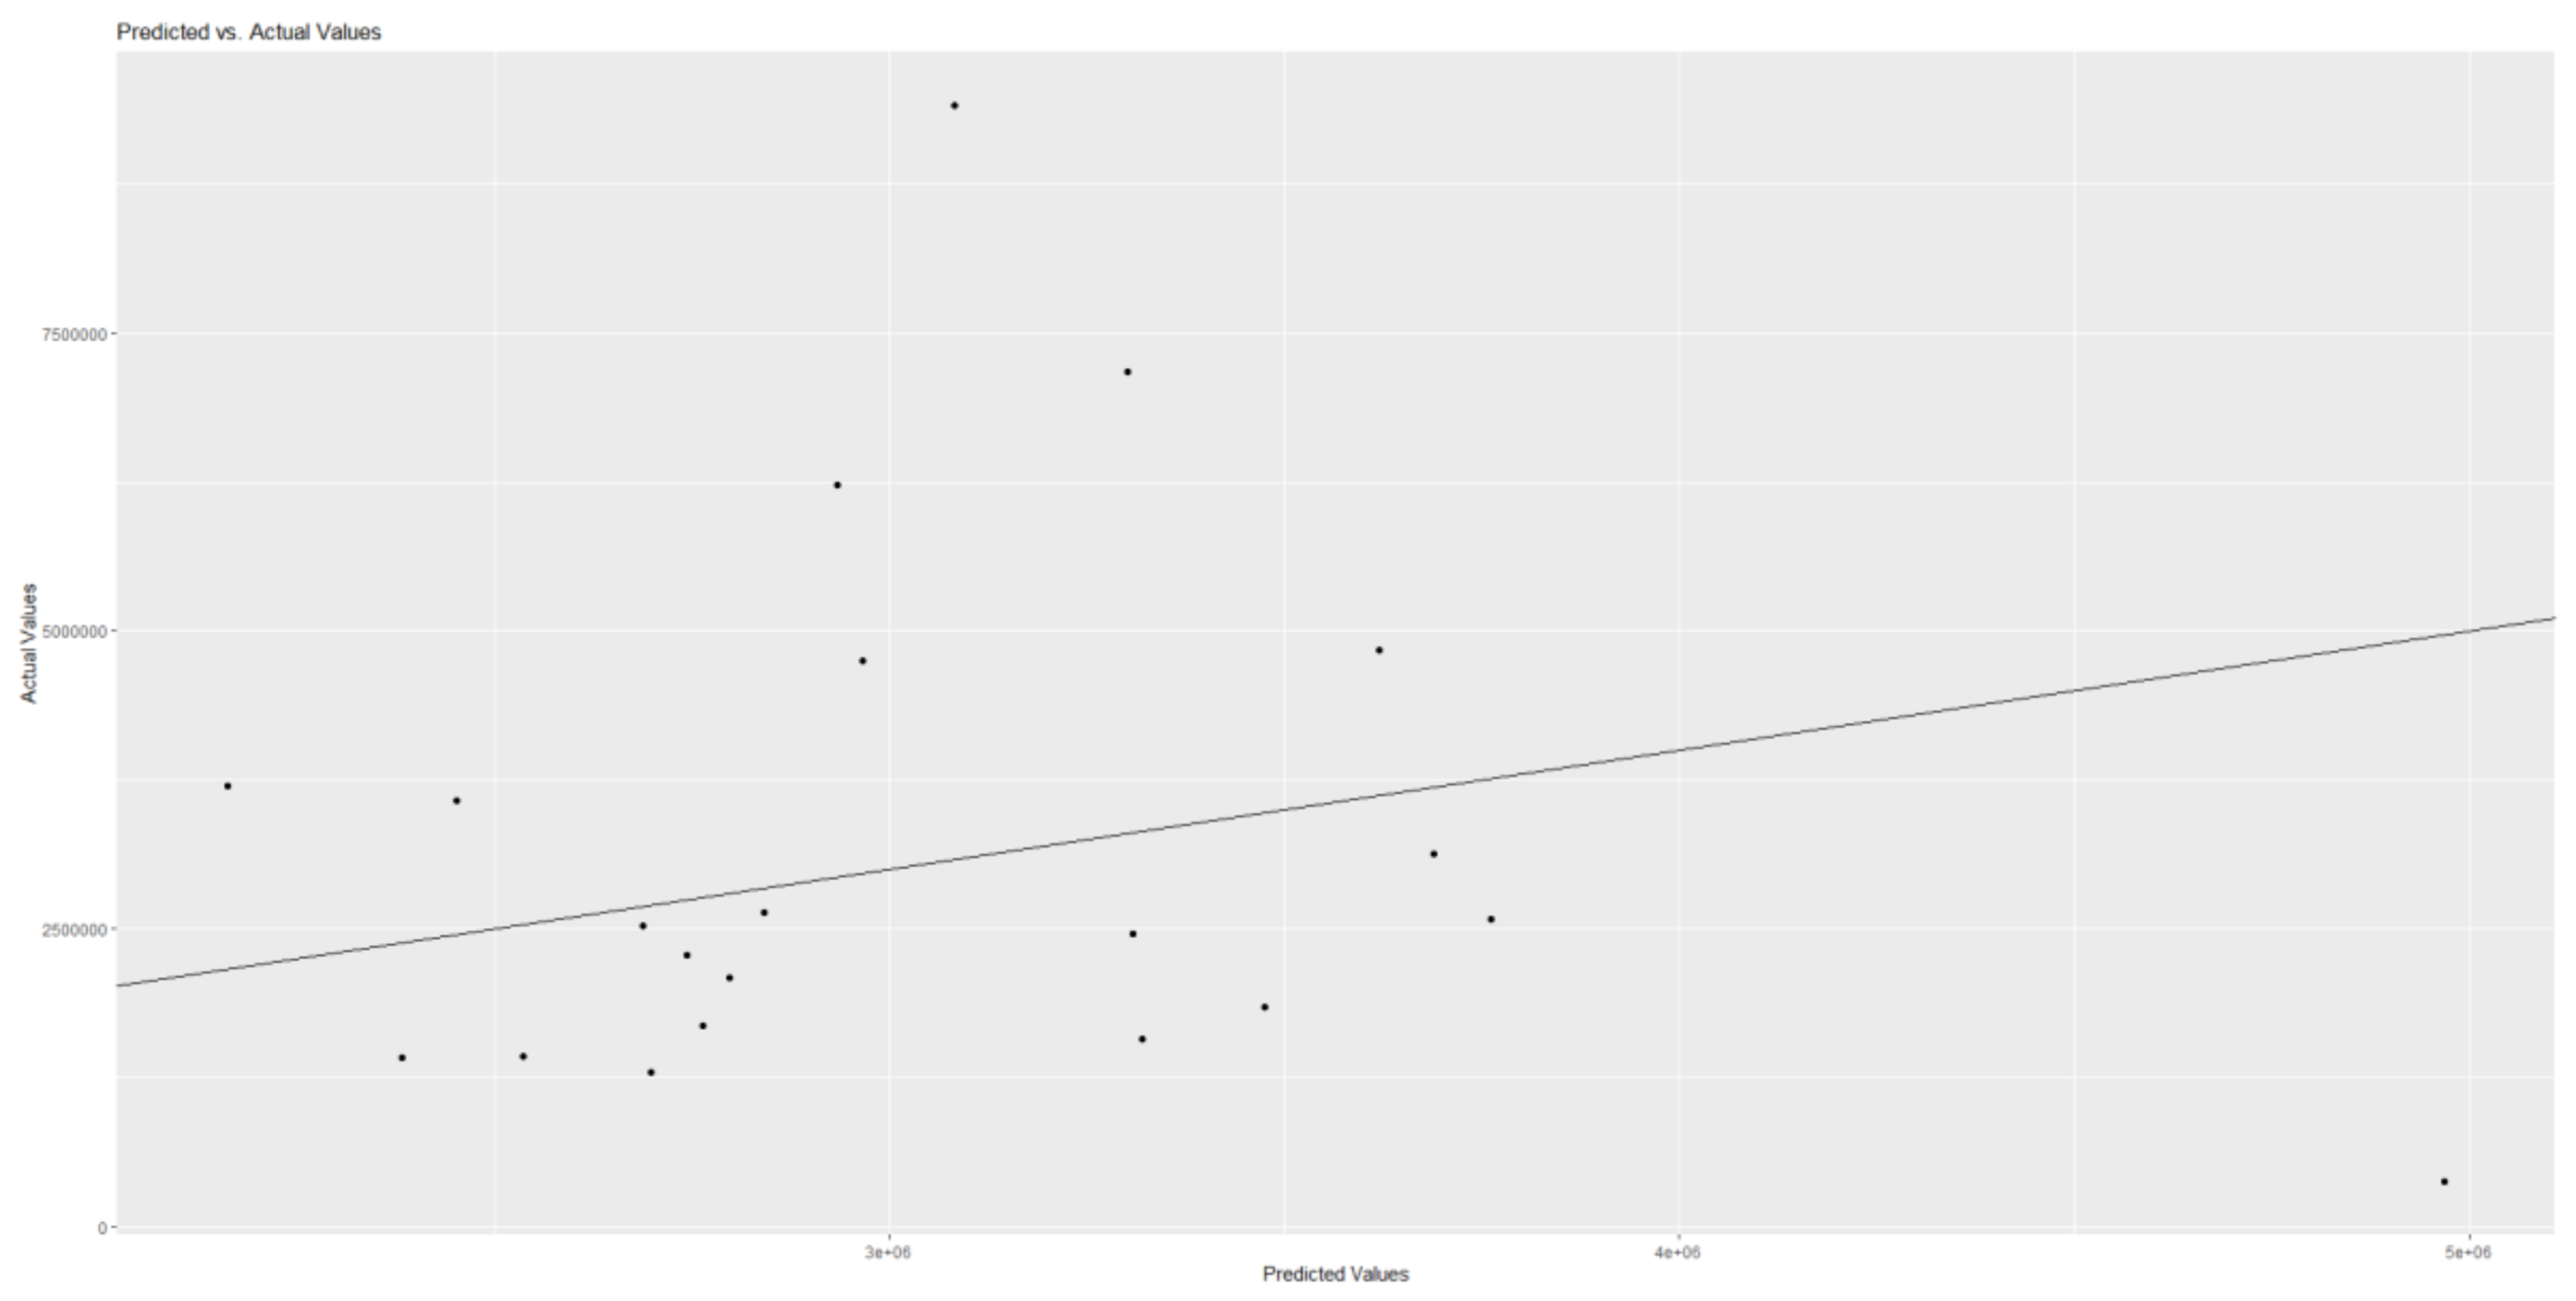
Figure 5.
Scatter Plot—Cost Uncovered.
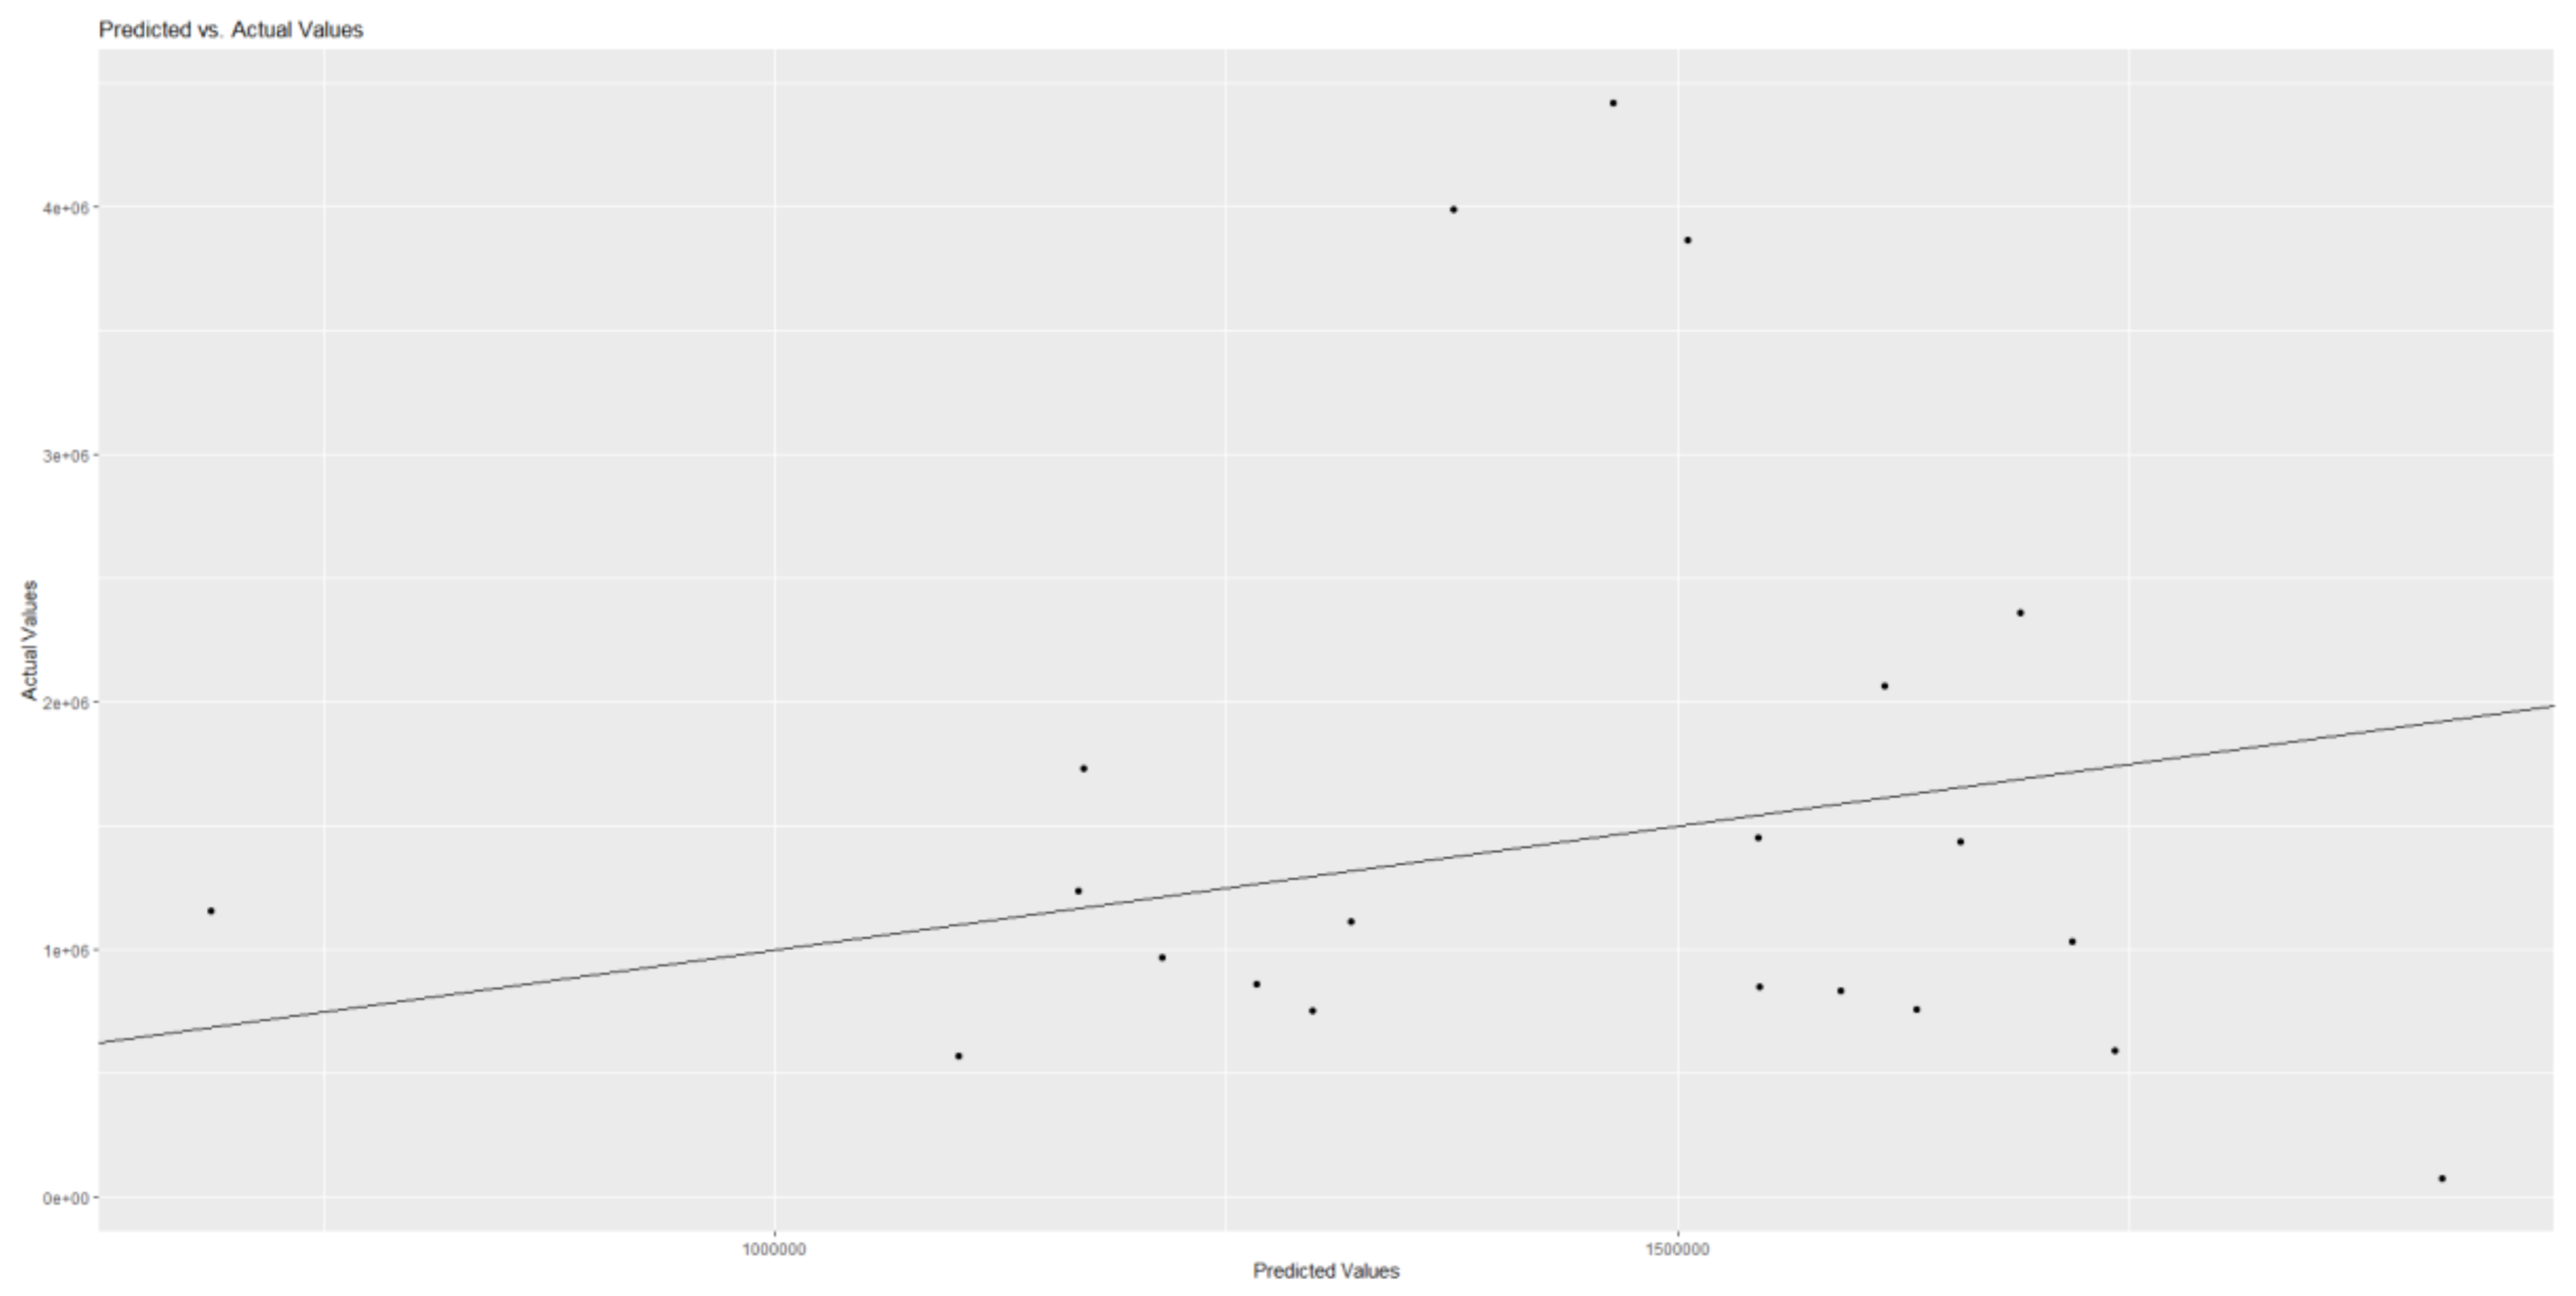

Table 1.
Descriptive Statistics.
| Variable | Categorical | Continuous | ||||||
|---|---|---|---|---|---|---|---|---|
| % | # | Min | Q1 | Median | Q3 | Max | IQR | |
| Rehospitalization | 82 | 68 | ||||||
| Rehospitalization July or Later | 59 | 49 | ||||||
| Reservation July or Later | 54 | 45 | ||||||
| Age | 15 | 28 | 36 | 44 | 49 | 16 | ||
| Marriage | 57 | 47 | ||||||
| Health Insurance | 90 | 75 | ||||||
| Employment | 76 | 63 | ||||||
| Major Disease | 24 | 20 | ||||||
| Comorbidity | 1 | 1 | ||||||
| Severity | 92 | 76 | ||||||
| Body Temperature (0 Low 1 High) | 1 | 2 | 2 | 2 | 3 | 0 | ||
| Pulse (per minute) | 4 | 33 | 41 | 49 | 62 | 16 | ||
| Respiration (per minute) | 3 | 5 | 7 | 7 | 7 | 2 | ||
| Systolic Blood Pressure (mm Hg) | 2 | 12 | 22 | 35 | 76 | 23 | ||
| Diastolic Blood Pressure (mm Hg) | 15 | 32 | 39 | 44 | 59 | 12 | ||
| Glucose (mg/dL) | 1 | 1 | 1 | 1 | 156 | 0 | ||
| RBC (million/microliter) | 2 | 4 | 4 | 4 | 5 | 0 | ||
| WBC (1000/microliter) | 2 | 5 | 6 | 8 | 21 | 3 | ||
| Hemoglobin (g/dL) | 9 | 12 | 13 | 13 | 15 | 1 | ||
| Hematocrit (%) | 26 | 37 | 39 | 40 | 46 | 3 | ||
| Platelet (1000/microliter) | 67 | 217 | 265 | 312 | 489 | 95 | ||
| Drinking | 39 | 32 | ||||||
| Smoking | 14 | 12 | ||||||
| Cancellation History | 4 | 3 | ||||||
| Emergency Hospitalization | 1 | 1 | ||||||
| Residence Seoul | 77 | 64 | ||||||
| Medical (1000 Won) Cost Total | 380 | 1893 | 2640 | 4057 | 13694 | 2164 | ||
| Medical (1000 Won) Cost Uncovered | 0 | 764 | 1195 | 1927 | 6058 | 1164 | ||
Note: RBC Red Blood Cell, WBC White Blood Cell, IQR Interquartile Range.
Table 2.
Model Performance—Retention.
| Accuracy | AUC | Specificity | Sensitivity | |
|---|---|---|---|---|
| Logistic Regression | 0.73 | 0.73 | 0.26 | 0.93 |
| Decision Tree | 0.82 | 0.82 | 0.81 | 0.83 |
| Naïve Bayes | 0.68 | 0.68 | 0.23 | 0.87 |
| Random Forest | 0.88 | 0.92 | 0.79 | 0.92 |
| Support Vector Machine | 0.71 | 0.71 | 0.10 | 0.96 |
| Artificial Neural Network | 0.71 | 0.50 | 0.00 | 1.00 |
Note: AUC Area Under the Curve.
Table 3.
Random Forest Outcomes—Retention.
| Retention | Variable Importance |
SHAP | |||
|---|---|---|---|---|---|
| Value | Rank | Min | Max | Sign | |
| Major Disease | 0.160 | 1 | -0.132 | 0.061 | 0.113 |
| Systolic Blood Pressure | 0.095 | 2 | -0.138 | 0.028 | 0.074 |
| Medical Cost Total | 0.094 | 3 | -0.123 | 0.026 | 0.100 |
| Platelet | 0.071 | 4 | -0.119 | 0.023 | 0.055 |
| Medical Cost Uncovered | 0.066 | 5 | -0.075 | 0.028 | 0.004 |
| Pulse | 0.049 | 6 | -0.177 | 0.014 | 0.039 |
| Age | 0.049 | 7 | -0.064 | 0.019 | 0.022 |
| White Blood Cell | 0.049 | 8 | -0.128 | 0.015 | -0.012 |
| Hematocrit | 0.048 | 9 | -0.106 | 0.012 | 0.036 |
| Rehospitalization July or Later | 0.045 | 10 | -0.119 | 0.016 | -0.024 |
| Reservation July or Later | 0.044 | 11 | -0.061 | 0.011 | -0.015 |
| Diastolic Blood Pressure | 0.044 | 12 | -0.062 | 0.008 | -0.103 |
| Severity | 0.030 | 13 | -0.111 | 0.011 | 0.088 |
| Employment | 0.027 | 14 | -0.019 | 0.013 | -0.014 |
| Hemoglobin | 0.026 | 15 | -0.039 | 0.014 | -0.019 |
| Red Blood Cell | 0.017 | 16 | -0.051 | 0.011 | 0.083 |
| Respiration | 0.012 | 17 | -0.011 | 0.013 | -0.004 |
| Body Temperature | 0.012 | 18 | -0.138 | 0.004 | 0.122 |
| Marriage | 0.010 | 19 | -0.008 | 0.006 | 0.016 |
| Residence Seoul | 0.010 | 20 | -0.011 | 0.012 | -0.048 |
| Cancellation History | 0.009 | 21 | -0.030 | 0.001 | 0.004 |
| Drinking | 0.007 | 22 | -0.009 | 0.007 | -0.020 |
| Glucose | 0.006 | 23 | -0.087 | 0.007 | 0.012 |
| Smoking | 0.006 | 24 | -0.013 | 0.002 | 0.005 |
| Health Insurance | 0.005 | 25 | -0.031 | 0.003 | 0.010 |
| Emergency Hospitalization | 0.004 | 26 | -0.063 | 0.002 | 0.069 |
| Comorbidity | 0.003 | 27 | -0.048 | 0.002 | 0.039 |
Note 1: VI Variable Importance, SHAP Shapley Additive Explanations. Note 2: Sign = Mean * 100.
Table 4.
Model Performance—Cost Total/Uncovered.
| RMSE | RMSE/IQR | |
|---|---|---|
| Medical Cost Total | ||
| Linear Regression | 2468 | 1.14 |
| Random Forest | 2283 | 1.05 |
| Medical Cost Uncovered | ||
| Linear Regression | 1570 | 1.35 |
| Random Forest | 1200 | 1.03 |
Note: RMSE Root Mean Square Error, IQR Interquartile Range.
Table 5.
Random Forest and Linear Regression Outcomes—Medical Cost Total.
| Medical Cost Total | VI | LR | ||
|---|---|---|---|---|
| Value/1000 | Rank | Coef/1000 | P-Value | |
| Comorbidity | 40047 | 1 | 7838 | 0.000 |
| Diastolic Blood Pressure | 22587 | 2 | 16 | 0.508 |
| Platelet | 22423 | 3 | 0 | 0.967 |
| Major Disease | 21558 | 4 | -250 | 0.000 |
| Hematocrit | 21298 | 5 | 652 | 0.001 |
| Hemoglobin | 16622 | 6 | -1795 | 0.001 |
| Emergency Hospitalization | 15974 | 7 | 4421 | 0.009 |
| Pulse | 13106 | 8 | 43 | 0.030 |
| Rehospitalization July or Later | 12338 | 9 | -8 | 0.380 |
| Systolic Blood Pressure | 11968 | 10 | 1 | 0.964 |
| Reservation July or Later | 11896 | 11 | -27 | 0.716 |
| Age | 11766 | 12 | 23 | 0.490 |
| Red Blood Cell | 10504 | 13 | -1241 | 0.025 |
| White Blood Cell | 10467 | 14 | -24 | 0.791 |
| Severity | 9818 | 15 | -1219 | 0.004 |
| Respiration | 7710 | 16 | 416 | 0.017 |
| Employment | 3012 | 17 | 20 | 0.876 |
| Residence Seoul | 2425 | 18 | 59 | 0.517 |
| Marriage | 1772 | 19 | 516 | 0.323 |
| Smoking | 1351 | 20 | 433 | 0.545 |
| Body Temperature | 1257 | 21 | -401 | 0.465 |
| Glucose | 1061 | 22 | 3 | 0.626 |
| Drinking | 960 | 23 | 651 | 0.193 |
| Health Insurance | 885 | 24 | -100 | 0.867 |
| Cancellation History | 807 | 25 | -937 | 0.446 |
Note: VI Random Forest Variable Importance, LR Linear Regression.
Table 6.
Random Forest and Linear Regression Outcomes—Medical Cost Uncovered.
| Medical Cost Uncovered | VI | LR | ||
|---|---|---|---|---|
| Value/1000 | Rank | Coef/1000 | P-Value | |
| Diastolic Blood Pressure | 9034 | 1 | 3 | 0.832 |
| Comorbidity | 6951 | 2 | 2519 | 0.015 |
| Hematocrit | 5974 | 3 | 572 | 0.000 |
| Platelet | 5446 | 4 | 0 | 0.860 |
| Systolic Blood Pressure | 5303 | 5 | 2 | 0.800 |
| Pulse | 5050 | 6 | 20 | 0.112 |
| White Blood Cell | 4096 | 7 | -26 | 0.648 |
| Hemoglobin | 3996 | 8 | -1372 | 0.000 |
| Severity | 3645 | 9 | -563 | 0.032 |
| Age | 3640 | 10 | -6 | 0.778 |
| Major Disease | 3237 | 11 | -112 | 0.008 |
| Reservation July or Later | 2622 | 12 | 42 | 0.381 |
| Health Insurance | 2559 | 13 | 485 | 0.214 |
| Rehospitalization July or Later | 2555 | 14 | -9 | 0.111 |
| Red Blood Cell | 2424 | 15 | -1051 | 0.004 |
| Respiration | 1952 | 16 | 286 | 0.012 |
| Marriage | 1927 | 17 | 796 | 0.022 |
| Employment | 1115 | 18 | 16 | 0.846 |
| Emergency Hospitalization | 696 | 19 | 607 | 0.561 |
| Residence Seoul | 628 | 20 | 63 | 0.291 |
| Drinking | 579 | 21 | 241 | 0.455 |
| Glucose | 494 | 22 | 1 | 0.893 |
| Body Temperature | 445 | 23 | -543 | 0.131 |
| Smoking | 372 | 24 | 82 | 0.860 |
| Cancellation History | 35 | 25 | -104 | 0.896 |
Note: VI Random Forest Variable Importance, LR Linear Regression.
Table 7.
Random Forest and Linear Regression Outcomes Summary.
| Variable | Retention | Cost Total | Cost Uncovered | ||||||
|---|---|---|---|---|---|---|---|---|---|
| Value | Rank | Sign | Value/1000 | Rank | Sign | Value/1000 | Rank | Sign | |
| Rehospitalization July or Later | 0.045 | 10 | 0.113 | 12338 | 9 | 7838 | 2555 | 14 | 3 |
| Reservation July or Later | 0.044 | 11 | 0.074 | 11896 | 11 | 16 | 2622 | 12 | 2519 |
| Age | 0.049 | 7 | 0.100 | 11766 | 12 | 0 | 3640 | 10 | 572 |
| Marriage | 0.010 | 19 | 0.055 | 1772 | 19 | -250 | 1927 | 17 | 0 |
| Health Insurance | 0.005 | 25 | 0.004 | 885 | 24 | 652 | 2559 | 13 | 2 |
| Employment | 0.027 | 14 | 0.039 | 3012 | 17 | -1795 | 1115 | 18 | 20 |
| Major Disease | 0.160 | 1 | 0.022 | 21558 | 4 | 4421 | 3237 | 11 | -26 |
| Comorbidity | 0.003 | 27 | -0.012 | 40047 | 1 | 43 | 6951 | 2 | -1372 |
| Severity | 0.030 | 13 | 0.036 | 9818 | 15 | -8 | 3645 | 9 | -563 |
| Body Temperature | 0.012 | 18 | -0.024 | 1257 | 21 | 1 | 445 | 23 | -6 |
| Pulse | 0.049 | 6 | -0.015 | 13106 | 8 | -27 | 5050 | 6 | -112 |
| Respiration | 0.012 | 17 | -0.103 | 7710 | 16 | 23 | 1952 | 16 | 42 |
| Systolic Blood Pressure | 0.095 | 2 | 0.088 | 11968 | 10 | -1241 | 5303 | 5 | 485 |
| Diastolic Blood Pressure | 0.044 | 12 | -0.014 | 22587 | 2 | -24 | 9034 | 1 | -9 |
| Glucose | 0.006 | 23 | -0.019 | 1061 | 22 | -1219 | 494 | 22 | -1051 |
| Red Blood Cell | 0.017 | 16 | 0.083 | 10504 | 13 | 416 | 2424 | 15 | 286 |
| White Blood Cell | 0.049 | 8 | -0.004 | 10467 | 14 | 20 | 4096 | 7 | 796 |
| Hemoglobin | 0.026 | 15 | 0.122 | 16622 | 6 | 59 | 3996 | 8 | 16 |
| Hematocrit | 0.048 | 9 | 0.016 | 21298 | 5 | 516 | 5974 | 3 | 607 |
| Platelet | 0.071 | 4 | -0.048 | 22423 | 3 | 433 | 5446 | 4 | 63 |
| Drinking | 0.007 | 22 | 0.004 | 960 | 23 | -401 | 579 | 21 | 241 |
| Smoking | 0.006 | 24 | -0.020 | 1351 | 20 | 3 | 372 | 24 | 1 |
| Cancellation History | 0.009 | 21 | 0.012 | 807 | 25 | 651 | 35 | 25 | -543 |
| Emergency Hospitalization | 0.004 | 26 | 0.005 | 15974 | 7 | -100 | 696 | 19 | 82 |
| Residence Seoul | 0.010 | 20 | 0.010 | 2425 | 18 | -937 | 628 | 20 | -104 |
| Medical Cost ‘total’ | 0.094 | 3 | 0.069 | ||||||
| Medical Cost ‘uncovered’ | 0.066 | 5 | 0.039 | ||||||
Disclaimer/Publisher’s Note: The statements, opinions and data contained in all publications are solely those of the individual author(s) and contributor(s) and not of MDPI and/or the editor(s). MDPI and/or the editor(s) disclaim responsibility for any injury to people or property resulting from any ideas, methods, instructions or products referred to in the content. |
© 2025 by the authors. Licensee MDPI, Basel, Switzerland. This article is an open access article distributed under the terms and conditions of the Creative Commons Attribution (CC BY) license (http://creativecommons.org/licenses/by/4.0/).
Copyright: This open access article is published under a Creative Commons CC BY 4.0 license, which permit the free download, distribution, and reuse, provided that the author and preprint are cited in any reuse.


