
Submitted:
22 July 2025
Posted:
23 July 2025
You are already at the latest version
Abstract
Estimating medical insurance costs accurately is essential for efficient and transparent health care with a focus on health system improvements and sustainability. The objective of this paper is to investigate and assess the predictive performance of numerous machine learning and deep learning models (including Linear Regression, Random Forest, & XGBoost) and a neural network (ANN) using demographic and health-related features to predict individual medical costs. The dataset was pre-processed, including feature engineering to improve the models’ performance. Of all the models, the ANN performed the best with an R-squared value of 0.88 on the test dataset and achieved a mean R-squared of 0.9886 over five-fold cross-validation. We also used SHAP (SHapley Additive exPlanations) to support an interpretable approach to the predictions from the ANN and found significant predictors of individual medical costs were age, BMI, and smoking status. The results demonstrate both accuracy and interpretability as investments in reliable and transparent AI applications for predicting health costs.
Keywords:
Health Insurance
; Machine Learning
; ANN
; SHAP
; Predictive Modeling
; Interpretability
1. Introduction
Accurate prediction of medical insurance costs is critical in the healthcare industry. Insurance companies depend on reliable forecasting to set fair premiums, manage financial risk, and ensure economic viability. At the same time, policyholders benefit from transparent, data-driven pricing that reflects their individual risk factors.
Historically, medical cost estimation has relied on actuarial science, which uses statistical methods to evaluate financial risks in insurance and finance. Traditional models such as generalized linear models (GLMs) have been commonly used, but they often fall short in capturing nonlinear interactions and high-dimensional dependencies between variables such as age, BMI, smoking habits, and pre-existing medical conditions.
With the rise of machine learning (ML) and artificial intelligence (AI), data-driven models now offer superior performance by learning complex relationships from historical data. These models not only improve prediction accuracy but also enable real-time analysis and adaptability. Supervised learning algorithms such as Linear Regression, Decision Trees, Random Forests, Extreme Gradient Boosting Machines (XGBoost), and Artificial Neural Networks (ANN) have proven especially effective in healthcare-related prediction tasks.
To enhance the interpretability of these advanced models, this research incorporates SHAP (SHapley Additive exPlanations), a game-theoretic approach that quantifies each feature’s contribution to the final prediction. This allows stakeholders to not only trust the model’s output but also understand why a certain prediction was made.
The purpose of this research is to perform a comparative study of multiple ML models for predicting individual health insurance costs, assess their predictive performance, and interpret the impact of different features using SHAP values. The insights gained from this study can aid in developing fair pricing strategies, increasing transparency in insurance decisions, and guiding health policy reforms.
2. Background
In today’s healthcare ecosystem, predicting health insurance costs has become increasingly critical for both insurance providers and policyholders. Insurance companies depend on accurate predictions to design fair and profitable premium structures, manage financial risks, and ensure operational sustainability. For policyholders, accurate estimations mean fair pricing, financial planning, and greater transparency. Traditionally, actuarial methods and linear statistical models were employed for such tasks, but they often fall short in capturing the complex, nonlinear relationships between various health, lifestyle, and demographic factors.
Advancements in artificial intelligence (AI) and machine learning (ML) have introduced powerful alternatives. These techniques can analyze large, real-world datasets and uncover hidden patterns that are not obvious in traditional models. Factors such as age, gender, body mass index (BMI), smoking status, number of dependents, and regional attributes play a key role in insurance cost estimation. Modern ML models are capable of not just improving predictive accuracy but also enabling real-time decision-making for insurers. As the demand for fairer and more personalized healthcare pricing grows, the use of intelligent, explainable models becomes more essential than ever.
3. Related Work
Numerous studies have explored machine learning approaches to predict healthcare costs with improved accuracy. For example, Orji, U., & Ukwandu, E . (2024) compared Extreme Gradient Boosting (XGBoost), Gradient Boosting Machine (GBM), and Random Forest models, revealing that XGBoost outperformed others in terms of predictive performance across key evaluation metrics. Similarly, Cenita, Asuncion, and Victoriano (2023) evaluated the effectiveness of Linear Regression, Gradient Boosting, and Support Vector Machine models and found Gradient Boosting most effective in capturing cost-driving patterns. Additionally, Bau, Y.-T., & Md Hanif, S . A. (2024) assessed Linear Regression, Ridge Regression, XGBoost, and Random Forest, where Random Forest consistently achieved higher scores across multiple evaluation criteria, including MAE and R². These findings highlight the importance of comparing both traditional and ensemble methods when tackling health insurance cost prediction.
While existing studies have demonstrated the effectiveness of individual models such as XGBoost, Gradient Boosting, and Random Forest in predicting health-related costs, they often fall short in offering a comprehensive comparison across diverse model types, especially when including deep learning methods. Additionally, many prior works focus solely on predictive performance and neglect interpretability, which is a crucial requirement in domains like healthcare and insurance where transparency is essential for decision-making by both insurers and stakeholders.
Moreover, although tools like SHAP have recently been used in some studies for explaining model outputs, their application has largely been restricted to traditional tree-based models. The interpretability of deep learning models, particularly Artificial Neural Networks (ANN), remains underexplored in this context. Also, many studies rely on a single performance metric or simple train-test splits, limiting their generalizability and robustness.
To address these limitations, this study adopts a multi-model comparative approach involving Linear Regression, XGBoost, Random Forest, and ANN models to predict health insurance costs. Beyond performance comparison, it employs SHAP values to interpret model behaviour and identify key contributing features, enhancing transparency. K-fold cross-validation is integrated to ensure consistent and reliable evaluation across multiple metrics, including MAE, RMSE, R², and MAPE. This holistic approach enables a more accurate, interpretable, and practical solution to insurance cost estimation problems.
4. Methodology
This section outlines the structured process used to develop and evaluate predictive models for estimating medical insurance costs. The approach is divided into several phases, including data collection, preprocessing, exploratory data analysis (EDA), model building, performance evaluation, and interpretability assessment. The entire workflow is summarized in a flowchart (see Figure 1), which visually represents each step in the process.
4.1. Dataset Source
The dataset used in this study was obtained from Kaggle, an open-access platform for data science resources. It is a publicly available dataset that reflects real-world scenarios and has been widely used for predictive modelling tasks related to healthcare cost estimation. The dataset consists of 1,338 records and contains six independent features along with one target variable, totally seven columns. It was further processed using data preprocessing, exploratory data analysis (EDA), and feature engineering techniques to prepare it for model development and evaluation.
4.2. Dataset Description
The dataset contains 1,338 records and includes multiple independent features along with one dependent (target) variable. The features are of two data types: numerical and categorical. The attributes include age, sex, BMI, number of children, smoking status, and region, while the target variable is medical insurance charges. These features are used to predict how much a person might be charged for medical insurance.

Table 1.
Dataset Description.
| Feature Name | Datatype | Description |
| age | Numerical | Age of the person |
| sex | Categorical | Gender (male or female) |
| bmi | Numerical | Body Mass Index -a measure of body fat |
| children | Numerical | Number of children covered by the insurance |
| smoker | Categorical | Whether the person smokes (yes or no) |
| region | Categorical | Area of residence in the U.S. |
| charges | Numerical | Medical insurance cost (target variable) |
4.3. Data Preprocessing
Data preprocessing is a critical step in the data science and machine learning pipeline. It involves preparing raw data through techniques such as handling missing values, removing duplicate records, and transforming data into a suitable format for model training. Since most machine learning algorithms require numerical input in array format, preprocessing includes encoding categorical variables and applying binning techniques to convert and simplify complex features. These transformations ensure that the dataset is clean, consistent, and ready for effective model learning and prediction.
Initially, the dataset contained no missing values. However, after binning the age and bmi columns into categorical groups, the newly created age_group column introduced 69 missing values. These null values resulted from edge cases in the binning logic, likely due to out-of-range or unclassified values. To preserve data quality and ensure unbiased model training, the affected records were excluded from further analysis.
In addition to binning, categorical feature encoding was performed to convert text-based variables into a format suitable for machine learning models. The sex, smoker, and region columns were first converted to string format using the astype(str) function to ensure compatibility with encoding operations. Subsequently, one-hot encoding was applied to transform these categorical features into binary indicator variables, allowing machine learning algorithms to interpret them effectively. This process generated new columns such as sex_male (indicating male individuals), smoker_yes (indicating smokers), and region-specific flags: region_northwest, region_southeast, and region_southwest. The region_northeast category was intentionally excluded to serve as a reference group and avoid multicollinearity. These transformations ensured that the categorical data could be seamlessly integrated into numerical machine learning workflows without introducing bias or misleading assumptions. While exploring the dataset, visual tools like boxplots revealed the presence of some outliers, particularly in features like BMI and medical charges. After careful consideration, these outliers were not removed, as they likely represent real-world, high-expense medical cases. Since such values can carry important insights in the context of insurance cost prediction, keeping them was essential to maintain the integrity and representativeness of the data.
These preprocessing steps ensured that the dataset was clean, well-structured, and fully numeric and making it suitable for effective model training.
4.4. Feature Engineering
A crucial step in getting data ready for machine learning is feature engineering. It involves creating new features from existing data to help models better understand patterns and make more accurate predictions. In this project, several meaningful features were engineered to enhance the model's ability to estimate health insurance costs.
One such feature was is_parent, which was created by analysing the children column. People who had one or more children were marked as parents (1), and those without children were marked as non-parents (0). This helped the model consider how having dependents might affect insurance expenses.
Another feature, called risk_score, was developed by combining factors like BMI, smoking status, and parental status. This score aimed to summarize a person’s health risk in a single number, making it easier for the model to identify those likely to incur higher medical costs.
We also added a feature named region_bmi_avg_diff, which measured how much a person's BMI differed from the average BMI in their region. This provided context about whether someone’s BMI was unusually high or low compared to others in the same area.The categorical variables were transformed for age_group and bmi_category, so the final data set contained 17 input features. The resulting data prepared for model training and evaluation included these 17 inputs plus the target variable, charges.
By introducing these features, we gave the model more relevant and insightful data to learn from, helping it makes better and more informed predictions.
The final set of engineered features, which form the basis for model training and evaluation, are detailed in Table 2 on the following page. This table outlines each feature's name, type, and a brief description of its role or transformation applied during preprocessing and engineering. Presenting this overview helps to clarify the structure of the dataset used in downstream modeling and supports the reproducibility of the study.
4.5. Exploratory Data Analysis (EDA)
Exploratory Data Analysis (EDA) serves as an essential first step in understanding the dataset before applying any machine learning models. It involves using statistical techniques and graphical representations to examine the structure, distribution, and relationships within the data. The aim is to identify meaningful patterns, spot unusual values or outliers, and explore how different features interact with each other. By providing these early insights, EDA helps guide decisions on feature selection, data transformation, and modeling strategies, ultimately contributing to the development of more accurate and interpretable predictive models.
4.5.1. Distribution of Charges
To examine the distribution of insurance charges, a histogram was plotted (Figure 2). The resulting plot reveals a right-skewed distribution, indicating a higher concentration of policyholders with lower insurance charges. This skewness suggests that the majority of individuals in the dataset are associated with relatively modest healthcare expenses, while a smaller subset incurs significantly higher costs.
4.5.2. Impact of Categorical Features on Insurance Charges
To gain insights into how categorical features affect insurance charges, a series of boxplots were created. These visualizations explore the relationships between charges and key categorical variables, including age group, BMI category, region, sex, and smoking status. This helps identify trends and disparities across different subgroups.
Charges by Age Group:
Boxplot (Figure 3) showing the distribution of insurance charges across different age groups. The chart indicates that charges generally increase with age, reflecting greater health risks and insurance costs for older individuals.
Charges by BMI Category:
This boxplot (Figure 4) illustrates the distribution of insurance charges across BMI categories. Individuals classified as obese tend to have higher median charges compared to those in the normal, overweight, or underweight groups. The variability in charges is also more pronounced in the obese group, indicating potential risk factors associated with higher BMI.
Charges by Region:
This boxplot (Figure 5) illustrates the distribution of insurance charges across the four U.S. regions in the dataset. While all regions show a similar central tendency, the Southeast region exhibits a higher concentration of extreme values (outliers), suggesting greater variability in insurance costs in that area.
Charges by Sex:
Boxplot (Figure 6) comparing insurance charges across sexes. The distribution appears relatively similar for males and females, with slightly higher variability observed among male policyholders.
Charges by Smoking Status:
This boxplot (Figure 7) illustrates a significant disparity in insurance charges between smokers and non-smokers. Individuals who reported smoking tend to incur substantially higher medical expenses, as indicated by the higher median and wider interquartile range. This suggests that smoking status is a critical factor influencing healthcare costs, likely due to the increased health risks associated with smoking-related conditions.
Note on Outliers:
During the exploratory analysis, several outliers were observed in the distribution of insurance charges, particularly among high-cost individuals across different categorical groups. While these data points fall outside the typical range, they were not removed from the dataset. This decision was made to preserve the integrity of the data and maintain real-world variability, especially considering that high insurance charges may genuinely result from critical health conditions, smoking habits, or other risk factors. Excluding them could potentially bias the model and reduce its ability to generalize well to actual scenarios where such cases are common.
The exploratory data analysis offered valuable validation of the engineered features and revealed significant patterns within the data. Key insights, such as the disproportionate charges associated with smokers, the influence of BMI categories, and regional disparities in costs, reaffirmed the importance of including these variables in the predictive models. Although feature engineering was performed prior to EDA, the analysis confirmed the quality and relevance of the transformed features, supporting the integrity of the dataset. Additionally, understanding the distribution of charges and presence of outliers helped guide evaluation expectations in the subsequent modelling phase.
4.6. Model Building and Evaluation
4.6.1. Model Creation and Implementation
Before model training, the dataset was split into two subsets: 80% for training and 20% for testing. This split ensured that the models could learn from one portion of the data and be evaluated on unseen data to assess generalization performance.
To predict medical insurance charges, four different models were developed, representing a range of learning strategies:
A. Linear Regression:
Linear Regression is a basic yet powerful technique used to estimate the relationship between one target variable and one or more predictors by fitting a straight line that minimizes prediction error. Its simplicity, speed, and interpretability make it a strong baseline model for evaluating other machine learning algorithms in structured datasets.
B. Random Forest:
Random Forest is a supervised machine learning algorithm applicable to both classification and regression problems. It employs an ensemble approach by constructing multiple decision trees using different subsets of the dataset and then aggregating their predictions. This collective strategy enhances the model’s accuracy and robustness. By relying on the consensus of many trees rather than a single model, Random Forest reduces the impact of variance and mitigates the effects of noise or bias in the data.
C. Extreme Gradient Boosting (XGBoost) Regression Model:
Extreme Gradient Boosting (XGBoost) is a highly efficient and scalable ensemble learning algorithm based on the gradient boosting framework. It constructs decision trees in a sequential manner, with each new tree attempting to correct the residual errors of the previous ones. XGBoost enhances this process through techniques such as regularization (L1 and L2), column subsampling, and parallel computation, which collectively contribute to improved model accuracy and reduced risk of overfitting.
In this study, XGBoost was employed as one of the predictive models for estimating insurance charges. To optimize performance, key hyperparameters including the number of estimators, learning rate, tree depth, and subsample ratio were tuned using grid search strategies. To ensure robust and reliable evaluation, 5-Fold Cross-Validation was applied on the tuned model. This process allowed the model to be trained and validated on multiple subsets of the data, thereby enhancing its generalization and reducing the likelihood of overfitting to any specific partition of the dataset.
D. Deep Learning Model: Artificial Neural Network (ANN):
An Artificial Neural Network (ANN) was developed using the Keras Sequential API to perform regression analysis for predicting medical insurance charges. The network architecture included an input layer with 64 neurons, followed by a hidden layer with 32 neurons utilizing the ReLU activation function. The output layer contained a single neuron, designed to output continuous insurance charge feature.
The model was compiled with the Adam optimizer, and Mean Squared Error (MSE) was used as the loss function to measure prediction accuracy during training. This deep learning model was trained on the processed dataset to learn complex, non-linear relationships between the input features and target variable.
To conclude, a range of models were implemented with appropriate configurations to predict insurance charges. This diverse setup lays the groundwork for evaluating and comparing their performance in the following section.
The Python Programming Language was used to implement the whole workflow. The following libraries and tools supported different stages of the project:
- Pandas and NumPy were utilized for structured data processing and numerical computations.
- Matplotlib and Seaborn were employed to generate visual representations for understanding data distributions and patterns.
- Scikit-learn provided the framework for building and evaluating machine learning models such as Linear Regression and Random Forest.
- XGBoost was used for implementing an advanced gradient boosting regression model.
- TensorFlow and Keras (Sequential) facilitated the development and training of the Artificial Neural Network.
- SHAP for model interpretability
- Jupyter Notebook served as the interactive coding and documentation environment for the entire project.
4.6.2. Model Evaluation
This part details the metrics used to evaluate model performance across all implemented algorithms. Since the objective was to predict continuous insurance charges, regression evaluation metrics were applied. The following metrics were considered:
Mean Absolute Error (MAE):
MAE reflects the mean of the absolute gaps between predicted outcomes and true values. It gives a direct sense of how far predictions typically are from actual data points.
Root Mean Squared Error (RMSE):
Emphasizes larger errors by squaring the differences, providing insight into the model's sensitivity to high variance in predictions.
R² Score:
Indicates how much of the variance in the target variable the model explains. A higher score implies a better fit of the model.
Mean Absolute Percentage Error (MAPE):
Provides an intuitive means to gauge accuracy relative to scale by expressing prediction error as a percentage of the actual values.
Where:
n represents the total quantity of data points included in the error computation
= actual value for the i-th data point
= predicted value for the i-th data point
= the mean of actual values
In summary, these metrics give a good basis to assess and compare models with respect to accuracy, error magnitude, and explanatory power.
4.7. Explainable AI (XAi)
Simply relying on model accuracy scores does not reveal which factors most influence the predictions. To bridge this gap, the study incorporated SHAP-based Explainable AI techniques, which make it possible to pinpoint the features that have the greatest impact on predicting medical insurance costs.
5. Results & Discussion
In this section, we will assess the various metric scores of the models evaluated in the study. By analyzing these scores, we can uncover important insights. The metrics utilized are MAE, RMSE, R2, and MAPE.
Table 3 compares four prediction models for estimating medical insurance costs: ANN, XGBoost, Random Forest, and Linear Regression. Each model was evaluated using the following four performance metrics: Mean Absolute Error (MAE), Root Mean Squared Error (RMSE), R-squared (R²), and Mean Absolute Percentage Error (MAPE).
Out of all the models, the ANN performed the best overall, showing excellent predictive power and data fit with the lowest RMSE (4680.82) and the highest R2 score (0.88). It still produced accurate results despite having a slightly higher MAPE (37.99%). Nonetheless, XGBoost demonstrated a consistent relative prediction accuracy with the lowest MAPE (29.44%). With R2 values of 0.86 and 0.85, respectively, Random Forest and Linear Regression both performed well despite having somewhat larger errors.
The argument for selecting models based on multiple performance metrics rather than just one is supported by the comparison in Table 3, which demonstrates how each algorithm balances prediction error and model accuracy differently.
Five-fold cross-validation (Table 4) was used to evaluate each model's consistency and robustness, and the mean R2 score was computed as a measure of predictive performance. With a mean R2 of 0.84, the Random Forest and Linear Regression models both showed mediocre effectiveness in capturing variation in insurance premiums. With an R2 of 0.86, the XGBoost model marginally beat them, demonstrating its superior capacity to represent intricate relationships in the data. With a mean R2 of 0.9886, the Artificial Neural Network (ANN) considerably outperformed the others, demonstrating its outstanding prediction ability and efficiency in identifying nonlinear patterns in the dataset.
Key Findings:
- In comparison to other models, the ANN model boasts better accuracy, with its maximum R² value at 0.88, and minimum RMSE at 4680.82 in terms of predictive accuracy. This supports the design's intentions of capturing complex relationships found in the data.
- XGBoost and Random Forest performed evenly, with R² values near 0.86, good MAE and MAPE scores, and reasonable capability to learn non-linear trends.
- The Linear Regression model underperformed, with a consistent predictive accuracy, but had higher MAE and MAPE scores versus random forest and XG. It is simplistic and interpretable, but suggests that linear assumptions were not sufficient to model medical insurance charges accurately.
- Cross-validation scores show that the models are consistent and have the ability to generalize. The mean R² of 0.9886 from 5-fold validation was the highest for ANN, and suggests it can be robust.
- Models with ensemble or deep learning architectures had significantly more impact from the feature engineering approaches in the pre-processing phase, particularly binning and encoding.
6. Model Interpretation
In addition to being able to achieve a high level of predictive accuracy, knowing why a model makes certain predictions is extremely important, particularly in healthcare, where you need to know the rationale behind your recommendations. To address this issue, we employed the SHAP (SHapley Additive exPlanations) as an Explainable AI (XAI) method to interpret the predictions made by the best model, the Artificial Neural Network (ANN) in our case.
SHAP is valuable for detailing how each input feature contributes to the output of the model by giving importance values to the individual features, which are based on cooperative game theory. Moreover, the SHAP algorithm reveals the magnitude of each feature's significance and the direction in which each one impacts predicted insurance charges.
The bar plot shown in Figure 8 depicts the SHAP summary plot for the ANN model that illustrates the top features that contributed the most to insurance charge predictions. Based on the plot, smoker_yes, risk_score, and bmi_category_Obese had the most average impact on model output, meaning that they are associated with higher medical costs of insurance. Additionally, this approach to interpretability increases transparency of the model and increases the user's trust in AI-based decisions in sensitive applications like healthcare.
7. Conclusion
This research study focused on designing and testing four different machine learning and deep learning methods (Linear Regression, Random Forest, XGBoost, and an Artificial Neural Network (ANN)) to make predictions for individual medical insurance charges. Data was involved in extensive data preprocessing, feature engineering, and exploratory data analysis to provide the most fundamental insights from the data.The ANN had the best performance when compared to the rest of the models, achieving an R² score of 0.88 and the lowest root mean squared error (RMSE). This indicates that an ANN is capable of modelling complex nonlinear relationships in terms of predicting the cost of healthcare. In addition, the analysis of model interpretability was performed using SHAP (SHapley Additive exPlans) to understand the features driving model predictions. The SHAP analysis identified that smoking status, age, and BMI were the most important features for the ANN model. The fact that many of these features were made through feature engineering reinforces the value of using domain-informed feature transformation to help with the performance and interpretability of machine learning models
8. Future Work
- Expand and Diversify the Dataset: Include real-world, large-scale insurance records along with more personal and health-related details to improve model accuracy and generalization.
- Advanced Feature Engineering: Since key features that affect the ANN model were created through feature engineering, it's important to explore meaningful and clear feature construction to improve performance and explainability.
- Model Deployment: Create a user-friendly application, either web or mobile, that allows users to enter personal data and get real-time insurance cost predictions.
- Improve Model Interpretability: Use Explainable AI techniques, including SHAP interaction values or DeepSHAP, to gain a better understanding of complex feature relationships in deep learning models.
- Fairness and Bias Assessment: Review model predictions across different demographic groups to ensure fair predictions and reduce potential bias in real-world applications.
Acknowledgments
The author acknowledges the use of AI assistance for improving grammar, structure, and clarity in the writing of this paper. All research, analysis, and conclusions were independently conducted by the author.
References
- Orji, U., & Ukwandu, E. (2024). Machine learning for an explainable cost prediction of medical insurance. Machine Learning with Applications, 15, 100516. [CrossRef]
- Kshirsagar, R., Hsu, L.-Y., Chaturvedi, V., Greenberg, C. H., McClelland, M., Hasson, H., et al. (2021). Accurate and interpretable machine learning for transparent pricing of health insurance plans. Proceedings of the AAAI Conference on Artificial Intelligence. https://ojs.aaai.org/index.php/AAAI/article/view/17351.
- Cenita, J. A. S. , Asuncion, P. R. F., & Victoriano, J. M. (2023). Performance evaluation of regression models in predicting the cost of medical insurance. International Journal of Computing Sciences Research 7, 2052–2065. [CrossRef]
- Patra, G. K. , Kuraku, C., Konkimalla, S., Boddapati, V. N., Sarisa, M., & Reddy, M. S. (2024). An analysis and prediction of health insurance costs using machine learning-based regressor techniques. Journal of Data Analysis and Information Processing, 12. [CrossRef]
- Olaoye, G. (2025). Comparative study of machine learning models for predicting health insurance costs. SSRN Electronic Journal. https://papers.ssrn.com/sol3/papers.cfm?abstract_id=5130267.
- Bau, Y.-T., & Md Hanif, S. A. (2024). Comparative analysis of machine learning algorithms for health insurance pricing. International Journal on Informatics Visualization, 8(1), 481–491. http://www.joiv.org/index.php/joiv/article/view/2282.
- Balakrishnan, S. G., Abdulla, N., Krishnan, H. S., Gokul, V., & Amizhthan, S. P. (2024). Medical insurance cost analysis and prediction using extreme gradient boosting algorithm. ShodhKosh: Journal of Visual and Performing Arts, 5(6), 1816–1822. [CrossRef]
- Jyothsna, C. , Sravanth, A. E., Srinivas, K., Kumar, A. T., Bhargavi, B., & Kumar, J. N. V. R. S. (2022). Health insurance premium prediction using XGBoost regressor. Proceedings of the IEEE International Conference on Artificial Intelligence and Computer Applications (ICAAIC). [CrossRef]
- Chintala, S. K. (2022). AI in public health: Modelling disease spread and management strategies. NeuroQuantology, 20(8), 10830–10838. [CrossRef]
- Lundberg, S. M. , & Lee, S.-I. (2017). A unified approach to interpreting model predictions. In Advances in Neural Information Processing Systems, 30. Retrieved from https://proceedings.neurips.cc/paper_files/paper/2017/file/8a20a8621978632d76c43dfd28b67767-Paper.pdf.
- Chen, T., & Guestrin, C. (2016). XGBoost: A scalable tree boosting system. In Proceedings of the 22nd ACM SIGKDD International Conference on Knowledge Discovery and Data Mining (pp. 785–794). [CrossRef]
- Breiman, L. (2001). Random forests. Machine Learning, 45. [CrossRef]
- Chollet, F. (2015). Keras: The Python deep learning library. Retrieved from https://keras.io.
- Scikit-learn Developers. (2011). Scikit-learn: Machine learning in Python. Journal of Machine Learning Research, 12, 2825–2830. Retrieved from https://scikit-learn.org.
- Nguyen, A. D. , & Nguyen, T. (2020). Health insurance cost prediction using machine learning. International Journal of Advanced Computer Science and Applications 11(6), 491–496. [CrossRef]
Figure 1.
Machine Learning Pipeline used for insurance cost prediction.
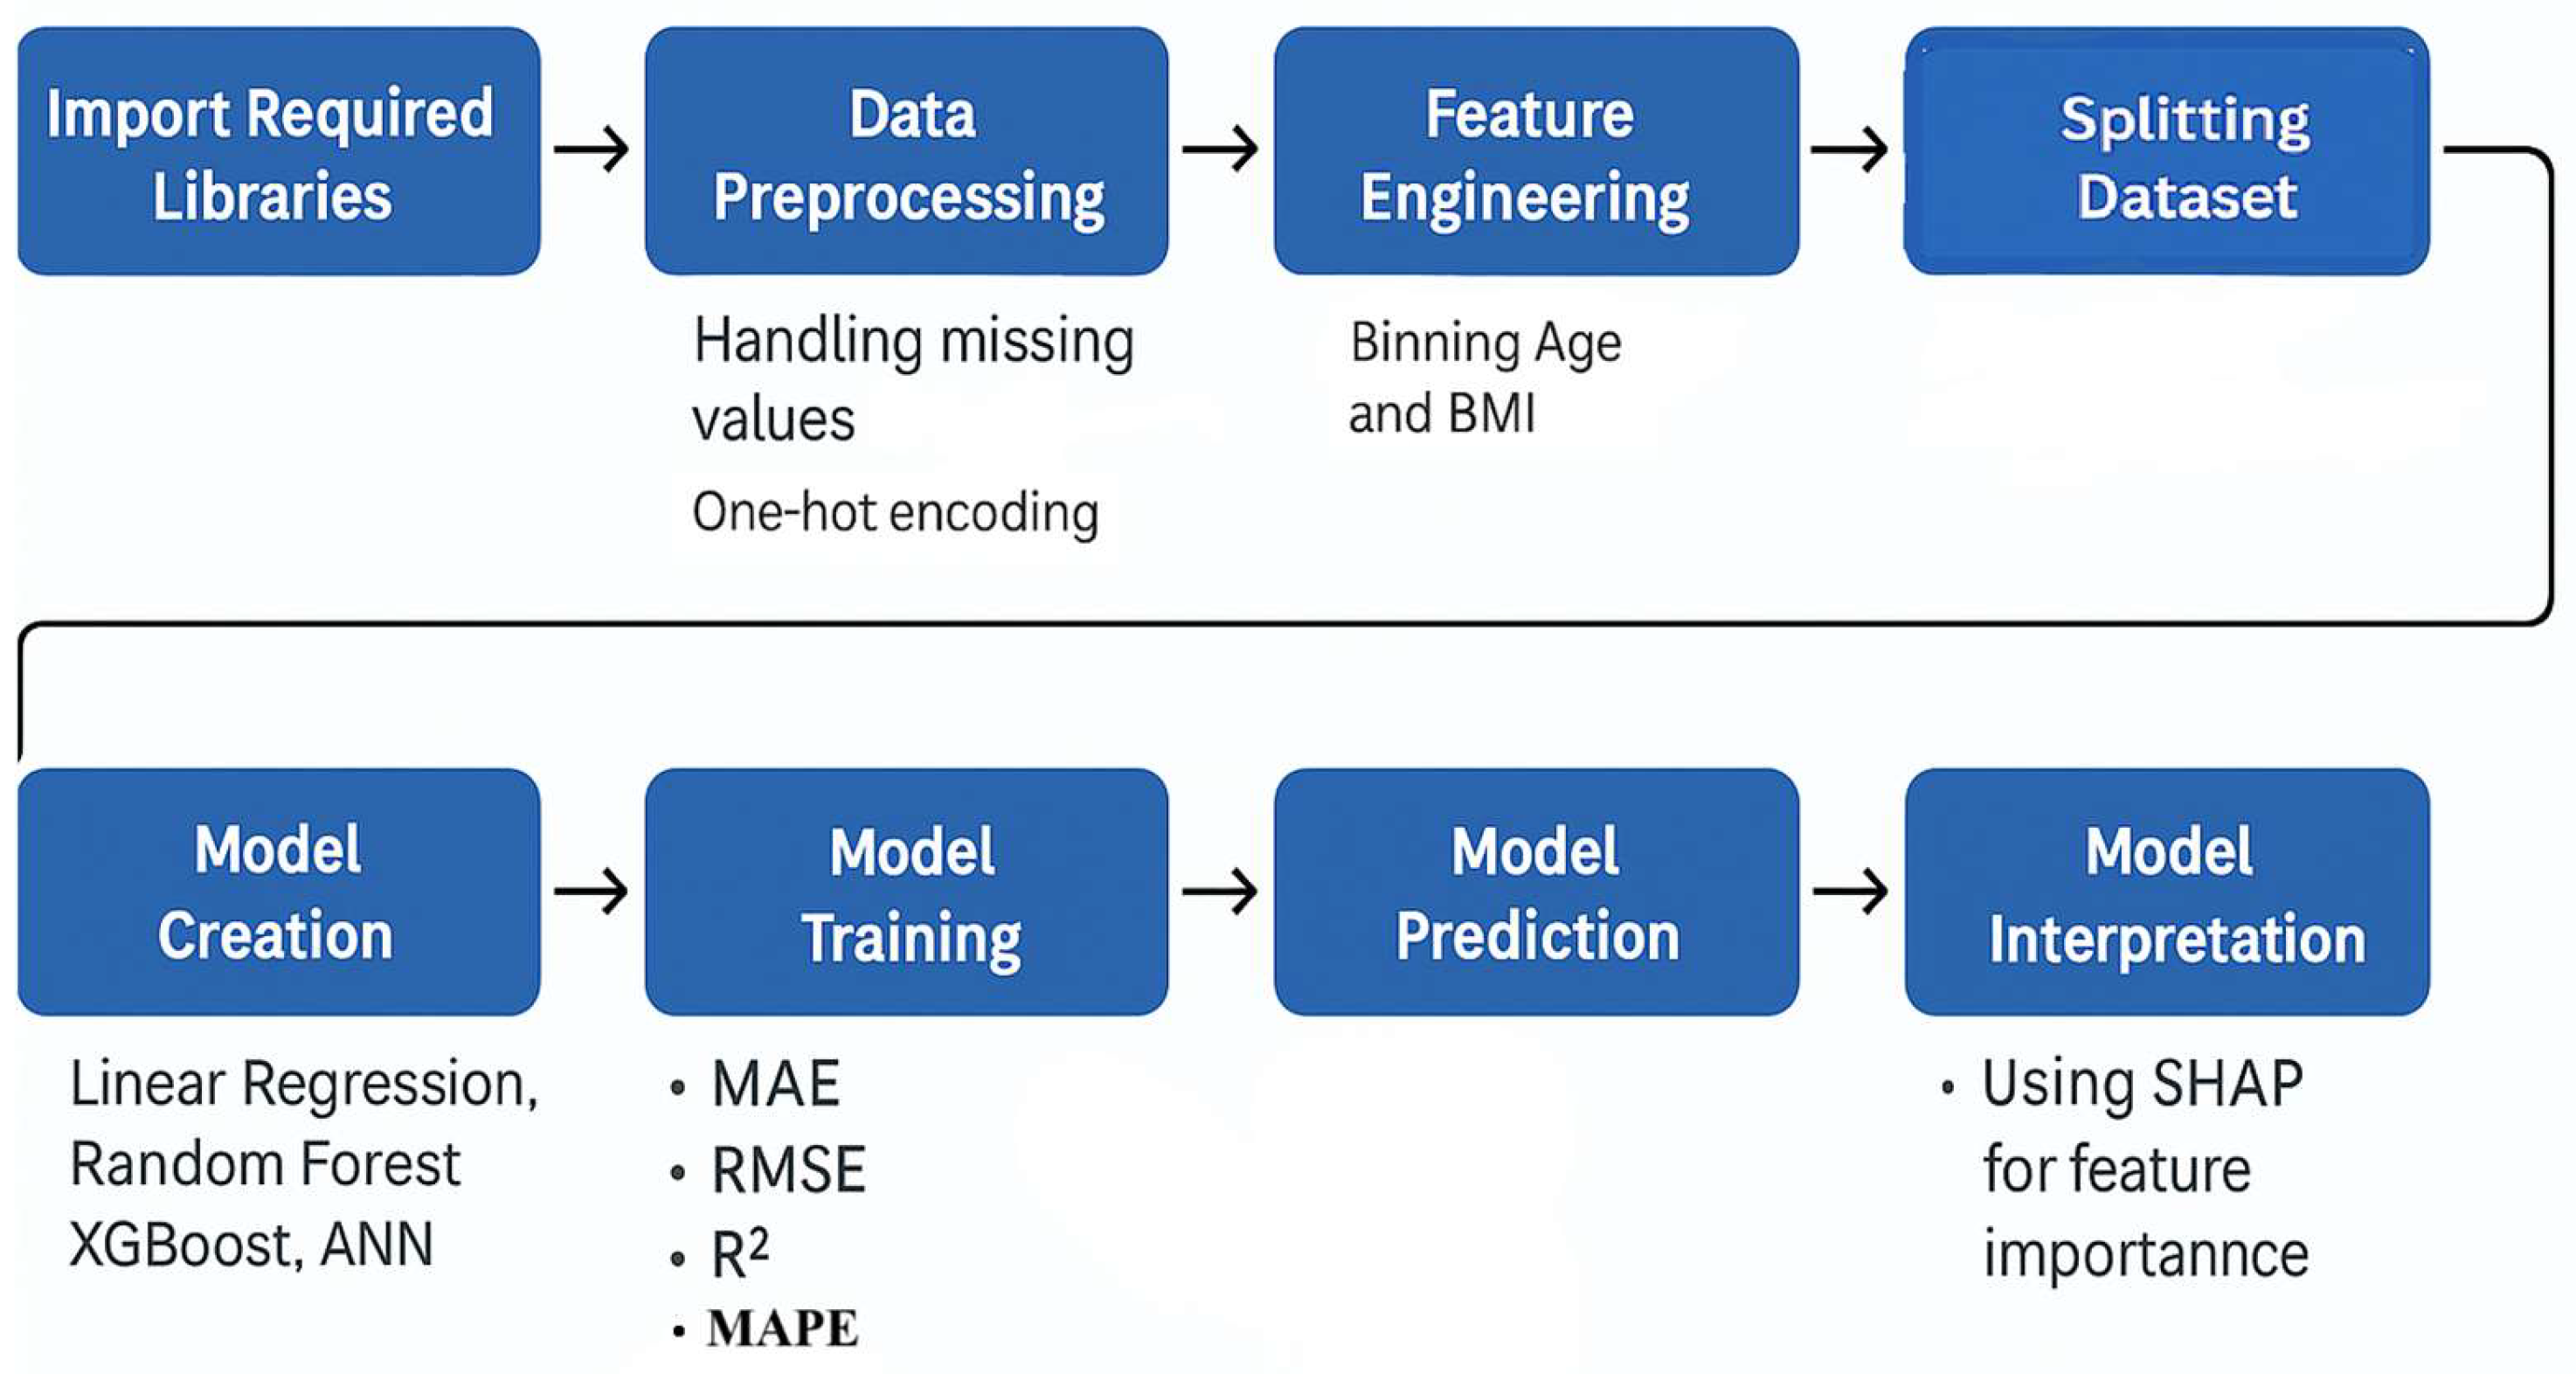
Figure 2.
Distribution of insurance charges across the dataset.
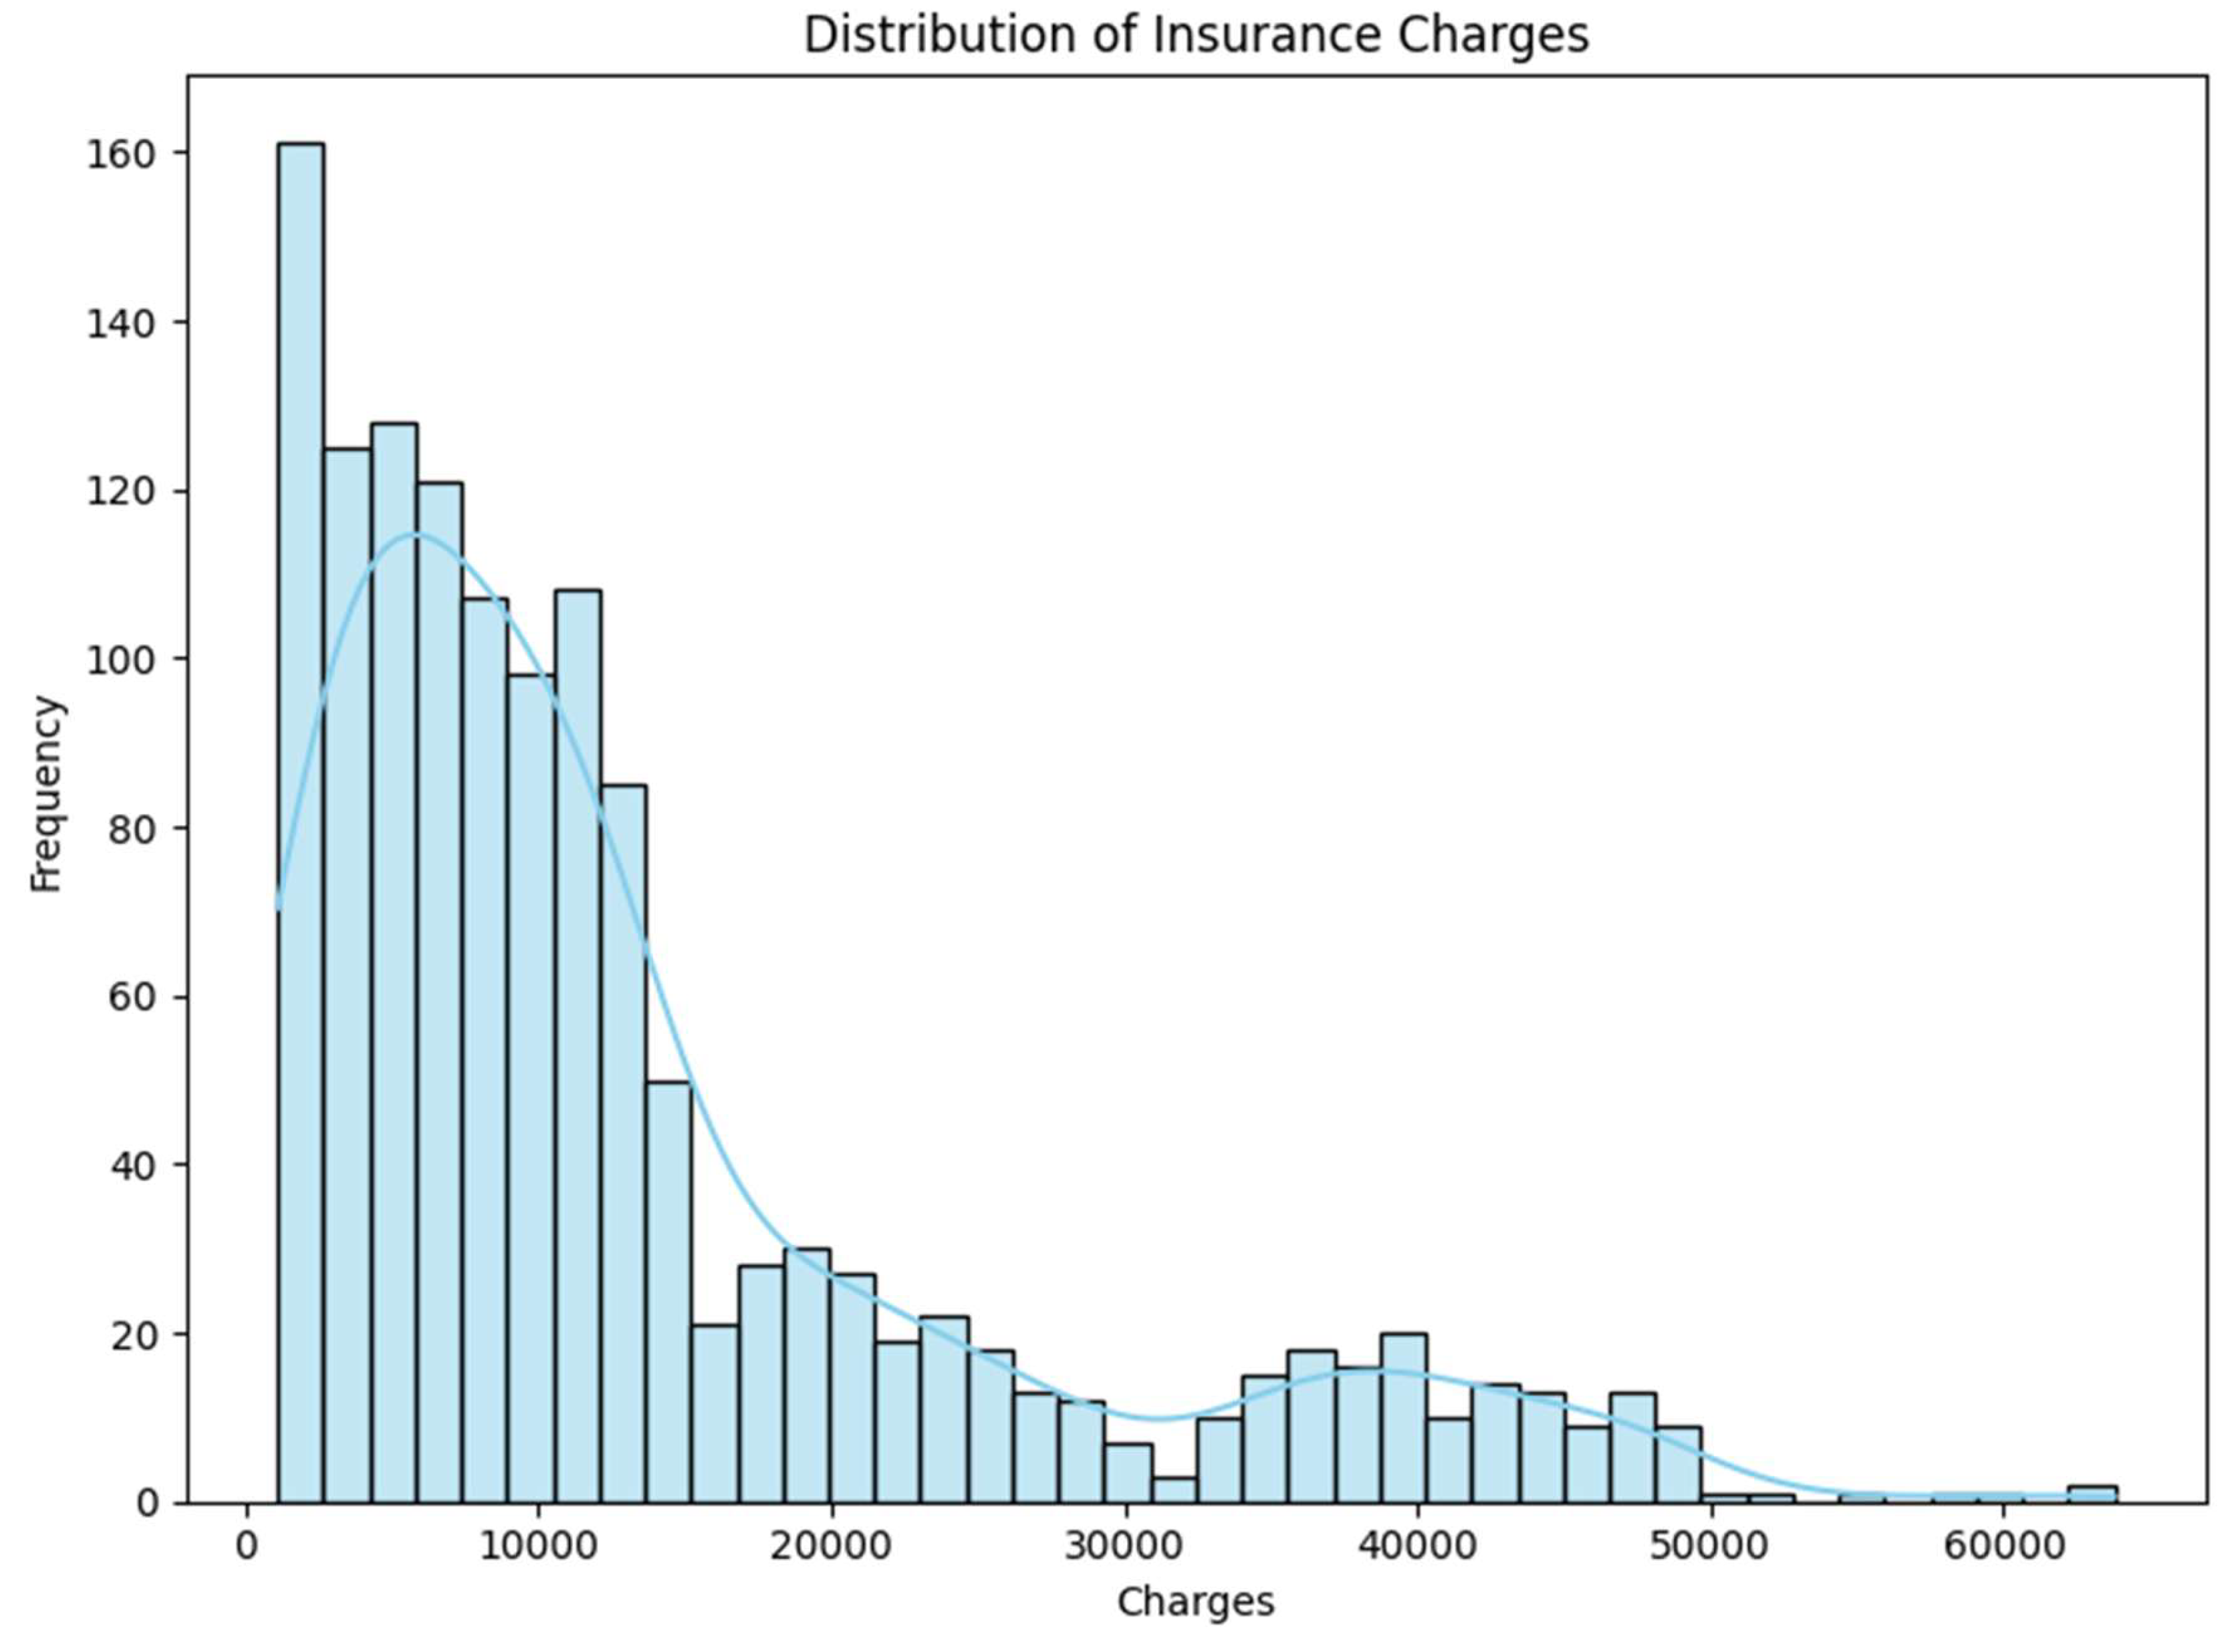
Figure 3.
Charges by Age Group.
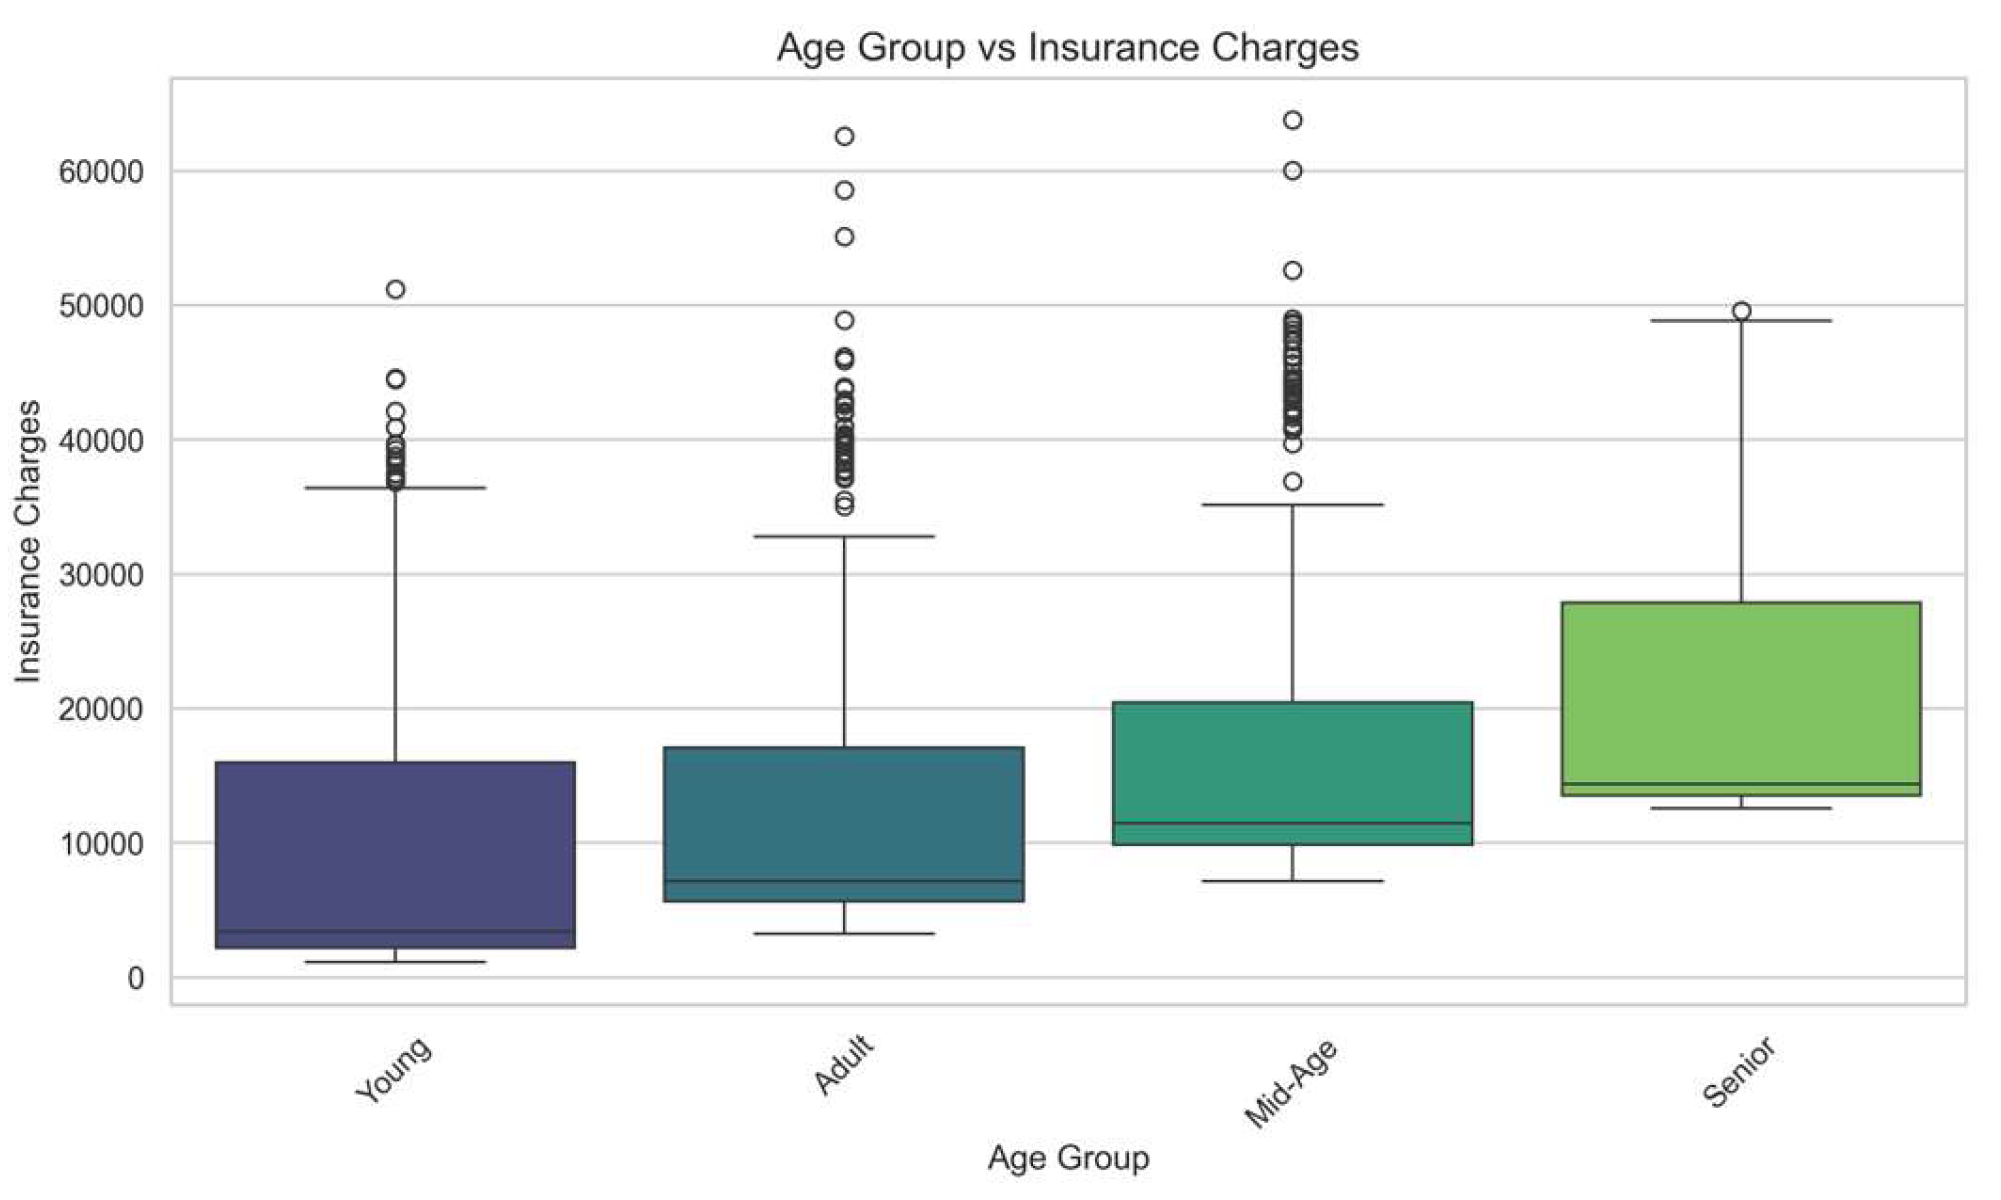
Figure 4.
Insurance Charges by BMI Category.
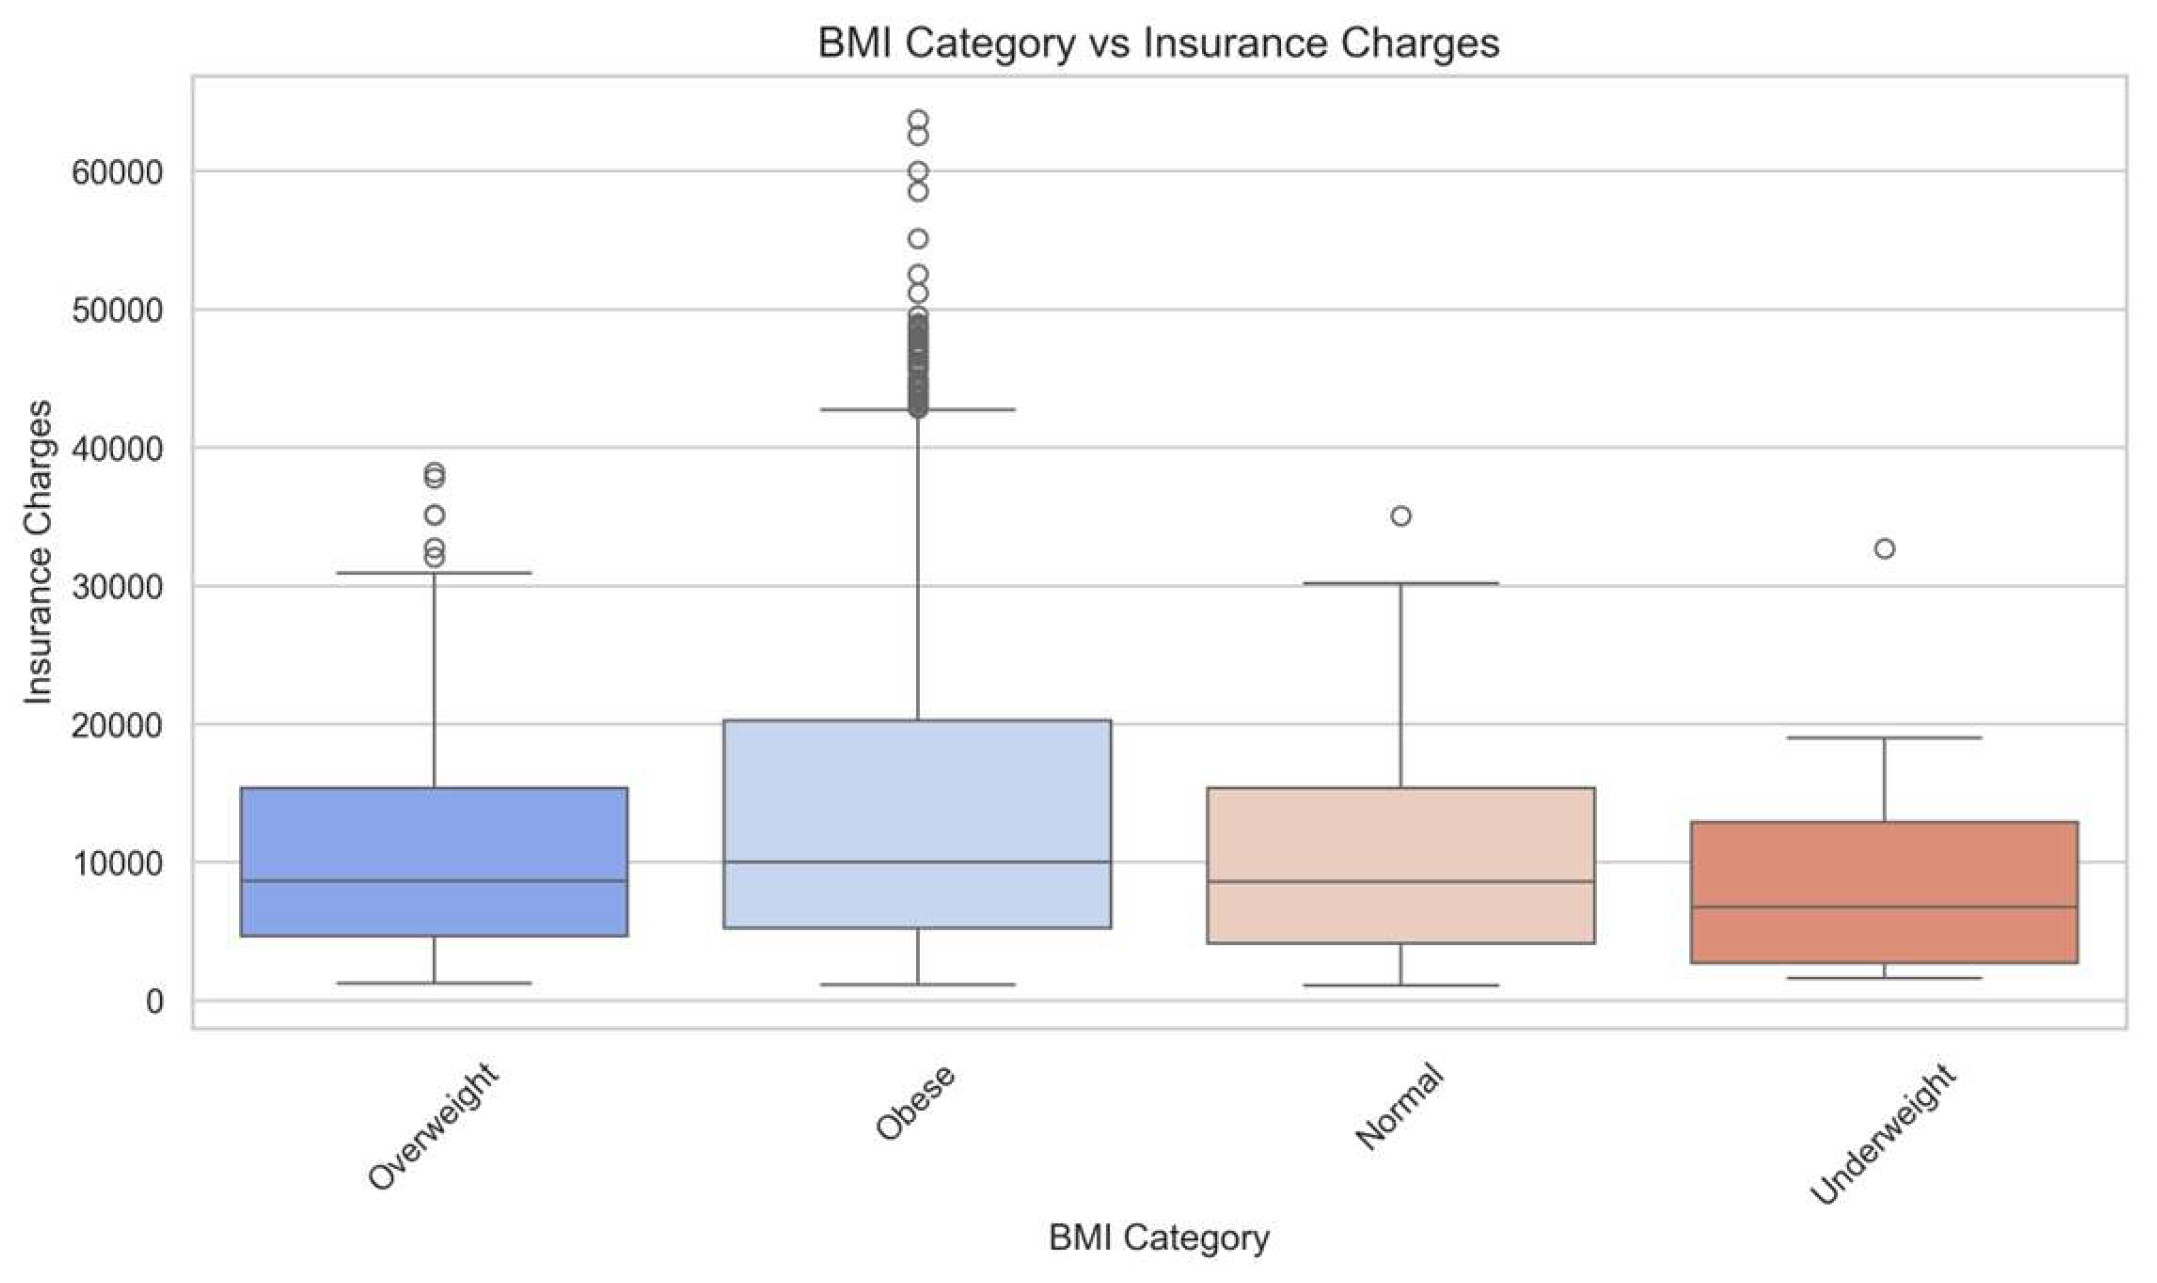
Figure 5.
Insurance Charges Across Regions.
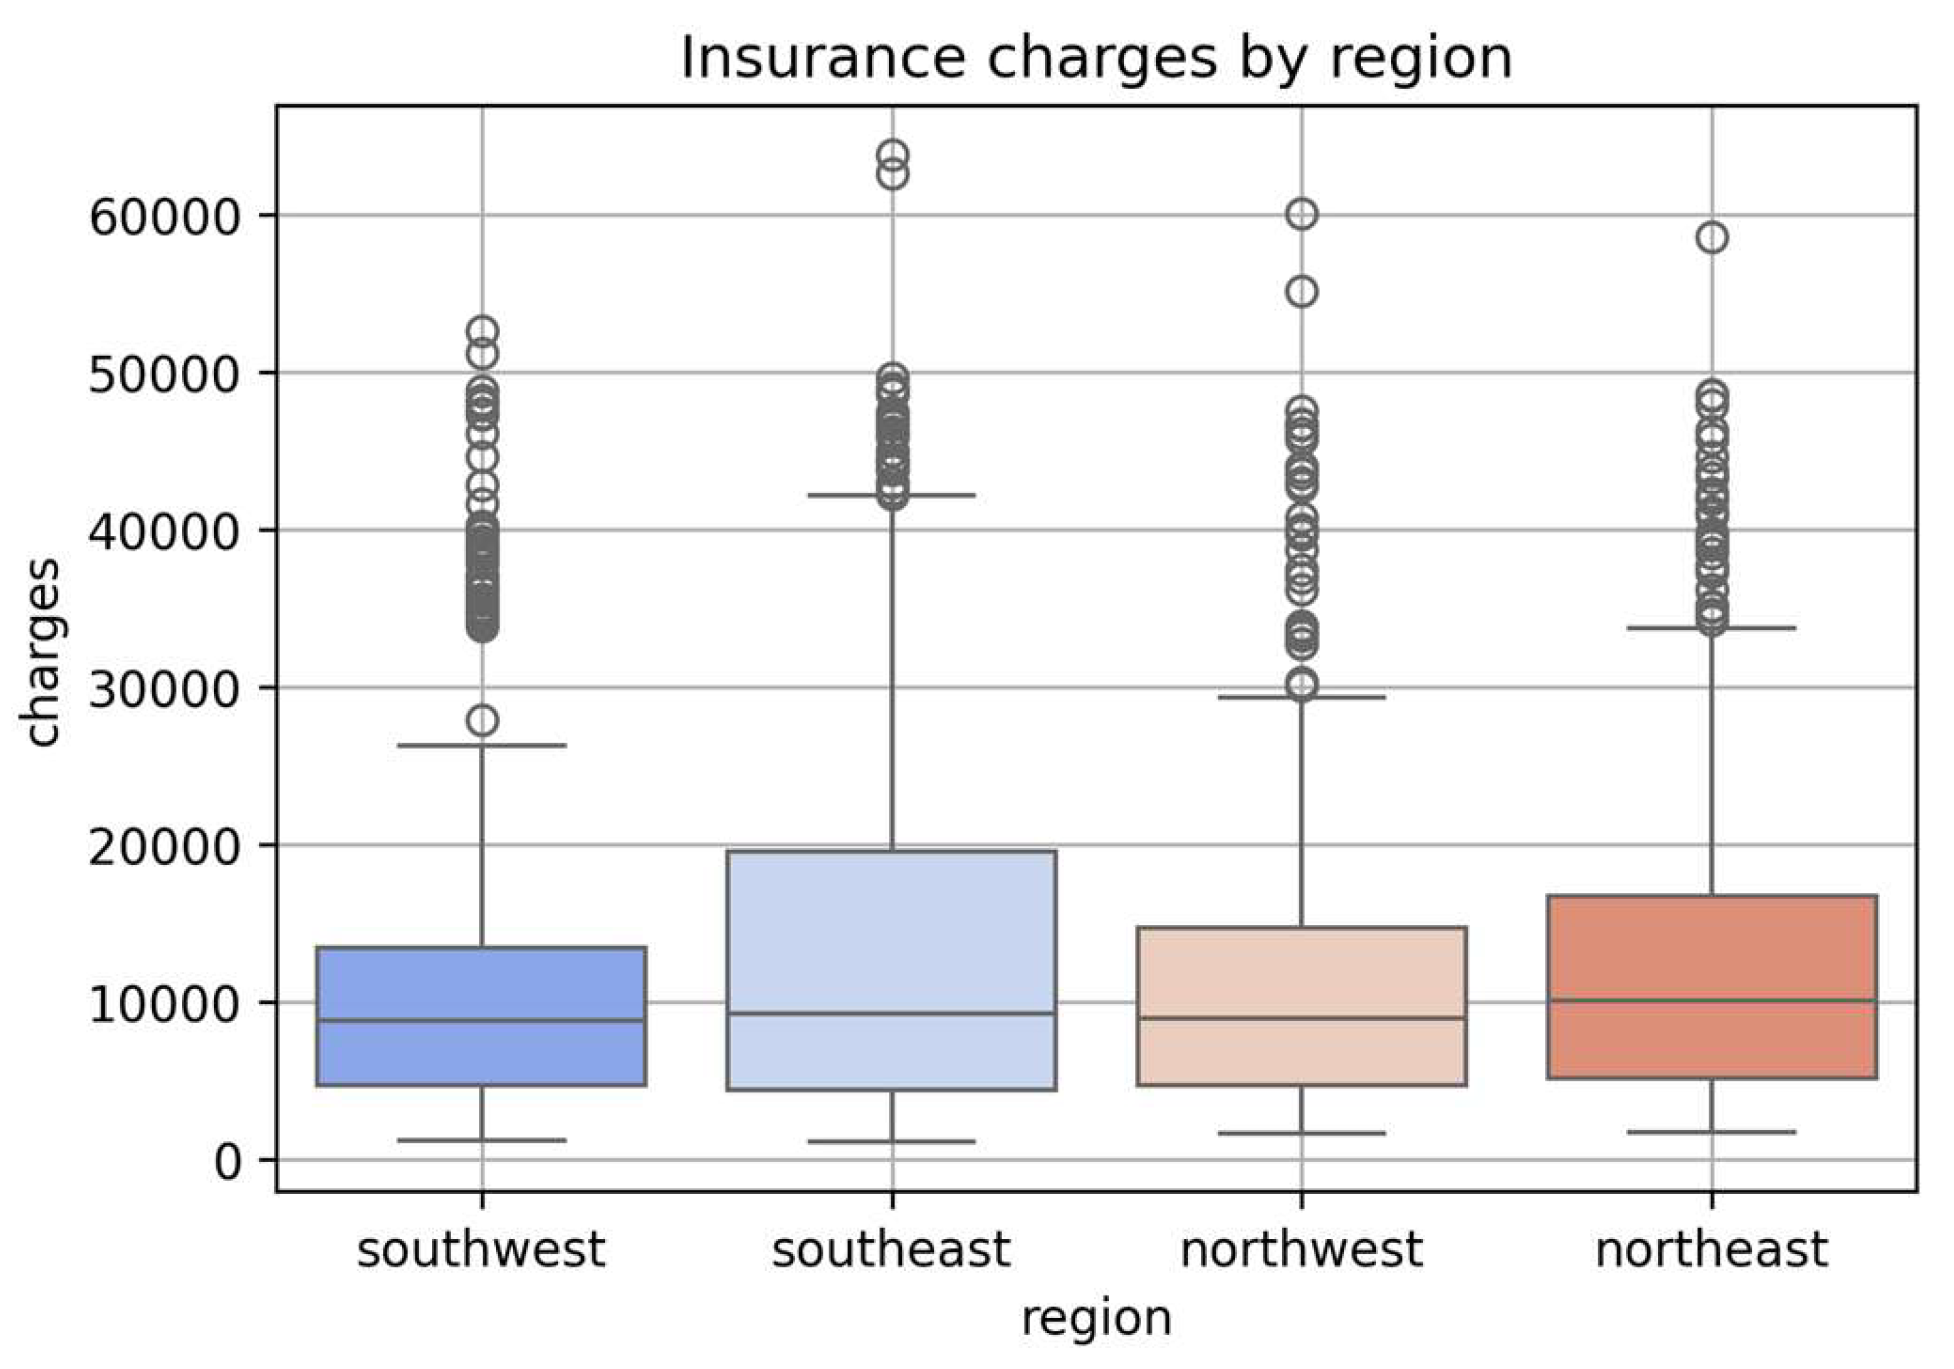
Figure 6.
Insurance charges by sex.
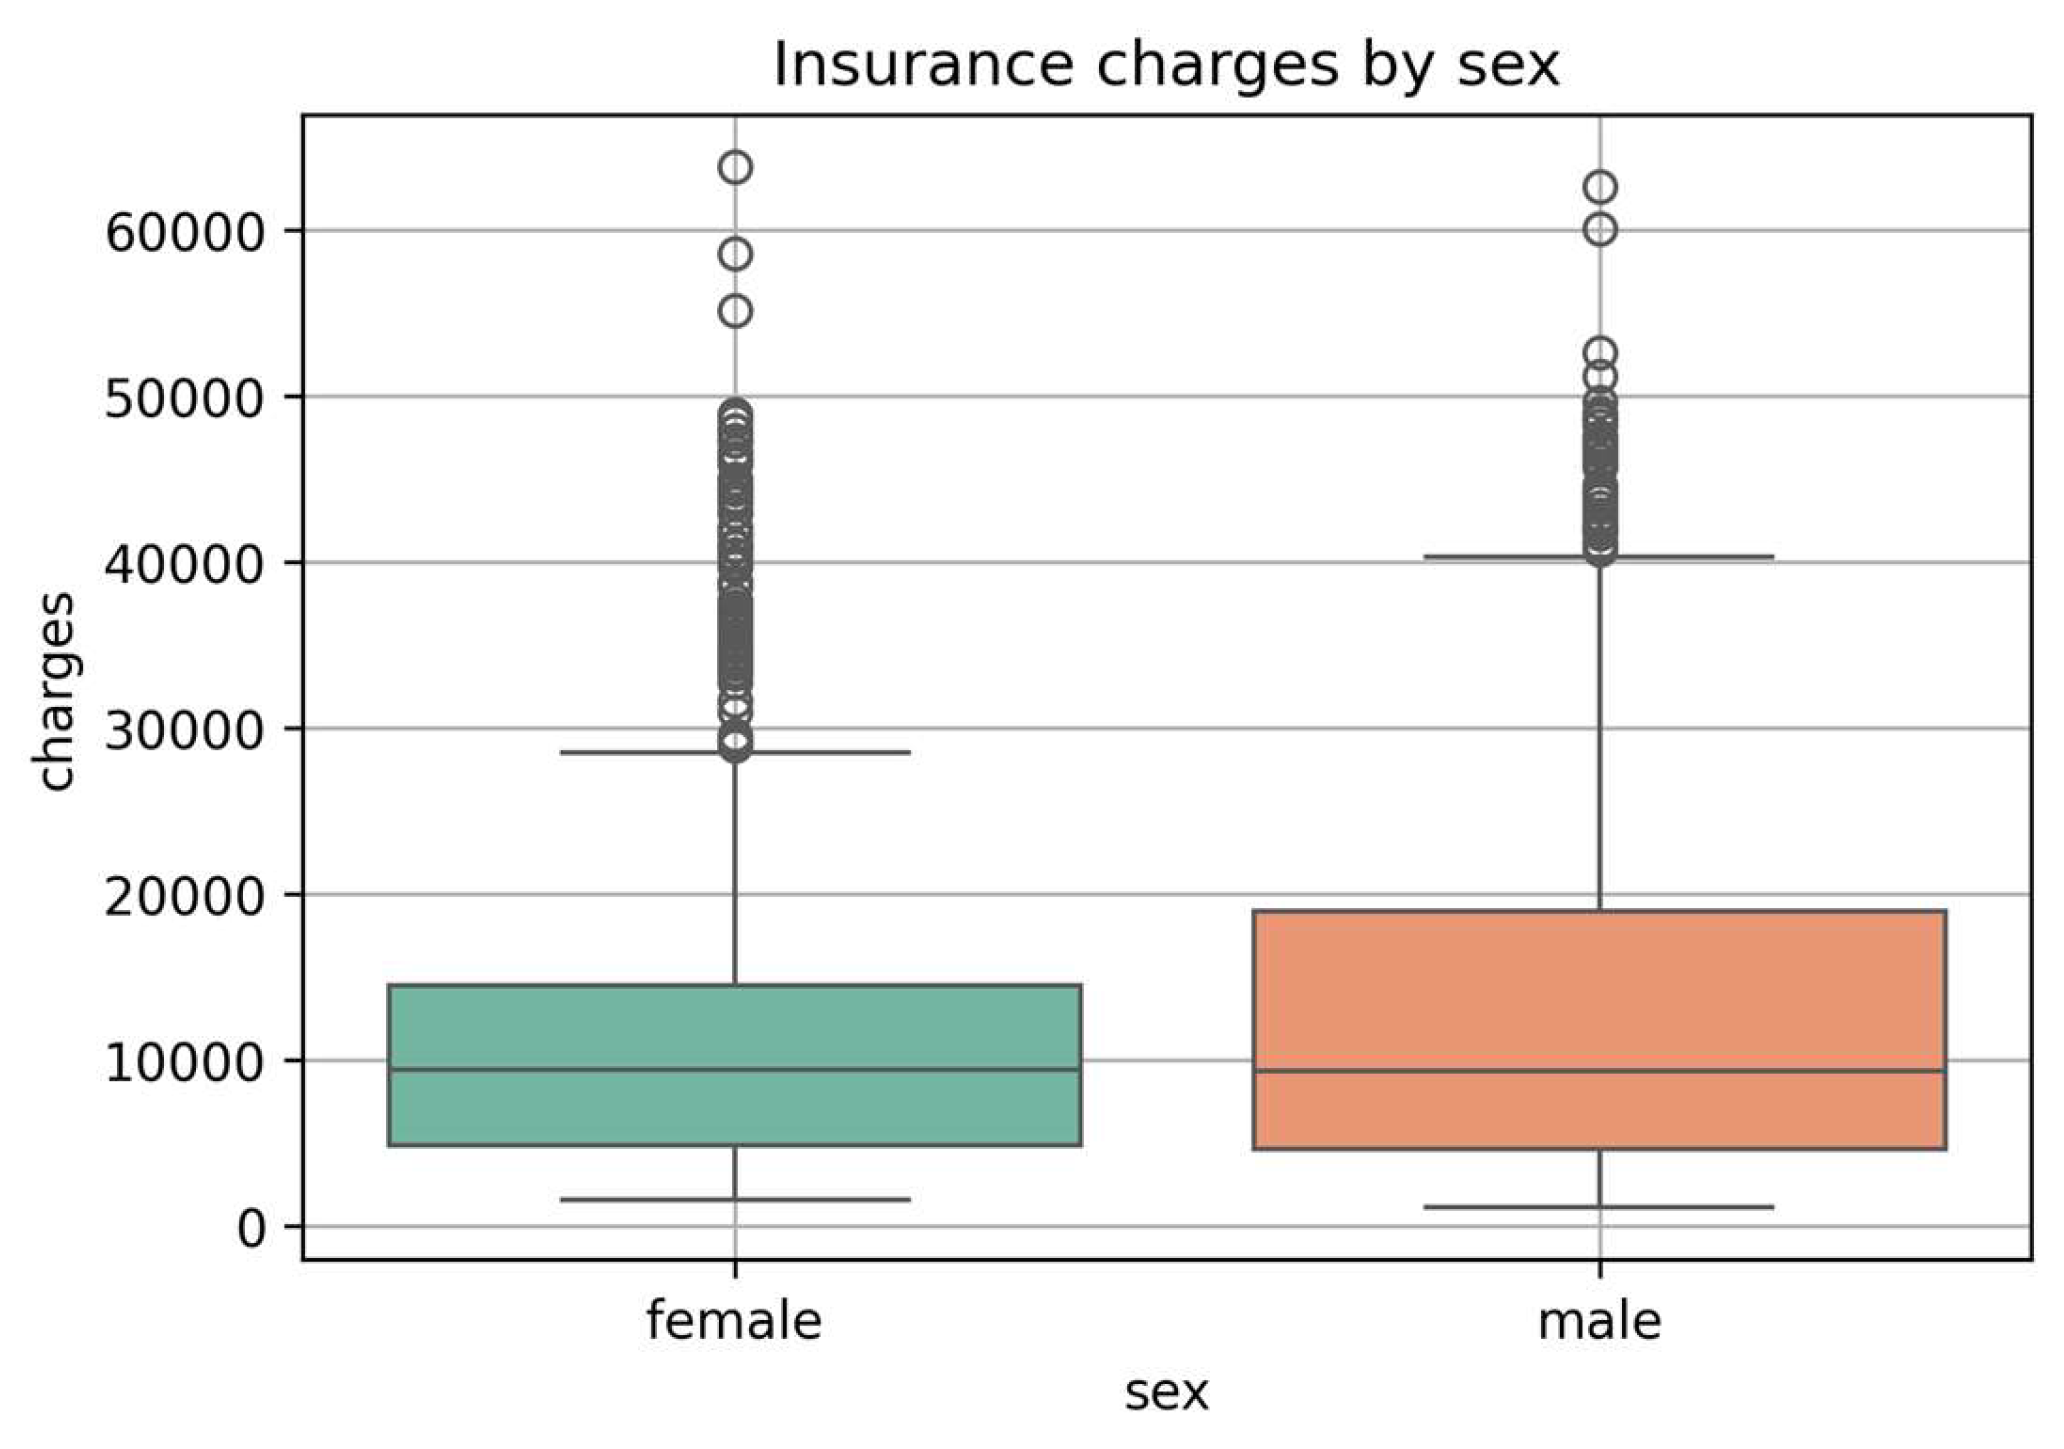
Figure 7.
Charges by Smoking Status.
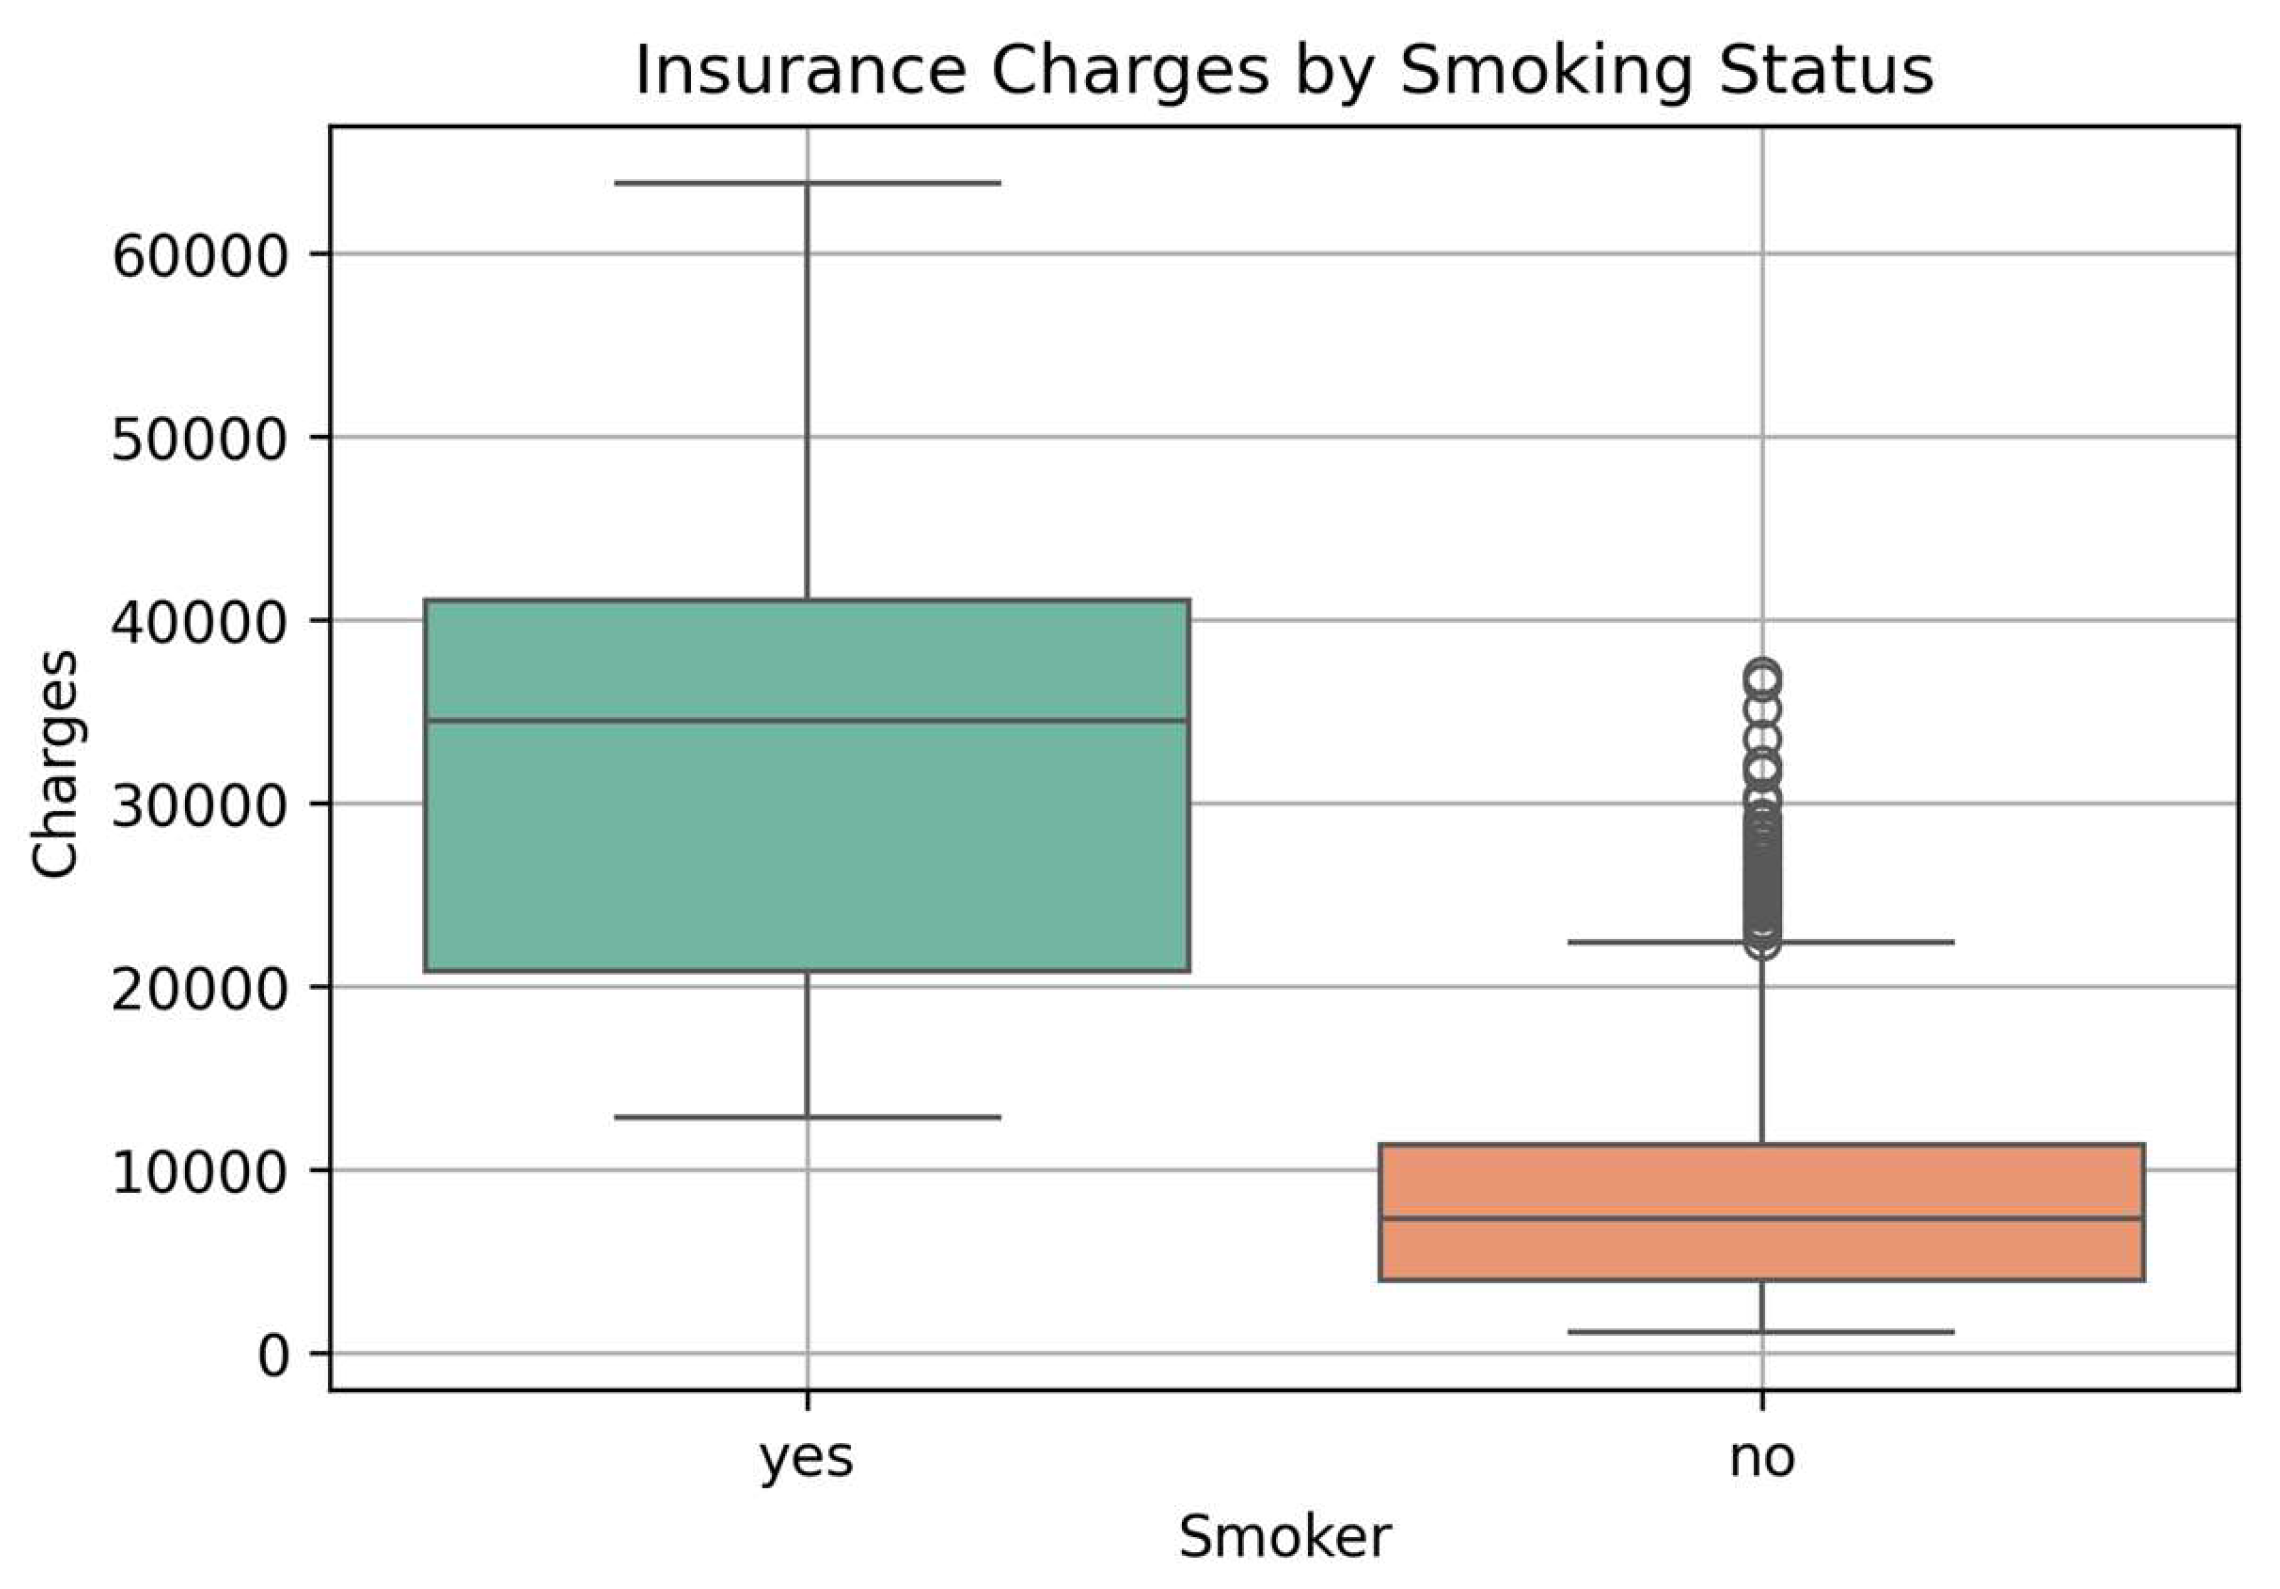
Figure 8.
SHAP bar plot showing the most important features influencing the ANN model’s predictions.
Figure 8.
SHAP bar plot showing the most important features influencing the ANN model’s predictions.
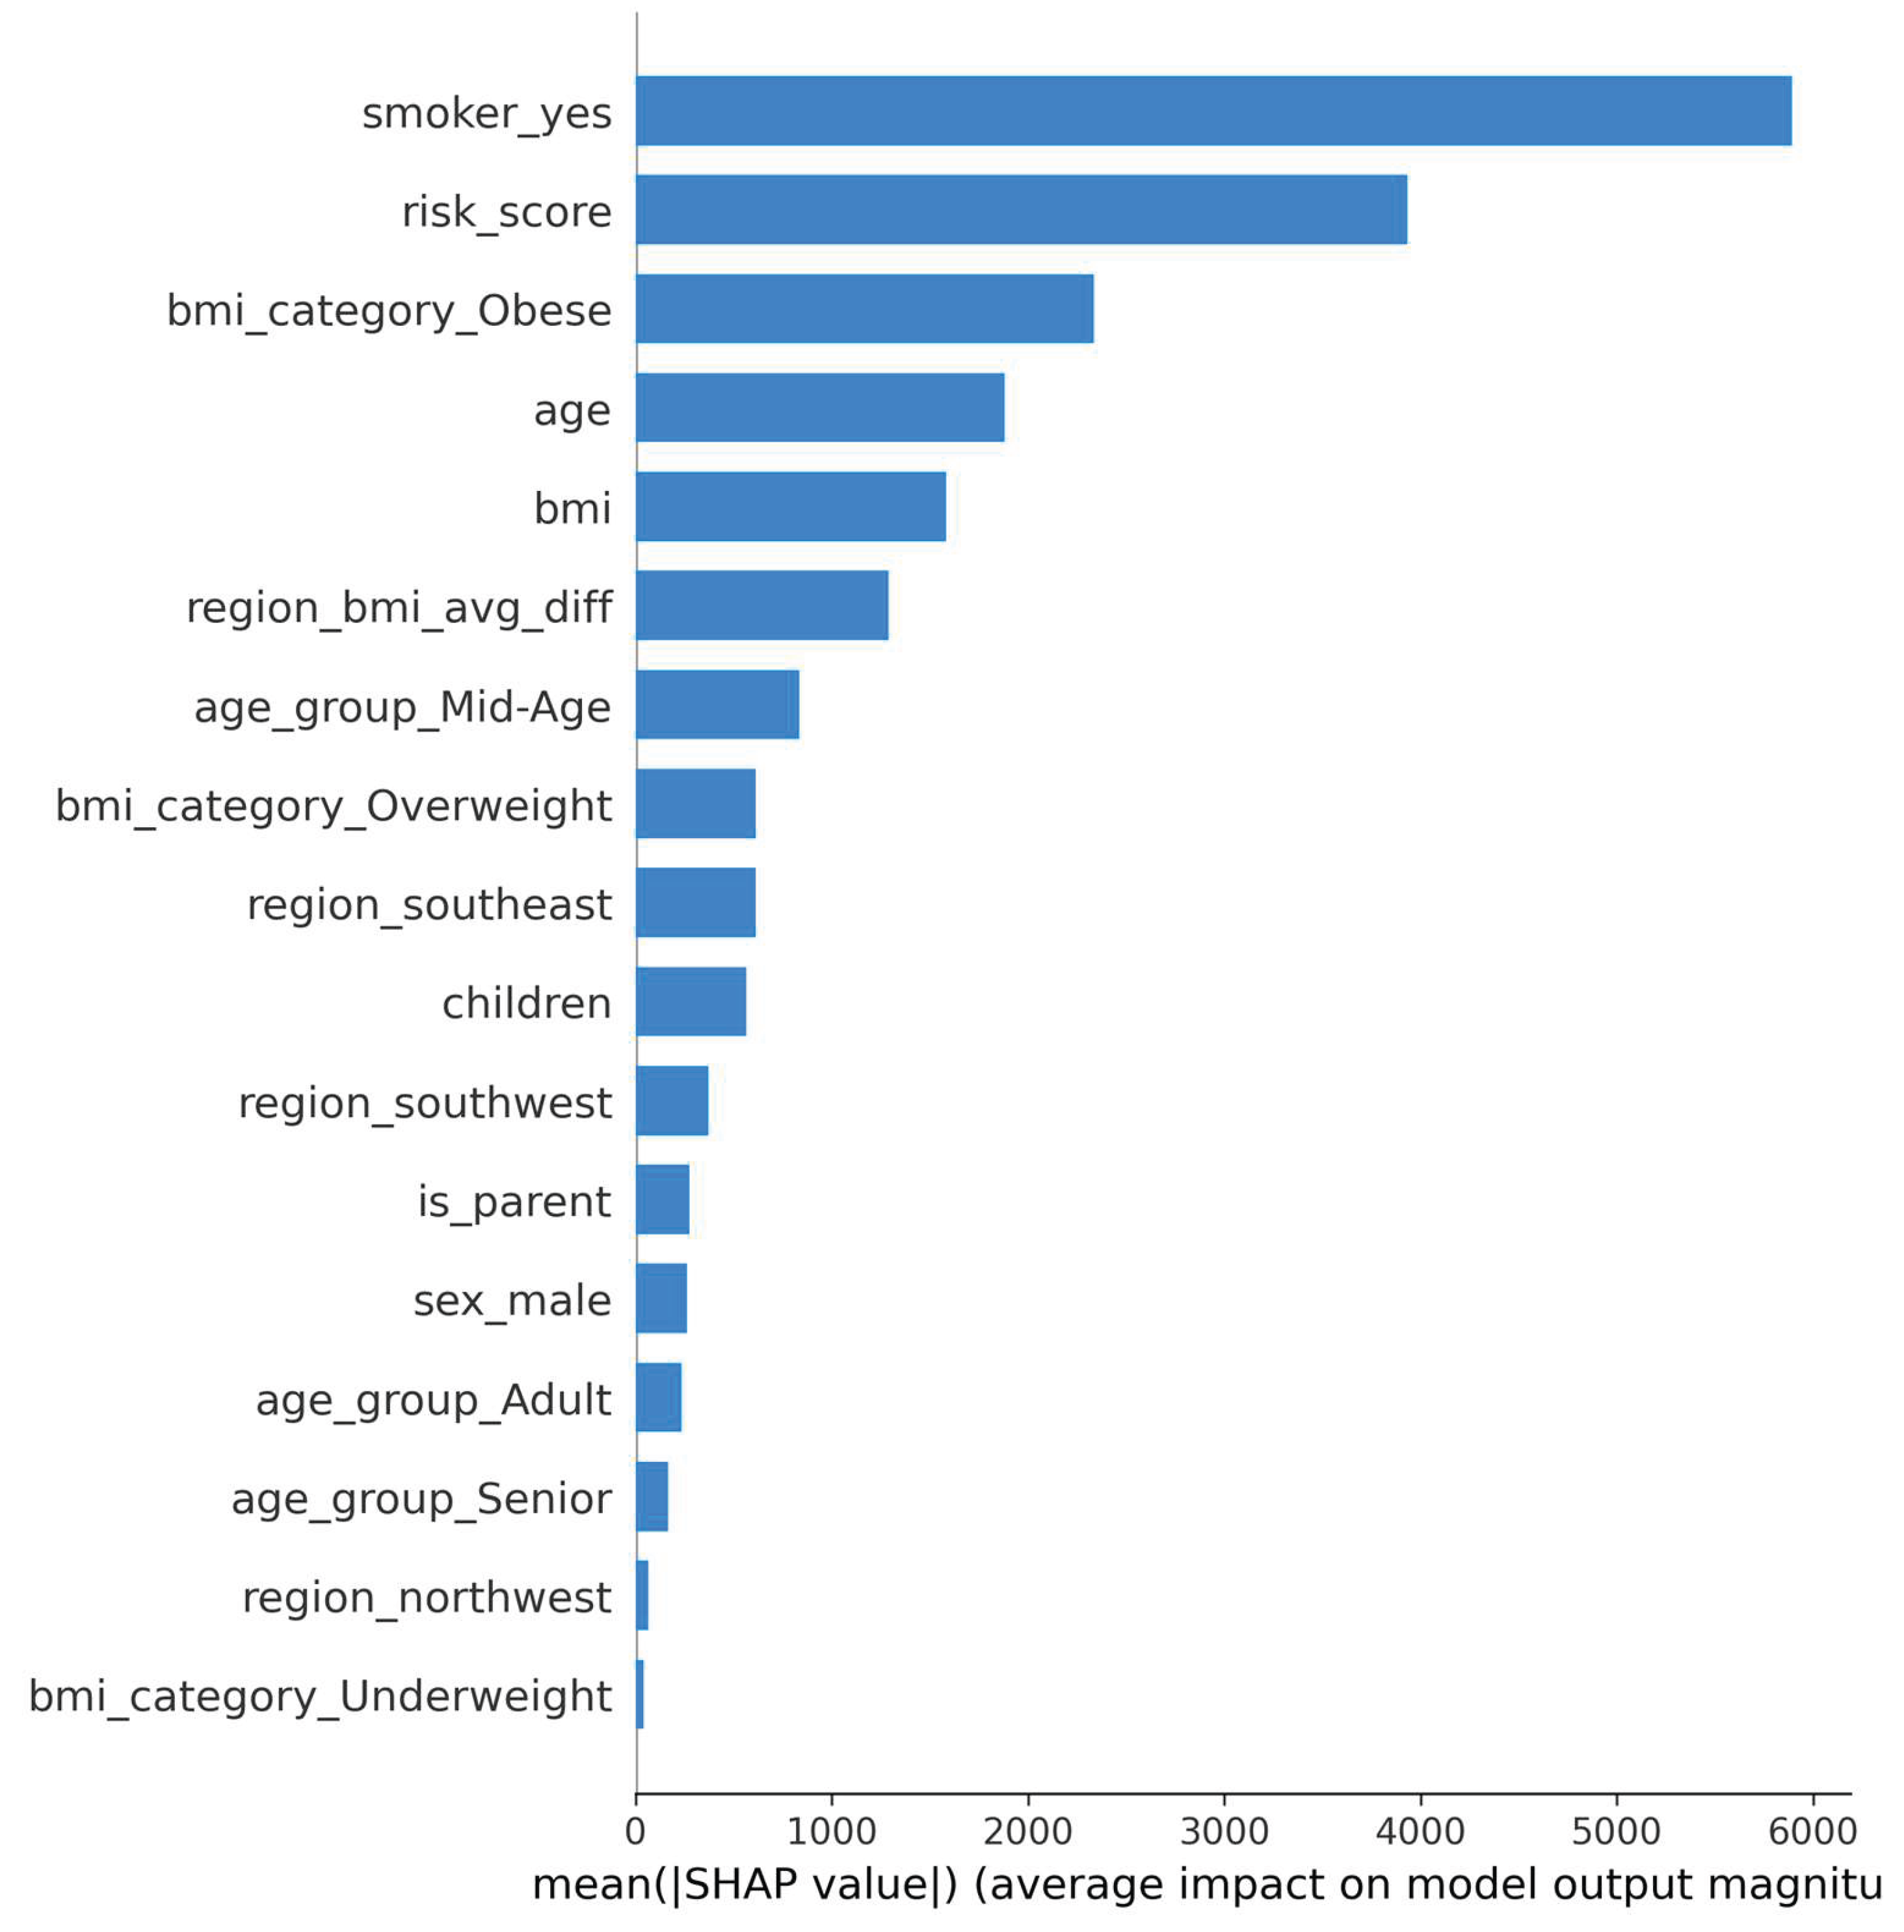
Table 2.
Summary of Final Engineered Features.
| Feature Name | Datatype | Description |
| age_group_Adult | Categorical | 1 if age is classified as Adult, 0 otherwise. |
| bmi_category_Obese |
Categorical | 1 if BMI category is Obese, 0 otherwise. |
| is_parent | Binary | Indicates whether the person has one or more children (1 = Yes, 0 = No). |
| risk_score | Numeric | Custom score calculated based on age, BMI, and smoking status to indicate risk. |
| region_bmi_avg_diff | Numeric | Difference between individual's BMI and average BMI in their region. |
| region_northwest | Binary | One-hot encoded column for Northwest region. |
| region_southeast | Binary | One-hot encoded column for Southeast region. |
| region_southwest | Binary | One-hot encoded column for Southwest region. |
| sex_male | Binary | One-hot encoded column (1 = Male, 0 = Female). |
| smoker_yes | Binary | One-hot encoded column (1 = Smoker, 0 = Non-smoker). |
| Children | Numeric | Number of dependent children covered under the insurance plan. |
| bmi | Numeric | Body Mass Index, a measure of body fat based on height and weight. |
| age | Numeric | Age of the individual (in years). |
| charges | Numeric | Actual medical insurance cost charged. |
| age_group_Senior |
Categorical |
1 if age is classified as Senior, 0 otherwise. |
| age_group_Mid-Age |
Categorical | 1 if age is classified as Mid-Age, 0 otherwise. |
| bmi_category_Overweight |
Categorical |
1 if BMI category is Overweight, 0 otherwise. |
| bmi_category_Underweight |
Categorical |
1 if BMI category is Underweight, 0 otherwise. |
These engineered and encoded features were used as inputs for all predictive models.
Table 3.
Evaluation Scores with Core Metrics:.
| Model | MAE | RMSE | MAPE % | |
| Linear Regression |
2873.51 |
4927.88 |
0.85 |
29.32 % |
| Random Forest |
2635.00 |
4842.31 |
0.86 |
31.80 % |
| XGBoost |
2677.80 |
4867.41 |
0.86 |
29.44 % |
| ANN (Deep Learning) |
2825.85 |
4680.82 |
0.88 |
37.99 % |
Table 4.
Model Evaluation scores 5-Fold Cross Validation.
| Model | K-Fold Cross Validation |
| Linear Regression |
0.84 |
| Random Forest |
0.84 |
| XGBoost |
0.86 |
| ANN (Deep Learning) |
0.9886 |
Disclaimer/Publisher’s Note: The statements, opinions and data contained in all publications are solely those of the individual author(s) and contributor(s) and not of MDPI and/or the editor(s). MDPI and/or the editor(s) disclaim responsibility for any injury to people or property resulting from any ideas, methods, instructions or products referred to in the content. |
© 2025 by the authors. Licensee MDPI, Basel, Switzerland. This article is an open access article distributed under the terms and conditions of the Creative Commons Attribution (CC BY) license (http://creativecommons.org/licenses/by/4.0/).
Copyright: This open access article is published under a Creative Commons CC BY 4.0 license, which permit the free download, distribution, and reuse, provided that the author and preprint are cited in any reuse.


