
Submitted:
21 July 2025
Posted:
22 July 2025
You are already at the latest version
Abstract
The protective role of progesterone (P4) against estradiol (E2)-driven proliferation is essential for preserving endometrial homeostasis. However, the factors that influence the P4:E2 ratio remain poorly characterized. This study aimed to model this ratio using a machine learning approach to identify key hormonal, anthropometric, demographic, dietary, metabolic, and inflammatory predictors. In addition, it aimed to assess estradiol and progesterone as individual outcomes to clarify whether shared or divergent mechanisms underlie variation in each hormone. NHANES data were used to identify postmenopausal women (n = 1,902). An XGBoost model was developed to predict the log-transformed P4:E2 ratio using a 70/30 stratified train-test split. SHAP (SHapley Additive exPlanations) values were computed to interpret feature contributions. The final XGBoost model for the log-transformed P4:E2 ratio achieved an RMSE of 0.746, an MAE of 0.574, and an R² of 0.298 on the test set. SHAP analysis identified FSH (0.213), waist circumference (0.181), and CRP (0.133) as the most influential contributors, followed by total cholesterol (0.085), and LH (0.066). FSH and waist circumference emerged as key predictors of estradiol, while total cholesterol and LH were the most influential for progesterone. By leveraging SHAP-based feature importance to rank predictors of the P4:E2 ratio, this study provides interpretable, data-driven insights into the reproductive hormonal dynamics of postmenopausal women.
Keywords:
progesterone-to-estradiol ratio
; menopause
; endometrial cancer
; breast cancer
; SHAP analysis
; FSH
; LH
1. Introduction
From the onset of puberty through menopause, progesterone and estradiol interact in complex ways — sometimes independently, at times synergistically, but most often antagonistically — to regulate physiological processes and promote health across the reproductive lifespan. Acting in synergy, progesterone enhances estradiol’s cardioprotective role in reducing exercise-induced myocardial ischemia [1], illustrating how the coordinated signaling between these two reproductive hormones from the steroid hormone biosynthesis pathway supports physiological homeostasis. Even when acting in opposition, their dynamic interplay can be essential for the coordination of normal physiological function. Indeed, one of the most well-characterized examples of functional antagonism is progesterone’s regulatory role in the endometrium: following estradiol-induced proliferation in the follicular phase, progesterone acts to stabilize the endometrial lining in the luteal phase by suppressing further proliferation while in parallel promoting the secretion of proteins, lipids, and growth factors necessary for implantation and tissue homeostasis [2].
Disruption of this tightly regulated antagonism — whether due to abnormal systemic levels of estradiol and progesterone or cellular level dysfunction — can have widespread consequences for reproductive and systemic health. According to the widely accepted unopposed estrogen theory, first described by Key et al. (1988) [3], estrogen that is not opposed by an adequate progesterone concentration can exert unregulated mitogenic effects, leading to excessive endometrial proliferation and, ultimately, the development of endometrial hyperplasia and adenocarcinoma. This concept has informed therapeutic strategies that leverage progesterone’s antiproliferative effects on the endometrium. Although progesterone treatment is not indicated for all forms of endometrial cancer, it is incorporated into the management of complex atypical hyperplasia and clinical stage 1A low-grade endometrial tumors in patients who are not surgical candidates. In such cases, reversal of endometrial hyperplasia can be observed in as little as 10 weeks following the initiation of treatment [4].
Epidemiological studies investigating the association between circulating levels of estradiol, progesterone, and endometrial cancer have been difficult to execute, largely due to historical reliance on immunoassay technologies that lack the specificity and sensitivity to accurately differentiate steroid hormones. The more recent adoption of mass spectrometry has overcome these limitations by offering highly specific, sensitive, and reproducible hormone quantification, making it the preferred method in both research and clinical settings. Using this approach, and in line with the strong biological premise discussed above, recent findings indicate that pre-diagnostic levels of progesterone relative to estradiol (P4:E2 ratio) in postmenopausal women are inversely associated with endometrial cancer risk [5].
Given the growing recognition of the P4:E2 ratio as a biologically meaningful marker of endometrial cancer risk, this study aimed to identify its predictors among postmenopausal women in the United States. Leveraging data from the National Health and Nutrition Examination Survey (NHANES), the approach implemented here uniquely combined two major methodological strengths. First, it relied upon the NHANES-implemented gold-standard mass spectrometry—specifically, isotope dilution liquid chromatography-tandem mass spectrometry (ID LC-MS/MS)—for the measurement of circulating hormone concentrations with high specificity and sensitivity, thus overcoming the limitations of traditional immunoassay-based approaches. Second, it employed a supervised machine learning framework to model the relationship between the P4:E2 ratio and a broad array of features spanning hormonal, demographic, dietary, and inflammatory domains. This approach enabled the identification of complex, potentially nonlinear relationships, while ensuring rigorous model validation through cross-validation and performance benchmarking.
In addition to modeling the P4:E2 ratio, estradiol and progesterone were analyzed as individual outcomes to disentangle the distinct pathways governing each hormone. While the ratio offers a useful integrative marker, its components may be influenced by partially independent biological processes where estradiol and progesterone exhibit different temporal dynamics and sources of production. Modeling estradiol and progesterone separately allowed for the detection of unique predictors and clarified whether shared or divergent mechanisms underlie their ratio.
Taken together, the use of high-resolution hormone quantification and interpretable machine learning models positioned this study to advance our understanding of hormonal regulation in postmenopausal women and generate hypotheses for future clinical and epidemiological investigations.
2. Materials and Methods
Study Design
The present study applied a cross-sectional design using publicly available NHANES hormone data. The NHANES is a research program that gathers information about health and nutritional profile of the population in the United States. It involves in-person interviews, questionnaire administration, physical examinations, and laboratory tests. NHANES data is publicly available on the Center for Disease Control website. The present study utilized the NHANES databases that contain Sex Steroid Hormone Panel – Serum and both estradiol and progesterone: 2021-2023, 2017-2020, and 2017-2018 (Surplus). The NHANES project is approved by the National Center for Health Statistics (NCHS) Ethics Review Board. All participants signed the informed consent.
Study Population
Women reporting absence of regular menstrual cycles in the past 12 months due to menopause were included in the study. The exclusion criteria was use of any hormones, specified as hormone/hormone modifiers in the Prescription Medications - Drug Information (RXQ_DRUG) NHANES codebook.
Target Variable Derivation and Measurement
The target variable for the study supervised machine learning model was the natural log-transformed ratio of progesterone to estradiol concentrations (P4:E2), calculated as log (progesterone / estradiol). As a supplemental analysis, estradiol and progesterone were modeled as individual target variables to further explore their unique patterns of regulation and predictors. Progesterone and estradiol concentrations were measured using isotope dilution liquid chromatography-tandem mass spectrometry (ID LC-MS/MS). This method involves dissociating hormones from serum binding proteins, followed by sequential liquid-liquid extraction and quantification using mass spectrometry with isotopically labeled internal standards. The ID LC-MS/MS approach is considered the gold standard for steroid hormone measurement due to the precision of the method and minimal cross-reactivity. Progesterone and estradiol values above the limit of detection (LOD), 0.86 ng/dL and 1.72 pg/mL, respectively, were included in the analysis.
Feature Selection
Anthropomorphic. The study anthropomorphic measure was waist circumference (WC). It was measured to the nearest 0.1 cm just above the iliac crest by trained NHANES technicians using a standardized protocol.
Metabolic. Total cholesterol in NHANES was measured enzymatically in serum samples using the Roche Modular P chemistry analyzer, with results reported in mg/dL. The lower limit of detection (LLOD) for total cholesterol in this method was 4 mg/dL, and the values in the present studies were filtered as such.
Demographics. Demographic features included age, and age at menarche. Age was recorded at the time of screening, and age at menarche was self-reported during the reproductive health interview.
Dietary. Dietary intake features (total kilocalories, protein, carbohydrate, fat, sugar, and fiber) were derived from the NHANES 24-hour dietary recall interviews, which were conducted on two non-consecutive days using the USDA’s validated Automated Multiple-Pass Method. Day 1 dietary data were collected in-person at the Mobile Examination Center (MEC), while Day 2 data were collected by telephone 3 to 10 days later. Data were extracted from NHANES Day 1 and Day 2 total nutrient files and mean daily intake for each nutrient was calculated across the two recall days to improve dietary exposure estimation and minimize intra-individual variability. All dietary variables were included as continuous features in the model.
Hormonal. Hormone features included estrone, estrone sulfate, follicle-stimulating hormone (FSH), and luteinizing hormone (LH). The ratio of estrone sulfate to estrone (sulfation ratio) was calculated to reflect estrogen storage capacity, as estrone sulfate serves as a circulating reservoir that can be converted to bioactive estrone and subsequently estradiol. Hormone values were filtered to retain values above LOD: estrone (0.13 ng/dL), estrone sulfate (2.04 pg/mL), FSH (0.30 mIU/mL) and LH (0.10 mIU/mL).
Inflammatory. High-sensitivity C-reactive protein (hs-CRP) was included as an indicator of systemic low-grade inflammation. In NHANES, CRP was measured in serum using a high-sensitivity assay, following standardized laboratory protocols. Values within the analytic range (0.15-20 mg/L) were included as continuous variables to capture the full distribution of inflammatory status.
Statistical Analysis
Statistical Analysis Framework and Data Preparation. The primary modeling objective was a prediction of the P4:E2 ratio as a continuous outcome based on demographic, anthropometric, hormonal, dietary, and inflammatory predictors using regression. The dataset was randomly partitioned into a training set, comprising 70% of the observations, and a test set, comprising the remaining 30%. Stratified sampling was used to ensure balanced representation of the target variable across both sets. In addition to modeling the P4:E2 ratio, two secondary models were constructed to predict serum estradiol and serum progesterone concentrations independently, using the same set of predictors. These secondary analyses were conducted to decompose the P4:E2 ratio signal and help identify whether the model’s predictive power was primarily driven by estradiol or progesterone. Each hormone was log-transformed prior to modeling to correct for skewness and stabilize variance.
Missing Data. Missing values in the dataset were handled using median imputation to minimize the influence of outliers and to maintain the central tendency of each variable. Using the pre-processing capabilities of the caret package [6], the imputation model was developed on the training data and subsequently applied to both the training and test datasets to prevent information leakage.
Model Development and Hyperparameter Tuning. All predictive models were developed using the native xgboost package [7]. To reduce the risk of overfitting, the following conservative model complexity and regularization settings were implemented: tree depth was capped at 4 (max_depth = 4), minimum child weight was set to 10 (min_child_weight = 10), and both L1 (alpha = 2) and L2 (lambda = 2) regularization penalties were applied. A small learning rate (eta = 0.03) and dropout-like subsampling of observations and features (subsample = 0.6, colsample_bytree = 0.6) were used to further enhance generalizability. Model hyperparameters were optimized using Bayesian optimization via the ParBayesianOptimization package, which efficiently searches the hyperparameter space by leveraging a Gaussian process surrogate model. Five-fold cross-validation with early stopping (patience = 50 rounds) was used during tuning to identify the optimal number of boosting rounds.
Final Model Training and Evaluation. Final XGBoost models for the P4:E2 ratio, estradiol, and progesterone were each trained on their respective training sets using the optimal hyperparameters identified during cross-validation and Bayesian optimization. Predictions were then generated on the held-out test sets to assess generalizability. Model performance was evaluated using root mean squared error (RMSE), mean absolute error (MAE), and the coefficient of determination (R2). Residual diagnostics were conducted for each model to assess assumptions and detect any prediction error patterns.
Model Interpretation Using SHapley Additive exPlanations (SHAP) Values. To further interpret the final XGBoost models, SHAP values were computed to quantify the contribution of each predictor to individual predictions. The fastshap package was used to calculate SHAP values for the test dataset. SHAP values were generated using Monte Carlo sampling with 200 simulations to ensure stable and reliable estimates of feature contributions. Separate SHAP analyses were performed for each of the three models (P4:E2 ratio, estradiol, and progesterone), and the resulting feature importance rankings were compared to assess the differential influence of predictors across hormone outcomes.
3. Results
Study Participants
A total of 28, 126 participants’ data were initially available across the merged NHANES datasets. After excluding men, the database was reduced to 14, 563, and 13, 055 after restricting the sample to women who did not take hormone/hormone modifier treatments. Further exclusion of women who reported absence of menstrual cycles due to menopause resulted in 2, 753 participants, with 2191 remaining after implementing progesterone exclusion criteria (total of 562 rows dropped; 399 missing values and 163 below LOD values). After implementing estradiol exclusion criteria, data from 1,906 were retained (total of 285 rows dropped; 47 missing values and 238 below LOD values). The final dataset contained 1902 rows of data after filtering based on LOD values for LH, FHS, estrone, and estrone sulfate.
The mean age of participants was 64.6 years (SD = 8.52), and the mean waist circumference was 101.0 cm (SD = 15.5). The average high-sensitivity C-reactive protein (CRP) concentration was 3.55 mg/L (SD = 3.61), and the mean total cholesterol level was 202.0 mg/dL (SD = 41.9). Participants consumed an average of 1,732 kcal/day (SD = 645). The mean daily intake of macronutrients was as follows: protein 65.0 g/day (SD = 25.9), fiber 15.8 g/day (SD = 8.26), fat 72.8 g/day (SD = 33.7), sugar 87.6 g/day (SD = 48.2), and carbohydrates 201.0 g/day (SD = 82.9).
Missing data were minimal across most variables, with less than 5% missingness for all features except dietary intake variables, which had 6.89% missingness. Detailed missingness information for each variable is provided in Supplementary Table 1.
Model Development and Hyperparameter Tuning
For the P4:E2 model, the final selected configuration included maximum tree depth = 5, minimum child weight = 6, gamma = 0.26, and learning rate (eta) = 0.028, with fixed regularization parameters (alpha = 2, lambda = 2) and dropout-like sampling (subsample = 0.6, colsample_bytree = 0.6). The best cross-validated RMSE achieved during tuning was 0.810, and the optimal number of boosting rounds selected was 596. For the estradiol model, the final selected configuration included maximum tree depth = 6, minimum child weight = 7, gamma = 0.134, and learning rate (eta) = 0.010, with fixed regularization parameters (alpha = 2, lambda = 2) and dropout-like sampling (subsample = 0.6, colsample_bytree = 0.6). The best cross-validated RMSE achieved during tuning was 0.686, and the optimal number of boosting rounds selected was 169. For the progesterone model, the final selected configuration included: maximum tree depth = 6, minimum child weight = 7, gamma = 0.134, and learning rate (eta) = 0.01, with fixed regularization parameters (alpha = 2, lambda = 2), and dropout-like sampling (subsample = 0.6, colsample_bytree = 0.6). The best cross-validated RMSE achieved during tuning was 0.686, and the optimal number of boosting rounds selected was 169. The above configurations were used to train the final three model on the entire training sets.
XGBoost Model Performance
As shown in Table 1, for the log-transformed P4:E2 ratio training set, the model achieved an RMSE of 0.393, an MAE of 0.295, and an R2 of 0.830, indicating a strong fit. On the test set, performance was more conservative, with an RMSE of 0.746, an MAE of 0.574, and an R2 of 0.298, suggesting moderate predictive power and effective control of overfitting. Visual inspection of the residuals vs. predicted values plot (Supplementary Figure 1, left) confirmed the absence of strong heteroscedasticity or systematic error patterns. Residuals appeared randomly distributed and approximately centered around zero, indicating that prediction errors were not biased across the predicted range. The predicted vs. observed plot (Supplementary Figure 1, right) displayed a clear positive linear trend, with most predictions closely tracking the actual values, albeit with some dispersion at extreme values. Together, these diagnostics support that the model generalized reasonably well to unseen data. In the estradiol analysis, the held-out test set model achieved an RMSE of 0.629, an MAE of 0.479, and an R2 of 0.306, indicating moderate predictive performance. In contrast, performance on the training set yielded an RMSE of 0.313, an MAE of 0.237, and an R2 of 0.835, suggesting a strong model fit. In the progesterone analysis, the held-out test set model achieved an RMSE of 0.681, an MAE of 0.528, and an R2 of 0.022, indicating limited predictive performance. In contrast, the training set yielded an RMSE of 0.660, an MAE of 0.492, and an R2 of 0.183, suggesting the model captured some signal but exhibited limited generalizability.
SHAP-Based Feature Importance
SHAP-based feature importance analysis revealed that FSH was the most influential predictor of the P4:E2 ratio, with a mean absolute SHAP value of 0.213, followed by waist circumference (0.181), indicating strong contributions to the model’s predictions (Table 2; Figure 1, left). C-reactive protein (0.133) was the next most impactful feature, followed by total cholesterol (0.0858) and LH (0.0668). Dietary variables such as fat intake (0.0653), protein intake (0.0584), and sugar intake (0.0562) played more moderate roles. Carbohydrate intake (0.0530) and age (0.0505) contributed similarly, along with the sulfation ratio (0.0449), fiber intake (0.0416), and age at menarche (0.0369). Total caloric intake had the smallest impact (0.0266).
In the estradiol model (Table 2; Figure 1, middle), follicle stimulating hormone (FSH) emerged as the strongest contributor (0.1510), followed by luteinizing hormone (LH) (0.1340), the sulfation ratio (0.1135), and age (0.0896). Waist circumference (0.0813), C-reactive protein (CRP) (0.0664), and dietary carbohydrate intake (0.0566) were also moderately influential. Other features such as fat intake (0.0485), total cholesterol (0.0437), protein intake (0.0421), sugar intake (0.0402), fiber intake (0.0379), age at menarche (0.0371), and total caloric intake (0.0252) played smaller but non-negligible roles in shaping predictions.
In the progesterone model (Table 2; Figure 1, right), total cholesterol (0.0527) and luteinizing hormone (LH) (0.0346) were the most influential predictors. These were followed by follicle stimulating hormone (FSH) (0.0178), waist circumference (0.0165), and fiber intake (0.0138), each showing modest contributions. Additional variables with minor impact included the estrone sulfate:estrone ratio (0.0129), sugar intake (0.0125), carbohydrate intake (0.0122), and protein intake (0.0094). C-reactive protein (CRP) (0.0089), fat intake (0.0081), age at menarche (0.0060), total caloric intake (0.0055), and age (0.0050) had the least contribution to model predictions.
SHAP-Based Model Interpretation
Follicle-stimulating hormone (FSH) was the most influential predictor of the log-transformed P4:E2 ratio. The SHAP dependence plot (Figure 2) revealed a nonlinear relationship between FSH levels and the predicted log-transformed P4:E2 ratio. As FSH concentrations increased, SHAP values rose sharply, indicating a strong positive contribution to the model’s output. This upward trend continued until approximately 75 mIU/mL, beyond which the curve began to plateau. At this inflection point, the predicted log-transformed P4:E2 ratio was approximately 0.3 (corresponding to a raw P4:E2 ratio of approximately 1.35), after which additional increases in FSH had minimal further impact on the model’s predictions. Figure 3 displays features that were ranked 2nd through 5th in impact. After FSH, the next most impactful feature was waist circumference, which exhibited a strong negative association with the log-transformed P4:E2 ratio. C-reactive protein (CRP) showed a somewhat non-linear pattern, with lower SHAP values across mid-to-high-range concentrations, approximately 3 to 10 mg/L. Total cholesterol had a moderately positive effect, with SHAP values increasing gradually across the feature range. Luteinizing hormone (LH), while influential, showed more nuanced and variable effects, with slightly positive to negative SHAP values across the distribution. Among dietary variables (Figure 4), fat, protein, and sugar intake exhibited modest non-linear relationships with the outcome. Of these three variables, sugar intake displayed the clearest pattern with a shallow decline in SHAP values across its range, suggesting a mild inverse influence. In contrast, carbohydrate intake demonstrated a non-linear increasing relationship, with SHAP values rising steadily and plateauing after approximately 250 g/day. Fiber intake had low but slightly negative SHAP contributions overall. Chronological age showed a mild U-shaped pattern, with reduced SHAP impact in midlife (ages approximately 55–70 years) and slightly higher impact at the tails of the age distribution. Age at menarche displayed increasing SHAP values though the magnitude of impact remained small. Among hormonal variables, the estrone sulfate:estrone ratio showed a distinct negative inflection at low values (around 75), with SHAP contributions becoming less positive and stabilizing across higher values. Lastly, total caloric intake showed minimal SHAP variation across its range, suggesting limited predictive influence in the context of other features.
In the estradiol model, follicle-stimulating hormone (FSH) emerged as the most influential predictor of estradiol levels, displaying a nonlinear relationship with SHAP values that plateaued beyond approximately 75 mIU/mL (Figure 5). Waist circumference similarly showed a consistent inverse association with predicted estradiol concentrations. In the progesterone model (Figure 6), total cholesterol was the most influential predictor, demonstrating a clear positive nonlinear relationship with progesterone levels. SHAP values rose rapidly with cholesterol concentrations up to ~250 mg/dL before plateauing, indicating a strong positive effect. Luteinizing hormone (LH) followed in importance, showing a consistent positive association before plateauing around 30 mIU/mL.
4. Discussion
In this study of 1,902 postmenopausal women from the NHANES dataset, we developed a machine learning model to identify key predictors of the P4:E2 ratio—an emerging risk factor for endometrial cancer. The model achieved an R2 of 0.298 on the test set, indicating that approximately 30% of the variance in the log-transformed P4:E2 ratio could be explained by the selected predictors. We found that FSH, waist circumference, and CRP were the most influential predictors, followed by total cholesterol, LH, and intake of dietary fat, protein, and sugar. Additional models revealed that FSH and waist circumference primarily predicted estradiol levels, while progesterone was more strongly influenced by cholesterol and LH. These findings offer new insights into the hormonal, metabolic, and lifestyle correlates of the P4:E2 ratio and provide a foundation for future work aimed at understanding its role in postmenopausal health and disease risk.
The observed inverse association between FSH and the P4:E2 ratio is biologically consistent with known endocrine adaptations to menopause [8]. As ovarian function declines, circulating levels of both progesterone and estradiol decrease, resulting in diminished negative feedback on the hypothalamic–pituitary–gonadal axis. Notably, progesterone production stabilizes at low levels by the onset of menopause, whereas estradiol continues to be produced in more variable quantities, with progressively lower and more stable levels as menopause progresses. As a result, with the progression of menopause, the P4:E2 ratio increases, leading to compensatory increases in FSH. This relationship is visualized in the SHAP dependence plot (Figure 2), which reveals a strong, nonlinear positive association between FSH and the predicted log-transformed P4:E2 ratio. SHAP values increase sharply with FSH concentrations up to approximately 75 mIU/mL, after which the curve plateaus, indicating a deflection point beyond which additional increases in FSH contribute minimally to the model’s output. This plateau may reflect a biological “ceiling effect,” wherein estradiol levels have already reached minimal postmenopausal values, thereby limiting the predictive utility of further increases in FSH.
Waist circumference emerged as a key feature influencing the P4:E2 ratio, with SHAP dependence plots suggesting that this effect was primarily driven by estradiol elevations associated with adiposity, while progesterone contributed a waist circumference–restricted effect that emerged only beyond higher thresholds of central adiposity. In the estradiol model, SHAP values increased steadily with waist circumference, reflecting the well-established role of adipose tissue as a site of peripheral estrogen biosynthesis via aromatization [9]. This adiposity-related rise in estradiol exerts downward pressure on the P4:E2 ratio by disproportionately elevating estradiol relative to progesterone. Notably, starting at waist circumferences of approximately 100 cm, a modest progesterone decline also emerged, suggesting that at this level of adiposity the influence of central adiposity may extend to both hormones, with progesterone dynamics contributing a secondary, waist circumference–dependent effect that reinforces the downward slope of the ratio.
C-reactive protein (CRP) emerged as one of the strongest non-hormonal predictors of the P4:E2 ratio, with SHAP dependence plots revealing a sharp decline in the ratio at lower CRP concentrations, followed by a plateau beyond approximately 5 mg/L. In the estradiol model, SHAP values increased steeply below this threshold and then stabilized, indicating a nonlinear relationship. The effects of estradiol on inflammation are context-dependent and can be pro- or anti-inflammatory depending on the cytokine profile, immune cell type, and estrogen receptor expression patterns [10]. Pro-inflammatory actions of estradiol, as suggested in the present study assessing the hormone’s association with CRP, are mediated through estrogen receptor signaling pathways that activate transcription factors, particularly in immune and endothelial cells [11]. The pattern observed in the present study underscores the importance of accounting for the concentration-sensitive interactions between estrogenic activity and inflammatory signaling in postmenopausal physiology, especially considering the altered distribution and function of estrogen receptor subtypes that occur with aging. In fact, prior studies examining the CRP–estradiol associations in postmenopausal women yielded mixed results—some reporting a positive association, others finding no significant relationship (reviewed in [12]). The use of machine learning in the present analysis enabled detection of threshold-dependent, positive nonlinear associations that helps to reconcile these discrepancies and offer a more nuanced understanding of inflammation–estradiol dynamics.
Total cholesterol exhibited a nonlinear, predominantly positive association in both the P4:E2 and progesterone models. The relationship between estradiol and total cholesterol was relatively weak and more linear, suggesting a limited role for cholesterol in estradiol regulation. The divergence in the association between the two reproductive hormones (i.e., estradiol and progesterone) and total cholesterol likely reflects differences in their positions within the steroid biosynthesis pathway, with progesterone situated upstream and closer to cholesterol than estradiol. In the P4:E2 ratio model, SHAP values increased notably between approximately 140 and 200 mg/dL, with a plateau observed at higher concentrations, indicating a threshold-dependent effect on the ratio. The progesterone model revealed a strong and pronounced positive association, with SHAP values rising steeply between 120 and 220 mg/dL before stabilizing, highlighting cholesterol as a key metabolic predictor of progesterone levels (and the higher P4:E2 ratio) in postmenopausal women.
Although ovulatory cycles cease after menopause, the pulsatile release of LH often mirrors that of FSH, albeit its secretory amplitude is smaller [13]. The non-linear relationship between LH and the P4:E2 ratio appears to reflect distinct—and at times opposing—contributions from estradiol and progesterone. In the present study, the stimulatory effect of LH on progesterone output plateaued at approximately 40 mIU/mL, contributing to an increase in the ratio within this range. Conversely, estradiol demonstrated a continuous positive association with LH across the entire range of values, exerting a countervailing influence that tempered the rise in the ratio up to 40 mIU/mL. Beyond this threshold, the persistent rise in estradiol—combined with the plateauing of progesterone—drove the ratio downward.
Carbohydrate intake emerged as the most consistent and meaningful dietary contributor across the three models. It showed a positive association with estradiol, particularly within the ~100 to ~250 g/day range, beyond which the effect plateaued. A similar but more attenuated pattern was observed in the P4:E2 ratio model, with SHAP values increasing gradually and leveling off beyond ~200 g/day. In the progesterone model, the association with carbohydrate intake was relatively flat, with only minor positive effects observed at lower intake levels, indicating a less consistent relationship. The remaining dietary measures exhibited weaker, inconsistent, or minimal effects on hormonal outcomes. The remaining dietary features tended to show nonlinear but shallow SHAP profiles, often centering near zero or demonstrating fluctuating associations that lacked clear thresholds or sustained impact across models.
The SHAP dependence plot for age at menarche in the P4:E2 ratio model revealed a U-shaped pattern, with a modest decline in the ratio observed between approximately ages 10 and 13, followed by a steady increase beyond this range. This shape appears to reflect contrasting associations in the component hormone models: in the estradiol model, earlier age at menarche is associated with higher estradiol levels, while in the progesterone model, a positive association emerges at later menarche ages. These opposing trends result in a biphasic effect on the ratio, where the influence of estradiol predominates at younger menarcheal ages, lowering the ratio, and progesterone’s influence becomes more apparent at later ages, pushing the ratio upward. This composite pattern underscores how developmental timing may impart lasting effects on postmenopausal hormonal balance through divergent trajectories of individual steroid hormones. The SHAP dependence plots for age across the three models—estradiol, progesterone, and the P4:E2 ratio—show largely modest and inconsistent effects, suggesting limited explanatory value of chronological age alone in postmenopausal hormone variability.
Estrone sulfate serves as a circulating estrogen reservoir that can be converted to bioactive estradiol via the intermediate estrone conversion step. This process appears to be limited in postmenopausal women as the SHAP dependence plots reveal subtle associations across the estradiol and P4:E2 models. In the estradiol model, there is a mild nonlinear relationship, with SHAP values increasing slightly at low ratio values, followed by a plateau, suggesting a modest positive influence of a higher sulfate-to-parent hormone balance on estradiol levels. Similarly, the P4:E2 ratio model exhibits minimal SHAP variation across the estrone sulfate:estrone ratio range, indicating limited influence on the ratio itself. These findings suggest that while estrone sulfate may contribute to estradiol availability, its impact is not strong enough to meaningfully affect the balance between progesterone and estradiol in a postmenopausal context.
Having examined the individual SHAP dependence patterns above, a more integrated understanding takes shape regarding the interplay between global feature importance and context-specific hormonal dynamics. Estradiol consistently emerged as the dominant hormonal driver across the examined features, demonstrating the highest SHAP magnitudes and most pronounced associations in both the individual estradiol model and the P4:E2 ratio model (Table 2). However, although the overall SHAP magnitude for the progesterone model was modest, the hormone nonetheless exerted a meaningful influence on the P4:E2 ratio in specific contexts. This was particularly evident for features such as total cholesterol LH, and waist circumference where SHAP dependence plots showed that progesterone altered the shape and direction of the ratio’s response. These findings underscore the importance of considering biological relevance alongside global model performance metrics. Progesterone’s sensitivity to upstream metabolic and gonadotropic signals—even if less predictive in isolation—can meaningfully modulate hormonal balance, particularly in systems modeled as ratios. Thus, while estradiol was the dominant driver of SHAP variance in most cases, progesterone’s context-specific contributions add interpretive depth to mechanistic inferences.
The mechanistic insights presented here align with epidemiological evidence linking distinct patterns of progesterone and estradiol concentrations to hormone-sensitive cancer risk in postmenopausal women. Notably, endogenous progesterone appears to play divergent roles in relation to estradiol — reducing risk in the endometrium but potentially increasing it in the breast. In a case-cohort study nested within the Breast and Bone Follow-up to the Fracture Intervention Trial examining endometrial cancer incidence in relation to progesterone to estradiol ratio in postmenopausal women during a 12-year follow-up, Trabert et al. (2021) [5] reported that postmenopausal women with high estradiol and low progesterone had the highest risk of developing endometrial cancer, while those with higher progesterone levels exhibited reduced risk. In contrast, in the same cohort, analysis of 405 incident breast cancer cases revealed that elevated progesterone concentrations were associated with an increased risk of invasive breast cancer—particularly when estradiol levels were also high [14]. Together, these data underscore the complex and tissue-specific roles of progesterone in hormone-sensitive cancers—exerting protective effects in the endometrium while potentially promoting tumorigenesis in the breast. Indeed, although both clinical and epidemiological studies support a synergistic role of estradiol and progesterone in elevating breast cancer risk, disentangling their individual contributions remains challenging due to the partial dependence of progesterone receptor transcription on estrogen receptor α–mediated signaling [15]. Thus, evaluating their combined hormonal interaction may be more informative than attempting to isolate independent effects [15].
The divergent role of progesterone in endometrial versus breast cancer risk underscores the importance of contextualizing hormonal balance within specific biological outcomes and disease pathways, reinforcing the need for mechanistically informed, tissue-targeted research in postmenopausal women. In this regard, the present study’s feature-level SHAP modeling offers a framework for disentangling the nuanced, context-dependent effects of individual hormones. As an example, the analysis of waist circumference revealed how central adiposity may elevate estradiol and reduce progesterone in a threshold-dependent manner (i.e., waist circumference >100 cm) to promote endometrial proliferation while potentially mitigating breast carcinogenesis.
Despite offering valuable insights into the determinants of the P4:E2 ratio, several limitations should be noted. The cross-sectional nature of the NHANES dataset limits causal inference, as the temporal ordering between predictors and hormone levels cannot be established. Although the P4:E2 model explained a moderate proportion of variance (R2 = 0.298), the progesterone model demonstrated low predictive performance (R2 = 0.022), suggesting that relevant biological or behavioral variables may be unmeasured or inadequately captured. Finally, residual confounding remains a concern, as unmeasured factors such as stress and circadian timing could influence hormonal dynamics.
5. Conclusions
In conclusion, this study provides novel insights into the determinants of the progesterone-to-estradiol (P4:E2) ratio in postmenopausal women using explainable machine learning. By modeling both the ratio and its constituent hormones, we revealed that estradiol variation was largely driven by gonadotropic and anthropometric features—particularly FSH and waist circumference—while progesterone was more sensitive to metabolic and gonadotropic signals such as total cholesterol and LH. Although progesterone exhibited low global predictive power, its SHAP dependence patterns demonstrated context-specific influence on the ratio, particularly in response to metabolic and central adiposity-related features. These findings underscore the importance of interpreting hormonal balance through both predictive and biological lenses, highlighting the nuanced interplay of endocrine factors in postmenopausal physiology. Future longitudinal studies incorporating circadian sampling, broader metabolic and behavioral variables, and outcome-specific modeling will be critical for refining mechanistic understanding and informing hormone-based cancer risk stratification strategies in aging women.
Supplementary Materials
The following supporting information can be downloaded at the website of this paper posted on Preprints.org, Figure S1: Residuals vs Predicted (left) and Predicted vs Observed (right) of the test set for the log-transformed P4:E2 ratio model; Table S1: Variable Percent Missing in the Analysis Dataset.
Author Contributions
For research articles with several authors, a short paragraph specifying their individual contributions must be provided. The following statements should be used “Conceptualization, A.H.; methodology, A.H.; validation, A.H.; formal analysis, A.H.; investigation, A.H.; resources, J.D.; data curation, A.H.; writing—original draft preparation, A.H.; writing—review and editing, A.H., M.B.; visualization, A.H.; project administration, A.H.; funding acquisition, J.D. All authors have read and agreed to the published version of the manuscript.”
Funding
This research received no external funding
Institutional Review Board Statement
The NHANES protocols are reviewed and approved by the National Center for Health Statistics (NCHS) Research Ethics Review Board (ERB) to ensure compliance with ethical standards for research involving human subjects. NHANES adheres to the principles outlined in the Declaration of Helsinki and follows U.S. Department of Health and Human Services regulations (45 CFR part 46) for the protection of human subjects. Data made publicly available by NHANES is de-identified to protect participant privacy.
Informed Consent Statement
All NHANES participants provide written informed consent before participating in any aspect of the survey, including interviews, physical examinations, and biological sample collection.
Data Availability Statement
No new data were created.
Acknowledgments
During the preparation of this manuscript/study, the authors used Chat GTP-4o for the purposes of text editing and code facilitation. The authors have reviewed and edited the output and take full responsibility for the content of this publication.”
Conflicts of Interest
The authors declare no conflicts of interest.
References
- Rosano, G.M.C.; Webb, C.M.; Chierchia, S.; Luigi Morgani, G.; Gabraele, M.; Sarrel, P.M.; De Ziegler, D.; Collins, P. Natural Progesterone, but Not Medroxyprogesterone Acetate, Enhances the Beneficial Effect of Estrogen on Exercise-Induced Myocardial Ischemia in Postmenopausal Women. Journal of the American College of Cardiology 2000, 36, 2154–2159. [Google Scholar] [CrossRef] [PubMed]
- Clarke, C.L.; Sutherland, R.L. Progestin Regulation of Cellular Proliferation. Endocr Rev 1990, 11, 266–301. [Google Scholar] [CrossRef] [PubMed]
- Key, T.J.; Pike, M.C. The Dose-Effect Relationship between “unopposed” Oestrogens and Endometrial Mitotic Rate: Its Central Role in Explaining and Predicting Endometrial Cancer Risk. Br J Cancer 1988, 57, 205–212. [Google Scholar] [CrossRef] [PubMed]
- Kim, J.J.; Chapman-Davis, E. Role of Progesterone in Endometrial Cancer. Semin Reprod Med 2010, 28, 81–90. [Google Scholar] [CrossRef] [PubMed]
- Trabert, B.; Geczik, A.M.; Bauer, D.C.; Buist, D.S.M.; Cauley, J.A.; Falk, R.T.; Gierach, G.L.; Hue, T.F.; Lacey, J.V.; LaCroix, A.Z.; et al. Association of Endogenous Pregnenolone, Progesterone, and Related Metabolites with Risk of Endometrial and Ovarian Cancers in Postmenopausal Women: The B∼FIT Cohort. Cancer Epidemiol Biomarkers Prev 2021, 30, 2030–2037. [Google Scholar] [CrossRef] [PubMed]
- Kuhn, M. Building Predictive Models in R Using the Caret Package. J. Stat. Soft. 2008, 28. [Google Scholar] [CrossRef]
- Chen, T.; Guestrin, C. XGBoost: A Scalable Tree Boosting System. In Proceedings of the Proceedings of the 22nd ACM SIGKDD International Conference on Knowledge Discovery and Data Mining; ACM: San Francisco California USA, August 13, 2016; pp. 785–794. [Google Scholar]
- Hall, J.E. Endocrinology of the Menopause. Endocrinology and Metabolism Clinics of North America 2015, 44, 485–496. [Google Scholar] [CrossRef]
- Simpson, E.R. Sources of Estrogen and Their Importance. The Journal of Steroid Biochemistry and Molecular Biology 2003, 86, 225–230. [Google Scholar] [CrossRef] [PubMed]
- Cutolo, M.; Capellino, S.; Sulli, A.; Serioli, B.; Secchi, M.E.; Villaggio, B.; Straub, R.H. Estrogens and Autoimmune Diseases. Ann N Y Acad Sci 2006, 1089, 538–547. [Google Scholar] [CrossRef] [PubMed]
- Kovats, S. Estrogen Receptors Regulate Innate Immune Cells and Signaling Pathways. Cell Immunol 2015, 294, 63–69. [Google Scholar] [CrossRef] [PubMed]
- Park, J.-M.; Lee, Y.-J. Serum Oestradiol Levels Are Inversely Associated with C-Reactive Protein Levels in Premenopausal Women, but Not Postmenopausal Women. J Int Med Res 2020, 48, 300060520961228. [Google Scholar] [CrossRef] [PubMed]
- Huerta, R.; Malacara, J.M.; Fajardo, M.E.; Nava, L.E.; Bocanegra, A.; Sanchez, J. High-Frequency FSH and LH Pulses in Obese Menopausal Women. Endocrine 1997, 7, 281–286. [Google Scholar] [CrossRef] [PubMed]
- Trabert, B.; Bauer, D.C.; Buist, D.S.M.; Cauley, J.A.; Falk, R.T.; Geczik, A.M.; Gierach, G.L.; Hada, M.; Hue, T.F.; Lacey, J.V.; et al. Association of Circulating Progesterone With Breast Cancer Risk Among Postmenopausal Women. JAMA Netw Open 2020, 3, e203645. [Google Scholar] [CrossRef] [PubMed]
- Trabert, B.; Sherman, M.E.; Kannan, N.; Stanczyk, F.Z. Progesterone and Breast Cancer. Endocr Rev 2020, 41, 320–344. [Google Scholar] [CrossRef] [PubMed]
Figure 1.
SHAP Beeswarm Plot. Summary plot displaying the distribution of SHAP values for each feature across all observations. Each point represents an individual SHAP value, color-coded by the scaled feature value. Features at the top were the most influential.
Figure 1.
SHAP Beeswarm Plot. Summary plot displaying the distribution of SHAP values for each feature across all observations. Each point represents an individual SHAP value, color-coded by the scaled feature value. Features at the top were the most influential.
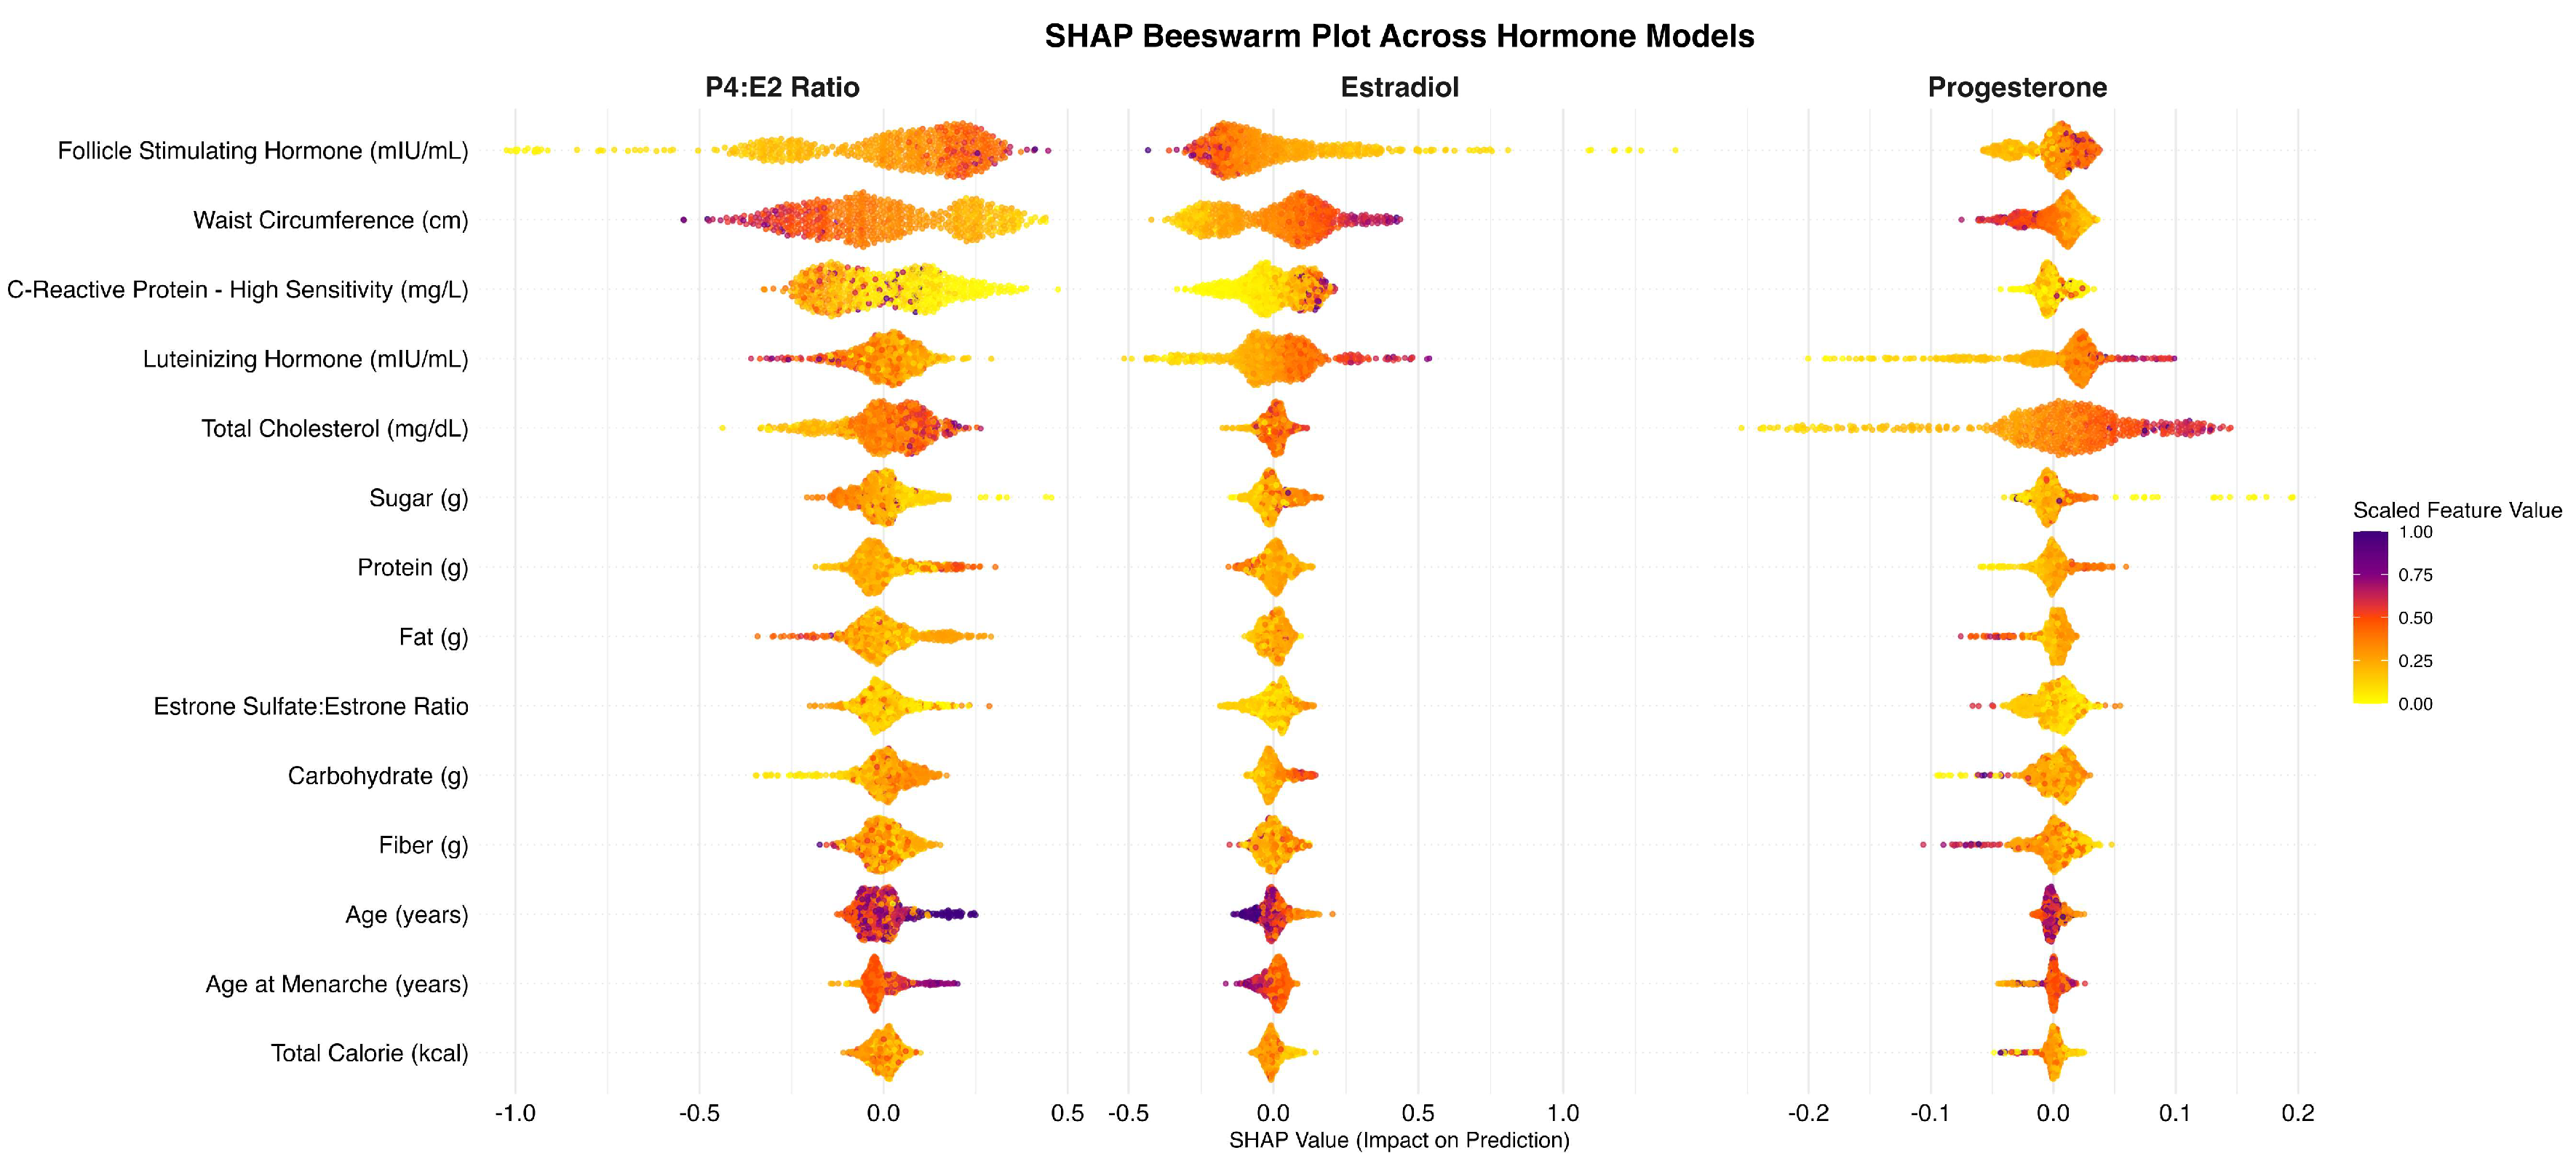
Figure 2.
SHAP Dependence Plot for Follicle-Stimulating Hormone (FSH). The plot illustrates the relationship between FSH levels (mIU/mL) and their corresponding SHAP values, reflecting the impact of FSH on the model’s prediction of the log-transformed progesterone-to-estradiol (P4:E2) ratio.
Figure 2.
SHAP Dependence Plot for Follicle-Stimulating Hormone (FSH). The plot illustrates the relationship between FSH levels (mIU/mL) and their corresponding SHAP values, reflecting the impact of FSH on the model’s prediction of the log-transformed progesterone-to-estradiol (P4:E2) ratio.
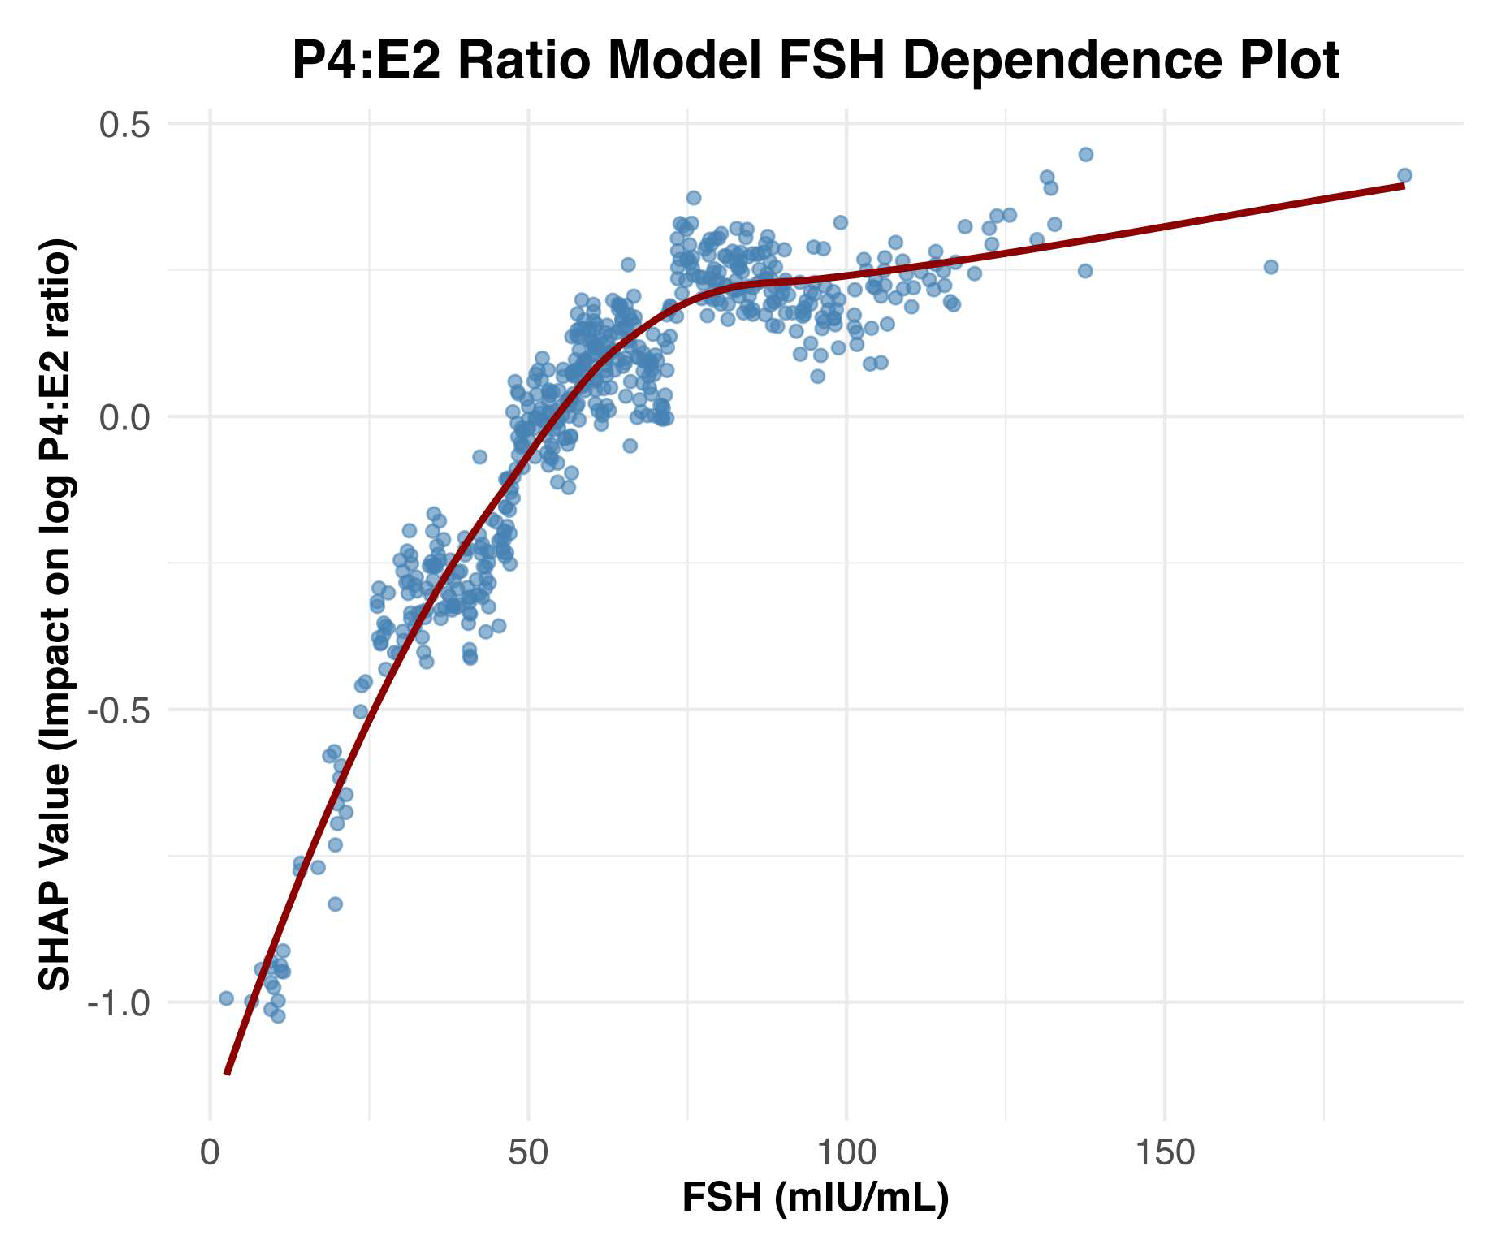
Figure 3.
SHAP Dependence Plots for Top Features Associated with the Log P4:E2 Ratio (After FSH). The figure presents SHAP dependence plots for the four most influential features following FSH, positioned clockwise from the top left: waist circumference (top left), C-reactive protein (CRP) (top right), luteinizing hormone (LH) (bottom right), and total cholesterol (bottom left).
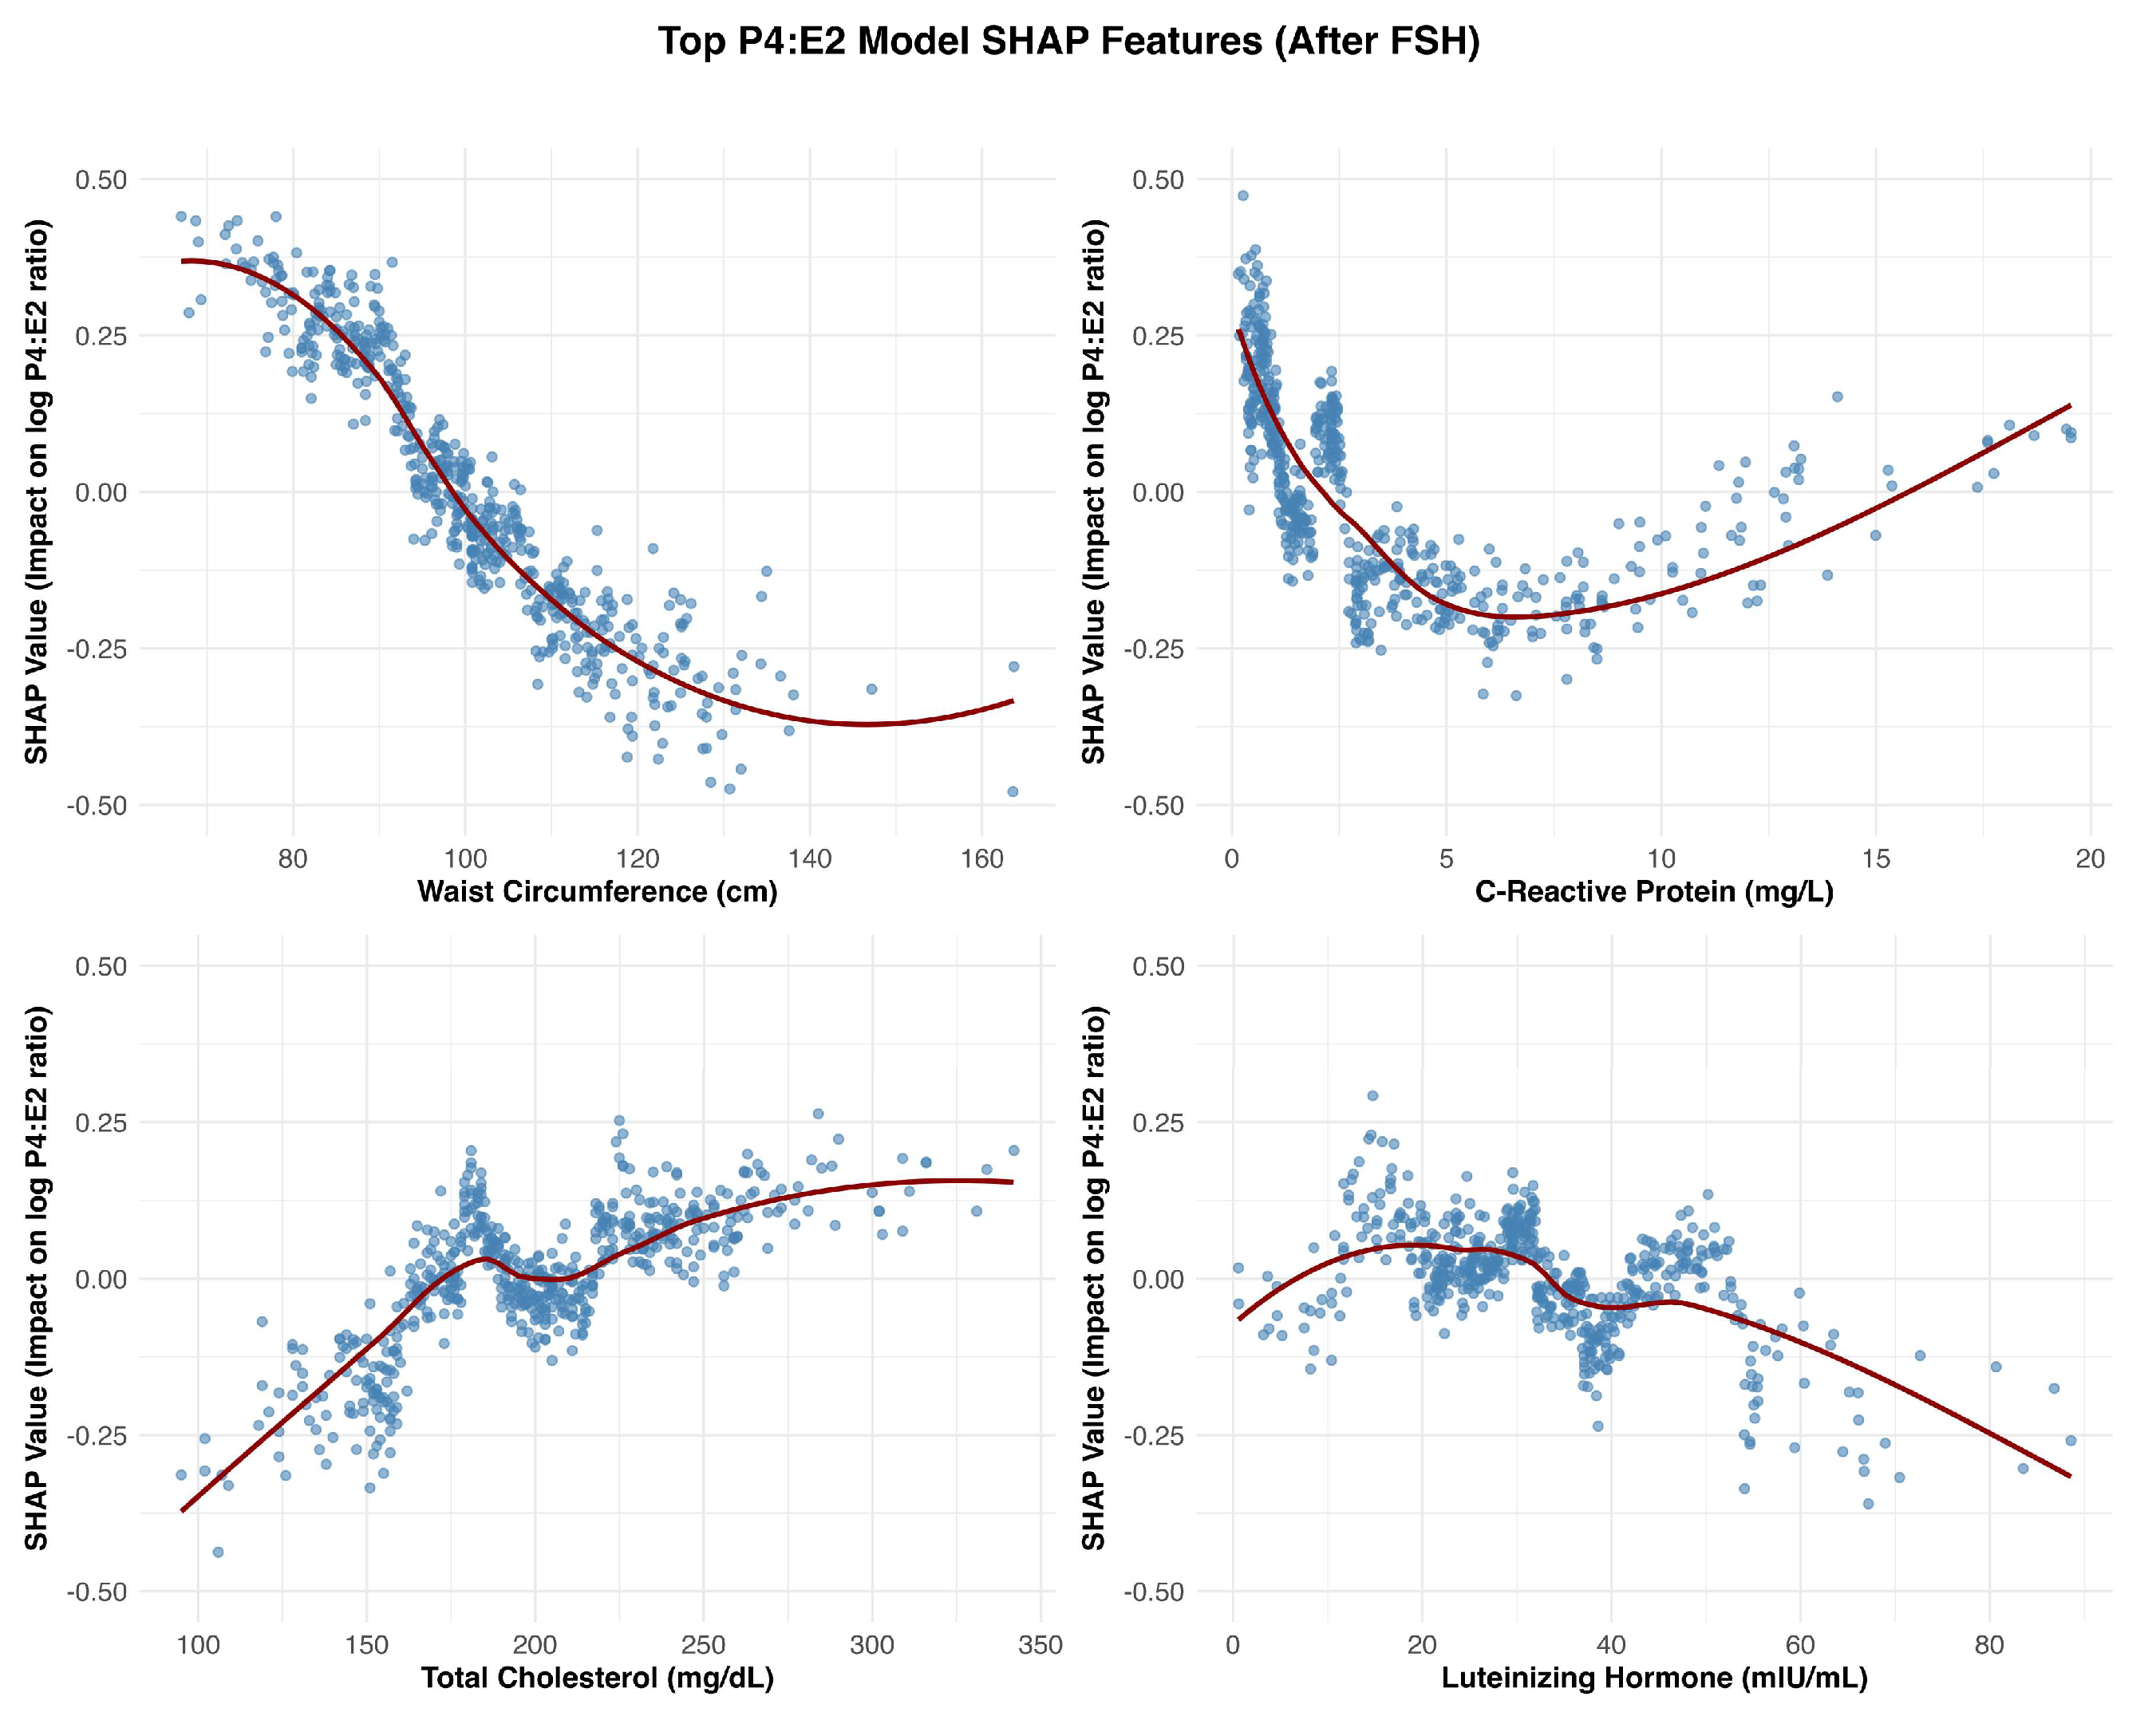
Figure 4.
SHAP Dependence Plots for Remaining Features Associated with the Log P4:E2 Ratio. This figure presented SHAP dependence plots for the remaining features in the model, organized left to right and top to bottom: fat (g), protein (g), sugar (g), carbohydrate (g), age (years), estrone sulfate:estrone ratio, fiber (g), age at menarche (years), and total calorie intake (kcal).
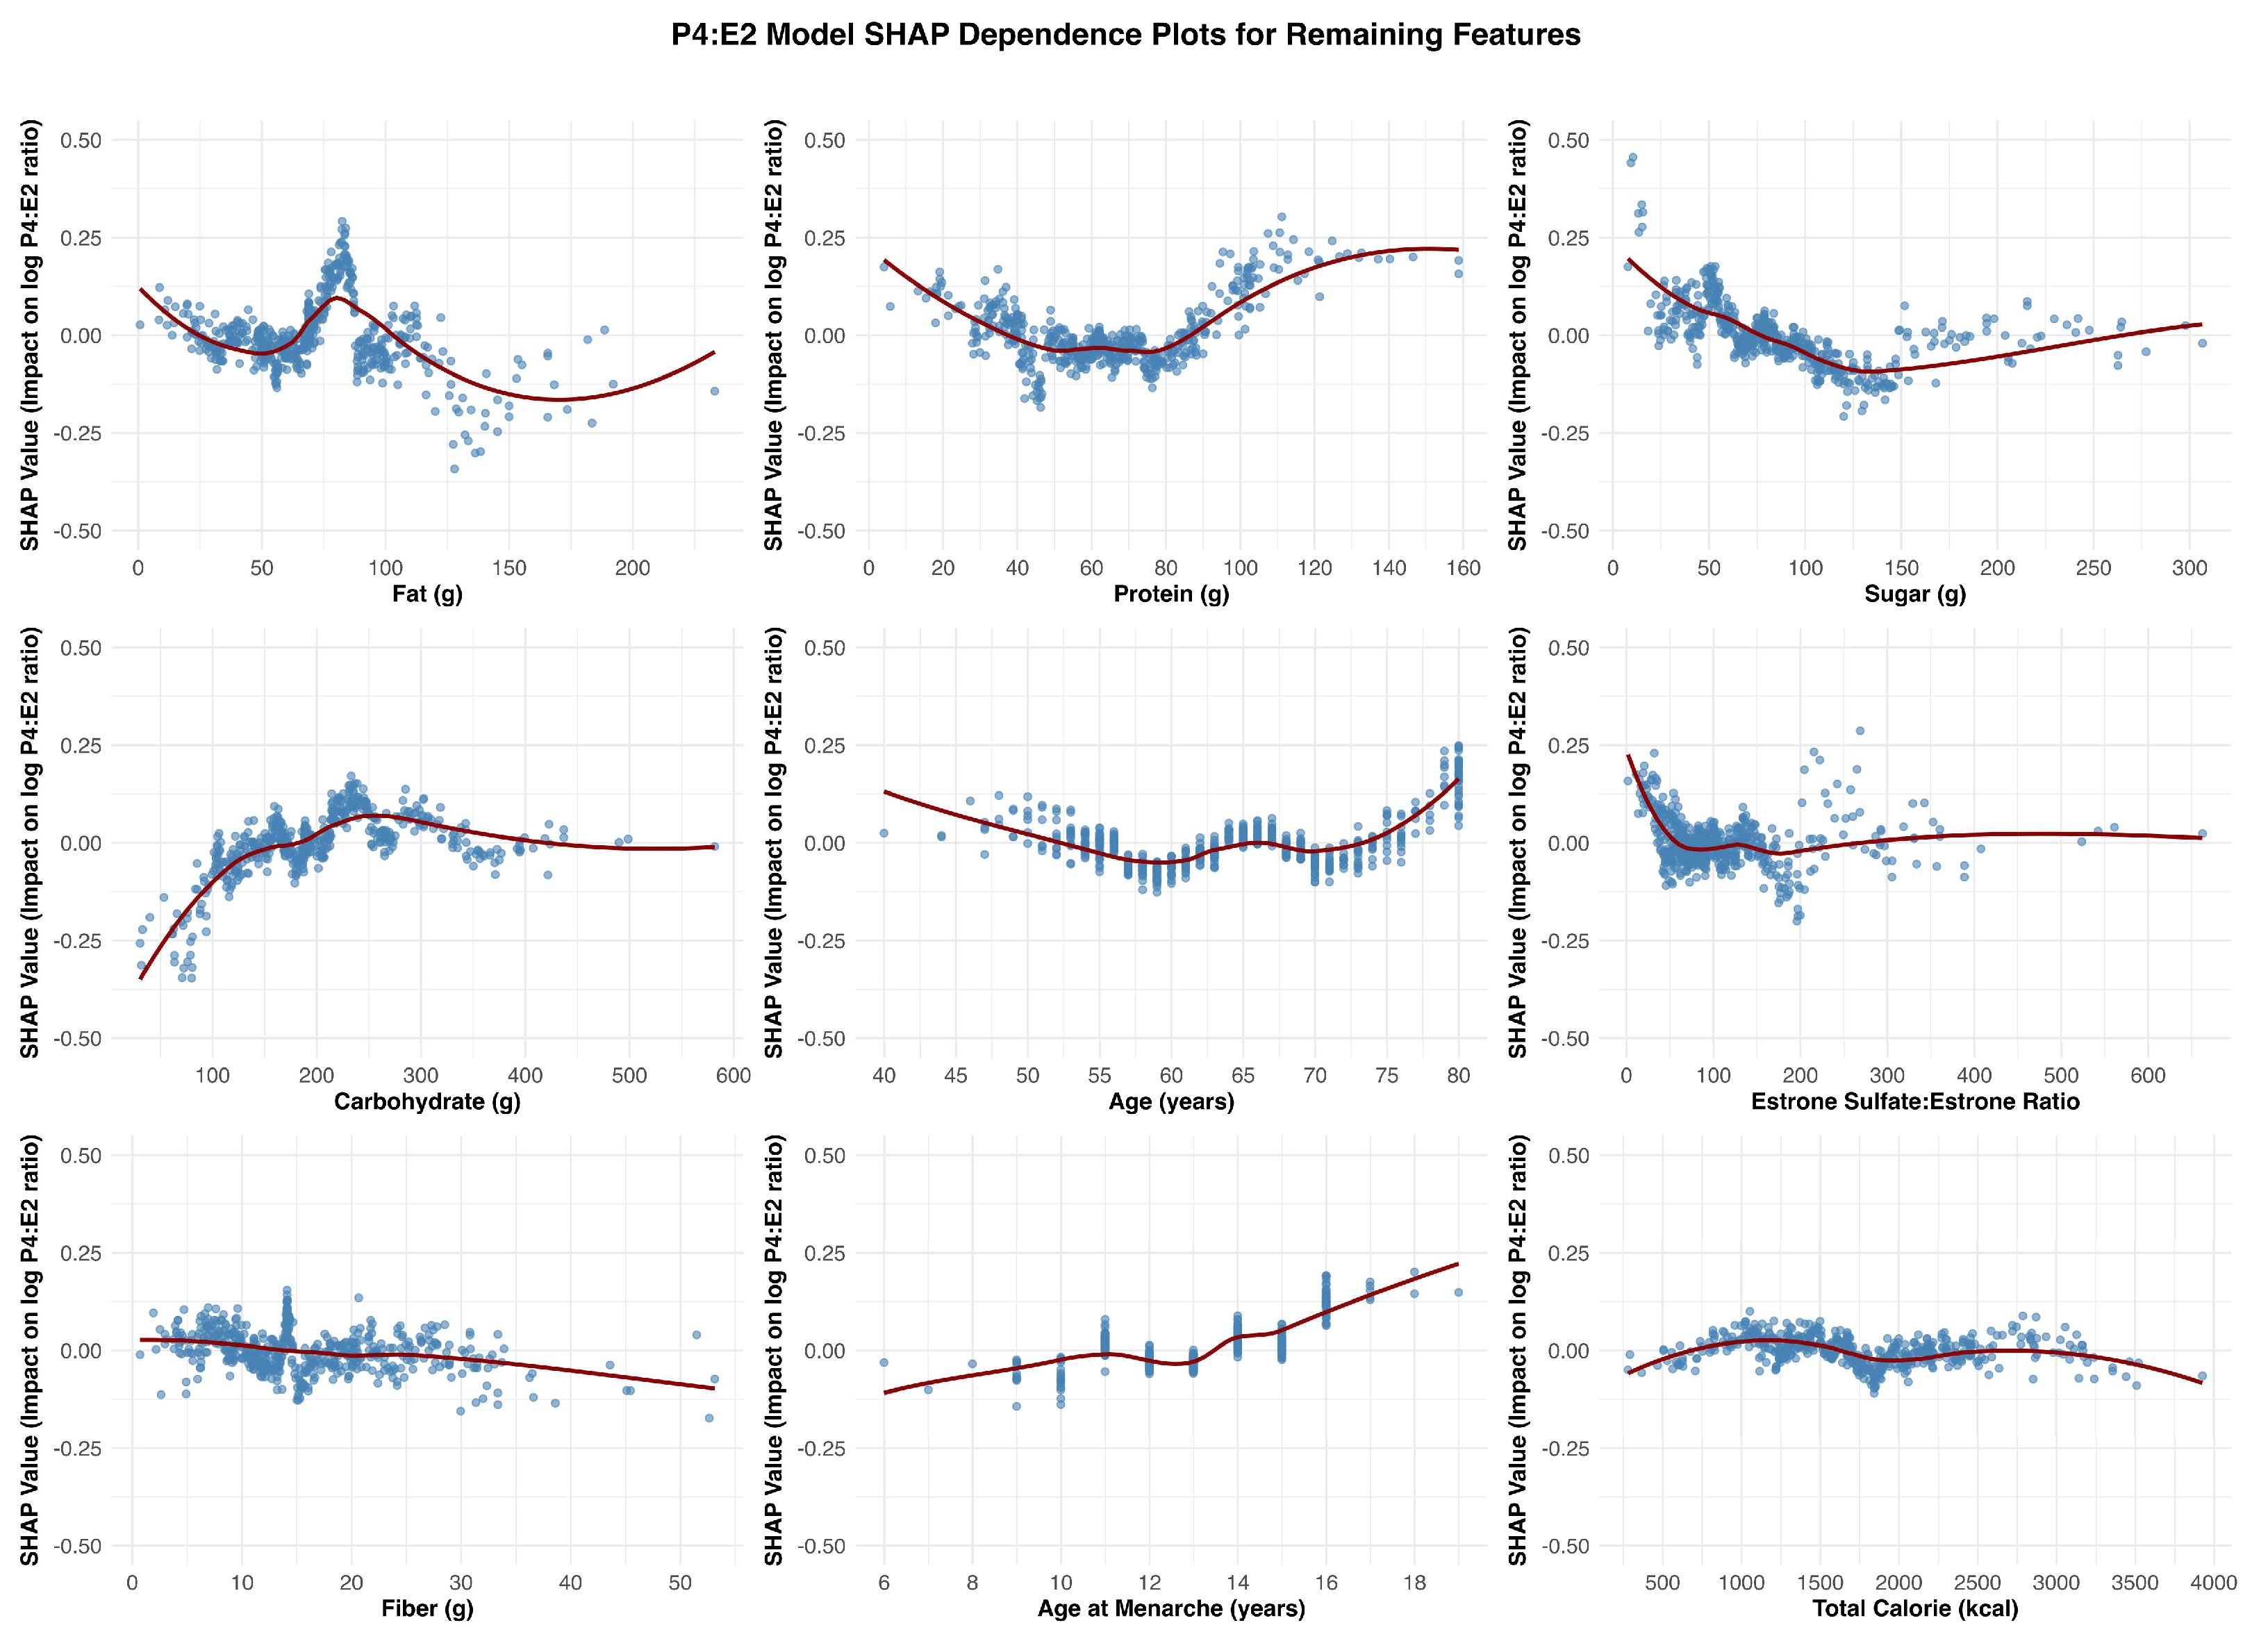
Figure 5.
SHAP Dependence Plots for Study Features Associated with Estradiol (log).
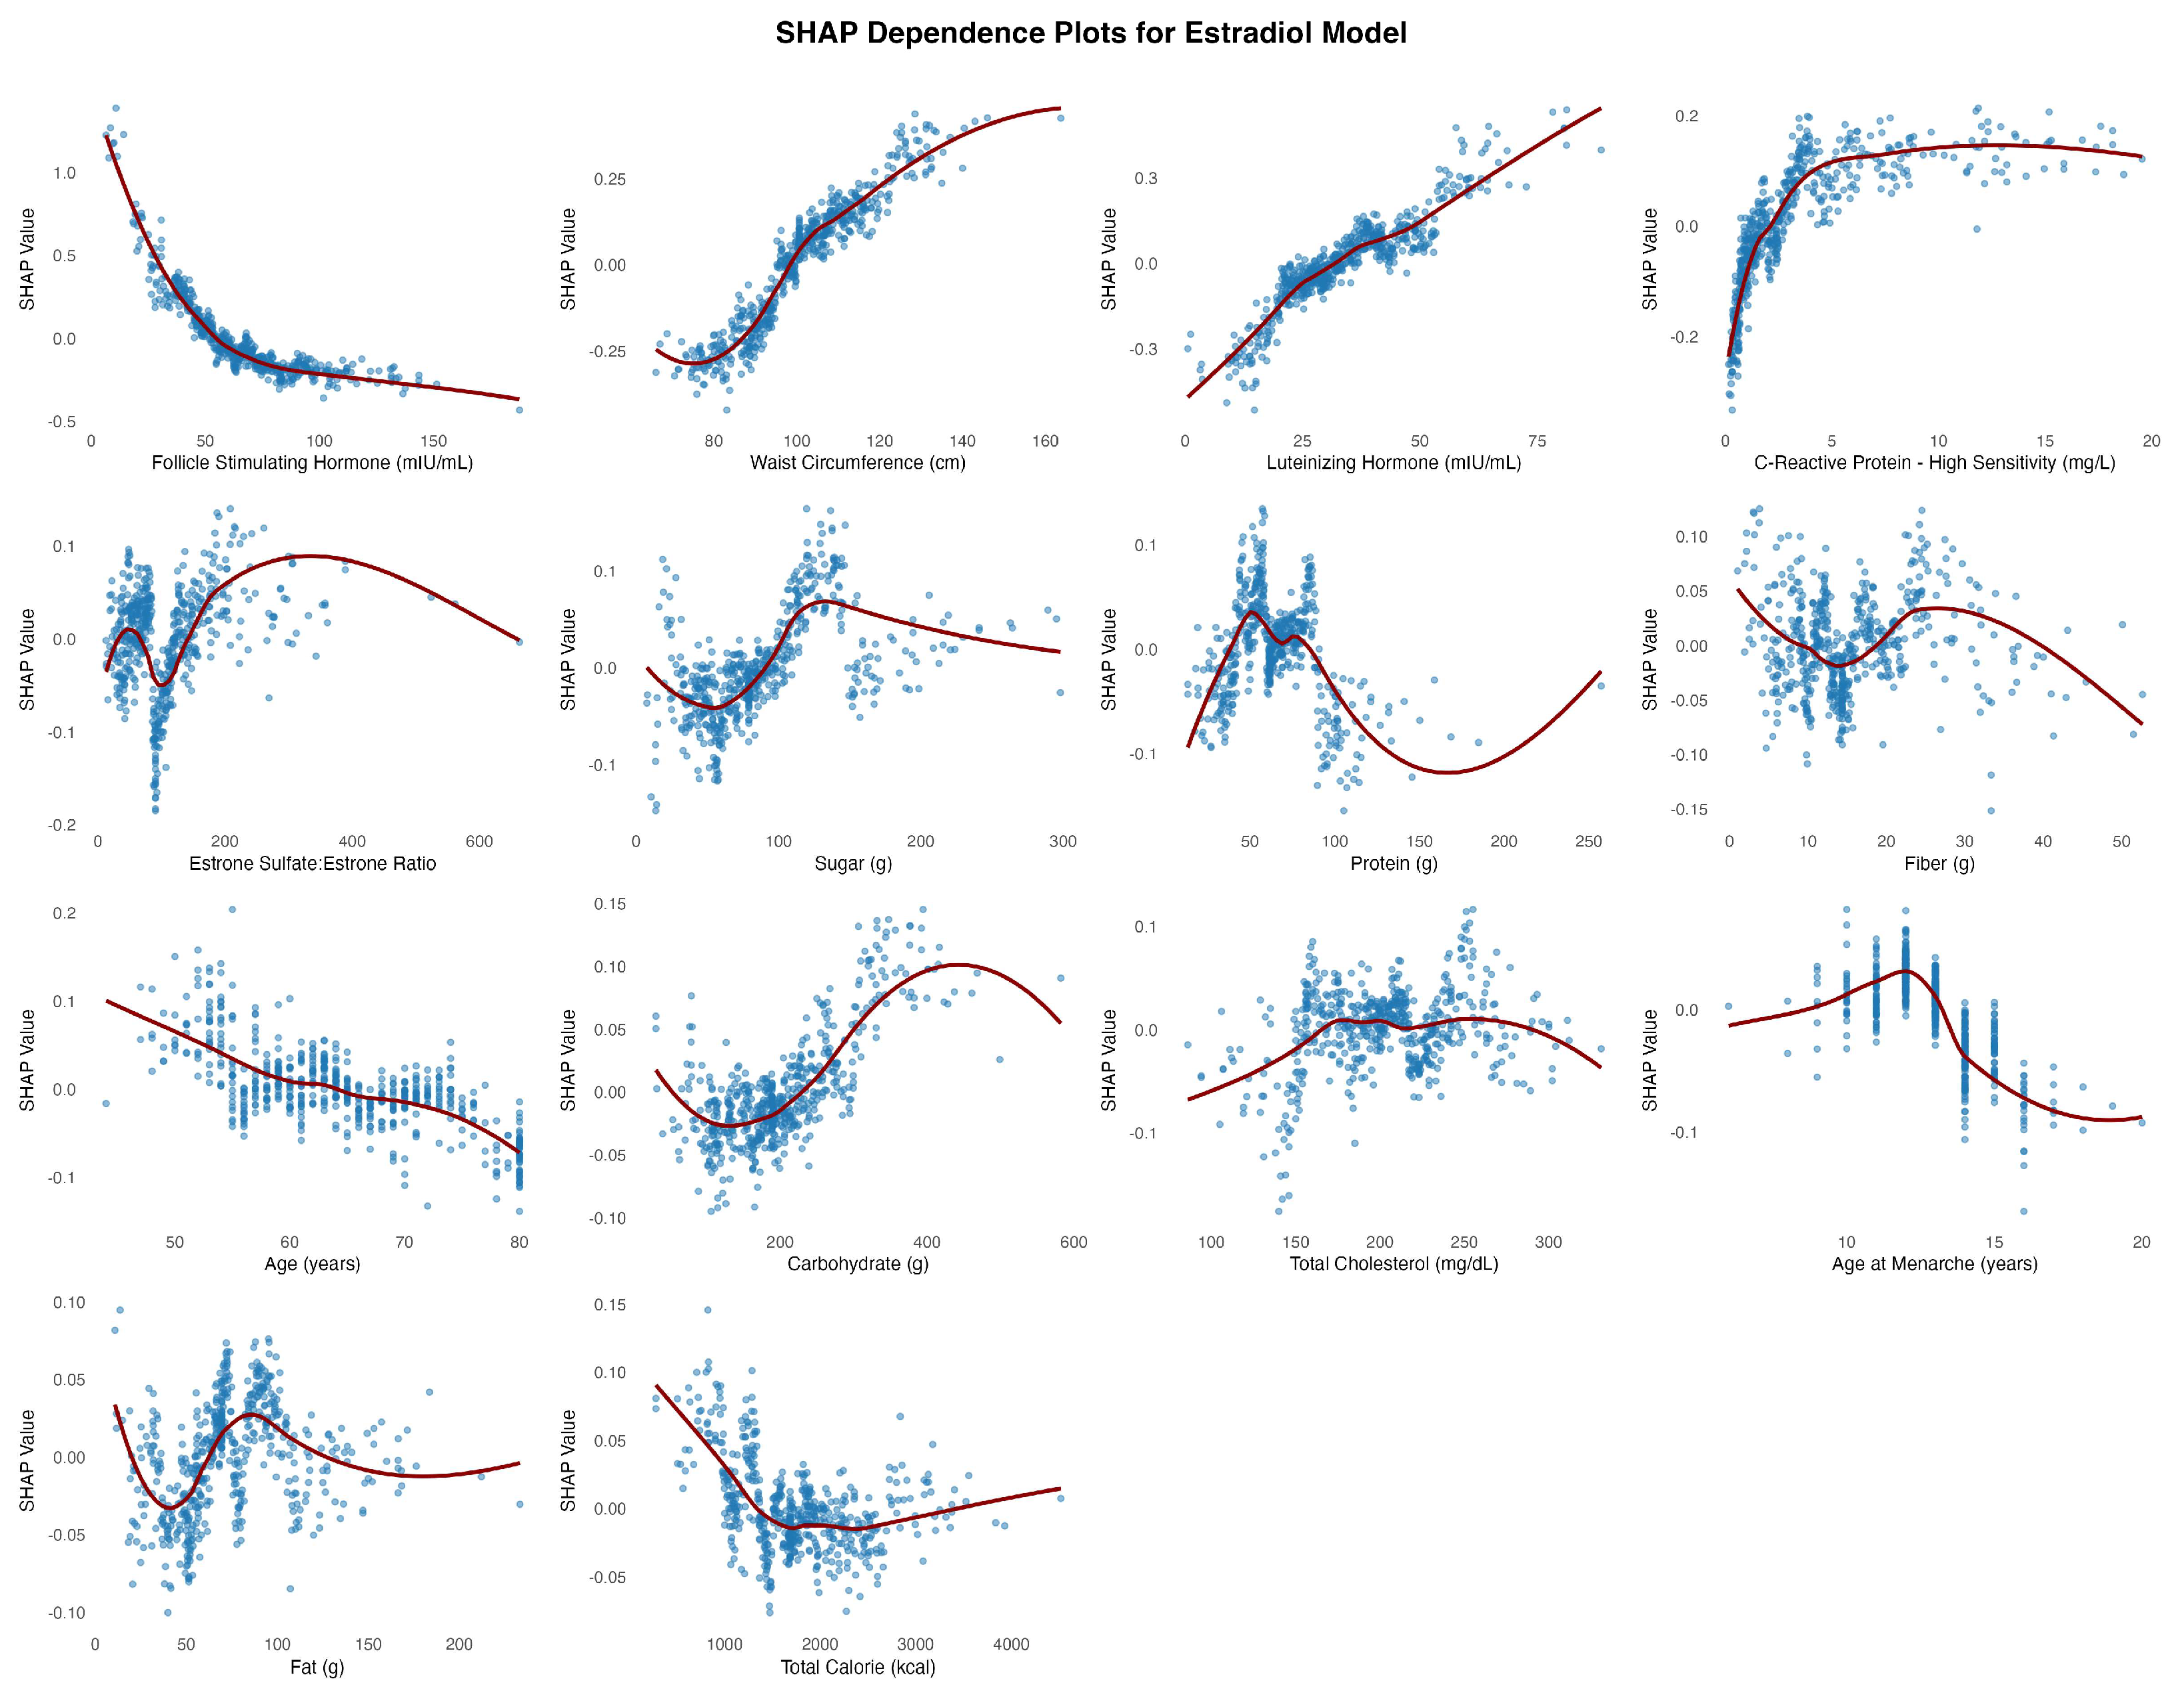
Figure 6.
SHAP Dependence Plots for Study Features Associated with Progesterone (log).
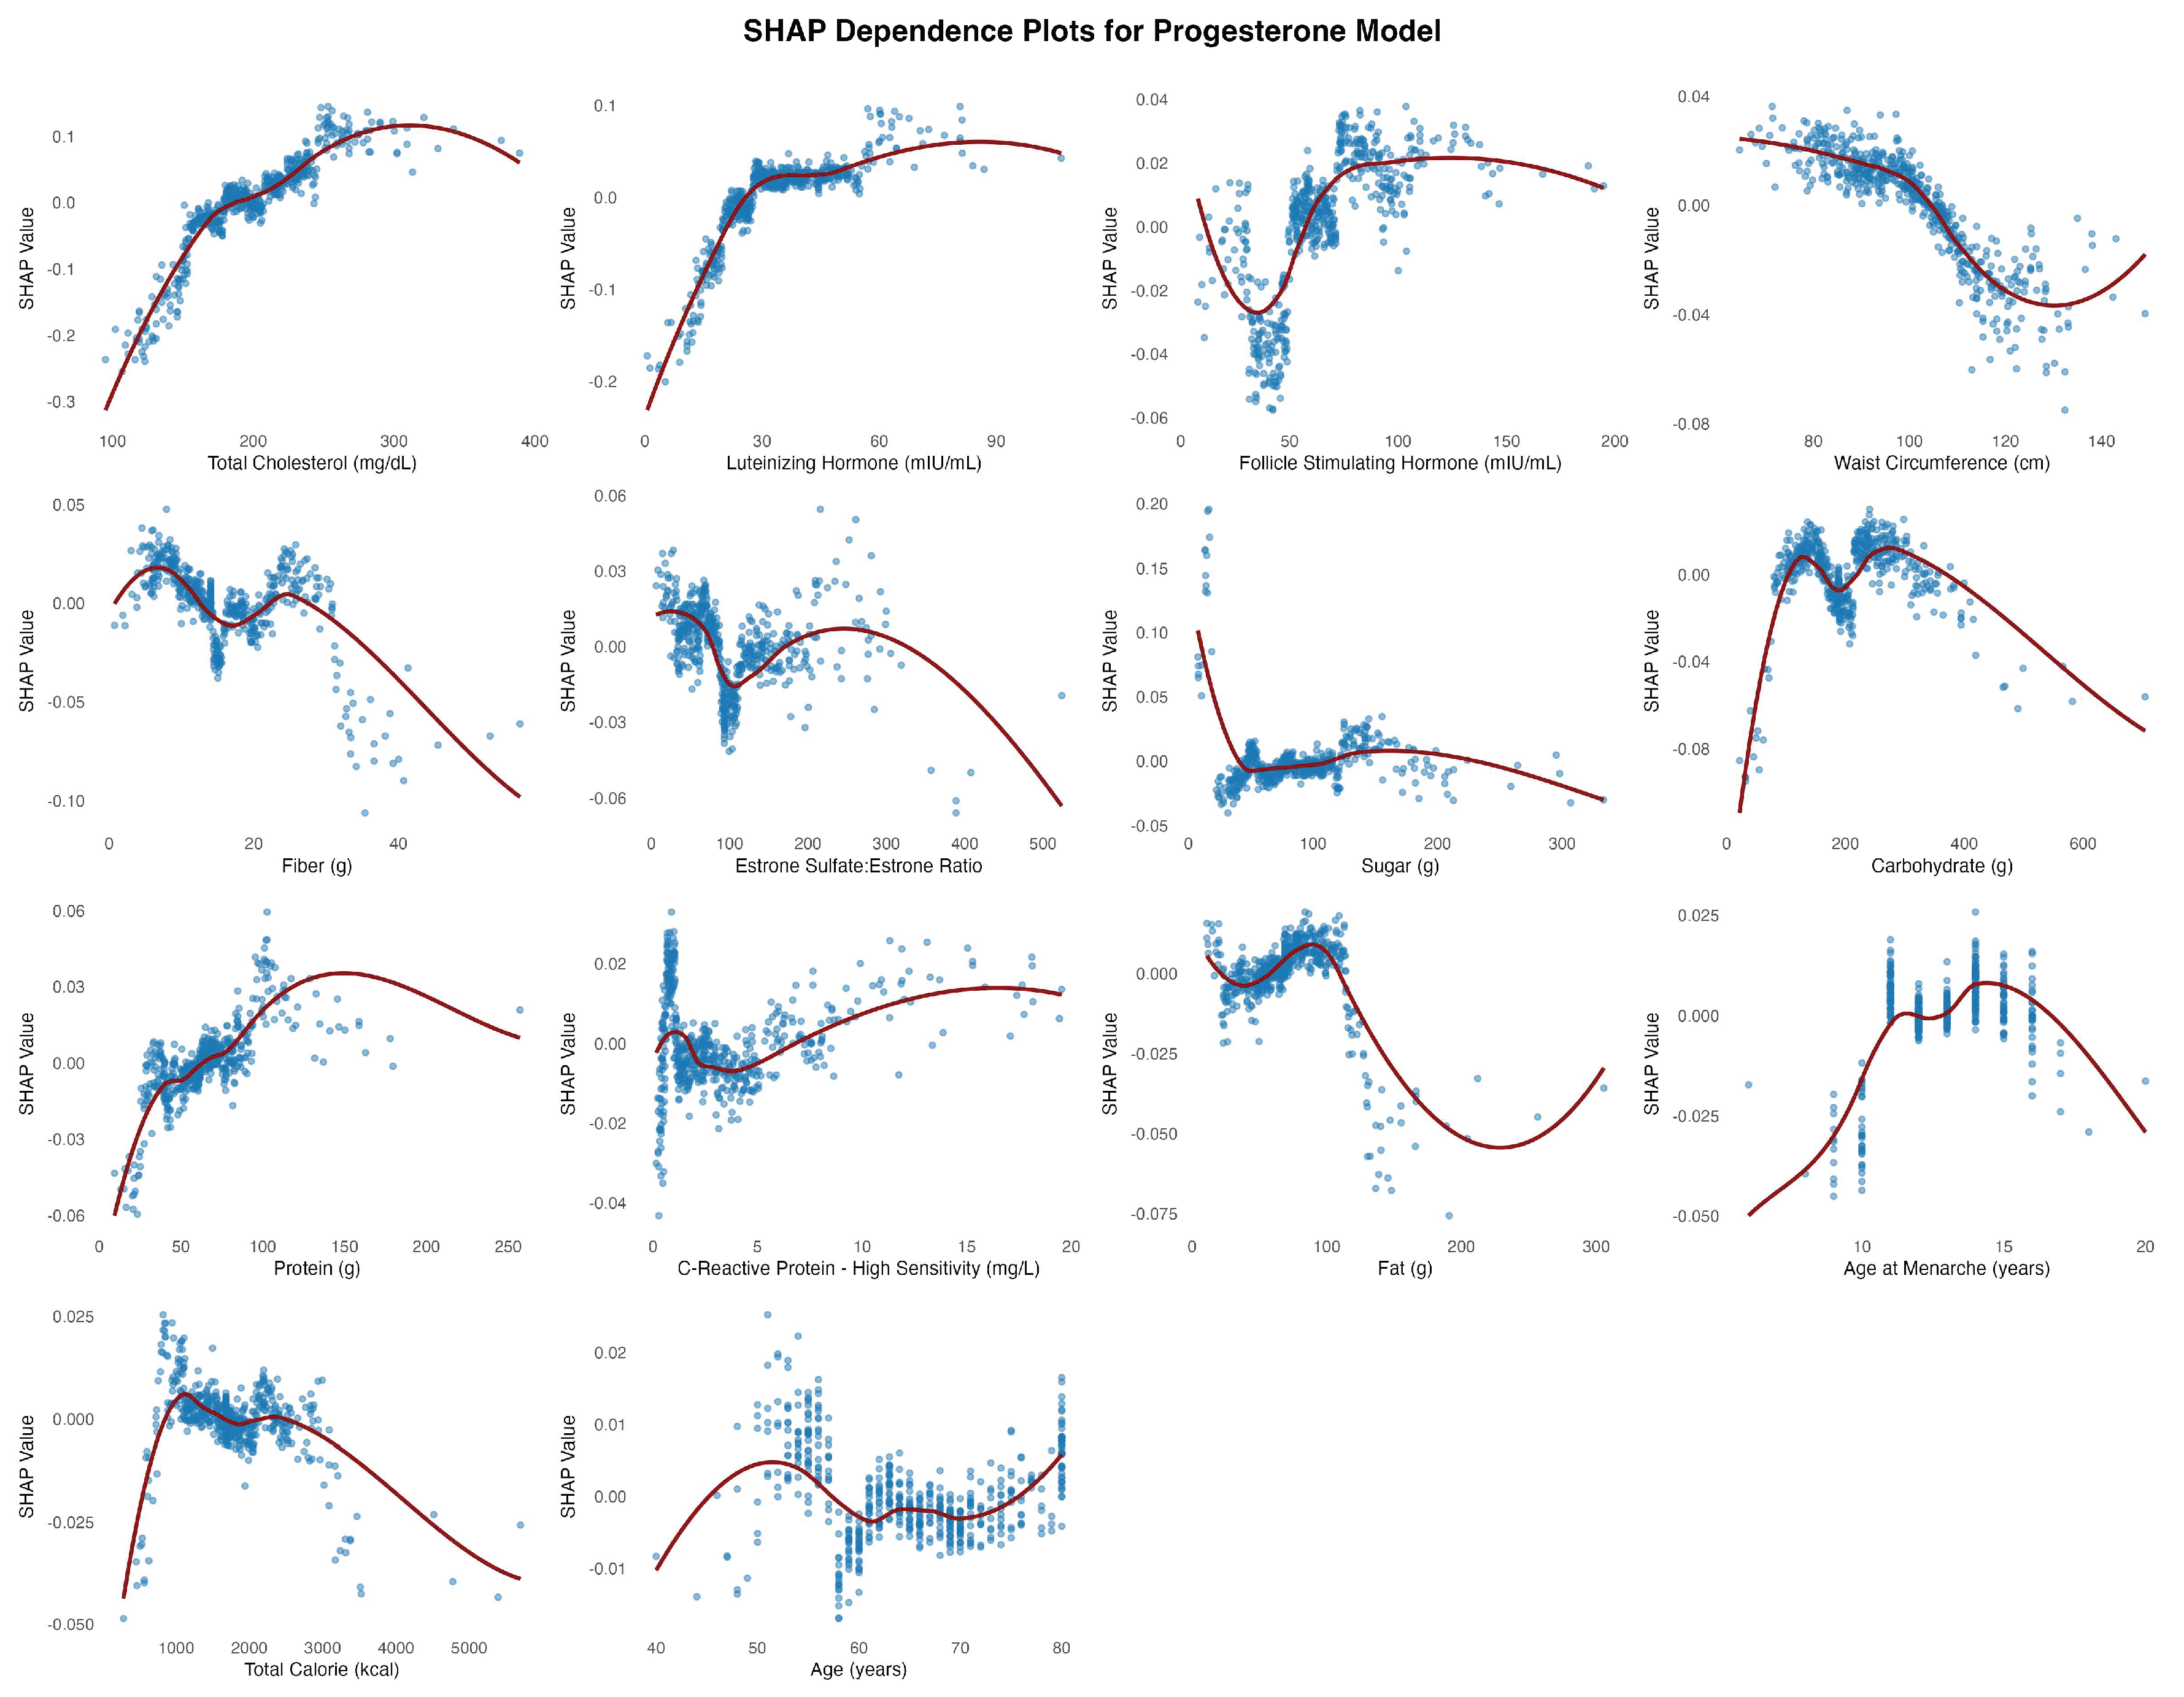

Table 1.
Predictive Performance of XGBoost Models for Hormone Outcomes in Postmenopausal Women.
| Outcome | Dataset | RMSE | MAE | R2 |
| P4:E2 ratio | Training | 0.393 | 0.295 | 0.830 |
| Test | 0.746 | 0.574 | 0.298 | |
| Estradiol | Training | 0.313 | 0.237 | 0.835 |
| Test | 0.629 | 0.479 | 0.306 | |
| Progesterone | Training | 0.660 | 0.492 | 0.183 |
| Test | 0.681 | 0.528 | 0.022 |
Table 2.
Mean Absolute SHAP Values for Predictors of P4:E2 Ratio, Estradiol, and Progesterone.
| Predictor Variable | P4:E2 Ratio | Estradiol | Progesterone |
| Follicle Stimulating Hormone (mIU/mL) | 0.2133 | 0.1821 | 0.0178 |
| Waist Circumference (cm) | 0.1802 | 0.1610 | 0.0165 |
| C-Reactive Protein (mg/L) | 0.1340 | 0.0930 | 0.0089 |
| Total Cholesterol (mg/dL) | 0.0878 | 0.0294 | 0.0527 |
| Luteinizing Hormone (mIU/mL) | 0.0668 | 0.1180 | 0.0346 |
| Fat (g) | 0.0660 | 0.0293 | 0.0081 |
| Protein (g) | 0.0589 | 0.0377 | 0.0094 |
| Sugar (g) | 0.0564 | 0.0411 | 0.0125 |
| Carbohydrate (g) | 0.0538 | 0.0320 | 0.0122 |
| Age (years) | 0.0497 | 0.0346 | 0.0050 |
| Estrone Sulfate:Estrone Ratio | 0.0452 | 0.0437 | 0.0129 |
| Fiber (g) | 0.0422 | 0.0349 | 0.0138 |
| Age at Menarche (years) | 0.0375 | 0.0293 | 0.0060 |
| Total Calorie (kcal) | 0.0276 | 0.0243 | 0.0055 |
Disclaimer/Publisher’s Note: The statements, opinions and data contained in all publications are solely those of the individual author(s) and contributor(s) and not of MDPI and/or the editor(s). MDPI and/or the editor(s) disclaim responsibility for any injury to people or property resulting from any ideas, methods, instructions or products referred to in the content. |
© 2025 by the authors. Licensee MDPI, Basel, Switzerland. This article is an open access article distributed under the terms and conditions of the Creative Commons Attribution (CC BY) license (http://creativecommons.org/licenses/by/4.0/).
Copyright: This open access article is published under a Creative Commons CC BY 4.0 license, which permit the free download, distribution, and reuse, provided that the author and preprint are cited in any reuse.


