Submitted:
30 October 2025
Posted:
31 October 2025
You are already at the latest version
Abstract
Enhancing grain quality is a primary breeding goal for sorghum [Sor-ghum bicolor (L.) Moench]. The levels of tannins, starch, and proteins have the greatest impact on the nutritional value and end-use quality of sorghum grains; however, limited information is available on the ge-netic basis of these traits. This study aims to identify genome-wide marker-trait associations for grain quality traits in a diverse sorghum genotype panel. We evaluated ninety-four diverse sorghum genotypes for their levels of starch, tannins, and nitrogen. Genome-wide associa-tion studies based on 6994 SNPs identified 32 marker-trait associations (MTAs), involving 12, 12, and 8 genetic loci linked to tannin, nitrogen, and starch levels, respectively. Seven loci associated with grain quality traits were validated from candidate markers, with tannin-related markers being the most abundant. Genotypes varied in their allele composition, with Gicamunkoni and Gadam carrying the highest number of alleles, highlighting them as promising parental sources. The study identifies important genetic loci linked to grain nitrogen, starch, and tannin in sorghum, offering valuable opportunities for mark-er-assisted selection. These results provide a foundation for breeding programs aimed at improving grain quality and promoting wider uti-lization of sorghum.
Keywords:
quality traits
; sorghum
; diverse
; associations
; candidate
; single nucleotide polymorphism
1. Introduction
Sorghum [Sorghum bicolor (L.) Moench] is a climate-resilient cereal that underpins food security in semi-arid regions of Africa due to its ability to withstand drought and other biotic and abiotic stresses [1]. Beyond subsistence, sorghum has growing economic importance as demand for high-quality grain increases across diverse end-uses, including food, brewing, feed, and biofuel production [2,3,4]. Despite this demand, progress in improving sorghum grain quality has lagged behind that of major cereals such as rice, maize, and wheat [5], underscoring the need to accelerate genetic research to support breeding efforts.
The nutritional composition of grain is a key factor in determining sorghum’s value for various uses. Starch, the primary carbohydrate in the endosperm, consists of amylose and amylopectin polymers produced through a coordinated enzymatic pathway involving genes such as SBE, SSIIIa, and AGPase [6]. High-starch varieties are desirable for food and feed, while mutations in starch biosynthesis genes can change digestibility and processing quality [7]. The protein content in sorghum depends on nitrogen accumulation and shows significant genetic variation [8]. However, the molecular mechanisms controlling protein deposition remain poorly understood. Additionally, while tannins contribute pigmentation and have antioxidant properties, excessive levels reduce protein and starch digestibility [9]. Recent studies have identified Tannin1 as a key regulatory gene for tannin biosynthesis in sorghum [10,11]. In exploring future trends and innovative approaches to increase quality and consumer preferences, sorghum grain starch, protein, and tannin levels are crucial [12].
Understanding the genetic basis of grain quality traits requires approaches that capture natural variation across diverse germplasms. Genome-wide association studies (GWAS) have become a powerful tool for dissecting trait architecture by leveraging historical recombination, which allows higher mapping resolution than conventional linkage analysis [13,14]. GWAS has successfully identified loci linked to sorghum grain protein, minerals, starch properties, fatty acid composition, and phenolic compounds [15,16] . However, marker trait associations (MTAs) for nutritional traits remain incompletely characterized, thereby limiting their use in breeding. Additionally, GWAS often yields a sizable number of significant loci, making it challenging to interpret their biological, cellular, and molecular roles. Therefore, complementary approaches are necessary. Gene ontology (GO) enrichment analysis offers a framework for connecting candidate genes to biological processes, molecular functions, and cellular components [17]. By focusing on the most significantly enriched terms and their related genes, GO analysis helps identify the most promising candidate genes for improving sorghum grain quality. Using Gene Ontology and Kyoto Encyclopedia of Genes and Genomes (KEGG) analysis is crucial for understanding the significance of associated genes and enriched pathways.
Connecting molecular markers to grain quality traits provides breeders with powerful tools to accelerate variety development through marker-assisted selection and, more recently, genomic editing strategies [18,19]. Furthermore, combining GWAS results with functional genomics offers opportunities to identify candidate genes and to clarify biosynthetic pathways that support nutritional quality [20]. This knowledge can help develop sorghum varieties optimized for food, feed, and industrial uses, thereby improving farmers’ livelihoods and benefiting consumers.
This study aimed to identify marker-trait associations for key grain quality traits, including nitrogen, starch, and tannin levels in a diverse sorghum genotype using genome-wide association analysis. Additionally, enrichment analysis was conducted to identify candidate genes and their primary biological functions. By locating genomic regions and potential candidate genes, this research provides insights into the genetic basis of sorghum grain quality and offers candidate markers to support breeding efforts for improved end-use qualities.
2. Results
2.1. Phenotypic Analysis of Grain Quality Traits
Descriptive statistics were conducted on three grain quality traits (nitrogen, starch, and tannin) in 94 sorghum genotypes (Table 1). Nitrogen ranged from a minimum of 1.0% to a maximum of 2.8 % with a mean of 1.7 %. Starch varied from a minimum of 29.5% to a maximum of 85.5%, with an average of 51.0%. The genotypes showed tannin to have a high coefficient of variation (CV = 45.1%), followed by starch (22.1%) and nitrogen (19.1%). The genotypes were normally distributed for all the grain quality traits (Figure 1), which helped to better understand the genetic architecture for grain quality enhancement in sorghum. Low heritability estimates were recorded for the three traits, with nitrogen having 16.9, starch (25.1), and tannin (28.2), Table 1.
2.2. Genome-Wide Association Analysis
Significant associations were identified between SNP markers across the genome and variation in the grain nitrogen, tannin, and starch (Table 2). Figure 2, Figure 3, and Figure 4 present the quantile-quantile (QQ) and Manhattan plots that visualize the results of the genome-wide association study for nitrogen, starch, and tannin content. The QQ plots show the observed P-values on the y-axis compared to the expected P-values under the null hypothesis of no association on the x-axis. Deviations from the diagonal line indicate loci with significant associations beyond random chance. The Manhattan plots (Figure 2, Figure 3, and Figure 4) map the negative log-transformed P-values for each SNP onto their chromosomal positions. Peaks crossing the significance threshold denote genomic regions harboring variants associated with the traits.
The GWAS analysis for nitrogen content in sorghum grains in the diversity panel revealed 12 significant associations representing five genetic loci (Figure 2). Significant SNP1094 is located at chromosome 1: 53155460 (P ≤ 0.000223), and SNP6600 is located at chromosome 2: 7768137 (P ≤ 0.000159). Associated SNP6600 on chromosome 2 tagged candidate gene Sobic.002G075100 related to putative uncharacterized protein P0009G03.26.
Association analysis for grain tannin content identified 12 significant SNPs exceeding the genome-wide significance threshold of -log10 (P-value) > 3 and representing seven gene loci (Figure 3). The most significant associated SNPs were located on chromosomes 3 and 4, SNP7665 at position 3:67912592 (P ≤ 1.34E-05) tagging candidate gene Sobic.003G361300, SNP9624 at position 3:11124381 (P ≤ 0.000111) tagged Sobic.003G122100, SNP7669 at position 3:69797685 tagging Sobic.003G385500 (P ≤ 0.00015), and SNP10372 at position 4: 4576097 (P ≤ 0.000239) tagging candidate gene Sobic.004G057200. These genes have similarity to lipoxygenase and other proteins related to plant growth, development, and stress response pathways. An additional associated SNP5305 at position 2: 13868847 on chromosome 2 tagged the candidate gene Sobic.002G010800, which has similarity to a disease resistance NBS-LRR type protein.
For starch content, GWAS identified the highest number of SNPs with eight significant SNPs representing six genetic loci, distributed on chromosomes 1, 2, 3, and 4 (Figure 4). Based on the compiled list of candidate genes for starch, the most significant SNP12153 at position 4:4525889 (P ≤ 0.000246) tagged the candidate gene Sobic.004G056300, broadly annotated as a Transglycosylase SLT domain.
The eight promising genotypes were selected based on the presence of favourable alleles associated with increased grain quality, which was recorded in each genotype (Table 3). Gadam and GBK 000095 had the highest number of favorable alleles associated with two traits (tannin and starch). Nahadava had 5 alleles, all associated with tannin, while BM 16, Rwanda, Gicamkoni, and Nyundo had 2 alleles each associated with both nitrogen and tannin. EST 37 had 4 favourable alleles, all associated with tannin and starch. The number of favorable alleles that each selected genotype carries was counted to determine the target genotypes as parents for future crosses in the sorghum breeding program to improve grain quality traits.
2.3. Gene Ontology and Enrichment Analysis
Gene ontology enrichment analysis was performed on the list of candidate genes to identify overrepresented biological processes. GO terms and a KEGG pathway (P value < 0.05) for tannin, starch, and nitrogen were associated with numerous candidate loci (Supplemental Table S2). The top 20 enriched processes provide insights into key mechanisms and pathways involved in grain quality traits. The results integrated genomic associations and functional annotation to pinpoint candidate genes and enriched biological factors controlling natural variation in sorghum grain composition.
The most significant tannin-enriched biological process, GO:0009651, with a P value of 2.40E-32, contains a gene that responds to salt stress. Additional significant terms, GO:0009607, GO:0043207, GO:0051707, and GO:0009409 highlighted the candidate genes involved in several stress resilience pathways, including responses to pathogens, cold, and oxidative damage, as illustrated in Figure 5. The GO terms were associated with candidate genes: Sobic.003G361300 at (P ≤ 0.000111), Sobic.003G122100, Sobic.003G385500 at (P ≤ 0.00015), and Sobic.004G057200 at (P ≤ 0.000239) which are implicated in salt stress responses and tolerance processes. Furthermore, negative regulation terms were prominently represented, indicating that the candidates specifically modify certain defense responses rather than merely activating them. The enrichment for protein complex assembly points to candidates governing the formation of protein complexes integral to stress tolerance and grain development. Protein ubiquitination gene (GO:0016567) was also overrepresented, as protein degradation via ubiquitin tags is critical in stress and developmental processes; however, processes specific to grain filling, starch biosynthesis were notably absent among the top results (Figure 6). Stress responses emerge as particularly enriched by tannin, underscoring how resilience mechanisms impact grain development.
The most significant enriched terms highlight the involvement of nitrogen candidate genes in critical processes related to pollen and male gametophyte development, including pollen germination (GO:0009809), pollen exine (GO:0010584) and wall formation (GO:00102208), and ribonucleoprotein complex assembly (GO:0022618) in pollen (Figure 6a) Additional enriched terms point to candidates governing lignin biosynthesis (GO:0009809), a key process involved in pollen wall strengthening and anther dehiscence. Cellular component morphogenesis (GO:0032989) and localization (GO:0051640) terms implicate candidates in cytoskeletal and vesicle trafficking processes that facilitate pollen development and polarized growth. On the other hand, overrepresentation of the terms phenylpropanoid (GO:0009698) and lignin metabolic process (GO:0009808) links candidate genes to the synthesis of critical cell wall components. In addition, GO terms related to actin cytoskeleton organization, translation, and negative regulation of organelle organization suggest candidates involved in modulating pollen tube emergence and growth. Consequently, the prominent enrichment of pollen and cell wall-related terms indicates these reproductive processes are strongly represented in the candidate gene set associated with nitrogen (Figure 6b).
Notably, gene ontology enrichment analysis for starch revealed several biological processes that are highly overrepresented among the candidate genes, providing insights into key mechanisms involved in regulation. Figure 7a illustrates significantly enriched terms related to reproductive development. These terms include seed development (GO:0048316), fruit development (GO:0010154), gametophyte development (GO:0048229), embryo sac development (GO:0009553), and sexual reproduction (GO:0019953). Additional enriched terms in Figure 7a highlight candidates involved in modulating metabolic processes (GO:0031324), biological quality (GO:0065008), and viral interactions (GO:0016032), likely tied to biotic stress responses. However, the enrichment for starch complex assembly suggests candidates governing the formation of complexes integral to development and defense. Taken together, the starch results indicate the candidate gene list is enriched for genes governing reproductive development, metabolism, and stress responses in the crop (Figure 7b).
3. Discussion
Sorghum is one of the most vital crops globally, valued for its extensive genetic diversity that serves as a crucial foundation for sorghum selection in breeding programs targeting diverse market needs. Grain quality traits linked to genetic markers hold great potential for accelerating breeding progress and offer insights into gene functions [21]. In this study, significant variation was observed among genotypes for grain tannin, starch, and nitrogen. Most of the grain quality traits showed an approximately normal distribution, as illustrated by the histograms, supporting their suitability for GWAS analysis. Genome-wide association studies identified a total of 32 loci significantly associated with tannin, nitrogen, and starch, as confirmed by Manhattan plots and QQ plots, which demonstrated strong marker trait associations [22].
Tannin plays a crucial role in plant defense mechanisms against insects, herbivores, birds, fungal infections, and cold tolerance. Twelve significant single-nucleotide polymorphisms exceeding the genome-wide significance threshold (-log10(P value) > 3) were significantly associated with tannin levels. We identified Sobic.003G361300 (lipoxygenase gene) on chromosome 3, tagging a stress-responsive candidate that may regulate secondary metabolism in sorghum. According to a study by [23], the same locus was described as ATAUX1, an auxin transport–related gene, indicating its integral role in plant defense and developmental processes. Another lipoxygenase-like gene (Sobic.004G057200) on chromosome 4 was also linked to stress responses. Lipoxygenases catalyze the deoxygenation of polyunsaturated fatty acids and are involved in plant-pathogen interactions, senescence, and seed germination [24]. Additionally, GWAS identified another important gene on chromosome 2 (Sobic.002G010800), which resembles a Nucleotide-binding site leucine-rich repeat (NBS-LRR). The NBS-LRR are disease resistance proteins that regulates the biosynthesis of phenylpropanoids and tannins. These proteins recognize pathogen effector molecules and trigger defense signaling, with some family members also regulating secondary metabolism, including phenylpropanoid pathways leading to tannin biosynthesis. The NBS-LRR genes have been identified in various crops and are reported to play a key role in host plant resistance and tannin biosynthesis [37,38,39,40].
We identified 12 significant SNPs for nitrogen content representing 12 loci on chromosomes 1, 2, 3, 5, and 6. Sobic.002G075100 in chromosome 2, similar to putative uncharacterized protein P0009G03.26, containing a protein kinase domain central in regulatory signaling function. The nitrogen candidate genes were enriched for reproductive processes such as pollen development, cell wall biogenesis, and cytoskeletal organization. This suggests nitrogen recycling and remobilization polymorphisms could influence pollen viability and male fertility [41,42]. Overrepresented phenylpropanoid and lignin pathways further link nitrogen utilization efficiency to pollen wall fortification [43,44]. The candidate gene Sobic.004G056300, broadly annotated as a Transglycosylase SLT domain, was found to be highly significant for starch levels. Transglycosylase SLT domain genes are linked to cell wall modification and remodeling. In cereals, cell wall remodeling influences grain endosperm development, nutrient storage, and stress tolerance, potentially linking it to starch accumulation [31].
Based on favorable allele counts, eight promising genotypes were identified for potential use in breeding for improved sorghum grain quality. Gadam and GBK 000095 carried the most favorable alleles associated with tannin and starch, while Nahadava, BM 16, Rwanda, Gicamkoni, EST 37, and Nyundo also carried multiple beneficial alleles. These genotypes represent valuable parents for future crosses in the sorghum breeding programs.
Gene ontology enrichment analysis is a powerful approach for clarifying the functional mechanisms represented within a set of genes [32]. Moreover, by determining if certain GO terms appear more frequently than expected by chance, we identified overrepresented biological processes [33]. For starch levels, Sobic.001G068700 and Sobic.004G060000 were enriched in protein complex assembly, contributing to starch granule formation as starch synthases and starch binding proteins. Although no GO terms directly related to starch metabolic process were enriched, network analysis revealed strong interconnections among starch-associated candidate genes, indicating coordinated regulation of starch biosynthesis and deposition. Such coordinated regulation may manifest through pleiotropic effects on grain filling rates and duration, ultimately influencing starch deposition [48,49]. The enrichment of reproductive process terms also points to grain filling and endosperm development [50,51].
Across all traits, 353 significantly enriched GO terms were identified from 964 candidate genes associated with sorghum grain nitrogen, starch, and tannin. Notably, tannin-associated loci showed a significant overrepresentation in responses to abiotic stressors, which aligns with sorghum's ability to adapt to arid environments. This aligns with sorghum's adaptation to arid environments, where tannins may confer tolerance by quenching reactive oxygen species [38]. Additionally, the role of tannins in biotic stress resilience and programmed cell death is highlighted by other enriched terms associated with pathogen defense response and protein ubiquitination [53,54]. Comparative network analysis confirmed that starch-related candidates are tightly interconnected, indicating coordinated control of starch biosynthesis and deposition [41].
These results demonstrate how tannin, starch, and nitrogen candidate genes contribute to grain quality and a range of biological and cellular processes by integrating GWAS significant loci with insights into biological pathways. The complex genetic networks affecting grain composition are highlighted by the identified genetic loci, pathways, and promising genotypes, which provide valuable resources for sorghum development.
4. Materials and Methods
4.1. Germplasm for the Study
Ninety-four sorghum genotypes comprising landraces collected from farmers in eastern Africa and gene bank accessions from Kenya Agricultural and Livestock Research Organization (KALRO), Genetic Resources Research Institute (KALRO-GeRRI), and breeding lines from the International Crops Research Institute for the Semi-Arid Tropics (ICRISAT), were assembled for the study, making 54%, 43% and 3% respectively. The accessions from KALRO-GeRRI gene bank were selected based on their geographic origin within Kenya and represented a wide range of local germplasm found in Kenya. Elite breeding lines originating from ICRISAT were also included, and these were chosen predominantly based on pedigree information. Therefore, the germplasm assembled for the study represented a strategic cross-section of sorghum diversity covering elite breeding lines, improved varieties, gene bank accessions, and farmer-maintained landraces from the eastern Africa region.
The field evaluation was carried out at two locations in Kenya. The Agronomy Research and Teaching Field (Field 7) at Egerton University (35°55'E and 0°22'S), Nakuru County, and KALRO Perkerra sub-centre in Marigat (0° 46' N and 35o 98' E), Baringo County, in the Rift Valley region. The trial was planted during the long rains from April to August in 2021. The Agronomy Research and Teaching Field is situated at an elevation of 2286 m above sea level (asl), with an average annual rainfall of 1000 mm, and a mean temperature of 14.9 °C. Meanwhile, KALRO Perkerra is situated at coordinates and has an elevation of 1,066 m above sea level, with an average annual temperature of 24.5 °C and rainfall of 621 mm. The experiment was set up using an alpha-Lattice Design with two replicates in plots measuring 3 m long at a 60 × 10 cm spacing.
At physiological maturity, sorghum panicles were harvested in each plot from the two locations for nitrogen, starch, and tannin content analysis at the Mycotoxin and Nutrition platform of the International Livestock Research Institute (ILRI), Nairobi, Kenya. Airdried grains from each genotype were used to analyze starch content using the Megazyme Total Starch kit [42]. The tannin content was determined using the Folin-Denn method [43], and nitrogen using the Kjeldahl method [44].
4.2. Phenotypic Data Analysis
The Multi-Environment Trial Analysis with R (META-R) software package was used to analyze phenotypic data [45]. Genotypes, environments, genotype-by-environment interactions (G×E), replications, and blocks were all included as variance components in the combined analysis of variance (ANOVA). The META-R was used to compute the best linear unbiased prediction (BLUP) and to estimate the variance components using the restricted maximum likelihood (REML). The broad-sense heritability (H2) for all traits was also determined using META-R.
4.3. DNA Extraction
The ninety-four genotypes were planted in a greenhouse for DNA extraction at the SEQART Africa, Nairobi, Kenya. The seeds of all genotypes were sown in a greenhouse at the International Livestock Research Institute, Nairobi, in plastic containers with 0.5 kg of vermiculite, and forest soil mixed with sand in a 2:1 w/w (weight-by-weight) ratio as growth media. Each genotype was replicated twice, with two plants per pot and four plants per genotype. A mixture of equal amounts of leaves from various plant species represented the genotypes. The genomic DNA was extracted using a QIAGEN kit at the BecA-ILRI Hub from the 14-day-old seedling leaves of each genotype. DArTseq libraries were normalized to 100 ng/l using Agarose gel electrophoresis (1%) to assess genomic DNA quality, quantify the total amount of DNA, and then normalize to 100 ng/l. Thereafter, DArTseq libraries were created by digesting individual samples with Pstl-Msel restriction enzymes and ligating with site-specific adapters.
The DArTseqTM next-generation sequencing method, which integrates the DArT complexity reduction techniques based on next-generation sequencing platforms and methyl filtration [46], was used for genotypic characterization. Sequencing was performed on an Illumina HiSeq 2500 (Illumina, USA) to identify SNPs and silicoDArT markers. After that, cluster creation was performed in cBOT (Illumina). Using the cBOT reagents, 10 nM of each library that had been denatured, diluted in a hybridization buffer, and added to the apparatus was used to generate clusters in the flow cell by cBOT. During cluster formation, molecules from each library were adhered to the flow cell surface and amplified to form clonal clusters. The HiSeq 2500 was loaded with the flow cell containing the clusters created in the preceding step (cBOT) and the sequencing reagents. All amplicons are sequenced in a single lane following the user-selected sequencing settings on the HiSeq 2500. Seventy-eight cycles were required to complete the single-read sequencing.
In the primary pipeline, the sequences generated in each lane were analyzed using DArT analytical pipelines exclusive to that lane. During the processing of FASTQ files, the barcode portion of the sequence was subjected to stricter selection criteria than the rest to eliminate low-quality sequences. Thus, the sequence-to-specific-sample matching in the "barcode split" step was highly accurate.
The fold-compressed sequence tags were stored permanently in the Diversity Arrays Technology database (DArTdb). After being extracted from DArTdb, the compressed sequence was imported into DArTsoft14 to extract marker data [47]. DArTsoft14 retrieves SNPs and SilicoDArTs as the two types of marker data. SilicoDArTs are dominant binary markers scored as "1" for the presence and "0" for the absence of restriction fragments containing marker sequences in the genomic representation of a sample. Calls with non-zero counts that are too low to score safely as "1" are represented by "-." (often representing heterozygotes). SNP alleles for each marker and genotype were reported in a standard format, and SNPs served as a reference. This SNP format can be changed to another if necessary. The report was created as a binary or read counts file, depending on the order specifications. As technical duplicates, two DNA samples from each of the 94 genotypes were genotyped to ascertain the repeatability of the marker data.
4.4. Marker Data Quality Analysis
A maximum criterion of 95%, an 80% call rate for markers, the polymorphism information content (PIC), and one ratio were used to test the SNP markers for reproducibility [48]. DArT Pty provided this information, limited to producing the SilicoDArT and SNP table. The percentage of technical replicate assay pairs for which the marker score is consistent was considered while calculating reproducibility scoring. The percentage of samples for which the score was either "0" or "1" was used to estimate the call rate, which determines the success of reading the marker sequence across the samples. PIC, which measures the marker's level of population diversity, was utilized to demonstrate the marker's value for linkage analysis. One ratio represents the percentage of samples whose genotype score was equal to one.
4.5. Data Filtering and Quality Control
Minor allele frequency greater than 0.01% and missing data of 30% were used to filter the raw DArTseq data. The Powermaker program was used to calculate summary statistics of the filtered DArTseq markers, including genetic diversity (GD), expected heterozygosity (He), polymorphic information content (PIC), and minor allele frequency (MAF). PIC was calculated based on the likelihood of polymorphism between two random samples, and gene diversity was defined as the probability that two randomly selected alleles from the population would differ. The StatgenGWAS package in R filters the data and removes redundant SNPs. After filtering, 94 genotypes and 6994 significant SNPs remained for GWAS analysis.
4.6. Marker-Trait Association Analysis
To identify genetic loci associated with phenotypic data, the genotype BLUP values were then used in association mapping along with the genotypic data (SNP markers) for each genotype. Following the procedure outlined by [49] and made available in the statgenGWAS R package [50] Fast single-trait Genome Wide Association Studies (GWAS) were employed. Based on phenotypic and genotypic data, a single-trait GWAS was carried out using statgenGWAS. Based on the EMMA technique, a covariance matrix was created [51]. The marker's effect and associated P-values were calculated using a Generalized Least Squares (GLS) method. Based on the statgenGWAS package's identity by state (IBS) technique option, the kinship coefficients were calculated. At α = 0.05, a fixed threshold of -log10 (P value) >3 was applied. The following equation was employed in the Fast single-trait GWAS analysis:
where Y represents the observed phenotype, X represents the design matrix for the fixed effect of the SNP, β represents the vector of coefficient of the fixed effect, Z represents the incidence matrix allocating individuals to genotypes, and µ represents the vector of genetic random effects, with variance (µ) = δ2g K, where K represents the marker-based kinship matrix and ε represents the vector of residual effects.
Y = Xβ + Zµ + ε
The P-value (marker) used to determine whether a marker is related to a trait and r2 (marker), which defines the percentage of phenotypic variation accounted for by a significant marker, were both reflected in the association analysis results. The significance of associations between the traits and SilicoDArT and SNP markers was evaluated using Bonferroni corrections and False Discovery Rate (FDR) levels based on P-values corrected for multiple testing. DArTseq and SNP markers having FDR and Bonferroni p = 0.01 thresholds were significantly associated with study phenotypic traits. Statistically significant markers and significant P-value distributions were visualized using Manhattan and Quantile-Quantile (q-q) plots in R statistical software [21]. To look for prospective positional gene candidates for the regions surrounding significant SNPs linked to grain quality traits, we used the Jbrowse tool available online on the Phytozome version 13 database on the Sorghum bicolor v5.1. annotation database [52]. All the genes were identified as potential candidate genes within 100 kb downstream and 100 kb upstream of a significant SNP (200 kb window).
The study genotypes were assessed for the presence of favourable alleles associated with grain quality traits according to [53]. Candidate genotypes for improving grain quality traits were selected based on the number of alleles associated with increased grain nitrogen, tannin, and starch in each selected genotype. In addition, we identified the target allele from each of the candidate genes. The number of favourable alleles that each selected genotype carries was counted to determine the target genotypes as parents for future crosses in the sorghum breeding program to improve grain quality traits.
4.7. Gene Ontology
Gene ontology and enrichment analyses were obtained using the clusterProfiler package in R [54]. The enrichment results of GO terms and pathways with P < 0.05 were considered as the significant threshold. Focusing on the top 20 terms highlights the biological, cellular, and molecular processes most overrepresented in the candidate gene list. These terms likely represent central mechanisms involved in the trait under study. The candidate genes annotated with these significant GO terms were then filtered to generate a prioritized shortlist for further investigation. Genes associated with multiple enriched terms are particularly promising candidates, as they are inferred to have related functions converging on processes integral to the trait. Ultimately, the enriched terms serve as a guide to pinpoint the most relevant candidates from the list based on functional genomic evidence, which can then be highlighted when describing the key biological factors implicated by the analysis.
5. Conclusions
The study revealed substantial genetic variation in sorghum grain starch, tannin, and nitrogen. The identification of Lipoxygenase, NBS-LRR, and Transglycosylase genes highlights their roles in secondary metabolism, nitrogen remobilization, and endosperm development, respectively, underscoring the complexity of the underlying regulatory networks. GO enrichment and network analyses demonstrated that these traits are controlled by interconnected biological pathways, particularly those related to biotic and abiotic stresses, reproduction, and starch deposition. Additionally, BM 16, Rwanda, GBK 000095, Gicamunkoni, Nyundo, Nahadava, Gadam, and EST 37 genotypes were identified as promising resources for favorable alleles for sorghum grain quality improvement programs.
Supplementary Materials
The following supporting information can be downloaded at the website of this paper posted on Preprints.org.
Author Contributions
Conceptualization and supervision, K.K., P.O., E.K., and C.Z.; writing—original draft preparation: K.K., P.O., and E.K.; formal analysis, K.K., P.O.; investigation, K.K., P.O., and E.K.; writing—original draft preparation, X.X.; writing—review and editing, K.K., P.O., E.K., and C.Z.; project administration, K.K.; funding acquisition, K.K. All authors have read and agreed to the published version of the manuscript.
Funding
This research was funded by the Kenya Climate Smart Agriculture Project (KCSAP), supported by the World Bank.
Data Availability Statement
Data is contained within the article or Supplementary Materials.
Acknowledgments
The first author acknowledges the following: Ph.D. Scholarship granted by the Kenya Climate Smart Agriculture Project (KCSAP) ‘Strengthening Climate-Smart Agricultural Research and Seed Systems’ project funded by the World Bank, the Biosciences eastern and central Africa-International Livestock Research Institute (BecA-ILRI) Hub, and the Mycotoxin and Nutrition platform ILRI for technical support.
Conflicts of Interest
The authors declare no conflict of interest.
Abbreviations
The following abbreviations are used in this manuscript:
| GWAS | Genome-wide association studies |
| GO | Gene Ontology |
| BecA | Biosciences eastern and central Africa |
| MAF | Minor allele frequency |
| SNP | Single-nucleotide polymorphism |
References
- Tadele, Z. Raising Crop Productivity in Africa through Intensification. Agronomy. 2017, 7, 22. [Google Scholar] [CrossRef]
- Aruna, C.; Visarada, K.B.R.S. Sorghum Grain in Food and Brewing Industry. Breed Sorghum Diverse End Uses. 2019, 209–28. [Google Scholar]
- Aruna, C.; Suguna, M.; Visarada, K.B.R.S.; Deepika, C.; Ratnavathi, C.V.; Tonapi, V.A. Identification of sorghum genotypes suitable for specific end uses: Semolina recovery and popping. J Cereal Sci. 2020, 93, 102955. [Google Scholar] [CrossRef]
- Ronda, V.; Aruna, C.; Visarada, K.B.R.S.; Bhat, B.V. Sorghum for Animal Feed. Breed Sorghum Diverse End Uses. 2019, 229–38. [Google Scholar]
- Hadebe, S.T.; Modi, A.T.; Mabhaudhi, T. Drought Tolerance and Water Use of Cereal Crops: A Focus on Sorghum as a Food Security Crop in Sub-Saharan Africa. J Agron Crop Sci. 2016, 203, 177–91. [Google Scholar] [CrossRef]
- Kang, X.; Gao, W.; Cui, B.; Abd El-Aty, A.M. Structure and genetic regulation of starch formation in sorghum (Sorghum bicolor (L.) Moench) endosperm: A review. Int J Biol Macromol. 2023, 239, 124315. [Google Scholar] [CrossRef]
- Zhang, X.; Karim, H.; Feng, X.; Lan, J.; Tang, H.; Guzmán, C.; et al. A single base change at exon of Wx-A1 caused gene inactivation and starch properties modified in a wheat EMS mutant line. J Sci Food Agric. 2021, 102, 2012–22. [Google Scholar] [CrossRef]
- Sejake, T.; Shargie, N.; Figlan, S.; Mofokeng, A.; Tsilo, T.J. Phenotypic Variation of Sorghum Accessions for Grain Yield and Quality Traits. Agronomy. 2022, 12, 3089. [Google Scholar] [CrossRef]
- Khalid, W.; Ali, A.; Arshad, M.S.; Afzal, F.; Akram, R.; Siddeeg, A.; et al. Nutrients and bioactive compounds of Sorghum bicolor L. used to prepare functional foods: a review on the efficacy against different chronic disorders. Int J Food Prop. 2022, 25, 1045–62. [Google Scholar] [CrossRef]
- Schumaker, B.; Mortensen, L.; Klein, R.R.; Mandal, S.; Dykes, L.; Gladman, N.; et al. UV-induced reactive oxygen species and transcriptional control of 3-deoxyanthocyanidin biosynthesis in black sorghum pericarp. Front Plant Sci. 2024, 15, 1451215. [Google Scholar] [CrossRef]
- Zhang, L.; Xu, J.; Ding, Y.; Cao, N.; Gao, X.; Feng, Z.; et al. GWAS of grain color and tannin content in Chinese sorghum based on whole-genome sequencing. TAG Theor Appl Genet Theor Angew Genet. 2023, 136, 77–77. [Google Scholar] [CrossRef] [PubMed]
- Dhar, A.; Meena Kumari, B.; Kavithamani, D.; Boopathi, N.M.; Meenakshi, P. Understanding the advances in Sorghum grain quality improvement: An overview. Plant Sci Today [Internet]. /: 2025 Aug 29]; Available from: https://horizonepublishing.com/journals/index.php/PST/article/view/3527, 16 June 2025. [Google Scholar]
- Boyles, R.E.; Brenton, Z.W.; Kresovich, S. Genetic and genomic resources of sorghum to connect genotype with phenotype in contrasting environments. Plant J. 2018, 97, 19–39. [Google Scholar] [CrossRef] [PubMed]
- Tibbs Cortes, L.; Zhang, Z.; Yu, J. Status and prospects of genome-wide association studies in plants. Plant Genome [Internet]. Available from. [CrossRef]
- Hao, H.; Li, Z.; Leng, C.; Lu, C.; Luo, H.; Liu, Y.; et al. Sorghum breeding in the genomic era: opportunities and challenges. TAG Theor Appl Genet Theor Angew Genet. 2021/03/02 ed. 2021, 134, 1899–924. [Google Scholar] [CrossRef] [PubMed]
- Deng, C.H.; Naithani, S.; Kumari, S.; Cobo-Simon, I.; Quezada-Rodriguez, E.H.; Skrabisova, M.; et al. Agricultural Sciences in the Big Data Era: Genotype and Phenotype Data Standardization, Utilization and Integration. 2023, Available from, 2023. [Google Scholar] [CrossRef]
- Doms, A.; Schroeder, M. GoPubMed: exploring PubMed with the Gene Ontology. Nucleic Acids Res. 2005, 33, W783–6. [Google Scholar] [CrossRef]
- Kimani, W.; Zhang, L.M.; Wu, X.Y.; Hao, H.Q.; Jing, H.C. Genome-wide association study reveals that different pathways contribute to grain quality variation in sorghum (Sorghum bicolor). BMC Genomics. 2020, 21, 112–112. [Google Scholar] [CrossRef]
- Lemke, S.; Tao, X.; Kushner, G.J. Assuring the Food Safety of Crops Developed through Breeding. ACS Agric Sci Technol. 2022, 2, 1151–65. [Google Scholar] [CrossRef]
- Wondimu, Z.; Dong, H.; Paterson, A.H.; Worku, W.; Bantte, K. Genome-wide association study reveals genomic loci influencing agronomic traits in Ethiopian sorghum (Sorghum bicolor (L.) Moench) landraces. Mol Breed. 2023, 43, 32. [Google Scholar] [CrossRef]
- Wang, J.; Yu, J.; Lipka, A.E.; Zhang, Z. Interpretation of Manhattan Plots and Other Outputs of Genome-Wide Association Studies. Methods Mol Biol. 2022, 63–80. [Google Scholar]
- Wang, X.; Wang, W.; Tai, S.; Li, M.; Gao, Q.; Hu, Z.; et al. Selective and comparative genome architecture of Asian cultivated rice (Oryza sativa L.) attributed to domestication and modern breeding. J Adv Res. 2022/08/18 ed. 2022, 42, 1–16. [Google Scholar] [CrossRef]
- Elango, D.; Wang, X.; Bhatnagar, R.S.; Tan, Q.; Gaffoor, I.; Hu, Z.; et al. Association genetics of early season cold and late season frost tolerance in Sorghum bicolor. Crop Sci. 2022, 62, 1844–65. [Google Scholar] [CrossRef]
- Kuźniak, E.; Gajewska, E. Lipids and Lipid-Mediated Signaling in Plant–Pathogen Interactions. Int J Mol Sci. 2024, 25, 7255. [Google Scholar] [CrossRef] [PubMed]
- Ambalavanan, A.; Mallikarjuna, M.G.; Bansal, S.; Bashyal, B.M.; Subramanian, S.; Kumar, A.; et al. Genome-wide characterization of the NBLRR gene family provides evolutionary and functional insights into blast resistance in pearl millet (Cenchrus americanus (L.) Morrone). Planta. 2024, 259, 143. [Google Scholar] [CrossRef] [PubMed]
- Zhu, L.; Huang, C.; Yuan, C.; Liu, Y.; Yu, H.; Long, Y.; et al. Genome-wide identification and characterization of NBS-LRR gene family in tobacco (Nicotiana benthamiana). Sci Rep. 2025, 15, 19015. [Google Scholar] [CrossRef] [PubMed]
- Mehri, N.; Fotovat, R.; Mirzaei, M.; Fard, E.M.; Parsamatin, P.; Hasan, M.T.; et al. Proteomic analysis of wheat contrasting genotypes reveals the interplay between primary metabolic and regulatory pathways in anthers under drought stress. J Proteomics. 2020, 226, 103895. [Google Scholar] [CrossRef]
- Nigro, D.; Fortunato, S.; Giove, S.L.; Mazzucotelli, E.; Gadaleta, A. Functional Validation of Glutamine synthetase and Glutamate synthase Genes in Durum Wheat near Isogenic Lines with QTL for High GPC. Int J Mol Sci. 2020, 21, 9253. [Google Scholar] [CrossRef]
- Buerstmayr, M.; Wagner, C.; Nosenko, T.; Omony, J.; Steiner, B.; Nussbaumer, T.; et al. Fusarium head blight resistance in European winter wheat: insights from genome-wide transcriptome analysis. BMC Genomics. 2021, 22, 470–470. [Google Scholar] [CrossRef]
- Buhrow, L.M.; Liu, Z.; Cram, D.; Sharma, T.; Foroud, N.A.; Pan, Y.; et al. Wheat transcriptome profiling reveals abscisic and gibberellic acid treatments regulate early-stage phytohormone defense signaling, cell wall fortification, and metabolic switches following Fusarium graminearum-challenge. BMC Genomics. 2021, 22, 798–798. [Google Scholar] [CrossRef]
- De Oliveira, A.C.P.; Ferreira, R.M.; Ferro, M.I.T.; Ferro, J.A.; Zamuner, C.; Ferreira, H.; et al. XAC4296 Is a Multifunctional and Exclusive Xanthomonadaceae Gene Containing a Fusion of Lytic Transglycosylase and Epimerase Domains. Microorganisms. 2022, 10, 1008. [Google Scholar] [CrossRef]
- The Gene Ontology Consortium. The Gene Ontology Resource: 20 years and still GOing strong. Nucleic Acids Res. 2019, 47, D330–D338. [CrossRef]
- Chicco, D.; Agapito, G. Nine quick tips for pathway enrichment analysis. PLoS Comput Biol. 2022, 18, e1010348–e1010348. [Google Scholar] [CrossRef]
- Narwal, S.; Sheoran, S.; Kumar, D.; Kundu, A.; Singh, A. Heat Stress and Grain Quality. Thermotolerance Crop Plants. 2022, 211–35. [Google Scholar]
- VP; Ali, K. ; Singh, A.; Vishwakarma, C.; Krishnan, V.; Chinnusamy, V.; et al. Starch accumulation in rice grains subjected to drought during grain filling stage. Plant Physiol Biochem. 2019, 142, 440–51. [Google Scholar] [CrossRef]
- Boyles, R.E.; Pfeiffer, B.K.; Cooper, E.A.; Rauh, B.L.; Zielinski, K.J.; Myers, M.T.; et al. Genetic dissection of sorghum grain quality traits using diverse and segregating populations. TAG Theor Appl Genet Theor Angew Genet. 2017, 130, 697–716. [Google Scholar] [CrossRef]
- Badoni, S.; Parween, S.; Henry, R.J.; Sreenivasulu, N. Systems seed biology to understand and manipulate rice grain quality and nutrition. Crit Rev Biotechnol. 2022, 43, 716–33. [Google Scholar] [CrossRef]
- Singh, D. Juggling with reactive oxygen species and antioxidant defense system – A coping mechanism under salt stress. Plant Stress. 2022, 5, 100093. [Google Scholar] [CrossRef]
- Campobenedetto, C.; Mannino, G.; Beekwilder, J.; Contartese, V.; Karlova, R.; Bertea, C.M. The application of a biostimulant based on tannins affects root architecture and improves tolerance to salinity in tomato plants. Sci Rep. 2021, 11, 354–354. [Google Scholar] [CrossRef] [PubMed]
- Bisht, A.; Saini, D.K.; Kaur, B.; Batra, R.; Kaur, S.; Kaur, I.; et al. Multi-omics assisted breeding for biotic stress resistance in soybean. Mol Biol Rep. 2023, 50, 3787–814. [Google Scholar] [CrossRef] [PubMed]
- Lv, F.; Yang, Y.; Sun, P.; Zhang, Y.; Liu, P.; Fan, X.; et al. Comparative transcriptome analysis reveals different defence responses during the early stage of wounding stress in Chi-Nan germplasm and ordinary Aquilaria sinensis. BMC Plant Biol. 2022, 22, 464–464. [Google Scholar] [CrossRef]
- Peiris, K.H.S.; Wu, X.; Bean, S.R.; Perez-Fajardo, M.; Hayes, C.; Yerka, M.K.; et al. Near Infrared Spectroscopic Evaluation of Starch Properties of Diverse Sorghum Populations. Processes. 2021, 9, 1942. [Google Scholar] [CrossRef]
- Mohapatra, D.; Patel, A.S.; Kar, A.; Deshpande, S.S.; Tripathi, M.K. Effect of different processing conditions on proximate composition, antioxidants, anti-nutrients, and amino acid profile of grain sorghum. Food Chem. 2019, 271, 129–35. [Google Scholar] [CrossRef]
- Aguirre, J. The Kjeldahl Method. Kjeldahl Method 140 Years. 2023, 53–78. [Google Scholar]
- Alvarado, G.; Rodríguez, F.M.; Pacheco, A.; Burgueño, J.; Crossa, J.; Vargas, M.; et al. META-R: A software to analyze data from multi-environment plant breeding trials. Crop J. 2020, 8, 745–56. [Google Scholar] [CrossRef]
- Kilian, A.; Wenzl, P.; Huttner, E.; Carling, J.; Xia, L.; Blois, H.; et al. Diversity Arrays Technology: A Generic Genome Profiling Technology on Open Platforms. In: Pompanon F, Bonin A, editors. Data Production and Analysis in Population Genomics [Internet]. Totowa, NJ: Humana Press; 2012 [cited 2023 Mar 20]. p. 67–89. (Methods in Molecular Biology; vol. 888). Available from: https://link.springer.com/10.1007/978-1-61779-870-2_5.
- Alam, M.; Neal, J.; O’Connor, K.; Kilian, A.; Topp, B. Ultra-high-throughput DArTseq-based silicoDArT and SNP markers for genomic studies in macadamia. PloS One. 2018, 13, e0203465–e0203465. [Google Scholar] [CrossRef] [PubMed]
- Allan, V.; Vetriventhan, M.; Senthil, R.; Geetha, S.; Deshpande, S.; Rathore, A.; et al. Genome-Wide DArTSeq Genotyping and Phenotypic Based Assessment of Within and Among Accessions Diversity and Effective Sample Size in the Diverse Sorghum, Pearl Millet, and Pigeonpea Landraces. Front Plant Sci. 2020, 11, 587426. [Google Scholar] [CrossRef]
- Kang, H.M.; Sul, J.H.; Service, S.K.; Zaitlen, N.A.; Kong, S.Y.; Freimer, N.B.; et al. Variance component model to account for sample structure in genome-wide association studies. Nat Genet. 2010/03/07 ed. 2010, 42, 348–54. [Google Scholar] [CrossRef]
- van Rossum, B.; Kruijer W. statgenGWAS. 2023 [cited 2023 Aug 27]. An R package for fast GWAS • statgenGWAS. Available from: https://biometris.github.io/statgenGWAS/.
- Cubry, P.; Pidon, H.; Ta, K.N.; Tranchant-Dubreuil, C.; Thuillet, A.C.; Holzinger, M.; et al. Genome Wide Association Study Pinpoints Key Agronomic QTLs in African Rice Oryza glaberrima. Rice. 2020, 13, 66. [Google Scholar] [CrossRef]
- Sorghum bicolor (v5.1) [Internet]. Phytozome 13, Joint Genome Institute (JGI); [cited 2024 Apr 10]. Available from: https://phytozome-next.jgi.doe.
- Eltaher, S.; Baenziger, P.S.; Belamkar, V.; Emara, H.A.; Nower, A.A.; Salem, K.F.M.; et al. GWAS revealed effect of genotype × environment interactions for grain yield of Nebraska winter wheat. BMC Genomics. 2021, 22, 2. [Google Scholar] [CrossRef]
- Wu, T.; Hu, E.; Xu, S.; Chen, M.; Guo, P.; Dai, Z.; et al. clusterProfiler 4.0: A universal enrichment tool for interpreting omics data. The Innovation. 2021, 2, 100141. [Google Scholar] [CrossRef]
Figure 1.
Histograms generated using R, representing the distribution of 94 sorghum genotypes for three grain quality traits in the two locations: a) tannin mg TAE/g, b) nitrogen %, and c) starch %, respectively.
Figure 1.
Histograms generated using R, representing the distribution of 94 sorghum genotypes for three grain quality traits in the two locations: a) tannin mg TAE/g, b) nitrogen %, and c) starch %, respectively.
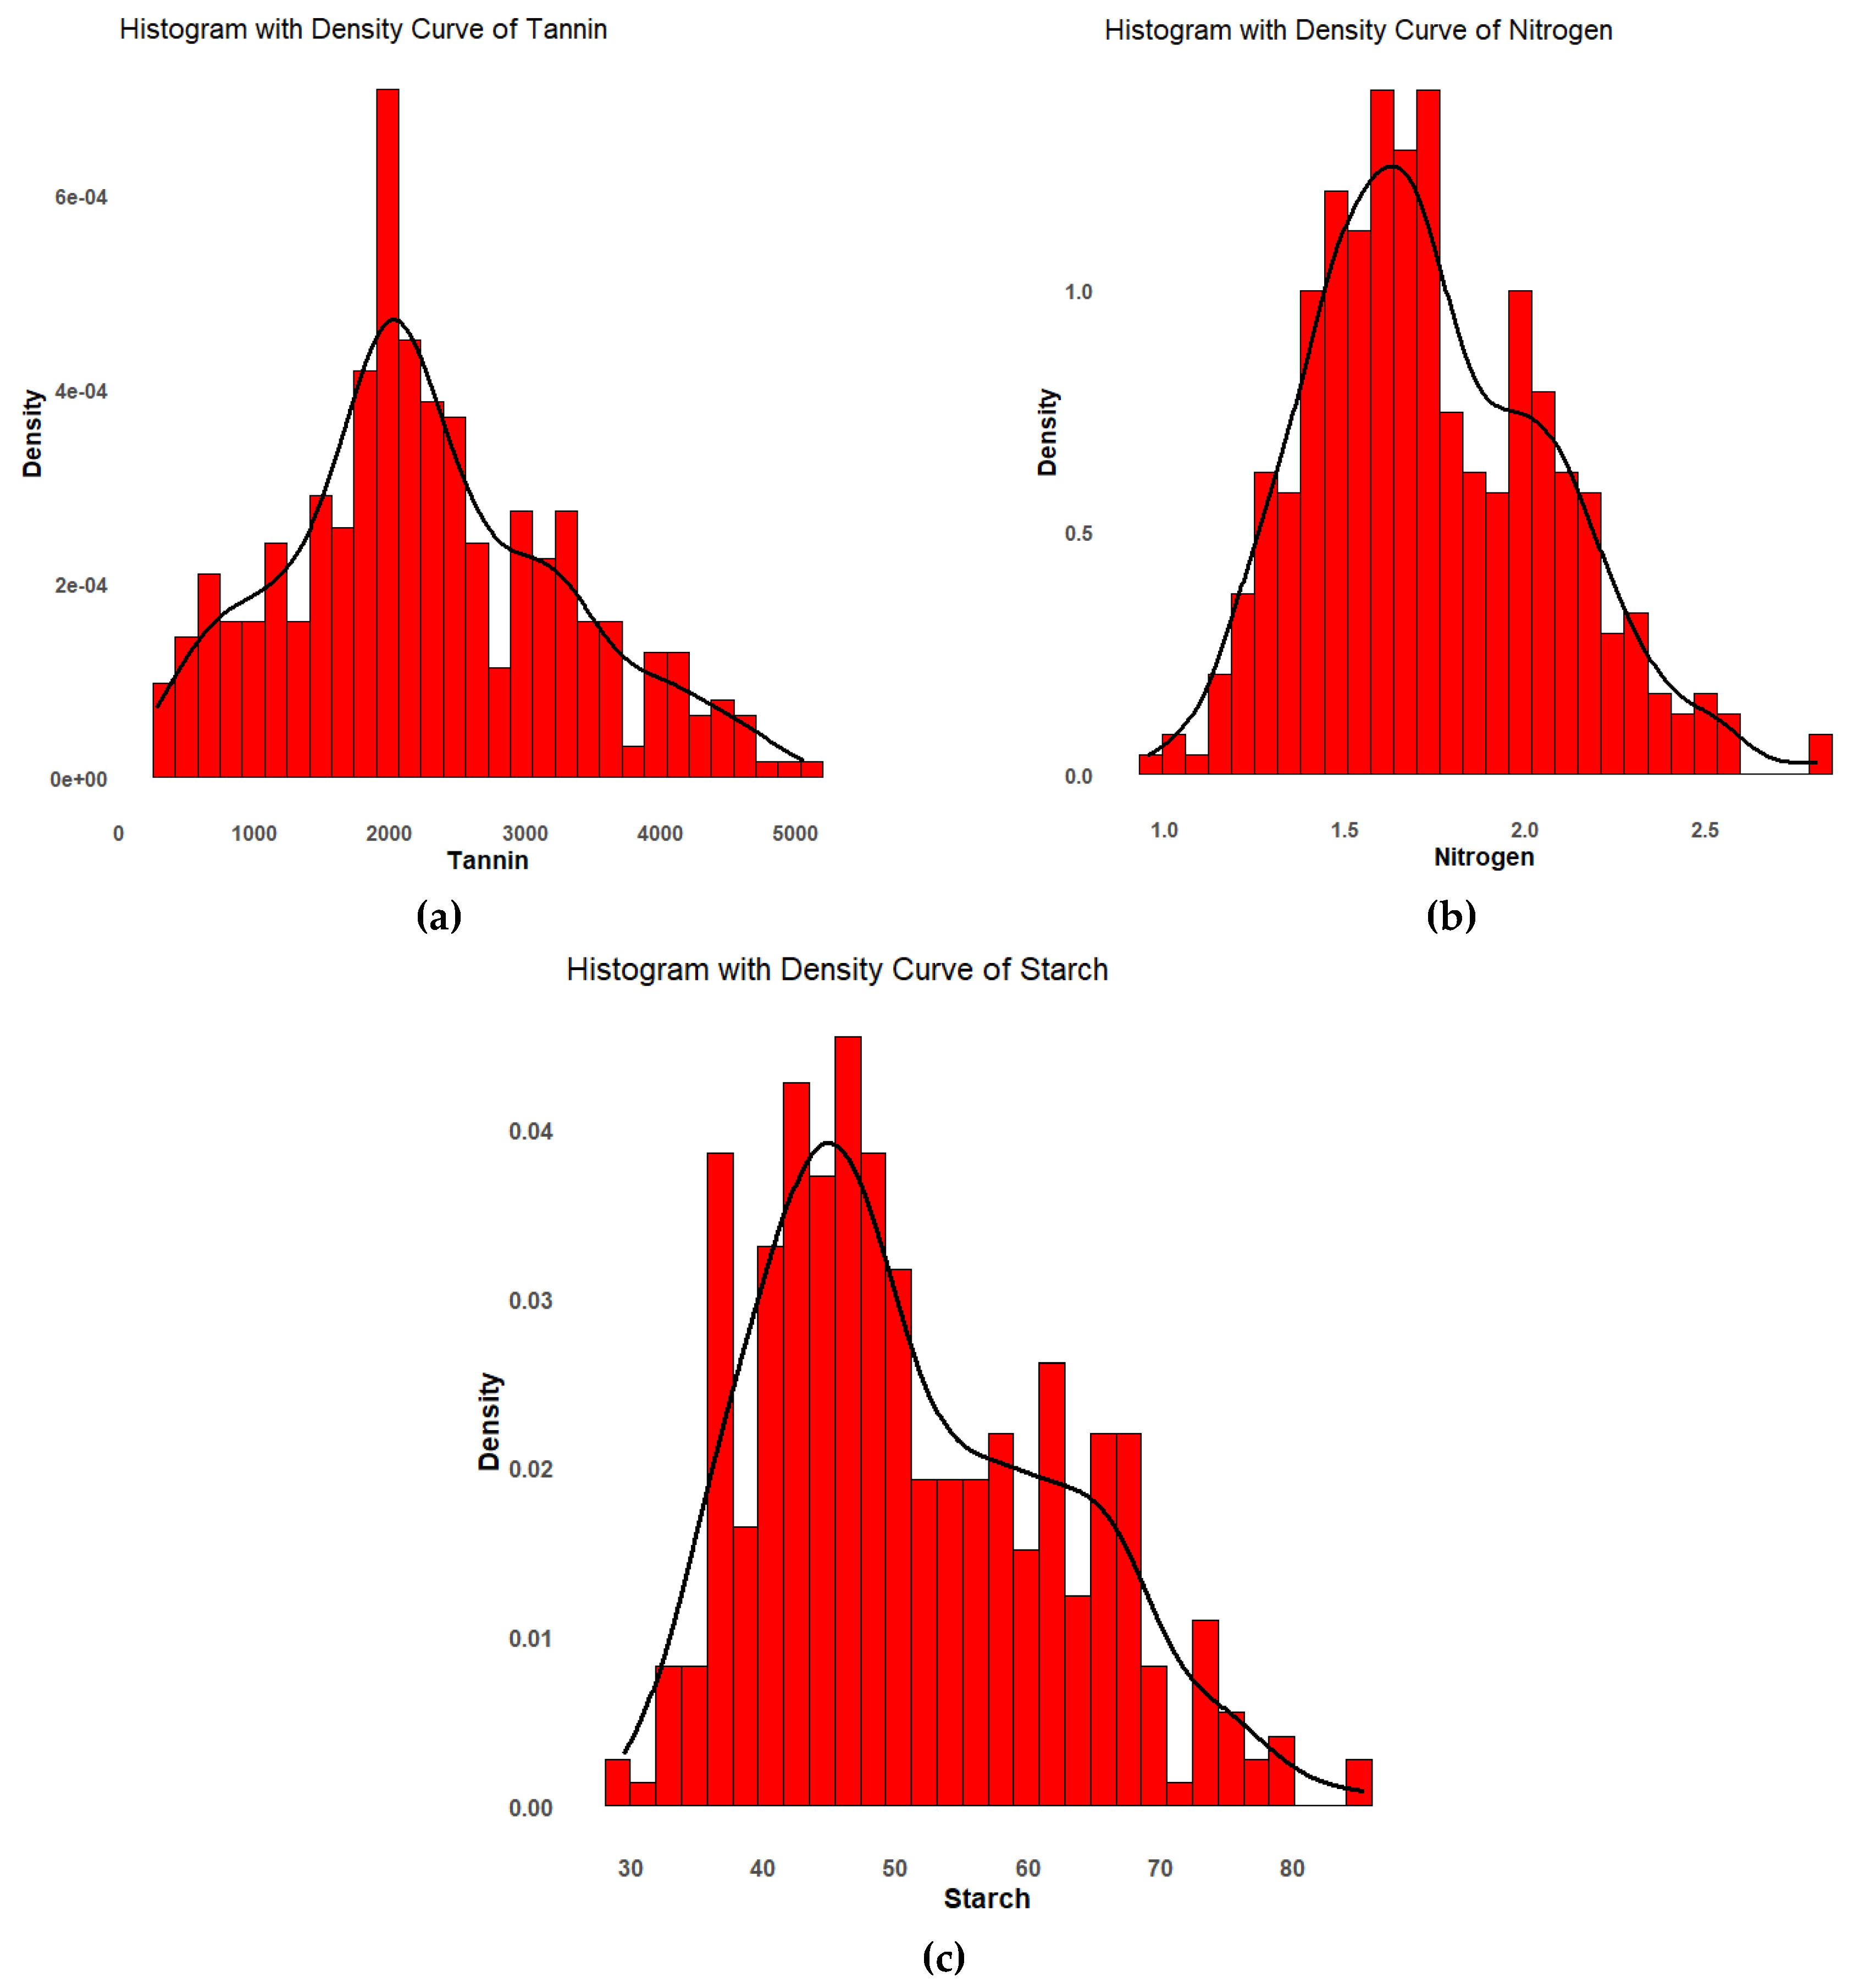
Figure 2.
P-values from the GWAS for nitrogen are displayed on QQ and Manhattan plots along with candidate SNPs. Manhattan plot's dotted line represents the preset significance level of -log10 (P value) > 3 at α = 0.05.
Figure 2.
P-values from the GWAS for nitrogen are displayed on QQ and Manhattan plots along with candidate SNPs. Manhattan plot's dotted line represents the preset significance level of -log10 (P value) > 3 at α = 0.05.
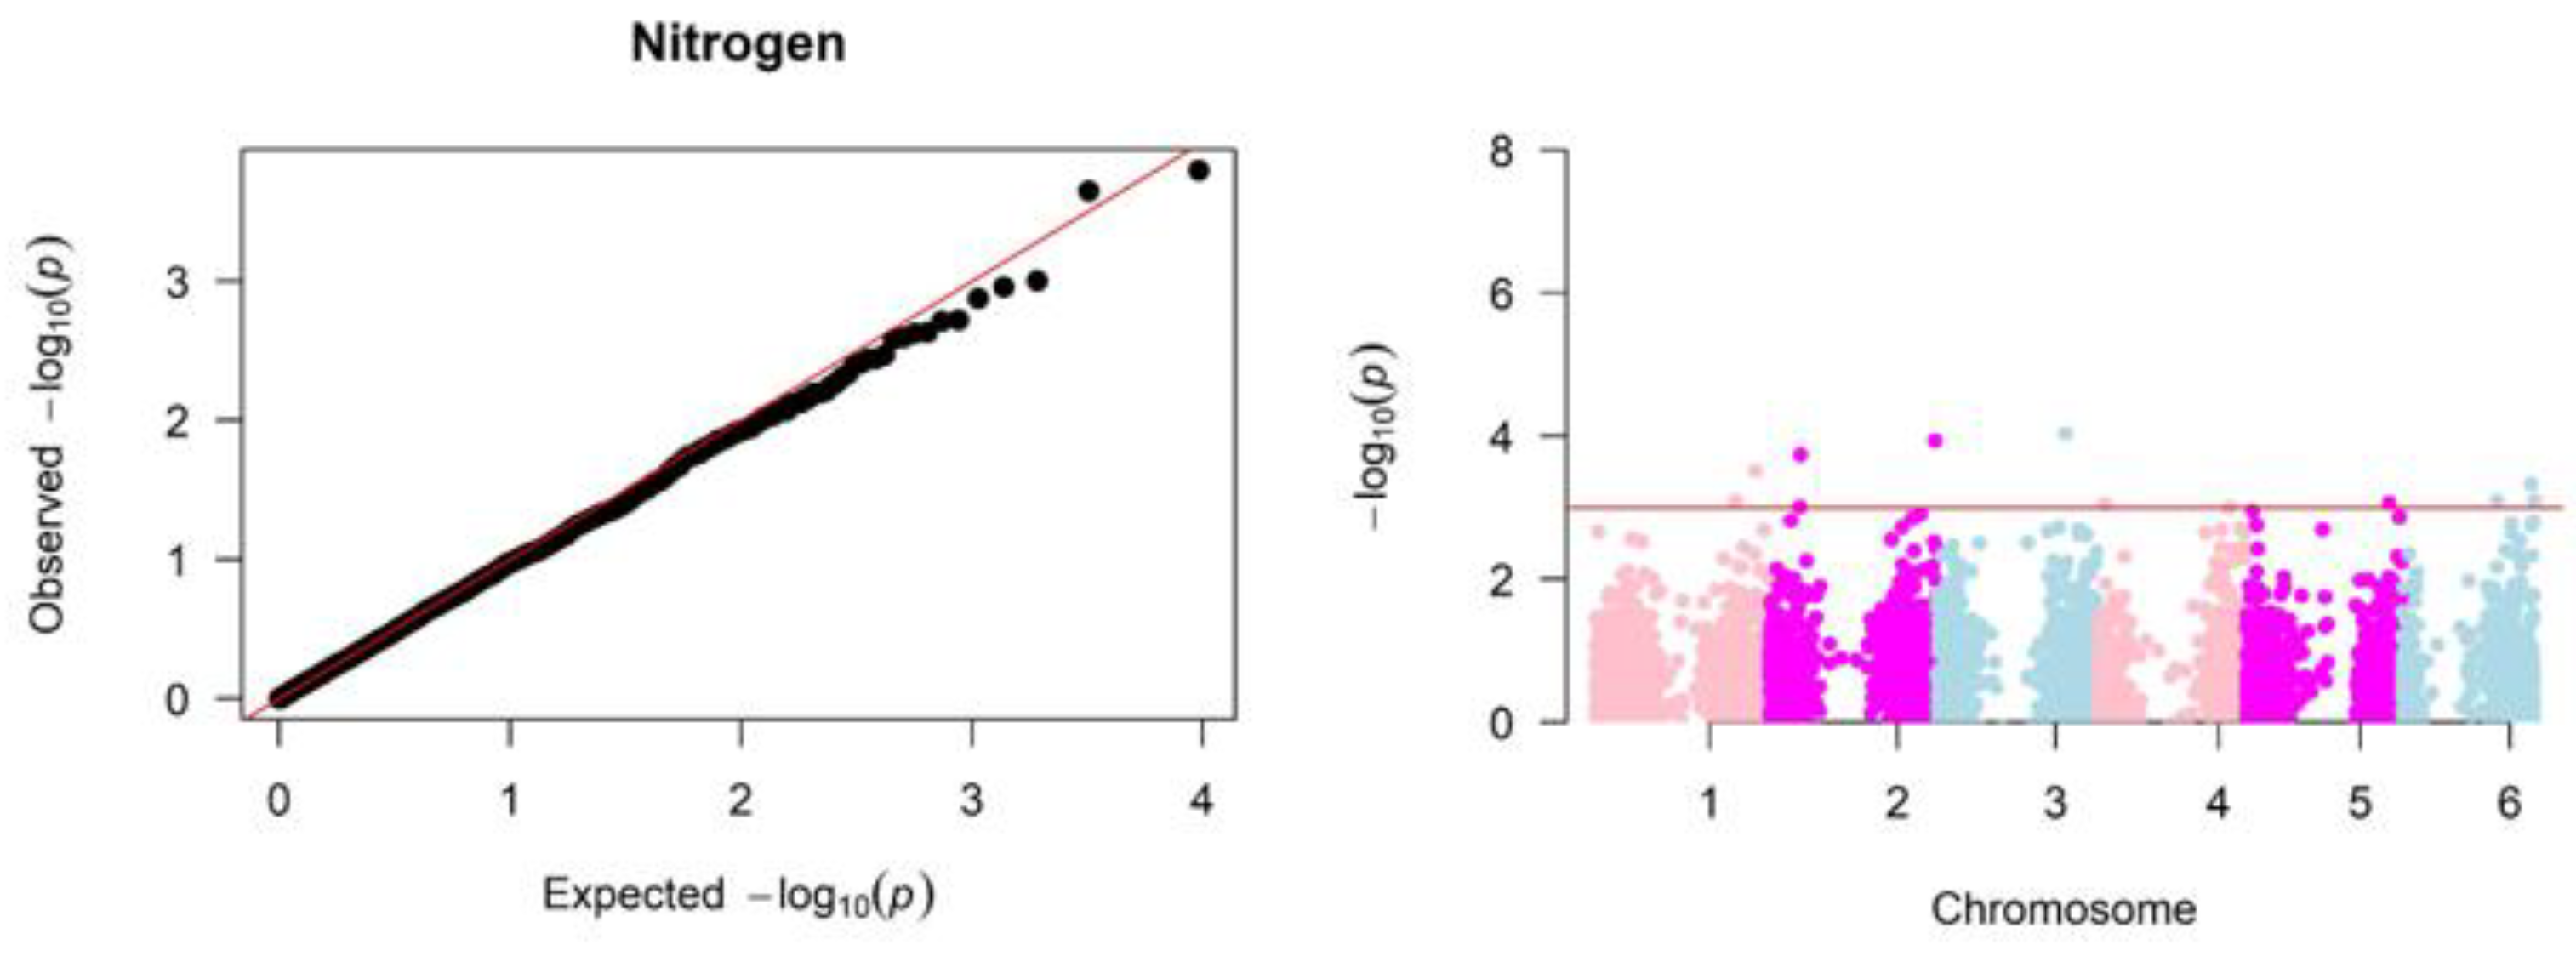
Figure 3.
P-values from the GWAS for tannin are displayed on QQ and Manhattan plots along with candidate SNPs. Manhattan plot's dotted line represents the preset significance level of -log10 (P value) > 3 at α = 0.05.
Figure 3.
P-values from the GWAS for tannin are displayed on QQ and Manhattan plots along with candidate SNPs. Manhattan plot's dotted line represents the preset significance level of -log10 (P value) > 3 at α = 0.05.
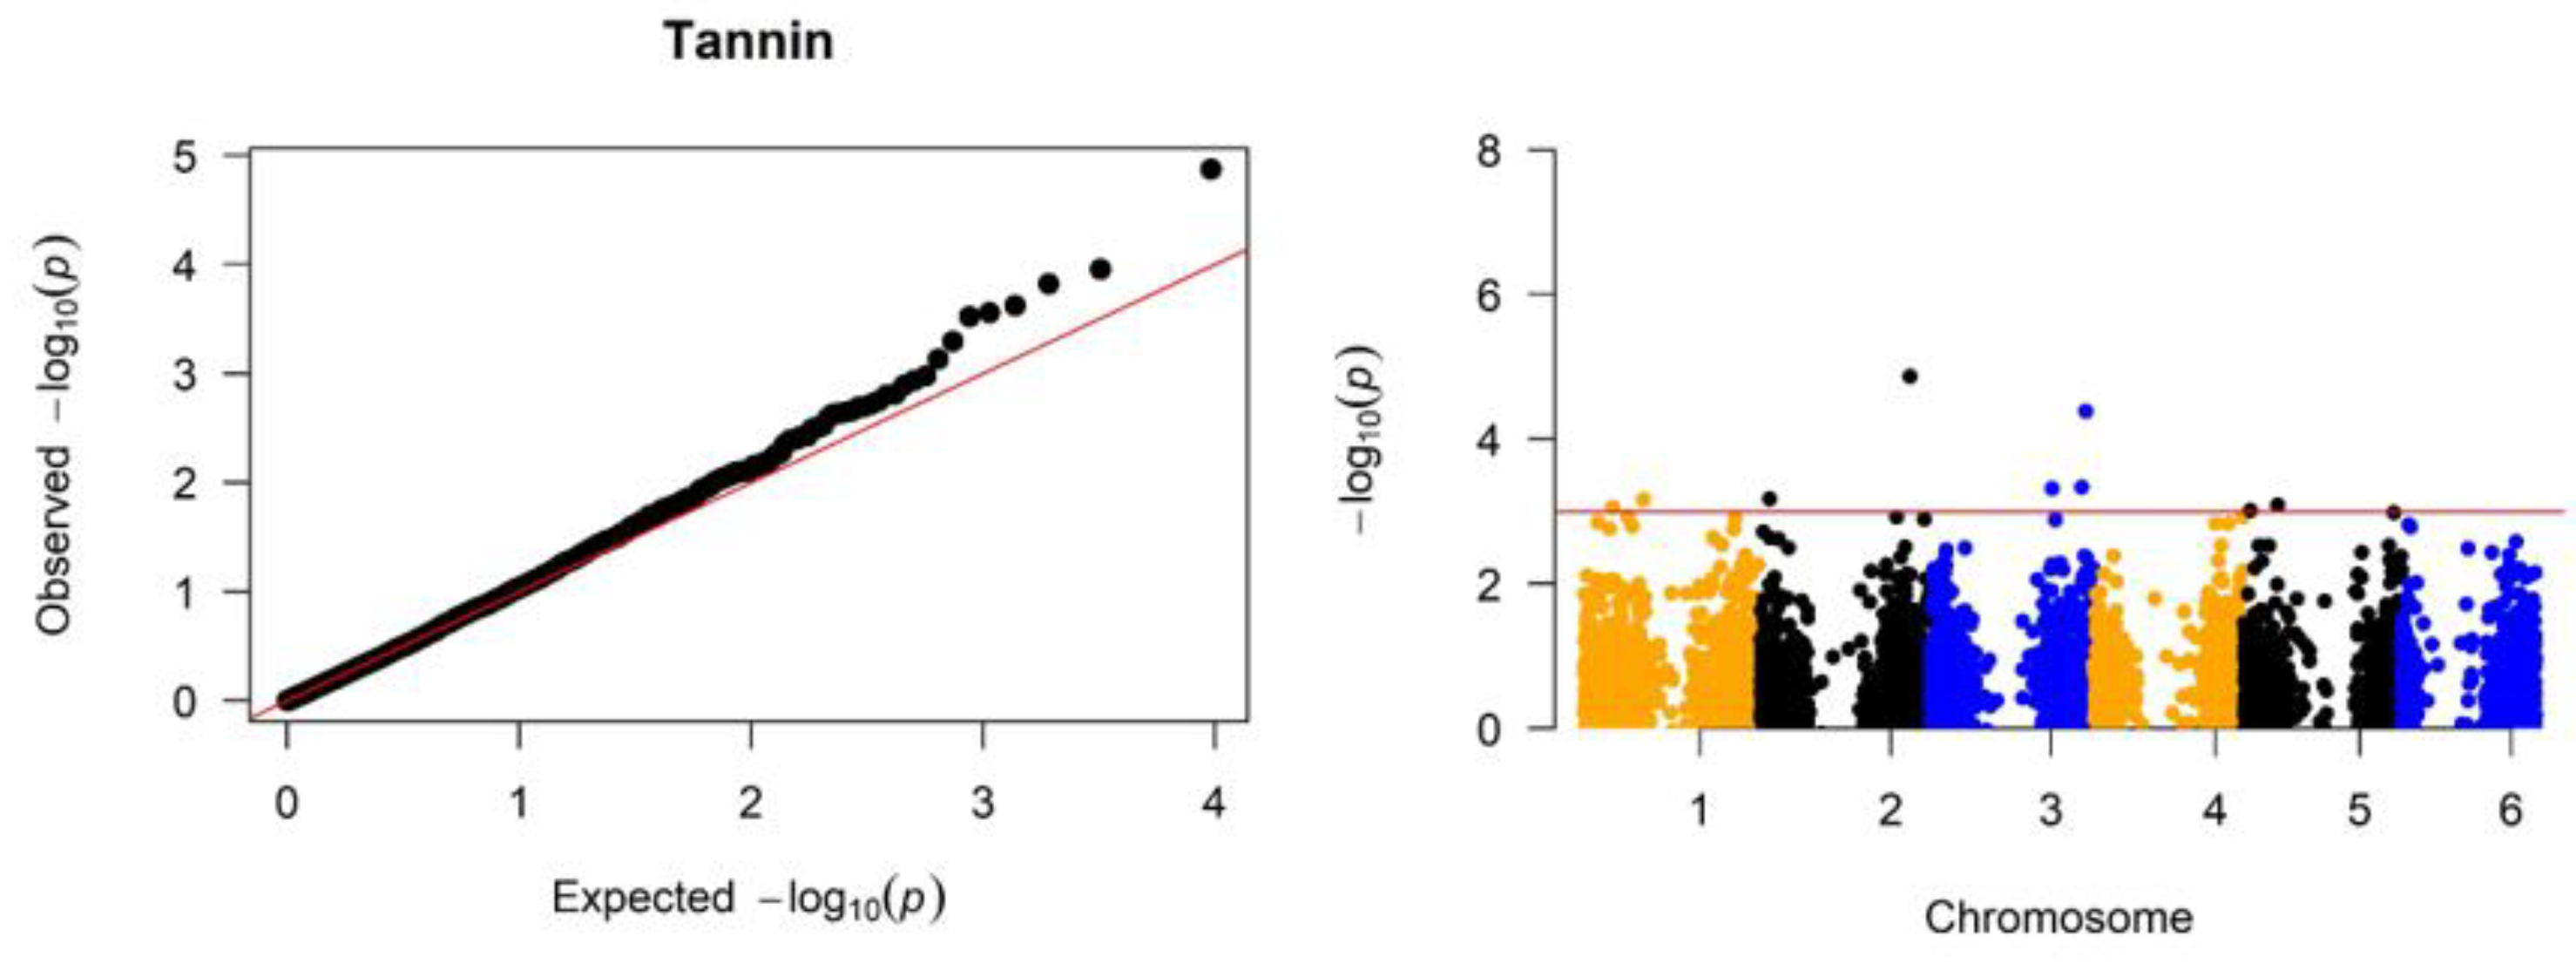
Figure 4.
P-values from the GWAS for starch are displayed on QQ and Manhattan plots along with candidate SNPs. Manhattan plot's dotted line represents the preset significance level of -log10 (P value) > 3 at α = 0.05.
Figure 4.
P-values from the GWAS for starch are displayed on QQ and Manhattan plots along with candidate SNPs. Manhattan plot's dotted line represents the preset significance level of -log10 (P value) > 3 at α = 0.05.
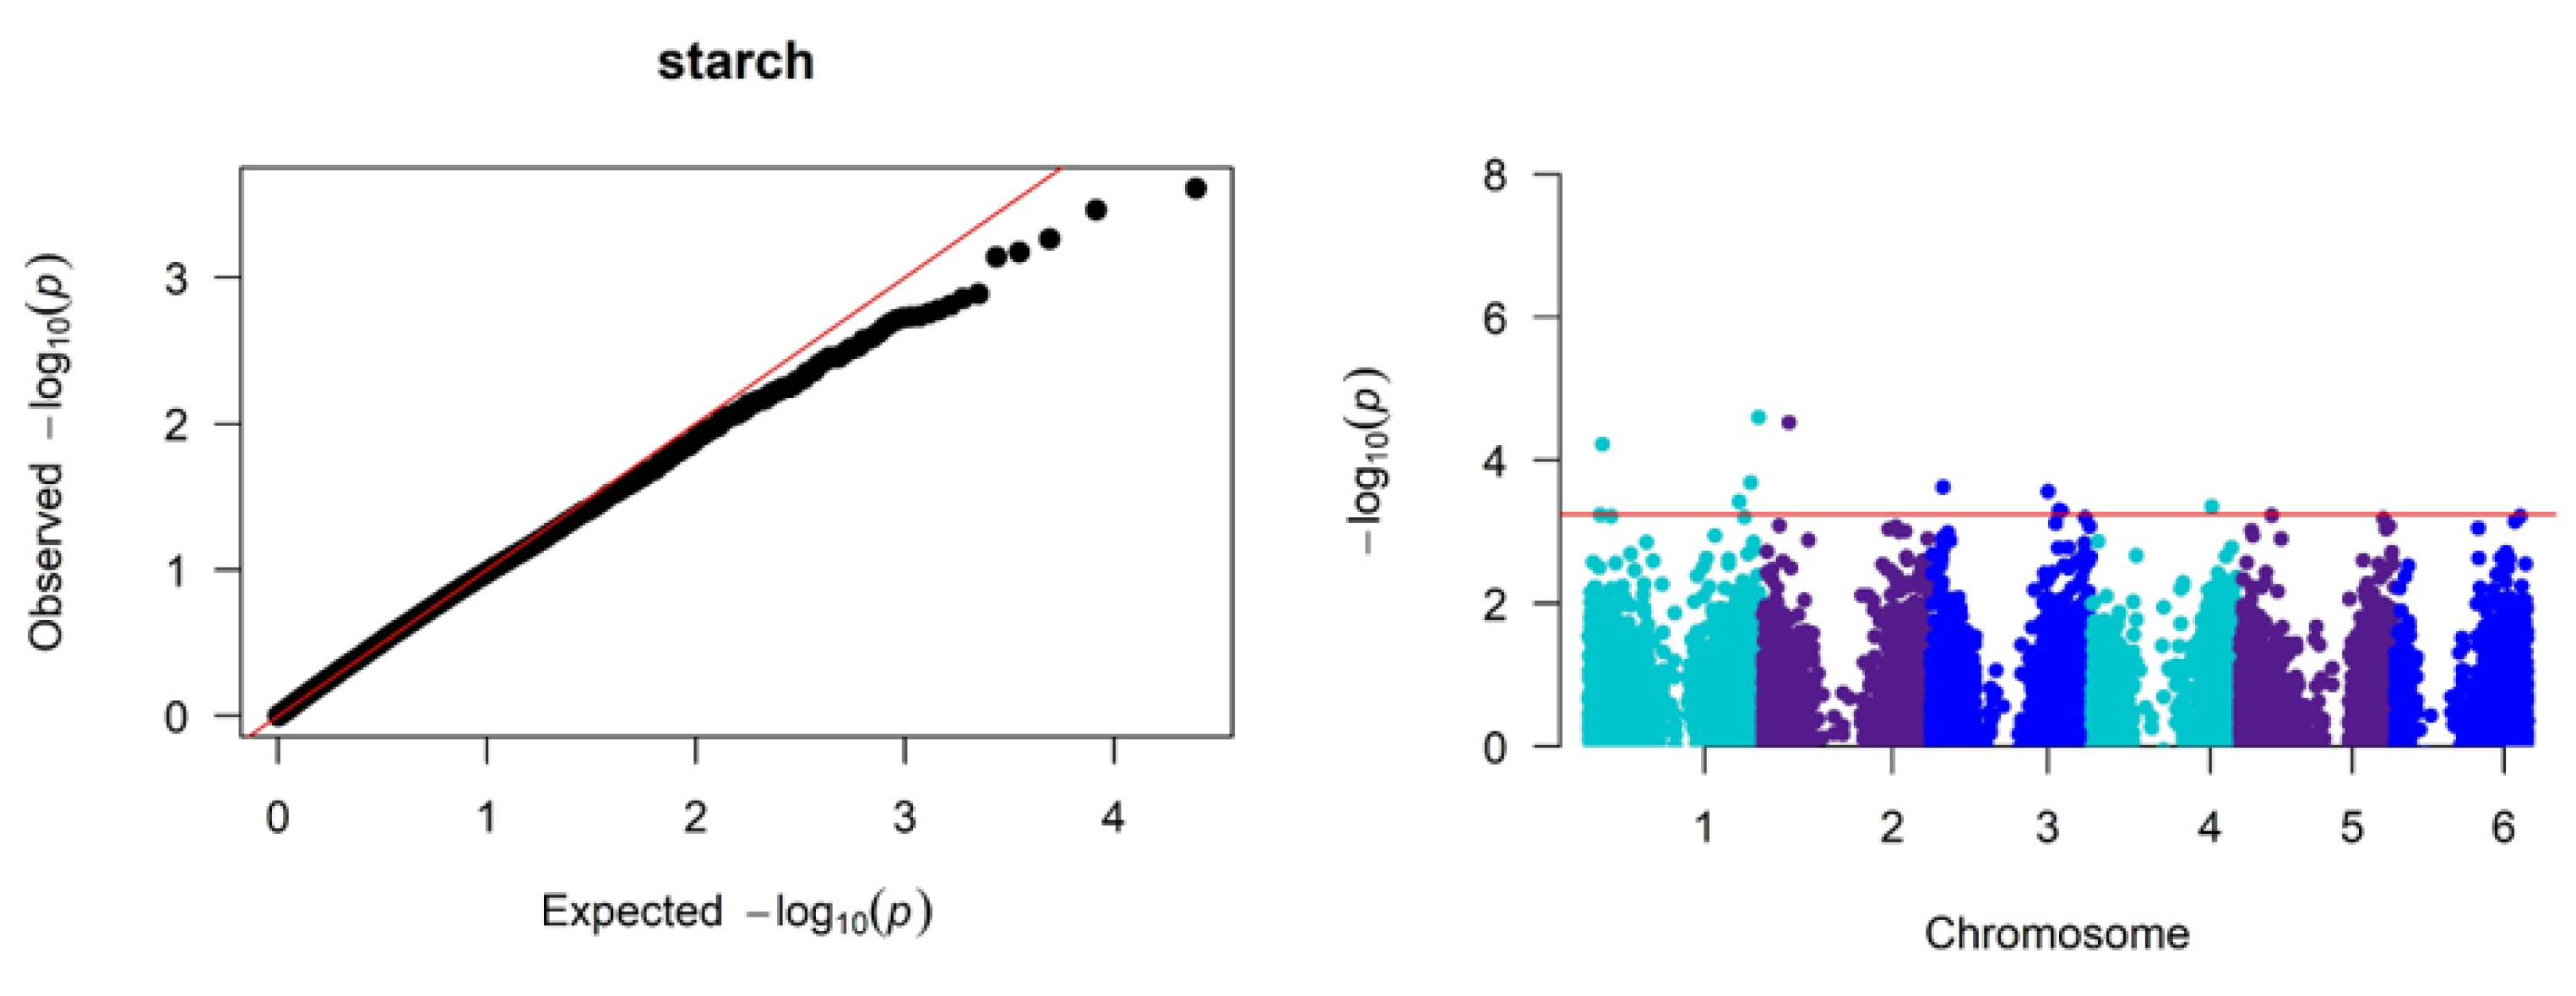
Figure 5.
Tannin top 20 enrichment analysis bubble chart (a). An enriched pathways crosstalk network was built based on the gene interaction network for the modulated pathways crosstalk network (b). The number of SNPs observed for a class is based on the area of the circle. The colour gradient denotes the P-value scale.
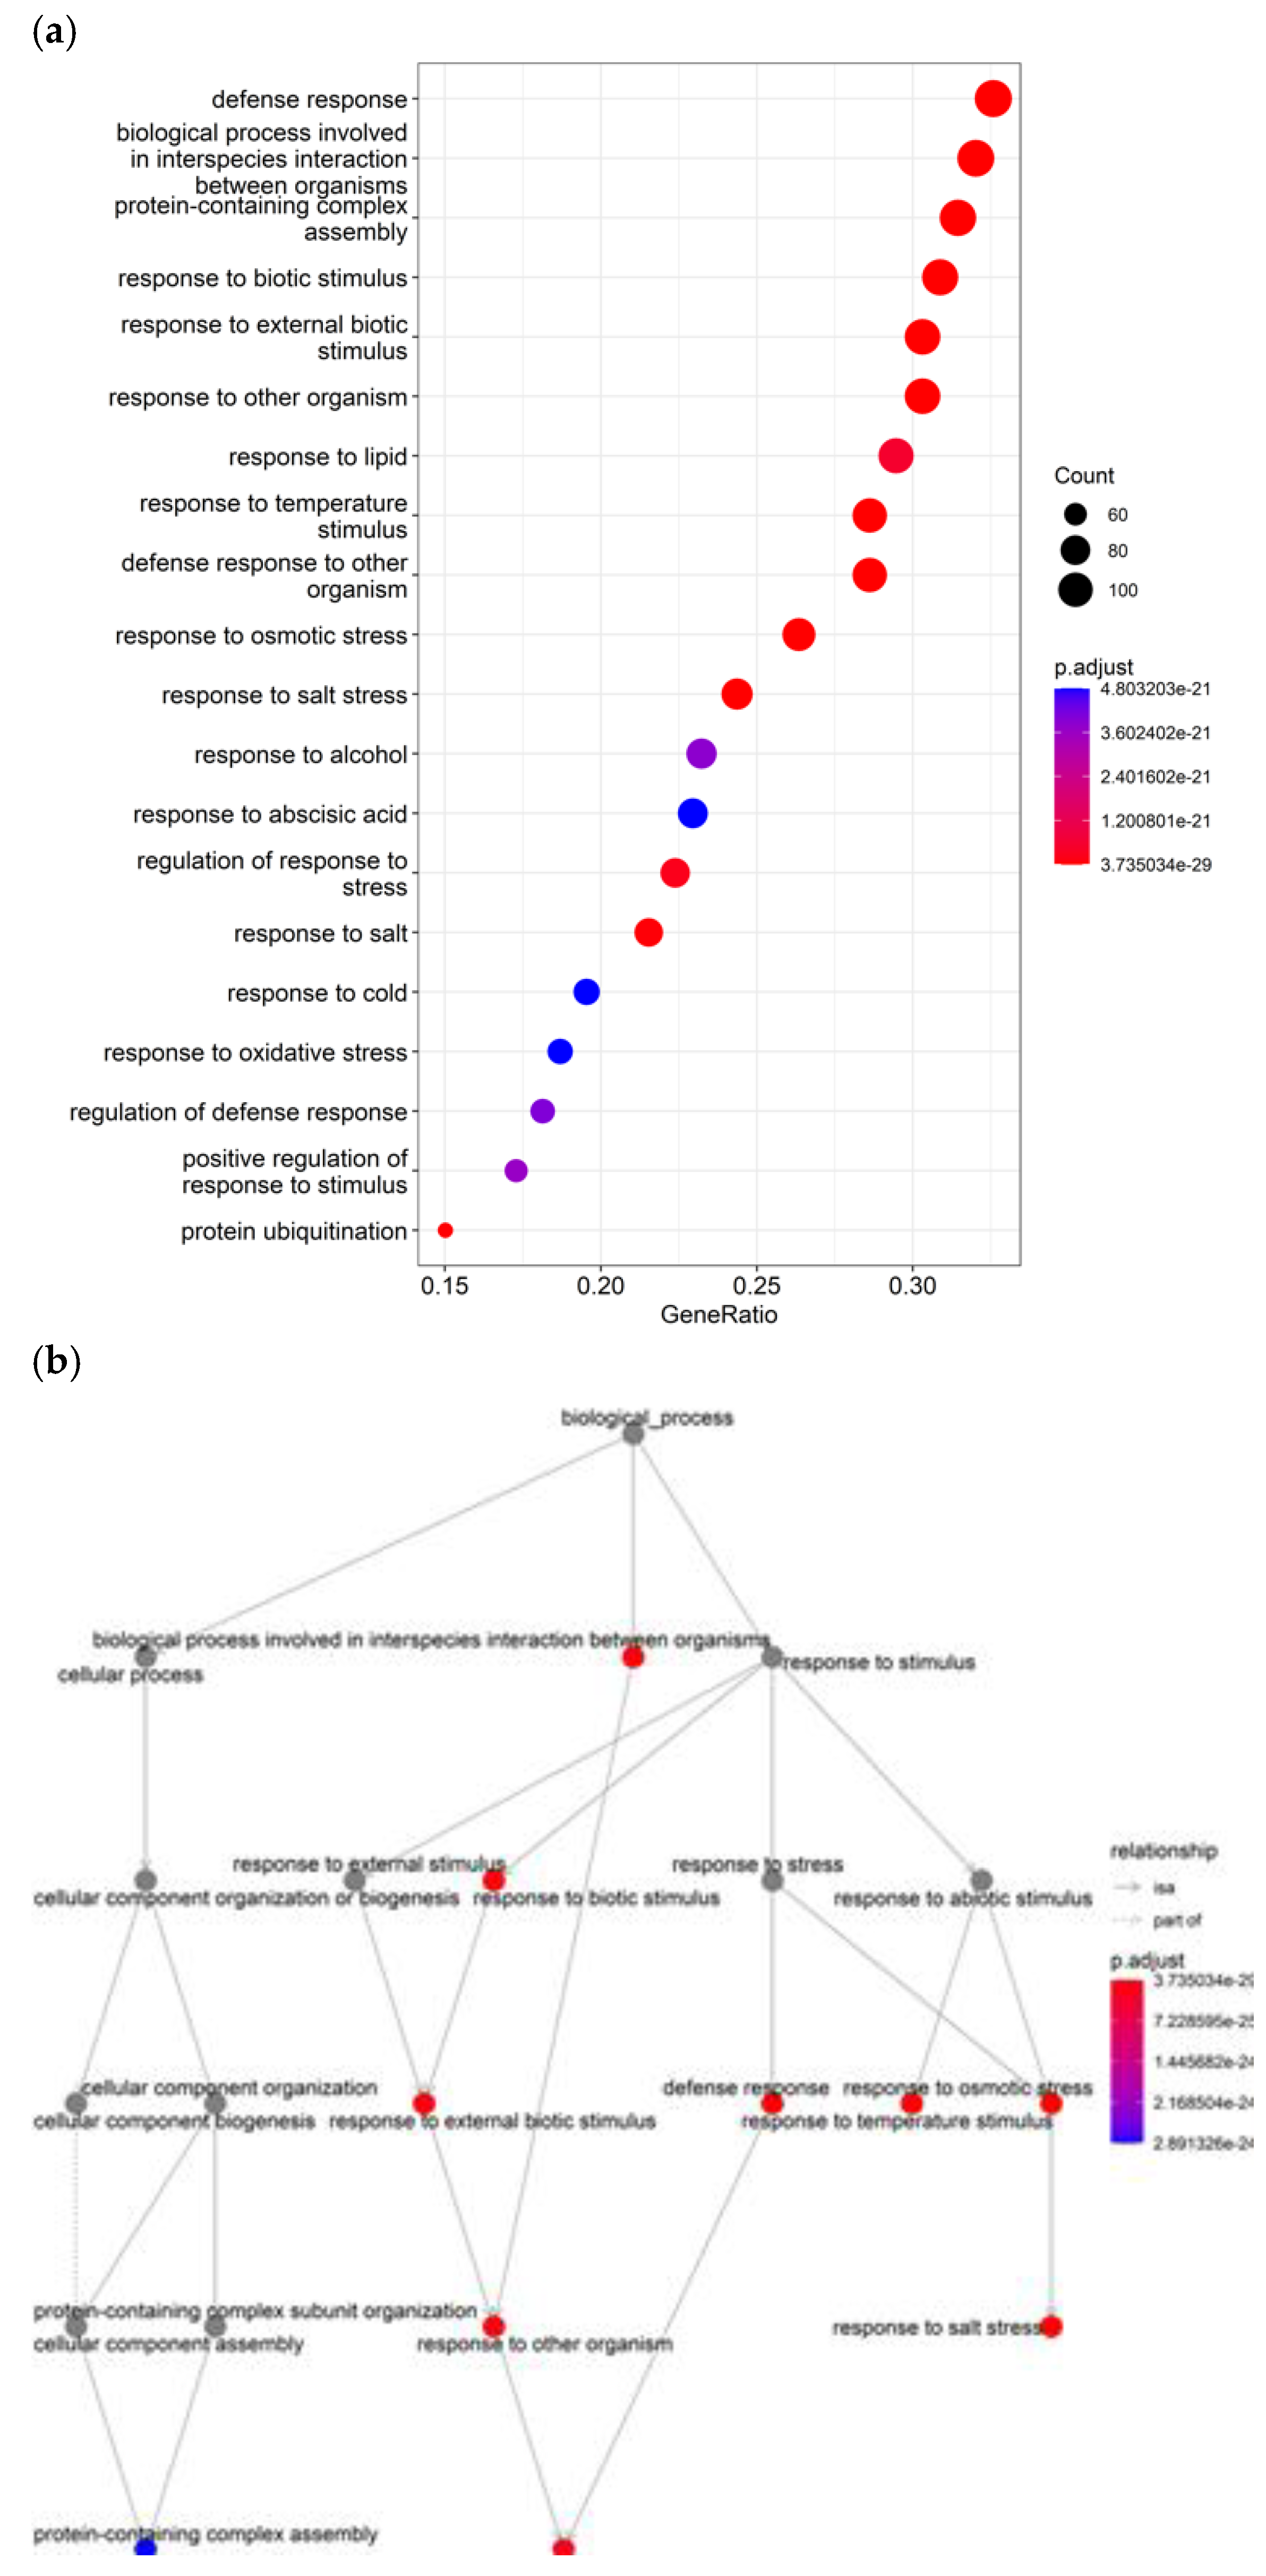
Figure 6.
Nitrogen top 20 enrichment analysis bubble chart (a). An enriched pathways crosstalk network was built based on the gene interaction network for the modulated pathways crosstalk network (b). The number of SNPs observed for a class is based on the area of the circle. The colour gradient denotes the P-value scale.
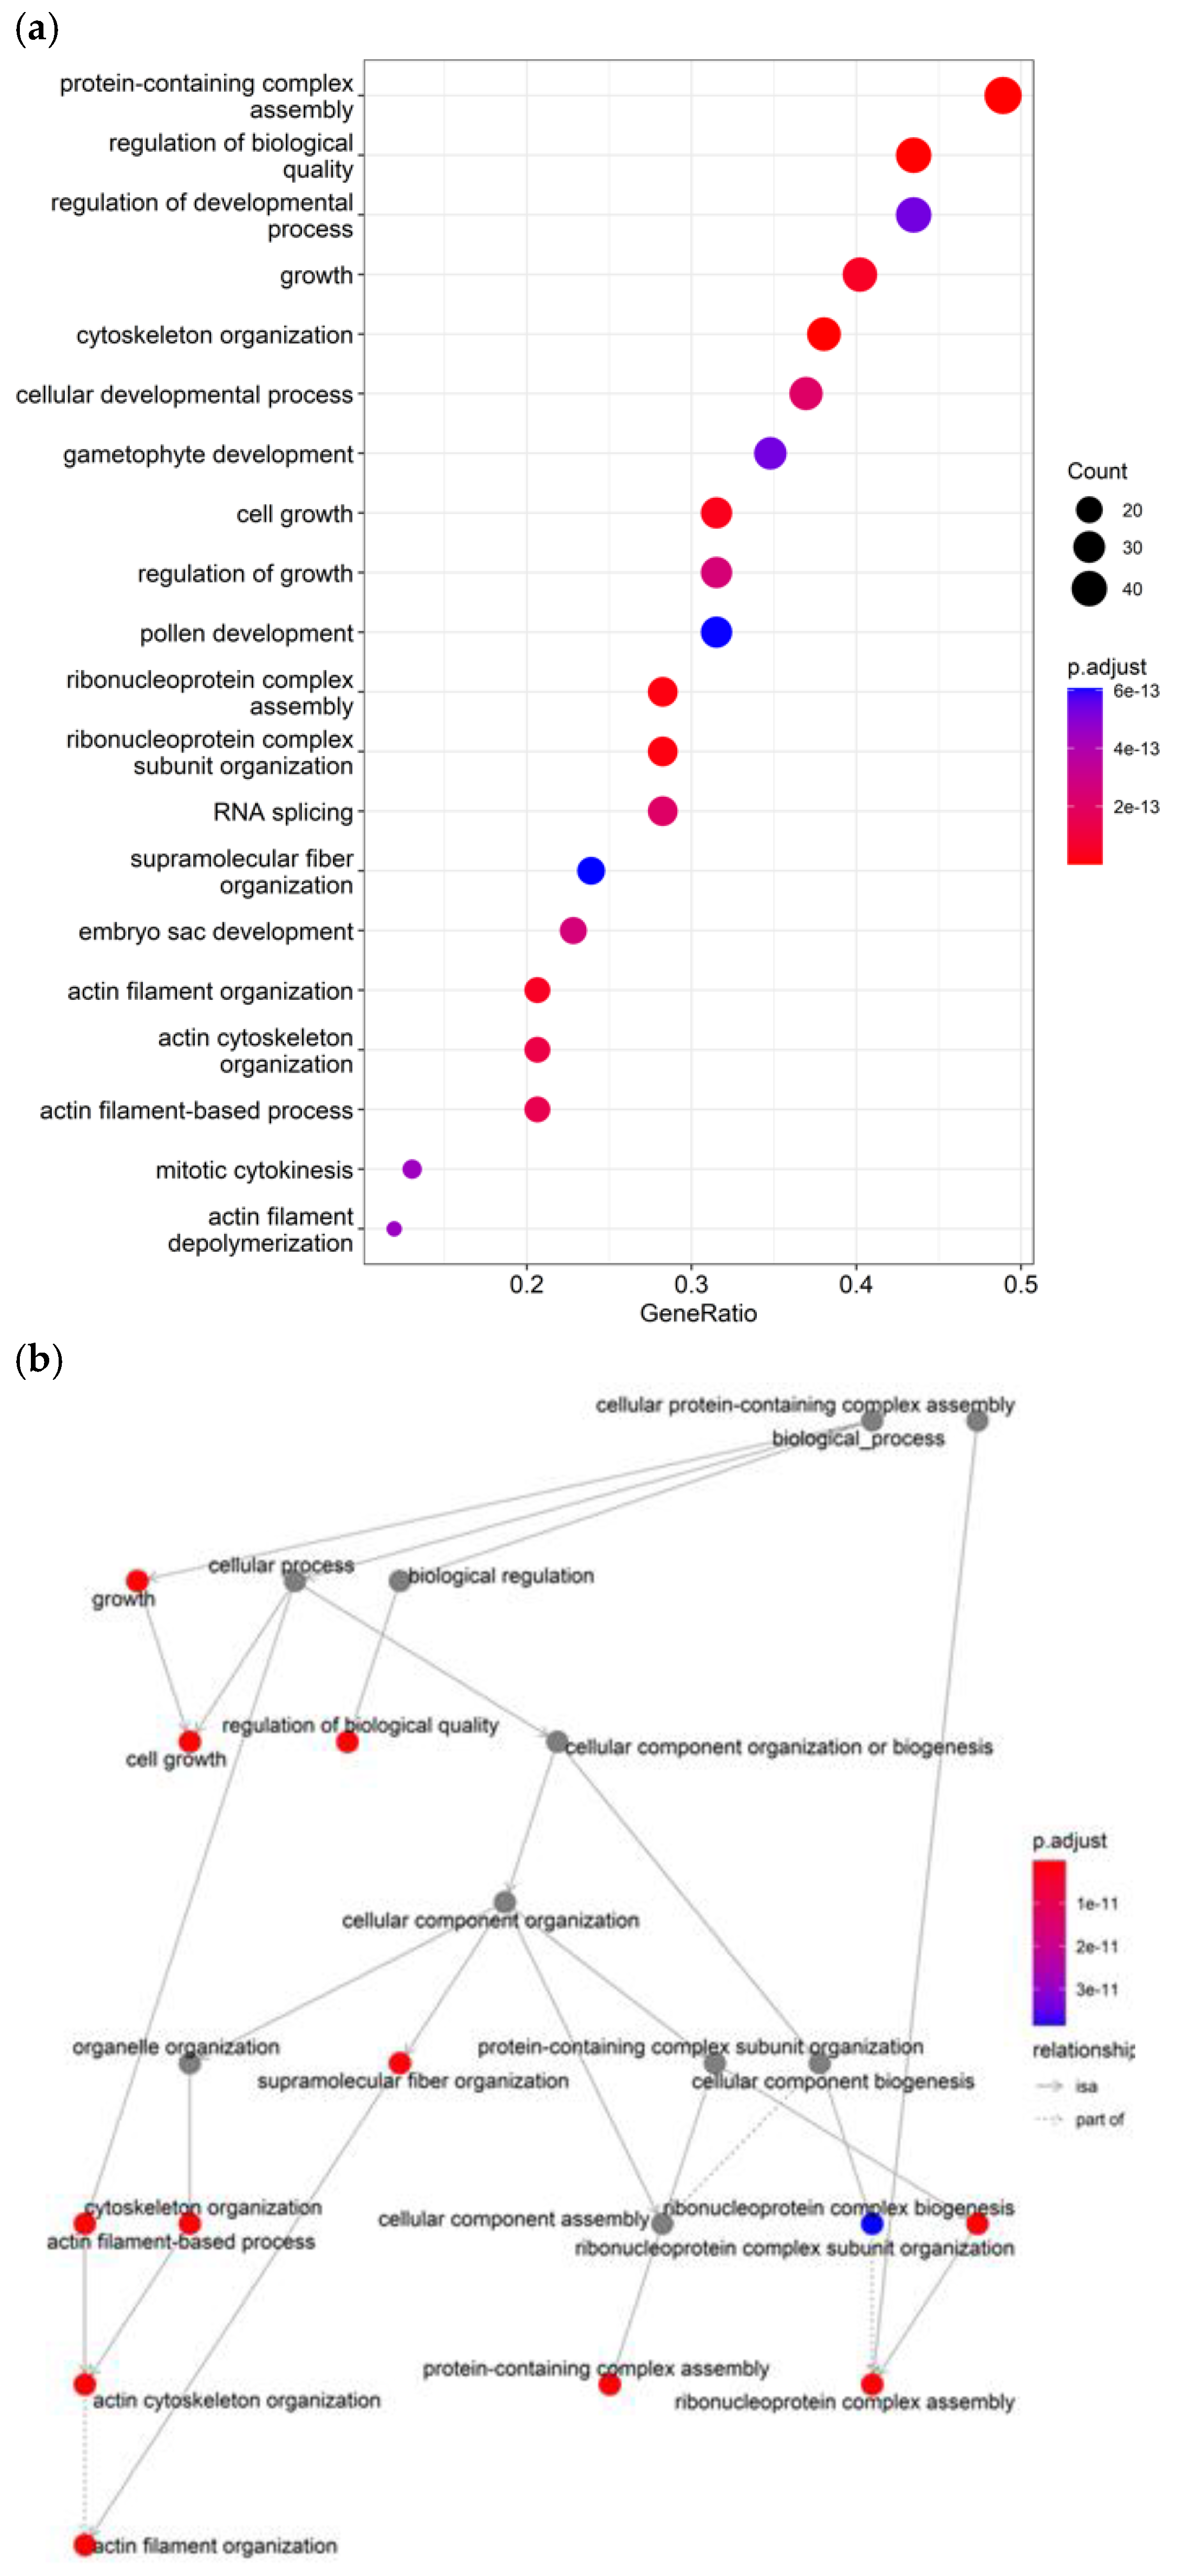
Figure 7.
Starch top 20 enrichment analysis bubble chart (a). An enriched pathways crosstalk network was built based on the gene interaction network for the modulated pathways crosstalk network (b). The number of SNPs observed for a class is based on the area of the circle. The colour gradient denotes the P-value scale.
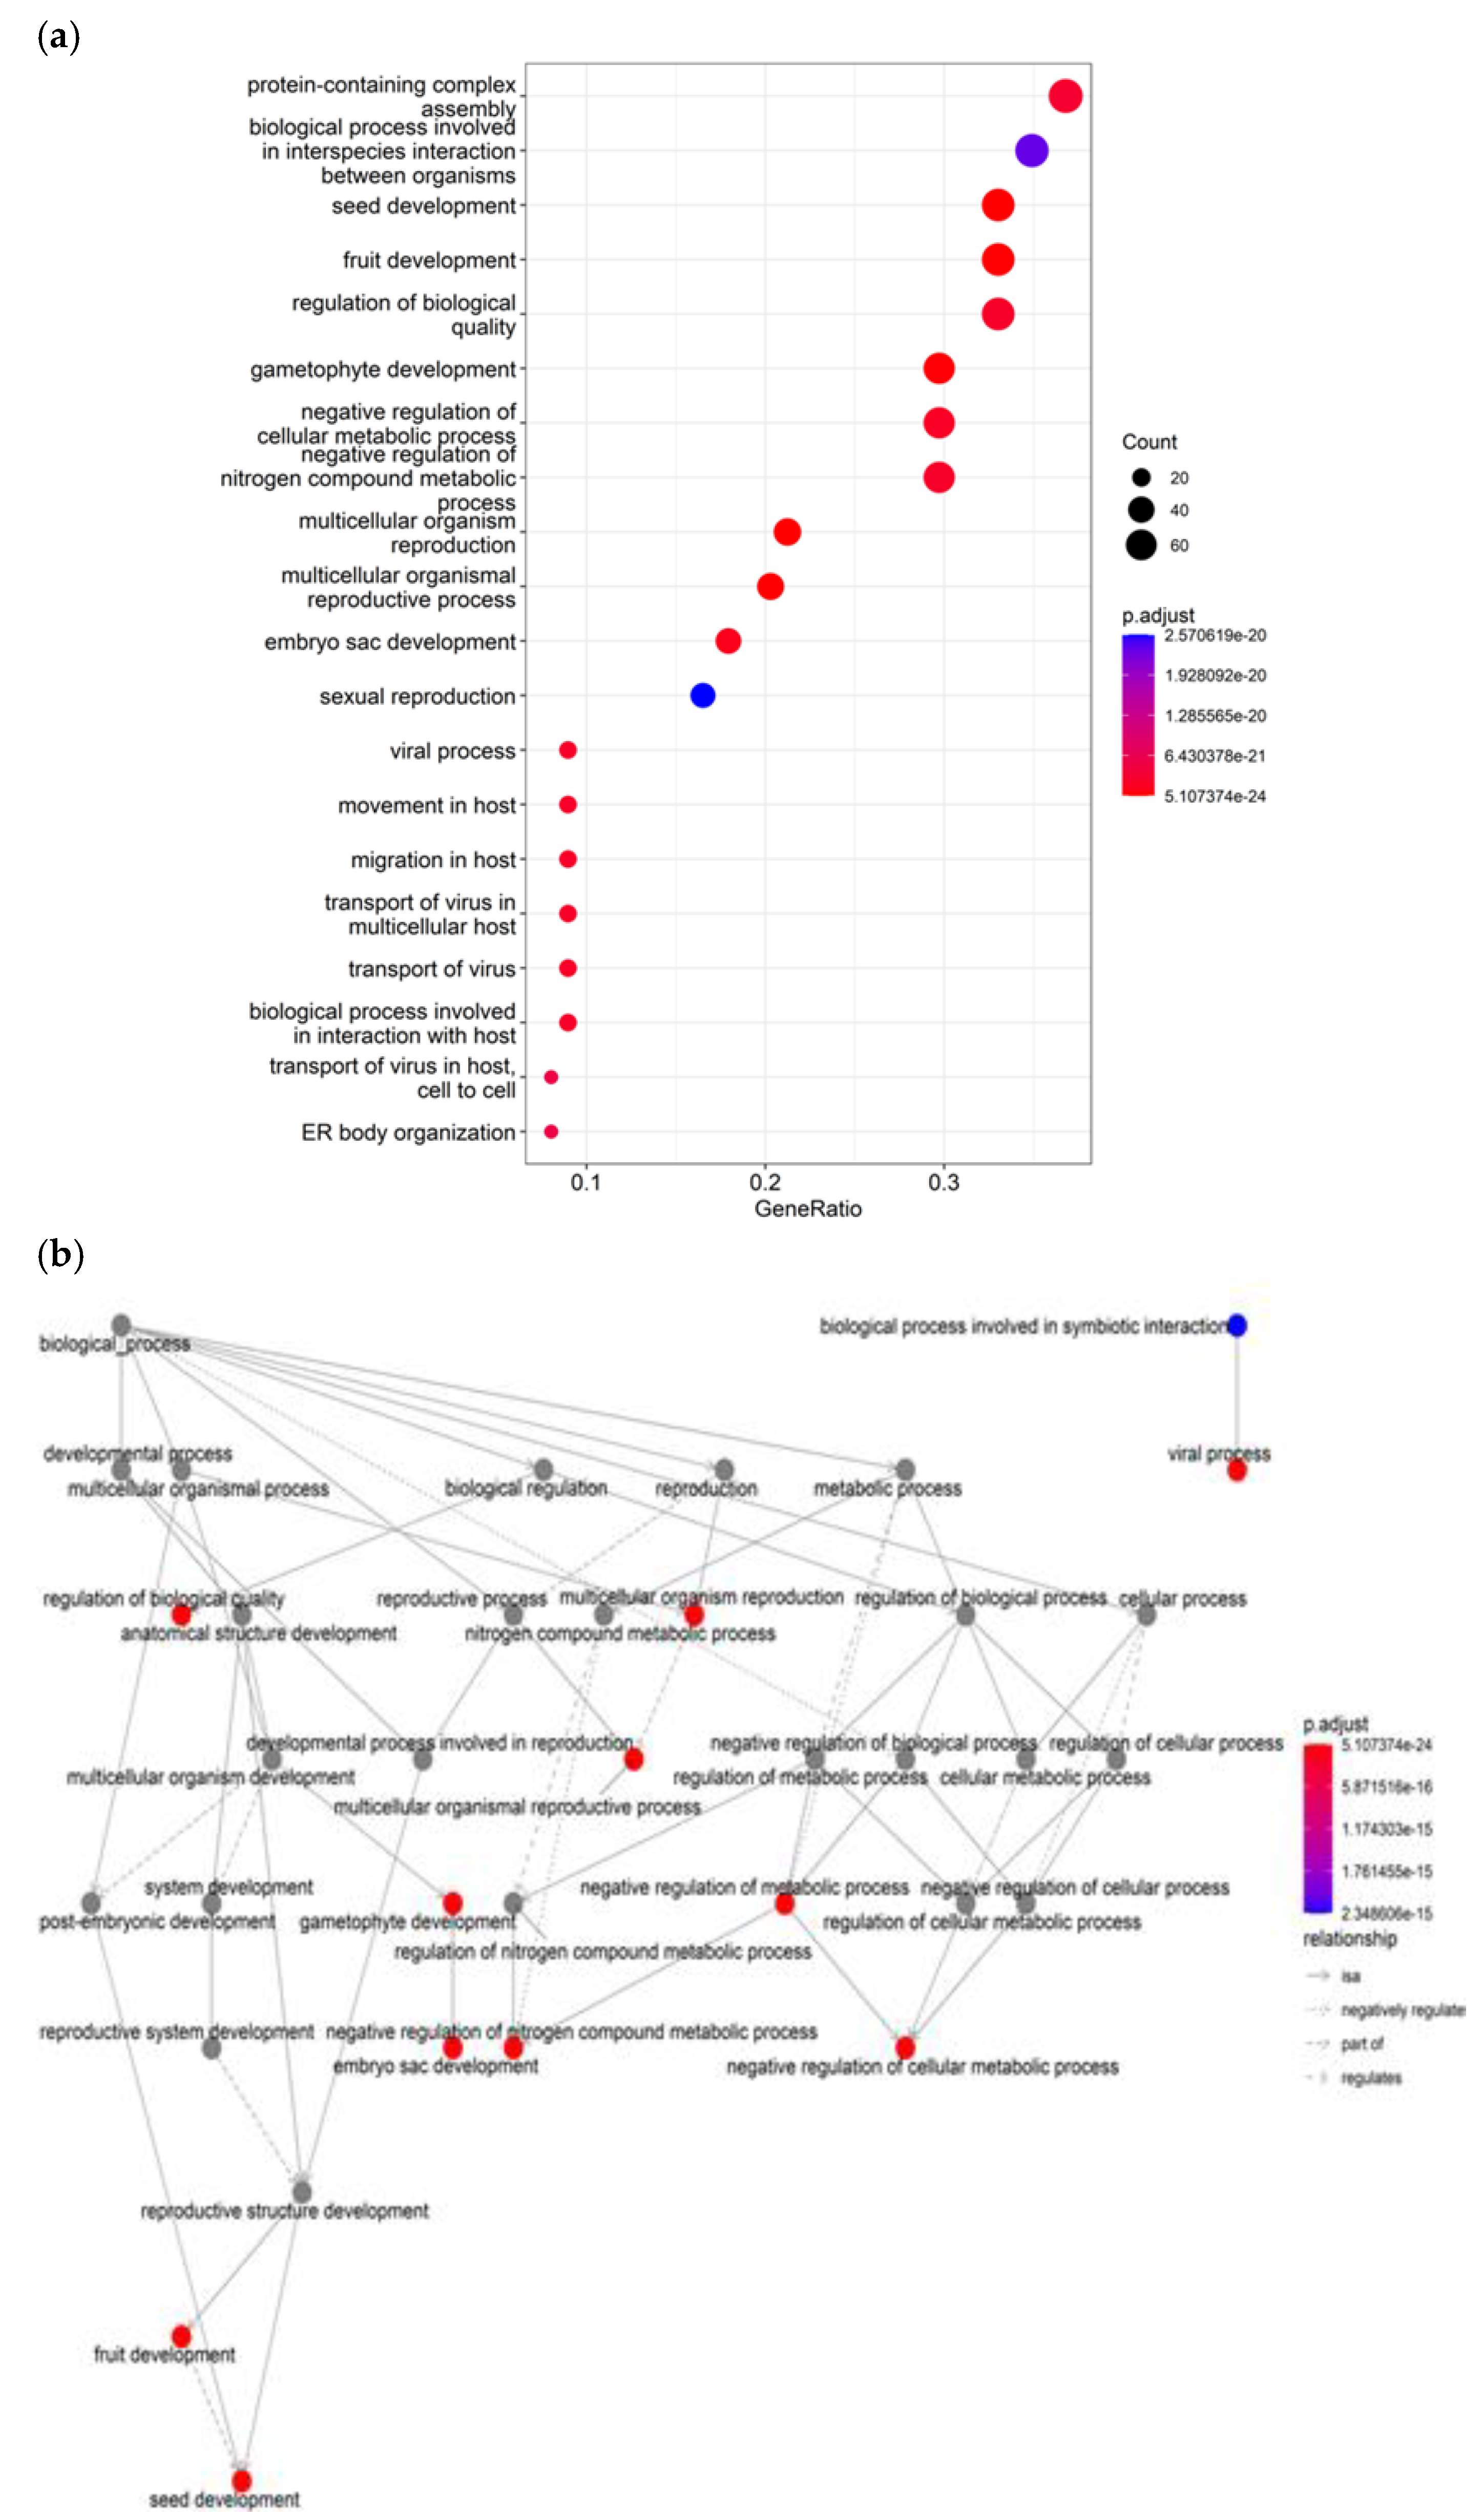

Table 1.
Descriptive statistics for quality traits collected from 94 sorghum genotypes.
| Traits | Minimum | Maximum | Mean | SD | CV% | h2% | Skew | Kurtosis |
|---|---|---|---|---|---|---|---|---|
| Nitrogen | 1.0 | 2.8 | 1.7 | 0.3 | 19.1 | 16.9 | 0.45 | -0.08 |
| Starch | 29.5 | 85.5 | 51.0 | 11.3 | 22.1 | 25.1 | 0.57 | -0.38 |
| Tannin | 279.0 | 5064.5 | 2257.4 | 1016.9 | 45.1 | 28.2 | 0.37 | -0.25 |
SD, standard deviation; CV, coefficient of variation; h2, heritability.
Table 2.
Genome-wide significant associations of single nucleotide polymorphisms (SNPs) with grain tannin, nitrogen, and starch contents in sorghum.
Table 2.
Genome-wide significant associations of single nucleotide polymorphisms (SNPs) with grain tannin, nitrogen, and starch contents in sorghum.
| Trait | SNP | Chromosome | SNP position (bp) | Allele frequency | P value | Effect | LOD | Proportion of SNP variance |
|---|---|---|---|---|---|---|---|---|
| Tannin | SNP15906 | 6 | 58902101 | 0.021 | 6.31E-06 | -56.292 | 5.20 | 0.179 |
| Tannin | SNP7665 | 3 | 67912592 | 0.468 | 2.44E-05 | 35.157 | 4.61 | 0.161 |
| Tannin | SNP1919 | 1 | 79473914 | 0.436 | 4.49E-05 | 20.107 | 4.35 | 0.152 |
| Tannin | SNP5305 | 2 | 13868847 | 0.383 | 4.52E-05 | 20.813 | 4.34 | 0.152 |
| Tannin | SNP12001 | 4 | 62964853 | 0.234 | 4.79E-05 | 26.983 | 4.32 | 0.151 |
| Tannin | SNP12829 | 5 | 70023140 | 0.032 | 5.00E-05 | -41.127 | 4.30 | 0.150 |
| Tannin | SNP14820 | 6 | 54727493 | 0.479 | 7.25E-05 | -31.827 | 4.14 | 0.145 |
| Tannin | SNP11533 | 4 | 61703796 | 0.330 | 7.28E-05 | 21.351 | 4.14 | 0.145 |
| Tannin | SNP12068 | 4 | 6374851 | 0.468 | 0.000142 | 21.874 | 3.85 | 0.135 |
| Tannin | SNP9624 | 3 | 11124381 | 0.266 | 0.000164 | 30.804 | 3.79 | 0.133 |
| Tannin | SNP14838 | 6 | 54825114 | 0.479 | 0.000187 | -33.725 | 3.73 | 0.131 |
| Tannin | SNP13768 | 5 | 62745804 | 0.298 | 0.000243 | -17.374 | 3.61 | 0.127 |
| Nitrogen | SNP12986 | 5 | 62349058 | 0.138 | 0.000504 | 0.032 | 3.30 | 0.115 |
| Nitrogen | SNP1445 | 1 | 65566433 | 0.468 | 0.000508 | 0.030 | 3.29 | 0.115 |
| Nitrogen | SNP3377 | 1 | 25203242 | 0.160 | 0.000535 | -0.030 | 3.27 | 0.114 |
| Nitrogen | SNP7991 | 3 | 1691620 | 0.287 | 0.000787 | 0.021 | 3.10 | 0.108 |
| Nitrogen | SNP8163 | 3 | 74310744 | 0.426 | 0.001087 | 0.032 | 2.96 | 0.103 |
| Nitrogen | SNP12236 | 5 | 68908806 | 0.096 | 0.001323 | 0.031 | 2.88 | 0.100 |
| Nitrogen | SNP8120 | 3 | 58597492 | 0.064 | 0.001555 | 0.036 | 2.81 | 0.097 |
| Nitrogen | SNP15725 | 6 | 1279566 | 0.074 | 0.001668 | 0.038 | 2.78 | 0.096 |
| Nitrogen | SNP11499 | 4 | 9611306 | 0.021 | 0.001688 | 0.066 | 2.77 | 0.096 |
| Nitrogen | SNP14675 | 6 | 44562776 | 0.160 | 0.001705 | 0.028 | 2.77 | 0.096 |
| Nitrogen | SNP9701 | 3 | 44108216 | 0.021 | 0.001731 | 0.060 | 2.76 | 0.096 |
| Starch | SNP12153 | 4 | 4525889 | 0.394 | 0.000246 | -3.067 | 3.61 | 0.126 |
| Starch | SNP3167 | 1 | 16740116 | 0.053 | 0.000343 | 5.534 | 3.46 | 0.121 |
| Starch | SNP13080 | 5 | 66626324 | 0.021 | 0.000545 | 8.527 | 3.26 | 0.114 |
| Starch | SNP15730 | 6 | 1911453 | 0.096 | 0.000666 | 4.299 | 3.18 | 0.111 |
| Starch | SNP14348 | 6 | 9343335 | 0.457 | 0.000723 | -2.434 | 3.14 | 0.110 |
| Starch | SNP11663 | 4 | 6089270 | 0.181 | 0.001293 | 3.696 | 2.89 | 0.100 |
| Starch | SNP13616 | 5 | 7295468 | 0.255 | 0.001382 | 2.609 | 2.86 | 0.099 |
| Starch | SNP12168 | 4 | 33501517 | 0.457 | 0.001548 | -2.475 | 2.81 | 0.098 |
| Starch | SNP539 | 1 | 1560297 | 0.043 | 0.001655 | 5.409 | 2.78 | 0.096 |
aSNP, Single Nucleotide Polymorphism code, bLOD, Logarithm of odds.
Table 3.
The presence (1) and absence (0) of all alleles associated with grain quality traits detected by GWAS in 8 selected genotypes.
Table 3.
The presence (1) and absence (0) of all alleles associated with grain quality traits detected by GWAS in 8 selected genotypes.
| No. | Marker ID | Trait | Alleles | Target allele | BM 16 | Rwanda | GBK -000095 | Gicamunkoni | Nyundo | Nahadava | Gadam | EST 37 | Total |
|---|---|---|---|---|---|---|---|---|---|---|---|---|---|
| 1 | Sobic.002G075100 | Nitrogen | C/A | A | 1 | 1 | 0 | 1 | 1 | 0 | 0 | 0 | 4 |
| 2 | Sobic.003G361300 | Tannin | T/G | T | 0 | 0 | 1 | 0 | 0 | 1 | 1 | 0 | 3 |
| 3 | Sobic.003G122100 | Tannin | C/G | C | 0 | 0 | 1 | 0 | 0 | 1 | 1 | 0 | 3 |
| 4 | Sobic.003G385500 | Tannin | T/C | C | 1 | 1 | 1 | 1 | 1 | 1 | 1 | 1 | 8 |
| 5 | Sobic.004G057200 | Tannin | T/C | T | 0 | 0 | 1 | 0 | 0 | 1 | 1 | 1 | 4 |
| 6 | Sobic.002G010800 | Tannin | G/C | G | 0 | 0 | 1 | 0 | 0 | 1 | 1 | 1 | 4 |
| 7 | Sobic.004G056300 | Starch | A/T | A | 0 | 0 | 1 | 0 | 0 | 0 | 1 | 1 | 3 |
| Total | 2 | 2 | 6 | 2 | 2 | 5 | 6 | 4 |
Disclaimer/Publisher’s Note: The statements, opinions and data contained in all publications are solely those of the individual author(s) and contributor(s) and not of MDPI and/or the editor(s). MDPI and/or the editor(s) disclaim responsibility for any injury to people or property resulting from any ideas, methods, instructions or products referred to in the content. |
© 2025 by the authors. Licensee MDPI, Basel, Switzerland. This article is an open access article distributed under the terms and conditions of the Creative Commons Attribution (CC BY) license (http://creativecommons.org/licenses/by/4.0/).
Copyright: This open access article is published under a Creative Commons CC BY 4.0 license, which permit the free download, distribution, and reuse, provided that the author and preprint are cited in any reuse.


