
Submitted:
17 April 2025
Posted:
21 April 2025
You are already at the latest version
Abstract
Background: Protein (GPC) and starch (GSC) content in common wheat grains determines suitability for further end-use processing and is important quality factor. The level of free asparagine in grains (GFAC) significantly affects suitability for thermal processing. The aim of this genome-wide association studies (GWAS) was to identify markers associated (MTA) with the levels of GPC, GSC and GFAC in elite winter wheat breeding lines, and to identify candidate genes. Methods: In total, 344 winter wheat lines were phenotyped and genotyped with DArTseq markers. Results: GWAS analyses revealed 14 MTAs for GPC, 40 for GSC and 43 for GFAC. New markers have been identified and explained from 6.3% to 12.2% of phenotypic variation. For GPC, region adjacent to 4990459 marker (QGpc.rut.2D) explained 10.2% of the variation and was stable between two years. The novel gene TraesCS7A03G037500, encoding sucrose synthase involved in starch biosynthesis, was identified in proximity of QGsc.rut.7A.2. The TraesCS1B03G0736700 gene, coding NAD(P)H dehydrogenase subunit H involved in the mitochondrial electron transport chain was found in proximity of QGfac.rut.1B.1. Conclusions: These findings provide valuable insights for elucidating inheritance of GCS, and identified MTAs provide molecular markers for reduction of free asparagine and increase of protein content in wheat grains.
Keywords:
association studies
; DArTseq
; near infrared spectroscopy
; single nucleotide polymorphism
1. Introduction
Common wheat (Triticum aestivum L) grown worldwide on more than 213 million hectares is beside rice and corn the third most important crop [1]. It is expected that demand for this crop will increase by about 70 percent over the next 30 years [2]. Therefore, wheat yield improvement is a very important worldwide issue. Almost 60% of produced wheat is destined for food [3], and the main storage components of wheat grains are starch and proteins [2,4]. Content of starch and proteins is different in segments of wheat grain. The main (80-85% of the dry weight) source of starch in wheat grain is endosperm consisted in 65-80% of starch. Embryo and bran contribute to 2-3% and 13-17% of dry weight, respectively and contain below 2% of starch [5,6]. Proteins are more evenly distributed in wheat embryo (20-25%), bran (10-15%), and endosperm (7-15%) [6,7,8]. In wheat, the most important quality yield are related to grain starch content (GSC) and protein content in the grain (GPC). Starch and grain protein content are quantitative, interdependent traits, dependent on both genetic predisposition and environmental conditions [9,10] such as crop rotation, annual rainfall, cultivation practices, soil fertility and nitrogen fertilizer [10]. The control of these traits takes place through the synchronized action of a number of loci [10,11]. Wheat produces transitional and storage starch with the enzymes coded by waxy (Wx) genes [9,12,13,14,15]. Genetic variation in genes involved in starch synthesis and accumulation during grain development directly affects wheat yield and quality of grains [16,17]. Similarly, the total protein content, its composition and the gliadin-glutenin ratio affects the quality of the flour and the bakery products [8,9,10,18,19].
Identification and utilization of loci responsible for GSC and GPC along with appropriate crop management appears to be a suitable agricultural strategy to increase yield of wheat [10]. Genome wide association studies (GWAS) and biparental mapping are the two main approaches to identify loci associated with GSC and GPC. GWAS analyses on a panel of 372 diverse European wheat varieties resulted in identification of marker trait association (MTA) on chromosome 6A (QGpc.ink-6A) that controls 23,42 % variation of GPC and 13,20 % of GSC, but with opposite allelic effects [10]. GSC specific effects were found on chromosomes 2A, 2B, 3A, 3B, 4A, 6A, and 6B [10,17]. Chromosomal localization of some these effects overlaps with loci involved in amylopectin (2A, 2B, 3A, 3B, 4A, 5A, 5B, 6A, 6B, 7A and 7B) and amylose synthesis (1B, 2A, 2B, 3A, 4A and 5A) active during the grain development process [9,17]. Mapping of quantitative trait loci (QTL) on different biparental populations revealed QTLs associated with GSCs on chromosomes 1A, 1B, 1D, 2A, 2D, 3B, 3D, 4A, 4D, 5A, 5B, 5D, 7A, 7B, and 7D [9,17,20,21,22]. Also the waxy genes encoding granule-bound starch synthase (GBSSI, EC 2.4.1.21) are located at three loci Wx-A1, Wx-B1 and Wx-D1, on chromosomes 7AS, 4AL and 7DS, respectively [12,13,23,24,25]. GWAS analyses revealed loci associated with the GPC on chromosomes 1A, 1B, 1D, 2A, 2B, 2D, 3A, 5A, 5B, 5D, 6A, 6B and 7B [9,10,26,27]. Some Single Nucleotide Polymorpism (SNP) markers useful for breeding to increase GPC have been selected [9,10,26]. QTL mapping approaches for GPC revealed the most important effects on chromosomes 6B and 7B. In addition, QTLs affecting GPC during grain development were detected on chromosomes 1B, 2A, 3B, 3D and 7A [9].
Wheat used in heat-processed bakery products is a source of acrylamide. Acrylamide is formed from free asparagine and reducing sugars (glucose, fuctose, maltose) [28,29,30,31,32,33,34,35,36] i.e. in the Maillard reaction [32,37]. The free asparagine (Asn) is an amino acid that together with glutamate and glutamine in higher plants is responsible for the storage and transport of nitrogen [38,39]. The free asparagine content of grain products (GFAC) depends on the genotype [28,32,40] increases under sulfur-deficient conditions [41,42]. Genome-wide association studies (GWAS) resulted in the identification of MTAs for GFAC on chromosomes 1A, 1B, 2A, 2B, 2D, 3B, 4A, 4B, 5A, 6A, 6B, 6D, 7A, and 7B [40,43,44,45,46]. Aspartate synthase is the enzyme responsible for asparagine synthesis in plants. It catalyzes the ATP-dependent transfer of the amide group of glutamine to aspartate. The products of the reaction are glutamate and asparagine [38]. In common wheat, the asparaginase synthetase gene family consists of 5 genes per genome [39,47,48].
In the present study GWAS analyses were employed to identify MTAs for GSC, GPC, and GFAC in common wheat elite breeding lines. Cultivars with elevated protein contents and reduced levels of free asparagine may be more suitable for bakery. The knowledge of regions responsible for different level of GSC, GPC, and GFAC in modern germplasms can be exploited to accelerate genetic gains and the breeding of varieties with desired set of traits.
2. Materials and Methods
2.1. Plant Material
Elite breeding lines and reference cultivars of common winter wheat (Table S1) from on-going breeding programs were planted at three research stations located in Poland at Kobierzyce (KBP, N50°58′34″, E16°55′53″), Smolice (SMH, N51°41′58″, E17°10′29″) and Strzelce (STH, N52°18′52″, E19°24′20″) in 2021-2022 and 2022-2023 cropping seasons. Therefore, 6 environments were assigned kob22, kob23, smh22, smh23, sth22 and sth23 for experimental stations located in Kobierzyce, Smolice and Strzelce respectively and cropping seasons 2022 and 2023. The experiments were set up in a split-block design in three sets of 59-60 genotypes including 3 reference cultivars (Artist, Formacja, and Kilimanjaro in 2022, and Artist, Formacja and Symetria in 2023) and 18 incomplete blocks per set. Each block consisted of 10 randomly assigned genotypes, accounting for three repetitions per genotype. Kernels were harvested from a 10 m2 plots (8 rows, 12.5 cm apart, and 10 m long), stored and used for chemical analyses.
2.2. Phenotypic Data Collection
Near infrared spectroscopy (NIR) (FOSS Infratec Nova analyzer, Hilleroed, Denmark) was used to determine the GSC, and GPC in the [%] unit. The mean humidity of grains was 11,4%. Samples collected in Strzelce in 2022 year were used for determination of GFAC in flour. Isolation of free asparagine was carried out according to [49] with some modifications. The amount of wheat flour and acid added was reduced 4-fold from 10g and 30mL to 2,5g and 7,5mL, respectively. Free asparagine content was determined on Varioskan LUX spectrophotometer (Thermo Fisher Scientific, Waltham, Massachusetts, US) in 96-well plates according to the instructions provided with the K-ASAM L-ASPARAGINE/L-GLUTAMINE/AMMONIA (RAPID) reagent kit (Megazyme Bray, Co. Wicklow, Ireland). The volume of sample added was increased from 10 to 25µL. Incubation times were increased from 5 min to 36 min, and 2 × 75 min between first (conversion of L-glutamine into L-glutamate), second (ammonia is converted to L-glutamate in the presence of NADPH, glutamate dehydrogenase (GIDH) and 2-oxoglutarate) and third reaction (hydrolysis to L-aspartate and ammonium ions by asparaginase).
2.3. Genotyping
DNA was isolated from 2-week old seedlings according to CTAB (cetyltrimethylammonium bromide) method recommended by Diversity Arrays Technology Pty Ltd. (Bruce, Australia). Quality of samples was checked on 1.5% agarose and DNA concentration was determined with spectrophotometer. In total, 343 winter wheat lines were genotyped with DArTseq markers in 2022 or 2023 season. Analysis of 170 genotypes carried out in 2022 resulted in 19 483 DArTseq markers (8952 silicoDArTs, and 10,531 SNPs). For the panel of 174 lines, 61,317 DArTseq markers (25934 silicoDArTs and 38,933 SNPs) were obtained in 2023.
2.4. Data Analysis
The distribution of the data, descriptive statistics, correlations and ANOVA analyses were obtained with Statistica 13.3 software (Tibco, CA, USA). For the genotypes studied the BLUP (Best Linear Unbiased Prediction) and the heritability were calculated using the R package - "Phenotype". Markers spaced every 5 Mbp were selected for the analysis of population structure [50]. Evenly distributed 2097 and 2782 SNP markers were obtained for sets of genotypes analyzed in 2022 and 2023, respectively. STRUCTURE v 2.2 [51] software was used to calculate the population structure with K values ranging from 1 to 15, iterated 10,000 times.
The BLUP values were subjected to GWAS (genome wide association studies) analysis. General Linear Model (GLM), Mixed Linear Model (MLM), and Compressed Mixed Linear Model (CMLM) models of the GAPIT package were tested with iPat (Intelligent Prediction and Association Tool) [52]. False Discovery Rates were calculated for the p-values to select significant effects.
2.5. Identification of Candidate Genes
Positions of selected MTA loci with highest or main effect were established on IWGSC v2.1 genome sequence on the Unit Resources Genomics-Info database (URGI) [53] using the sequences of significant SNP markers. For selected MTAs with the highest effects, 10 flanking genes were selected. Gene ontology (GO) annotations were checked on Ensembl Plants (http://plants.ensembl.org/) and Uniprot (https://www.uniprot.org/). Expression profiles of selected genes with functions directly or indirectly related to the traits studied were retrieved from WheatOmics 1.0 [54].
3. Results
3.1. Phenotypic Data
Analysis of variance showed significant variation in the average starch and protein contents in grains and a significant influence of environment for GSC and GPC. The average GSC in 344 lines of wheat was 60.97% and varied between environments in a narrow range from 60.16 (smh22) to 62.27% (sth23) (Table 1). Higher variation of GPC was found. On average, grains contained 11.31% protein and the content varied from 9.61% (sth23) to 12.92 (smh22). The greatest variability was found for free asparagine content, which ranged from 26.67 to 227.16 ppm in the varieties studied. With two exceptions, the absolute values of skewness and kurtosis were less than 1.0. This indicates that the distribution of the studied traits is close to normal, and GSC, GPC and GFAC belong to quantitative traits controlled by multiple loci (Figure 1). The highest broad-sense heritability reaching almost 80% were obtained for GPC, while for GSC we found 70% and 45% in panels of wheat lines analyzed in 2022 and 2023, respectively. A strong negative correlation between GSC and GPC (-0.778, p<0.001) indicates, that both processes of proteins and starch accumulation during wheat grain maturation are linked, and selection for low GSC will result in increase of GPC. A weak positive correlation (0.277, p<0.001) was observed for the GPC-GFAC pair.
3.2. Genotype Variation
A total of 19,483 and 61,317 DArTseq markers were used for association analyses in 2022 and 2023, respectively. Some of these markers had no unambiguous position on the reference genome (IWGSC v.2.1), while other markers were mapped (Figure 2). The distribution of DArTseq markers on wheat chromosomes that is not random, and distal fragment are apparently better saturated.
3.3. Population Structure
Subsets of 2097 and 2782 of DArTseq markers were used for population structure analysis of common wheat panels analyzed in 2022 and 2023, respectively. To avoid overrepresentation of genetic diversity deposited in distal regions of chromosomes, markers with lowest number of missing data were selected from 5Mbp linkage blocks. Different genetic structure of elite breeding lines was found in subsequent years (Figure 4). In 2022 year, 170 lines were divided into four subpopulations represented by 86, 34, 32 and 18 lines. The panel of lines surveyed in 2023 consisted of two subpopulations represented by 111 and 63 lines (Table S1).
3.4. GWAS Results
In total, 12 chromosomal regions associated with changes in protein content were found in the studied breeding lines using the GLM model. No major genes affecting GPC were identified and the markers explained from 6.8% to 10.2% of total variation (Table 2, Table S2). The marker-trait association (MTA) effect of QGpc.rut.2D was stable for both panels of lines tested. Most MTAs were significantly associated with protein content only in selected environments.
Genome -wide association studies for GSC revealed 40 MTAs (Table S3) clustered in 35 QTLs, with DArTseq markers showing minor allele frequency (MAF) above 0.05. QGsc.rut.3D.4 was common for both panels of advanced breeding lines. Three models (GLM, MLM, and CMLM) produced consistent results for 16 MTAs (Table 3) identified for GSC measured in 2023 year. Selected markers explained from 6.8% to 12.2% (QGsc.rut.7A.4) of variation (Table S3).
In total, 43 markers associated with free asparagine content were identified on 15 chromosomes using the GLM model in 2022 (Table 4). These markers explained from 6.3% to 11.9% of the variation (QGfac.rut.1B.1). Distribution of MTAs was not random, and 6 markers have been located in the first homoeologous group on 1B in the fragment of 470-495 Mbp and on 1D in area of 368-423 Mbp. Similarly, the distribution of MTAs between chromosomes 2B and 2D was in the corresponding regions of 31 Mbp and 35 Mbp and 517 Mbp and 497 Mbp, respectively. Further, 3 MTAs have been located in the beginning of chromosomes belonging to the third 3 group. Two cluster of markers were also found. The first comprised 5 markers mapped in the 245-375 Mbp on chromosome 6B. The second group included 8 MTAs located on the long arm of chromosome 7A (Table 4).
3.5. Candidate Genes
Most of the markers associated with the traits studied were related to selected loci on the wheat genome, and it was not possible to distinguish narrow regions of the chromosome saturated with MTAs where candidate genes are located. The search for candidate genes was limited to regions adjacent to the selected markers, which included the nearest 5 genes upstream and downstream. For GPC, region adjacent to 4,990,459 marker (QGpc.rut.2D) which explained 10.2% of the variation and was stable between years was characterized, but no genes directly affecting GPC were identified (Table S3). For GSC two markers 1,280,335 and 980,786 from region of QGsc.rut.7A.2, has been selected. These markers in spite of low frequency, overlapped with existing MTA (1127783). Sucrose synthase gene (TraesCS7A03G0375000) was identified in region of QGsc.rut.7A.2 that is involved in sucrose metabolism process. Finally, three MTAs with the GFAC were selected 4,989,859 (QGfac.rut.1B.1), 1,081,766 (QGfac.rut.3B.2), and 3,953,081 (QGfac.rut.7A.6), explaining 11.9%, 10.1%, and 11.2% of variation in GFAC, respectively. NAD(P)H dehydrogenase subunit H was identified in the region of QGfac.rut.1B.1 and can be indirectly related with nitrogen metabolism.
4. Discussion
The resulting locations of the 14 MTAs were compared with markers identified to date for GPC (Table S5). The cluster of 4 markers located in the 0.9-18.2 Mbp region on chromosome 2A (IWGSC v1.0) is a new region that does not overlap with previously described markers from this chromosome (located in the terminal region of the chromosome). Similarly, new GPC-related regions have been identified by the markers QGpc.rut.5B.1 (331 Mbp, v1.0), QGpc.rut.5B.2 (357 Mbp, v1.0), QGpc.rut.6A (4.7 Mbp, v1.0), 7B (66 Mbp, v1.0), and QGpc.rut.2D. The remaining markers QGpc.rut.3A, QGpc.rut.3B, QGpc.rut.5B.4 and QGpc.rut.5B.3 are located within a 50 Mbp window relative to the previously described markers (Table S5).
Most of the markers associated with GSC identified within this study have not been described before. New MTAs for GSC were found on chromosomes 1B, 2D, 3D, 5A, 5B, 7A and 7B. Markers QGsc.rut.4A.1 and QGsc.rut.4A.2 were located in previously reported regions [17]. The locations of the other GSC-associated MTAs also do not match markers reported in the literature. Markers associated with variation in asparagine content in grains identified on chromosomes 2D (QGfac.rut.2D.1) and 7B (QGfac.rut.7B.9) were located 13.7 Mbp and 0.4 Mbp, respectively, away from previously described markers [43]. Four markers (QGfac.rut.4A, QGfac.rut.7A.1, QGfac.rut.7D.1 and QGfac.rut.7D.2) were found within the 50 Mbp window in respect to already reported regions (Table S5) [43,44].
Genes indirectly related to protein biosynthesis in wheat grain have been identified on chromosome 2D (Table S5). They encode enzymes that are involved in the plant's response to the stress factor. Xyloglucan endotransglucosylases/hydrolases (XTH) are key enzymes involved in cell wall remodeling, a process that includes relaxation and structural changes essential for plant adaptation to stress [55]. The defense mechanisms may disturb the metabolic balance, including protein synthesis. Panel of diseases tolerance related genes in this region includes disease resistance protein RPM1 [56], NB-ARC domain-containing protein, disease resistance N-terminal domain-containing protein [57], and cytochrome P450 that modulates plant defense against Furasium head blight [58]. Some of the enzymes in P450 family also affect seed development and size [59].
For GSCs, the protein directly involved in the starch biosynthetic pathway is sucrose synthase (SuS). This enzyme catalyses the reaction to convert sucrose into UDP-glucose and fructose [60], then UDP-glucose is then converted to G1P [15]. The highest activity of this enzyme occurs at the time of increased starch synthesis and is mainly related to endosperm development in Triticum aestivum [60]. The gene TraesCS7A03G0375000 (IWGSC v2.1) corresponds to TraesCS7A02G158900 (IWGSC v1.0) is located in region of QGsc.rut.7A.2 set by markers 1,280,335 and 980786. This gene shows the highest level of expression in the root (>150 TPM), with slightly lower levels in the stem, spike and grain (Figure 5, Figure S1). The lowest expression values are observed in the leaves (<50 TPM) [61]. In grain, the highest expression activity occurs early in grain development - 10DPA (Figure S2) [62]. In the embryo, expression is higher than in the endosperm up to 14 DPA. After 25 DPA it decreases significantly. In the endosperm it remains at a similar level (Figure S3) [63].
In the case of GFAC, gene TraesCS1B03G0736700 indirectly linked to the free asparagine content of the grain was identified on chromosome 1B. This gene coding NAD(P)H dehydrogenase is involved in the mitochondrial electron transport chain as the so-called complex I [64]. Metabolism of nitrogen is associated with this pathway is as an element essential for the synthesis of amino acids and proteins [64,65]. Expression analysis of TraesCS1B03G0736700 (TraesCS1B02G262900 v1.1) shows that the gene is active in both root, stem, leaf, spike and grain. Overall, the highest level of expression is observed in the spike (Figure 6, Figure S4) [61]. Expression level of this gene is higher in the embryo (>1 TPM) than in the endosperm (<0,25 TPM), and remains at similar levels between 14 and 25 DPA (Figure S5, S6) [63].
5. Conclusions
Association studies revealed 14 MTAs for GPC, 40 for GSC and 43 for GFAC. Polyploid nature of wheat and presence of homoeologous chromosomes introduce some level of uncertainty into physical mapping of markers to reference genome. However, beside several markers with overlapping position mainly new markers have been identified. In elite wheat breeding lines main genes affecting important agronomically traits were possibly already fixed. Therefor only minor loci have been found that explained from 6.3% to 12.2% of phenotypic variation. The novel gene TraesCS7A03G037500, encoding sucrose synthase involved in starch biosynthesis, was identified in proximity of QGsc.rut.7A.2 that opens further opportunity for better understanding of starch biosynthesis and accumulation processes. Reported findings provide valuable insights for elucidating inheritance of GCS. Identified MTAs provide molecular markers for reduction of free asparagine and increase of protein content in wheat grains.
Supplementary Materials
The following supporting information can be downloaded at the website of this paper posted on Preprints.org, Figure S1: TraesCS7A02G158900 expression in tissues of Chinese Spring; Figure S2: TraesCS7A02G158900 expression in developing wheat grain; Figure S3: Expression of TraesCS7A02G158900 in embryo and endosperm of developing grain; Figure S4: TraesCS1B02G262900 expression in organs of Chinese Spring; Figure S5: Expression of TraesCS1B02G262900 in embryo and endosperm of developing grain; Figure S6: TraesCS1B02G262900 expression in developing wheat grain; Table S1: Accessions used in the study, pedigree, subpopulation and BLUP values; Table S2: Markers associated with GPC in elite breeding lines. Alternative genomic localizations and sequences. Kbp, smh, and sth correspond to Kobierzyce, Smolice and Strzelce experimental stations; Table S3: Markers associated with GSC in elite breeding lines. Alternative genomic localizations and sequences. Kbp, smh, and sth correspond to Kobierzyce, Smolice and Strzelce experimental stations; Table S4: Markers associated with GFAC in elite breeding lines. Alternative genomic localizations and sequences.; Table S5: Genes identified in proximity of selected MTAs, and predicted functions; Table S6: MTAs and QTLs identified for GSC, GPC and GFAC.
Author Contributions
For research articles with several authors, a short paragraph specifying their individual contributions must be provided. The following statements should be used “Conceptualization, M.T. and K.R.; investigation, K.R., M.O-I., and D.T.; resources, P.M., T.D., A.D.; writing—original draft preparation, K.R. and M.T.; writing—review and editing, K.R. and M.T; visualization, K.R. and M.T; supervision, M.T.; funding acquisition, M.T. All authors have read and agreed to the published version of the manuscript.” Please turn to the CRediT taxonomy for the term explanation. Authorship must be limited to those who have contributed substantially to the work reported.
Funding
“This research was funded by Ministry of Agriculture and Rural Development of Poland, grant number DHR.hn.802.7.2022 and DHR.hn.802.8.2023”.
Data Availability Statement
Data is contained within the article or supplementary material.
Conflicts of Interest
The authors declare no conflicts of interest.
Abbreviations
| ADP-ase | ADP-glucose pyrophosphorylase |
| ADPG | ADPG - ADP-glucose |
| AMP | adenosine monophosphate |
| Asn | asparagine, |
| ATP | adenosine triphosphate |
| DBE | starch debranching enzymes |
| FK | fructokinase |
| G1P | glucose-1-phosphate |
| G6P | glucose-6-phosphate |
| GBSS | granule-bound starch synthase, |
| GPC | grain protein content |
| GSC | grain starch content |
| HK | hexokinase |
| INV | invertase |
| ISA | isoamylase-type starch debranching enzyme |
| NIR | near infrared spectroscopy |
| PGI | phosphoglucose isomerase |
| PGM | phosphoglucomutase |
| PPi | pyrophosphate |
| PUL | pullanase |
| QTL | quantitative trait loci |
| SBE | starch branching enzyme |
| SS | starch synthase |
| SuSy | sucrose synthase |
| UDPG | UDP-glucose |
References
- FAOSTAT. Available online: https://www.fao.org/faostat/en/#home (accessed on 14 April 2025).
- Vitale, J.; Adam, B.; Vitale, P. Economics of Wheat Breeding Strategies: Focusing on Oklahoma Hard Red Winter Wheat. Agronomy 2020, 10, 238. [Google Scholar] [CrossRef]
- Abedi, T.; Mojiri, A. Cadmium Uptake by Wheat (Triticum Aestivum L.). An. Overview. Plants 2020, 9, 500. [Google Scholar] [CrossRef] [PubMed]
- Shewry, P.R.; Hey, S.J. The Contribution of Wheat to Human Diet and Health. Food Energy Secur. 2015, 4, 178–202. [Google Scholar] [CrossRef] [PubMed]
- Šramková, Z.; Gregová, E.; Šturdík, E. Chemical Composition and Nutritional Quality of Wheat Grain. Acta Chim. Slovaca 2009, 2, 115–138. [Google Scholar]
- Khalid, A.; Hameed, A.; Tahir, M.F. Wheat Quality: A Review on Chemical Composition, Nutritional Attributes, Grain Anatomy, Types, Classification, and Function of Seed Storage Proteins in Bread Making Quality. Front. Nutr. 2023, 10, 1053196. [Google Scholar] [CrossRef]
- Shewry, P.R.; Van Schaik, F.; Ravel, C.; Charmet, G.; Rakszegi, M.; Bedo, Z.; Ward, J.L. Genotype and Environment Effects on the Contents of Vitamins B1, B2, B3, and B6 in Wheat Grain. J. Agric. Food Chem. 2011, 59, 10564–10571. [Google Scholar] [CrossRef]
- Wieser, H.; Koehler, P.; Scherf, K.A. The Two Faces of Wheat. Front. Nutr. 2020, 7, 517313. [Google Scholar] [CrossRef]
- Guo, Y.; Wang, G.; Guo, X.; Chi, S.; Yu, H.; Jin, K.; Huang, H.; Wang, D.; Wu, C.; Tian, J.; et al. Genetic Dissection of Protein and Starch during Wheat Grain Development Using QTL Mapping and GWAS. Front. Plant Sci. 2023, 14, 1189887. [Google Scholar] [CrossRef]
- Muqaddasi, Q.H.; Brassac, J.; Ebmeyer, E.; Kollers, S.; Korzun, V.; Argillier, O.; Stiewe, G.; Plieske, J.; Ganal, M.W.; Röder, M.S. Prospects of GWAS and Predictive Breeding for European Winter Wheat’s Grain Protein Content, Grain Starch Content, and Grain Hardness. Sci. Rep. 2020, 10. [Google Scholar] [CrossRef]
- Zhang, L.Y.; Liu, D.C.; Guo, X.L.; Yang, W.L.; Sun, J.Z.; Wang, D.W.; Sourdille, P.; Zhang, A.M. Investigation of Genetic Diversity and Population Structure of Common Wheat Cultivars in Northern China Using DArT Markers. BMC Genet. 2011, 12, 1–11. [Google Scholar] [CrossRef]
- Graybosch, R.A. Waxy Wheats: Origin, Properties, and Prospects. Trends Food Sci. Technol. 1998, 9, 135–142. [Google Scholar] [CrossRef]
- Liu, Q.; Hu, Y.; Hu, M.; Sun, L.; Chen, X.; Li, Q.; Wang, P.; Wang, L. an; Zhang, Y.; Li, H. Identification and Molecular Characterization of Mutant Line Deficiency in Three Waxy Proteins of Common Wheat (Triticum Aestivum L.). Sci. Rep. 2021, 11, 1–9. [Google Scholar] [CrossRef] [PubMed]
- Tian, B.; Deng, Z.; Xie, Q.; Tian, J.; Tian, B.; Deng, Z.; Xie, Q.; Tian, J. Genetic Dissection of the Developmental Behaviour of Total Starch Content and Its Components in Wheat Grain. Crop. Pasture Sci. 2015, 66, 445–455. [Google Scholar] [CrossRef]
- Zhang, X.; Guo, D.; Blennow, A.; Zörb, C. Mineral Nutrients and Crop Starch Quality. Trends Food Sci. Technol. 2021, 114, 148–157. [Google Scholar] [CrossRef]
- Wang, Z.; Li, W.; Qi, J.; Shi, P.; Yin, Y. Starch Accumulation, Activities of Key Enzyme and Gene Expression in Starch Synthesis of Wheat Endosperm with Different Starch Contents. J. Food Sci. Technol. 2014, 51, 419–429. [Google Scholar] [CrossRef]
- Chen, X.; Fang, W.; Ji, M.; Xu, S.; Jiang, Y.; Song, S.; Chen, G.; Tian, J.; Deng, Z. Genome-Wide Association Study of Total Starch and Its Components in Common Wheat. Euphytica 2019, 215. [Google Scholar] [CrossRef]
- Shewry, P.R. Wheat. J. Exp. Bot. 2009, 60, 1537–1553. [Google Scholar] [CrossRef]
- Paull, A.E.; Anderson, J.A. THE EFFECTS OF AMOUNT AND DISTRIBUTION OF RAINFALL ON THE PROTEIN CONTENT OF WESTERN CANADIAN WHEAT. 2011, 20c, 212–227. [Google Scholar] [CrossRef]
- McCartney, C.A.; Somers, D.J.; Lukow, O.; Ames, N.; Noll, J.; Cloutier, S.; Humphreys, D.G.; McCallum, B.D. QTL Analysis of Quality Traits in the Spring Wheat Cross RL4452 × ‘AC Domain. ’ Plant Breed. 2006, 125, 565–575. [Google Scholar] [CrossRef]
- Sun, H.; Lu, J.; Fan, Y.; Zhao, Y.; Kong, F.; Li, R.; Wang, H.; Li, S. Quantitative Trait Loci (QTLs) for Quality Traits Related to Protein and Starch in Wheat. Progress. Nat. Sci. 2008, 18, 825–831. [Google Scholar] [CrossRef]
- Tian, B.; Deng, Z.; Xie, Q.; Tian, J. Genetic Dissection of the Developmental Behaviour of Total Starch Content and Its Components in Wheat Grain. Crop Pasture Sci. 2015, 66, 445–455. [Google Scholar] [CrossRef]
- Zi, Y.; Cheng, D.; Li, H.; Guo, J.; Ju, W.; Wang, C.; Humphreys, D.G.; Liu, A.; Cao, X.; Liu, C.; et al. Effects of the Different Waxy Proteins on Starch Biosynthesis, Starch Physicochemical Properties and Chinese Noodle Quality in Wheat. Mol. Breed. 2022, 42, 1–14. [Google Scholar] [CrossRef] [PubMed]
- Murai, J.; Taira, T.; Ohta, D. Isolation and Characterization of the Three Waxy Genes Encoding the Granule-Bound Starch Synthase in Hexaploid Wheat. Gene 1999, 234, 71–79. [Google Scholar] [CrossRef] [PubMed]
- Araki, E.; Miura, H.; Sawada, S. Identification of Genetic Loci Affecting Amylose Content and Agronomic Traits on Chromosome 4A of Wheat. Theor. Appl. Genet. 1999, 98, 977–984. [Google Scholar] [CrossRef]
- Kartseva, T.; Alqudah, A.M.; Aleksandrov, V.; Alomari, D.Z.; Doneva, D.; Arif, M.A.R.; Börner, A.; Misheva, S. Nutritional Genomic Approach for Improving Grain Protein Content in Wheat. Foods 2023, 12, 1399. [Google Scholar] [CrossRef]
- Kartseva, T.; Aleksandrov, V.; Alqudah, A.M.; Arif, M.A.R.; Kocheva, K.; Doneva, D.; Prokopova, K.; Börner, A.; Misheva, S. GWAS in a Collection of Bulgarian Old and Modern Bread Wheat Accessions Uncovers Novel Genomic Loci for Grain Protein Content and Thousand Kernel Weight 2024.
- Claus, A.; Schreiter, P.; Weber, A.; Graeff, S.; Herrmann, W.; Claupein, W.; Schieber, A.; Carle, R. Influence of Agronomic Factors and Extraction Rate on the Acrylamide Contents in Yeast-Leavened Breads. J. Agric. Food Chem. 2006, 54, 8968–8976. [Google Scholar] [CrossRef]
- Halford, N.G.; Curtis, T.Y.; Muttucumaru, N.; Postles, J.; Mottram, D.S. Sugars in Crop Plants. Ann. Appl. Biol. 2011, 158, 1–25. [Google Scholar] [CrossRef]
- Krishnakumar, T. Acrylamide in Food Products: A Review. J. Food Process Technol. 2014, 5, 344. [Google Scholar] [CrossRef]
- Mottram, D.S.; Wedzicha, B.L.; Dodson, A.T. Acrylamide Is Formed in the Maillard Reaction. Nature 2002, 419, 448–449. [Google Scholar] [CrossRef]
- Oddy, J.; Raffan, S.; Wilkinson, M.D.; Elmore, J.S.; Halford, N.G. Understanding the Relationships between Free Asparagine in Grain and Other Traits to Breed Low-Asparagine Wheat. Plants 2022, 11, 669. [Google Scholar] [CrossRef]
- Raffan, S.; Halford, N.G. Acrylamide in Food: Progress in and Prospects for Genetic and Agronomic Solutions. Ann. Appl. Biol. 2019, 175, 259–281. [Google Scholar] [CrossRef] [PubMed]
- Stadler, R.H.; Blank, I.; Varga, N.; Robert, F.; Hau, J.; Guy, P.A.; Robert, M.C.; Riediker, S. Acrylamide from Maillard Reaction Products. Nature 2002, 419, 449–450. [Google Scholar] [CrossRef] [PubMed]
- Yaylayan, V.A.; Wnorowski, A.; Perez Locas, C. Why Asparagine Needs Carbohydrates to Generate Acrylamide. J. Agric. Food Chem. 2003, 51, 1753–1757. [Google Scholar] [CrossRef] [PubMed]
- Zyzak, D. V.; Sanders, R.A.; Stojanovic, M.; Tallmadge, D.H.; Eberhart, B.L.; Ewald, D.K.; Gruber, D.C.; Morsch, T.R.; Strothers, M.A.; Rizzi, G.P.; et al. Acrylamide Formation Mechanism in Heated Foods. J. Agric. Food Chem. 2003, 51, 4782–4787. [Google Scholar] [CrossRef] [PubMed]
- Mottram, D.S. The Maillard Reaction: Source of Flavour in Thermally Processed Foods. Flavours and Fragrances: Chemistry, Bioprocessing and Sustainability 2007, 269–283. [Google Scholar] [CrossRef]
- Lea, P.J.; Azevedo, R.A. Nitrogen Use Efficiency. 2. Amino Acid Metabolism. Ann. Appl. Biol. 2007, 151, 269–275. [Google Scholar] [CrossRef]
- Raffan, S.; Halford, N.G. Cereal Asparagine Synthetase Genes. Ann. Appl. Biol. 2021, 178, 6–22. [Google Scholar] [CrossRef]
- Emebiri, L.C. Genetic Variation and Possible SNP Markers for Breeding Wheat with Low-Grain Asparagine, the Major Precursor for Acrylamide Formation in Heat-Processed Products. J. Sci. Food Agric. 2014, 94, 1422–1429. [Google Scholar] [CrossRef]
- Curtis, T.Y.; Muttucumaru, N.; Shewry, P.R.; Parry, M.A.J.; Powers, S.J.; Elmore, J.S.; Mottram, D.S.; Hook, S.; Halford, N.G. Effects of Genotype and Environment on Free Amino Acid Levels in Wheat Grain: Implications for Acrylamide Formation during Processing. J. Agric. Food Chem. 2009, 57, 1013–1021. [Google Scholar] [CrossRef]
- Curtis, T.Y.; Powers, S.J.; Wang, R.; Halford, N.G. Effects of Variety, Year of Cultivation and Sulphur Supply on the Accumulation of Free Asparagine in the Grain of Commercial Wheat Varieties. Food Chem. 2018, 239, 304–313. [Google Scholar] [CrossRef]
- Rapp, M.; Schwadorf, K.; Leiser, W.L.; Würschum, T.; Longin, C.F.H. Assessing the Variation and Genetic Architecture of Asparagine Content in Wheat: What Can Plant Breeding Contribute to a Reduction in the Acrylamide Precursor? Theoretical and Applied Genetics 2018, 131, 2427–2437. [Google Scholar] [CrossRef] [PubMed]
- Peng, Y.; Liu, H.; Chen, J.; Shi, T.; Zhang, C.; Sun, D.; He, Z.; Hao, Y.; Chen, W. Genome-Wide Association Studies of Free Amino Acid Levels by Six Multi-Locus Models in Bread Wheat. Front. Plant Sci. 2018, 9, 400649. [Google Scholar] [CrossRef]
- Oddy, J.; Chhetry, M.; Awal, R.; Addy, J.; Wilkinson, M.; Smith, D.; King, R.; Hall, C.; Testa, R.; Murray, E.; et al. Genetic Control of Grain Amino Acid Composition in a UK Soft Wheat Mapping Population. Plant Genome 2023, 16, e20335. [Google Scholar] [CrossRef]
- Lavoignat, M.; Cassan, C.; Pétriacq, P.; Gibon, Y.; Heumez, E.; Duque, C.; Momont, P.; Rincent, R.; Blancon, J.; Ravel, C.; et al. Different Wheat Loci Are Associated to Heritable Free Asparagine Content in Grain Grown under Different Water and Nitrogen Availability. Theor. Appl. Genet. 2024, 137, 1–14. [Google Scholar] [CrossRef]
- Gao, R.; Curtis, T.Y.; Powers, S.J.; Xu, H.; Huang, J.; Halford, N.G. Food Safety: Structure and Expression of the Asparagine Synthetase Gene Family of Wheat. J. Cereal Sci. 2016, 68, 122–131. [Google Scholar] [CrossRef]
- Xu, H.; Curtis, T.Y.; Powers, S.J.; Raffan, S.; Gao, R.; Huang, J.; Heiner, M.; Gilbert, D.R.; Halford, N.G. Genomic, Biochemical, and Modeling Analyses of Asparagine Synthetases from Wheat. Front. Plant Sci. 2018, 8, 278898. [Google Scholar] [CrossRef]
- Lecart, B.; Jacquet, N.; Anseeuw, L.; Renier, M.; Njeumen, P.; Bodson, B.; Vanderschuren, H.; Richel, A. Nonconventional Enzymatic Method to Determine Free Asparagine Level in Whole-Grain Wheat. Food Chem. 2018, 251, 64–68. [Google Scholar] [CrossRef]
- Tyrka, M.; Mokrzycka, M.; Bakera, B.; Tyrka, D.; Szeliga, M.; Stojałowski, S.; Matysik, P.; Rokicki, M.; Rakoczy-Trojanowska, M.; Krajewski, P. Evaluation of Genetic Structure in European Wheat Cultivars and Advanced Breeding Lines Using High-Density Genotyping-by-Sequencing Approach. BMC Genom. 2021, 22. [Google Scholar] [CrossRef]
- Pritchard, J.K.; Wen, X.; Falush, D. Documentation for Structure Software: Version 2. 2. 2007.
- Chen, C.J.; Zhang, Z. IPat: Intelligent Prediction and Association Tool for Genomic Research. Bioinformatics 2018, 34, 1925–1927. [Google Scholar] [CrossRef]
- Alaux, M.; Rogers, J.; Letellier, T.; Flores, R.; Alfama, F.; Pommier, C.; Mohellibi, N.; Durand, S.; Kimmel, E.; Michotey, C.; et al. Linking the International Wheat Genome Sequencing Consortium Bread Wheat Reference Genome Sequence to Wheat Genetic and Phenomic Data. Genome Biol. 2018, 19. [Google Scholar] [CrossRef] [PubMed]
- Ma, S.; Wang, M.; Wu, J.; Guo, W.; Chen, Y.; Li, G.; Wang, Y.; Shi, W.; Xia, G.; Fu, D.; et al. WheatOmics: A Platform Combining Multiple Omics Data to Accelerate Functional Genomics Studies in Wheat. Mol. Plant 2021, 14, 1965–1968. [Google Scholar] [CrossRef] [PubMed]
- Bi, H.; Liu, Z.; Liu, S.; Qiao, W.; Zhang, K.; Zhao, M.; Wang, D. Genome-Wide Analysis of Wheat Xyloglucan Endotransglucosylase/Hydrolase (XTH) Gene Family Revealed TaXTH17 Involved in Abiotic Stress Responses. BMC Plant Biol. 2024, 24, 1–16. [Google Scholar] [CrossRef] [PubMed]
- Zhang, W.; Zhang, Z.; Chen, Q.; Wang, Z.; Song, W.; Yang, K.; Xin, M.; Hu, Z.; Liu, J.; Peng, H.; et al. Mutation of a Highly Conserved Amino Acid in RPM1 Causes Leaf Yellowing and Premature Senescence in Wheat. Theor. Appl. Genet. 2023, 136, 1–13. [Google Scholar] [CrossRef]
- Chandra, S.; Kazmi, A.Z.; Ahmed, Z.; Roychowdhury, G.; Kumari, V.; Kumar, M.; Mukhopadhyay, K. Genome-Wide Identification and Characterization of NB-ARC Resistant Genes in Wheat (Triticum Aestivum L. ) and Their Expression during Leaf Rust Infection. Plant Cell Rep. 2017, 36, 1097–1112. [Google Scholar] [CrossRef]
- Gunupuru, L.R.; Arunachalam, C.; Malla, K.B.; Kahla, A.; Perochon, A.; Jia, J.; Thapa, G.; Doohan, F.M. A Wheat Cytochrome P450 Enhances Both Resistance to Deoxynivalenol and Grain Yield. PLoS One 2018, 13, e0204992. [Google Scholar] [CrossRef]
- Ma, M.; Wang, Q.; Li, Z.; Cheng, H.; Li, Z.; Liu, X.; Song, W.; Appels, R.; Zhao, H. Expression of TaCYP78A3, a Gene Encoding Cytochrome P450 CYP78A3 Protein in Wheat (Triticum Aestivum L.), Affects Seed Size. Plant J. 2015, 83, 312–325. [Google Scholar] [CrossRef]
- Jiang, Q.; Hou, J.; Hao, C.; Wang, L.; Ge, H.; Dong, Y.; Zhang, X. The Wheat (T. Aestivum) Sucrose Synthase 2 Gene (TaSus2) Active in Endosperm Development Is Associated with Yield Traits. Funct. Integr. Genom. 2011, 11, 49–61. [Google Scholar] [CrossRef]
- Lukaszewski, A.J.; Alberti, A.; Sharpe, A.; Kilian, A.; Stanca, A.M.; Keller, B.; Clavijo, B.J.; Friebe, B.; Gill, B.; Wulff, B.; et al. A Chromosome-Based Draft Sequence of the Hexaploid Bread Wheat (Triticum Aestivum) Genome. Science (1979) 2014, 345, 2025. [Google Scholar] [CrossRef]
- Pfeifer, M.; Kugler, K.G.; Sandve, S.R.; Zhan, B.; Rudi, H.; Hvidsten, T.R.; Mayer, K.F.X.; Olsen, O.A.; Rogers, J.; Doležel, J.; et al. Genome Interplay in the Grain Transcriptome of Hexaploid Bread Wheat. Science (1979) 2014, 345, 2025. [Google Scholar] [CrossRef]
- Wei, J.; Cao, H.; Liu, J. dong; Zuo, J. hong; Fang, Y.; Lin, C.T.; Sun, R. ze; Li, W. long; Liu, Y. xiu Insights into Transcriptional Characteristics and Homoeolog Expression Bias of Embryo and De-Embryonated Kernels in Developing Grain through RNA-Seq and Iso-Seq. Funct. Integr. Genom. 2019, 19, 919–932. [Google Scholar] [CrossRef] [PubMed]
- van Dongen, J.T.; Gupta, K.J.; Ramírez-Aguilar, S.J.; Araújo, W.L.; Nunes-Nesi, A.; Fernie, A.R. Regulation of Respiration in Plants: A Role for Alternative Metabolic Pathways. J. Plant Physiol. 2011, 168, 1434–1443. [Google Scholar] [CrossRef] [PubMed]
- Zayed, O.; Hewedy, O.A.; Abdelmoteleb, A.; Ali, M.; Youssef, A.; Roumia, A.F.; Seymour, D.; Zayed, O.; Hewedy, O.A.; Abdelmoteleb, A.; et al. Nitrogen Journey in Plants: From Uptake to Metabolism, Stress Response, and Microbe Interaction. Biomolecules 2023, 13, 1443. [Google Scholar] [CrossRef] [PubMed]
- Apriyanto, A.; Compart, J.; Fettke, J. A Review of Starch, a Unique Biopolymer – Structure, Metabolism and in Planta Modifications. Plant Sci. 2022, 318, 111223. [Google Scholar] [CrossRef]
- Jeon, J.S.; Ryoo, N.; Hahn, T.R.; Walia, H.; Nakamura, Y. Starch Biosynthesis in Cereal Endosperm. Plant Physiol. Biochem. 2010, 48, 383–392. [Google Scholar] [CrossRef]
- Alarcón-Reverte, R.; Xie, Y.; Stromberger, J.; Cotter, J.D.; Mason, R.E.; Pearce, S. Induced Mutations in ASPARAGINE SYNTHETASE-A2 Reduce Free Asparagine Concentration in the Wheat Grain. Crop Sci. 2022, 62, 1484–1496. [Google Scholar] [CrossRef]
- Tepe, Y.; Çebi, A. Acrylamide in Environmental Water: A Review on Sources, Exposure, and Public Health Risks. Expo. Health 2019, 11, 3–12. [Google Scholar] [CrossRef]
- Juhász, A.; Békés, F.; Wrigley, C.W. Wheat Proteins. Appl. Food Protein Chem. 2014, 9781119944492, 219–303. [Google Scholar] [CrossRef]
- Wrigley, C.W.; Bekes, F.; Bushuk, W. Gluten: A Balance of Gliadin and Glutenin.
- Wrigley, C.W. Giant Proteins with Flour Power. Nature 1996, 381, 738–739. [Google Scholar] [CrossRef]
- Schirmer, T.M.; Ludwig, C.; Scherf, K.A. Proteomic Characterization of Wheat Protein Fractions Taken at Different Baking Conditions. J. Agric. Food Chem. 2023, 71, 12899–12909. [Google Scholar] [CrossRef]
- Arendt, E.K.; Zannini, E. Cereal Grains for the Food and Beverage Industries. Cereal Grains Food Beverage Ind. 2013, 1–485. [Google Scholar] [CrossRef]
- Surdyk, N.; Rosén, J.; Andersson, R.; Åman, P. Effects of Asparagine, Fructose, and Baking Conditions on Acrylamide Content in Yeast-Leavened Wheat Bread. J. Agric. Food Chem. 2004, 52, 2047–2051. [Google Scholar] [CrossRef]
- Lingnert, H.; Grivas, S.; Jägerstad, M.; Skog, K.; Törnqvist, M.; Åman, P. Acrylamide in Food: Mechanisms of Formation and Influencing Factors during Heating of Foods. Scand. J. Nutr. /Naringsforsk. 2002, 46, 159–172. [Google Scholar] [CrossRef]
- Information on EC 6.3.5.4 - Asparagine Synthase (Glutamine-Hydrolysing) and Organism(s) Triticum Aestivum - BRENDA Enzyme Database. Available online: https://www.brenda-enzymes.org/enzyme.php?ecno=6.3.5.4&Suchword=&reference=&UniProtAcc=&organism%5B%5D=Triticum+aestivum&show_tm=0 (accessed on 30 April 2024).
- Lea, P.J.; Sodek, L.; Parry, M.A.J.; Shewry, P.R.; Halford, N.G. Asparagine in Plants. Ann. Appl. Biol. . Author 1, A.; Author 2, B. Title of the chapter. In Book. Title, 2nd ed.; Editor 1, A., Editor 2, B., Eds.; Publisher: Publisher Location, Country, 2007; Volume 3, pp. 154–196. 2007, 150, 1–26. [Google Scholar] [CrossRef]
Figure 1.
Distribution of Grain Protein Content (A), Grain Starch Content (B) and Grain Free Asparagine Content (C); correlations graphs between traits: GPC-GSC (D), GPC-GFAC (E), GSC-GFAC (F). .
Figure 1.
Distribution of Grain Protein Content (A), Grain Starch Content (B) and Grain Free Asparagine Content (C); correlations graphs between traits: GPC-GSC (D), GPC-GFAC (E), GSC-GFAC (F). .
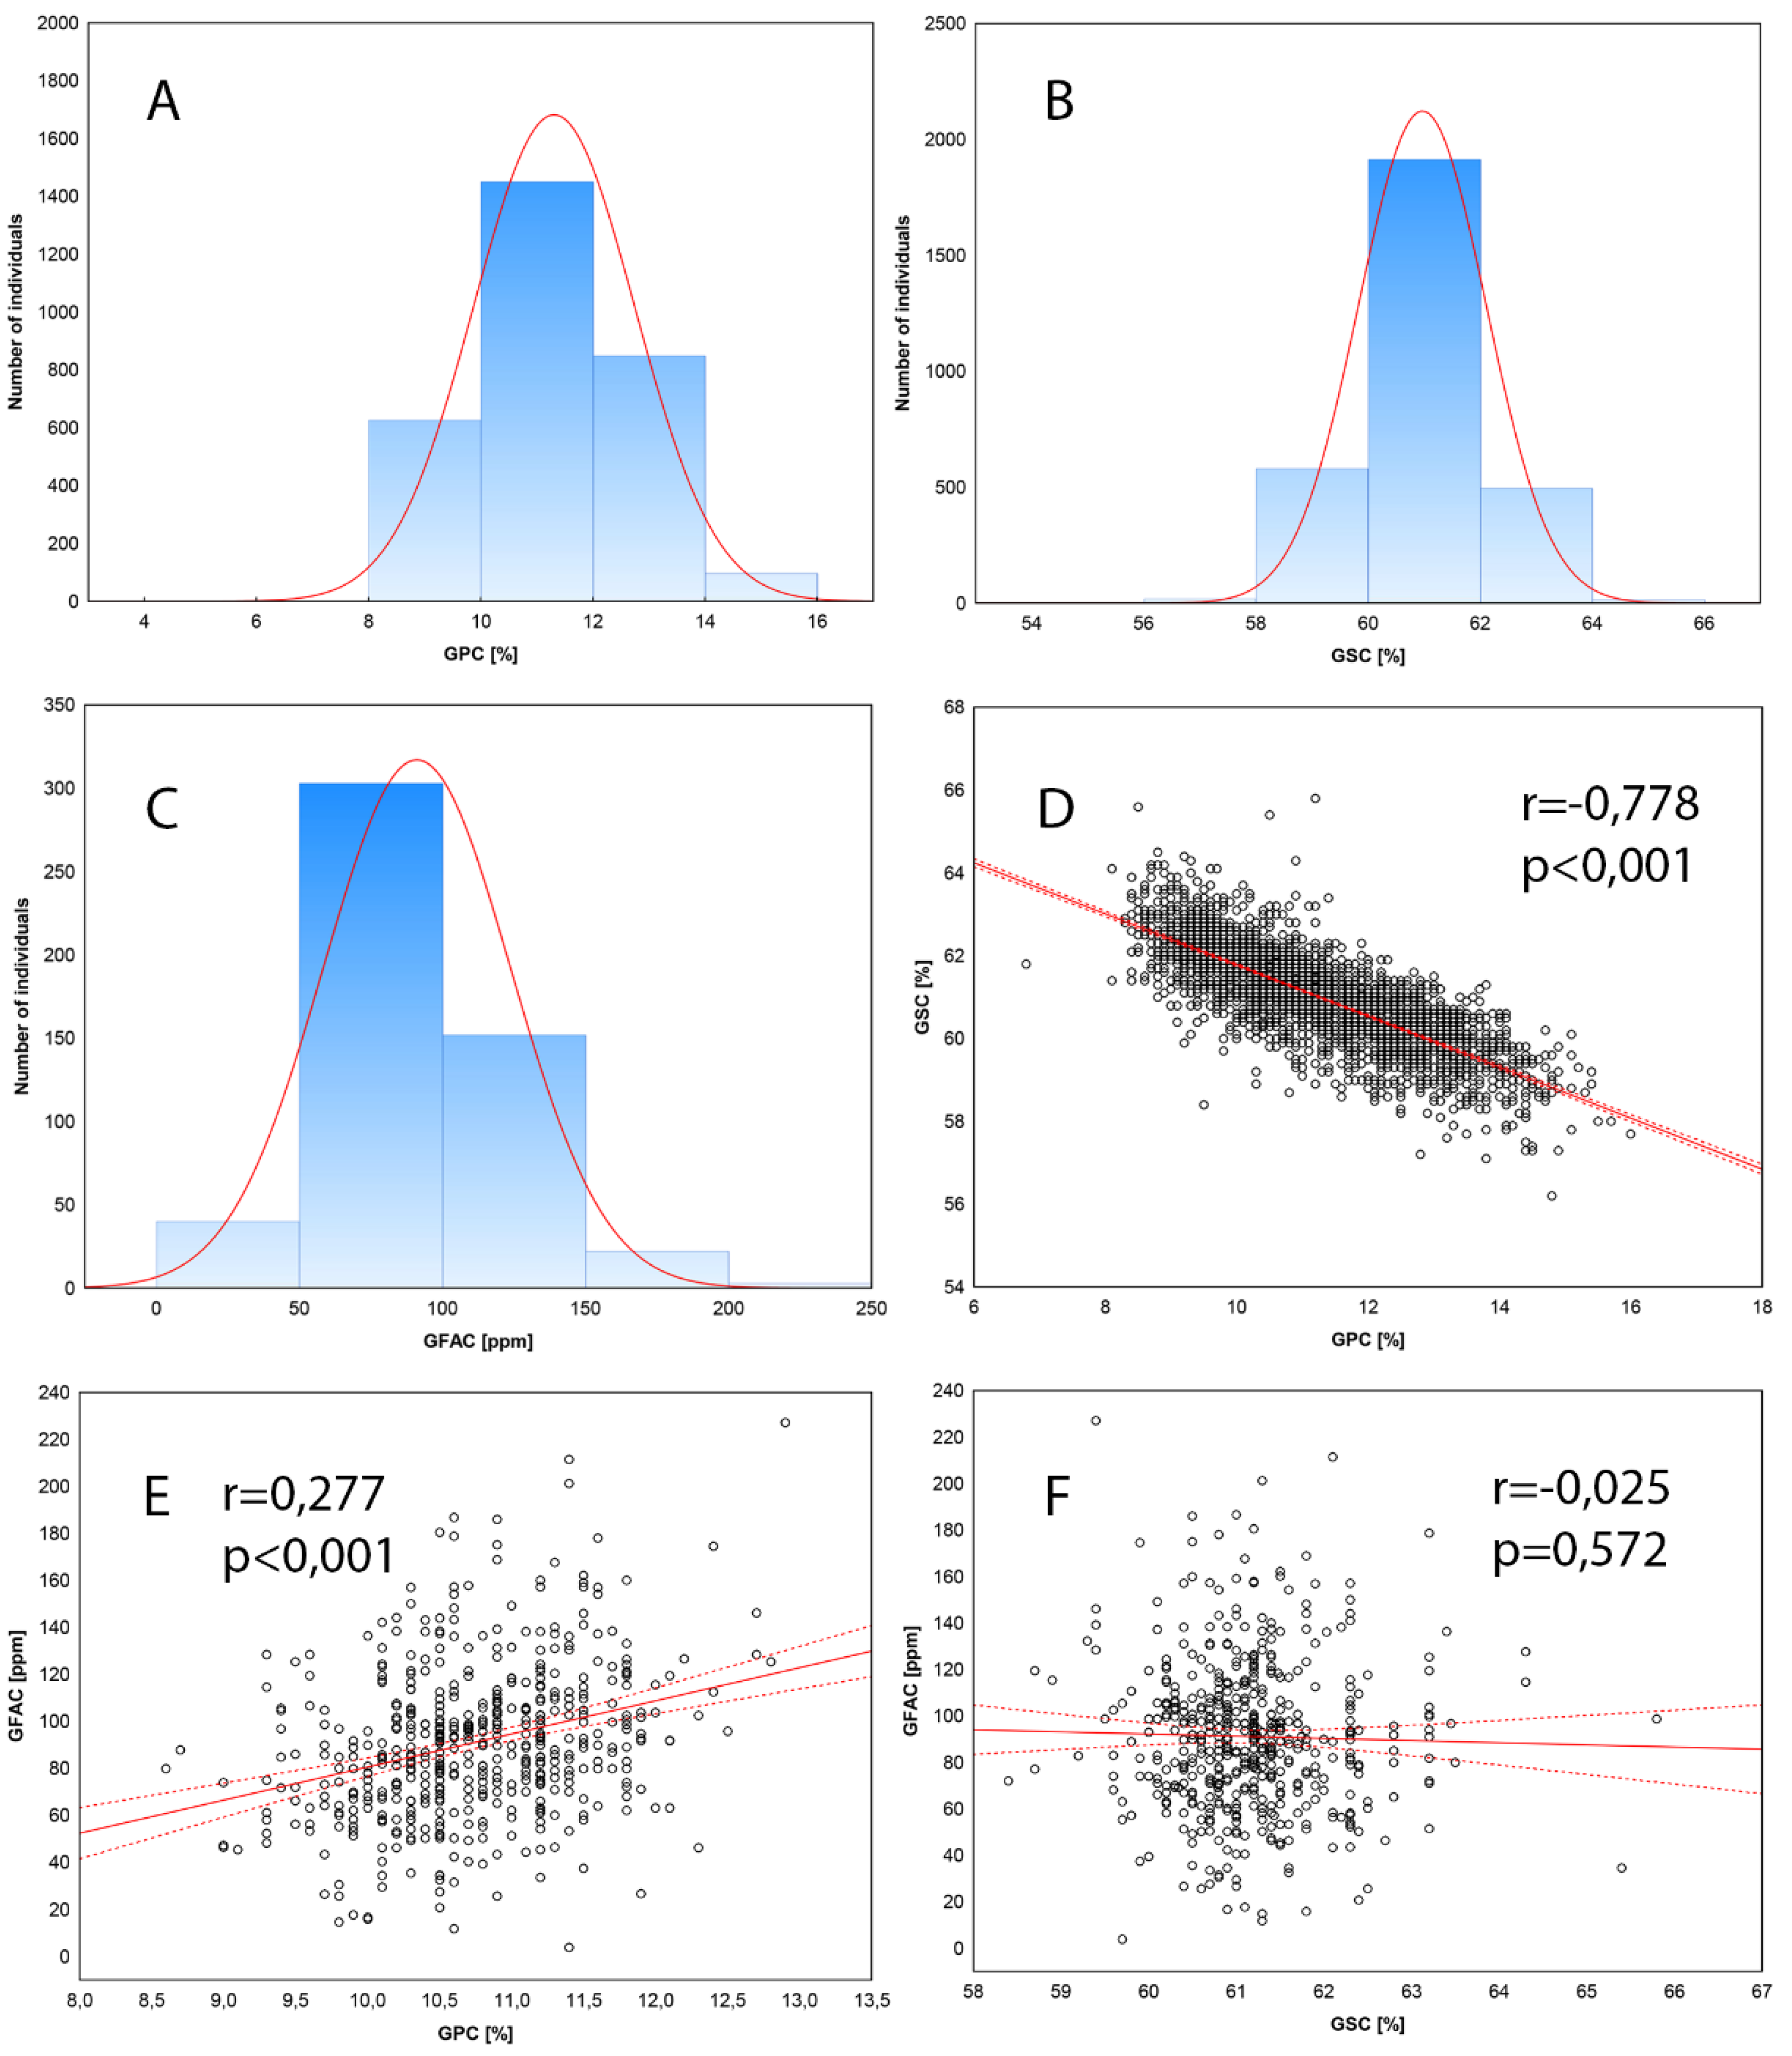
Figure 2.
Physical distribution of 14,345 (A) and 46,586 (B) DArTseq markers on wheat chromosomes (IWGSC v.2.1) used in association mapping in 2021/22 and 2022/23.
Figure 2.
Physical distribution of 14,345 (A) and 46,586 (B) DArTseq markers on wheat chromosomes (IWGSC v.2.1) used in association mapping in 2021/22 and 2022/23.
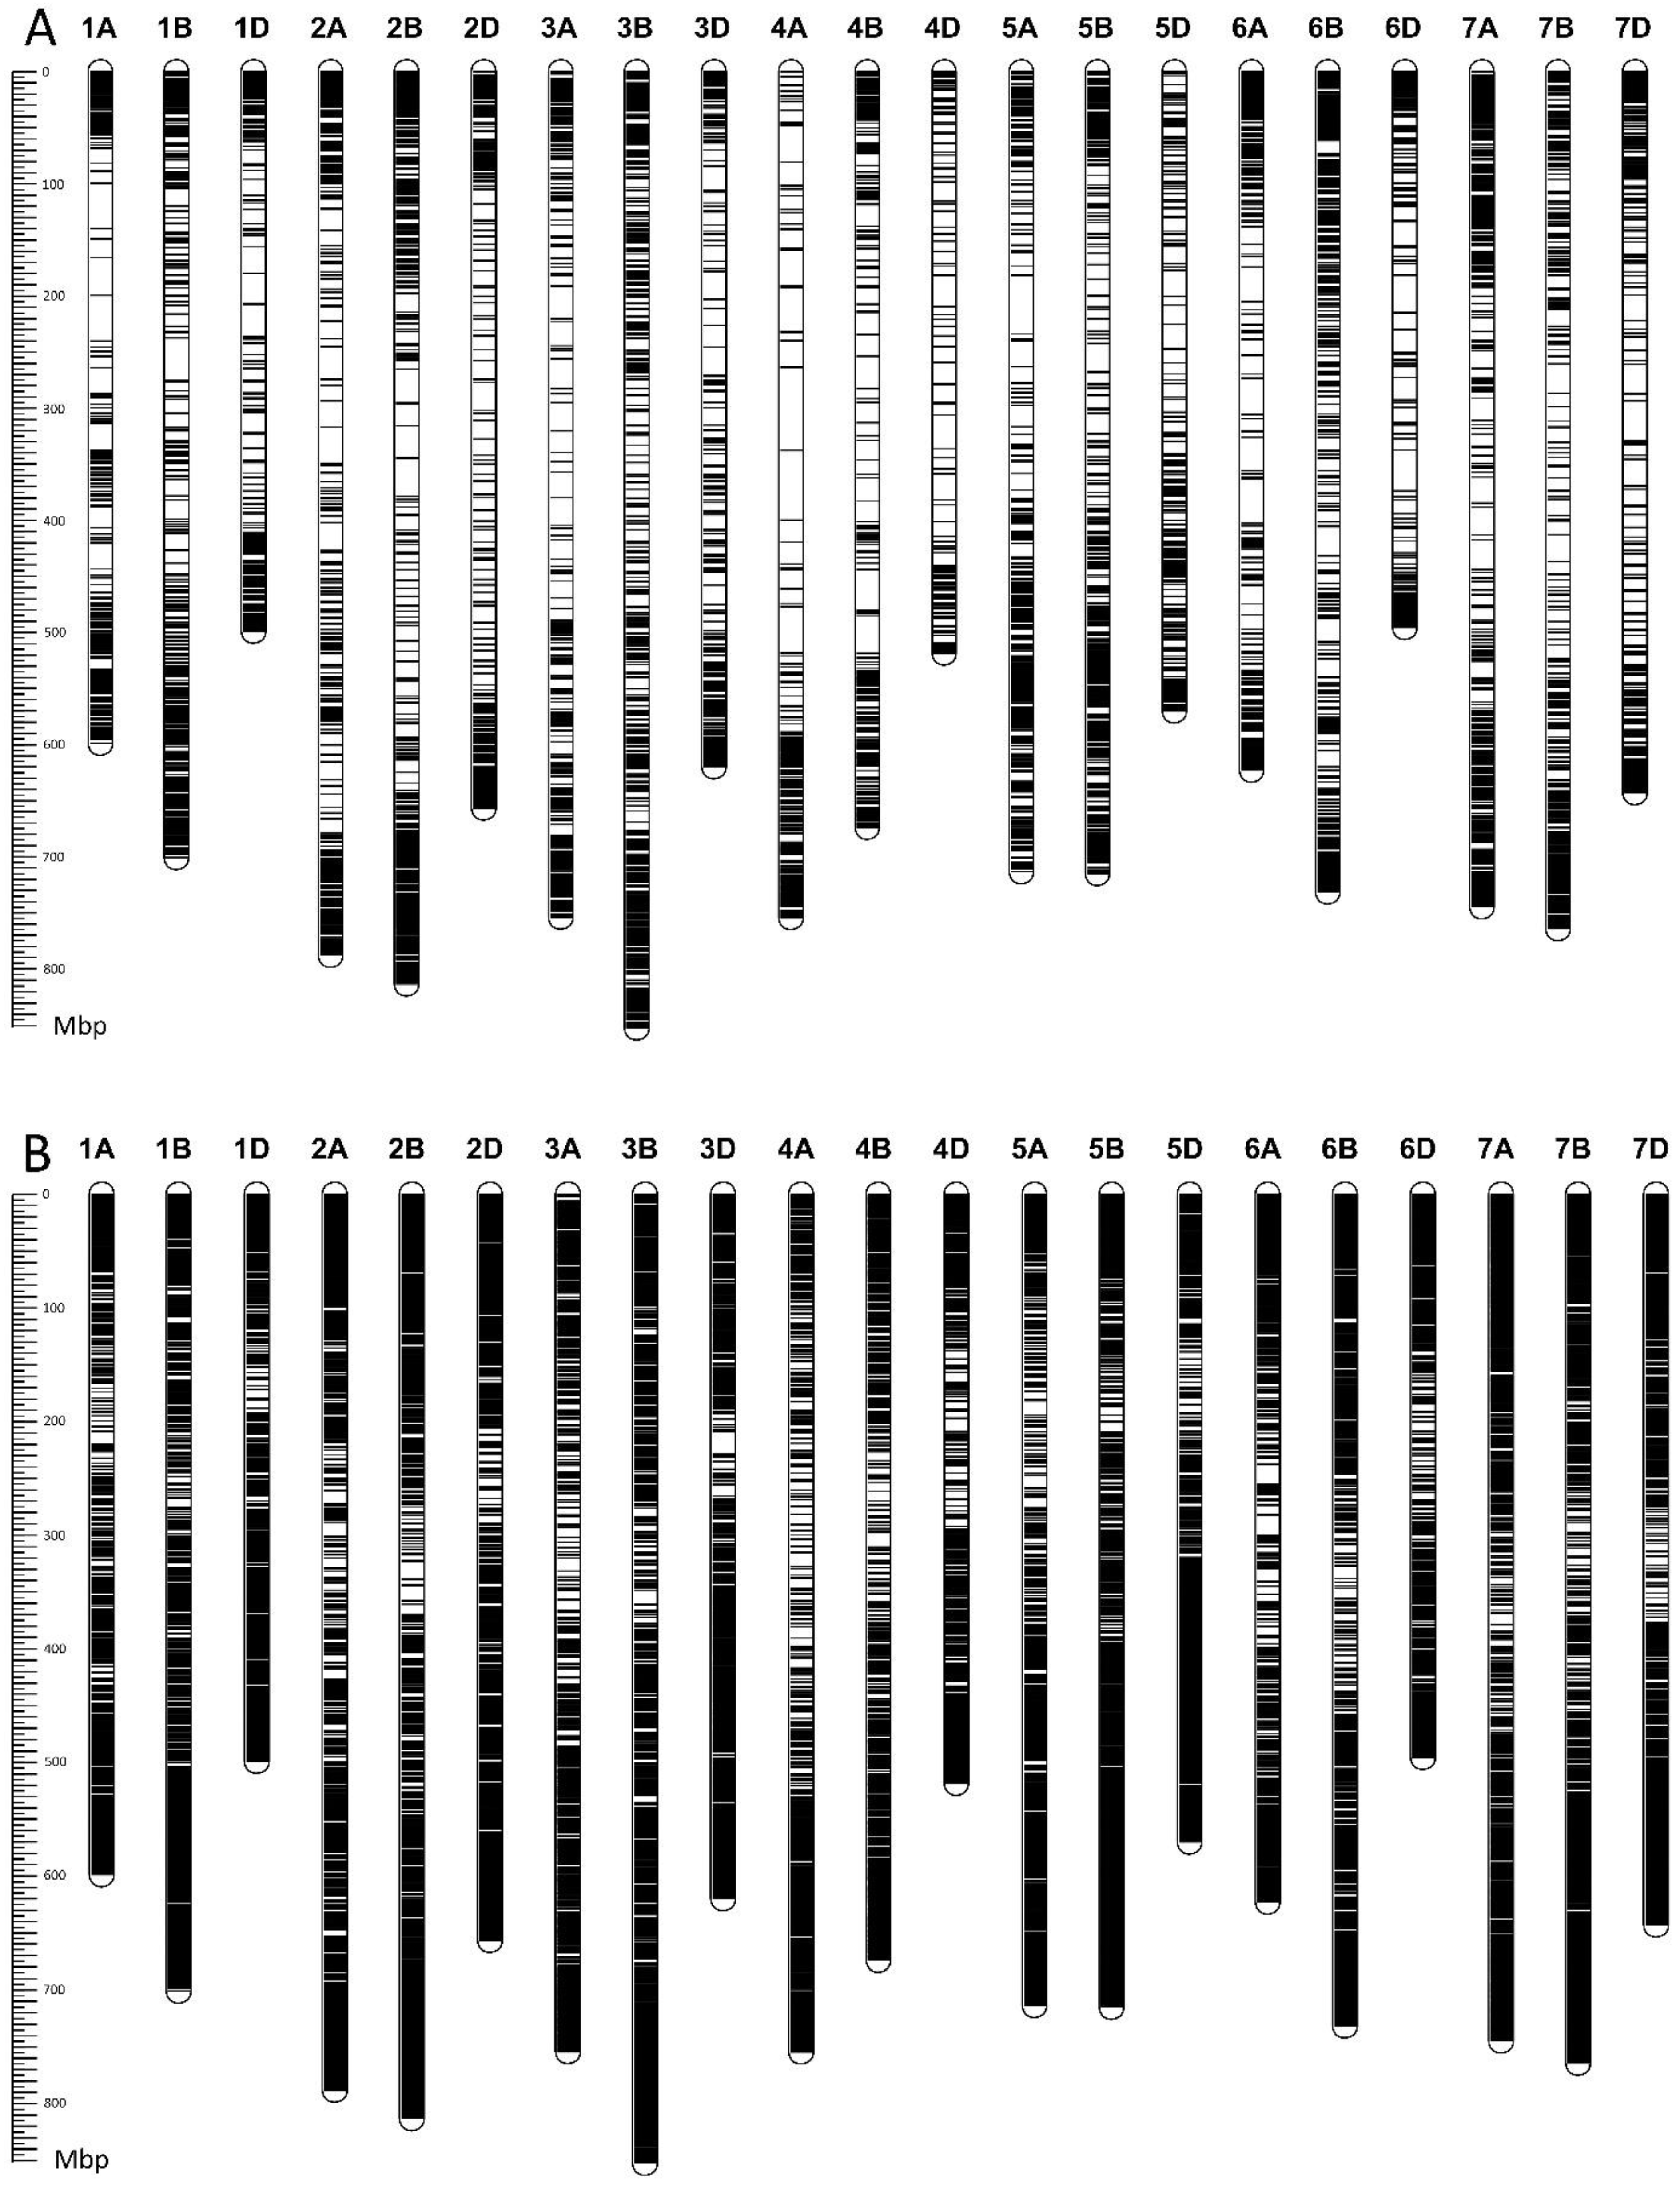
Figure 3.
Comparison of DArTseq marker sets used in association analyses in 2022 and 2023.
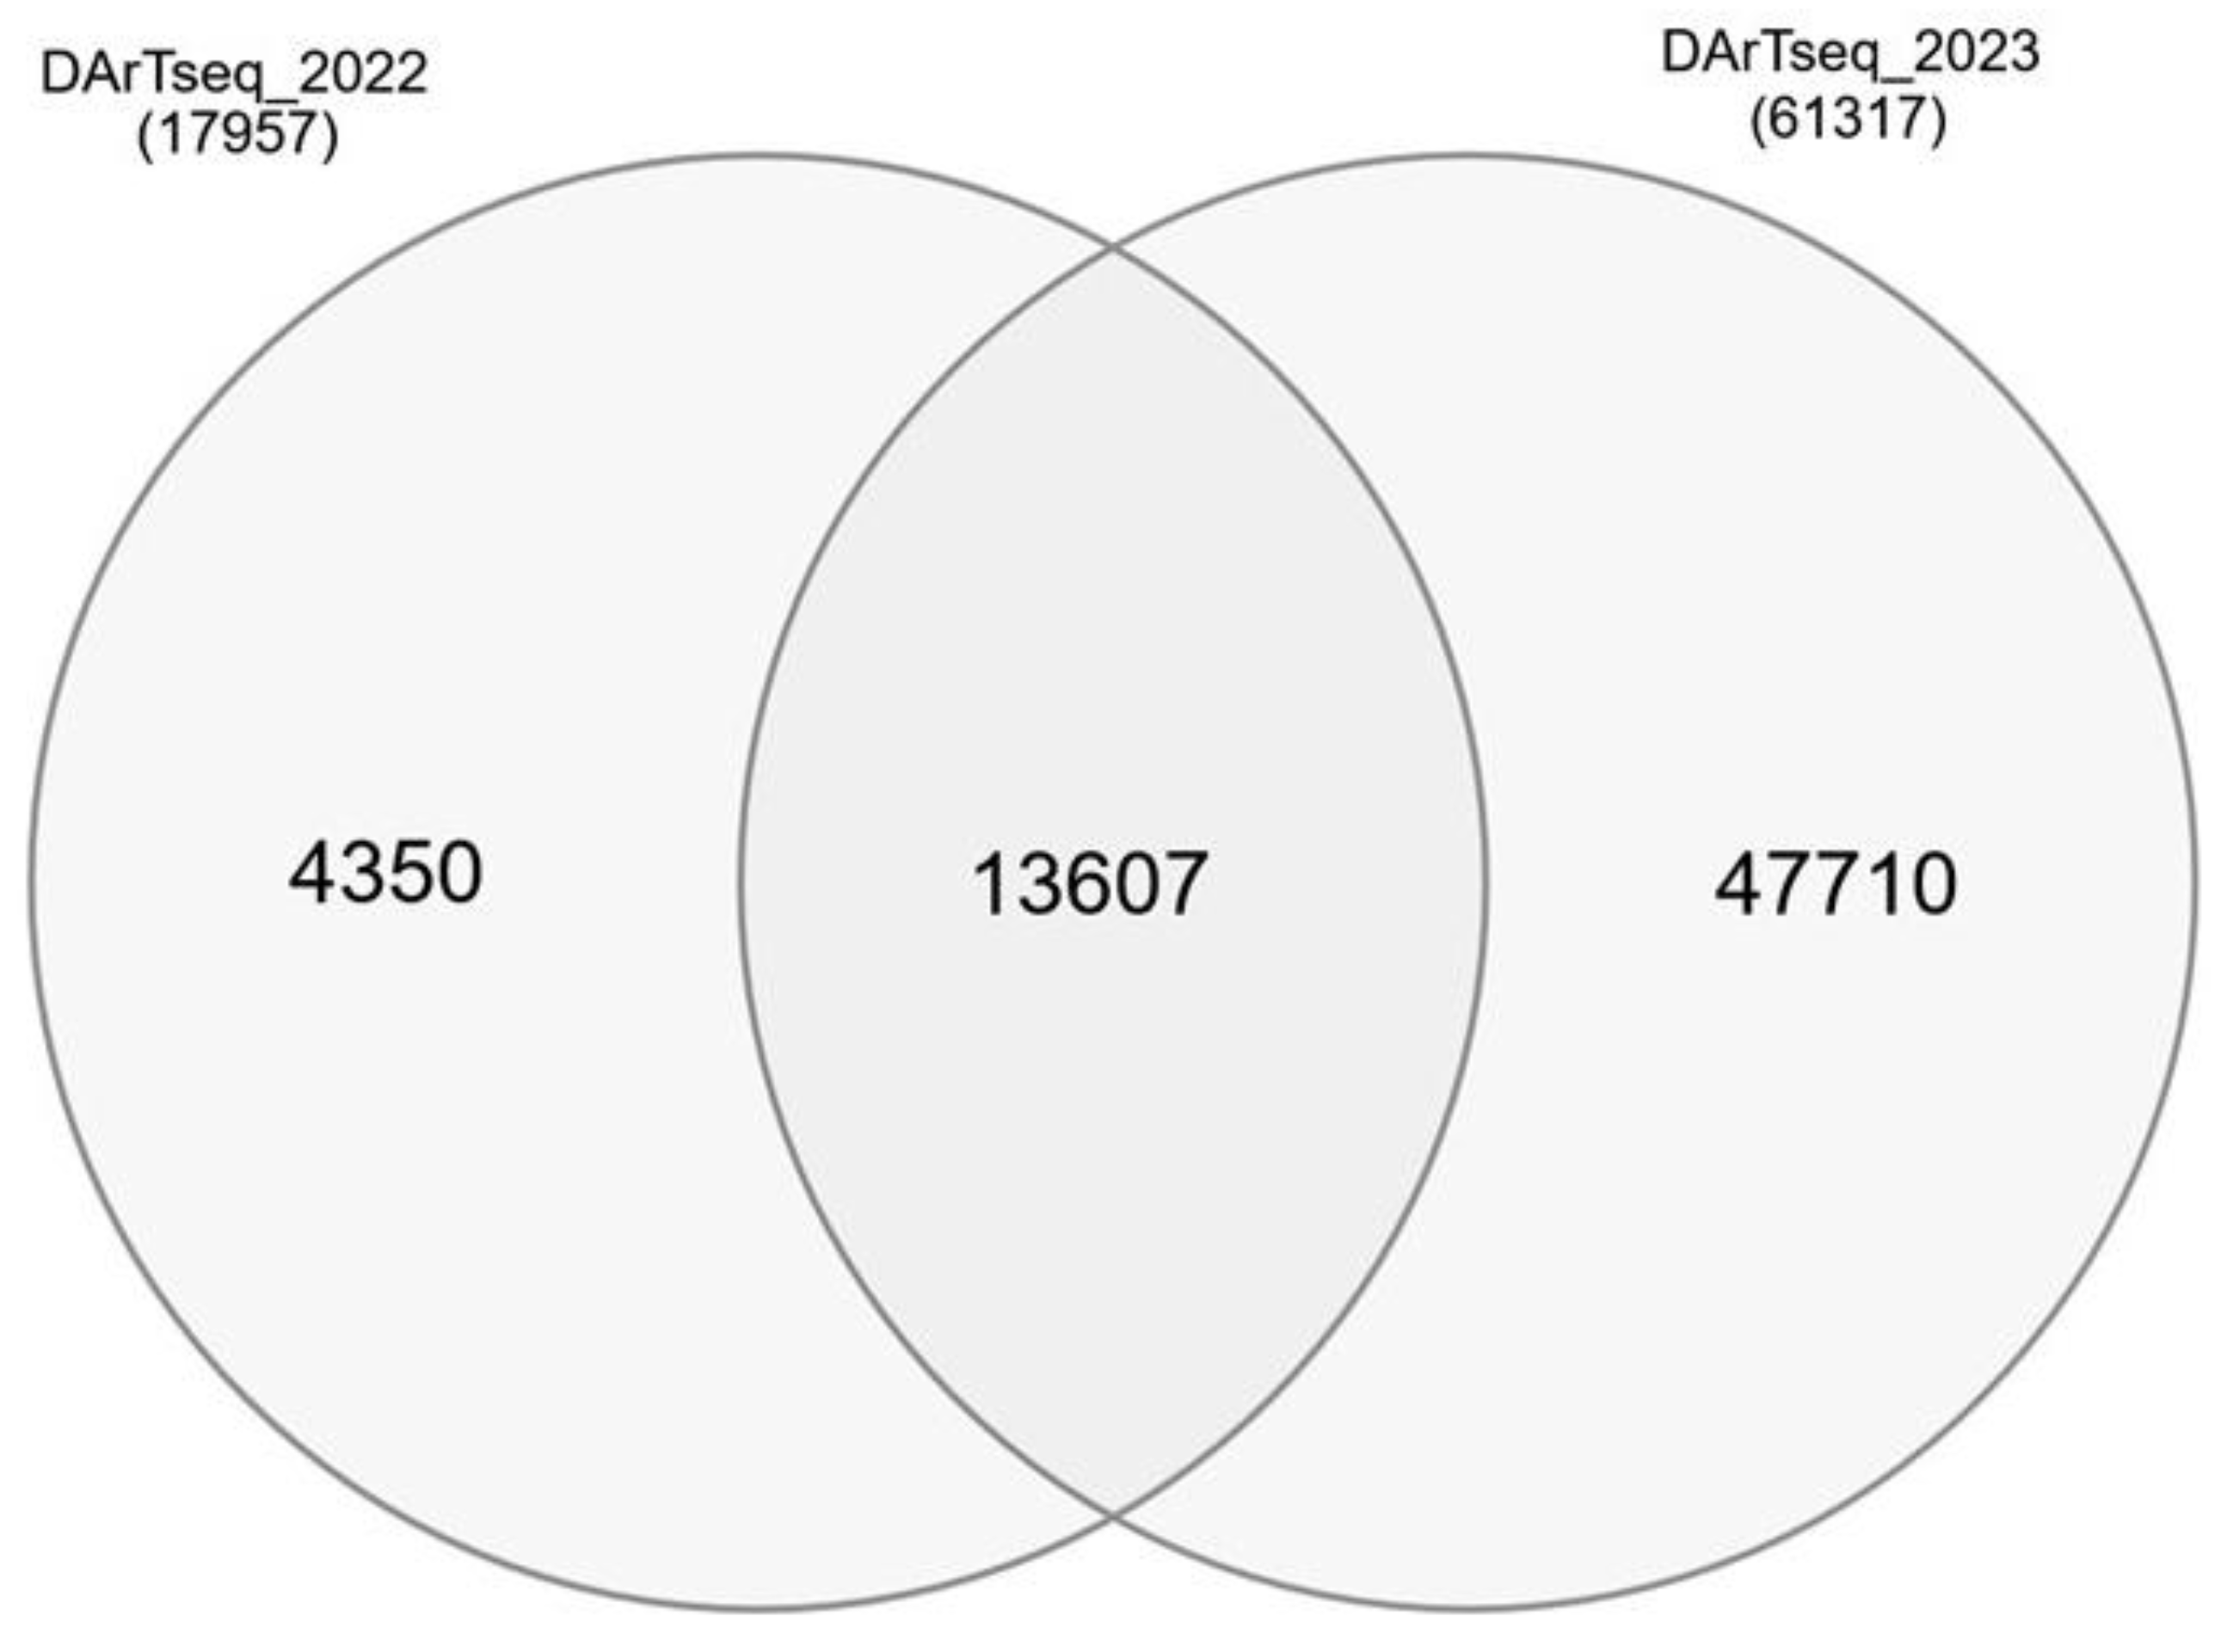
Figure 4.
Number of subpopulations identified with 2079 (A) and 2782 (B) DArTseq markers in 170 and 174 elite breeding lines studied at 2021/22 and 2022/23 growth seasons, respectively.
Figure 4.
Number of subpopulations identified with 2079 (A) and 2782 (B) DArTseq markers in 170 and 174 elite breeding lines studied at 2021/22 and 2022/23 growth seasons, respectively.
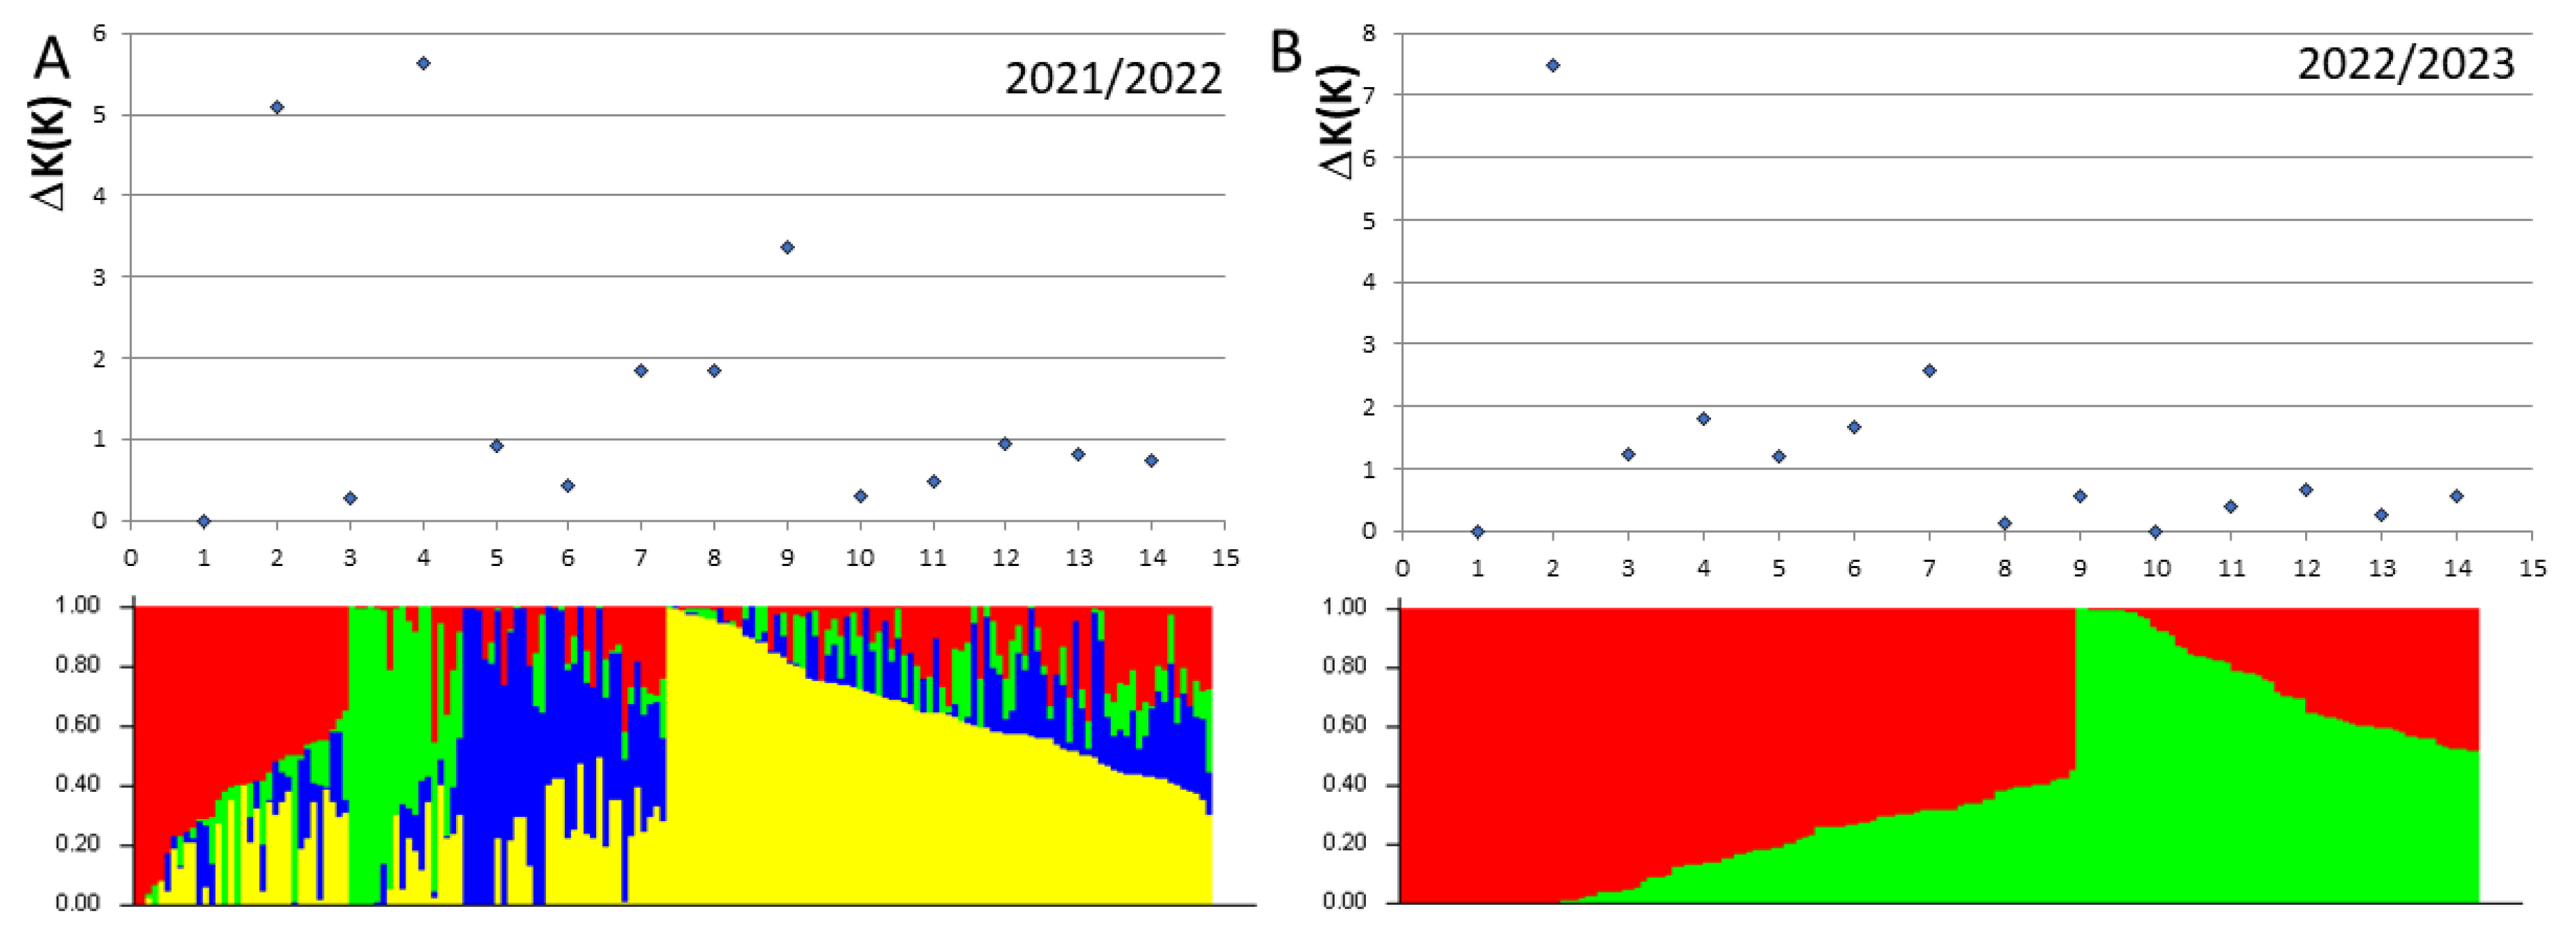
Figure 5.
TraesCS7A02G158900 expression in organs during development of Chinese Spring plant. TPM – transcripts per million.
Figure 5.
TraesCS7A02G158900 expression in organs during development of Chinese Spring plant. TPM – transcripts per million.
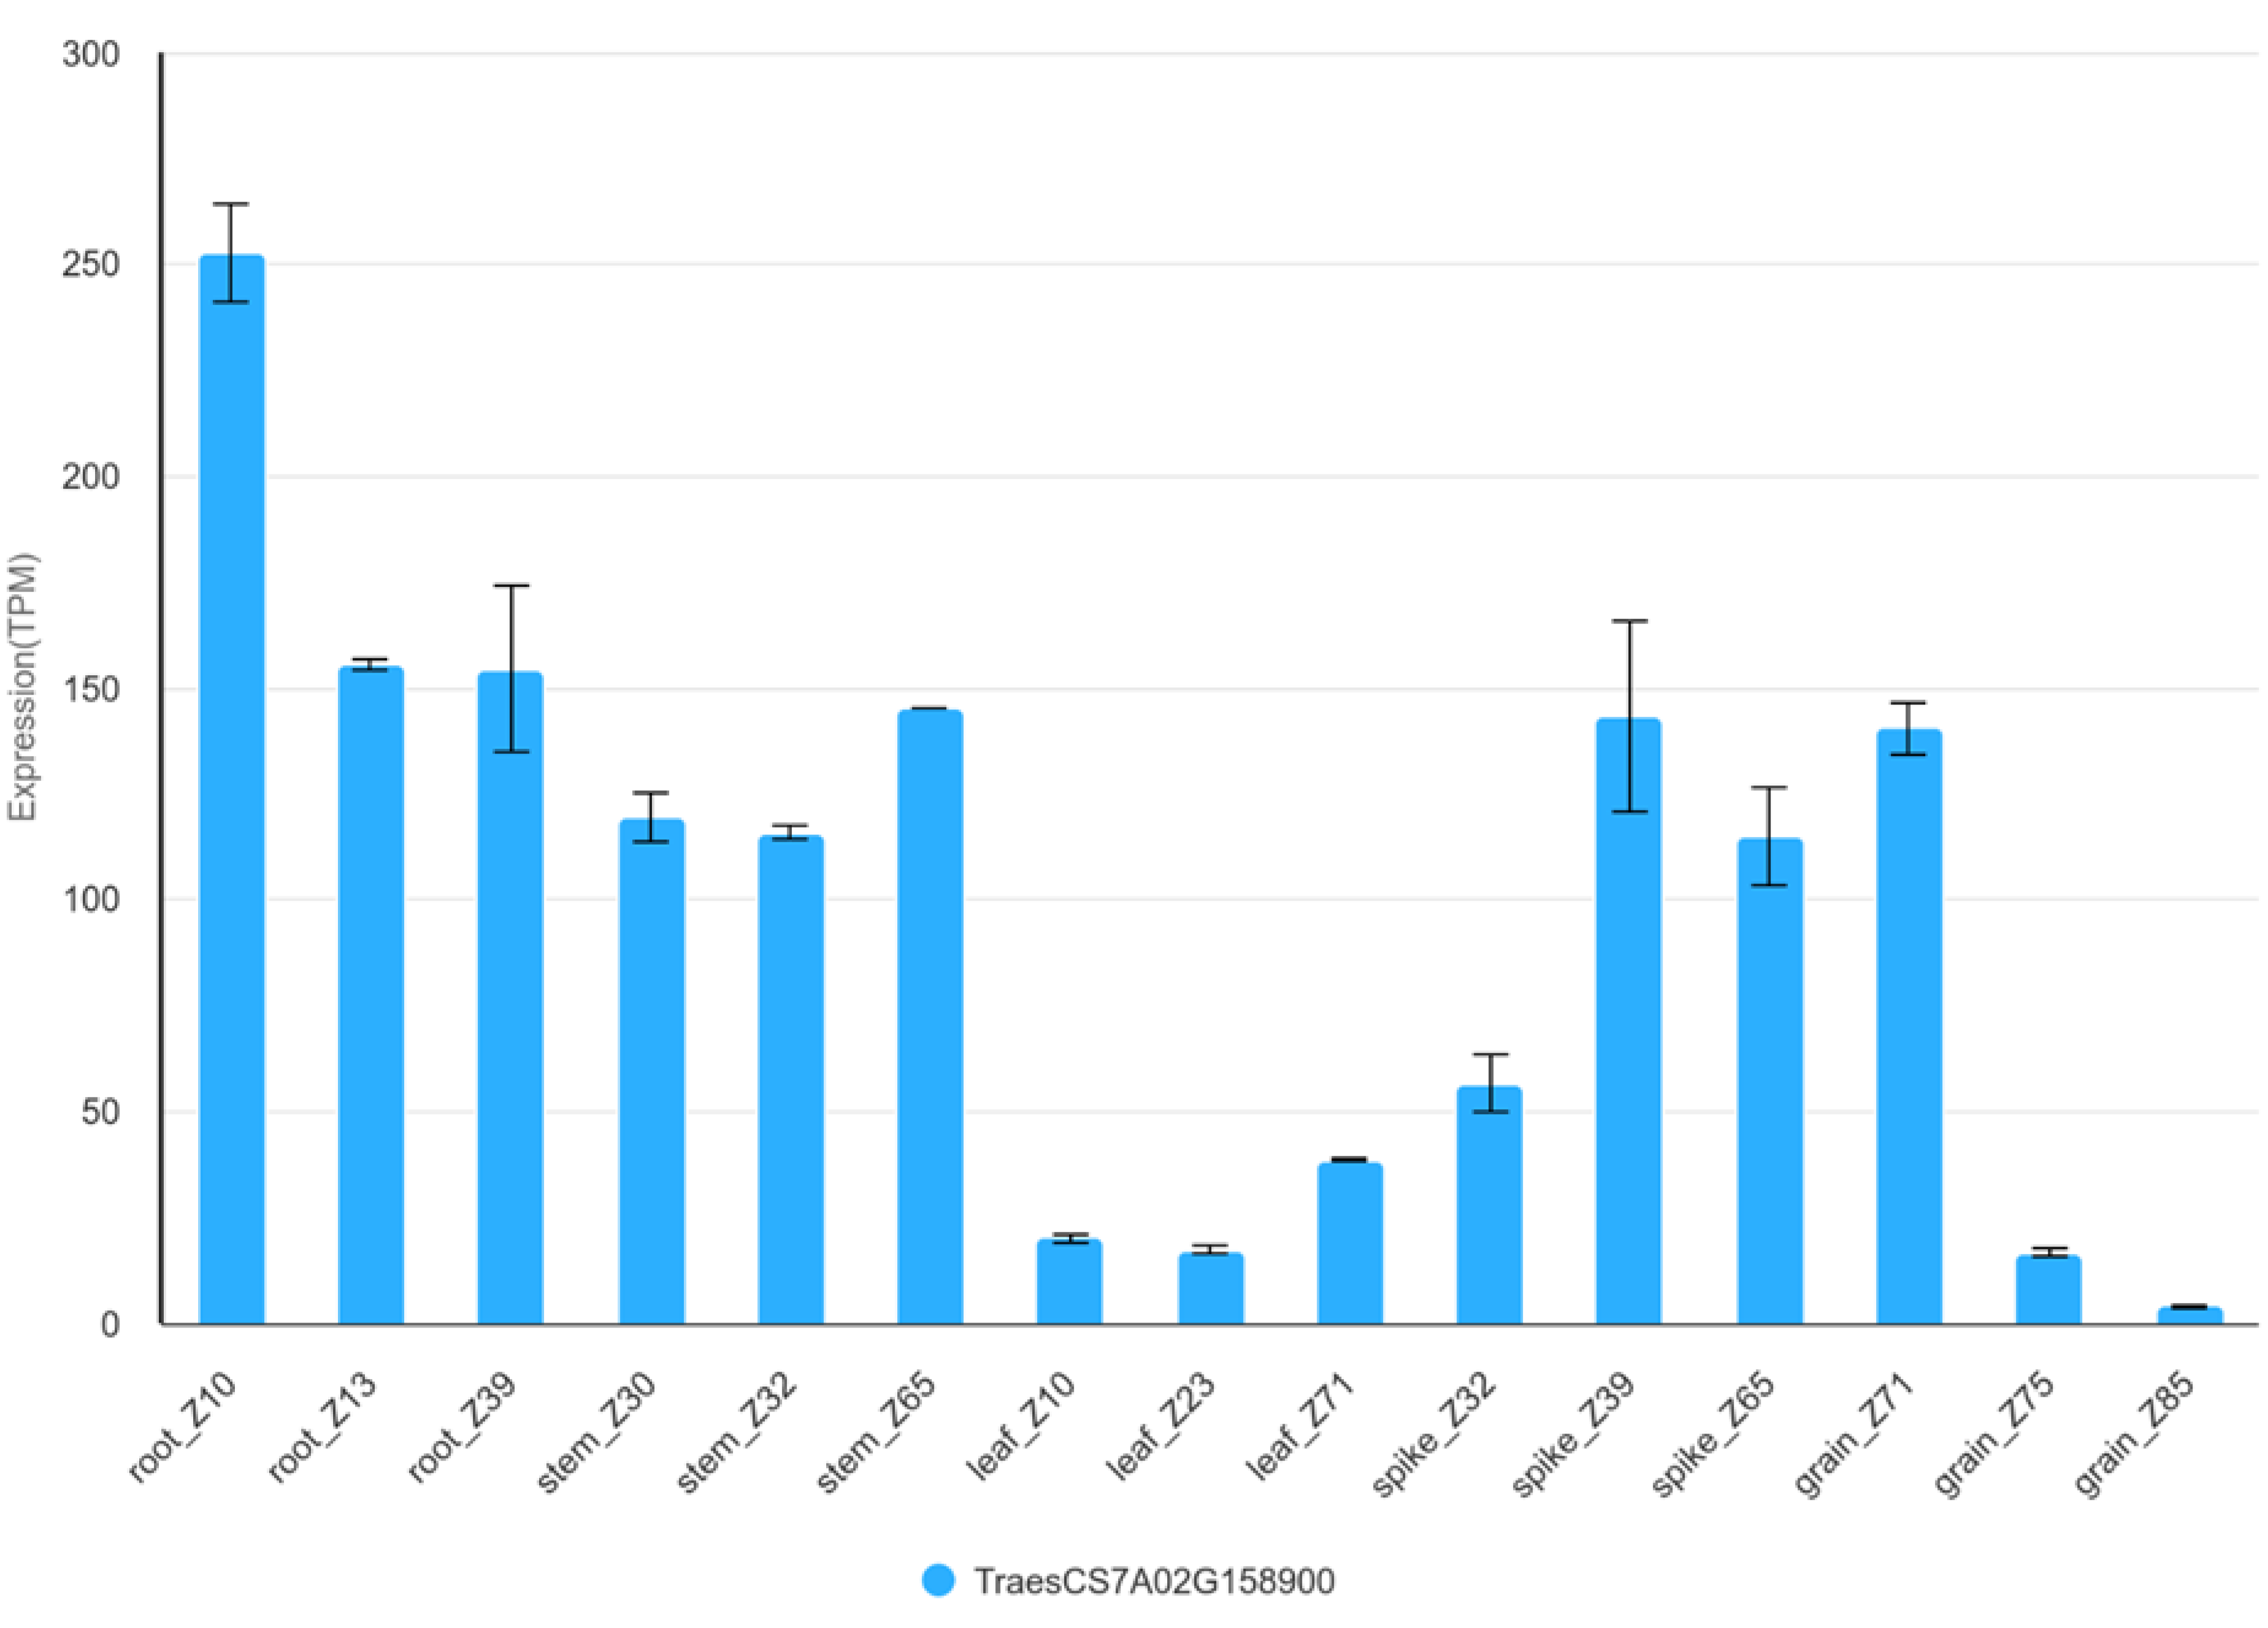
Figure 6.
Expression of TraesCS1B02G262900 in organs during development of Chinese Spring plant. TPM – transcripts per million.
Figure 6.
Expression of TraesCS1B02G262900 in organs during development of Chinese Spring plant. TPM – transcripts per million.
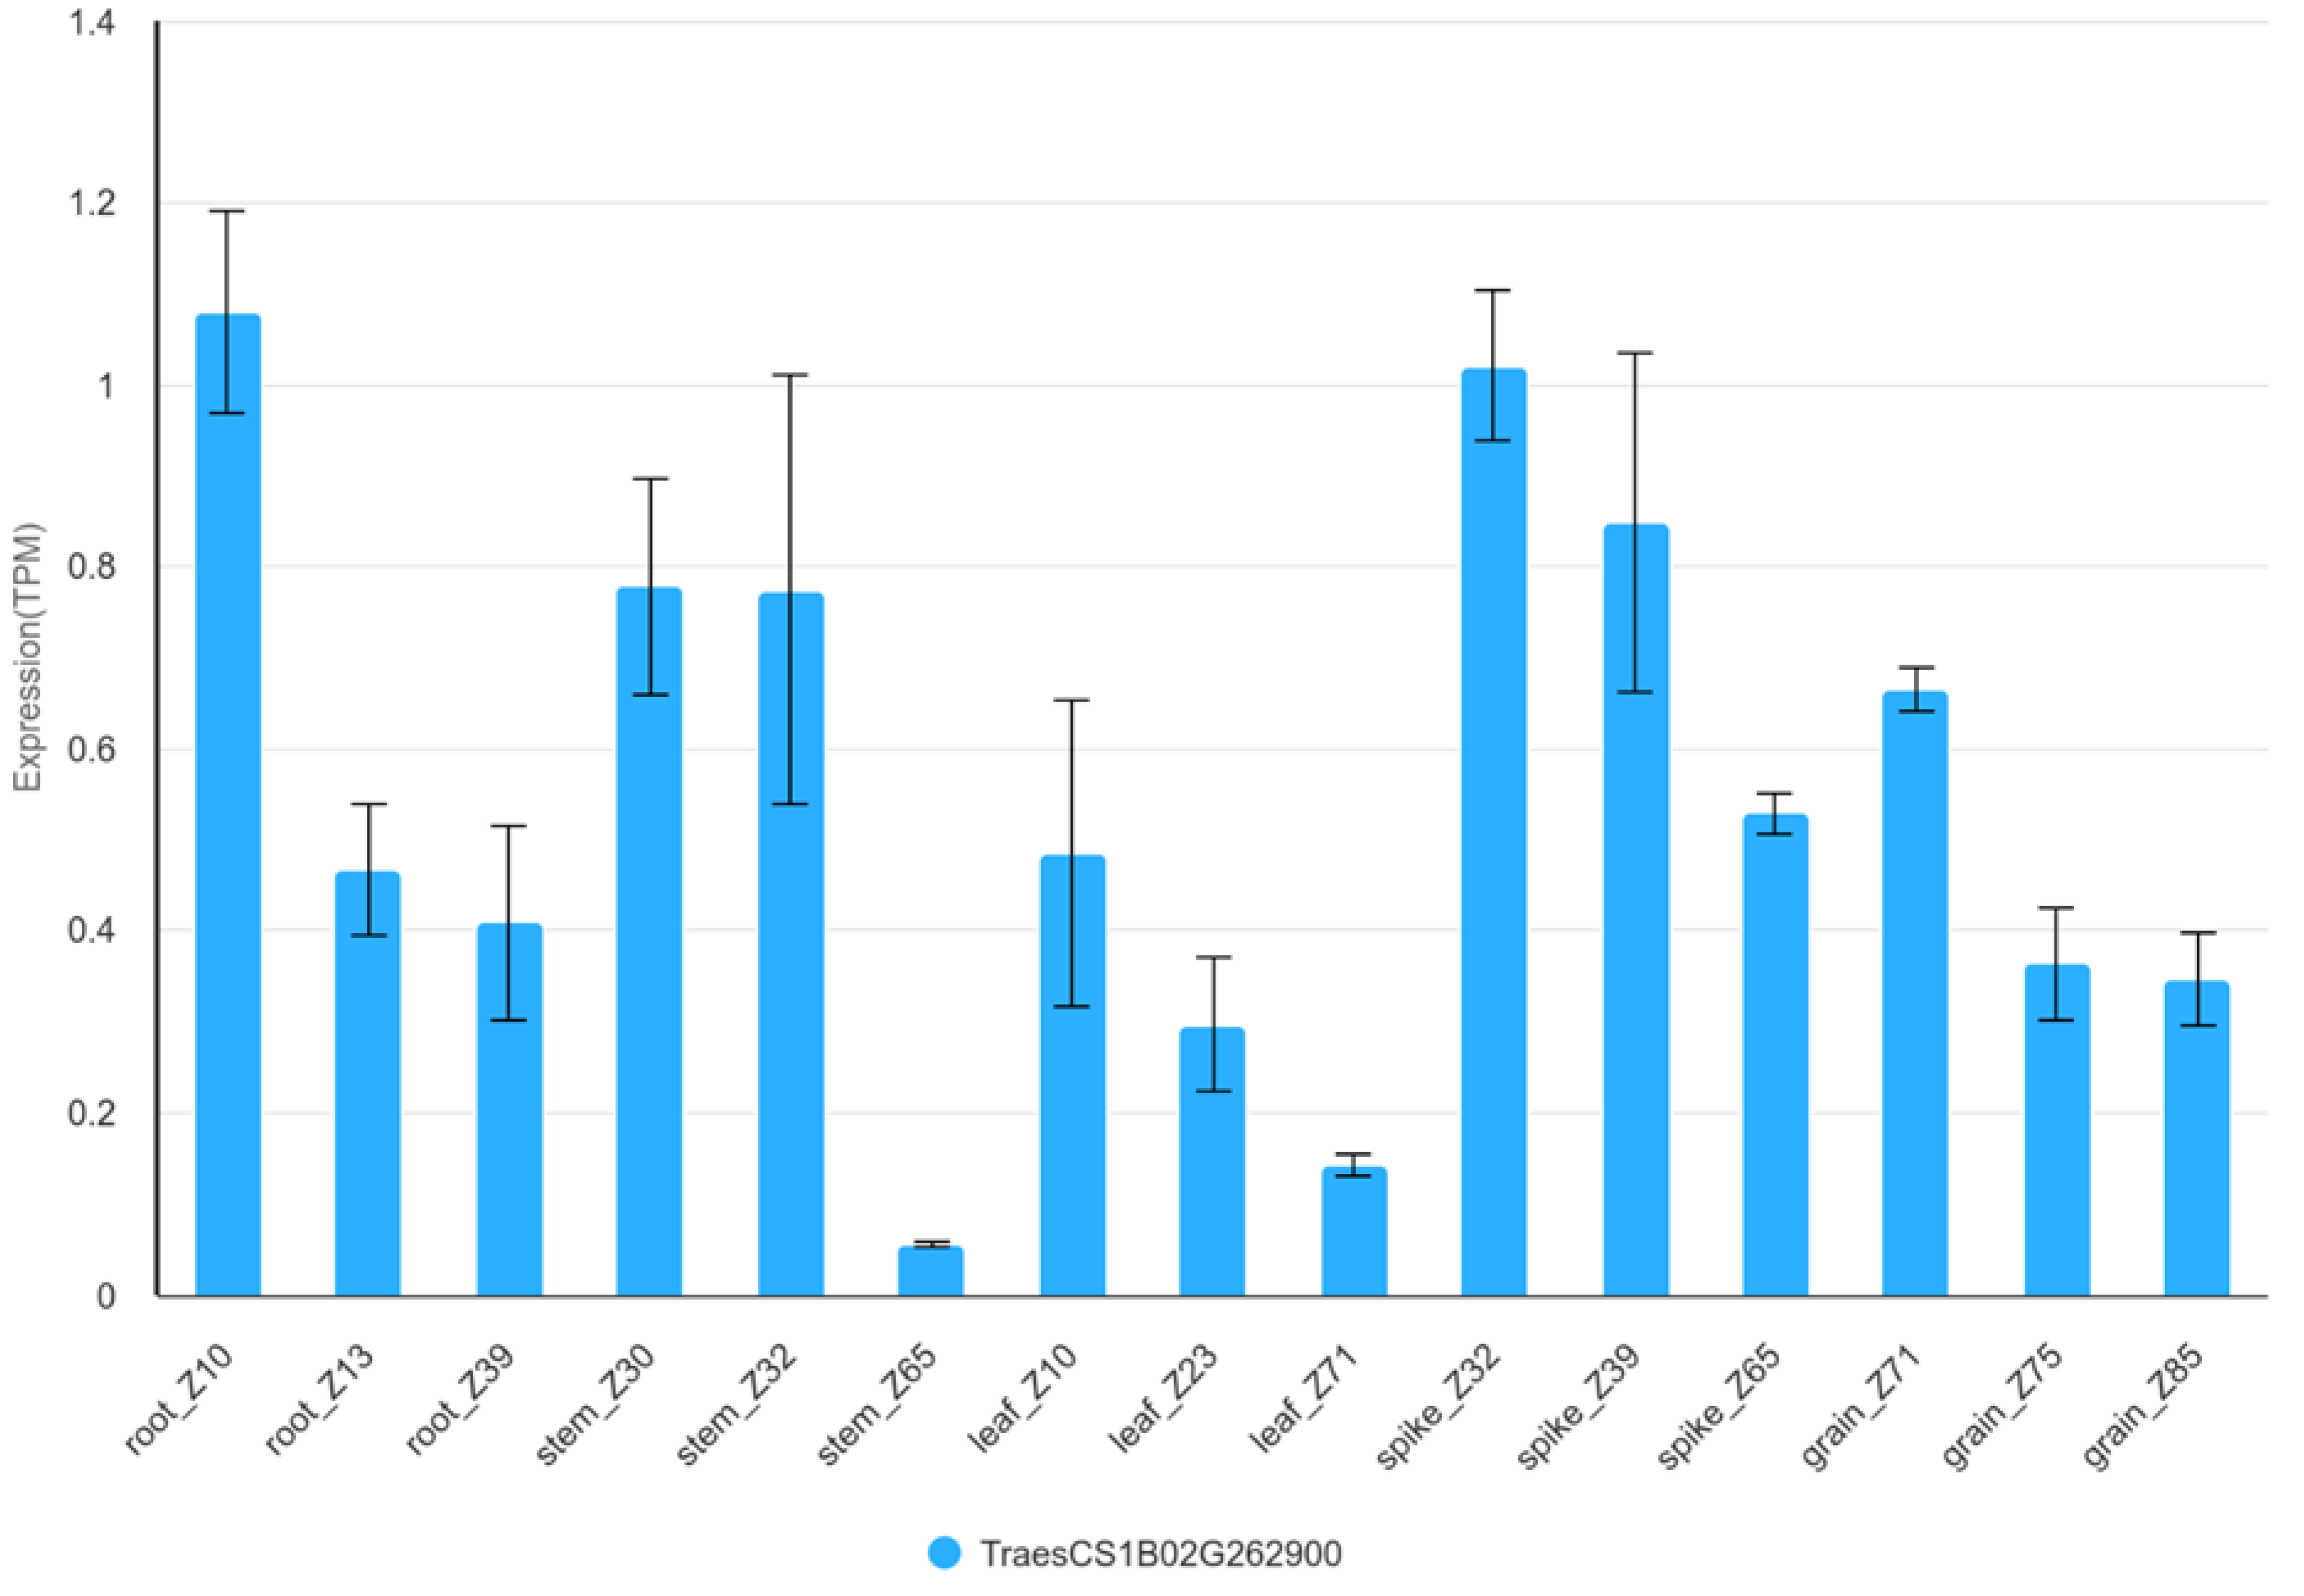

Table 1.
Phenotypic values for starch, proteins and asparagine content in grains of 344 winterwheat lines.
Table 1.
Phenotypic values for starch, proteins and asparagine content in grains of 344 winterwheat lines.
| Trait | Mean± SD | Min | Max | Median | Skewness | Kurtosis | H2 |
| GSC [%] | 60.97±1.14 | 56.2 | 65.8 | 61.0 | 0.01 | 0.32 | |
| kbp22 | 60.48±0.75 | 57.3 | 62.3 | 60.5 | -0.56 | 0.93 | 0.70 |
| smh22 | 60.16±0.82 | 57.5 | 62.2 | 60.2 | -0.15 | -0.21 | |
| sth22 | 61.15±0.87 | 58.4 | 65.8 | 61.1 | 0.83 | 3.10 | |
| kbp23 | 61.09±0.82 | 57.9 | 63.3 | 61.1 | -0.28 | 0.51 | 0.45 |
| smh23 | 60.49±1.24 | 56.2 | 64.2 | 60.5 | 0.00 | 0.13 | |
| sth23 | 62.27±0.72 | 60.0 | 65.6 | 62.2 | 0.46 | 0.73 | |
| GPC [%] | 11.31±1.44 | 6.8 | 16.0 | 11.2 | 0.24 | -0.55 | |
| kbp22 | 12.37±0.97 | 9.8 | 16 | 12.4 | 0.13 | 0.08 | 0.79 |
| smh22 | 12.92±0.99 | 10.4 | 15.7 | 12.9 | 0.04 | -0.37 | |
| sth22 | 10.73±0.72 | 6.8 | 12.9 | 10.7 | -0.24 | 1.46 | |
| kbp23 | 10.92±0.96 | 8.4 | 13.7 | 10.9 | 0.04 | -0.36 | 0.78 |
| smh23 | 11.71±1.15 | 8.7 | 14.8 | 11.7 | 0.05 | -0.38 | |
| sth23 | 9.61±0.65 | 8.10 | 11.70 | 9.60 | 0.36 | 0.11 | |
| GFAC [ppm] | 91.11±32.71 | 26.67 | 227.16 | 89.79 | 0.52 | 0.97 | 0.51 |
Table 2.
Significant marker-trait associations of DArTseq markers with BLUP values for GPC in elite breeding lines. MAF - minor allele frequency.
Table 2.
Significant marker-trait associations of DArTseq markers with BLUP values for GPC in elite breeding lines. MAF - minor allele frequency.
| Trait | MTA | DArTseq marker | IWGSC v2.1 | position [Mbp] | P-value | R2 [%] | MAF | effect |
| GPC_2022 | QGpc.rut.2A.1 | 1064413 | 2A | 0.9 | 8.31E-05 | 8.2 | 0.106 | -0.673 |
| GPC_2022 | QGpc.rut.2A.2 | 1090321 | 2A | 11.6 | 2.47E-04 | 7.1 | 0.444 | 0.449 |
| GPC_2022 | QGpc.rut.2A.3 | 3961191 | 2A | 18.2 | 9.73E-05 | 8.0 | 0.424 | 0.572 |
| GPC_2022 | QGpc.rut.2A.3 | 7354314 | 2A | 21.3 | 2.03E-04 | 7.3 | 0.479 | 0.376 |
| GPC_2022 | QGpc.rut.2D | 1090962 | 2D | 16.6 | 1.43E-04 | 7.6 | 0.344 | 0.281 |
| GPC_2023 | QGpc.rut.2D | 4990459 | 2D | 16.6 | 1.20E-05 | 10.2 | 0.017 | 1.620 |
| GPC_2022 | QGpc.rut.3A | 13880651 | 3A | 10.5 | 1.09E-04 | 7.9 | 0.088 | -0.648 |
| GPC_2022 | QGpc.rut.3B | 4004943 | 3B | 23.2 | 1.07E-04 | 7.9 | 0.309 | 0.297 |
| GPC_2022 | QGpc.rut.5B.1 | 16662440 | 5B | 334.8 | 1.49E-04 | 7.6 | 0.129 | 0.376 |
| GPC_2022 | QGpc.rut.5B.2 | 1058250 | 5B | 359.8 | 3.30E-04 | 6.8 | 0.109 | 0.390 |
| GPC_2022 | QGpc.rut.5B.3 | 3935268 | 5B | 426.2 | 2.65E-04 | 7.0 | 0.153 | 0.383 |
| GPC_2022 | QGpc.rut.5B.4 | 1385698 | 5B | 534.3 | 3.36E-04 | 6.8 | 0.076 | 0.493 |
| GPC_2022 | QGpc.rut.6A | 1116192 | 6A | 5.9 | 1.12E-04 | 7.9 | 0.191 | 0.363 |
| GPC_2022 | QGpc.rut.7B | 1080641 | 7B | 68.7 | 1.06E-04 | 8.0 | 0.068 | 0.594 |
Table 3.
Significant marker-trait associations of DArTseq markers with BLUP values for GSC in elite breeding lines obtained for combination of models.
Table 3.
Significant marker-trait associations of DArTseq markers with BLUP values for GSC in elite breeding lines obtained for combination of models.
| MTA | DArTseq marker | IWGSC v2.1 | position [Mbp] | P-value | R2 [%] | MAF | effect |
| QGsc.rut.1B.3 | 7352878 | 1B | 644.8 | 2.43E-05 | 10.9 | 0.230 | -0.878 |
| QGsc.rut.1B.4 | 5324459 | 1B | 685.6 | 2.71E-05 | 10.7 | 0.371 | -0.390 |
| QGsc.rut.3B | 7353108 | 3B | 105.1 | 2.09E-04 | 8.3 | 0.236 | -0.779 |
| QGsc.rut.3D.2 | 1708238 | 3D | 107.5 | 2.55E-05 | 10.8 | 0.227 | -0.829 |
| QGsc.rut.3D.4 | 7353553 | 3D | 613.1 | 2.21E-04 | 8.2 | 0.164 | -0.815 |
| QGsc.rut.3D.4 | 7352096 | 3D | 617.1 | 1.15E-04 | 9.0 | 0.233 | -0.777 |
| QGsc.rut.4A.2 | 2256486 | 4A | 695.4 | 2.64E-04 | 8.0 | 0.417 | -0.325 |
| QGsc.rut.5A.1 | 1204378 | 5A | 7.4 | 1.64E-04 | 8.6 | 0.103 | -0.519 |
| QGsc.rut.5A.4 | 1059886 | 5A | 569.7 | 1.93E-04 | 8.4 | 0.086 | -0.658 |
| QGsc.rut.5B.4 | 1110565 | 5B | 574.2 | 3.04E-04 | 7.8 | 0.342 | -0.322 |
| QGsc.rut.6D | 1066660 | 6D | 477.9 | 2.59E-04 | 8.0 | 0.187 | 0.753 |
| QGsc.rut.7A.2 | 1127783 | 7A | 116.1 | 1.57E-04 | 8.6 | 0.057 | -0.788 |
| QGsc.rut.7A.4 | 4909952 | 7A | 698.7 | 7.90E-06 | 12.2 | 0.066 | -0.912 |
| QGsc.rut.7B.1 | 2276168 | 7B | 8.6 | 3.08E-04 | 7.8 | 0.374 | 0.288 |
| QGsc.rut.7B.3 | 1067031 | 7B | 470.7 | 1.25E-05 | 11.7 | 0.052 | -0.988 |
| QGsc.rut.7B.4 | 3935071 | 7B | 610.8 | 2.02E-04 | 8.3 | 0.411 | -0.311 |
Table 4.
Significant marker-trait associations of DArTseq markers with BLUP values for GFAC in elite breeding lines.
Table 4.
Significant marker-trait associations of DArTseq markers with BLUP values for GFAC in elite breeding lines.
| MTA | SNP marker | IWGSC v2.1 | position [Mbp] | P-value | R2 [%] | MAF | effect |
| QGfac.rut.1B.1 | 4989859 | 1B | 468.9 | 1.52E-05 | 11.9 | 0.293 | -14.28 |
| QGfac.rut.1B.2 | 1023929 | 1B | 481.0 | 1.53E-04 | 8.5 | 0.207 | 13.48 |
| QGfac.rut.1B.3 | 996356 | 1B | 491.1 | 7.00E-04 | 7.6 | 0.169 | 9.54 |
| QGfac.rut.1B.3 | 1063426 | 1B | 495.3 | 3.68E-04 | 8.4 | 0.186 | 9.72 |
| QGfac.rut.1D.1 | 985475 | 1D | 20.5 | 3.39E-04 | 7.3 | 0.494 | 7.89 |
| QGfac.rut.1D.2 | 1043337 | 1D | 368.0 | 1.07E-03 | 6.9 | 0.130 | 14.40 |
| QGfac.rut.1D.3 | 1128816 | 1D | 423.0 | 1.06E-03 | 6.3 | 0.112 | 11.33 |
| QGfac.rut.2B.1 | 7940434 | 2B | 31.5 | 1.06E-03 | 6.3 | 0.337 | 7.09 |
| QGfac.rut.2B.2 | 1021699 | 2B | 111.5 | 1.01E-03 | 6.3 | 0.157 | 10.43 |
| QGfac.rut.2B.3 | 1201965 | 2B | 516.7 | 9.11E-04 | 7.2 | 0.210 | 9.03 |
| QGfac.rut.2D.1 | 1019419 | 2D | 35.8 | 1.32E-04 | 9.1 | 0.154 | -12.22 |
| QGfac.rut.2D.2 | 2242065 | 2D | 496.8 | 1.84E-04 | 8.7 | 0.183 | 15.04 |
| QGfac.rut.3A | 1069217 | 3A | 0.9 | 7.58E-04 | 7.0 | 0.379 | -7.16 |
| QGfac.rut.3B.1 | 5005709 | 3B | 2.5 | 9.50E-04 | 6.7 | 0.388 | -7.16 |
| QGfac.rut.3B.2 | 1081766 | 3B | 256.1 | 3.97E-05 | 10.2 | 0.287 | -14.40 |
| QGfac.rut.3B.3 | 1101184 | 3B | 837.2 | 2.92E-04 | 7.8 | 0.402 | 8.07 |
| QGfac.rut.3D | 1109137 | 3D | 40.6 | 6.99E-04 | 7.1 | 0.183 | -8.94 |
| QGfac.rut.4A | 983765 | 4A | 698.2 | 4.96E-04 | 6.7 | 0.266 | -9.02 |
| QGfac.rut.5B.1 | 3941721 | 5B | 634.2 | 9.91E-04 | 6.3 | 0.322 | 7.63 |
| QGfac.rut.5B.2 | 1266853 | 5B | 697.9 | 9.76E-04 | 6.8 | 0.180 | -8.50 |
| QGfac.rut.5D | 1139602 | 5D | 122.2 | 4.82E-04 | 7.7 | 0.414 | -7.23 |
| QGfac.rut.6B.1 | 1250105 | 6B | 18.8 | 1.04E-03 | 6.6 | 0.296 | 7.90 |
| QGfac.rut.6B.2 | 4992737 | 6B | 245.3 | 9.28E-04 | 6.3 | 0.311 | -7.54 |
| QGfac.rut.6B.3 | 1009606 | 6B | 313.1 | 8.62E-04 | 6.7 | 0.479 | -7.12 |
| QGfac.rut.6B.4 | 1001121 | 6B | 323.2 | 2.33E-04 | 7.9 | 0.482 | -8.28 |
| QGfac.rut.6B.5 | 2322830 | 6B | 356.0 | 3.10E-04 | 7.6 | 0.476 | -7.87 |
| QGfac.rut.6B.6 | 3533239 | 6B | 375.6 | 4.02E-04 | 7.2 | 0.459 | -7.42 |
| QGfac.rut.6B.7 | 1089420 | 6B | 708.3 | 2.51E-04 | 8.7 | 0.376 | 8.32 |
| QGfac.rut.6D.1 | 998928 | 6D | 181.1 | 5.46E-04 | 6.9 | 0.281 | 13.93 |
| QGfac.rut.6D.2 | 1016778 | 6D | 418.4 | 6.77E-04 | 7.3 | 0.269 | 13.52 |
| QGfac.rut.7A.1 | 1017632 | 7A | 25.8 | 1.94E-04 | 8.7 | 0.349 | 9.24 |
| QGfac.rut.7A.2 | 1011371 | 7A | 413.0 | 2.34E-04 | 8.1 | 0.062 | 16.25 |
| QGfac.rut.7A.3 | 1862702 | 7A | 477.5 | 1.84E-04 | 8.4 | 0.053 | 18.50 |
| QGfac.rut.7A.4 | 994119 | 7A | 549.9 | 8.87E-05 | 9.2 | 0.068 | 16.99 |
| QGfac.rut.7A.5 | 1696589 | 7A | 622.0 | 5.22E-04 | 7.1 | 0.139 | 14.74 |
| QGfac.rut.7A.6 | 3953081 | 7A | 638.9 | 1.86E-05 | 11.2 | 0.189 | 12.71 |
| QGfac.rut.7A.7 | 994476 | 7A | 656.7 | 1.71E-04 | 8.4 | 0.062 | 17.59 |
| QGfac.rut.7A.8 | 1331106 | 7A | 702.8 | 9.12E-04 | 7.1 | 0.322 | 8.10 |
| QGfac.rut.7B.9 | 985944 | 7B | 756.0 | 8.64E-04 | 6.5 | 0.210 | 8.56 |
| QGfac.rut.7D.1 | 2269456 | 7D | 15.4 | 8.07E-04 | 6.5 | 0.080 | 18.25 |
| QGfac.rut.7D.2 | 1022222 | 7D | 77.7 | 1.97E-04 | 8.0 | 0.464 | 10.81 |
| QGfac.rut.7D.3 | 1062859 | 7D | 114.5 | 2.91E-04 | 7.8 | 0.192 | 10.88 |
| QGfac.rut.7D.4 | 1236791 | 7D | 633.0 | 5.49E-05 | 9.9 | 0.115 | 14.02 |
Disclaimer/Publisher’s Note: The statements, opinions and data contained in all publications are solely those of the individual author(s) and contributor(s) and not of MDPI and/or the editor(s). MDPI and/or the editor(s) disclaim responsibility for any injury to people or property resulting from any ideas, methods, instructions or products referred to in the content. |
© 2025 by the authors. Licensee MDPI, Basel, Switzerland. This article is an open access article distributed under the terms and conditions of the Creative Commons Attribution (CC BY) license (http://creativecommons.org/licenses/by/4.0/).
Copyright: This open access article is published under a Creative Commons CC BY 4.0 license, which permit the free download, distribution, and reuse, provided that the author and preprint are cited in any reuse.


