
Submitted:
21 December 2025
Posted:
22 December 2025
You are already at the latest version
Abstract
DNA damage must be efficiently repaired to sustain cell survival. During transcription, RNA polymerases (RNAPs) serve as sentinels of genome health by detecting bulky DNA lesions, such as UV-induced CPDs, and initiating TC-NER. TC-NER has been most investigated for Pol II, and depends on coordinated interaction of numerous NER proteins, including the central translocase ERCC6(CSB), largely to dislodge the stalled EC. However, this basic mechanism is not unique to Pol II. RNA polymerase I, responsible for ribosomal RNA synthesis, dominates transcriptional output. Using structural and molecular analyses, we found that Pol I known to be stalled at CPDs due to interactions near its active site, requires ERCC6 (CSB) to displace the stalled EC and enable repair, whose activity we now show depends heavily on multiple phosphorylations of the “hydroxy patch”. TLK1 and its downstream kinase NEK1 regulate ERCC6 through phosphorylation of conserved residues within a “hydroxy patch” essential for ATPase and DNA interactions. Mutational disruption of this phosphorylation ‘core’ impaired Pol I transcription recovery and pre-rRNA processing following UV exposure. These findings uncover a TLK1–NEK1–ERCC6 regulatory axis linking DNA repair, ribosome biogenesis, and the integrated stress response that results in cell cycle progression delay and major reprogramming of the transcriptional repertoire. Comparative analysis with yeast orthologs, studying traditional TC-NER of protein-coding genes, suggests this mechanism is evolutionarily conserved.
Keywords:
TC-NER
; ERCC6
; NEK1
; Rad26
; Kin3
; rRNA transcription processing
; integrated stress response
1. Introduction
In the intricate dance of life within a cell, the preservation of genetic integrity stands as an essential priority. The genome is under constant assault from a myriad of endogenous and exogenous agents that can lead to DNA damage. Such damage, if left unrepaired, can culminate in mutations, genomic instability, and even contribute to the onset of diseases, including cancer. To counteract this ever-present threat, cells have evolved an intricate network of DNA repair mechanisms, among which nucleotide excision repair (NER) is a prominent guardian of genome stability.
NER operates through two distinct pathways: global genome repair (GGR) and transcription-coupled repair (TC-NER). TC-NER, as its name suggests, is specifically dedicated to rectifying lesions that obstruct the progression of RNA polymerase during active transcription (rev. in [1,2]). This process is imperative for the maintenance of cellular homeostasis, as lesions encountered by the transcription machinery can lead to stalling, erroneous transcription, and ultimately, deleterious cellular outcomes. At the heart of the TC-NER pathway lies ERCC6, a protein of paramount importance in orchestrating the repair of DNA lesions within transcribed regions of the genome. ERCC6, also known as Cockayne syndrome protein B (CSB), is a versatile molecular sentinel that plays a pivotal role in detecting and coordinating the repair of transcription-blocking lesions [3]. Biochemically, ERCC6 is recruited to lesions through interaction with the TFIIH component of stalled RNA PolII, thus engaging its intrinsic ATPase that somehow facilitates PolII complex displacement, possibly in conjunction with ubiquitination [4], although it possesses no measurable in vitro helicase [5]. More likely, ERCC6 activity is envisioned as a corkscrew DNA translocase that tows the EC (Elongation Complex) stuck at lesions [6,7], in analogy to its Mfd functional homolog in E.coli [8]. Beyond its direct involvement in TC-NER, ERCC6 has been implicated in a plethora of cellular processes, underscoring its multifaceted nature and its broader impact on genome stability and cellular health, as clearly exemplified by the severity of syndromes in individuals with frame-shift mutations [9]. Some other mutations have unexpected phenotypes that include premature ageing as in Csbm/m mice due to mitochondrial dysfunction, but when these animals were given a high-fat feeding, it rescued the metabolic, transcriptomic, and behavioral phenotypes of Csbm/m mice. Furthermore, premature ageing in CS mice, nematodes, and human cells correlates with aberrant PARP activation due to deficient DNA repair leading to decreased SIRT1 activity. But notably, β-hydroxybutyrate (BHB) levels are increased by the high-fat diet, and BHB, PARP inhibition, or NAD+ supplementation can activate SIRT1 and rescue CS-associated phenotypes. Mechanistically, this is explained by CSB activity that can displace activated PARP1 from damaged DNA to limit its PARylation activity [10].
We are now presenting some novel features that appear to regulate some functions of ERCC6's activities and its central role in the TC-NER pathway (https://rgd.mcw.edu/rgdweb/report/gene/main.html?id=1311509). We explore the novel regulation of ERCC6 via NEK1 phosphorylation and the in vitro activity of a putative consensus-phosphorylation-site-null-mutant. Specifically, we studied the intrinsic and DNA-dependent ATPase activity as one of the features that enables ERCC6 to recognize lesions via its ATPase-dependent DNA unwinding capacity, and facilitate their removal, shedding light on the complex interplay between transcription, repair, and cellular physiology. By dissecting the regulation governing ERCC6's actions, we hope to enhance our understanding of how this protein safeguards genome integrity and contributes to the important role of TC-NER in repairing lesions that may well contribute to a variety of diseases, including cancer and the progeria-like syndrome that characterizes Cockayne-affected individuals [11].
2. Materials & Methods
2.1. Co-Immunoprecipitation (co-IP)
Cells were lysed by sonication in 1X RIPA lysis buffer (SCBT, cat# 24948). 50 µl of equilibrated protein A/G agarose (SCBT, cat# sc-2003) was incubated with either mouse anti-NEK1 or anti-ERC6 antibody or control mouse IgG antibody at 4°C for 4 hours with rotation. 500 µg of protein lysate was added to the reaction and incubated overnight at 4°C. Beads were washed thrice, eluted with 25µl of 2X SDS-Laemmli buffer and the entire volume was loaded into SDS-PAGE gel for WB analysis.
2.2. Generation of NT1 NEK1 Knockout (KO) Cells Lines
NT1 NEK1 KO clones were previously generated [12] by lentiviral infection using NEK1 CRISPR gRNA (AAGGAGAGAAGTTGCTGTAT) cloned into pLentiCRISPR V2 vector backbone from Genscript. Lentivirus containing NEK1 CRISPR gRNA was packaged using HEK293T cells. NT1 cells were infected with lentivirus using polybrene transfection reagent following standard protocol. After 72 hours of infection, cell were supplemented with fresh media and selected with 1-2µg/ml of puromycin for 10 days. To generate a single clonal population of NEK1 KO cells, 1-2 cells/well were seeded in a 96-well plate and grown until confluency and then, transferred them to a bigger dish for expansion. KO efficiency was measured by western blotting (WB) using anti-NEK1 mouse antibody from Santa Cruz Biotechnology (cat# sc-398813).
2.3. ERCC6 Plasmid Vector SDM
The expression vector RC219020 (OriGene https://www.origene.com/catalog/cdna-clones/expression-plasmids/rc219020-csb-ercc6-nm-000124-human-tagged-orf-clone) was mutated by PCR using QuickChangeII SDM kit (Agilent cat#200523); the primer sets listed below; sequenced for confirmation; and amplified E.coli XL1Blue.
2.4. Primer Set 1 SYSY/AAAA
CGAGATGTTGCTCATTGTCATGGAATTTTGATCACAGCTGCTGCCGCTATTCGATTGATGCAGGATGACATTAGCAGGTATGACTGGC
REV
GCCAGTCATACCTGCTAATGTCATCCTGCATCAATCGAATAGCGGCAGCAGCTGTGATCAAAATTCCATGACAATGAGCAACATCTCG
2.5. Primer Set 2 (Ser 624 Ala)
CGAGATGTTGCTCATTGTCATGGAATTTTGATCACAGCTTACTCCTACATTCGATTGATGCAGGATGACATTAGCAGGTATGACTGGC
REV
GCCAGTCATACCTGCTAATGTCATCCTGCATCAATCGAATGTAGGAGTAAGCTGTGATCAAAATTCCATGACAATGAGCAACATCTCG
Primer Set 3 (Tyr 625 Phe)
CGAGATGTTGCTCATTGTCATGGAATTTTGATCACATCTTTCTCCTACATTCGATTGATGCAGGATGACATTAGCAGGTATGACTGGC
Rev
GCCAGTCATACCTGCTAATGTCATCCTGCATCAATCGAATGTAGGAGAAAGATGTGATCAAAATTCCATGACAATGAGCAACATCTCG
2.6. Protein Purification
Recombinant His-tagged full length MK5 and his-tagged NEK1 N-terminal truncated proteins (NEK1 ΔCT) were purified by affinity chromatography. NEK1∆CT (kinase domain) transformed into Rosetta2 DE3 strain [13]. Expression of His-MK5 was induced with 1mM IPTG at 37°C for 3-4 hours and His-NEK1ΔCT expression was induced with 0.5mM IPTG overnight at 25°C. Bacteria were pelleted down, dissolved in buffer containing 50mM sodium phosphate (Na2HPO4+NaH2PO4) of pH 8.0, 300mM NaCl, 20mM imidazole and 1mM PMSF, and lysed by sonication. Supernatants were incubated with Ni-NTA agarose (Qiagen, cat# 30210) and protein was eluted in buffer containing 50mM sodium phosphate (Na2HPO4+NaH2PO4) of pH 8.0, 300mM NaCl, 250mM imidazole. Eluted proteins were dialyzed overnight at 4°C using dialysis buffer containing 20mM sodium phosphate (Na2HPO4+NaH2PO4) of pH 7.7, 1M NaCl, 10mM β-mercaptoethanol, 0.5mM EDTA of pH 8.0 and 5% glycerol. After the dialysis, protein samples were run in SDS-PAGE gel to check their correct molecular weight.
Fl-ERCC6-flag-tagged (Origene-RC219020, wt and listed SDM-mutants) were overexpressed in Hek293 cells and partially purified by affinity retention with anti-flag IP.
2.7. ADP Hunter Assay
ADP hunter assays were conducted to determine the catalytic activity of the purified kinases by the fluorescence detection of ATP to ADP conversion using ADP HunterTM Plus Assay kit (Eurofins, cat# 90-0083). Manufacturer provided kinase buffer and 100uM of ATP was added in the reaction and incubated the reaction at 30°C for 30 minutes. Afterwards, reagent A and B were added sequentially and incubated the reaction at room temperature for 30 minutes. Stop solution was added and fluorescence intensity signal was measured at 530/590nm excitation/emission wavelength. ADP concentration was measured by the standard curve by the serial dilutions of the ADP standards provided with the kit.
2.8. In Vitro Kinase Assay
In vitro kinase (IVK) assays were performed using purified recombinant proteins, kinase buffer, ATP. Purified recombinant Flag-tagged ERCC6 was incubated with recombinant His-Tagged NEK1∆CT. Kinase buffer (10X) contains 10 mM Tris-Cl of pH 7.5, 10 mM MgCl2, 10 mM DTT and 10 mM ATP. The reactions were incubated for 30 minutes at 30°C and subsequently, were separated by SDS-PAGE, stained with coomassie brilliant blue.
2.9. Identification of ERCC6 Phosphorylation Sites by Mass Spectrometry
Following IVK, the band corresponding to ERCC6 was excised and subjected to dithiothreitol reduction, iodoacetamide alkylation, and in-gel chymotrypsin digestion. Peptides were extracted, concentrated and subjected to LC-MS/MS analysis at our LSUHS Proteomics Core Facility as previously reported [14]. Briefly, LC-MS/MS analysis was performed using an LTQ-Orbitrap mass spectrometer (Thermo Fisher Scientific, Waltham, MA) coupled with an Eksigent Nanoflex cHiPLC™ system (Eksigent , Dublin, CA) through a nano-electrospray ionization source. The peptide samples were separated with a reversed phase cHiPLC column (75 μm x 15 cm) at a flow rate of 300 nL/min. Mobile phase A was water with 0.1% (v/v) formic acid while B was acetonitrile with 0.1% (v/v) formic acid. The data-dependent acquisition method consisted of an Orbitrap MS scan (250-1800 m/z) with 60,000 resolution for parent ions followed by MS/MS for fragmentation of the 10 most intense multiple charged ions. The LC-MS/MS data were submitted to a local Mascot server for MS/MS protein identification via Proteome Discoverer (version 1.3, Thermo Fisher Scientific, Waltham, MA). Typical parameters used in the Mascot MS/MS ion search were: chymotrypsin digestion with a maximum of two miscleavages; 10 ppm precursor ion and 0.8 Da fragment ion mass tolerances; and dynamic modifications including cysteine carbamidomethylation, methionine oxidation, and serine/threonine/tyrosine phosphorylation. The identified phosphorylation sites were illustrated with relevant b and/or y ions labeled, and sequences were deposited in https://www.proteomexchange.org. The pY625 was confirmed in NT1 cells (wt and Nek1-/- cells) with custom-made phosphor-peptide antiserum prepared by Sino Biologicals, Texas Office: 10101 Southwest Freeway, Suite 100. Houston, TX 77074
2.10. Dot Blot (DNA Southwestern Blot)
50, 000 cells were plated and incubated for 24 hours, and then exposed to UV for 30 seconds. They were then allowed to recover for different time points, after which the cells were lysed using the X-Amp DNA reagent, Cat. No IB47441 and dot blotted on Milipore INYC00010 IMMOBILON via a dot blot apparatus (Bio-rad). Baked at 80 degrees for 30 minutes. The membrane was dipped in water and then 0.1% methylene blue and incubated with primary antibody, mouse monoclonal Anti-Cyclobutane pyrimidine dimer [C3B6] – Absolute antibody diluted 1:1000 in 0.5% BSA overnight. The membrane was washed twice gently in 0.02% TBST for 10 min and incubated in secondary antibody, Anti-mouse IgG, HRP-linked Antibody – Cell Signaling technology 1:5000 in 0.5% BSA in 0.02% TBST and then washed three times and visualized using the BIORAD ChemiDoc Imaging System.
2.11. Proliferation Assays
Cells were seeded into Greiner Cell culture Microplate, 96 Well, Ps, F-Bottom 655180 at 50% confluency(10,000 cells). After 24 hours, the cells were exposed to different doses of UV and placed into IncuCyte S3. Cell growth was monitored using the Incucyte® Live-Cell Analysis System to capture phase contrast images every four hours and analyzed using the integrated confluence algorithm.
2.12. Real-Time Quantitative PCR (RT-qPCR)
Total RNA was isolated using RNeasy RNA isolation minikit (Qiagen, cat# 74104) according to manufacturer’s instruction. Complementary DNA (cDNA) was synthesized using 1ug of RNA/reaction using protoscript First stand RNA synthesis reverse transcriptase and oligo (dT) primers (New England Biolab, cat# E6300L). qPCR was conducted using iQ SYBR green supermix (Biorad, cat# 1708880) and Bio-Rad CFX96 Fast Real-Time PCR Systems. Gene expression changes were determined by ΔΔCt relative quatification method. GAPDH mRNA was used as an internal control. All values are presented as mean± SEM. True-tested primer-pairs for a select panel of ISR genes was used for qPCR.
2.13. Statistical Analysis
Graphpad prism 10 was used to perform statistical analysis, and also Microsoft Excel software (Version 16.88) was used for data handling. Results are viewed as mean ± standard error of the mean (SEM). Statistical significance was calculated by a Student’s t-test when comparing the mean between two groups. P-values < 0.05 were considered significant(P value: P < 0.05*, P < 0.01**, and P < 0.001٭٭٭.
2.14. System Modelling and Setup for MD Simulations
The sequence for the Human DNA excision repair protein ERCC-6 (Q03468|ERCC6_HUMAN DNA excision repair protein ERCC-6) was downloaded from the UniProt structure database (https://www.uniprot.org). Modelling of the sequence was performed using AlphaFold 3.0 server (https://alphafoldserver.com) (REF: https://doi.org/10.1038/s41586-024-07487-w). The pLDDT, pTM and iPTM score were also recorded for the structures. The DNA bound form was further explored using the AlphaFold 3.0 and template structure of Pol II-CSB-CSA-DDB1-UVSSA-PAF-SPT6 (PDB: 7OOP) (REF: https://doi.org/10.1038/s41586-021-03906-4). The post modelling mutations for the target residues were performed and then remodeled and analyzed for the model quality. Further visualization and analysis were performed using the PyMOL 3.0.3.
All molecular dynamics simulations were run on single Graphical Processing Unit (GPU) Nvidia V100-SXM2-16GB Graphic card, using the Amber18 and AmberTOOLS18 Compute Unified Device Architecture (CUDA) version of particle-mesh Ewald molecular dynamics (PMEMD). The ff14SB, OL15 forcefield were used for the Protein and DNA respectively, whereas TIP3P water model was used to solvate the system.( R. Galindo-Murillo; J. C. Robertson; M. Zgarbovic; J. Sponer; M. Otyepka; P. Jureska; T. E. Cheatham. Assessing the Current State of Amber Force Field Modifications for DNA. J. Chem. Theory Comput., 2016, 12, 4114–4127. P. Li and K.M. Merz, Jr. Taking into Account the Ion-Induced Dipole Interaction in the Nonbonded Model of Ions J. Chem. Theory Comput., 2014, 10, 289-297.) Simulations were run at 1 atm constant pressure using Monte Carlo barostat (REF: Jorgensen W.L., Tirado-Rives J. Monte Carlo vs molecular dynamics for conformational sampling. J. Phys. Chem. 1996; 100:14508–14513) and 300 K constant temperature by using Langevin thermostat with a collision frequency of 2 ps–1 and the volume exchange was attempted for every 100 fs. An integration step of 2 fs was also used for simulation the hydrogen atoms involving bonds were constrained by using SHAKE algorithm (REF: Andersen H.C. Rattle: a “velocity” version of the shake algorithm for molecular dynamics calculations. J. Comput. Phys. 1983; 52:24–34.). Long range electrostatic interactions were computed by using Particle Mesh Ewald method while for short range interaction a cutoff of 8 Å was used. The solvated box for ERCC-6 protein model consisted of the Octahedron with 27609 water molecules and 20 Cl- ions to neutralize the system. Equilibration consisted of rounds of NVT and NPT equilibration for 10 ns in total. CPPTRAJ (REF: Roe D.R., Cheatham T.E. PTRAJ and CPPTRAJ: software for processing and analysis of molecular dynamics trajectory data. J. Chem. Theory Comput. 2013; 9:3084–3095.) was used to analyses the interactions over full trajectory after taking configuration at every 4 ps. RMSD, RMSF and MMGBSA binding free energy was determined after analyzing the trajectories. The trajectory analysis for calculating the free energy landscape (FEL), Principle component analysis (PCA) and DCCM matrix was performed using the MDanalysis python package.( doi:10.1002/jcc.21787.) The model validation and external analysis for the characterization of the protein models were performed in the AlphaFold 3.0 and the SWISSModel server (10.1093/nar/gky427).
2.15. Yeast Strains, SDM, and Assays of PolII-TC-NER
rad26 mutants were generated in the MP072 background (MATa trp1Δ0 leu2Δ0 met15Δ0 ura3Δ0 rad16::TRP1) using CRISPR/Cas9. The mutations were confirmed by DNA sequencing.
2.16. UV Sensitivity Assay
Yeast cells were cultured to saturation at 30°C. Sequential 10-fold dilutions of the cultures were made. Five μl of the diluted cell suspension was spotted onto plates and irradiated with varying doses of ~ 254 nm UV. The plates were incubated in the dark at 30°C for 3-5 days before being photographed.
2.17. Mapping Repair of UV Induced CPDs
Yeast cells were cultured at 30°C to late log phase (OD600 ≈ 1.0), irradiated with 120 J/m2 of ~254 nm UV and incubated at 30°C. At different timepoints of the post-UV incubation, aliquots were taken, and the genomic DNA was isolated. The CPDs remaining in the RPB2 and YEF3 genes in the isolated genomic DNA were analyzed using the Lesion-Adjoining Fragment Sequencing (LAF-Seq) method [15]. Sequencing reads whose 3’ ends adjoin the sites of CPDs remained in the genomic DNA were aligned to the TS and/or NTS sequences of the AGP2, RPB2 and YEF3 gene fragments. Reads corresponding to CPDs at individual sites along the gene fragments were counted after subtraction of the background counts (in the unirradiated samples) by using codes in R. To better illustrate the CPD induction and repair profiles, pseudo images whose band intensities correspond to the counts of aligned sequencing reads were generated using codes in R.
3. Results
TLK1 is implicated in resistance to multiple DNA damaging agents including UV and cisplatin. By phosphorylating its substrates (e.g., NEK1, RAD54 and ASF1), TLK1 plays roles in resistance to a number of DNA damaging agents, including ionizing radiation (IR), UV and CPT [16,17,18,19]. We recently synthesized a specific and potent TLK1 inhibitor (J54) [20], and tested its usefulness in conferring resistance to different genotoxins [21,22]. Notably, J54, through inhibition of TLK1>Rad54-promoted HRR, resulted in synthetic lethality (SL) with CPT-induced ICLs that are typically repaired via TC-NER intermediates [22]. This prompted us to test the SL potential of J54 with UV.
It is well known that UV damage, via formation of Cyclo-Pyrimidine Dimers (CPDs), arrests transcription progress of both PolII and PolI RNA polymerases [23]. The cryo-EM structure of an RNA Polymerase I (Pol I) stalled at a cyclobutane pyrimidine dimer (CPD) lesion has been solved at a resolution of 3.6 Å and provides the molecular mechanism for Pol I stalling in the presence of UV light-induced DNA damage[24]. Therefore, recovery of transcription of the 45S rRNA precursor is an indirect but reliable indicator for completion of repair of DNA lesions that block transcription [23]. We have thus determined the recovery of 45S rRNA transcription after UV exposure in cells simultaneously treated with J54 (Figure 1). Notably, cells exposed only to UV recovered transcription of the 45S rRNA precursor after about 2h, and also recovered the rapid processing of the 32S precursor that was also interrupted, indicating the ability to restore the final processing of pre-existing intermediates. In contrast, in cells simultaneously exposed to UV and J54, recovery of transcription did not occur until the 4th hour; processing was evidently arrested at the earlier 41S to 32S cleavage step [25]; and the residual 41S intermediates escaped further processing even after transcription by PolI recovered. In fact, it is likely that the newly accumulated 28S rRNAs after 4 hours of recovery in presence of J54 derive entirely from newly transcribed and processed 45S pre-RNA species. We should point out that this recovery of rRNA transcription and processing is in fact a mechanism of bona fide TC-NER, and that we previously reported that TLK1 was heavily localized to foci in the nucleoli after IR [21]. Since the heterochromatic and tightly clustered rRNA genes are more difficult and lengthier to repair, and hyper-autophosphorylation of TLKs was recently reported to negatively regulate their permanence at the DNA damage sites [26], it is tempting to speculate that their persistence in the nucleoli at damaged rRNA genes portends their critical importance in recovering stalled PolI-dependent transcription and processing. Additionally, it was reported that in HeLa cells, TLK loss increased chromatin accessibility at heterochromatic regions and caused spurious transcription of silenced repetitive elements [27], which we can now suggest may be another key role in orchestrating the precisely initiated and coordinated transcription of the rRNA genes clusters (cartoon on right reproduced from [28]) while suppressing aberrant events.
The fact that inhibiting TLK1 may delay the recovery of PolI transcripts, as well as precursor rRNA processing, is not that surprising per se, but the question is what might the mechanism be? Our working hypothesis is that this is the result of reduced ERCC6/CSB activity dependent on the TLK1>NEK1>ERCC6 axis. In fact, it is important to point out that there is strong evidence that CSB is a critical component of PolI transcription [29,30] as well as its more established roles [31,32,33,34,35] in TC-NER when PolII is arrested at CPD lesions of ‘protein-coding’ genes.
Nek1 and ERCC6 specific interaction as possible reason for TLK1-mediated UV resistance. The TLKs are known to play important roles in DNA repair (rev in [36]), and one of the earliest reports described the activity of overexpressed TLK1B in promoting more rapid removal of CPDs (determined with an antibody detection or accessibility to CPD-specific T4-nucleaseV) and conferring greatly increased viability [37]. However, the direct regulated target(s), or interactors, of TLK1 that play this role in repair of CPDs remained unknown [38], except for the possible indirect involvement of APEX that was implicated in some aspects of UV-damage repair [39].
However, we knew that a key regulatory function of TLK1 is as an activator of the important kinase NEK1 through its phosphorylation at T141 in the ‘activation loop’ [38]. Nek1 derives its name from the founding member of the NIMA (Never in Mitosis Gene A) family of protein kinases that was originally identified in Aspergillus nidulans as a kinase essential for mitosis [40], and expression of a dominant-negative mutant of NIMA results in G2 arrest in vertebrate cells [41].
NIMA related kinases (NEKs) have adapted to a variety of cellular functions in addition to mitosis [42]. In human cells, 11 NEKs were identified that are involved in several functions. For example, NEK2 is critical for centrosome duplication [42], whereas NEK6, 7, 9 are regulators of the mitotic spindle and cytokinesis [43]. NEK1, NEK4, NEK8, NEK10 and NEK 11 have been linked to the DNA damage response (DDR) and DNA repair pathways as well as ciliogenesis [42]. NEK1 mediates Chk1 activation likely by modulating the ATRIP/ATR interaction and activity [44], and this was reported as its main role in participating in the DDC (DNA Damage Checkpoint). However, NEK1 may also play more direct roles in DNA repair that could be a leading cause in its implied etiology in ALS. Following DNA damage induction, NEK1-ALS motor neurons and NEK1 knockdown cells exhibit accumulation of γH2AX over time, indicating a lack of DNA repair [45].
The NEK1 interactome, while probably incomplete, was reported [46] and revealed several proteins that are known to be involved in DNA repair, but none particularly related to UV-damage repair. However, its paralog NEK4 revealed, via a MS proteomic screen, its own direct interaction with ERCC6/CSB [47]. We thus decided to test if NEK1 also interacted with ERCC6 and whether it might be a suitable substrate. Indeed, a pulldown of NEK1 co-immunoprecipitated also ERCC6 and the reciprocal occurred, but not in cells with Nek1-KO (Figure 2), revealing high specificity for the interaction, despite the weak rendering of the WBs owing to the low abundance of the two proteins at the normal endogenous level. When Myc-ERCC6 was overexpressed in Hek293 cells, the coIP revealed strong intracellular interaction. Moreover, they readily associate in vitro when purified as recombinant proteins. In Figure 3, we carried out a copurification of ERCC6 (Origene) and recombinant His-NEK1 isolated from bacteria, both at 0.1µg/µl. HisNEK1 was readily associated with ERCC6 after repurification on Ni-Sepharose, whereas competitor BSA showed no appreciable association with it. The fraction of ERCC6 retained (indirectly) by the resin was in excess of the unbound fraction. In contrast, ERCC6 was quantitatively bound by resin, while none of BSA was. Beside confirming their physical interaction in vitro, and resulting in the phosphorylation of key residues in the ‘hydroxy patch’ in IVK reactions (Figure 6 below), the confirmation of pY625 dependence on Nek1 was confirmed in CRISPR-KO NT1 cells [12] (Figure 5 below).
Nek1-deficient cells show reduced capacity to repair CPDs. The interaction of ERCC6 with NEK1 immediately posed the question of whether NEK1 could regulate the activity of ERCC6 in TC-NER and establish the intriguing nexus:TLK1>NEK1>ERCC6>CPD-Repair. We thus empolyed a Southwestern blot technique to probe the kinetics of CPD removal from total DNA in UV-irradiated control NT1 cells and congenic Nek1-KO [48], as well as 3 other typical human PCa lines for comparison. Consistent with our hypothesis, while elimination of CPDs was completed within 12h in control NT1 cells, there was almost no detectable reduction in the Nek1-KO cells (Figure 4 and SI4 for repeat with quantitation). Note, however, that this assay does not distinguish between TC-NER and GG-NER, so that the inolvement of ERCC6 in the elimination of CPDs is only a partial explanation for the proposed TLK1>NEK1>ERCC6 activity on UV-damaged DNA. An obvious issue was to investigate the pattern of UV sensitivity in the NT1-Nek1-KO cells compared to parental NT1. UV exposure results in a cell cycle arrest, and then there is an expected recovery lag before proliferation resumes, but more importantly, when it does, the slope of proliferation rate gives a key estimate of how good the repair was, as an indication of the overall ‘fitness’’ of the cells population after recovery from a highly mutagenic event. As shown in Figure 5, at all UV doses tested, except for the highest 20s (highly lethal) exposure, the Nek1-KO cells were much less fit for recovery, indicating a deficiency in NER capacity decreased their viability.
NEK1 phosphorylates ERCC6 in vitro at several residues and one main consensus patch.
An extensive peptide-based screen for NEK1 consesus phospho-sites has been published [49], but we think it may actually not represent the correct situation. Apart from the incorrect conclusion that NEK1 does not phosphorylate at Tyrosines, which argues against the very incept of its initial identification [50], it is also not the situation we have encontered when we IVK’ed several substrates (including NEK1 autophosphorylated iteslf) with the recombinant kinase [48,51] (for published examples). In fact, our work suggests that the best consensus sequence is a tight patch of hydroxy AA residues – in YAP the key residue(s) phosphorylated was the SY in the patch SMSSY [48]; and in RAD54, the main site was all 3 S in KSSSETQIQ [51]. Interestingly, there are two such sets in human and mouse ERCC6 (highlighted) and one is further highly conserved even in two yeast species (Figure 6 - highlighted in red and yellow). In fact, all 5 (bracketed) residues were found to be phosphorylated by an IVK with recombinant NEK1 and ERCC6, determined by MS ion fragmentation analysis. Both pS624 and pY625 are annotated in PhosphoStie-plus as previously identified in vivo by MS.
The consensus TSYSY box is critical for the ATPase functional activity of ERCC6. We have demostrated by MS analysis that all 5 residues in the high NEK1 consensus site of ERCC6 are in fact phosphorylated in vitro by recombinant NEK1. In order to seek a quick answer for the possible regulatory function of these potential phosphorylation sites on the activity of the CSB protein in vitro (ATPase activity in presence and absense of substoichiometric amount of NEK1) we replaced the SYSY with Ala residues. We then first determined the ATPase activity of the recombinat wt and mutant proteins, in presence of the essential DNA. To our surprise, the Ala-replaced mutant protein was completely inactive for the ATPase function, even without any potential contribution from NEK1 phosphorylation/activation (Figure 7 – note that the slight reduction in expression compared the wt ERCC6 cannot explain the total loss of activity for the SYSY/4A protein). This, clearly indicated those residues are actually essential for the function of CSB and not just potential regulatory site(s) via reversible phosphorylation, and complicates a possible interpretation for the possible regulation of CSB by NEK1. We should point out that we have previously also made Hek293 cells expressing NEK1-wt and dominant inactive T141A mutant [38], which have similar doubling times, unlike the NT1-Nek1-KO cells. These Hek/Nek1-T141A cells are in fact highly sensitive to UV or H2O2 [38], and we could have made a case for the direct “loss” of regulation/ activation of CSB by the hypoactive Nek1-T141A mutant (that cannot be activated by TLK1) as the immediate cause for their damage sensitivity. However, it was previously demonstrated by Lee Zou’s group [52], and confirmed by us [38], that NEK1 is a key ‘primer’ for the activation of ATR, particularly after UV exposure – in fact, the only one of the 11-members Nek family that posses such activity [52]. Thus, following this line of investigation would have led to ambiguous interpretation for the UV sensitivity in attributing this to its NEK1 and ERCC6 interplay.
The 6. with NEK1 increase its ATPase activity.
While the structure/fnction significance of the SYSY/Ala replacement requires a complex investigation with molecular dynamics (see below), we sought to determine is the converse phosphorylation by NEK1 (overall at all target sites) could result in a change of the ATPase activity. For this, highly recombinant proteins were used and assmebled in reactions that essntially determine the accumulation of ADP at the end point (ADP-Hunter, DicoverX).
For control reactions testing specificity, we added ~200 ng of ERCC6 antiserum, which unfortunately did not appear to block its, DNA-dependent ATPase, likely because of inoperative inactivation of a critical acitivity site. Despite the lack of this desired control, the results obtained suggest that the addition of sub-stoichiometric amounts of NEK1 more than additively enhanced the overall ATP>ADP conversion attributable to ERCC6 produced by its DNA translocation function (Figure 8 – note that the DNA subtrate was added after the kinase/phosphorylation activation step of Nek1 (ADP-generating) was complete and thus only the ERCC6 ATPase remained. Perhaps the additional negative charge developing on the TSYSY patch upon NEK1 phosphorylation may loosen the contact with DNA enhance the overall ‘translocase’ activity of ERCC6. It is not clear how in general this would affect the TC-NER function(s) of this complex protein-machine. However, a model proposed for the E.coli homolog, Mfd, indicated a highly regulated process with mutliple rounds of rather ‘slow’ATP hydrolysis accompanied with conformational changes, for the initial assocition with the stalled EC (not present in our conditions of course). But these intramolecular rearrangements are likely involved in the discrimination between a EC that is simply ‘paused’ vs.one that is stalled at a DNA lesion [8] - the likely key difference being the presence of a significant lesion-induced distortion in the DNA helix.
Modeling of ERCC6-wt and SYSY mutant and its contact with DNA. Due to the lack of a crystallographic or cryo-EM structure for the DNA excision repair protein ERCC-6 sequence in its DNA-bound and unbound form, we use AlphaFold3 (Abramson, J et al. Accurate structure prediction of biomolecular interactions with AlphaFold3. Nature (2024)) for modelling the protein and protein-DNA complex. Here, we also studied some reference models to understand better the larger complexes like the human transcription-DNA repair coupling (PDB: 7OOP) (https://www.nature.com/articles/s41586-021-03906-4). To begin with, we used the complete ERCC-6 (Q03468 · ERCC6_HUMAN, https://www.uniprot.org/uniprotkb/Q03468/entry) sequence to investigate the structure of the protein in the bound and unbound state. Two models were generated with an original sequence and the other with mutations at the S624A, Y625A, S626A and Y627A residues. The goal was to understand the effect of these four mutations on the flexibility, inter- and intramolecular interactions, stability and flexibility of the protein structure in this DNA binding region of the ERCC-6. Here, the first study was focused on the unbound states (Figure 9a), and the model was built using the most recent version of the Alfafold3 tool. The AlphaFold3 model showed a predicted template modelling (pTM) score of 0.56, suggesting the overall structure predicted might be similar to the actual structure. However, the structural validation using the Ramachandran φ and ψ analysis, MolProbity score and the Qmean values suggested for structural optimisation. To address this challenge, these structures were subjected to a 1.0 µs classical molecular dynamics (cMD) simulation under an explicit solvent model; the details of the setup and the parameters are provided in the supplementary information. The original and the mutant model’s cMD trajectories were analysed, and the structural aspects were explored to seek insights into the structural dynamics of ERCC-6 in its original and mutated state. For the original sequence model, the protein Root Mean Square Deviation (RMSD) was found to fluctuate from 2-8Å accounting for a 6Å deviation, with a steep rise around 0.25 µs, reaching its highest during 0.6 µs, and then going down gradually till the end of the simulation. However, in the case of the mutant model, there were no sudden changes in the protein RMSD; it showed a slow and steady rise of about 1Å till the first 0.4 µs and later remained within 1Å, totaling a fluctuation of 2Å throughout the simulation duration. These limited fluctuations suggest a stable structure of the modelled protein (SI_Figure Ia). The same behavior was observed with the Root Mean Square Fluctuations (RMSF) of the individual residues of the protein structure, where the original sequence model showed an overall higher fluctuation, with the mutant model showing higher spikes in the loop regions, which is an obvious nature of the protein dynamics (SI_Figure Ib). These modelled proteins were subjected to structural validations before and after the simulations, where their secondary nature (SI_Figure Ic,d), Ramachandran analysis (SI_Figure Ie) and template modelling scores (SI_Figure If) were calculated and tabulated. The MolProbity score for the original sequence model improved from 1.76 to 1.70, and from 1.59 to 1.42 for the mutant sequence model; a lower MolProbity score shows improvement of the protein structure regarding steric clashes and geometric optimisation. Similarly, the Qmean scores improved to 0.66 and 0.68 for the original and mutant sequence models. The higher Qmean score indicates the sound quality of the protein structure model with regard to residue-residue distances matching closely to the homologous structures in the PDB databases. A close analysis of the mutated sequence S624A, Y625A, S626A and Y627A shows the loss of intramolecular interactions for the mutant sequence model (Figure 9b), which was anticipated due to the lack of sidechain in residue alanine. A dihedral analysis was performed to compare this behaviour. The αC atoms for these four residues in the original and mutant were analysed to find common ground. The dihedral angle analysis (Figure 9c) shows higher fluctuations in the mutant sequence (624A, 625A, 626A and 627A) model, which corroborates the fact that due to the lack of sidechains and thus the lack of intramolecular interaction leads to higher mobility (20 - 90 Å). The original sequence (624S, 625Y, 626S and 627Y) shows lower backbone dihedral fluctuations between 30 - 60 Å as sidechains stabilise this region. The mutant residue analysis for its RMSF corroborates that the SYSY domain shows higher fluctuations due to the flexibility, whereas the mutant (AAAA) domain lacks this structural feature (Figure 9d). In these initial experiments, we established the model and the structural nature of the ERCC-6 in its original and mutated state. The next step was to understand the effect of DNA's presence and how the protein-DNA interactions and loss of interactions affect the ERCC-6-mediated regulation.
The protein-DNA complex modelling and cMD simulations were performed similarly to those mentioned earlier, and details about methods and materials are provided in the SI. However, the analysis was extended for the DNA, and a deeper study was performed involving the energetics of the original and the mutated sequence models. The protein RMSD was analysed, the original sequence model showed a steep rise in the RMSD accounting for 2-3 Å between 0-250 ns, next spike in the RMSD was observed around 500 ns, but the average RMSD remains at 2 Å for the 1.0 µs. The mutant sequence model showed a slow rise in the RMSD over the first 500 ns, but remained within 2.0 Å, and shows a convergence in its fluctuations by remaining with 1.0 Å for the rest of the simulation (SI_Figure IIa). This RMSD fluctuation pattern is similar to the one observed in earlier experiments, except for the lower fluctuations that could be due to the presence of the DNA segment, stabilising this protein dynamics. The protein RMSF calculated for the complete trajectory showed a similar pattern of fluctuations except for some highly flexible regions around residues 790-810 and 890-910. Again, the lower RMSF for both structures indicate stabilisation of the protein models with the reduction of overall RMSF by about 2.0 Å when compared with the DNA bond and unbound form (SI_Figure IIb). The protein radius of Gyration (RoG) for the Original and the Mutant sequence mode remained between 25.25 to 26.25Å and 25.5 to 26.75Å, respectively, throughout the MDS. This indicates that the protein complexes are compact and highly stable (SI_Figure IIc). The αC atom dihedral for the residues 624-627 in the protein-DNA complexes was also analysed and it shows the characteristic high fluctuations for the mutant sequence model with a range of 20 – 80 Å along with several spikes in the fluctuations, whereas the original sequence model showed a comparatively stable composition with fluctuations between 40 – 80 Å (SI_Figure IId), this is strengths our understanding of the intra ad intermolecular interaction for the bound and unbound state of the ERCC-6 protein. In this study, the DNA segment with 32 base pairs in the form of duplex DNA is bound to the ERCC-6 protein; the simulations were able to sample a stable complex through the 1.0 µs MDS for the original and mutant protein sequence models (Figure 10a, f). Along with the protein structures, the DNA segment was also analysed for its structural integrity and interaction with the protein binding site, as suggested in the literature (10.7554/eLife.62117, https://www.nature.com/articles/s41586-021-03906-4). The DNA RMSD was calculated for the base pairs in both complexes; the RMSD in both cases was limited within 3.0 - 6.5 Å throughout the simulation trajectory (SI_Figure IIe). This was also supported by the DNA RoG where the DNA bound to the original protein sequence model was within the 16.5 - 19.5 Å and for mutant complex it was between 16.5 - 18.5 Å, for the DNA structures, RoG between 15-30Å is considered as highly stable and compact structure, indicating the higher stable complexes (SI_Figure IIf). The structural aspects were further validated similarly as discussed earlier, the original sequence model in complex with DNA had MolProbity, Qmean, TM and IDDT scores of 1.50, 0.70, 0.93 and 0.74, respectively, suggesting its stability and compact nature. The RC plot shows an acceptable range of favoured region, and RMSD to the initial pose from the MDS simulation was 2.37 Å, which is a promising number since it is a large protein with a duplex DNA complex (SI_Figure IIg,h). The mutant sequence model in complex with DNA had MolProbity, Qmean, TM and IDDT scores of 1.46, 0.68, 0.92 and 0.72, respectively, suggesting its stability and compact nature. The RC plot shows an acceptable range of favoured region, a bit higher compared to the original sequence model, and RMSD to the initial pose from the MDS simulation was 2.56 Å, which is suitable for a large protein in complex with the duplex DNA segment (SI_Figure IIg, i).
The presence of side chains at the interface of the ERCC6-DNA is crucial for the stability of this complex. We extracted these complexes' initial and final poses to investigate and explain this mechanism. Visual analysis of the original sequence model shows hydrogen bond interactions between the SYSY motif residues with the base pairs of the duplex DNA segment, the Ser626 forms an hydrogen bond interaction with DNA and this bond was found to stabilise throughout the MD simulation, apart from these interactions Tyr627 forms a hydrogen bond interaction with the base pairs (Figure10a,b). The MDS trajectory analysis has already established a compact complex for the original sequence model, but analysing the different modes and motion of the system over 1.0 µs MDS is difficult. We calculated the covariance matrix from the atomic coordinates to perform this analysis and identify the dominant motions and conformational changes. We then extracted the principal components (eigenvectors and eigenvalues) and projected these components for more straightforward interpretation of the standard modes using principal component analysis (PCA). The PCA plot shows three PCA components over the X-Y-Z axis with the initial and final state of the protein-DNA complex conformation from the MDS. The PCA analysis suggests two major components clustered around the final conformation (Figure 10c). Significant clustering could be observed over PC1 (between 1 and -2 over the x-axis), capturing the large-scale motion of the complex and suggesting one central cluster of stable conformations (SI_Figure IIIa). This explains the minor difference between the complex's initial and final pose, with the converged complex following initial fluctuations. A Dynamical Cross-Correlation Matrix (DCCM) plot was analysed for the trajectory to investigate the per-residue interaction stability, a complete scan and focused (S624, Y625, S626 and Y627) residue analysis was performed (Figure 10d and SI_Figure IIIb ). A Dynamic cross correlation maps (DCCM) plot highlights the correlated motions between the atoms and the residues in a given protein structure during the MDS, allowing for the exploration of positive and negative correlations, the collective motion of the residues, and deciphering the functional mechanism of the protein system. The DCCM analysis of the select residues from the ERCC-6 protein shows a positively correlated motion with a coefficient of 0.75 and 1.0 for the 1.0 µs MDS trajectory analysis of the original sequence model (Figure_10d). Whereas, the complete protein structure shows an overall satisfactory correlation coefficient ranging between -0.75 and 1.0 for most of the residues and 1.0 for the diagonal elements, explaining the stability of this complex (SI_Figure IIIb). A free energy landscape (FEL) analysis was performed to investigate the stability of the complex and its conformational states. Figure 10e shows several deep and shallow minima representing the highly stable and transforming conformations converging towards stable conformations. These show the free energy levels in the range of 1.5 to about 0.5 kcal/mol and below for some of the conformational ensembles (PC1:PC2:PC3; -20:5:0). It also shows a continuous minima transitioning from shallow to deeper minima leading to a deeper minima valley indicating a stable low energy conformation was achieved during the simulation. On the same lines, the mutant sequence model was examined. The visual analysis of the mutated sequence patch of S624A, Y625A, S626A and Y627A shows loss of interactions between the residues and the adjacent bases (Figure 10f and g), which was expected due to the lack of sidechain due to the induced mutation. However, the tight packing of the DNA segment in the binding domain allows for the interaction with the residues from the adjacent amino acids, like Thr575, which shows a stable interaction with the adjoining adenine from the DNA segment. Two-dimensional PCA presents an unclear picture about the clustering of the eigenvalues with the initial and the final state close, based on the two principal components (PC1 and PC2) (SI_Figure IIIc). To verify this observation, a 3D-plot for three PC’s were studied, which supports the initial reading as the significant conformation variations fall in 2-3 closely packed conformation buckets, leading to a low conformational deviation once the complex achieves a convergence as observed from the protein and DNA backbone RMSD (Figure 10h, SI_Figure IIa and e). The DCCM analysis of this trajectory indicates a positive correlation coefficient of about 0.25 for Ala626, but the diagonal coefficient is near 1.0 (Figure 10i). The DCCM analysis of the complete structure (SI_Figure IIId) shows a negative correlation coefficient for several regions, suggesting a higher fluctuation area of the complex. The loss of interaction, such as hydrogen bond interactions, of the given mutation patch has increased the dynamic motion of this portion of the backbone, allowing it to stay in the helical form instead of the sheet form for most of the simulation instances. The FEL analysis for the mutant sequence model showed a clear reflection of the PCA analysis, where the two distinct deep minima were observed and a low barrier transition was seen from the starting to the lowest energy conformation over the PC1 (Figure 10j). The FEL shows low energy conformations, indicating the complex enters a higher stable state, possibly due to a lack or loss of function.
In this study, the mutation of residues 624-627 (SYSY) has impacted the interaction with the bound DNA base pairs. It also affected the structural form of this protein patch, where the mutant model shows a string helical nature due to the presence of alanine. In contrast, the original sequence tends to form beta sheet-like interactions (Figure 11a, Geen= AAAA, Blue= SYSY). Our investigation focused on this patch and its surrounding region since the DNA segment finds several interaction points throughout its length. Several intra- and intermolecular hydrogen bonds were observed in both complexes. Hydrogen bond interactions are the intermolecular forces formed between donor-acceptor pairs. They are based on how distant the bond-forming heavy atoms are and the directionality of the covalent hydrogen atom. H-bond interactions maintain and hold base pairs, stabilise protein structures, and regulate DNA-protein interactions. In this case, we observed these hydrogen bond interactions between the ERCC-6 and the DNA segment where the Ser626 forms the H-bond with DNA bases. Still, these are not limited to residues of interest; the adjacent residues also interact with these bases (Figure 11b, c). The RMSF of the patch residues shows interesting fluctuations; the original sequence model shows low RMSF due to its stabilisation by forming hydrogen bond interactions with the adjacent DNA bases, owing to their side chains (Figure 11d). Whereas the mutant sequence shows higher fluctuations due to the lack of these H-bond interactions, these differences are quite noticeable given the tight packing of these regions (Figure 11e). The distance-based H-bond and the Dihedral were calculated for these models to ascertain our results. The mutant patch did not yield any results, which was evident due to the lack of side chains and the distance from the backbone was beyond the range of H-bond (2.5 to 3.7 Å). The original sequence model showed two prominent hydrogen bond interactions throughout the 1.0 µs MDS simulation. First, Ser626(OG)-DT1011(OP2), which belongs to the patch of interest; this H-bond showed high fluctuation but existed for most of the simulation towards the lower limit of 2.5 Å, the make and break nature is due to the flexibility imparted by the dynamic motion of the side chain and the bases (Figure 11f). Second Thr575(N)-DA1010(OP2), this was investigated to understand the stability of the complex, where the residues adjacent to the DNA segment, other than the SYSY patch, hold the complex together. This H-bond presents a strong interaction while staying within 2.5 to 3.7 Å for most instances (Figure 11f). In this case, the lack of sidechains limited our dihedral analysis to the backbone atoms. Hence, the αC were plotted over the simulated time. The plot in Figure 11g clearly indicates the stability of the original sequence model’s complex; here, the dihedral angle is highly restricted, within 40° (40-80 on the Y-axis) throughout the simulation, indicating the stability of the complex and thus higher interaction with the DNA bases. Meanwhile, the mutations led to higher dihedral motion; hence, its backbone movement is less stable, indicating a lack of interaction with the adjacent DNA bases, which also implies that this mutation could lead to the loss of function.
The comple loss of ATPase activity for the SYS/4A ERCC6 mutant, combined with the apparent activity dependence on phosphorylation by NEK1, prompted us to monitor via modeling and molecular dynamics the structure of the protein and possible contact with DNA at that specific site. This revealed that the SYSY hydroxy patch that is the main consesus target of NEK1 forms an actual springlike machine that is presumed to function in translocation (or unwinding) consuming ATP. It also may be a very active part of protein carrying out extensive intramolecular displacements to either move along the DNA helix, or potentially dragging along the stuck EC. The high intramolecular rearrangements at theis active site were further confirmed in molecular dynamics simulations and interpretation of RMSD and RMSF after 1 µs, showing that in contrast to the wt, the SYS/4A mutant is essntially ‘frozen’ and incapable of movement.
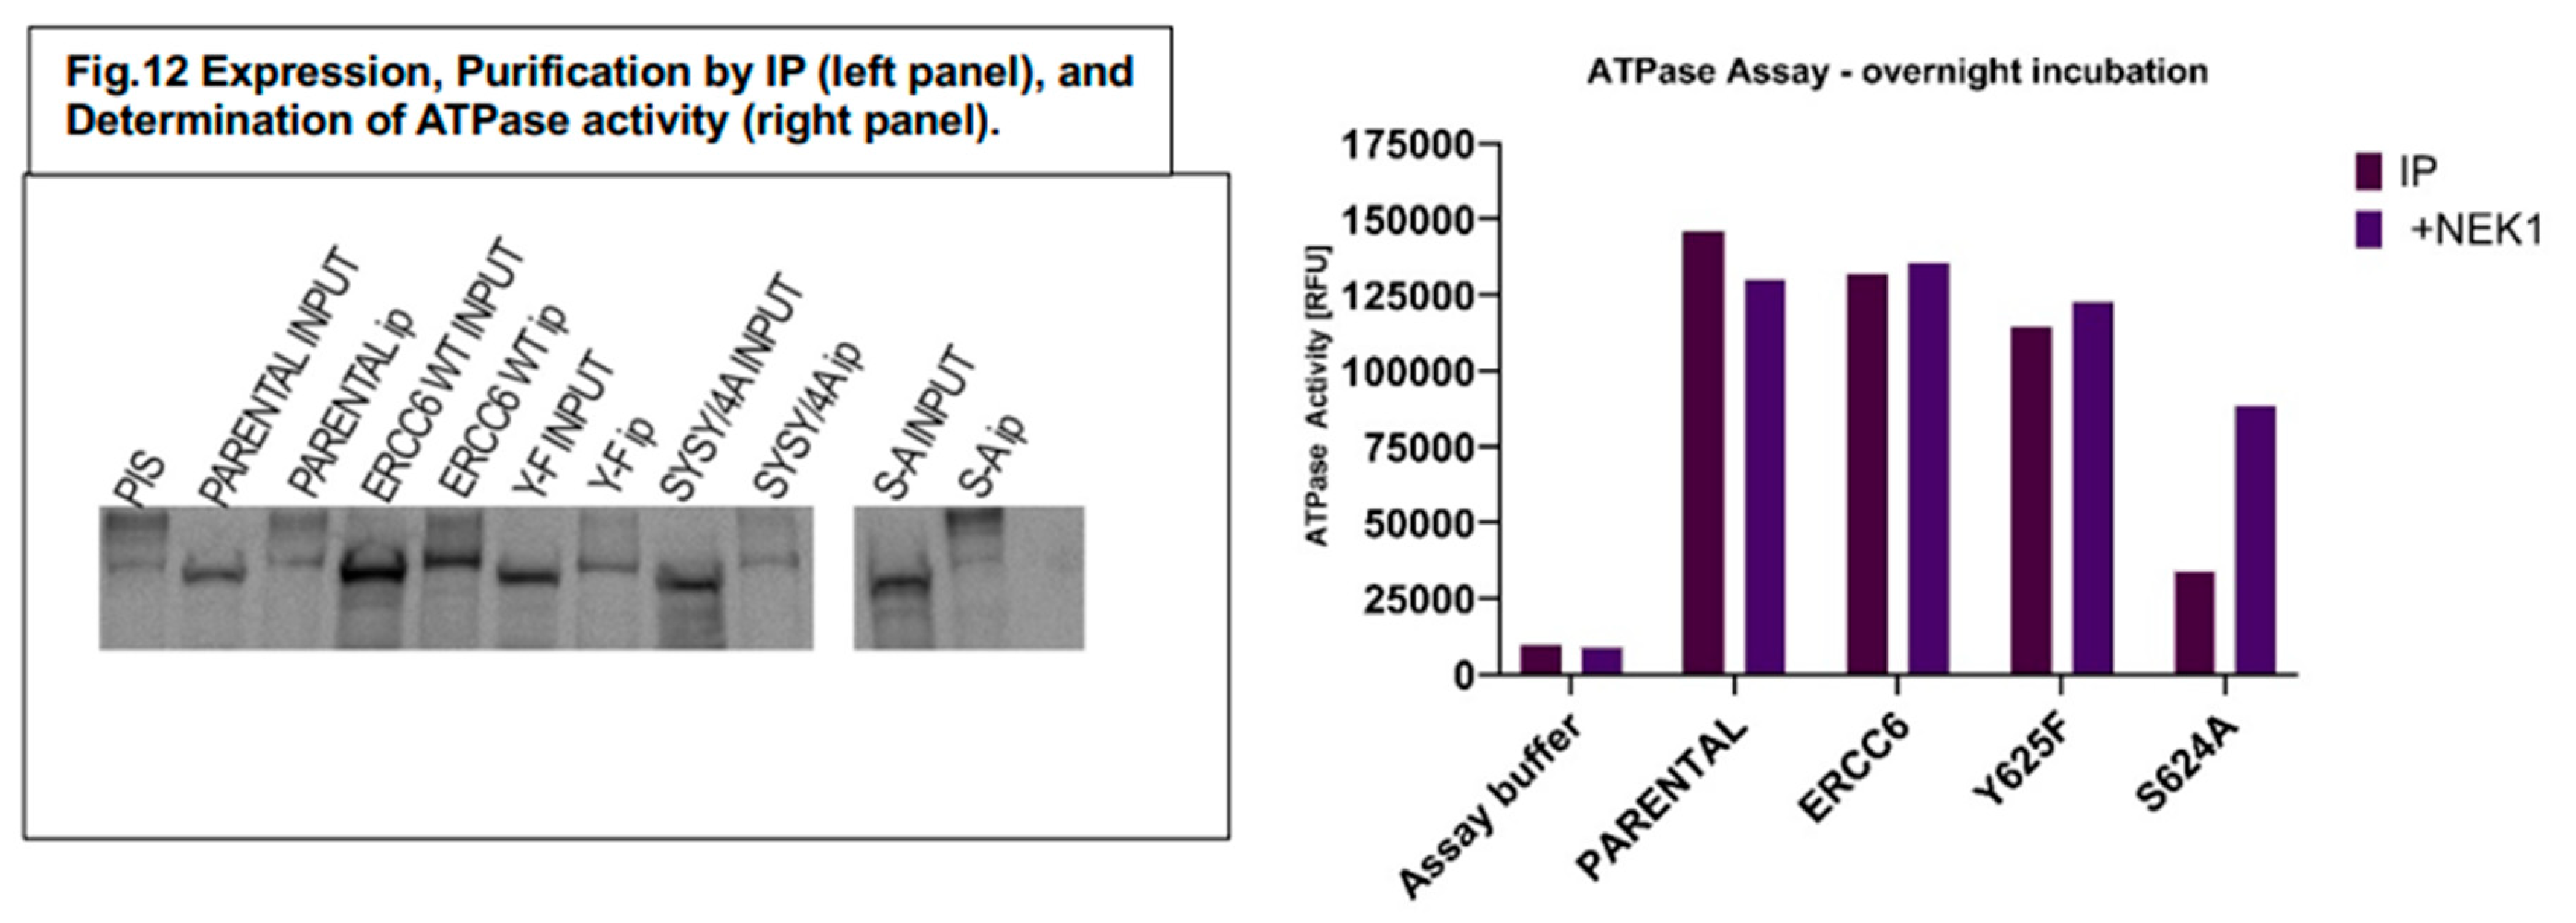
In vitro ATPase activity of the various mutant ERCC6. We IP’d the different ERCC6 versions and carried out ATPase assays on ‘bound’ ProteinA/G beads, with and w/o a small amount of NEK1 to determine their activation. Due to the small amount of recovered proteins (panel B), the ATPase reactions were carried out overnight. Endogenous ERCC6 (parental) and wt- overexpressed protein in Hek293 gave essentially the same signal and no dependence on added Nek1 (as expected since these are likely already phosphorylated in vivo). The Y-F is mostly a dead protein that likely contributes no activity over the endogenous ERCC6 in vivo, suggesting that the Y625 is critical for functioning. The S624A is also mostly inactive, but in a long incubation, it can be resuscitated significantly in presence of Nek1 stimulation. So, we suggest that the Y625 is critical for the ERCC6 overall catalytic activity in presence of DNA (ATPase), while the S624 is likely the main residue that is most subject to regulation by Nek1 and can fine-tune/orchestrate its function.
Figure 12.
Expression, Purification by IP (left panel), and Determination of ATPase activity (right panel).
Figure 12.
Expression, Purification by IP (left panel), and Determination of ATPase activity (right panel).
Delayed recovery of rRNA expression after UV in the Y625F mutant cells. Our hypothesis derived from the experiments so far on the roles of ERCC6 in TC-NER (both PolII and PolI), and recovery of transcription and processing of rRNA genes is that the overexpressed wt- protein should hasten these processes, while the poorly active Y625F mutant, that cannot be phosphorylated by NEK1, should act as a dominant negative machine in recovery from UV. We set to determine if this is true with a 3H-Uridine pulse labeling time course after a 10 sec UV exposure (or non-irradiated controls) in which the cells were labeled during the last 20 min of each time point. The result confirmed that the wt-ERCC6 overexpressing Hek293 cells fully recovered transcriptional activity and processing of mature 28S and 18S after 2h. In contrast, the Y625F expressing cells barely recovered full PolI transcriptional activity after 6h. Moreover, the ratio of 32S to 28S did not yet reverse even at 6h, and there was some accumulation of the 41S pre-rRNA. Interestingly, a reflection of this phenomenon was visible even at the level of EtBr staining of the major rRNA species (typically stable) in that there was a visible progressive decrease of the 45S precursor in the Y>F OE cells up to the point where PolI transcription restarts at 3h, whereas that did not happen in cells with OE-ERCC6. These data confirmed the critical role of active, presumably phosphorylated Y625, after recovery from UV. It would be a mistake to underestimate the significance of a few hours delay in recovery of the expression of rRNA (mature) transcripts for cells’ viability, since the generation of rRNA is coordinated with the Integrated Stress Response (ISR) enacted at transcriptional and translational levels for most ribosomal genes [53]. Restoring normal functionality in a cell that typically replicates in <24h with such a a sreious delay may result in the (observed) loss of cell replicative capacity and even viability – note however that the Y>F cells grow well and syntheize rRNA at about the same rate as the wt-OE cell (or ‘parental’) in the absense of UV.
It is important to point out that the expression and stability of the Y625F mutant protein is not different than the wt, and thus, it is its activity that is rather defective in rRNA expression after UV recovery.
Figure 13.
Top. Determination of rRNA synthesis and processing rates in Hek293 expressing wt or Y625F ERCC6. 105 cells plated in 24-wells were exposed to UV for 10s and allowed to recover for the indicated times and labeled during the last 20 min of each time point with 50µCi/ml 3H-Uridine. RNA was isolated, fractionated on a 1.2% agarose gel, then processed for fluorography with PPO. Bottom. Expression and stability of wt and Y625F after UV.
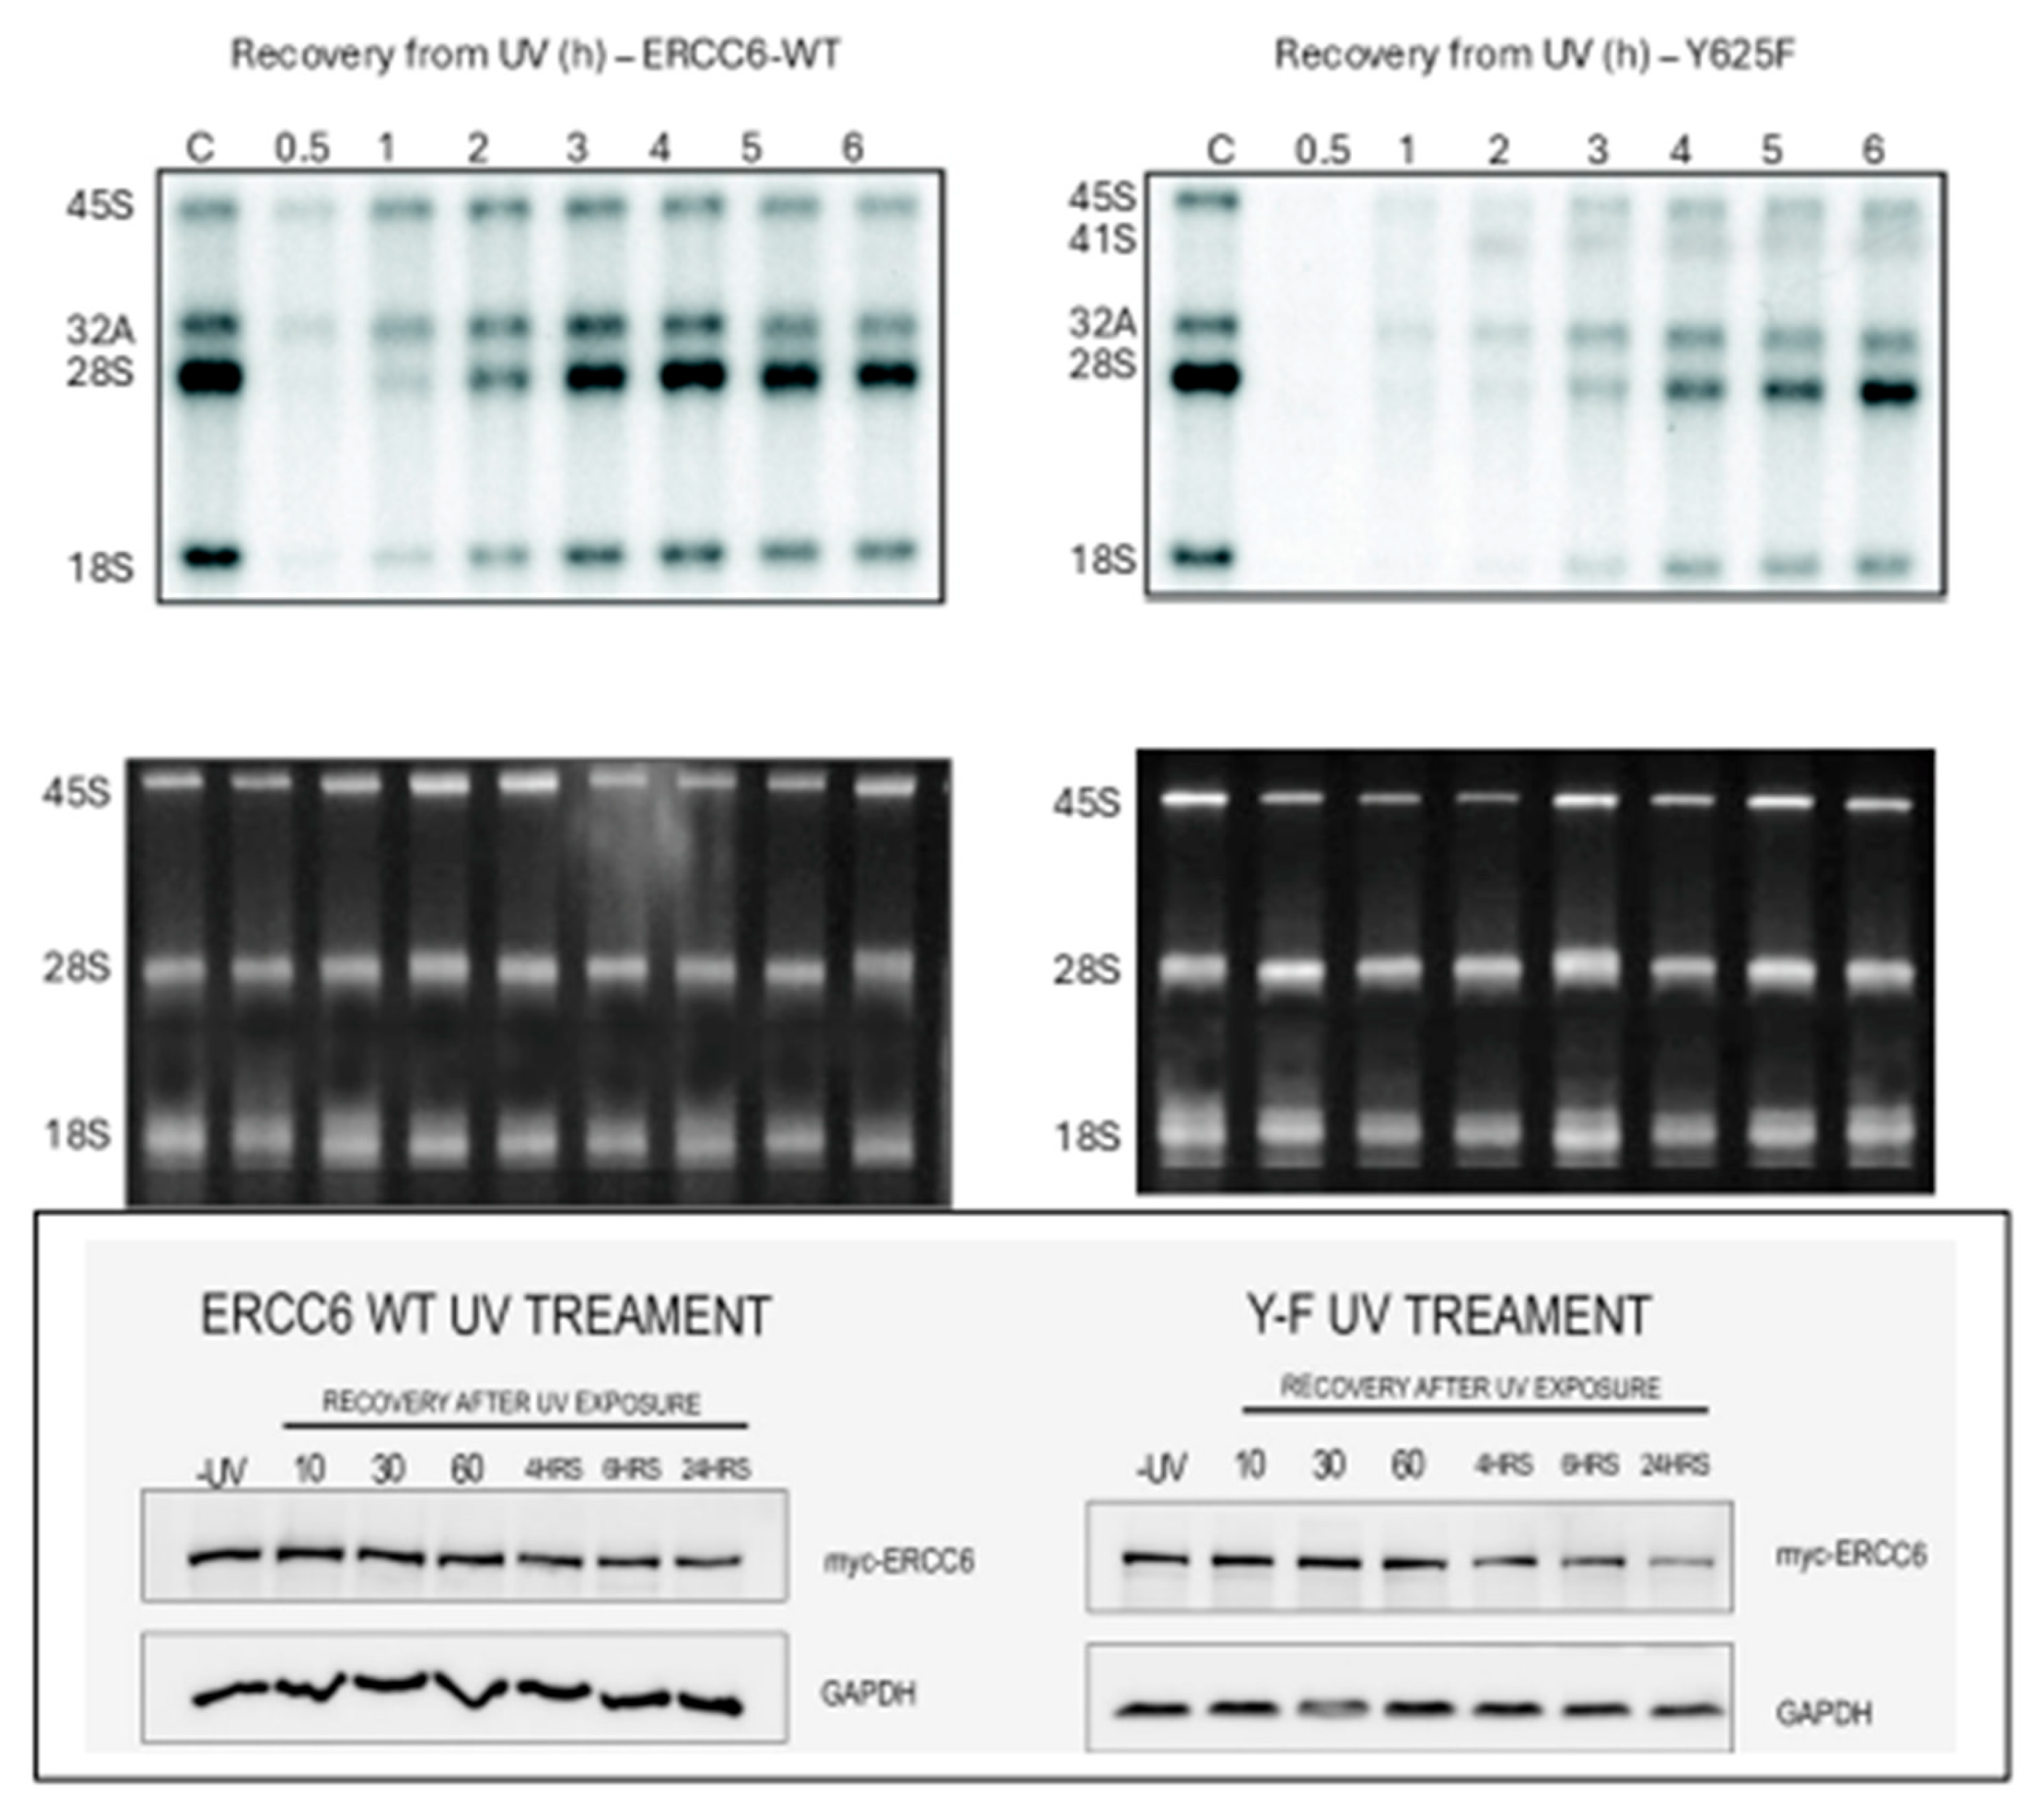
Figure 14.
Growth curves of Hek293 expressing wt of mutants ERCC6 following increasing times of UV exposure (top panel).
Figure 14.
Growth curves of Hek293 expressing wt of mutants ERCC6 following increasing times of UV exposure (top panel).
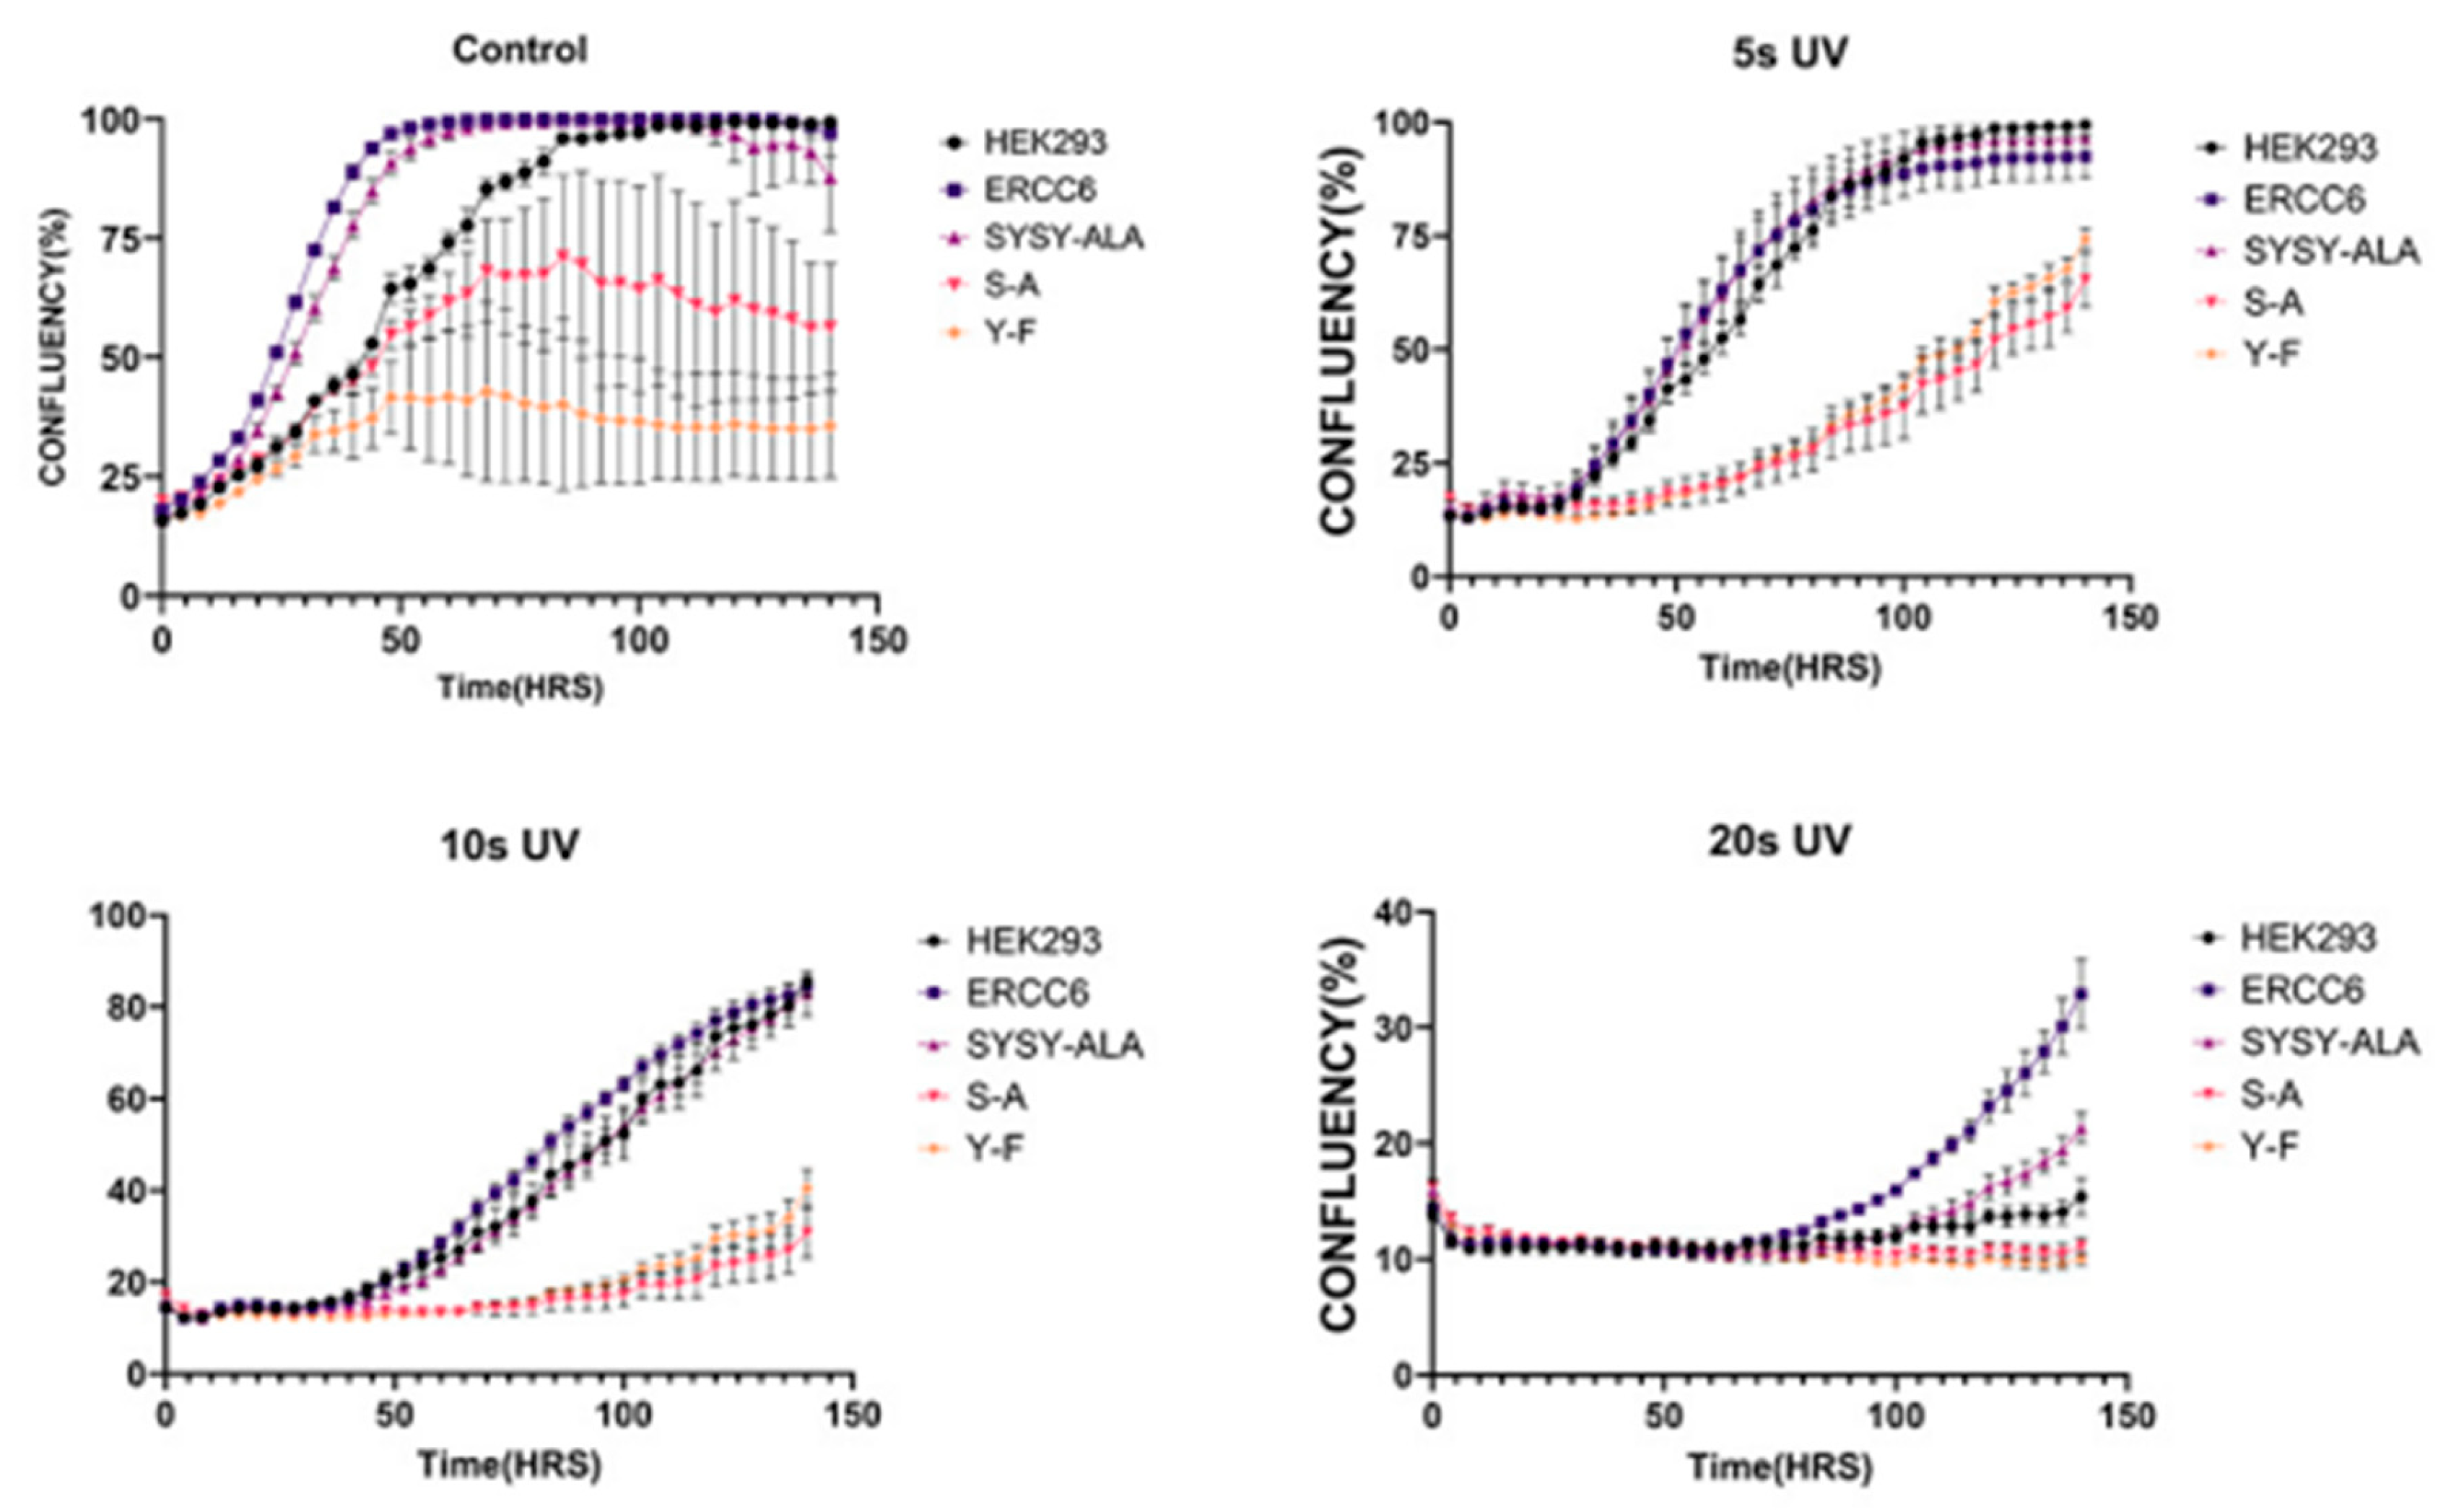
The different ERCC6 mutants-carrying lines were tested for their sensitivity to UV, expecting they would exert dominant effects over the endogenous wt-protein. Of course, we first examined their growth rate w/o UV (Figure 15). Interestingly, SYSY/4A (SYSY-ALA) grew well and no different than parental HEK293, in contrast to all the mutants and even the OE-WT (ERCC6) that showed partial growht impairment. This indicates that even under normal unchallenged conditions ERCC6 expression, and particularly the dominant-negative mutants, confer growth impairments, except for the SYSY/4A completely unfunctional protein. After UV irradiation, all ERCC6 OE mutants were much more sensitivie to all doses (exposure time in sec)except for the OE-WT that conferred significant resistance even at 20s exposure, as could be predicted. While the effects on UV sensitivity were anticipated given the critical role of ERCC6 in TC-NER, the lack of growth inhbition w/o UV in the OE-SYSY/4A, which is a completely non-functional protein, may seem odd. So, an analogy seems appropriate. The NER ‘core mechanism’ consists of a pair of spacely-defined cuts bracketing the lesion, and the replacement of the offending flap followed by re-syntesis of the corrected complementary strand. The analogy is that a pair of rusty scissors that poorly open/close is not a huge problem because they are just not used while there is still the endogenous functional pair (ERCC6-WT). But a pair of not-sharp scissors (The S-A or Y-F dominant mutants) can be a serious problem even in non-irradiated cells. Until, of course, there is lot of work to be done (as after UV) in which case, the cells are forced to use also the rusty scissors (SYSY/4A) - and then they don't do that well.
Prolonged activation of the ISR in the Y625F expressing cells. The delayed recovery of rRNA expression in the Y625F expressing cells revoring from UV was expected to result in prolonged activation of the ISR. In fact, all the expression of all ISR genes we tested were affected by the delayed recovery of rRNA expression in the Y625F mutant (Figure 16). Notably, the strong increased ATF3 expression in the Y625F mutant may play a key role in maintaining suppression of some 70% of PolII genes after UV as a key ISR mechanism to UV [54], but with the important exception of ribosomal proteins genes, like RPL7A. But interestingly, GADD34, a eIF2 alpha phosphatase that turns off the ER stress that was activated by GCN2 or PERK after UV [55], showed rapidly increased expression after 0.5h of recovery and was still somewhat elevated after 12h. This is perhaps an attempt to maintain ribosomes biogenesis by maintaining partial translation of ribosomal proteins and utilizing a pre-existing rRNA pool to compensate for the delayed recovery of newly synthesized mature rRNA species, despite the fact that the ‘call’ for increased expression of mRNA for ribosomal proteins was not as robust in the recovering Y625F mutants (e.g., RPL7A). XBP1, or X-box binding protein 1, a transcription factor critical for protecting cells from endoplasmic reticulum (ER) stress, and is specifically ‘processed’ via the IRE1 pathway, and that plays a key role in regulating genes involved in immune and cellular stress responses, showed the Y625F mutant cells retained more of the ‘unspliced form’ (uXBP1) after UV, and thus slower ‘coping’. Although the ‘spliced form’ (sXBP1 – derived from IRE1-processing) is believed to be the ‘master regulator’ of the ER stress genes, it is now believed that the uXBP1 has an underappreciated role [56]. In any case, it was clear that the delayed recovery of mature rRNA expression in the Y625F mutant during recovery from UV had a dramtic effect on the ISR as a whole, and consequently viability. UV exposure can at the same time cause mitochondrial damage and oxidative stress that, in toto, can augment the ISR in the Y625F mutant expressing cells, while the arrest in ribosomes biogenesis and related ‘translation’ stress form P-eIF2 can be sensed in the ER as a UPR.
Evidence for a conserved evolutionary pathway in the regulation of ERCC6/Rad26 activity by NEK and phosphorylation of the Hyrdoxy patch. The RAD26 gene is not essential for viability in the yeast Saccharomyces cerevisiae, meaning yeast cells can survive and grow without it. However, its absence leads to defects in DNA repair and increased sensitivity to DNA damage, but primarily bulky adducts[57,58]. In fact, while Rad26 activities in TC-NER are believed to be similar [58]to the mammalian ERCC6, there are also some key differences:
Non-essential function: Unlike its human homolog CSB, a mutation in yeast's RAD26 does not cause hypersensitivity to ultraviolet (UV) light under normal conditions [59]. This is because yeast has an alternative and highly efficient DNA repair pathway (Global Genome Repair, or GGR) that compensates for the loss of Rad26.
Increased sensitivity under specific conditions: When the alternative GGR pathway is also disabled (such as in a rad16∆ rad26∆ double mutant), the yeast becomes much more sensitive to DNA-damaging agents like UV light. Our work proceeded under these premises.
Based on the assumption that the conserved Hydroxy patch would serve a similar structure/function relationship, we conducted a CRISPR-mediated SDM of residues T447 and Y448 of Saccharomyces cerevisiae Rad26 correspond to residues S624 and Y625 within the TSYSY box of human ERCC6. To determine the role of the TSYSY box in transcription-coupled repair (TCR), we substituted Rad26 residues T447 and Y448 with either alanine (A) or glutamic acid (E) in rad16Δ cells, which are defective in global genomic repair (GGR) and thus allow unambiguous analysis of TCR [60].
Single mutations—rad26-T447A, rad26-Y448A, rad26-T447E, or rad26-Y448E—had little effect on cellular UV sensitivity (Figure 16). In contrast, the double mutants rad26-T447/Y448A and rad26-T447/Y448E displayed significantly increased UV sensitivity, indicating that these substitutions compromised Rad26’s TCR function. As both AA and EE substitutions displayed greate UV sensitivity, one possible explanation is that activity regulation (perhaps DNA translocation) may require cycles of phosphorylation and de-phosphorylation, for which examples in other proteins are known (e.g., eIF4E in translation initiation cycles [61]. Of course, we had to guess that a kinase exists for the phosphorylation of those specific residues, wherein the yesat Nek homologue is Kin3. This kinase has obvious actvities in regulating the cell cycle, but also in sensitivity to certain DNA damage types and is involved in DNA adducts damage response [62], although sensitivity to UV (just as for Rad26) does not seem strong, which we confirmed independently in 3 different strains (not shown). And direct proof of phosphorylation of these reisdues by Kin3 is very difficult in yeast.
To study directly the impact of these Rad26 mutations on TC-NER (of Pol2 genes in this case, which is much simpler for the yeast genome complexity), we directly measured the impact of rad26-T447/Y448A on TCR of UV-induced cyclobutane pyrimidine dimers (CPDs) using our LAF-seq technique [15]. In rad16Δ cells, rapid CPD repair occurred immediately downstream of the major transcription start site (TSS) on the transcribed strand (TS) of the moderately transcribed RPB2 gene (Figure 17) and the highly transcribed YEF3 gene (Figure 2D). Deletion of RAD26 (rad26Δ) markedly slowed TCR (Figure 17, compare B with A, and E with D). The rad26-T447/Y448A mutation reduced TCR to a similar extent as rad26Δ (Figure 17, compare C with B, and F with E), indicating that rad26-T447/Y448A effectively abolished Rad26’s TCR activity.
3. Discussion
DNA damage poses a significant threat to cell’s life and must be repaired to preserve genome integrity. During transcription, RNA polymerases (RNAPs) actively patrol the DNA to identify bulky lesions and initiate their repair. In proliferating eukaryotic cells, the majority of transcription involves the synthesis of ribosomal RNA by RNAP I (Pol I), making Pol I activity crucial for cell survival following DNA damage. High-resolution electron cryomicroscopy studies were carried out to determine the structure of Pol I stalled at a UV-induced lesion, the cyclobutane pyrimidine dimer (CPD), revealing how the enzyme handles this critical DNA damage. And was found that Pol I gets stalled when the lesion reaches specific residues around the active site near the bridge helix that contribute to CPD-induced arrest. Then, PolI, or PolII, must be towed away from th CPD in order for the excision machinery to handle the damaged strand – an ativity largely accomplished by ERCC6[63].
Our study began in earnest as an investigation of the role of ERCC6 in aiding recovery of transcription after UV exposure, initially of the pre-rRNA which is the most aboundant and rapidly made species (~2 min) in the cell. Surprisingly we later discovered that scattered elements of this phenomenon were published as early as ~50 years ago [64] from observations of pre-rRNA loss of transcription and aberrant processing upon different doses of UV. Just a few years later, this was reported as a remarkable compounding early defect in cells from individuals with Cockayne's syndrome [65]. We arrived at this from a totally independent angle, while studying the effect of a powerful inhibitor of the TLKs when testing its synergistic lethal effects upon UV, while extending previous studies [19,37]. We were determined to find a rapid way of testing the recovery of transcription mediated via TC-NER in cells exposed to UV damage +/- addition of J54, and concluded to study this directly via incorporation of H3-labeled uridine. We did not anticipate the concomitant loss of pre-rRNA processing and its recovery delay from inhibition of TLKs, even though this phenomenon was well known and ascribed as part of a more complex process known as the Integrated Stress Response (ISR) enacted at transcriptional and translational levels for most ribosomal genes [53]. The fact that inhibiting TLK1 may delay the recovery of PolI transcripts, as well as precursor rRNA processing, is not that surprising per se, but the question is what might the mechanism be? Our working hypothesis was that this results from reduced ERCC6/CSB/A activity, previously implicated in rRNA processing and ribosomes assembly[66] dependent on the TLK1>NEK1>ERCC6 axis[67]. In fact, it is important to point out that there is strong evidence that CSB is a critical component of PolI transcription [29,30] beside its more established roles [31,32,33,34,35] in TC-NER when PolII is arrested at CPDs of ‘protein-coding’ genes. Apart from its constituents, this process was long known to occur from exposure to many stress/toxic inducers (not just UV) and be coordinated with ribosomes biogenesis [53,68]. Note that the temporary inhibition of rRNA expression after UV-induced Pol I arrest has almost no impact on the available number of ribosomes in the cells, but it is the dysgenesis that ensues that triggers the ISR and overall arrest of cell proliferation.
The involvement of ERCC6 in recovery of PolI transcription and associated pre-rRNA processing, possibly by towing away the stuck EC from CPD lesions, was then inferred from its potential regulation by the protein kinase NEK1, which we have been studied for several years as one of the principal downstream mediators of TLK1 activitites. While sifting through the literature on the 11 human NEKs, we discovered the reported interaction between NEK4 and ERCC6 [42,47] while the converse has never been reported. We thus decided to test the potential in teraction between the parolog NEK1 with ERCC6 by coIP, which readily revealed their co-enrichment.
The residues in ERCC6 phosphorylated by NEK1 were estabilished directly by IVK/MS, but this just confirmed its predicted hydroxy patch (TSYSY) where each residue was phosphorylated, as determined by MS/MS ion-fragmentation. The signifcance of the highly efficient phosphorylation of each of these residues for the overal activity of the protein was established by the complete loss of invitro of ATPase activity when thee residues were changed to 4; but this more likely altered the structure of the protein and its interaction with DNA (likely both double-and single-strand). The modeling work indeed confiremed this to be the case. Therefore, the substitution of every residue in the hydroxy patch could suggest a specfic role for their NEK1-mediated phosphorylation, and we then implemented SDM-targeted of phosphorylation of the S524 and Y625 that are most highly conserved from yeast to mammals. While, the loss of phosphorylation of these 2 residues could not be verified with P-specific antisera that are currently no available, their singnficance was immediately evident from the phenotypes resulting from their dominant expression in Hek293 cells, and particularly their remarkable loss of viability after even low UV doses, and from their delayed recovery of PolI transcription and recovery of rRNA processing.
A remarkable feature of this regulatory mechanism we have uncovered is its presumed high evolutionary conservation, from yeast to humans. Not only is ERCC6 highly conserved with its yeast paralog Rad26, but the high conservation of the ‘hydroxy patch’ suggests a similarity of function and regulation. In S.Cerevisiae, the closest Nek1 homolog is Kin3, and while this kinase was originally identified as having a function in mitosis, it was soon idetified as having important roles in DNA Repair (weakly UV, more so base-adducts [62]; in addition to ribosomes biogenesis [69,70]. And while evidence phosphorylation and possibly regulation of RAD26 via a kinase was clearly suggested (based on protein mibility shift) its regulatory kinase(s) during DNA damage remained unknown but was affected via Mec1 but not by the downstream checkpoint kinases, Rad53 and Chk1 [71] – likewise, in mammals, Nek1 is upstream and not downstream of ATR [52]. However, since S. cerevisiae has no homolog of TLK, the identity of KIN3 upstream effector kinase remains to be established. We have mentioned that a key feature in the initial recognition and regulatory steps of TC-NER is the ability to distinguish between a ‘paused’ vs a ‘stalled’ Polymerase. In this context it is important to note that KIN3 was found to directly interact (affinity chromatography) with SUA7 (the S.Cerevisiae TFIIB) that is known to modulate PolII pausing/elongation via a model invoking activator-dependent conformational changes in TBP-TFIIB interaction (rev. in [72]). Indeed, Sua7 has roles in the relationship between the holocomplex, Pol II pausing, and TC-NER, that is complex and involves several key players in transcription and DNA repair. SUA7 is a protein involved in DNA repair, that interacts with UVSSA, a protein that recruits the deubiquitinating enzyme USP7 to TC-NER complexes. This complex is essential for stabilizing the CSB protein as a crucial component of TC-NER. Pol II pausing, a brief halt in transcription elongation, is a common mechanism for regulating gene expression, while TC-NER is initiated when Pol II stalls at a lesion. The complementation of our mammalian cells initial studies on PolI-TC-NER with those in yeast of PolII-TC-NER clealry suggests a highly conserved role for the regulation of ERCC6 via the Hydroxy patch DNA-interacting domain and the general transcriptional ECs arrested at lesions. Remarkably, medical genetic evidence exists, based on (LOH homozygous) LOF mutations of various ‘seriousness’ of penetration leading to pathological CS, as opposed to milder conditions, occur from nonsense-generated truncations beyond the first 500 residues[73]
Author Contributions
All authors – O.O., R.C., C.L., S.L., A.D.B. contributed experiments and data analysis and interpretation; writing of the draft manuscript; A.D.B and S.L. also contributed also to funding acquisition and investigation direction.
Funding
This work was supported by a DoD-PCRP grant W81XWH-17-1-0417 and a Chancellor Pathway grant of LSU Health Shreveport to ADB; and a joint LCRC grant (CCRI6 2022 program) to ADB and SL.
Institutional Review Board Statement
NA.
Informed Consent Statement
NA.
Data Availability Statement
Description of all data and materials can be found in the referenced article. No additional data have been withheld from the public.
Contributors:
We wish to recognize the help of Camille Canon of the Genomics Core facilities (RRID:SCR_024775); Brian Latimer in the INLET (RRID:SCR_024990) for help with the Incucyte; Xinggui Shen, PhD - Core Director Analytical Redox Biology Sub-Core, Center for Redox Biology and Cardiovascular Disease (RRID:SCR_024778) for expert MS analysis. R.C. acknowledges the use of the Computational facilities at UCL and the Computational Shared Facility (CSF3) at the University of Manchester.
Declarations of Interest:
Authors declare no conflicts of interest. A patent: Targeting the TLK1/NEK1 axis in prostate cancer“: United States Patent, Patent Application No.: US16/834,061 that includes J54 was awarded 07-24-2023 to LSUHS on behalf of ADB, but there are currently no licensing agreements.
References
- Svejstrup, J.Q. Mechanisms of transcription-coupled DNA repair. Nat. Rev. Mol. Cell Biol. 2002, 3, 21–29. [Google Scholar] [CrossRef] [PubMed]
- Spivak, G. Transcription-coupled repair: an update. Arch. Toxicol. 2016, 90, 2583–2594. [Google Scholar] [CrossRef] [PubMed]
- Orren, D.K.; Dianov, G.L.; A Bohr, V. The human CSB (ERCC6) gene corrects the transcription-coupled repair defect in the CHO cell mutant UV61. Nucleic Acids Res. 1996, 24, 3317–3322. [Google Scholar] [CrossRef] [PubMed]
- Anindya, R.; Aygün, O.; Svejstrup, J.Q. Damage-Induced Ubiquitylation of Human RNA Polymerase II by the Ubiquitin Ligase Nedd4, but Not Cockayne Syndrome Proteins or BRCA1. Mol. Cell 2007, 28, 386–397. [Google Scholar] [CrossRef]
- Selby, C.P.; Sancar, A. Human Transcription-Repair Coupling Factor CSB/ERCC6 Is a DNA-stimulated ATPase but Is Not a Helicase and Does Not Disrupt the Ternary Transcription Complex of Stalled RNA Polymerase II. J. Biol. Chem. 1997, 272, 1885–1890. [Google Scholar] [CrossRef]
- Khobta, A.; Sarmini, L. Transcription-Coupled Nucleotide Excision Repair: A Faster Solution or the Only Option? Biomolecules 2025, 15, 1026. [Google Scholar] [CrossRef]
- Lefkofsky, H.B.; Veloso, A.; Ljungman, M. Transcriptional and post-transcriptional regulation of nucleotide excision repair genes in human cells. Mutat. Res. Mol. Mech. Mutagen. 2015, 776, 9–15. [Google Scholar] [CrossRef]
- Kang, J.Y.; Llewellyn, E.; Chen, J.; Olinares, P.D.B.; Brewer, J.; Chait, B.T.; A Campbell, E.; A Darst, S. Structural basis for transcription complex disruption by the Mfd translocase. eLife 2021, 10. [Google Scholar] [CrossRef]
- Kou, Y.; Shboul, M.; Wang, Z.; Shersheer, Q.; Lyu, Z.; Liu, P.; Zhao, X.; Tian, J. : Novel frame shift mutation in ERCC6 leads to a severe form of Cockayne syndrome with postnatal growth failure and early death: A case report and brief literature review. Medicine (Baltimore) 2018, 97(33), e11636. [Google Scholar] [CrossRef]
- Scheibye-Knudsen, M.; Mitchell, S.J.; Fang, E.F.; Iyama, T.; Ward, T.; Wang, J.; Dunn, C.A.; Singh, N.; Veith, S.; Hasan-Olive, M.; et al. A High-Fat Diet and NAD + Activate Sirt1 to Rescue Premature Aging in Cockayne Syndrome. Cell Metab. 2014, 20, 840–855. [Google Scholar] [CrossRef]
- Wilson, D.M., 3rd; Bohr, V.A. : Special issue on the segmental progeria Cockayne syndrome. Mech Ageing Dev 2013, 134(5-6), 159–160. [Google Scholar] [CrossRef] [PubMed]
- Khalil, M.I.; Ghosh, I.; Singh, V.; Chen, J.; Zhu, H.; De Benedetti, A. NEK1 Phosphorylation of YAP Promotes Its Stabilization and Transcriptional Output. Cancers 2020, 12, 3666. [Google Scholar] [CrossRef] [PubMed]
- Singh, V.; Connelly, Z.M.; Shen, X.; De Benedetti, A. Identification of the proteome complement of humanTLK1 reveals it binds and phosphorylates NEK1 regulating its activity. Cell Cycle 2017, 16, 915–926. [Google Scholar] [CrossRef] [PubMed]
- Kamelgarn, M.; Chen, J.; Kuang, L.; Arenas, A.; Zhai, J.; Zhu, H. Gal J: Proteomic analysis of FUSinteracting proteins provides insights into FUSfunction its role, i.n.A.LS. Biochim Biophys Acta Epub. 2016, 1862(10), 2004–2014. [Google Scholar] [CrossRef]
- Gong, W.; Li, S. Rpb7 represses transcription-coupled nucleotide excision repair. J. Biol. Chem. 2023, 299, 104969. [Google Scholar] [CrossRef]
- Groth, A.; Lukas, J.; Nigg, E.A.; Silljé, H.H.W.; Wernstedt, C.; Bartek, J.; Hansen, K. Human Tousled like kinases are targeted by an ATM- and Chk1-dependent DNA damage checkpoint. EMBO J. 2003, 22, 1676–1687. [Google Scholar] [CrossRef]
- Li, Y.; DeFatta, R.; Anthony, C.; Sunavala, G.; De Benedetti, A. A translationally regulated Tousled kinase phosphorylates histone H3 and confers radioresistance when overexpressed. Oncogene 2001, 20, 726–738. [Google Scholar] [CrossRef]
- Sen, SP; De Benedetti, A. TLK1B promotes repair of UV-damaged DNA through chromatin remodeling by Asf1. BMC Mol Biol 2006, 7, 37. [Google Scholar] [CrossRef]
- Takayama, Y.; Kokuryo, T.; Yokoyama, Y.; Ito, S.; Nagino, M.; Hamaguchi, M.; Senga, T. Silencing of Tousled-like kinase 1 sensitizes cholangiocarcinoma cells to cisplatin-induced apoptosis. Cancer Lett. 2010, 296, 27–34. [Google Scholar] [CrossRef]
- Singh, V.; Bhoir, S.; Chikhale, R.V.; Hussain, J.; Dwyer, D.; Bryce, R.A.; Kirubakaran, S.; De Benedetti, A. Generation of Phenothiazine with Potent Anti-TLK1 Activity for Prostate Cancer Therapy. iScience 2020, 23. [Google Scholar] [CrossRef]
- Ghosh, I.; Kwon, Y.; Shabestari, A.B.; Chikhale, R.; Chen, J.; Wiese, C.; Sung, P.; De Benedetti, A. TLK1-mediated RAD54 phosphorylation spatio-temporally regulates Homologous Recombination Repair. Nucleic Acids Res. 2023, 51, 8643–8662. [Google Scholar] [CrossRef]
- Bhoir, S.; Ogundepo, O.; Yu, X.; Shi, R.; De Benedetti, A. Exploiting TLK1 and Cisplatin Synergy for Synthetic Lethality in Androgen-Insensitive Prostate Cancer. Biomedicines 2023, 11, 2987. [Google Scholar] [CrossRef] [PubMed]
- Daniel, L.; Cerutti, E.; Donnio, L.M.; Nonnekens, J.; Carrat, C.; Zahova, S.; Mari, P.O. Giglia-Mari G: Mechanistic insights in transcription-coupled nucleotide excision repair of, r.i.b.o.s.o.m.a.l.D.NA. Proc Natl Acad Sci U S A 2018, 115(29), E6770–e6779. [Google Scholar] [CrossRef] [PubMed]
- Sanz-Murillo, M.; Xu, J.; Belogurov, G.A.; Calvo, O.; Gil-Carton, D.; Moreno-Morcillo, M.; Wang, D.; Fernández-Tornero, C. Structural basis of RNA polymerase I stalling at UV light-induced DNA damage. Proc. Natl. Acad. Sci. 2018, 115, 8972–8977. [Google Scholar] [CrossRef] [PubMed]
- Aubert, M.; O’Donohue, M.F.; LeBaron, S.; Gleizes, P.-E. Pre-Ribosomal RNA Processing in Human Cells: From Mechanisms to Congenital Diseases. Biomolecules 2018, 8, 123. [Google Scholar] [CrossRef]
- West, K.L.; Nguyen, T.T.N.; A Tengler, K.; Kreiling, N.; Raney, K.D.; Ghosal, G.; Leung, J.W. Autophosphorylation of the Tousled-like kinases TLK1 and TLK2 regulates recruitment to damaged chromatin via PCNA interaction. Nucleic Acids Res. 2024, 53. [Google Scholar] [CrossRef]
- Segura-Bayona, S.; Villamor-Payà, M.; Attolini, C.S.-O.; Koenig, L.M.; Sanchiz-Calvo, M.; Boulton, S.J.; Stracker, T.H. Tousled-Like Kinases Suppress Innate Immune Signaling Triggered by Alternative Lengthening of Telomeres. Cell Rep. 2020, 32, 107983. [Google Scholar] [CrossRef]
- Dyomin, A.G.; Koshel, E.I.; Kiselev, A.M.; Saifitdinova, A.F.; Galkina, S.A.; Fukagawa, T.; Kostareva, A.A.; Gaginskaya, E.R. Chicken rRNA Gene Cluster Structure. PLOS ONE 2016, 11, e0157464. [Google Scholar] [CrossRef]
- Yuan, X.; Feng, W.; Imhof, A.; Grummt, I.; Zhou, Y. Activation of RNA Polymerase I Transcription by Cockayne Syndrome Group B Protein and Histone Methyltransferase G9a. Mol. Cell 2007, 27, 585–595. [Google Scholar] [CrossRef]
- Bradsher, J.; Auriol, J.; de Santis, L.P.; Iben, S.; Vonesch, J.-L.; Grummt, I.; Egly, J.-M. CSB Is a Component of RNA Pol I Transcription. Mol. Cell 2002, 10, 819–829. [Google Scholar] [CrossRef]
- Forrest, I.S.; Chaudhary, K.; Vy, H.M.T.; Bafna, S.; Kim, S.; Won, H.; Loos, R.J.; Cho, J.; Pasquale, L.R.; Nadkarni, G.N.; et al. Genetic pleiotropy of ERCC6 loss-of-function and deleterious missense variants links retinal dystrophy, arrhythmia, and immunodeficiency in diverse ancestries. Hum. Mutat. 2021, 42, 969–977. [Google Scholar] [CrossRef] [PubMed]
- Wang, Y.; Li, F.; Zhang, G.; Kang, L.; Guan, H. Ultraviolet-B induces ERCC6 repression in lens epithelium cells of age-related nuclear cataract through coordinated DNA hypermethylation and histone deacetylation. Clin. Epigenetics 2016, 8, 1–15. [Google Scholar] [CrossRef] [PubMed]
- Sharma, R.; Lewis, S.; Wlodarski, M.W. DNA Repair Syndromes and Cancer: Insights Into Genetics and Phenotype Patterns. Front. Pediatr. 2020, 8, 570084. [Google Scholar] [CrossRef] [PubMed]
- Olivieri, M.; Cho, T.; Álvarez-Quilón, A.; Li, K.; Schellenberg, M.J.; Zimmermann, M.; Hustedt, N.; Rossi, S.E.; Adam, S.; Melo, H.; et al. A Genetic Map of the Response to DNA Damage in Human Cells. Cell 2020, 182, 481–496.e21. [Google Scholar] [CrossRef]
- van Sluis, M.; Yu, Q.; van der Woude, M.; Gonzalo-Hansen, C.; Dealy, S.C.; Janssens, R.C.; Somsen, H.B.; Ramadhin, A.R.; Dekkers, D.H.W.; Wienecke, H.L.; et al. Transcription-coupled DNA–protein crosslink repair by CSB and CRL4CSA-mediated degradation. Nat. Cell Biol. 2024, 26, 770–783. [Google Scholar] [CrossRef]
- Ghosh, I. De Benedetti A: Untousling the Role of Tousled-like Kinase 1 in DNA Damage Repair. International Journal of Molecular Sciences 2023, 24(17), 13369. [Google Scholar] [CrossRef]
- Sen, S; De Benedetti, A. TLK1B promotes repair of UV-damaged DNA through chromatin remodeling by Asf1. BMC Mol Biol 2006, 7, 37. [Google Scholar] [CrossRef]
- Singh, V.; Connelly, Z.M.; Shen, X.; De Benedetti, A. Identification of the proteome complement of humanTLK1 reveals it binds and phosphorylates NEK1 regulating its activity. Cell Cycle 2017, 16, 915–926. [Google Scholar] [CrossRef]
- Shammas, M.; Pal, J.; Vahia, A.V.; Nanjappa, P.; Munshi, M.N.; Shi, J.; Munshi, N.C. Elevated APEX1 Endonuclease Is Associated with Increased DNA Breaks and Instability in Myeloma. Blood 2011, 118, 1805–1805. [Google Scholar] [CrossRef]
- Osmani, S.A.; Pu, R.T.; Morris, N. Mitotic induction and maintenance by overexpression of a G2-specific gene that encodes a potential protein kinase. Cell 1988, 53, 237–244. [Google Scholar] [CrossRef]
- Lu, KP. Hunter T: Evidence for a NIMA-like mitotic pathway in vertebrate cells. Cell 1995, 81(3), 413–424. [Google Scholar] [CrossRef] [PubMed]
- Meirelles, G.V.; Perez, A.M.; De Souza, E.E.; Basei, F.L.; Papa, P.F.; Hanchuk, T.D.M.; Cardoso, V.B.; Kobarg, J. “Stop Ne(c)king around”: How interactomics contributes to functionally characterize Nek family kinases. World J. Biol. Chem. 2014, 5, 141–160. [Google Scholar] [CrossRef] [PubMed]
- Moniz, L.; Dutt, P.; Haider, N.; Stambolic, V. Nek family of kinases in cell cycle, checkpoint control and cancer. Cell Div. 2011, 6, 18–18. [Google Scholar] [CrossRef]
- Chen, Y.; Chen, C.F.; Riley, D.J.; Chen, PL. Nek1 kinase functions in DNAdamage response checkpoint control through a pathway independent of, A.T.M.A.TR. Cell Cycle 2011, 10(4), 655–663. [Google Scholar] [CrossRef] [PubMed]
- Kok, JR; Palminha, NM; Dos Santos Souza, C; El-Khamisy, SF; Ferraiuolo, L. DNA damage as a mechanism of neurodegeneration in ALS and a contributor to astrocyte toxicity. Cell Mol Life Sci 2021, 78(15), 5707–5729. [Google Scholar] [CrossRef]
- Melo-Hanchuk, T.D.; Slepicka, P.F.; Meirelles, G.V.; Basei, F.L.; Lovato, D.V.; Granato, D.C.; Pauletti, B.A.; Domingues, R.R.; Leme, A.F.P.; Pelegrini, A.L.; et al. NEK1 kinase domain structure and its dynamic protein interactome after exposure to Cisplatin. Sci. Rep. 2017, 7, 1–13. [Google Scholar] [CrossRef]
- Basei, F.L.; Meirelles, G.V.; Righetto, G.L.; Migueleti, D.L.d.S.; Smetana, J.H.C.; Kobarg, J. New interaction partners for Nek4.1 and Nek4.2 isoforms: from the DNA damage response to RNA splicing. Proteome Sci. 2015, 13, 11–11. [Google Scholar] [CrossRef]
- Khalil, M.I.; Ghosh, I.; Singh, V.; Chen, J.; Zhu, H.; De Benedetti, A. NEK1 Phosphorylation of YAP Promotes Its Stabilization and Transcriptional Output. Cancers 2020, 12, 3666. [Google Scholar] [CrossRef]
- van de Kooij, B.; Creixell, P.; van Vlimmeren, A.; Joughin, B.A.; Miller, C.J.; Haider, N.; Simpson, C.D.; Linding, R.; Stambolic, V.; Turk, B.E.; et al. Comprehensive substrate specificity profiling of the human Nek kinome reveals unexpected signaling outputs. Elife 2019, 8, e44635. [Google Scholar] [CrossRef]
- Letwin, K.; Mizzen, L.; Motro, B.; Ben-David, Y.; Bernstein, A.; Pawson, T. A mammalian dual specificity protein kinase, Nek1, is related to the NIMA cell cycle regulator and highly expressed in meiotic germ cells. EMBO J. 1992, 11, 3521–3531. [Google Scholar] [CrossRef]
- Ghosh, I.; Khalil, M.I. De Benedetti A: Evidence that Nek1 does not phosphorylate Rad54-S572 during recovery, f.r.o.m.IR. bioRxiv 2022:2022.2004.2001.486731.
- Liu, S.; Ho, C.K.; Ouyang, J.; Zou, L. Nek1 kinase associates with ATR–ATRIP and primes ATR for efficient DNA damage signaling. Proc. Natl. Acad. Sci. 2013, 110, 2175–2180. [Google Scholar] [CrossRef] [PubMed]
- Szaflarski, W.; Leśniczak-Staszak, M.; Sowiński, M.; Ojha, S.; Aulas, A.; Dave, D.; Malla, S.; Anderson, P.; Ivanov, P.; Lyons, S.M. Early rRNA processing is a stress-dependent regulatory event whose inhibition maintains nucleolar integrity. Nucleic Acids Res. 2021, 50, 1033–1051. [Google Scholar] [CrossRef] [PubMed]
- Epanchintsev, A.; Costanzo, F.; Rauschendorf, M.-A.; Caputo, M.; Ye, T.; Donnio, L.-M.; Proietti-De-Santis, L.; Coin, F.; Laugel, V.; Egly, J.-M. Cockayne’s Syndrome A and B Proteins Regulate Transcription Arrest after Genotoxic Stress by Promoting ATF3 Degradation. Mol. Cell 2017, 68, 1054–1066.e6. [Google Scholar] [CrossRef]
- Jiang, HY; Wek, RC. GCN2 phosphorylation of eIF2alpha activates NF-kappaB in response to UV irradiation. Biochem J 2005, 385 Pt 2, 371–380. [Google Scholar] [CrossRef]
- Luo, X.; Alfason, L.; Wei, M.; Wu, S.; Kasim, V. Spliced or Unspliced, That Is the Question: The Biological Roles of XBP1 Isoforms in Pathophysiology. Int. J. Mol. Sci. 2022, 23, 2746. [Google Scholar] [CrossRef]
- Malik, S.; Chaurasia, P.; Lahudkar, S.; Durairaj, G.; Shukla, A.; Bhaumik, S.R. Rad26p, a transcription-coupled repair factor, is recruited to the site of DNA lesion in an elongating RNA polymerase II-dependent manner in vivo. Nucleic Acids Res. 2009, 38, 1461–1477. [Google Scholar] [CrossRef]
- Yan, C.; Dodd, T.; Yu, J.; Leung, B.; Xu, J.; Oh, J.; Wang, D.; Ivanov, I. Mechanism of Rad26-assisted rescue of stalled RNA polymerase II in transcription-coupled repair. Nat. Commun. 2021, 12, 1–12. [Google Scholar] [CrossRef]
- Ghosh-Roy, S.; Das, D.; Chowdhury, D.; J.Smerdon, M.; Chaudhuri, R.N. Rad26, the Transcription-Coupled Repair Factor in Yeast, Is Required for Removal of Stalled RNA Polymerase-II following UV Irradiation. PLOS ONE 2013, 8, e72090. [Google Scholar] [CrossRef]
- Li, S. Transcription coupled nucleotide excision repair in the yeast Saccharomyces cerevisiae: The ambiguous role of Rad26. DNA Repair 2015, 36, 43–48. [Google Scholar] [CrossRef]
- Lama, D.; Verma, C.S. Deciphering the mechanistic effects of eIF4E phosphorylation on mRNA-cap recognition. Protein Sci. 2019, 29, 1373–1386. [Google Scholar] [CrossRef] [PubMed]
- Moura, D.J.; Bruna; IB, C. F.; CA, D.; Guido, P. HJA; Saffi, L.J. Kin3 protein, a NIMA-related kinase of Saccharomyces cerevisiae, is involved in DNA adduct damage response. Cell Cycle 2010, 9(11), 2220–2229. [Google Scholar] [CrossRef] [PubMed]
- Sanz-Murillo, M.; Xu, J.; Belogurov, G.A.; Calvo, O.; Gil-Carton, D.; Moreno-Morcillo, M.; Wang, D.; Fernández-Tornero, C. Structural basis of RNA polymerase I stalling at UV light-induced DNA damage. Proc. Natl. Acad. Sci. 2018, 115, 8972–8977. [Google Scholar] [CrossRef] [PubMed]
- Nocentini, S. Inhibition and recovery of ribosomal RNA synthesis in ultraviolet-irradiated mammalian cells. Biochim. et Biophys. Acta (BBA) - Nucleic Acids Protein Synth. 1976, 454, 114–128. [Google Scholar] [CrossRef]
- MAYNE, L.; LEHMANN, A. FAILURE OF RNA-SYNTHESIS TO RECOVER AFTER UV IRRADIATION - AN EARLY DEFECT IN CELLS FROM INDIVIDUALS WITH COCKAYNES SYNDROME AND XERODERMA PIGMENTOSUM. 1982, 42, 1473–1478. [Google Scholar] [CrossRef]
- Qiang, M.; Khalid, F.; Phan, T.; Ludwig, C.; Scharffetter-Kochanek, K.; Iben, S. Cockayne Syndrome-Associated CSA and CSB Mutations Impair Ribosome Biogenesis, Ribosomal Protein Stability, and Global Protein Folding. Cells 2021, 10, 1616. [Google Scholar] [CrossRef]
- Lanzafame, M.; Branca, G.; Landi, C.; Qiang, M.; Vaz, B.; Nardo, T.; Ferri, D.; Mura, M.; Iben, S.; Stefanini, M.; et al. Cockayne syndrome group A and ferrochelatase finely tune ribosomal gene transcription and its response to UV irradiation. Nucleic Acids Res. 2021, 49, 10911–10930. [Google Scholar] [CrossRef]
- Koch, H.; Waller, H.; Kiefer, J. Ultraviolet-induced inhibition of ribosomal RNA synthesis in yeast strains differing in radiation sensitivities. Biochim. et Biophys. Acta (BBA) - Nucleic Acids Protein Synth. 1976, 454, 436–446. [Google Scholar] [CrossRef]
- Shore, D.; Zencir, S.; Albert, B. Transcriptional control of ribosome biogenesis in yeast: links to growth and stress signals. Biochem. Soc. Trans. 2021, 49, 1589–1599. [Google Scholar] [CrossRef]
- Ruta, LL; Farcasanu, IC. Saccharomyces cerevisiae and Caffeine Implications on the Eukaryotic Cell. Nutrients 2020, 12(8). [Google Scholar] [CrossRef]
- Taschner, M.; Harreman, M.; Teng, Y.; Gill, H.; Anindya, R.; Maslen, S.L.; Skehel, J.M.; Waters, R.; Svejstrup, J.Q. A Role for Checkpoint Kinase-Dependent Rad26 Phosphorylation in Transcription-Coupled DNA Repair in Saccharomyces cerevisiae. Mol. Cell. Biol. 2010, 30, 436–446. [Google Scholar] [CrossRef]
- Hampsey, M. Molecular Genetics of the RNA Polymerase II General Transcriptional Machinery. Microbiol. Mol. Biol. Rev. 1998, 62, 465–503. [Google Scholar] [CrossRef]
- Zhang, H.; Gao, J.; Ye, J.; Gong, Z.; Gu, X. Maternal origin of a de novo microdeletion spanning the ERCC6 gene in a classic form of the Cockayne syndrome. Eur. J. Med Genet. 2011, 54, e389–e393. [Google Scholar] [CrossRef]
Figure 1.
An assay for monitoring the persistence of DNA lesions that block all RNA Pol transcription. MM3MG cells (CRL-6376) (105 per well) were labeled with 50 μCi 3H-uridine, with and without 5μM J54. After 2 J/m2 of UV irradiation, the cells were removed, and total RNA was isolated with the TRI-reagent. 10 μg of total RNA from each sample was separated on a 1% agarose gel, then repeatedly soaked in CH3CO2H to remove the water and processed for autoradiography with PPO.
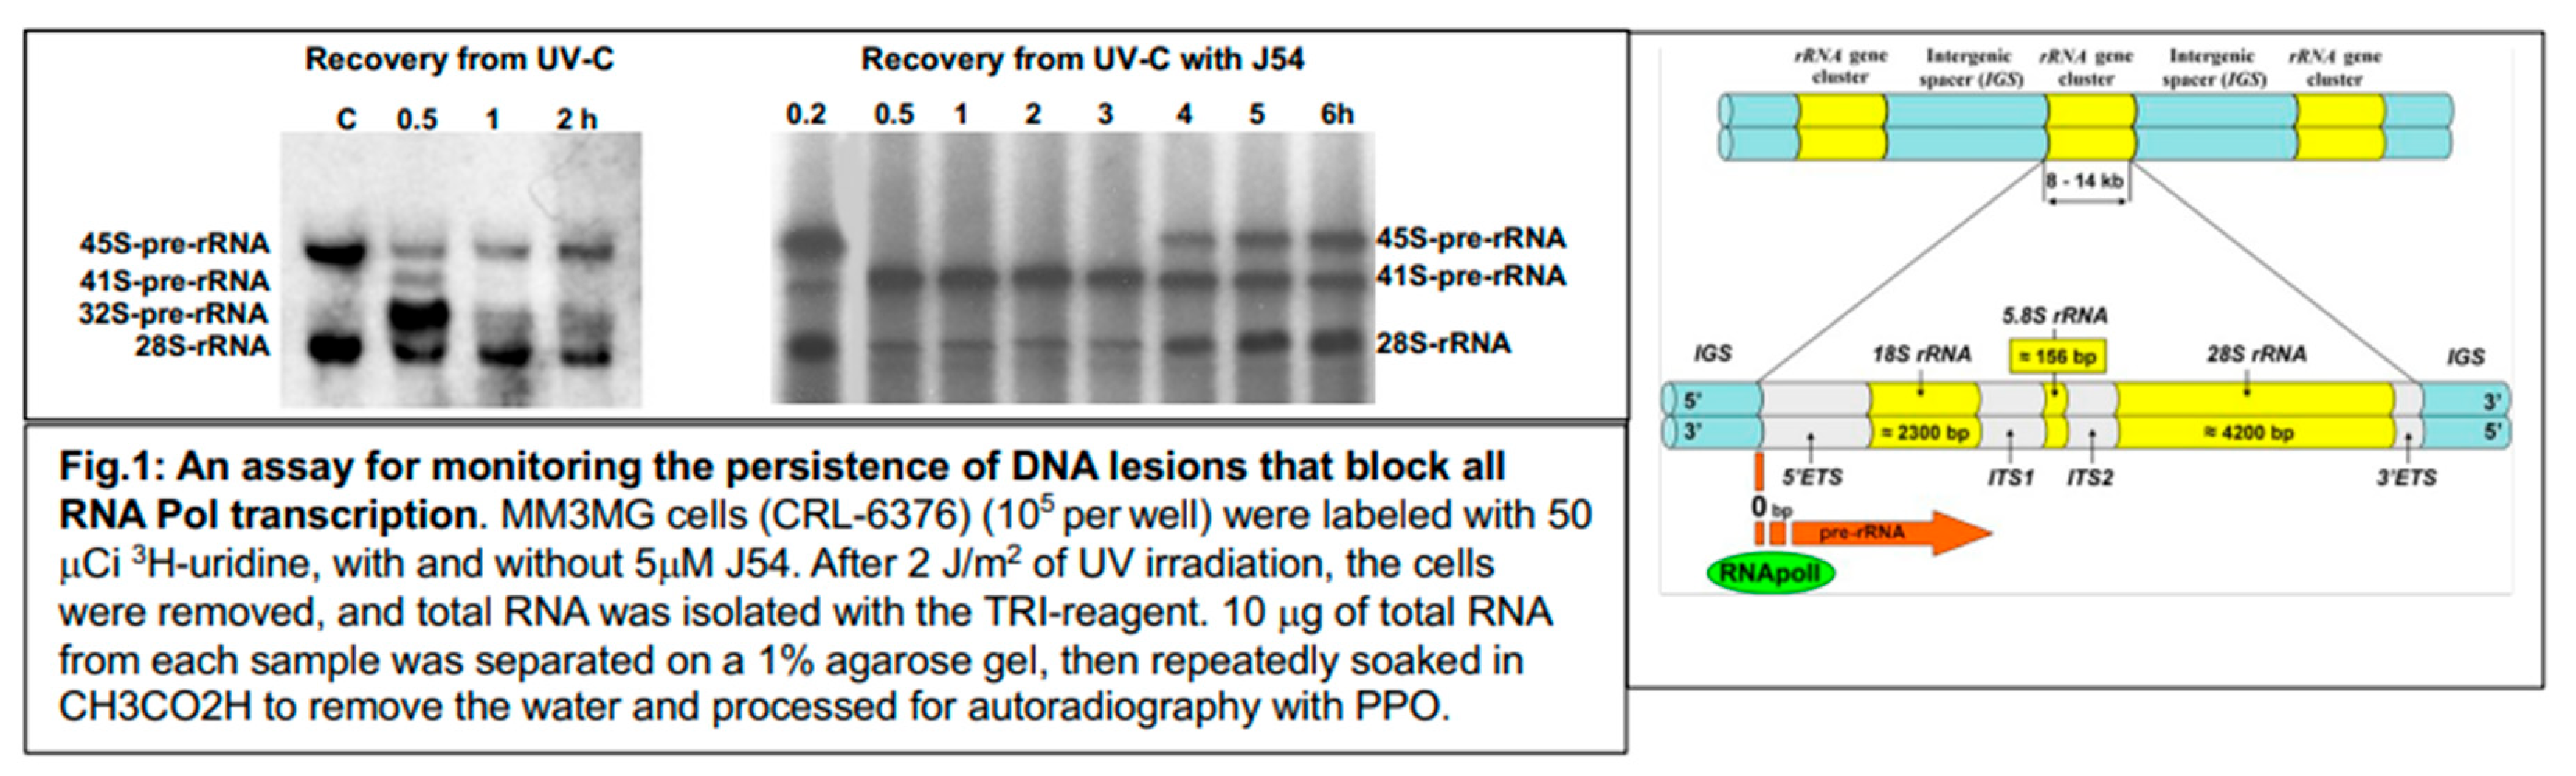
Figure 2.
Reciprocal coIP of NEK1 and ERCC6 from NT1 and NT1-NEK1-/- cells, and coIP of expressed Myc-ERCC6 – note that ERCC6 often presents with slower than expected mobility (see also SI for expression examples).
Figure 2.
Reciprocal coIP of NEK1 and ERCC6 from NT1 and NT1-NEK1-/- cells, and coIP of expressed Myc-ERCC6 – note that ERCC6 often presents with slower than expected mobility (see also SI for expression examples).
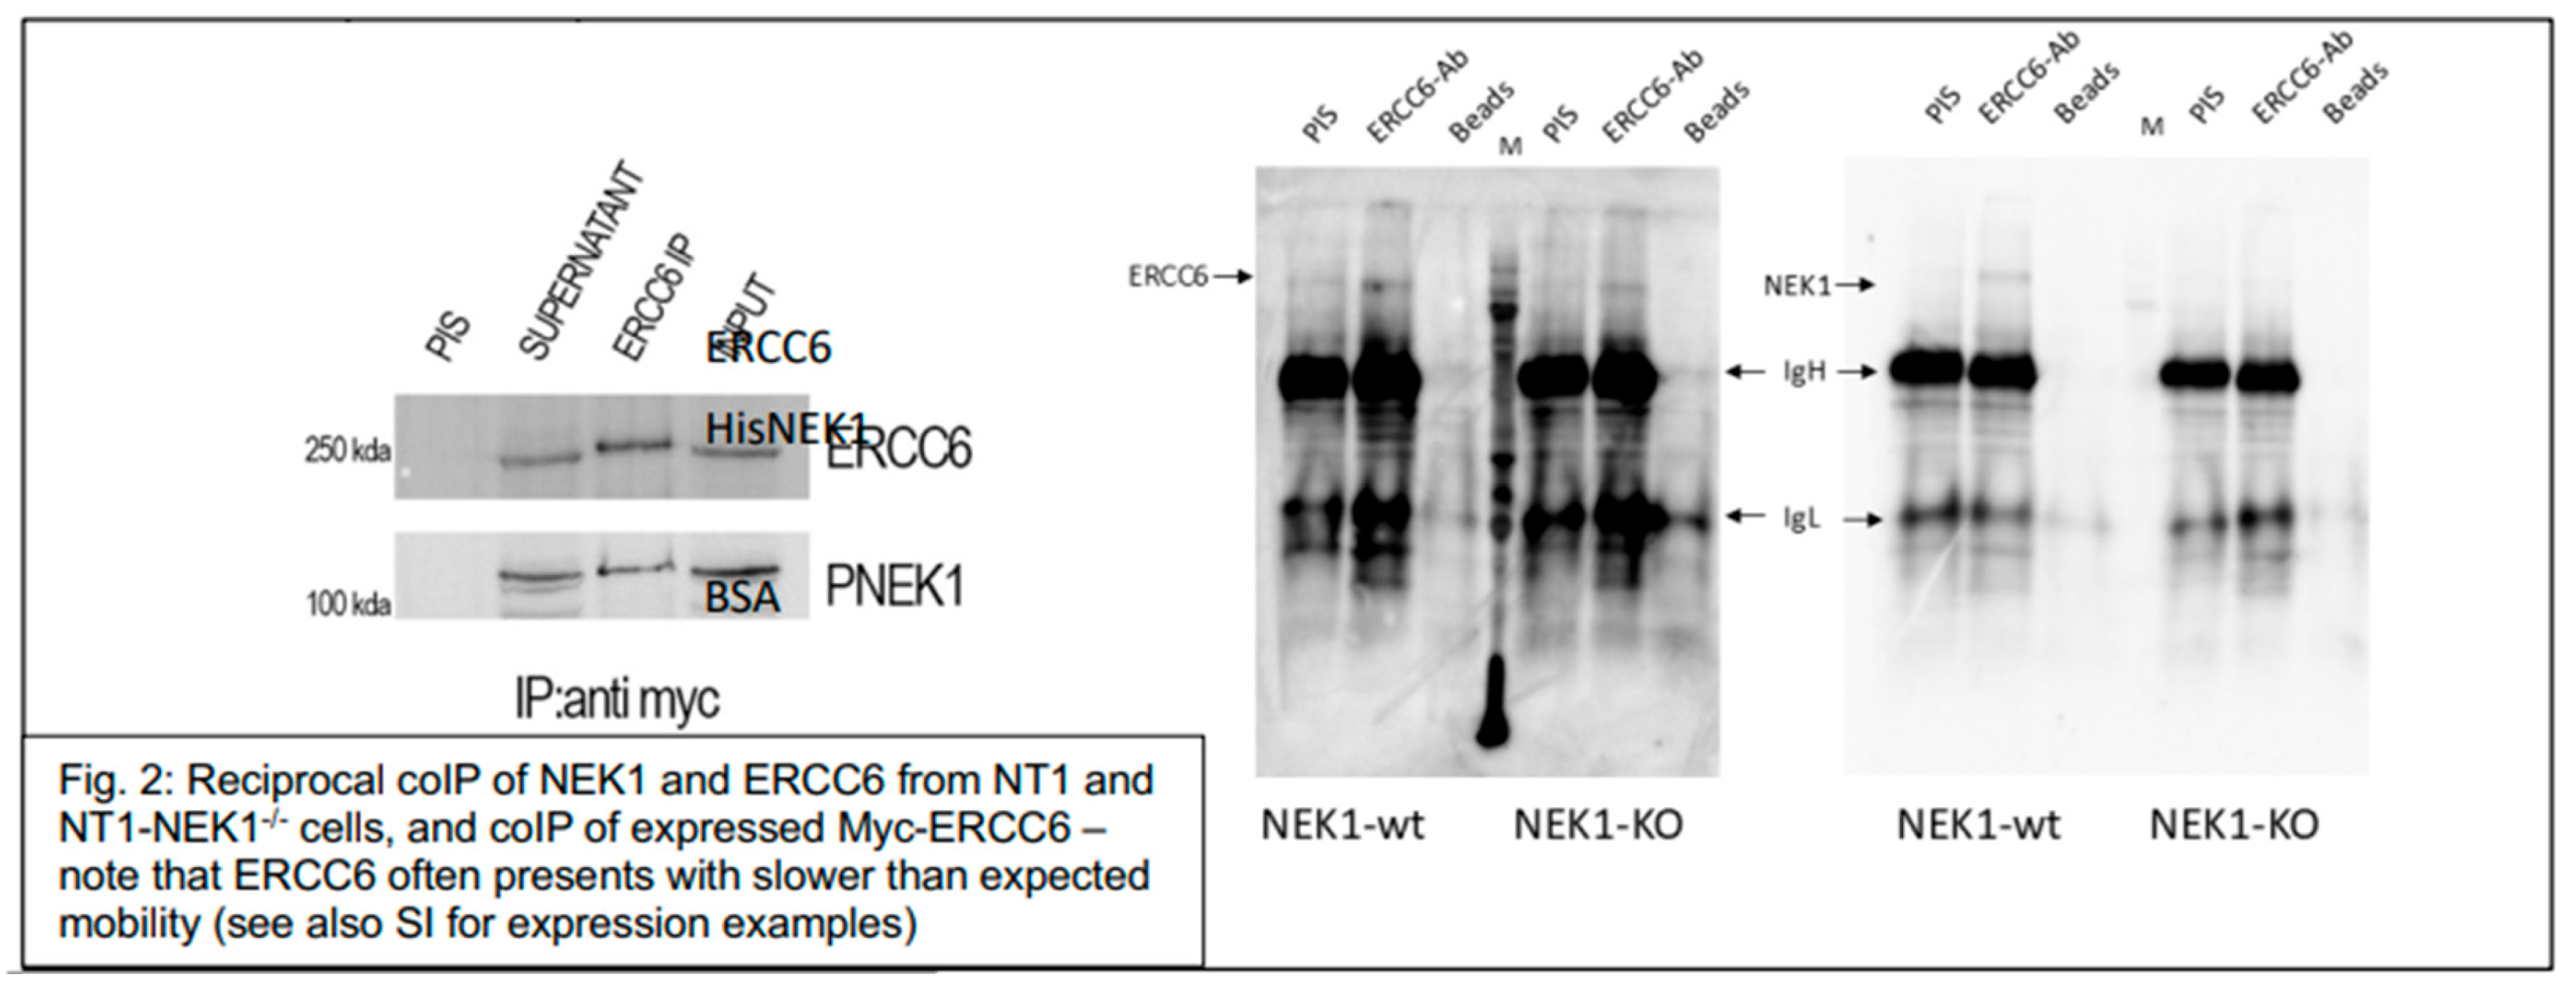
Figure 3.
Pulldown of recombinants HisNEK1 and ERCC6 on Ni-Sepharose. Binding assembled in 0.1 ml of TBS on ice for 20 min. After that, 15 µL of resin was added and incubated with rotation for 30 more min. Resin bound and unbound fractions were collected by centrifugation and resolved on 8% SDS/PAGE that was then silver stained.
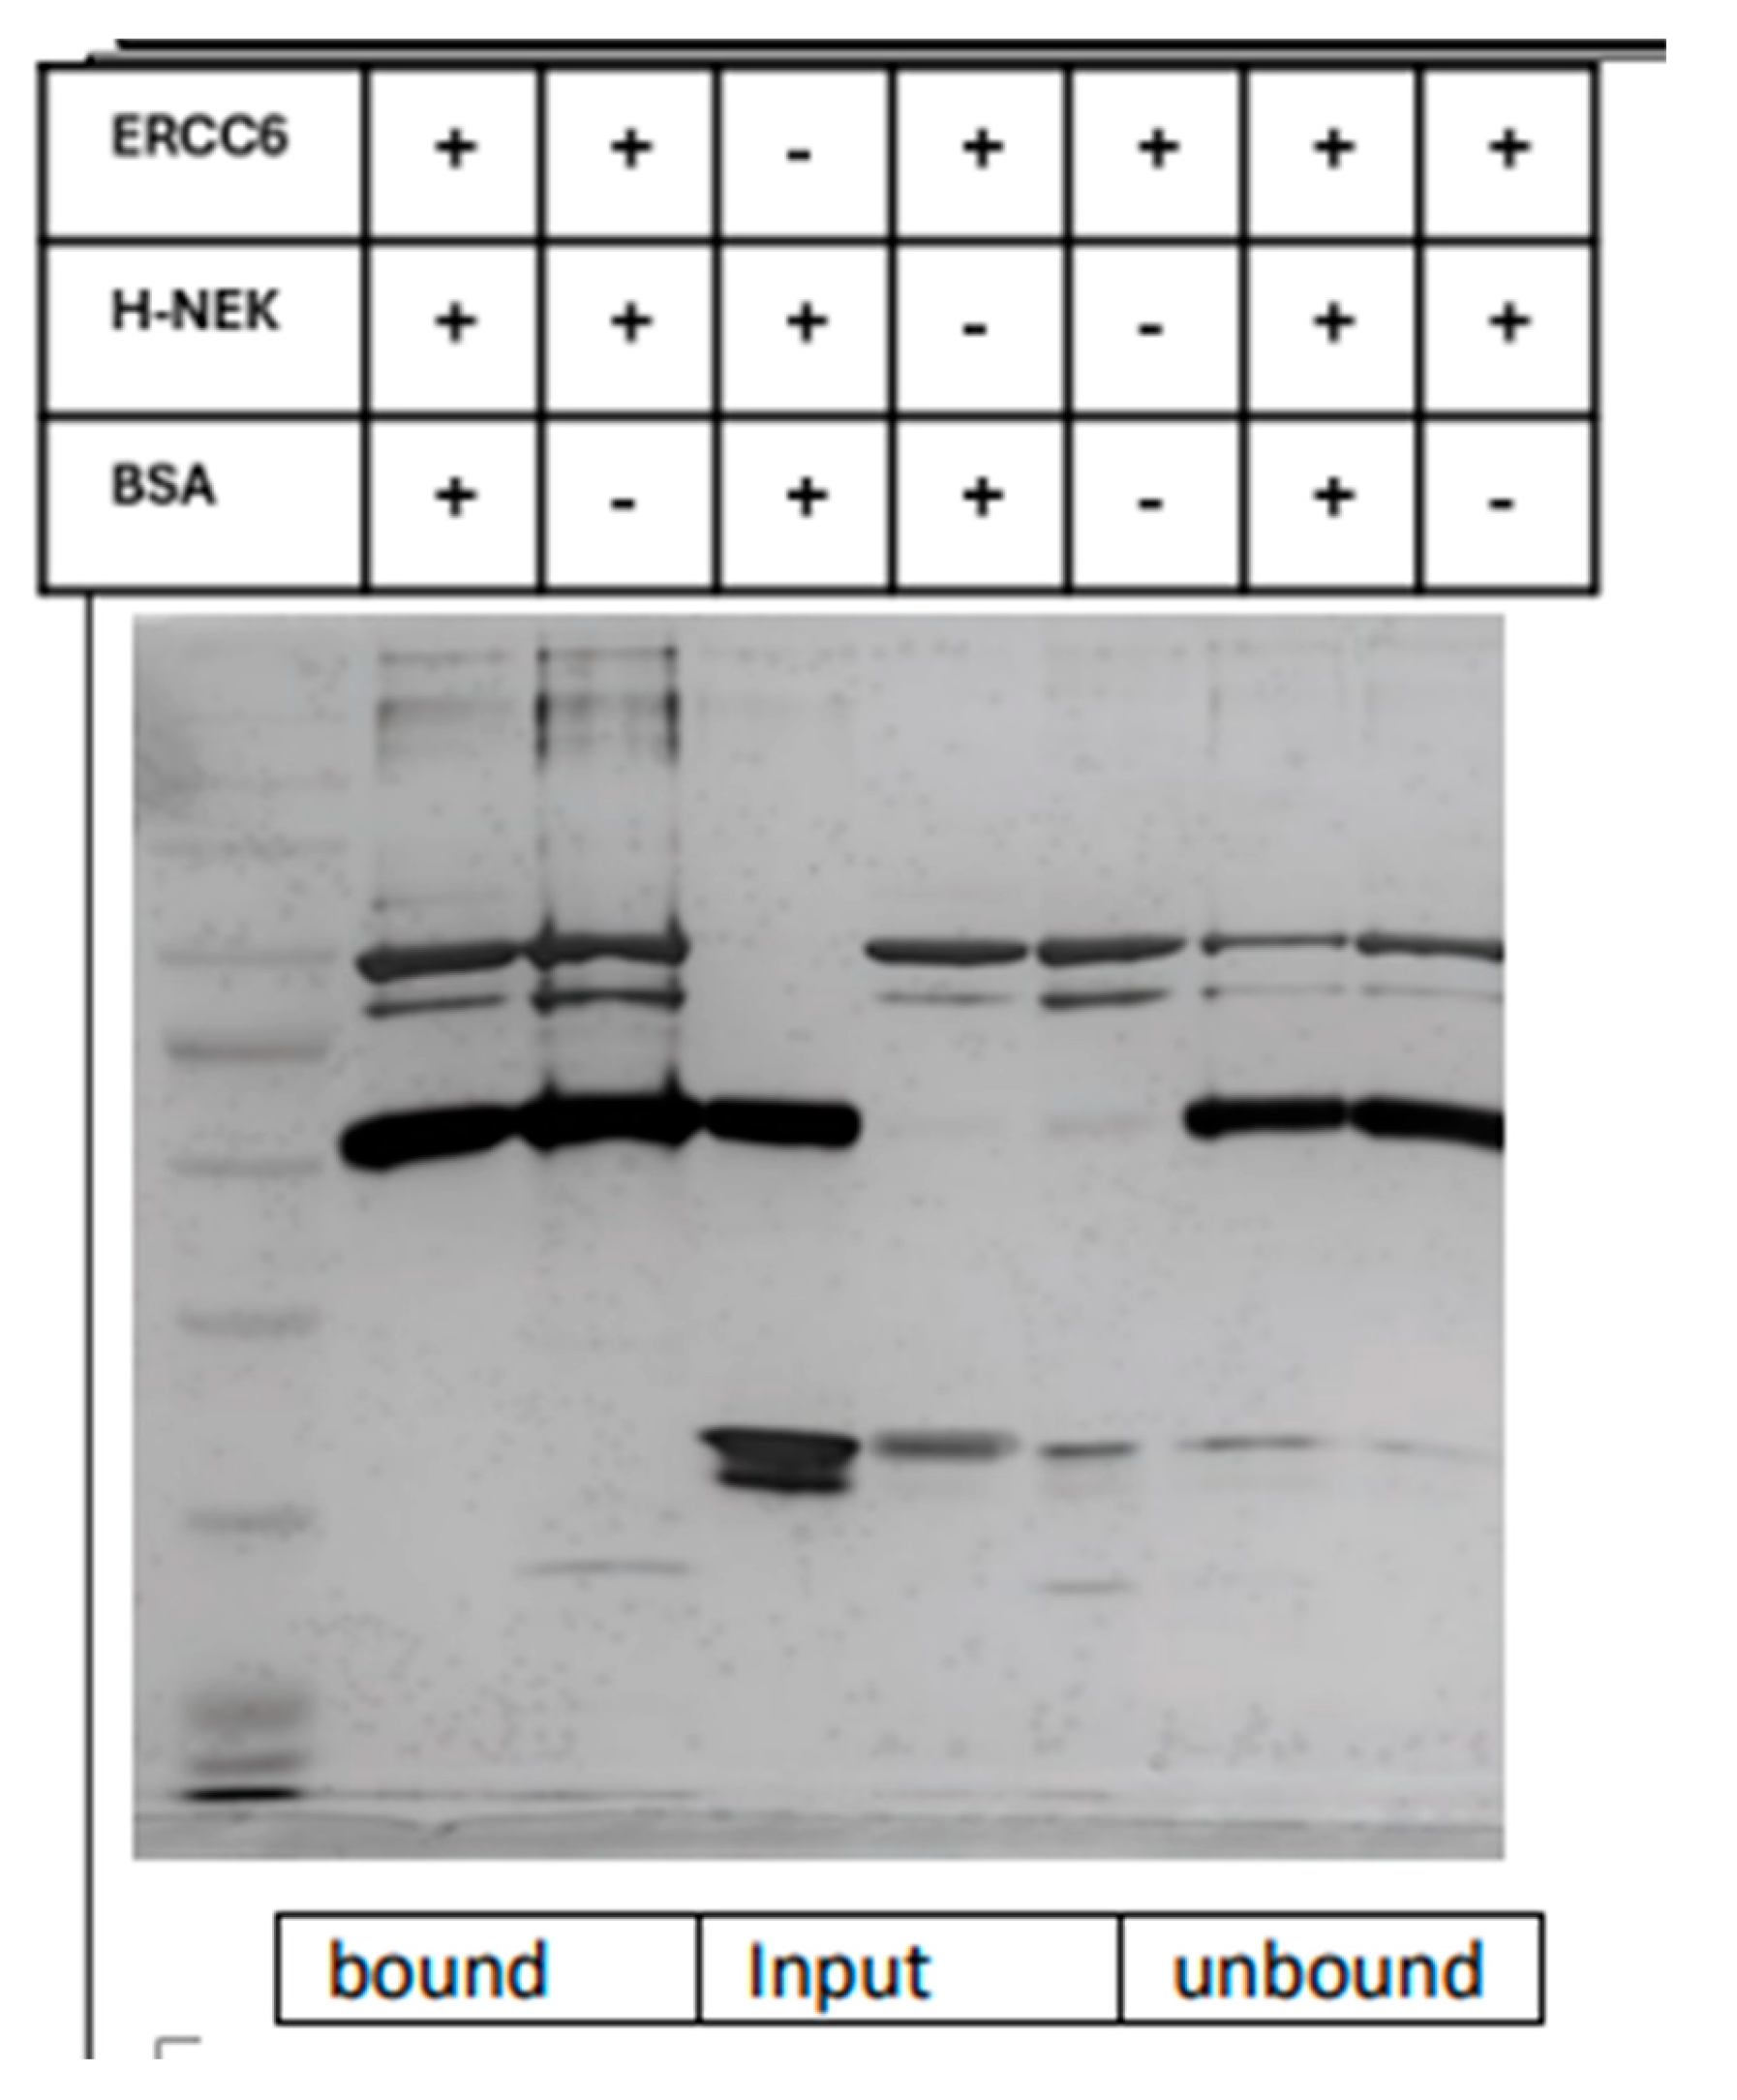
Figure 4.
Kinetics of CPD removal. Cells were irradiated with UV (200 mJ/cm2) and allowed to recover for the indicated times. DNA was isolated and affixed to Hi-Bond via a manifold. Following brief staining with MB to ensure even DNA application, the blot was probed with CPD antiserum.
Figure 4.
Kinetics of CPD removal. Cells were irradiated with UV (200 mJ/cm2) and allowed to recover for the indicated times. DNA was isolated and affixed to Hi-Bond via a manifold. Following brief staining with MB to ensure even DNA application, the blot was probed with CPD antiserum.
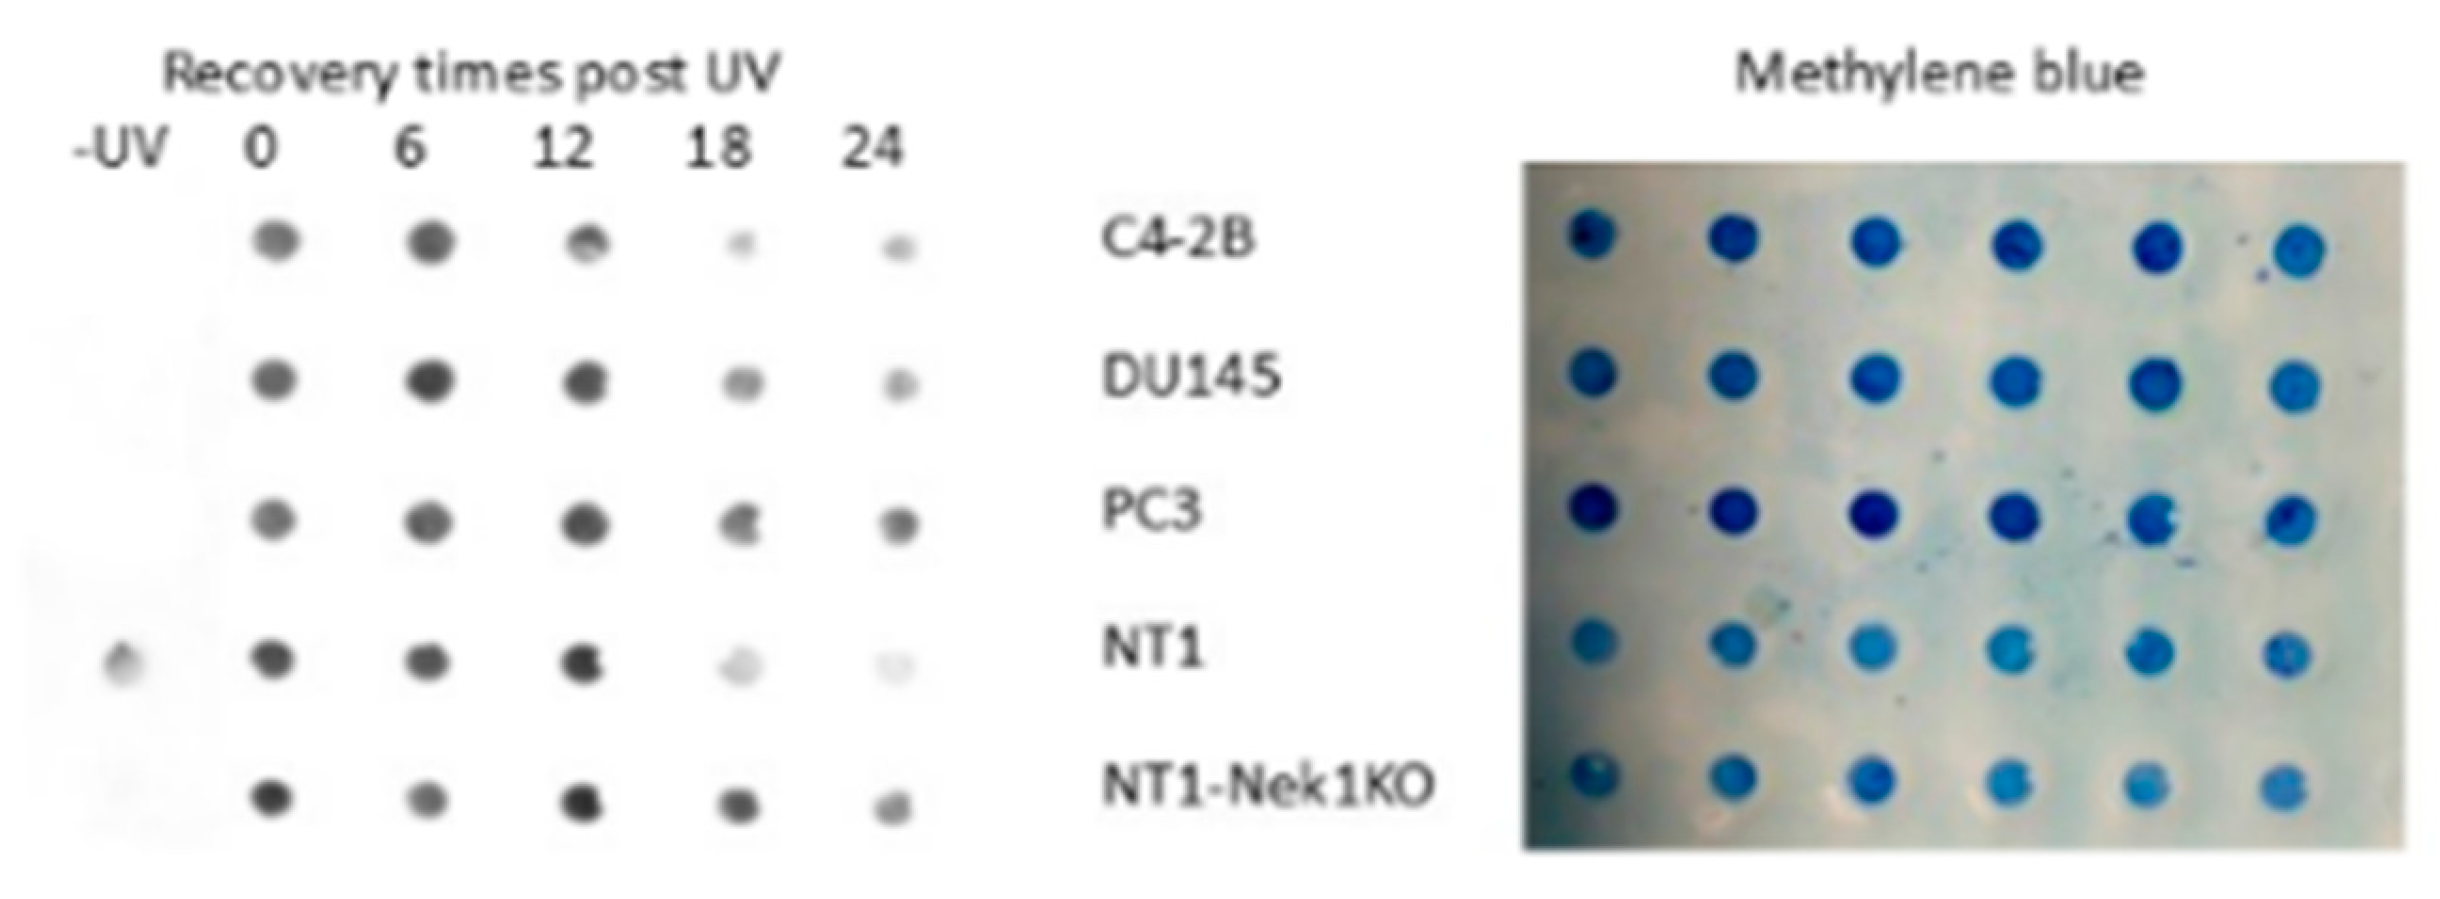
Figure 5.
(left) Viability of parental NT1 cell vs. Nek1-KO after exposure to different doses of UV. Cells (10,000 per well in 96-wells plate) were irradiated with UV-C at a fluence of 20 mJ/cm2/sec and set for tracing recovery time (viability/proliferation) with the Incucyte. (Right) Nek1-KO cells display loss of ERCC6 phosphorylation at Y625.
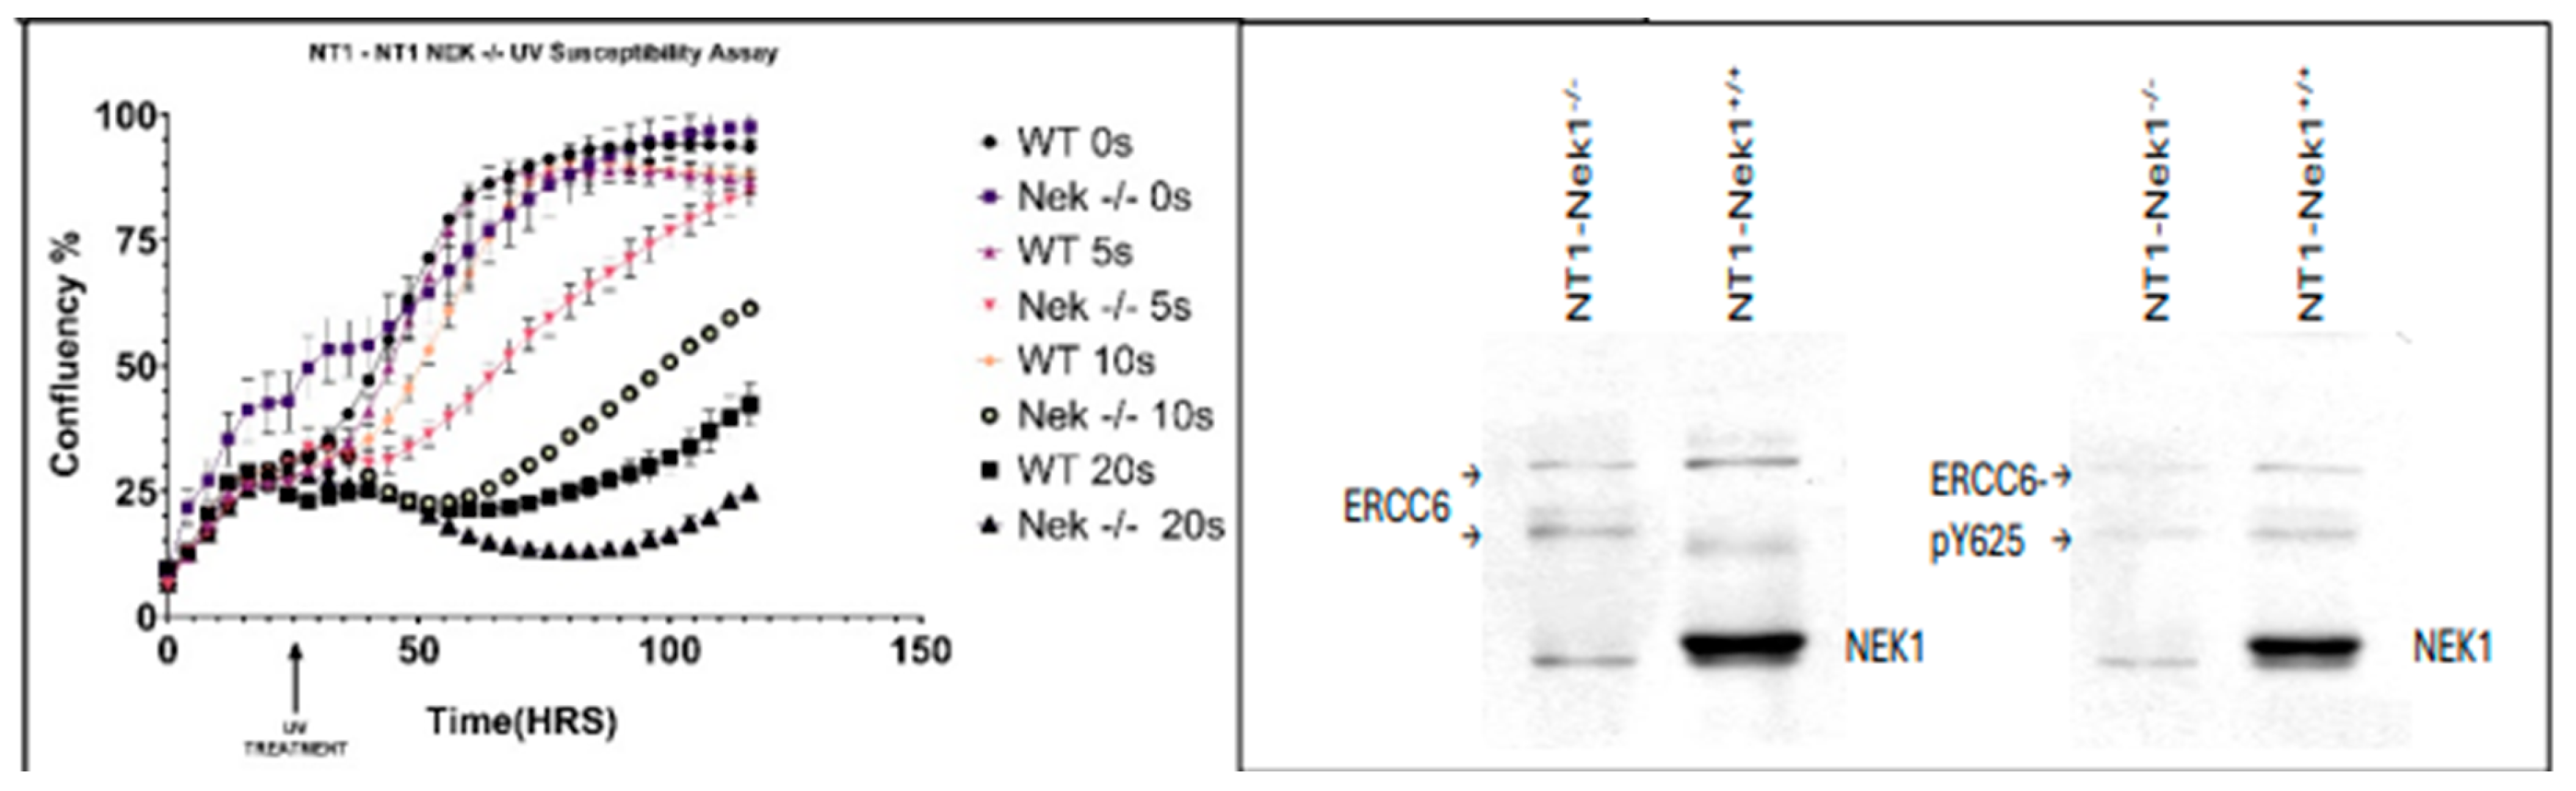
Figure 6.
Sequence alignment of ERCC6 in different species. Consensus Nek1 sites in a patch of hydroxylated AA. Below, analysis of peptides phosphorylated via IVK by recombinant NEK1.
Figure 6.
Sequence alignment of ERCC6 in different species. Consensus Nek1 sites in a patch of hydroxylated AA. Below, analysis of peptides phosphorylated via IVK by recombinant NEK1.
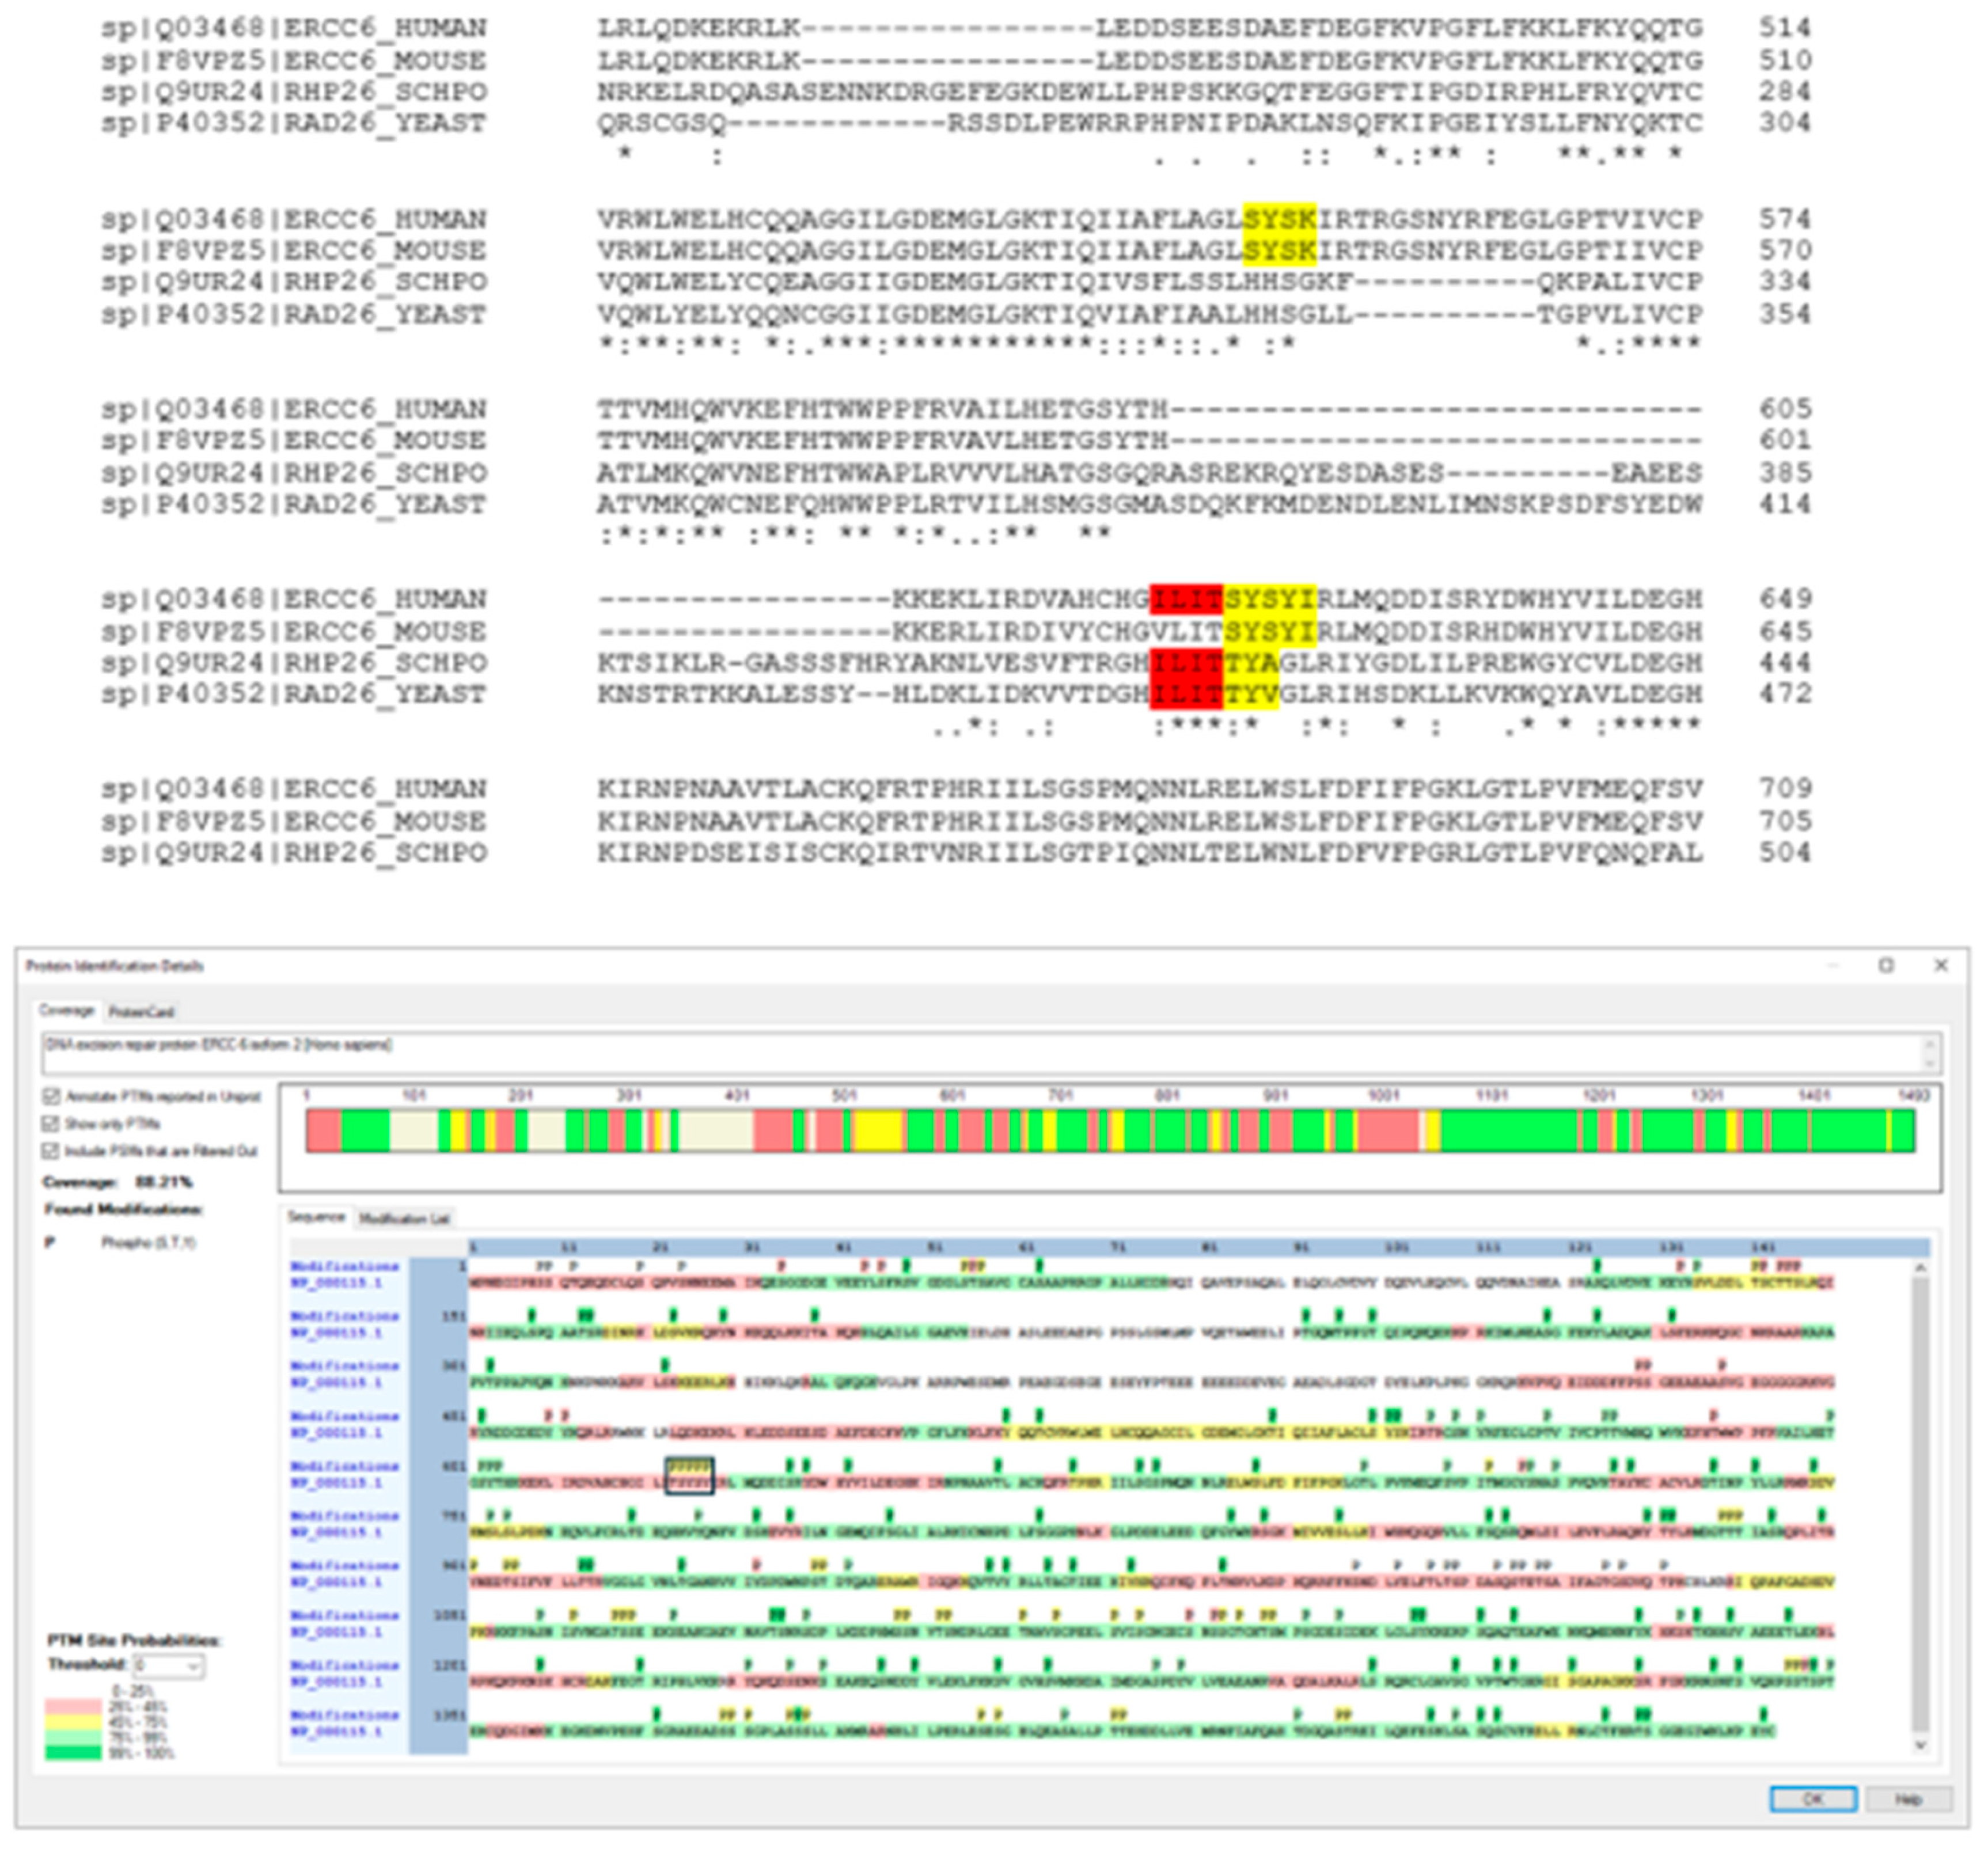
Figure 7.
ATPase assays with recombinant ERCC6 (wt and SYSY mutant) isolated by IP from Hek293 cells.
Figure 7.
ATPase assays with recombinant ERCC6 (wt and SYSY mutant) isolated by IP from Hek293 cells.
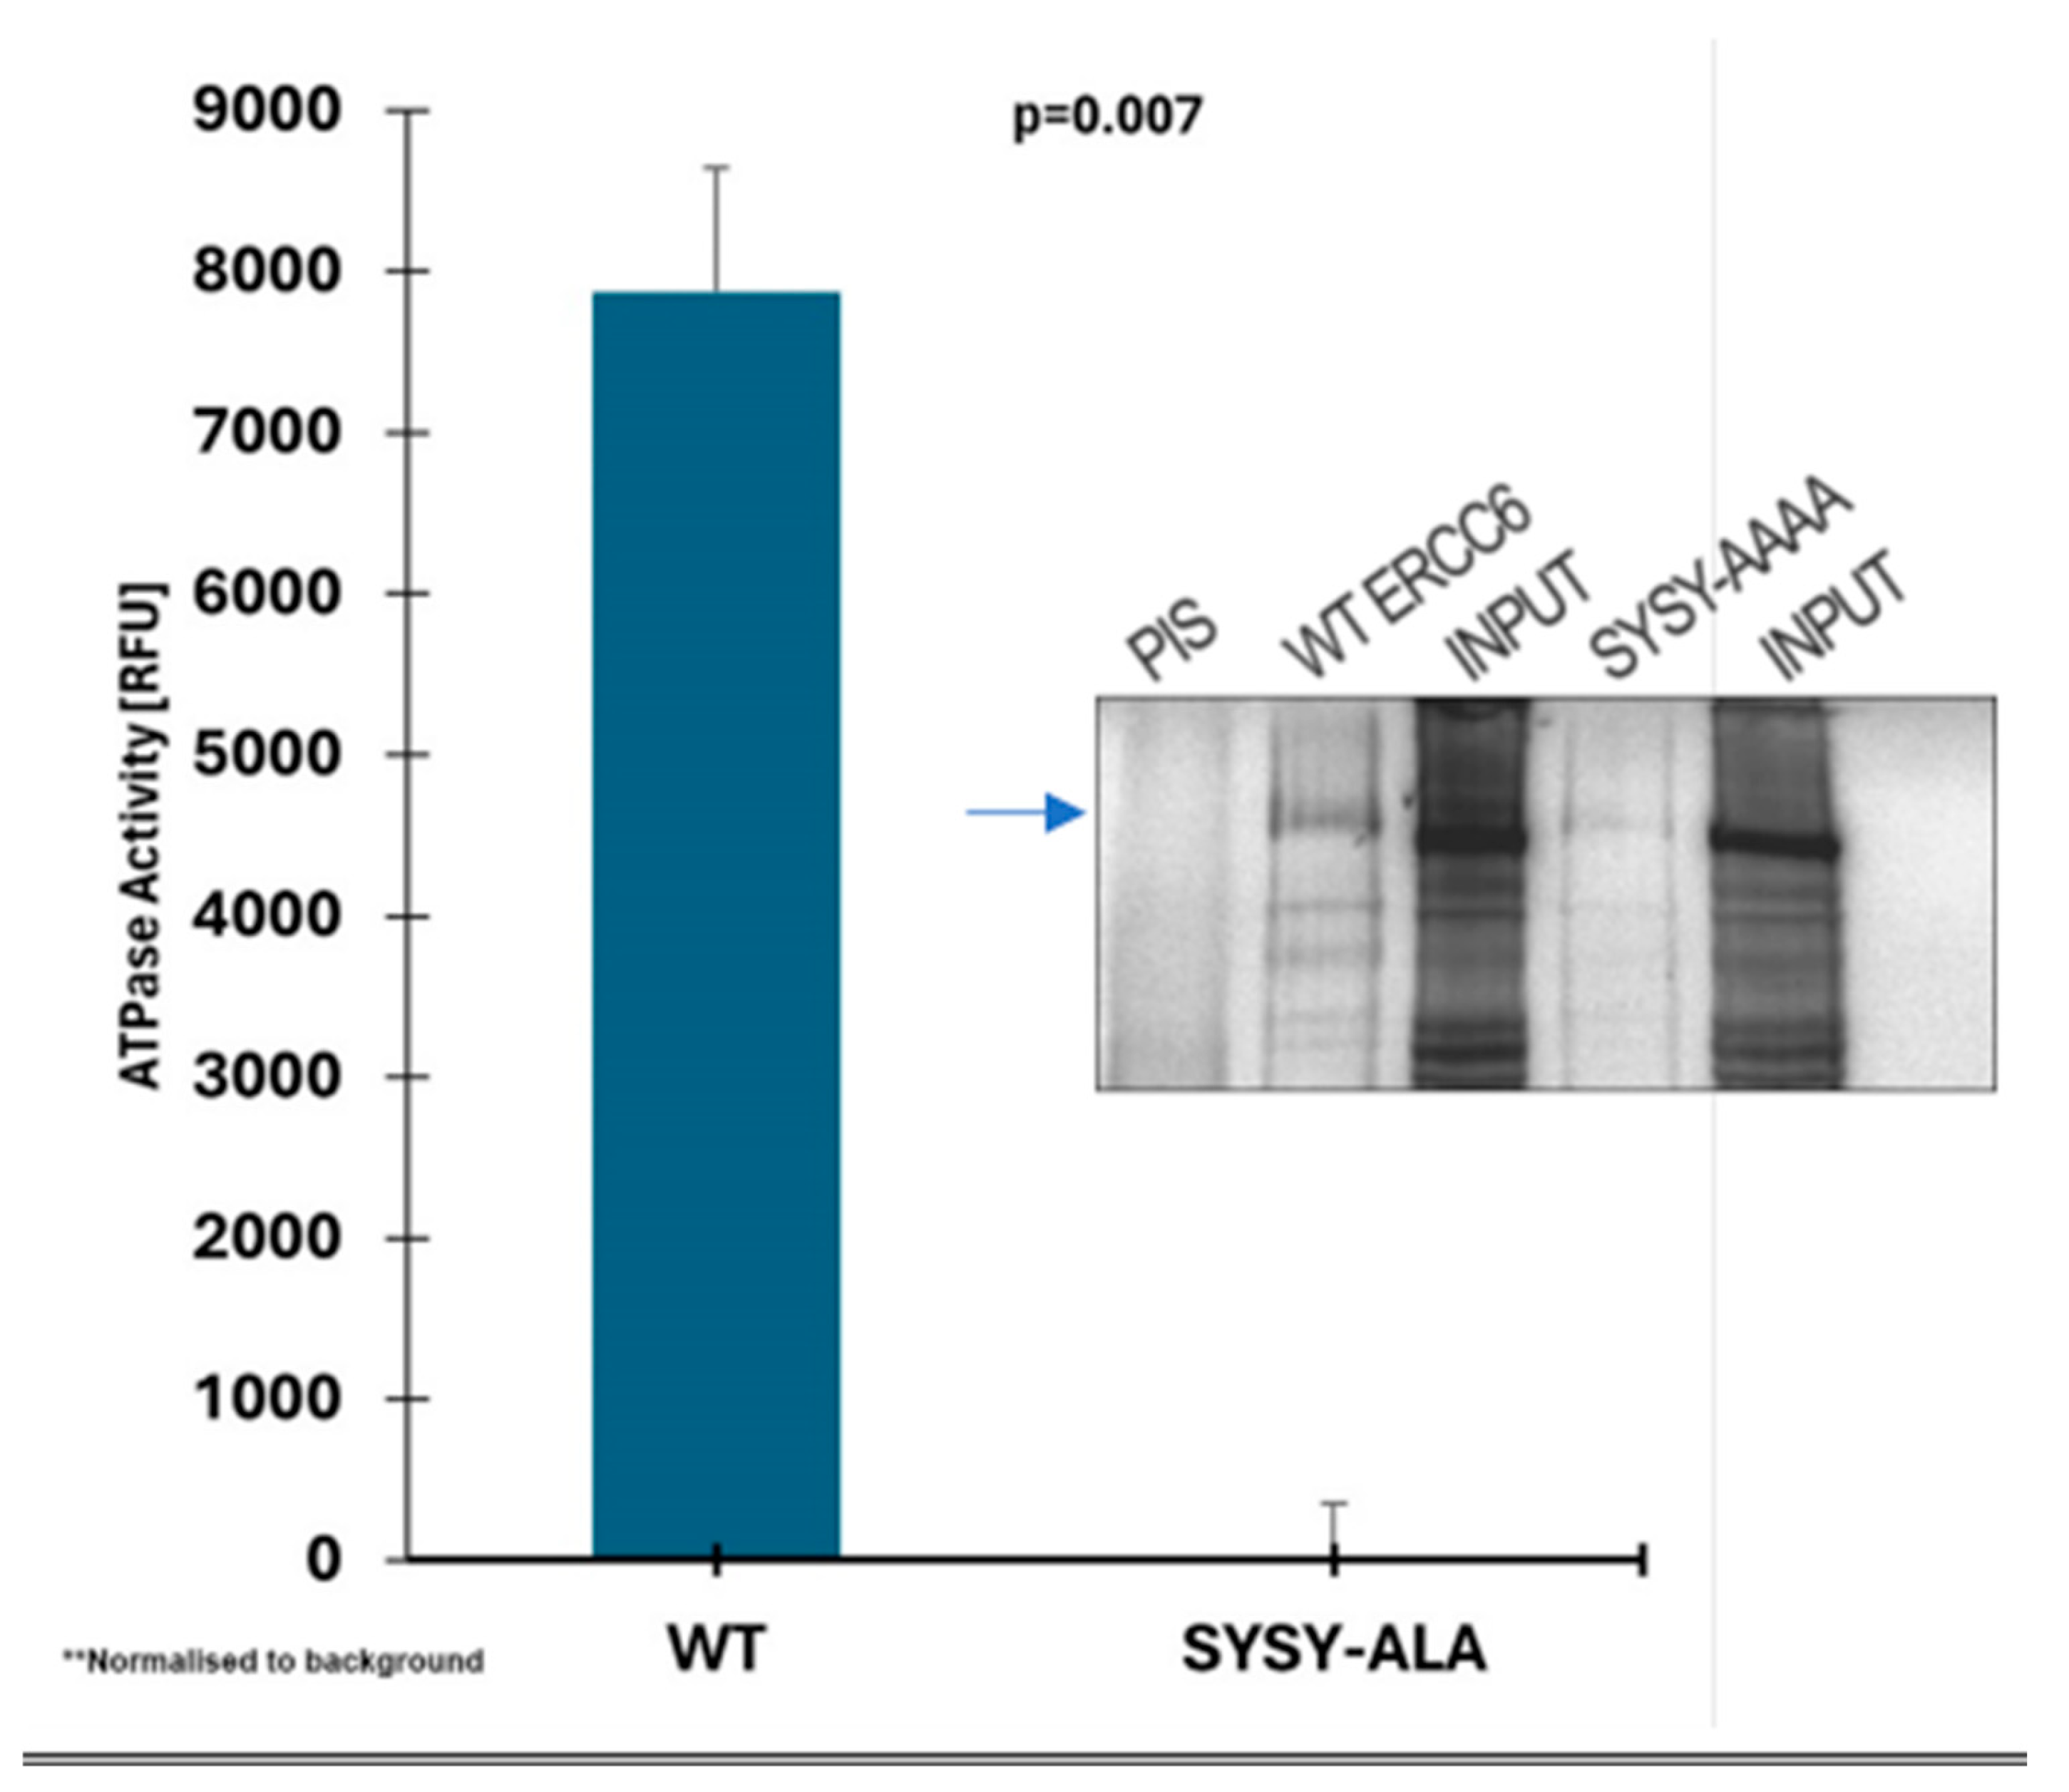
Figure 8.
ATPase reactions to determine the effect of Nek1 on the activity of recombinant ERCC6. Reactions were assembled as below and incubated first for 10 min to complete the proteins phosphorylations and then for 1h after the addition of 10 ng/ul DNA to start the translocation ATPase.
Figure 8.
ATPase reactions to determine the effect of Nek1 on the activity of recombinant ERCC6. Reactions were assembled as below and incubated first for 10 min to complete the proteins phosphorylations and then for 1h after the addition of 10 ng/ul DNA to start the translocation ATPase.
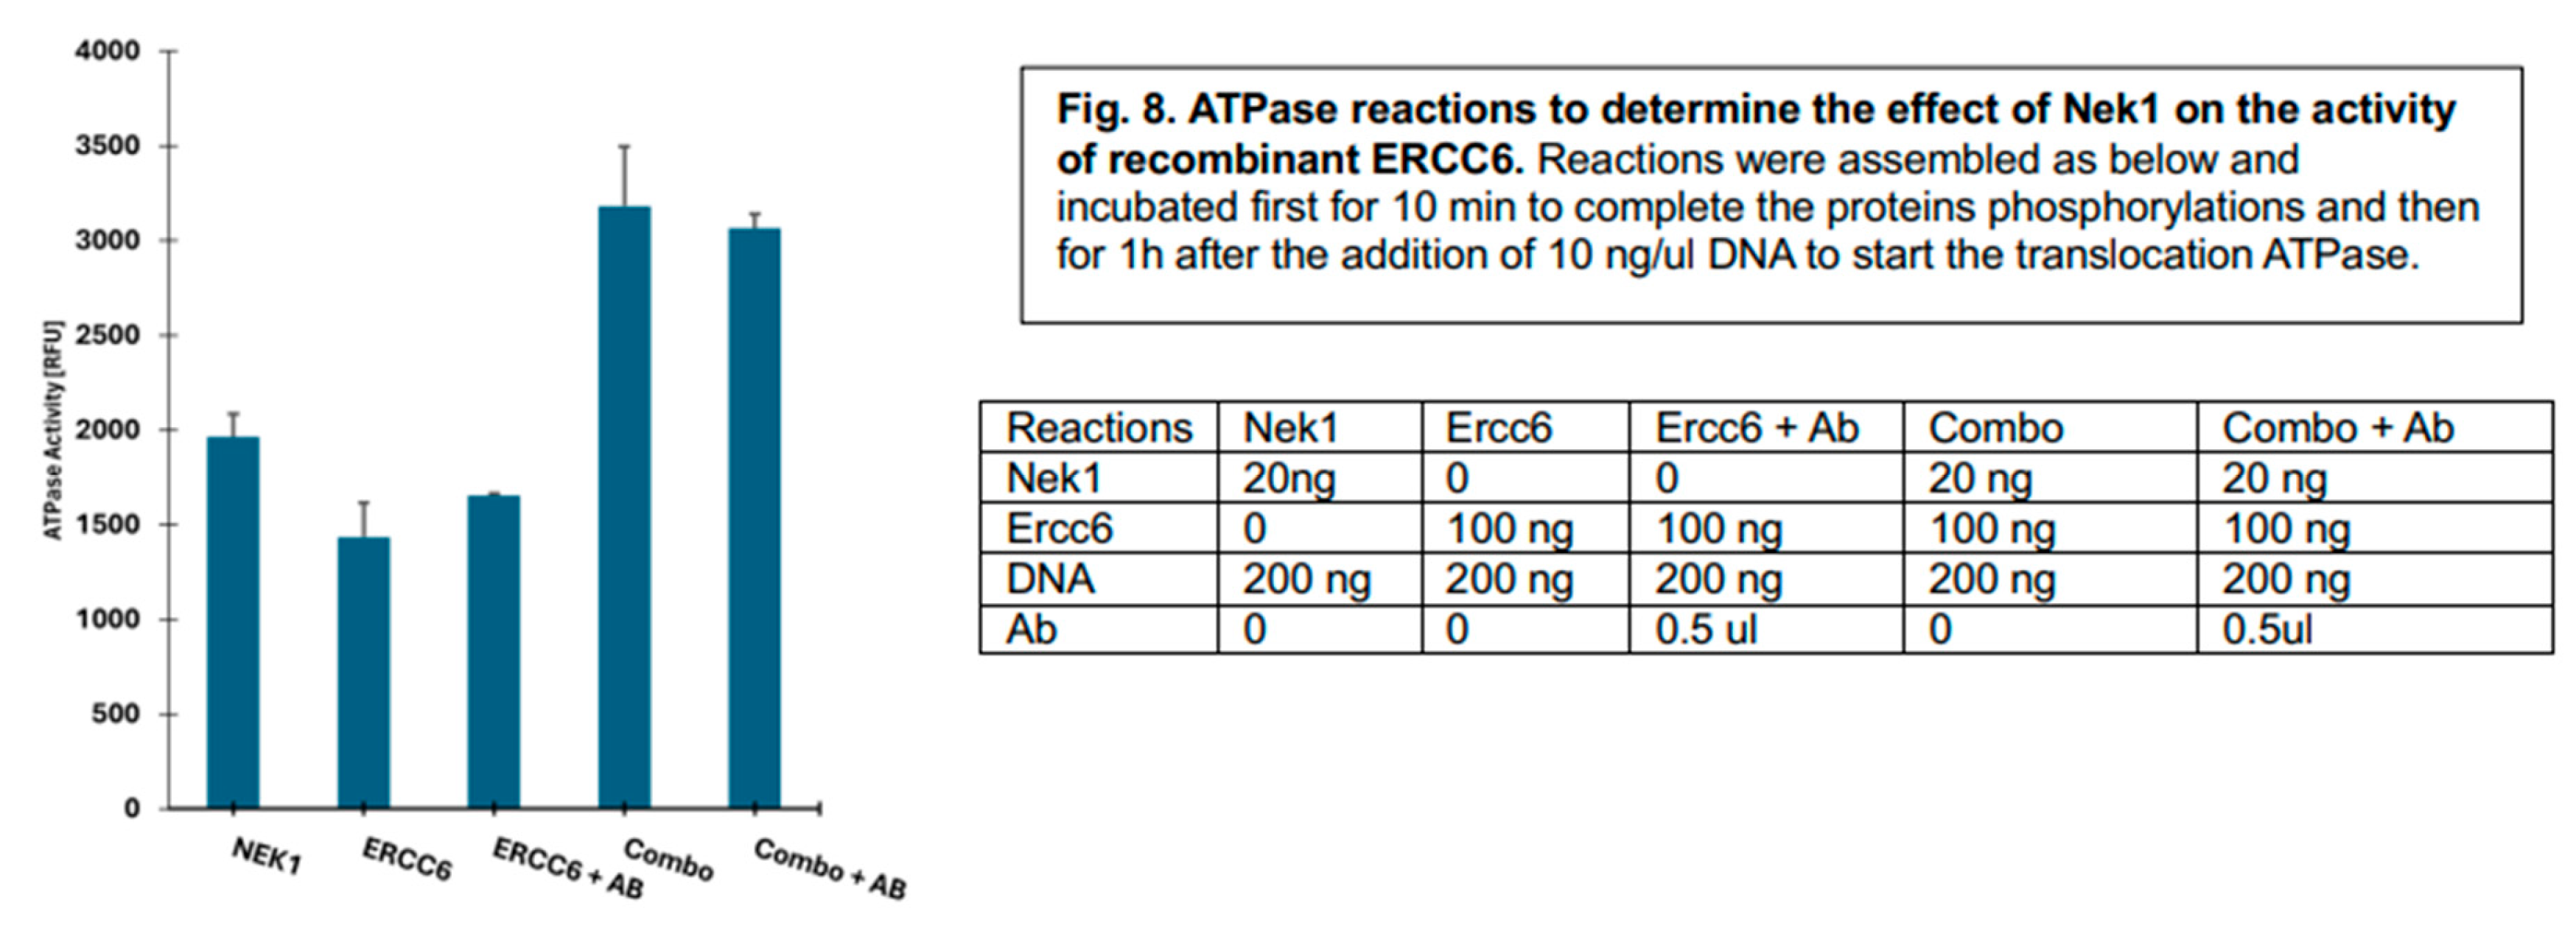
Figure 9.
Modelling and Simulation of the original and mutated sequence for DNA excision repair protein ERCC-6 in its unbound form; (a) Modelled protein structure with the initial pose of the simulation (Blue-original sequence and Green-mutated sequence) (b) The highlighted region showing the original and mutated residues, labelled (c) Dihedral angle plot for the α-carbon atoms of residues 624 to 627 during 1.0 µs MD simulation (d) RMSF for the selected residues 624-627.
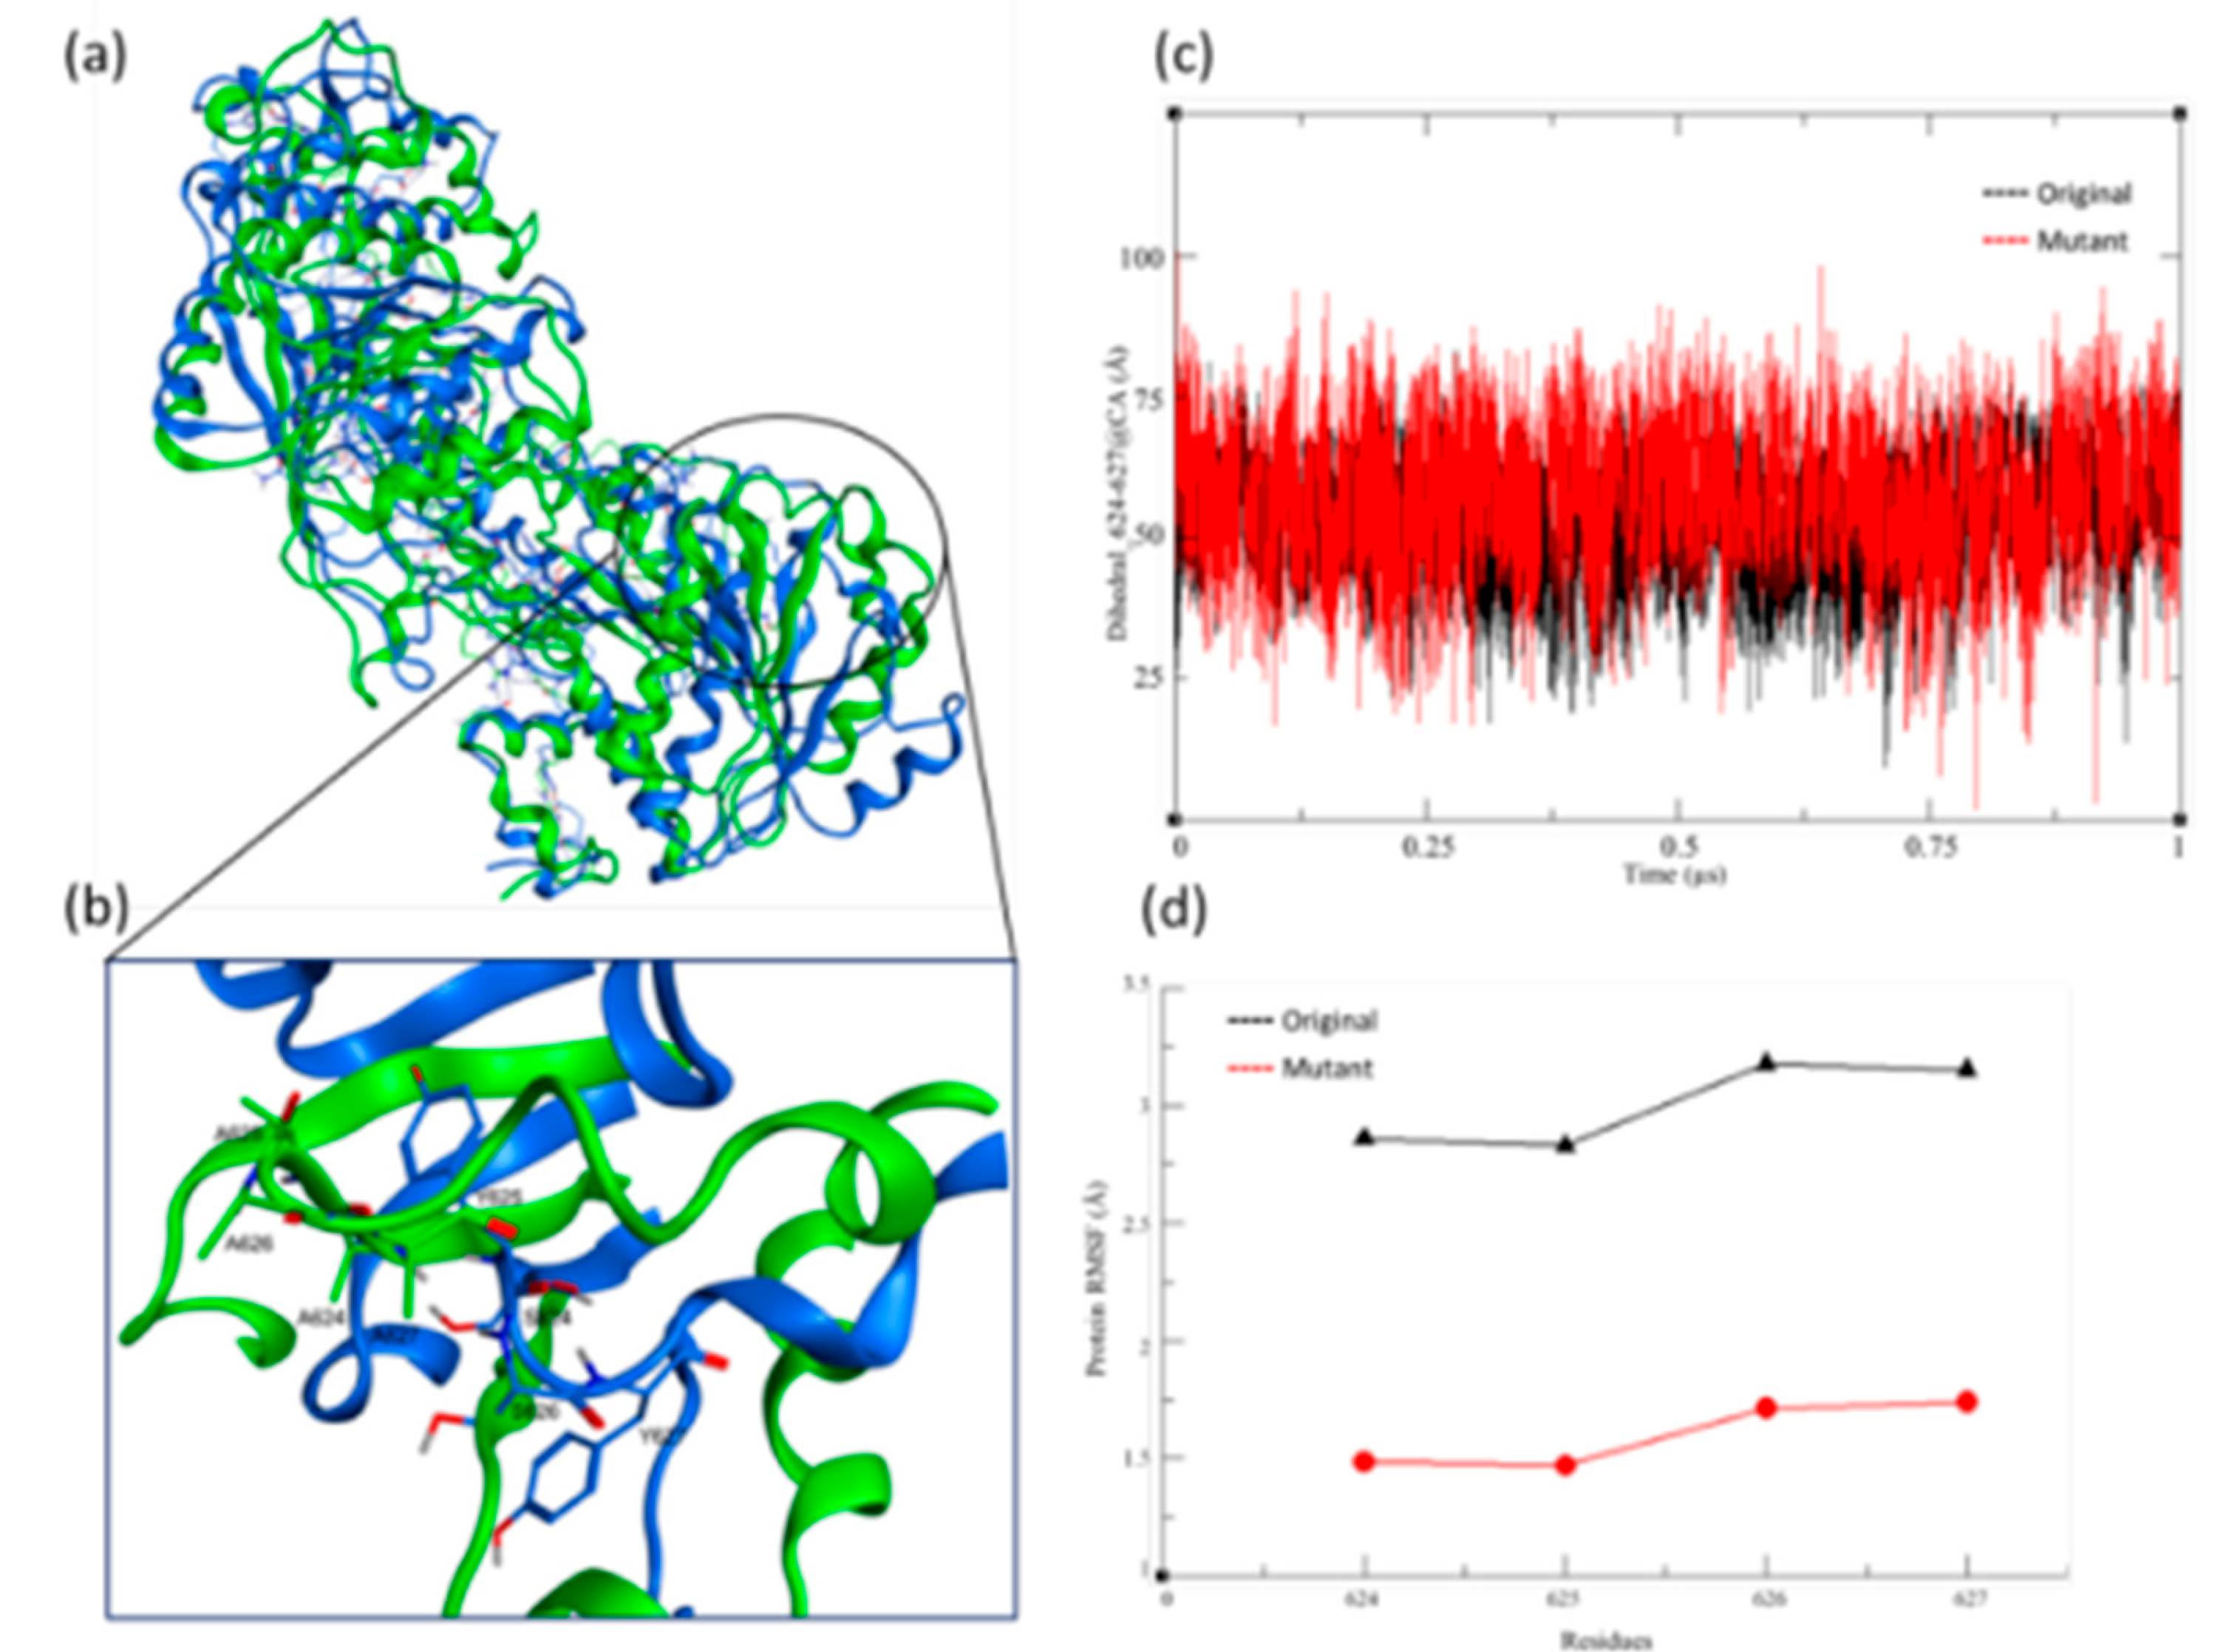
Figure 10.
Modelling and Simulation of the original and mutated sequence for DNA excision repair protein ERCC-6; (a) Initial stage of the simulations with the DNA segment bound to the original sequence model of the ERCC-6, showing interactions between the S624, Y625, S626 and Y627 residue side chains and the base pairs. (b) Final stage of the 1.0 µs MD simulations with the DNA segment bound to the ERCC-6, showing interactions between the S624, Y625, S626 and Y627 residue side chains and the base pairs. (c) 3D-Principal component analysis (PCA) plot for the original sequence model over the MDS trajectory with initial (red square) and final (green square) state of the model. (d) Dynamic cross correlation maps (DCCM) plot for the residues 624-627 only, using the MDS trajectory, the full analysis is provided in the SI. (e) The free energy landscape for the original sequence based on the protein RMSD and PCA. (f) Initial stage of the simulations with the DNA segment bound to the mutant sequence model of the ERCC-6 protein complex, showing interactions between the S624A, Y625A, S626A and Y627A residues and the base pairs. (b) Final stage of the 1.0 µs MD simulations with the DNA segment bound to the ERCC-6, showing interactions between the S624A, Y625A, S626A and Y627A residue and the base pairs. (c) 3D-Principal component analysis (PCA) plot for the mutated sequence model over the MDS trajectory with initial (blue square) and final (black square) state of the model. (d) Dynamic cross correlation maps (DCCM) plot for the mutant residues 624-627 only, using the MDS trajectory, the full analysis is provided in the SI. (e) The free energy landscape for the mutant sequence based on the protein RMSD and PCA. .
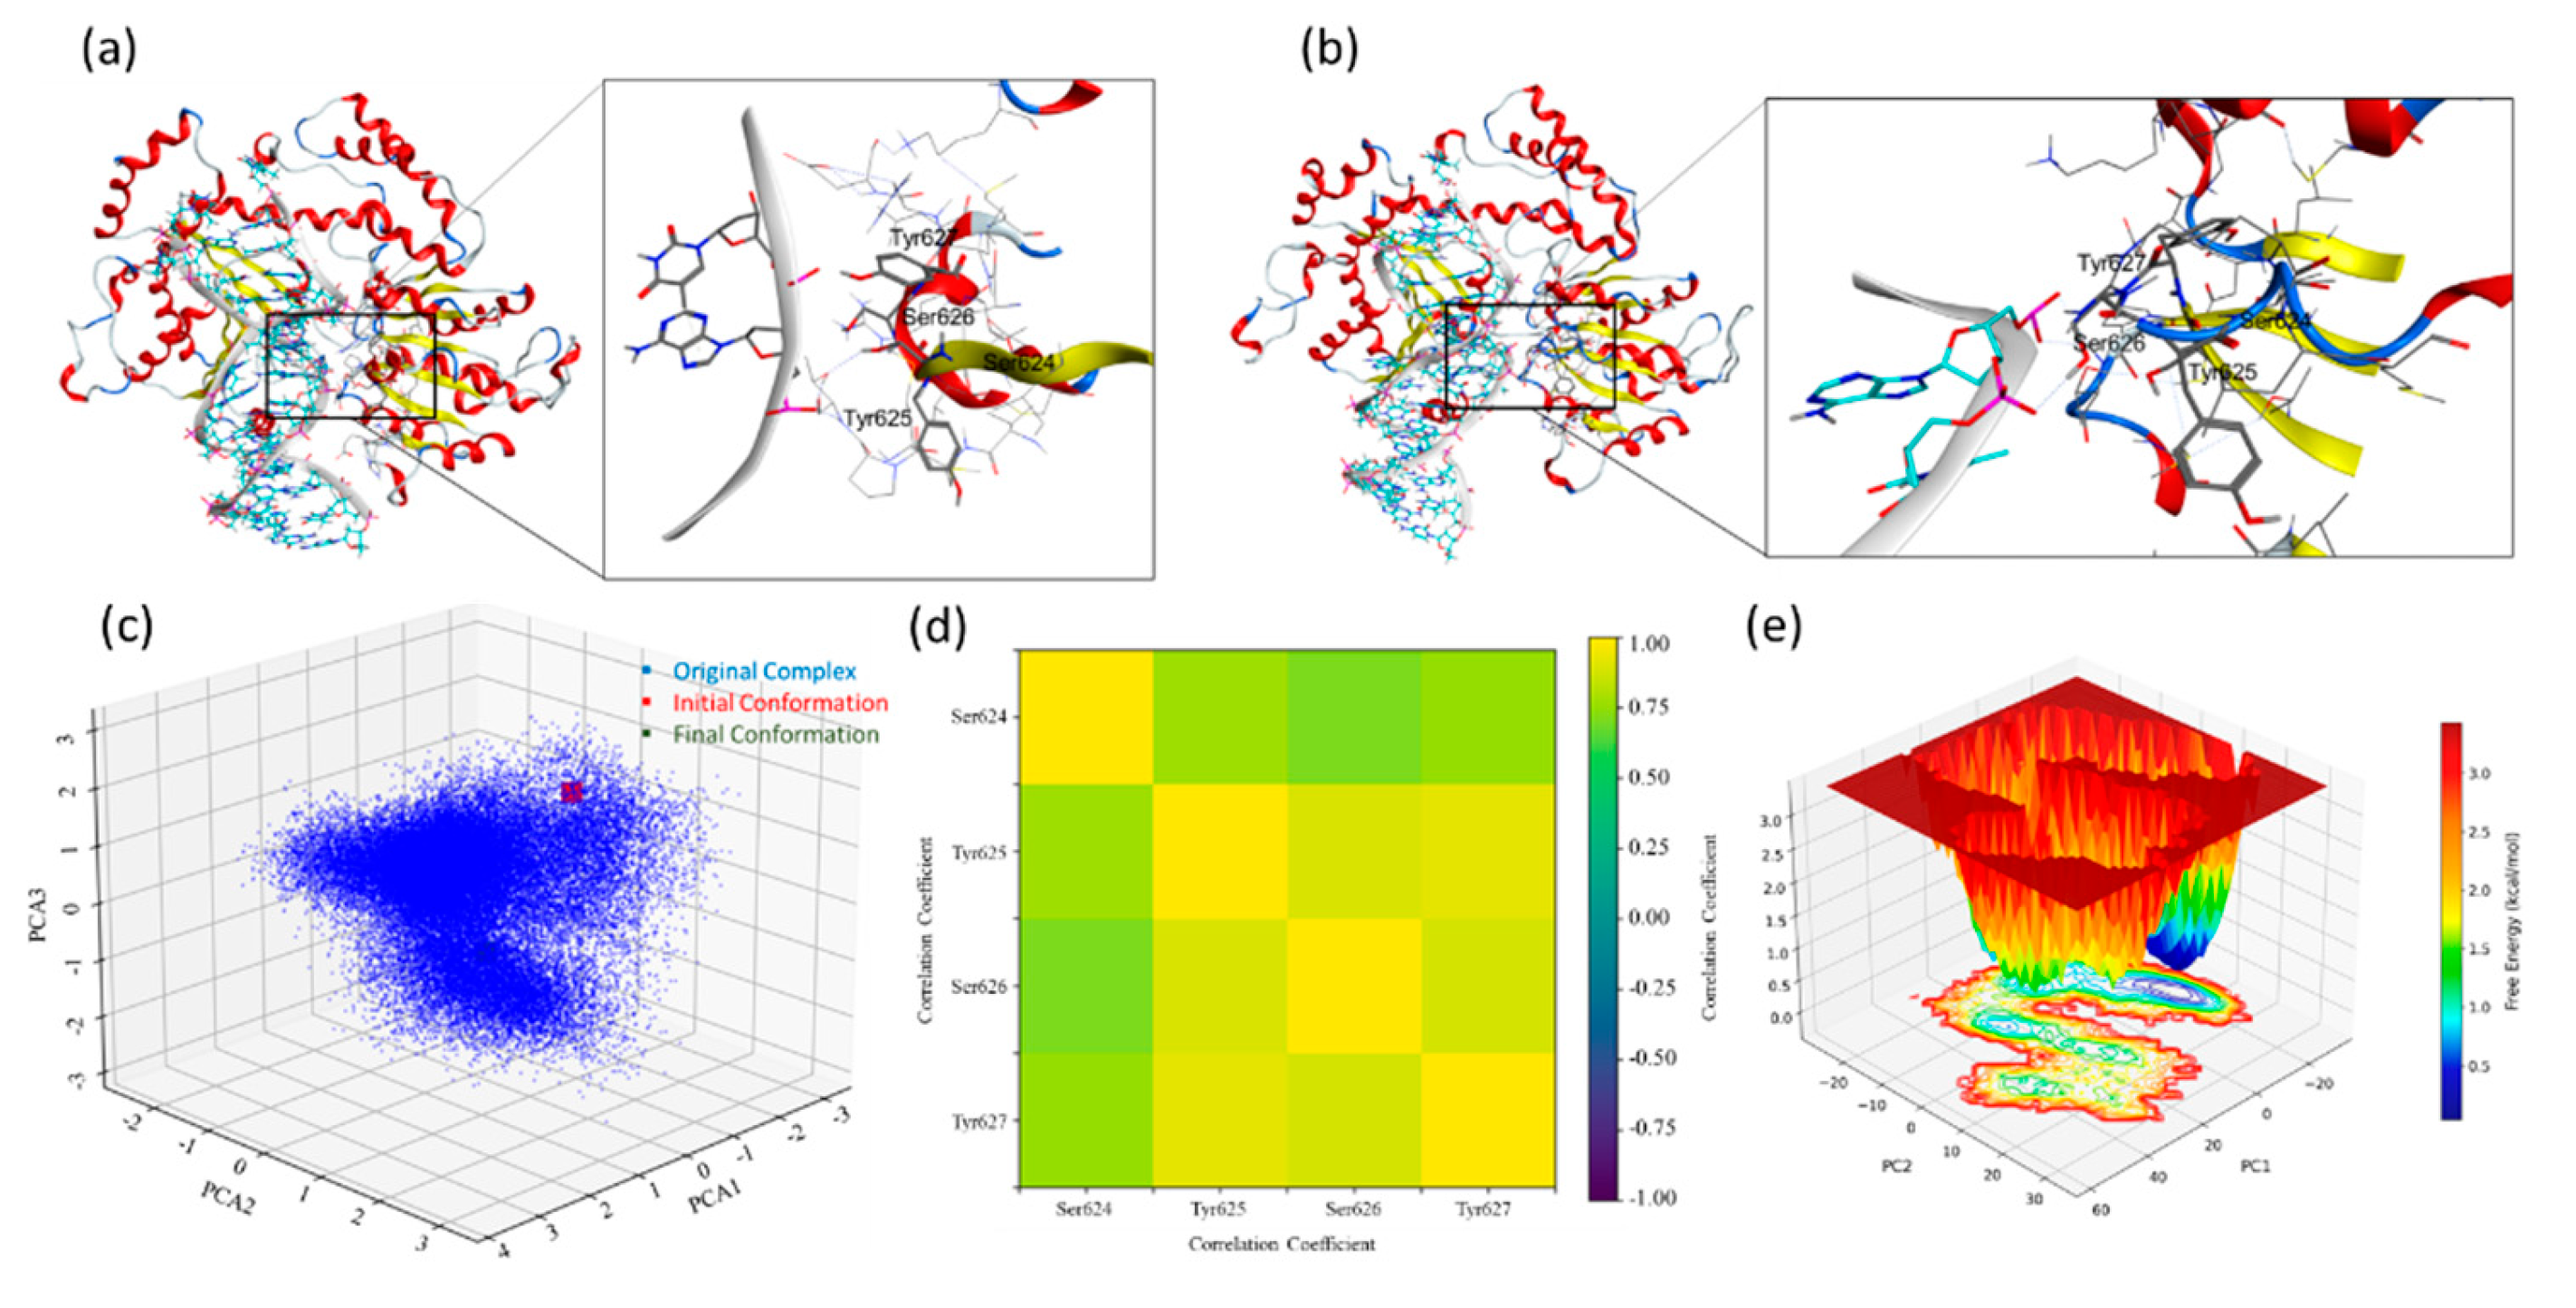
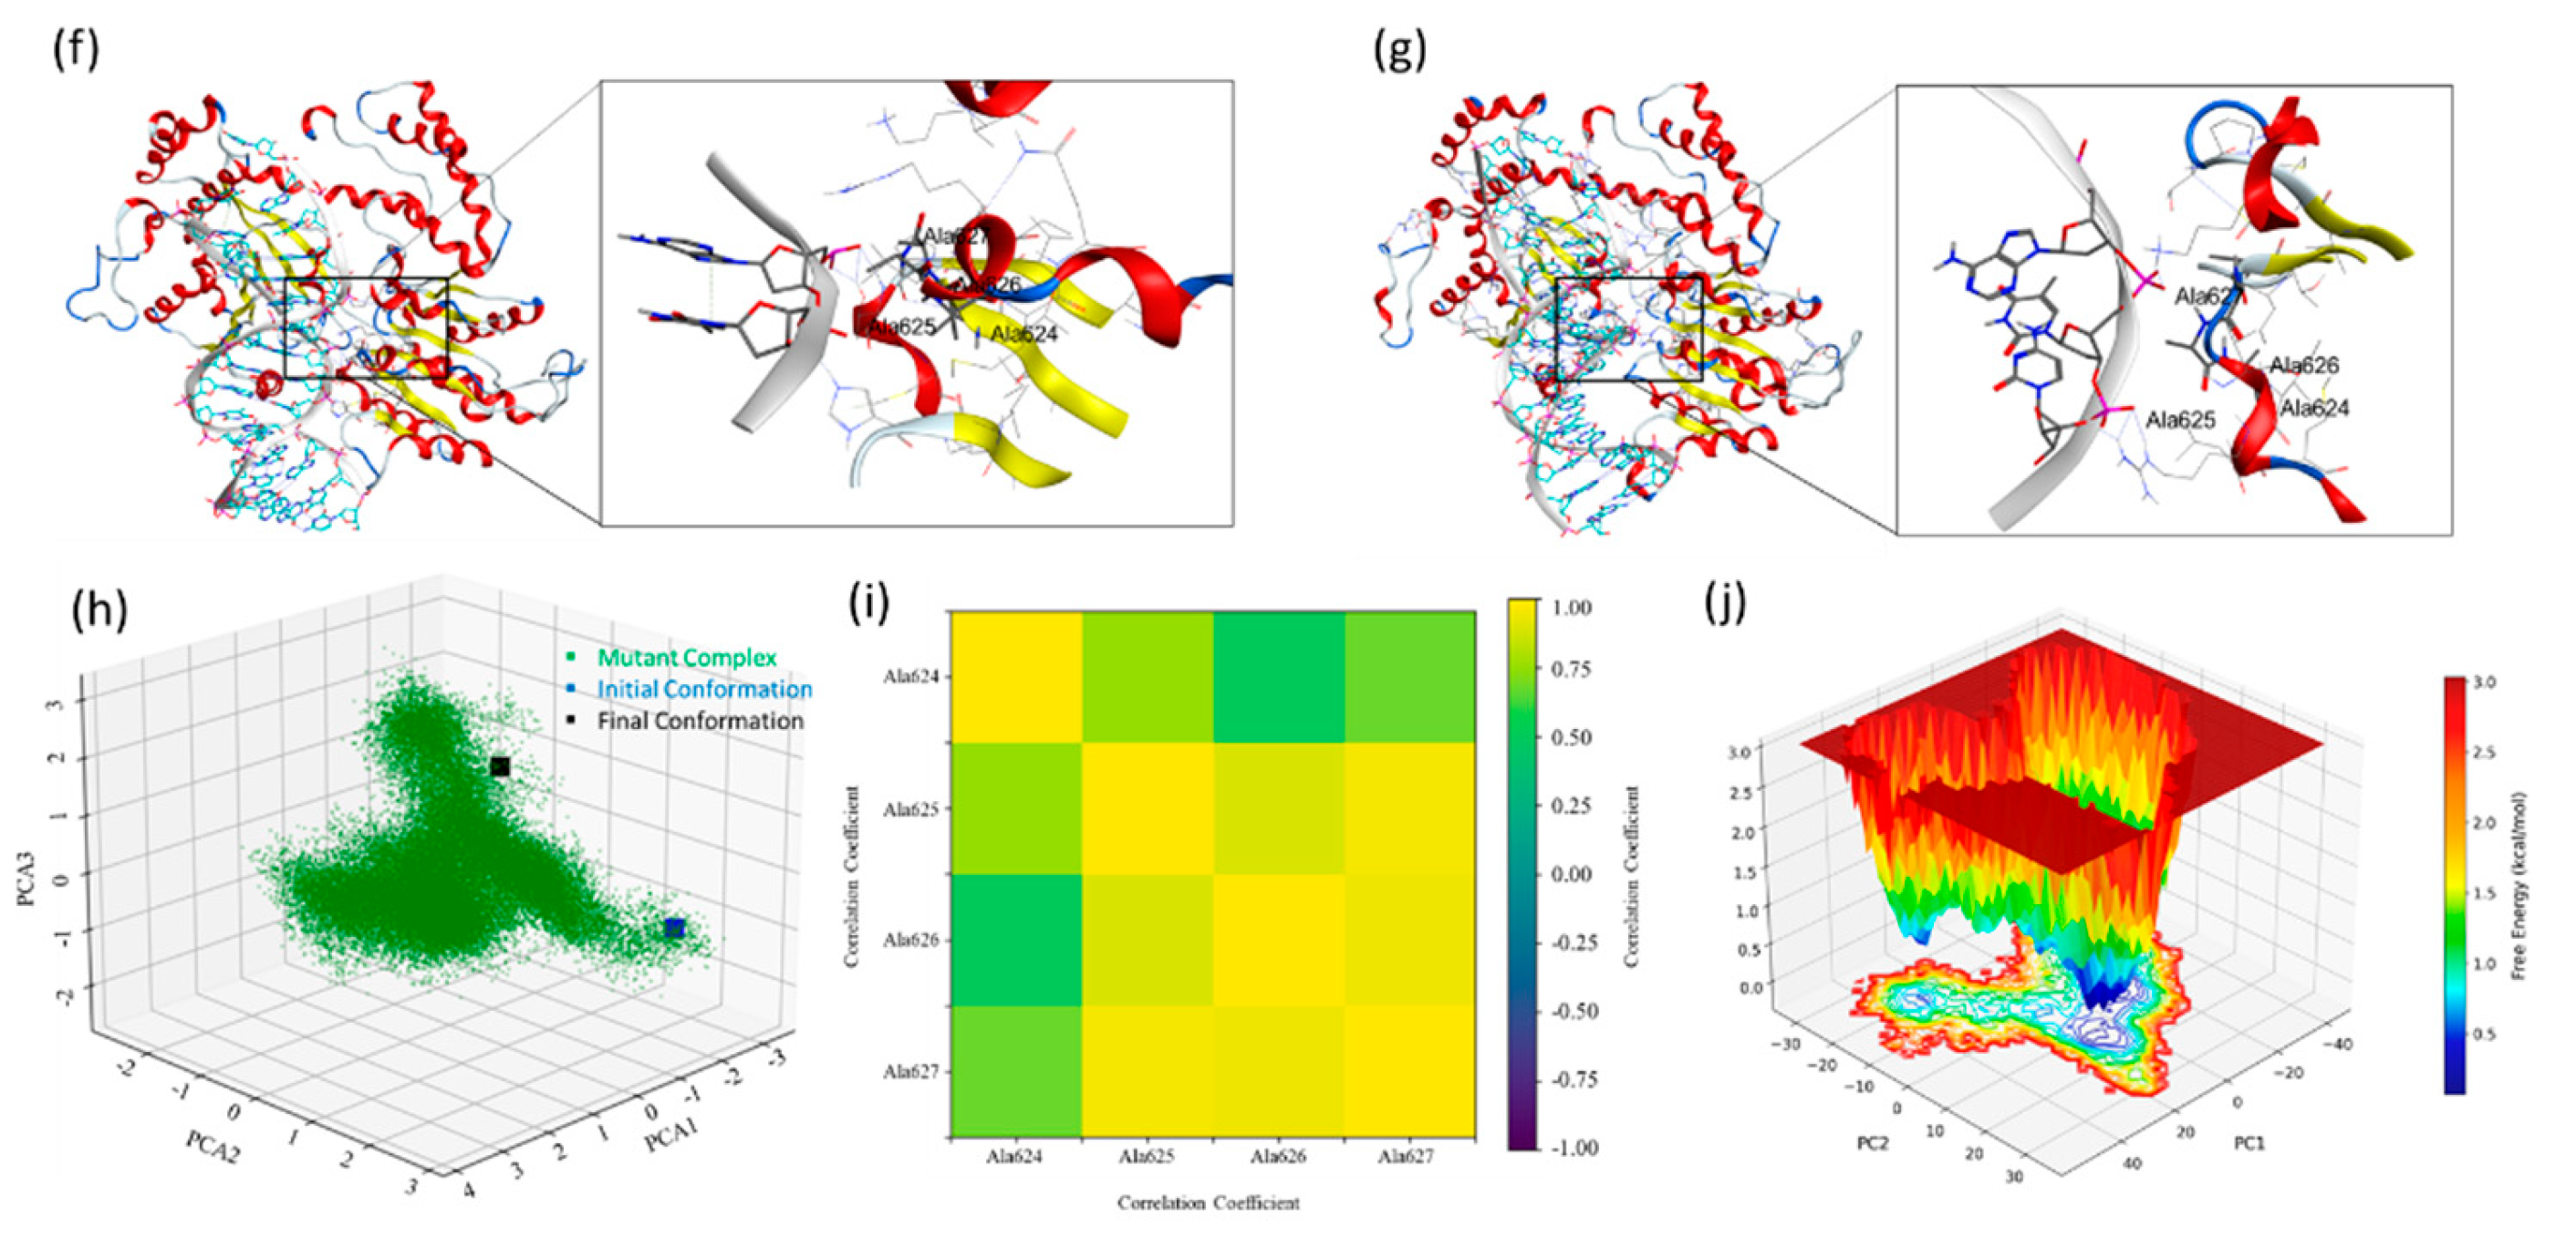
Figure 11.
Analysis of the modelled and simulated original and mutated sequence for DNA excision repair protein ERCC-6 bound to the duplex DNA segment; (a) Overlay of the original (blue) and the mutant (green) sequence model of the protein complex. (b) Protein residue (S624, Y625, S626 and Y627) interaction and hydrogen bond interactions with the base pairs. (c) Protein residue (S624A, Y625A, S626A and Y627A) interaction and hydrogen bond interactions with the base pairs. (d) RMSF for the whole protein and the focused on the residues of interest during MD simulation. (e) Validation parameters for the modeled original and mutant protein complexes. (f) Hydrogen bond interactions and distance-based analysis of trajectories for Ser626(OG)-DT1011(OP2) and Thr575(N)-DA1010(OP2) for the original sequence model. (g) Dihedral angle plot for the α-carbon atoms of residues 624 to 627 during 1.0 µs MD simulation for original and mutant sequence models. .
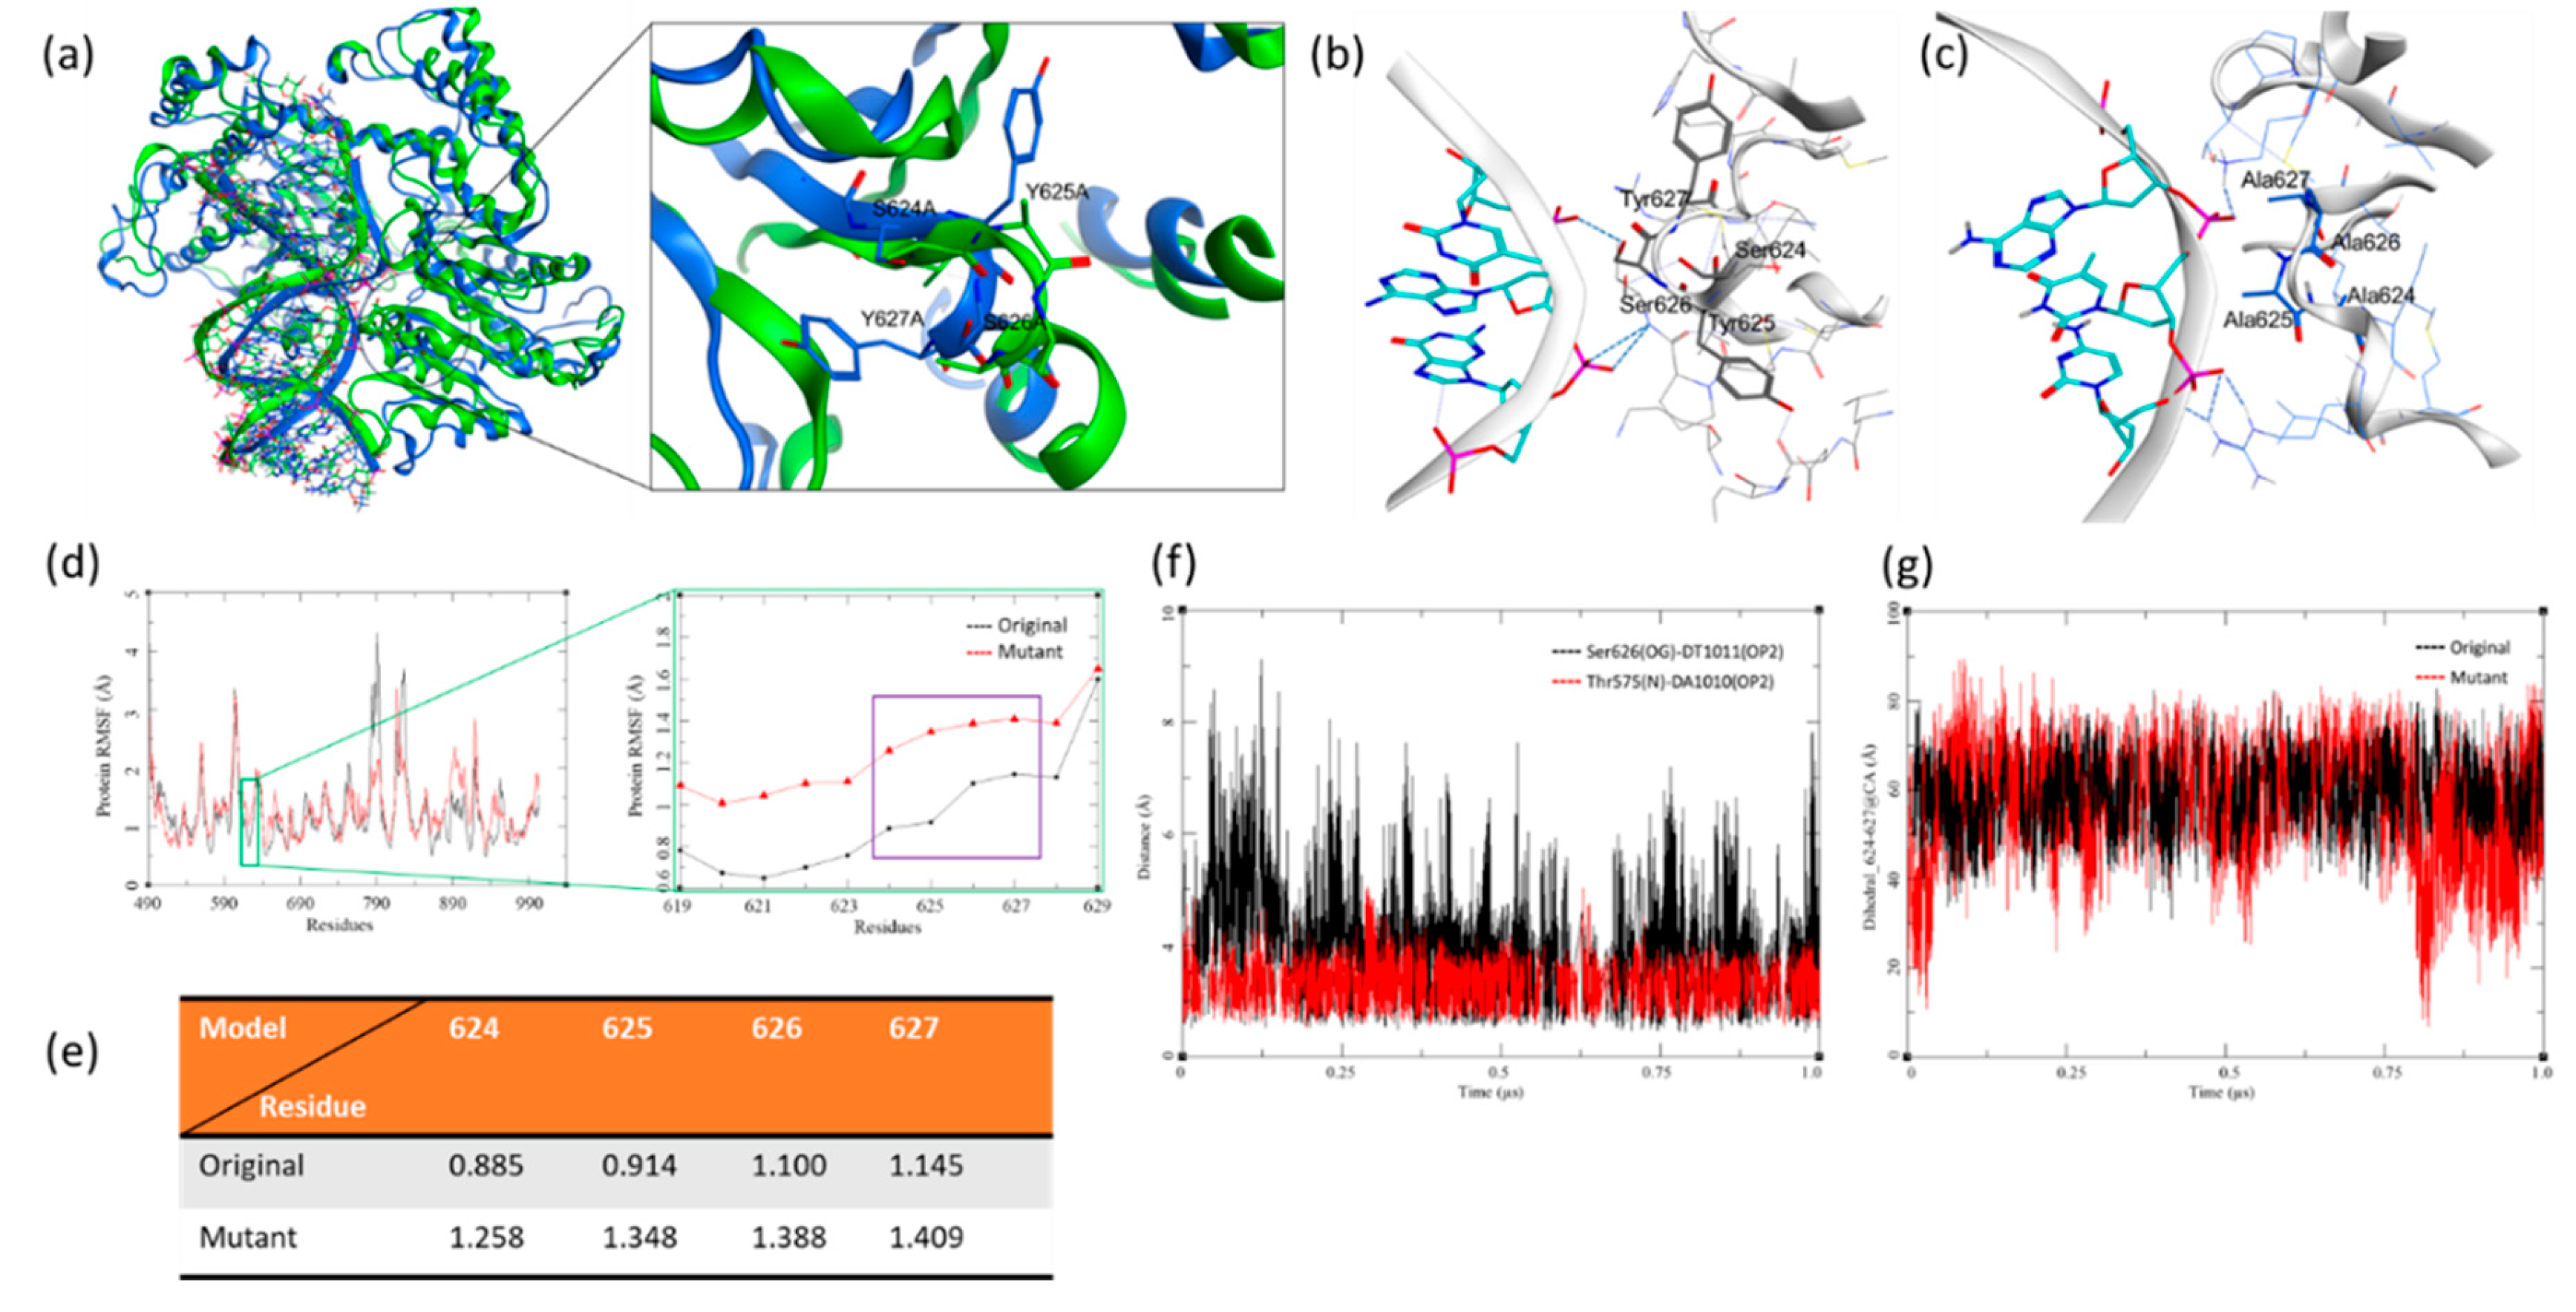
Figure 15.
Time course of CPD removal in the same cells following UV (10s). 15 ng of DNA isolated from the indicated cells and time points was affixed and probed with anti-CPD Ab. A control on the right shows that the assay works well only with diluted DNA and irradiated in vivo.
Figure 15.
Time course of CPD removal in the same cells following UV (10s). 15 ng of DNA isolated from the indicated cells and time points was affixed and probed with anti-CPD Ab. A control on the right shows that the assay works well only with diluted DNA and irradiated in vivo.
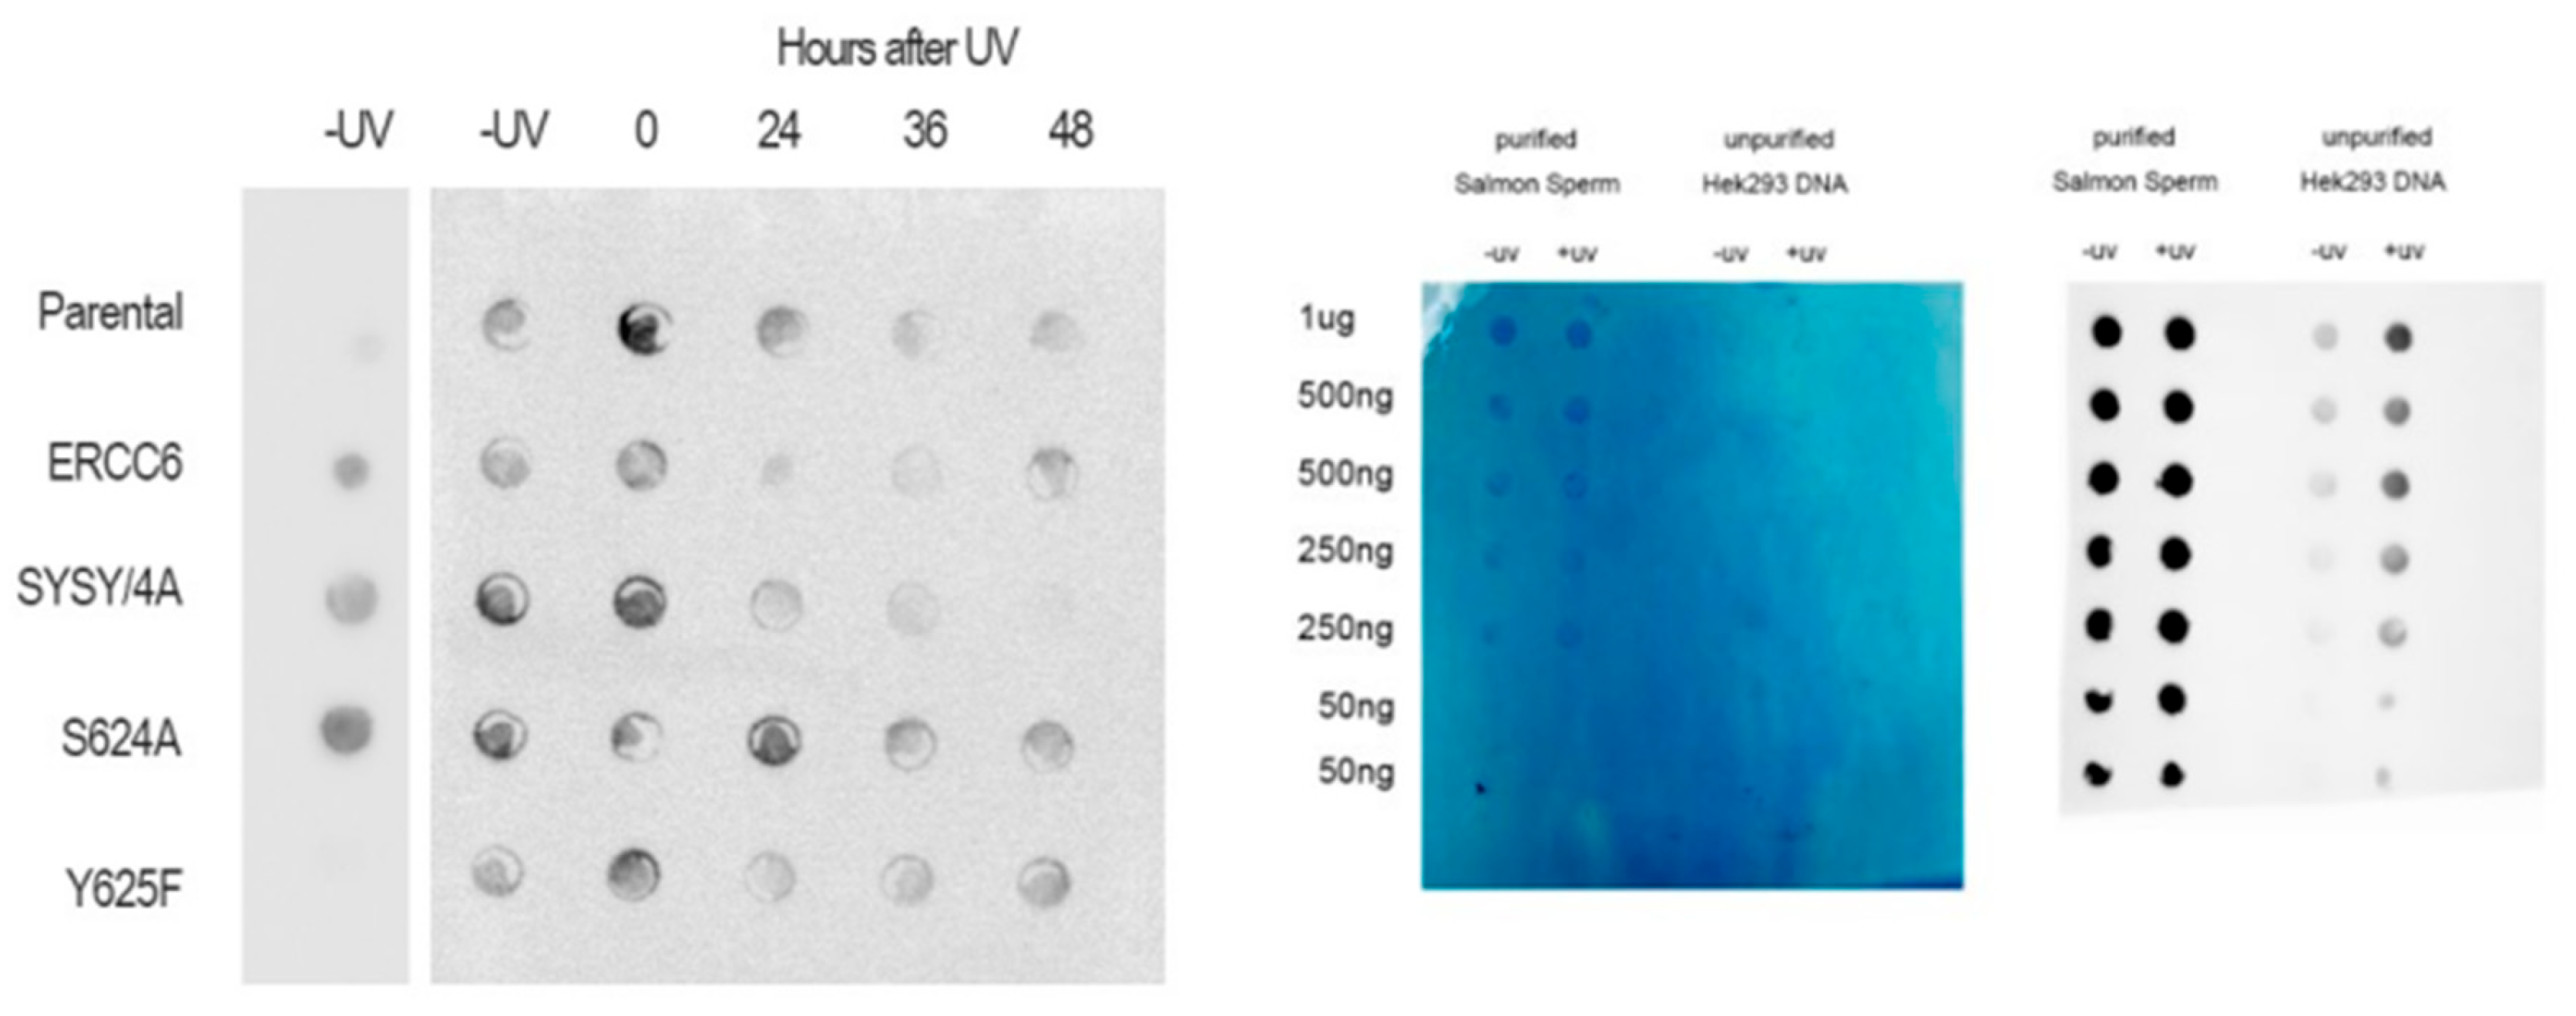
Figure 16.
Expression of a panel of ISR genes in ERCC6-WT and Y625F mutant expressing cells during recovery from 10s UV exposure.
Figure 16.
Expression of a panel of ISR genes in ERCC6-WT and Y625F mutant expressing cells during recovery from 10s UV exposure.
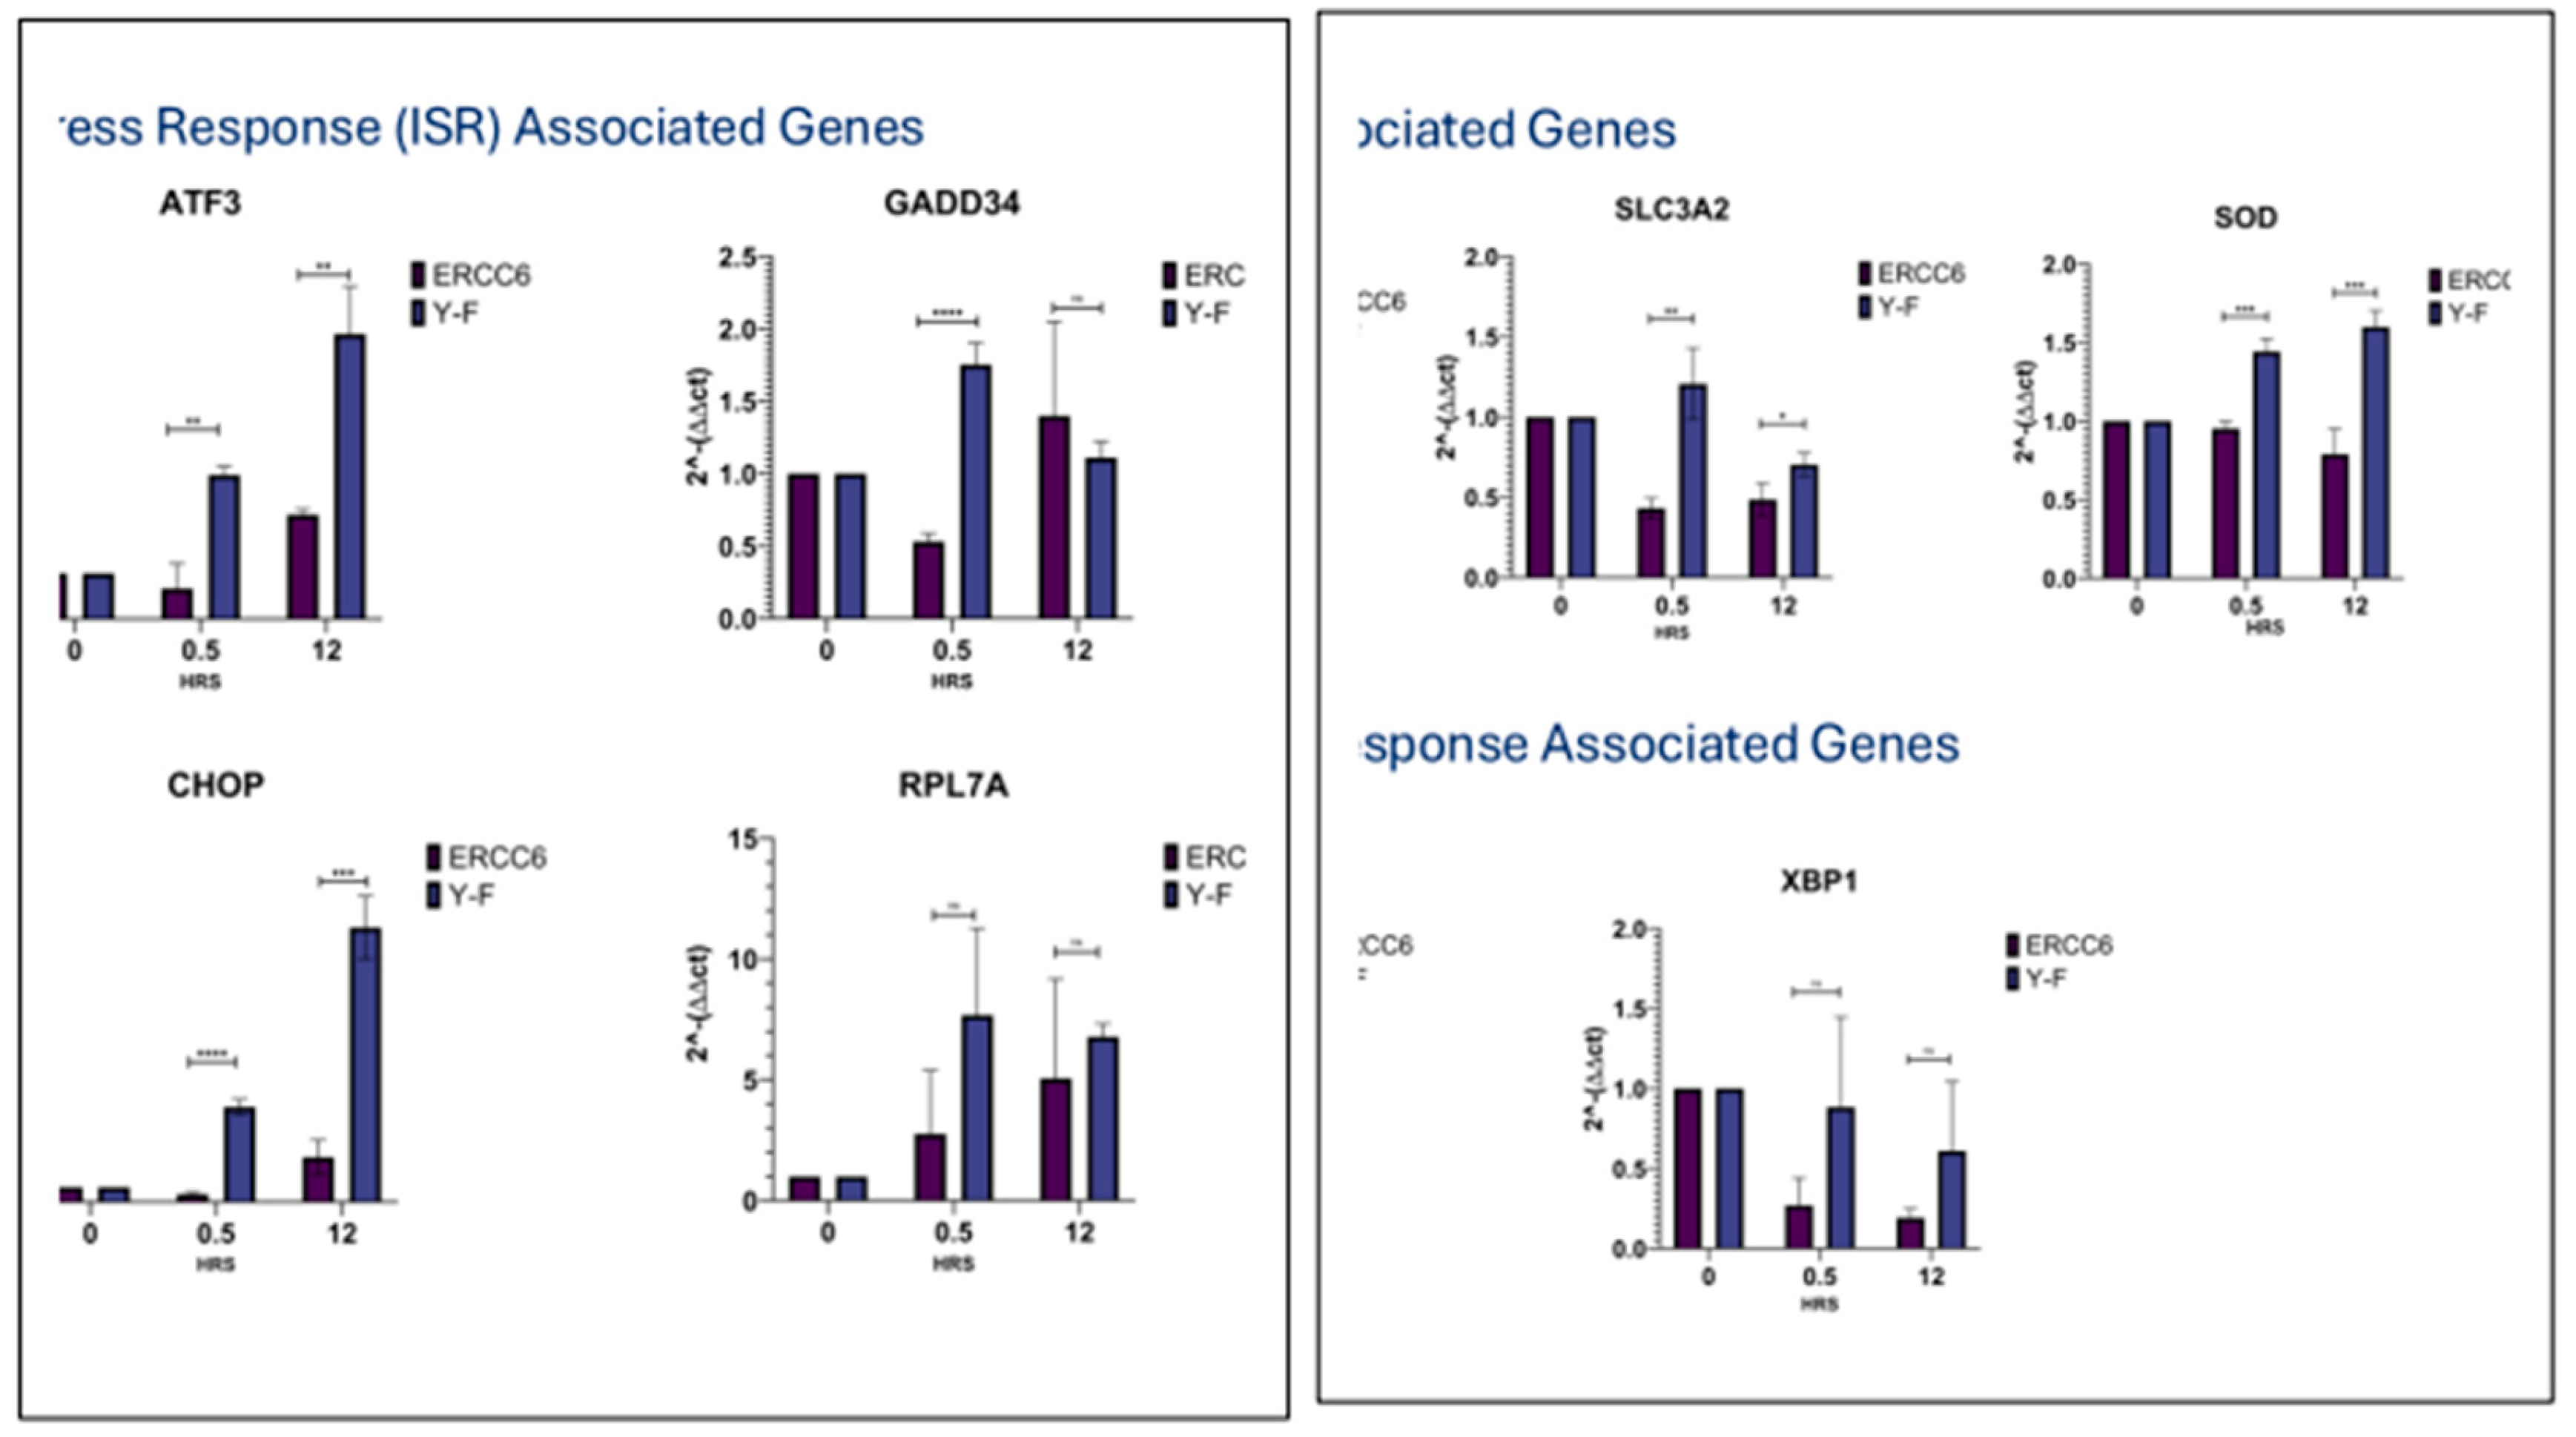
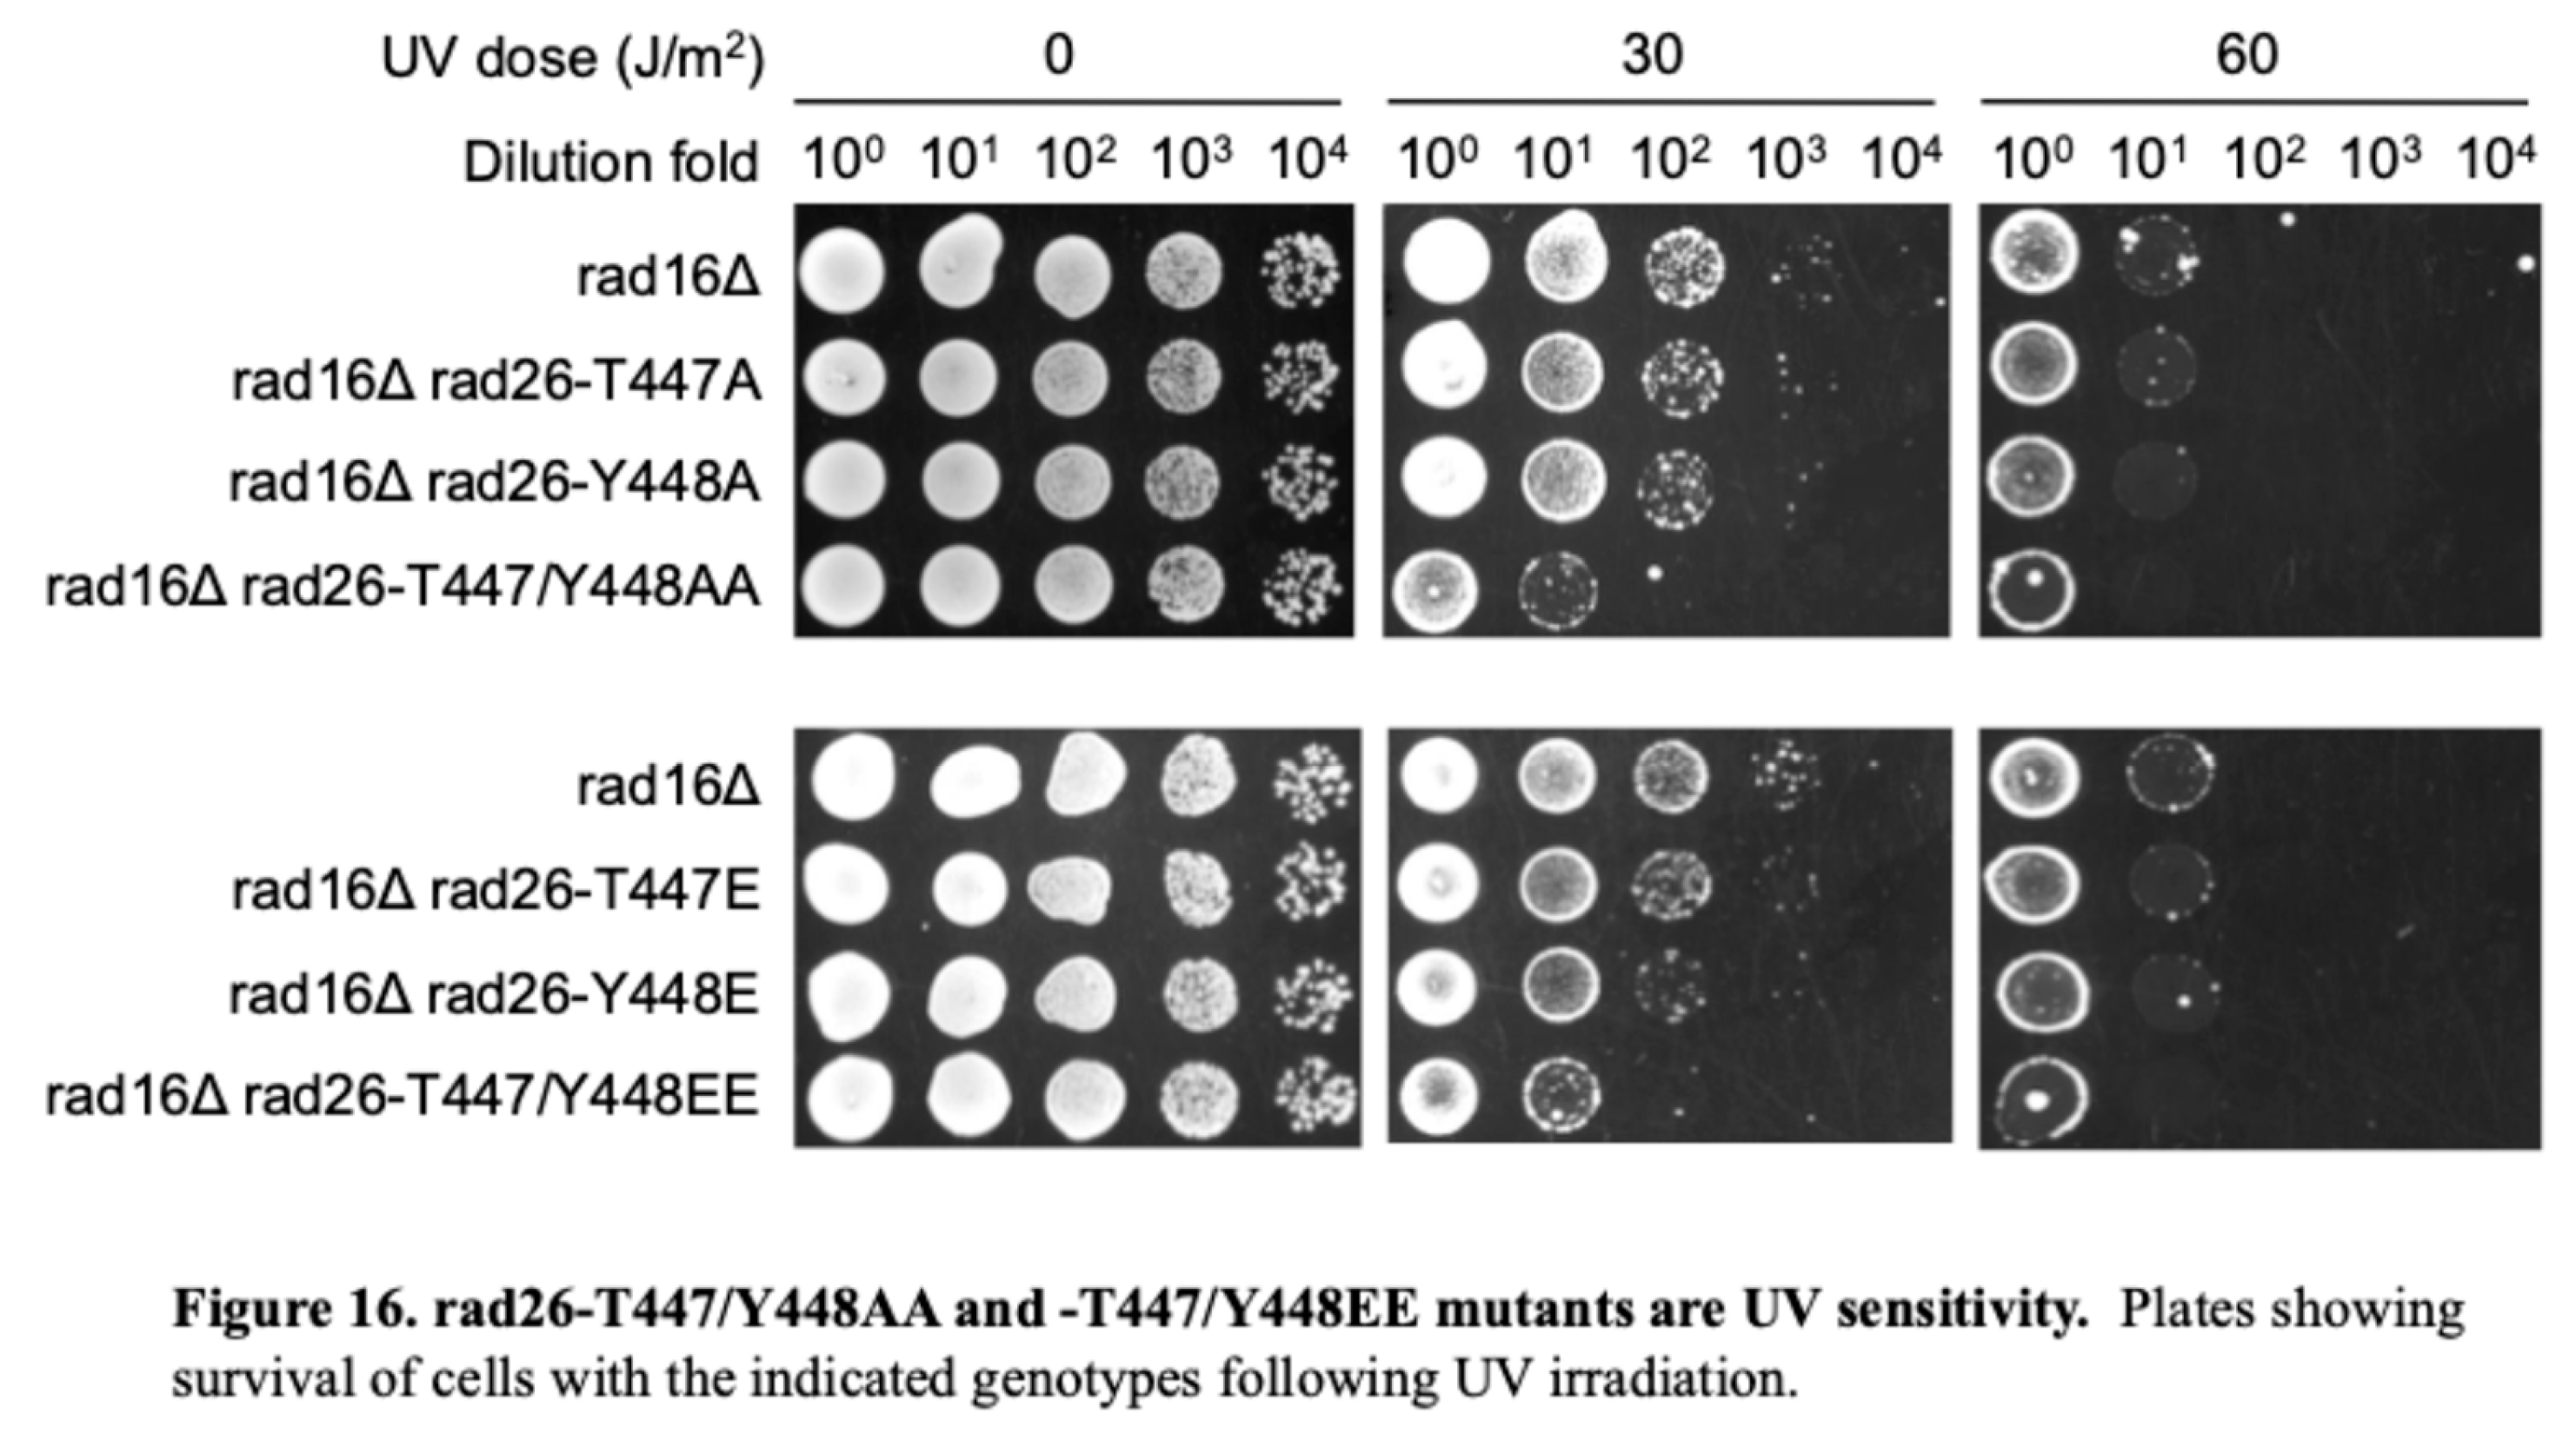
Figure 17.
Figure 17. Figure 2. rad26-T447/Y448AA abolishes Rad26’s TCR function. Pseudo images showing effects of rad26Δ and rad26-T447/Y448AA (rad26-AA) on TCR. A–F, bands reflecting CPDs remaining along the TS of the moderately transcribed RPB2 (A-C) and highly transcribed YEF3 (D-F) genes in rad16Δ cells at the indicated repair times (min). ‘U’, sample unirradiated with UV. Numbers on the left indicating the nucleotide positions of the genes are relative to the major TSS (+1).
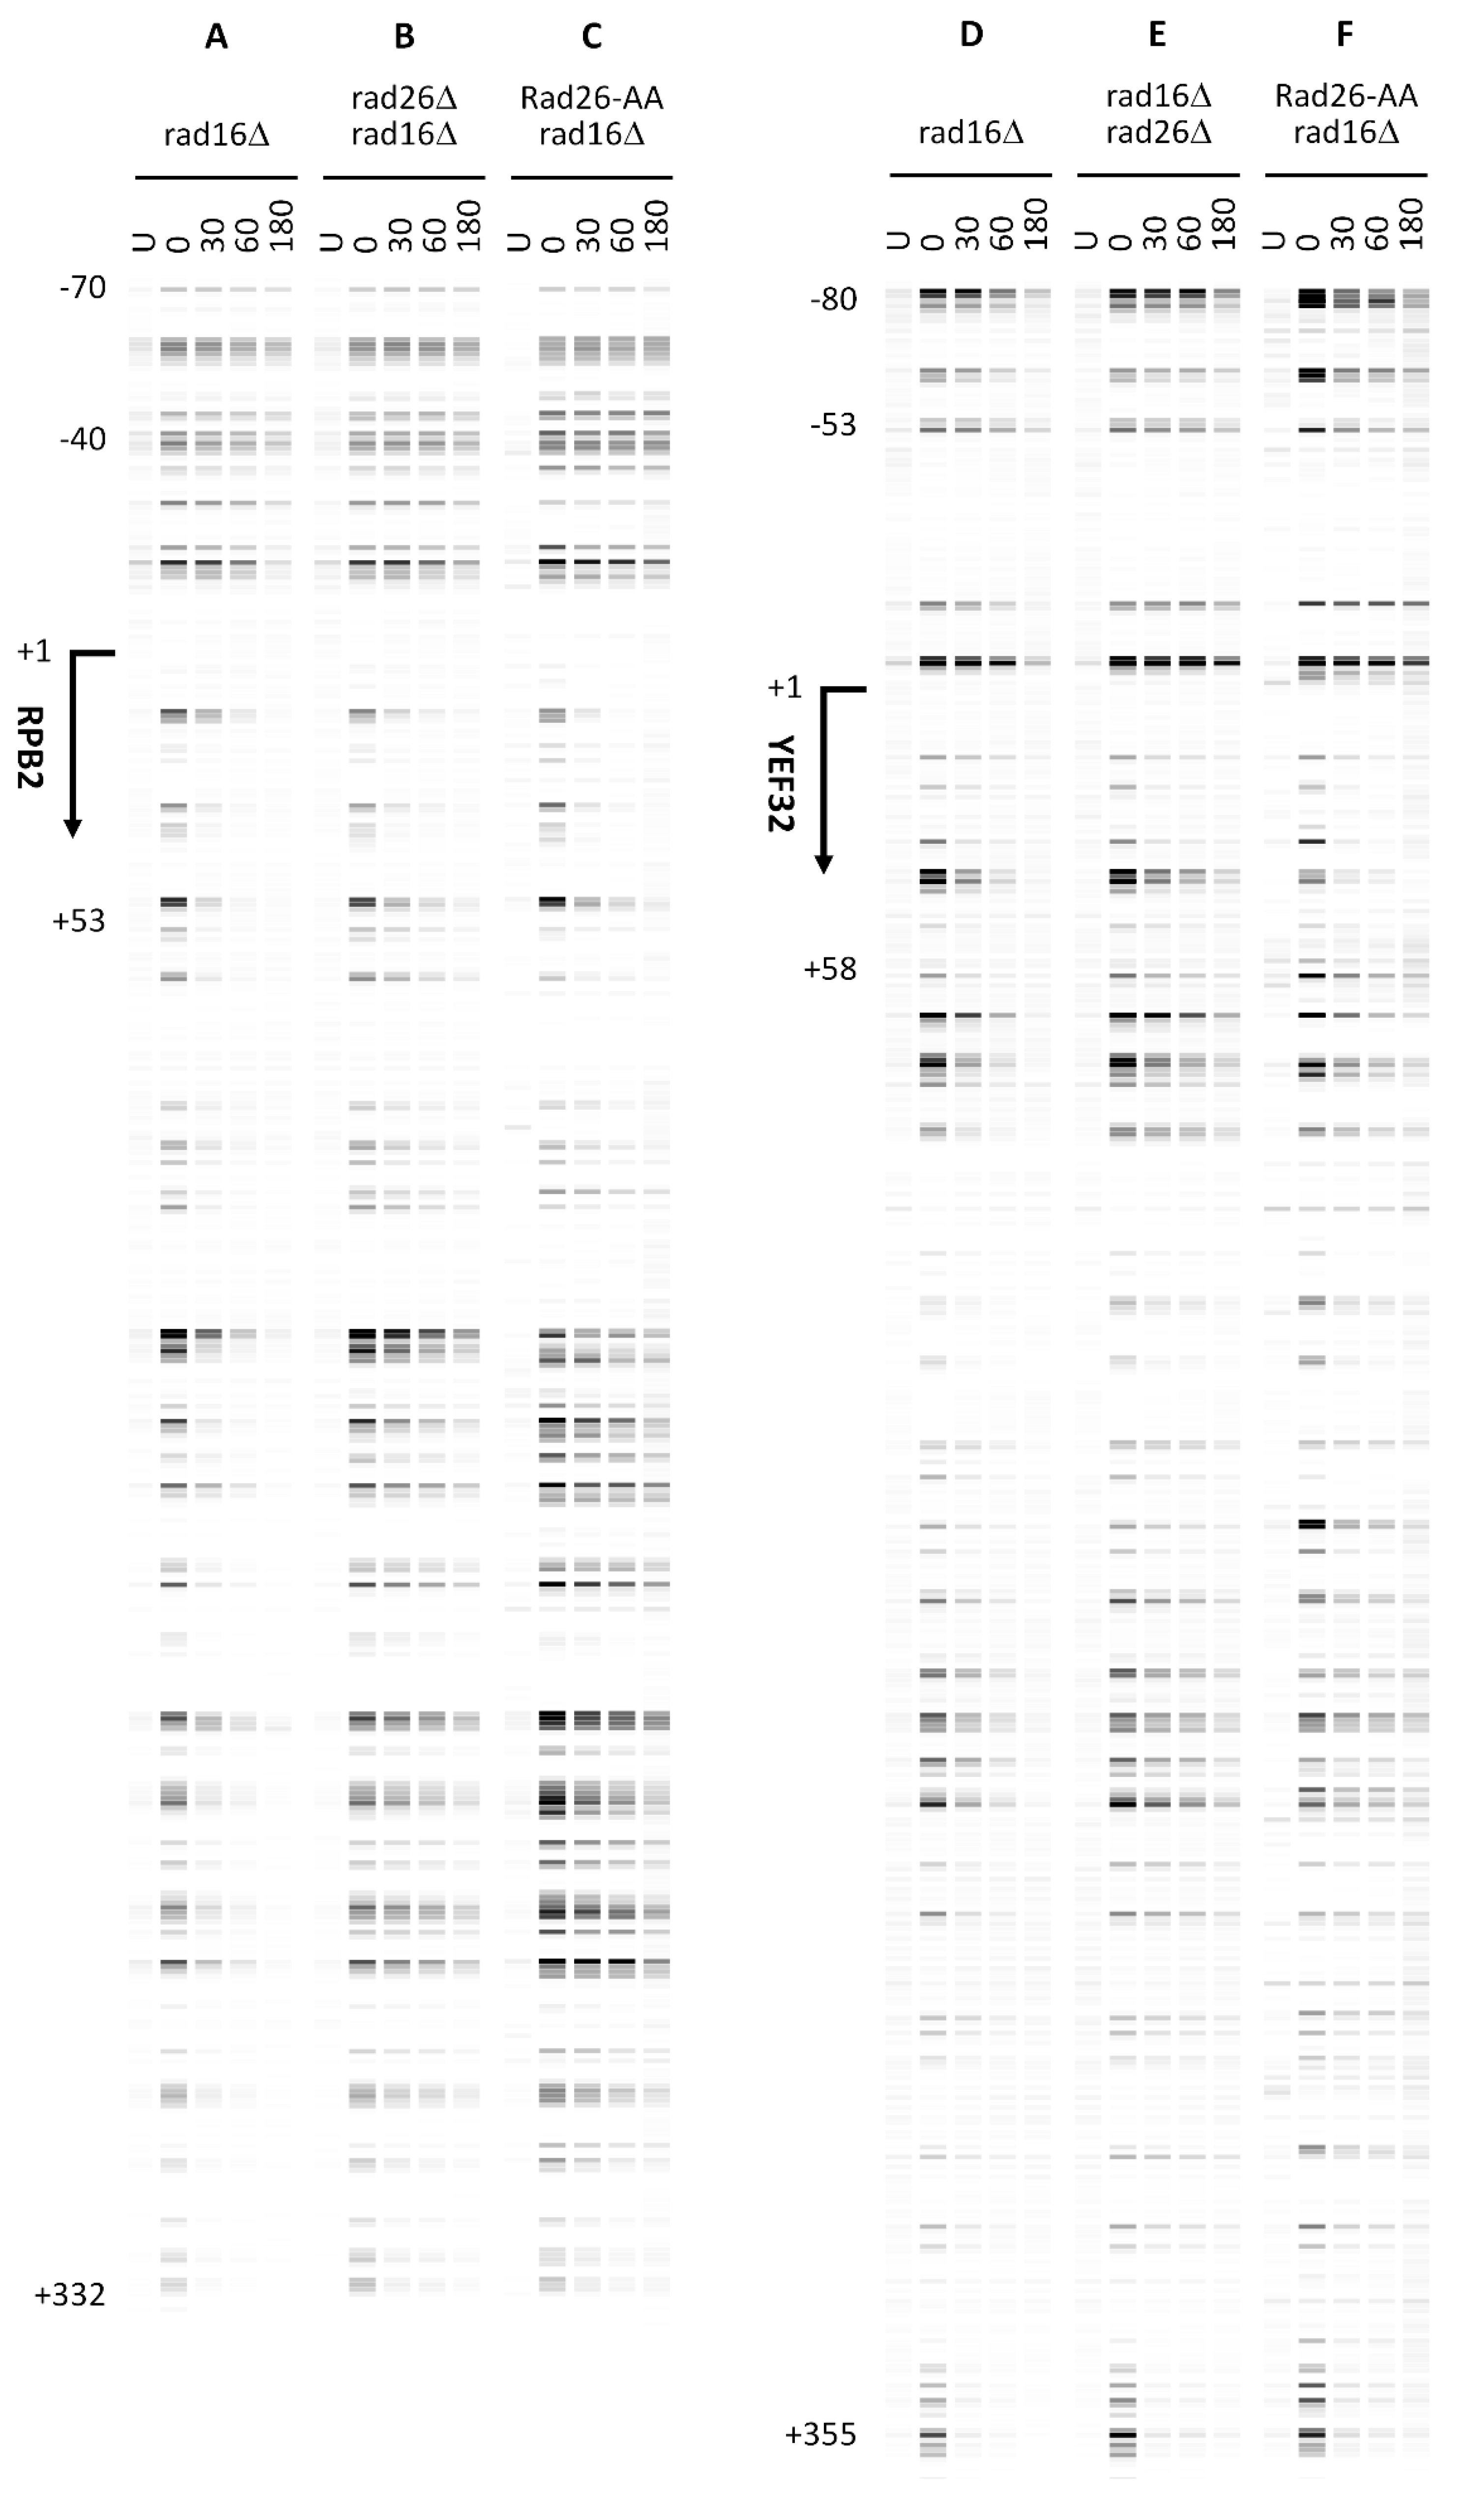
Disclaimer/Publisher’s Note: The statements, opinions and data contained in all publications are solely those of the individual author(s) and contributor(s) and not of MDPI and/or the editor(s). MDPI and/or the editor(s) disclaim responsibility for any injury to people or property resulting from any ideas, methods, instructions or products referred to in the content. |
© 2025 by the authors. Licensee MDPI, Basel, Switzerland. This article is an open access article distributed under the terms and conditions of the Creative Commons Attribution (CC BY) license (http://creativecommons.org/licenses/by/4.0/).
Copyright: This open access article is published under a Creative Commons CC BY 4.0 license, which permit the free download, distribution, and reuse, provided that the author and preprint are cited in any reuse.


