
Submitted:
28 October 2025
Posted:
31 October 2025
You are already at the latest version
Abstract
Background: MicroRNAs (miRNAs) regulate gene expression critical for embryo implan-tation, but integrated analyses of miRNA changes in both endometrium and plasma dur-ing the peri-implantation period are lacking. Methods: A total of 62 endometrium and 62 plasma samples were collected from participants undergoing hormone treatment cycles between day P+3 to P+7. Next-generation sequencing (NGS) assay was used to profile miRNA expression levels. To identify the dynamic differentially expressed (DE) miRNAs, we compared the following groups: P+3/P+4, P+4/P+5, P+5/P+6, and P+6/P+7. Then, we perform functional miRNA-target interaction (MTI) and pathway enrichment analysis to understand the biological functions of DE miRNAs. Results: A total of 76 DE miRNAs in endometrium and 48 in plasma were identified. These miRNAs are involved in pathways related to implantation, such as cell senescence, cell growth, apoptosis, focal adhesion, autophagy, platelet activation and signaling. Ten DE miRNAs overlapped between en-dometrial tissue and plasma, with seven showing consistent dynamic expression changes. Further analysis revealed a high similarity in the biological pathways and functions in-volving the target genes of DE miRNAs in both endometrium and plasma. Conclusions: Dynamic miRNA expression changes in both endometrium and plasma reflect key bio-logical processes regulating human embryo implantation.
Keywords:
periimplantation
; HRT cycle
; endometrium
; plasma
; microRNAs
; Next generation sequencing
; functional enrichment analysis
1. Introduction
The peri-implantation period is critical for successful embryo implantation and subsequent pregnancy outcomes. During this time, significant changes occur in the endometrium to create a suitable uterine microenvironment for embryo transfer, known as the window of implantation (WOI) [1,2]. This window typically spans day 3 to 7 post-progesterone administration in a hormone replacement cycle for in vitro fertilization (IVF) treatments. Research has extensively explored the regulatory network of embryo implantation, revealing that successful implantation depends on various factors including hormones levels, growth factors, immune responses, uterine microenvironments, and embryo quality [3,4,5,6]. Notably, small non-coding RNAs, particularly miRNAs, play a pivotal role in influencing implantation processes by regulating the gene expression and epigenetic mechanisms associated with these factors [7,8,9].
MiRNAs are small non-coding RNAs, 20–30 nucleotides in length, with over 2,500 identified in the human genome [10,11]. These miRNAs function as post-transcriptional gene regulators, playing vital roles in various biological processes during the peri-implantation period. These processes include endometrium proliferation, oocyte quality, and embryogenesis - all crucial determinants of reproductive outcomes [8,12,13]. Given the significant role of miRNAs, various diagnostic tools utilizing miRNA profiles from endometrial tissues have been developed to determine the optimal timing for embryo transfer and enhance fertilization processes [14,15]. Additionally, many studies have examined both miRNAs and implantation-related protein-coding genes to better understand endometrial pathologies such as endometriosis, preeclampsia, endometrial cancer, and ovarian cancer [16,17].
Various sample types, including endometrial tissues, plasma, and luminal fluid, have revealed distinct profiles of miRNA and implantation-related protein-coding genes in patients with recurrent implantation failure [14,15,18,19]. Furthermore, cell-free miRNAs have gained attention for their effectiveness, stability, and non-invasive nature in supporting IVF processes. These include detecting biochemical pregnancy loss after embryo transfer, early pregnancy, and personal receptivity stages [8,20,21]. A blood-based diagnostic platform analyzing patient’s miRNA expression profiles has also been developed to support personalized embryo transfer timing determination [22]. Recent evidence has identified dynamic cell-free miRNA profiles at multiple time points during the peri-implantation period from zygotes to early pregnancies [9,23]. For example, miR-29b may interfere with DNA methylation by controlling DNMT3a/b expression, potentially halting early embryonic development in mice [24]. Decreased expressions of miR-181 and miR-223-3p on Day 4 of the WOI are crucial for initiating implantation, as these miRNAs reduce the expression of LIF, an important marker for implantation, thus hindering the implantation process [25,26].
Despite established findings on dynamic plasma miRNA changes during the peri-implantation period in women with successful pregnancy [27], systematic and comprehensive studies on miRNA expression changes in both endometrial tissue and plasma during this period are lacking. This study aims to investigate the dynamic changes in miRNAs from day 3 to day 7 post-progesterone treatment in a hormone replacement cycle. Using small RNA sequencing, we intend to identify dynamically differentially expressed (DE) miRNAs in endometrial and plasma samples and explore their biological functions.
2. Results
2.1. Validation of the Prediction Model
A total of 62 subjects participated in this study, with menstrual cycles managed using hormone replacement therapy (HRT). Participants were divided into five groups according to sampling time points, from the third to seventh day after progesterone treatment (P+3 to P+7): P+3 (n=12), P+4 (n=12), P+5 (n=13), P+6 (n=13), and P+7 (n=12). General clinical characteristics—including follicle stimulating hormone (FSH), luteinizing hormone (LH), estrogen, progesterone, and endometrial thickness—were measured on day 2 and day 10-12 of the menstrual cycle. From P+3 to P+7, endometrial tissue and plasma samples were collected, and hormone levels and endometrial thickness were recorded (Supplemental Figure 1). Hormone and thickness trends across the cycle were within normal ranges: LH was lowest on day 2, peaked on days 10–12, and declined to near-baseline by P+X. Endometrial thickness increased progressively from day 2, with 26% of subjects (16/62) reaching their maximum by days 10–12 (Supplemental Figure 2). Apart from endometrial thickness on days 10–12, no significant differences in age, BMI, hormone levels, or thickness were observed between P+3 and P+7 groups (Table 1).
2.2. Summary of miRNA Sequencing Data in Endometrial Tissue and Plasma Samples
To profile miRNA expression in endometrial tissue and plasma, we used NGS followed by miRBase annotation. Sequencing results for all 62 samples are shown in Supplemental Table 1. Because plasma miRNA levels were lower and more variable, each plasma sample was sequenced twice for technical replication at greater depth [28]. The average human genome–mappable sequencing depth was 4,037,654× for endometrial tissue and 6,230,647× for plasma. In tissue samples, detectable miRNAs averaged 1,711,055 reads (43.1% of mappable reads) and 336 distinct miRNAs. Plasma samples averaged 590,628 reads (9.5% of mappable reads) and 205 distinct miRNAs. Overall, endometrial tissue yielded both a higher proportion of miRNA reads and a greater number of detectable miRNAs than plasma.
2.3. Endometrial miRNA Expression Profile During the Peri-Implantation Window
We identified 76 dynamic DE miRNAs in endometrial tissues across days P+3 to P+7 (Supplemental Table 2, Figure 1A). Their expression patterns fell into two main types—increasing or decreasing over time (Figure 1B)—with representative examples shown in Figure 1C. Increasing patterns included hsa-miR-224-5p, hsa-miR-29b-3p, hsa-miR-29c-3p, and hsa-miR-345-5p, while decreasing patterns included hsa-miR-3613-3p, hsa-miR-708-5p, hsa-miR-4455, and hsa-miR-9985. Pearson correlation analysis between these 76 miRNAs and five clinical characteristics (Supplemental Figure 3, Supplemental Table 3) revealed several significant associations. LH levels negatively correlated with hsa-miR-203a-5p, hsa-miR-29b-3p, hsa-miR-29c-3p, hsa-miR-30b-5p, hsa-miR-30d-3p, and hsa-miR-30d-5p. Estrogen levels positively correlated with hsa-miR-1299, hsa-miR-1303, hsa-miR-144-3p, and hsa-miR-9-3p. Endometrial thickness negatively correlated with hsa-miR-29c-3p, hsa-miR-30d-5p, and hsa-miR-34b-5p, and positively correlated with hsa-miR-4635 and hsa-miR-675-5p. These results suggest that certain dynamic DE miRNAs may influence LH, estrogen, and endometrial thickness. We also compared miRNA profiles between subjects with and without a history of pregnancy using the same criteria for dynamic DE miRNA identification. No significant differences were observed (Supplemental Table 4), which may be attributable to the limited sample size.
2.4. Functional Analysis of Endometrial Dynamic DE miRNAs
To explore the role of dynamic DE miRNAs in endometrial tissue during the peri-implantation period, we first identified their target genes using miRTarBase (a database of experimentally validated microRNA-target interactions, Supplemental Table 5). Cytoscape [29] was then used to construct a gene network illustrating interactions between these miRNAs and their targets (Figure 2A and 2B). The network highlights miRNAs with increasing expression patterns (e.g., hsa-miR-29b-3p, hsa-miR-224-5p, hsa-miR-30d-5p) and decreasing patterns (e.g., hsa-miR-429, hsa-miR-449a, hsa-miR-708-5p, hsa-miR-362-5p, hsa-miR-15b-3p). Several genes—including BCL2, CASP3, CCND1, CDC42, GSK3B, MYC, and ZEB2—are regulated by two or more dynamic DE miRNAs. BCL2 is regulated by 11 miRNAs, while genes such as IGF1R, PTEN, MYC, CDK6, E2F3, CDC25A, CDK4, MYCN, RUNX2, and ZEB1 are regulated by more than five miRNAs (Supplemental Table 6), suggesting these targets may play key roles in endometrial changes during the peri-implantation period. Functional analysis of these target genes using KEGG, Gene Ontology, and Reactome databases identified implantation-related pathways and biological functions (Figure 2C, Supplemental Table 7), including PI3K-Akt, FoxO, Ras/MAPK, JAK-STAT, WNT, and relaxin signaling, as well as processes such as cell senescence, apoptosis and growth, focal adhesion, cytoskeletal regulation, and IL-4/IL-13–mediated immune responses. Autophagy, which increases during the secretory phase, also contributes to embryo implantation by regulating endometrial receptivity and decidualization [30].
2.5. Plasma Dynamic DE miRNAs and Their Biological Functions During the Peri-Implantation Window
To assess whether dynamic DE miRNAs in plasma reflect changes observed in endometrial tissue, we identified 48 dynamic DE miRNAs in plasma (Figure 3, Supplemental Table 8). These were categorized into increasing (e.g., hsa-miR-182-5p) and decreasing patterns (e.g., hsa-miR-1260b, hsa-miR-7-5p, hsa-miR-99a-5p). Target genes of these miRNAs were identified using miRTarBase, and gene networks were constructed with Cytoscape (Figure 4A–B, Supplemental Table 9). PTEN was regulated by hsa-miR-182-5p and hsa-miR-382-5p, while BAX, EGFR, and IGF1R were regulated by hsa-miR-122-5p, hsa-miR-7-5p, and hsa-miR-99a-5p. Genes regulated by more than five miRNAs included BCL2, IGF1R, PTEN, MYC, VEGFA, EGFR, and MCL1 (Supplemental Table 6). Functional analysis of these targets revealed implantation-related signaling pathways, including PI3K-Akt, Ras/MAPK, JAK-STAT, ESR, WNT, neurotrophin, and relaxin pathways, as well as immune-related pathways such as Toll-like receptor, NOD-like receptor, chemokine, and interleukin signaling (Figure 4C, Supplemental Table 10). Additional relevant biological functions included cell senescence, apoptosis, proliferation, focal adhesion, autophagy, and platelet activation, signaling, and aggregation—a critical process in folliculogenesis, ovulation, placental development, implantation, and embryo development [31].
2.6. Comparison of Dynamic DE miRNAs Between Endometrial Tissue and Plasma Samples
To evaluate whether dynamic DE miRNAs in plasma reflect endometrial tissue status, we compared the miRNAs, their target genes, and associated pathways between the two sample types. Of the 76 dynamic DE miRNAs in endometrial tissue and 48 in plasma, 10 overlapped (Figure 5), with 7 showing similar expression patterns: hsa-miR-181-3p, hsa-miR-339-5p, hsa-miR-342-3p, hsa-miR-3529-3p, hsa-miR-375-3p, hsa-miR-3960, and hsa-miR-7-5p. The remaining three—hsa-miR-1303, hsa-miR-8485, and hsa-miR-3135b—did not show consistent patterns. Common target genes regulated by more than five dynamic DE miRNAs in both plasma and tissue included BCL2, IGF1R, PTEN, and MYC (Supplemental Table 6). Functional analysis revealed enrichment in similar pathways and processes, including PI3K-Akt, Ras/MAPK, JAK-STAT, WNT, and relaxin signaling, as well as cell senescence, apoptosis, focal adhesion, autophagy, and platelet activation, signaling, and aggregation (Figures 2C and 4C). While only seven miRNAs showed consistent dynamic expression, the overlap in target genes and pathways suggests that plasma miRNAs may partially reflect the biological state of endometrial tissue.
3. Discussion
The peri-implantation period is critical for embryo implantation and pregnancy outcomes. To investigate the role of miRNAs during this timeframe, we profiled dynamic miRNA changes in endometrial tissue and plasma from day P+3 to P+7 post-progesterone treatment using NGS. We identified 76 and 48 dynamic DE miRNAs in endometrial tissue and plasma, respectively. These miRNAs regulate key implantation-related pathways and functions, including cell senescence, proliferation, apoptosis, focal adhesion, autophagy, and platelet activation and signaling.
While earlier studies have characterized miRNA dynamics during this period using plasma [27], our study is the first to systematically profile dynamic DE miRNAs from both endometrial tissue and plasma, along with their biological functions. We reveal how these miRNAs regulate key pathways across different time points in the peri-implantation period. Because tissue sampling and embryo implantation cannot typically occur in the same cycle, parallel analysis of tissue and plasma miRNAs offers broader insight into endometrial physiology and supports the potential of plasma miRNAs as non-invasive markers of endometrial status.
This study has two main limitations. First, the sample size for each time point (P+3 to P+7) was moderate—12–13 endometrial tissue and plasma samples—sufficient for preliminary insights but not for minimizing variability, particularly in plasma miRNA expression (Table 1). A larger cohort would improve data stability and accuracy. Second, plasma sample quality varied more than tissue samples, with greater differences in sequencing metrics such as total reads, mapped reads, miRNA reads, miRNA ratio, and detectable miRNAs (>20 reads). Some plasma samples showed notably low values (data not shown). Using specialized blood collection tubes that preserve cell-free nucleic acids could improve plasma sample stability.
Among the top-ranked target genes regulated by dynamic DE miRNAs (Supplemental Table 6), several play key roles in implantation and pregnancy. BCL2 regulates oocyte and embryo survival or apoptosis, influencing decidual regression [32,33]. IGF1R promotes epithelial cell proliferation and uterine growth during early pregnancy [34,35]. In mice, PTEN depletion in myometrial and stromal/decidual cells impairs trophoblast invasion and decidual regression [36]. Aberrant PTEN downregulation and Akt activation disrupt endometrial cell growth and death, potentially reducing receptivity in infertile women with intramural fibroids during the midsecretory phase [37]. MYC supports implantation by promoting ovarian steroid secretion [38]. CDK6 regulates uterine stromal cell decidualization and polyploidy, both critical for implantation [39,40].
During the peri-implantation period, endometrial proliferation and remodeling are essential for embryo implantation. Our functional analysis revealed key pathways and processes, including Ras/MAPK, PI3K-Akt, JAK-STAT, and ESR signaling, as well as cell senescence, growth, apoptosis, and focal adhesion [41,42,43,44]. We also identified several notable pathways, including autophagy—a key process for degrading long-lived proteins and organelles that maintains tissue homeostasis, with disruptions potentially causing severe consequences [45]. Recent studies show that autophagy is essential for both normal and pathological endometrial processes, including menstruation, decidualization, endometriosis, endometrial cancer, and infertility [46,47]. Platelet activation supports folliculogenesis, ovulation, placental development, implantation, and embryogenesis [31], and intrauterine platelet-rich plasma can enhance endometrial receptivity and improve pregnancy outcomes [48,49,50]. However, excessive platelet activation has been linked to ovarian hyperstimulation syndrome (OHSS) and preeclampsia, with low-dose aspirin shown to reduce OHSS risk during ovulation induction [31,51] .
Analysis of endometrial tissue and plasma samples revealed 76 dynamic DE miRNAs in tissue and 48 in plasma, with only 7 overlapping. Despite this, target gene, biological function, and pathway analyses showed strong similarities, suggesting that circulating cell-free miRNAs in plasma have the potential to reflect endometrial status. Additionally, circulating cell-free miRNAs show promise as biomarkers in reproductive medicine [16]. Previous studies show that plasma circulating cell-free miRNA profiles can identify whether the uterus is receptive to embryo implantation [22]. Furthermore, circulating cell-free miRNAs might serve as diagnostic tools for conditions such as endometriosis and polycystic ovary syndrome [52,53,54]. In addition to reproductive disease, circulating cell-free miRNAs dysregulated in malignant tumor also had been proven to be the surrogate markers for detecting colorectal cancer and non-small cell lung cancer [55,56], and in other chronic diseases, such as atherosclerotic abdominal aortic aneurysm and diabetes, as well as asthma [57,58,59]. These findings highlight that circulating cell-free miRNAs could offer a non-invasive alternative to tissue sampling for disease diagnosis. Blood collection is feasible, painless, time-saving, and non-invasive. Moreover, the stability of circulating cell-free miRNAs are notably stable, protected from endogenous RNase activity, making them reliable for laboratory analysis. [60,61,62].
Given that Day P+5 is typically considered the most critical and standardized timing for embryo transfer [63,64], and some of these miRNAs have been associated with endometrium function or embryo implantation in prior research. Studies showed that hsa-miR-345-5p, together with other miRNAs, regulates the expression level of several cell cycle genes in the secretory-phase of endometrium [65]. Hsa-miR-150-5p have also been linked to biological pathways that could affect embryo implantation [19]. MiR-140-3p targets IGF1R and regulate cellular function s and pathways such as Hippo signaling pathway, RNA transport, TGF-beta signaling pathway, Oocyte meiosis, Fatty acid metabolism, Gap junction and invasion of endometrial epithelial cells over peri-implantation period in rat model [66]. While functional study of each miRNA remains to be performed, our study has illustrated that miRNAs expression changes in plasma can be reflective of the status of the endometrium.
4. Materials and Methods
4.1. Ethical Approval
This single-center cohort study was conducted from July 2022 to June 2024. The study protocol was approved by the Institutional Review Board of Chung Shan Medical University Hospital (IRB number CS2-22033), and study subjects were included only after written informed consent forms were obtained.
4.2. Study Population
This study was conducted at Lee Women’s Hospital in Taichung, Taiwan, from July 2022 to June 2024. The inclusion criteria were as follows: 1) age between 25 and 38 years; 2) regular menstrual cycles of 28-32 days; 3) body mass index (BMI) between 18 and 30 kg/m2; and 4) serum progesterone (P4) level < 1 ng/mL prior to medication administration. Exclusion criteria included: 1) suspected uterine abnormalities; 2) women breastfeeding their children; 3) history of pelvic inflammatory disease, reproductive tract diseases, sexually transmitted diseases, systemic diseases, endocrine disorders, or other major illnesses; and 4) use of hormonal contraceptives or intrauterine devices within the past 3 months. A total of 62 volunteers who met the inclusion criteria were recruited and assigned to groups. Volunteers started oral estradiol valerate (Estrade Estrade® 2 mg/tablet; Synmosa) 6 mg per day from day 2 of their menstrual cycle and returned for hormonal assessment on day 10-12. Upon confirming a serum progesterone (P4) level < 1 ng/mL, all participants began receiving daily subcutaneous progesterone injections (Prolutex, IBSA, Switzerland) starting from day 10–12 of the cycle. The total dose of progesterone differed among groups according to the assigned sampling day (P+3 to P+7), as it corresponded to the number of consecutive days of progesterone administration before sample collection. For example, participants in the P+3 group received progesterone for three consecutive days, whereas those in the P+7 group received seven days of progesterone. Endometrial tissue and peripheral blood samples were collected immediately after the last progesterone dose on the designated P+ day.
4.3. Endometrial Tissue and Plasma Sample Collection and Preparation
Endometrial tissue was collected by a pipelle (UNIMAX, New Taipei City, Taiwna, Cat. No. FEM103600) and then preserved in RNAlater solution (Thermo Fisher Scientific, MA, USA, Cat. No. AM7022). Peripheral blood samples (5–10 mL per subject) were obtained from subjects undergoing hormone treatment cycle. The peripheral blood sample was collected into EDTA tubes (BD, MIS, Canada, Cat. No. 367525) or Plasma Preparation Tubes (BD, MIS, Canada, Cat. No. 362788). After the peripheral blood samples were collected, the tubes were inverted at least five times and processed within 60 min. Each specimen was centrifuged at 1200 g for 10 min at room temperature to separate plasma from cells. The supernatant was transferred to new tubes and centrifuged at 12,000× g for 10 min. The plasma samples were subsequently transferred to new tubes and stored at −80 °C.
4.4. Endometrial Tissue Small RNA Extraction
Tissue small RNAs were extracted from approximately 5 milligrams (mg) of endometrial tissue using the miRNeasy Micro Kit (QIAGEN, Hilden, Germany, Cat. No. 217804) according to the manufacturer's instructions. Tissue small RNA was then eluted in nuclease-free water. The concentration was measured using the Qubit microRNA Assay Kit (Thermo Fisher Scientific, MA, USA, Cat. No. Q32880). For each sample, 10 ng of miRNA was used as the input for subsequent library construction.
4.5. Plasma Small RNA Extraction
Small RNA was isolated from 200–600 μL of plasma with miRNeasy Serum/Plasma Advanced Kit (QIAGEN, Hilden, Germany, Cat. No. 217204) following the manufacturer’s protocol. Subsequently, the plasma RNA was eluted in nuclease-free water. The concentration was quantified by using Qubit microRNA Assay Kit (Thermo Fisher Scientific, MA, USA, Cat. No. Q32880). For each sample, at least 10ng miRNA was used as input for the following library construction.
4.6. miRNA Library Construction and Sequencing
The miRNA sequencing library was constructed using the QIAseq miRNA Library Kit (QIAGEN, Germany, Cat. No. 331502). In brief, the miRNA sequencing library was prepared by the following steps: (1). 3’-adaptor ligation with pre-adenylated adaptor; (2). 5’-adaptor ligation with sequenced primers; (3). cDNA synthesis using reverse transcription primers with a unique molecular index (UMI) assigned to every miRNA molecule, allowing the identification of individual molecules; (4). cDNA cleanup; (5). PCR amplification using primers with sample barcode; (6). library cleanup. The quality of the library was checked using the 5200 Fragment Analyzer System (Agilent Technologies, CA, USA). The size of the library product is between 190 and 220 bps. The library was quantified by Qubit (Thermo Fisher Scientific, USA, Cat. No. Q32851), and the concentration must be more than 1 ng/μL for the following sequencing assay. The library was sequenced using single-end 75 bp reads on the Illumina NextSeq 550 (Illumina, CA, USA) as per the manufacturer’s instructions.
4.7. NGS Data Analysis Pipeline
A NGS data analysis pipeline was built to analyze the data, with the following protocols: (1). Data were preprocessed by performing quality control on raw fastq data, including trimming adapter sequences, and removing low-quality reads using FastQC [67] and Trimmomatic [68]. After trimming low-quality (Q value < 20) ends from reads in addition to adapter removal, reads shorter than 17bps or longer than 55bps were discarded. (2). Alignment of processed reads to Human Genome Assembly GRCh38 (hg38) reference genome and a specific set of small RNA sequences from miRBase was performed by using aligners such as Bowtie [69,70]. (3). Quantification of extracted reads from the data by mapping the aligned reads using samtools and obtained reference annotations using miRBase (total 2656 miRNAs) [71]. The read counts of each miRNA were used as the expression value for further data analysis.
4.8. Identification of Dynamic and DE miRNAs
Limited by the small sample size, the differences in miRNA abundance among P+3 to P+7 groups were analyzed by the following steps: (1) each miRNA read was divided by the total mapped miRNA reads for data normalization; (2) the normalized data was log2-transformed and then multiplied by 10,000,000 to obtain the final miRNA expression level; (3) determine miRNAs that were expressed in at least 75% of the samples (for example, in at least 47 out of total 62 samples) and showed a difference of more than 0.3 or less than -0.3 between the following group pairs: P+3 and P+4, P+4 and P+5, P+5 and P+6, and P+6 and P+7. Finally, to identify the dynamic and DE miRNAs, we calculate the absolute differences between the group pairs, sum them up, and filter for values greater than 0.5. The p-value of Student’s t-test for each group pairs were also calculated in supplemental table 2 and 8.
4.9. miRNA List and Target Gene Retrieval
Based on DE miRNA lists from endometrial tissue and plasma samples, we used the multiMiR R package to retrieve validated miRNA-target gene interactions [72]. Specifically, we focused on interactions supported by "Functional MTI" (miRNA-target interaction) evidence from the miRTarBase database [73]. This ensured that only high-confidence and experimentally validated interactions were included in our analysis.
4.10. Pathway Enrichment Analysis
Pathway enrichment analysis was performed using the clusterProfiler R package [74]. We used the Kyoto Encyclopedia of Genes and Genomes (KEGG) pathway [75], biological process (BP) of Gene Ontology (GO) [76] and Reactome [77] database to identify significantly enriched pathways among the target genes. To ensure comprehensive coverage of potential genes and pathways in this analysis, we derived a background gene set from the Ensembl database [78] using the BioMart tool with the following criteria: (1) Species: Human (GRCh38.p14); (2) Gene Type: Only protein-coding genes were selected to focus on genes with known coding potential; (3) Gene Ontology (GO) Terms: The dataset was filtered to include only genes associated with GO terms, ensuring functional annotations for subsequent enrichment analyses; (4) NCBI Gene ID: The unique identifier from the NCBI Gene database. Ultimately, we obtained 19,237 genes as the background for enrichment analysis. The P-values of pathway enrichment analysis were adjusted for multiple testing using the Benjamini-Hochberg method to control the false discovery rate. The enriched pathways were further refined by selecting those with a target gene count exceeding 40 and those related to implantation, as determined through a literature search in the PubMed database.
4.11. Correlation Analysis Between Clinical Characteristics and DE miRNAs
To analyze the correlation between clinical characteristics and differentially expressed (DE) miRNAs, we used the Pearson correlation coefficient as the analytical method. The t score was calculated using the following formula:
where r is the correlation coefficient value and n is the total sample size, and then, the p value was also determined [79].
5. Conclusions
This study shows that dynamic changes of miRNAs expression occur in both endometrial tissue and plasma during the periimplantation period. The identified DE miRNAs are involved in critical pathways regulating cellular processes essential for embryo implantation. These findings provide new insights into the molecular mechanisms underlying implantation and highlight the potential of circulating and endometrial miRNAs as biomarkers for endometrial receptivity and implantation success.
6. Patents
The patent has been filed as a provisional application.
Supplementary Materials
The following supporting information can be downloaded at: at the website of this paper posted on Preprints.org, Figure S1: Overview of the study design. Participants underwent a hormone replacement therapy (HRT) cycle; Figure S2: The change of clinical characteristics during peri-implantation period; Figure S3: Correlation analysis between clinical characteristics and dynamic DE miRNAs in endometrial tissue; Table S1: Summary of Next Generation Sequencing result; Table S2: Complete list of 76 dynamic differentially expressed miRNAs in endometrial tissues; Table S3: Raw data of correlation analysis between clinical characteristics and dynamic DE miRNAs in endometrial tissue; Table S4: Comparison of miRNA profile between subjects with a history of pregnancy and those without; Table S5: miRNA-target gene analysis result of 76 dynamic differentially expressed miRNAs in endometrial tissues; Table S6: The most common target genes targeted by dynamic DE miRNAs in both endometrial tissue and plasma samples; Table S7: Pathways and biological functional enrichment analysis of 76 dynamic differentially expressed miRNAs in endometrial tissues; Table S8: Complete list of 48 dynamic differentially expressed miRNAs in plasma samples; Table S9: miRNA-target gene analysis of 48 dynamic differentially expressed miRNAs in plasma samples; Table S10: Pathways and biological functional enrichment analysis of 48 dynamic differentially expressed miRNAs in plasma samples.
Author Contributions
Conceptualization, C.I.L., A.H., P.Y.L., E.P.Y. and M.S.L.; methodology, C.I.L., A.H., E.P.Y. and M.S.L.; validation, S.T.L., J.H.Y., and H.L.H.; formal analysis, A.H.; investigation, C.I.L., Y.J.L., E.H.C., C.I.C., and T.N.Y.; resources, C.I.L., Y.J.L., E.H.C., C.I.C., and T.N.Y.; data curation, A.H.; writing—original draft preparation, A.H., C.Y.W. and T.W.; writing—review and editing, E.P.Y. and T.H.L.; visualization, A.H.; super-vision, E.P.Y., M.S.L. and T.H.L.; funding acquisition, E.P.Y. and M.S.L.. All authors have read and agreed to the published version of the manuscript.
Funding
This study was supported by grant (CSH-2023-C-015) from Chung-Shan Medical University Hospital, Taichung, Taiwan, and Inti Labs, Taiwan, Inc.
Institutional Review Board Statement
The study was conducted in accordance with the Declaration of Helsinki, and approved by the Institutional Review Board of Chung Shan Medical University Hospital (IRB number CS2-22033) on June 28, 2022.
Informed Consent Statement
Informed consent was obtained from all subjects involved in the study.
Data Availability Statement
The datasets generated and analysed during this study are available on request from the corresponding author and in the Gene Expression Omnibus (GEO) database with accession number GSE297808.
Acknowledgments
We extend our appreciation to all the staff from the Lee Women's Hospital and Inti Labs for their assistance with the patient enrollment and data collection. We are also thankful to all participants who contributed to this study.
Conflicts of Interest
The authors declare no conflict of interest.
Abbreviations
The following abbreviations are used in this manuscript:
| BMI | Body mass index |
| BP | Biological process |
| DE miRNAs | Differentially expressed miRNAs |
| FSH | Follicle stimulating hormone |
| GO | Gene Ontology |
| HRT | Hormone replacement therapy |
| IVF | In vitro fertilization |
| KEGG | Kyoto Encyclopedia of Genes and Genomes |
| LH | Luteinizing hormone |
| microRNAs | miRNAs |
| MTI | miRNA-target interaction |
| NGS | Next-generation sequencing |
| UMI | Unique molecular index |
| WOI | Window of implantation |
References
- Paria, B.C.; Huet-Hudson, Y.M.; Dey, S.K. , Blastocyst's state of activity determines the "window" of implantation in the receptive mouse uterus. Proc Natl Acad Sci U S A 1993, 90, 10159–10162. [Google Scholar] [CrossRef]
- Acosta, A.A.; Elberger, L.; Borghi, M.; Calamera, J.C.; Chemes, H.; Doncel, G.F.; Kliman, H.; Lema, B.; Lustig, L.; Papier, S. , Endometrial dating and determination of the window of implantation in healthy fertile women. Fertil Steril 2000, 73, 788–798. [Google Scholar] [CrossRef]
- Robertson, S.A. , Control of the immunological environment of the uterus. Rev Reprod 2000, 5, 164–174. [Google Scholar] [CrossRef]
- Zhang, S.; Lin, H.; Kong, S.; Wang, S.; Wang, H.; Wang, H.; Armant, D.R. , Physiological and molecular determinants of embryo implantation. Mol Aspects Med 2013, 34, 939–980. [Google Scholar] [CrossRef]
- Salamonsen, L.A.; Evans, J.; Nguyen, H.P.; Edgell, T.A. , The Microenvironment of Human Implantation: Determinant of Reproductive Success. Am J Reprod Immunol 2016, 75, 218–225. [Google Scholar] [CrossRef] [PubMed]
- Tomic, V.; Kasum, M.; Vucic, K. , Impact of embryo quality and endometrial thickness on implantation in natural cycle IVF. Arch Gynecol Obstet 2020, 301, 1325–1330. [Google Scholar] [CrossRef] [PubMed]
- Galliano, D.; Pellicer, A. , MicroRNA and implantation. Fertil Steril 2014, 101, 1531–1544. [Google Scholar] [CrossRef]
- Paul, A.B. M.; Sadek, S.T.; Mahesan, A.M. , The role of microRNAs in human embryo implantation: a review. J Assist Reprod Genet 2019, 36, 179–187. [Google Scholar] [CrossRef] [PubMed]
- Liang, J.; Wang, S.; Wang, Z. , Role of microRNAs in embryo implantation. Reprod Biol Endocrinol 2017, 15, 90. [Google Scholar] [CrossRef]
- Ha, M.; Kim, V.N. , Regulation of microRNA biogenesis. Nat Rev Mol Cell Biol 2014, 15, 509–524. [Google Scholar] [CrossRef]
- Winter, J.; Jung, S.; Keller, S.; Gregory, R.I.; Diederichs, S. , Many roads to maturity: microRNA biogenesis pathways and their regulation. Nat Cell Biol 2009, 11, 228–234. [Google Scholar] [CrossRef]
- Reza, A.; Choi, Y.J.; Han, S.G.; Song, H.; Park, C.; Hong, K.; Kim, J.H. , Roles of microRNAs in mammalian reproduction: from the commitment of germ cells to peri-implantation embryos. Biol Rev Camb Philos Soc 2019, 94, 415–438. [Google Scholar] [CrossRef]
- Salilew-Wondim, D.; Gebremedhn, S.; Hoelker, M.; Tholen, E.; Hailay, T.; Tesfaye, D. , The Role of MicroRNAs in Mammalian Fertility: From Gametogenesis to Embryo Implantation. Int J Mol Sci 2020, 21. [Google Scholar] [CrossRef]
- Chen, C.H.; Lu, F.; Yang, W.J.; Yang, P.E.; Chen, W.M.; Kang, S.T.; Huang, Y.S.; Kao, Y.C.; Feng, C.T.; Chang, P.C.; Wang, T.; Hsieh, C.A.; Lin, Y.C.; Jen Huang, J.Y.; Wang, L.H. , A novel platform for discovery of differentially expressed microRNAs in patients with repeated implantation failure. Fertil Steril 2021, 116, 181–188. [Google Scholar] [CrossRef]
- Chen, C.H.; Lu, F.; Yang, W.J.; Chen, W.M.; Yang, P.E.; Kang, S.T.; Wang, T.; Chang, P.C.; Feng, C.T.; Yang, J.H.; Liu, C.Y.; Hsieh, C.A.; Wang, L.H.; Huang, J.Y. , Development of a Novel Endometrial Signature Based on Endometrial microRNA for Determining the Optimal Timing for Embryo Transfer. Biomedicines 2024, 12. [Google Scholar] [CrossRef]
- Santamaria, X.; Taylor, H. , MicroRNA and gynecological reproductive diseases. Fertil Steril 2014, 101, 1545–1551. [Google Scholar] [CrossRef] [PubMed]
- Gilabert-Estelles, J.; Braza-Boils, A.; Ramon, L.A.; Zorio, E.; Medina, P.; Espana, F.; Estelles, A. , Role of microRNAs in gynecological pathology. Curr Med Chem 2012, 19, 2406–2413. [Google Scholar] [CrossRef]
- von Grothusen, C.; Frisendahl, C.; Modhukur, V.; Lalitkumar, P.G.; Peters, M.; Faridani, O.R.; Salumets, A.; Boggavarapu, N.R.; Gemzell-Danielsson, K. , Uterine fluid microRNAs are dysregulated in women with recurrent implantation failure. Hum Reprod 2022, 37, 734–746. [Google Scholar] [CrossRef] [PubMed]
- Zeng, H.; Fu, Y.; Shen, L.; Quan, S. , MicroRNA signatures in plasma and plasma exosome during window of implantation for implantation failure following in-vitro fertilization and embryo transfer. Reprod Biol Endocrinol 2021, 19, 180. [Google Scholar] [CrossRef]
- Shen, L.; Zeng, H.; Fu, Y.; Ma, W.; Guo, X.; Luo, G.; Hua, R.; Wang, X.; Shi, X.; Wu, B.; Luo, C.; Quan, S. , Specific plasma microRNA profiles could be potential non-invasive biomarkers for biochemical pregnancy loss following embryo transfer. BMC Pregnancy Childbirth 2024, 24, 351. [Google Scholar] [CrossRef] [PubMed]
- Hitit, M.; Kose, M.; Kaya, M.S.; Kirbas, M.; Dursun, S.; Alak, I.; Atli, M.O. , Circulating miRNAs in maternal plasma as potential biomarkers of early pregnancy in sheep. Front Genet 2022, 13, 929477. [Google Scholar] [CrossRef]
- Chen, M.J.; Hsu, A.; Lin, P.Y.; Chen, Y.L.; Wu, K.W.; Chen, K.C.; Wang, T.; Yi, Y.C.; Kung, H.F.; Chang, J.C.; Yang, W.J.; Lu, F.; Guu, H.F.; Chen, Y.F.; Chuan, S.T.; Chen, L.Y.; Chen, C.H.; Yang, P.E.; Huang, J.Y. , Development of a Predictive Model for Optimization of Embryo Transfer Timing Using Blood-Based microRNA Expression Profile. Int J Mol Sci 2023, 25. [Google Scholar] [CrossRef] [PubMed]
- Gross, N.; Kropp, J.; Khatib, H. , MicroRNA Signaling in Embryo Development. Biology (Basel) 2017, 6. [Google Scholar] [CrossRef]
- Zhang, J.; Wang, Y.; Liu, X.; Jiang, S.; Zhao, C.; Shen, R.; Guo, X.; Ling, X.; Liu, C. , Expression and potential role of microRNA-29b in mouse early embryo development. Cell Physiol Biochem 2015, 35, 1178–1187. [Google Scholar] [CrossRef]
- Chu, B.; Zhong, L.; Dou, S.; Wang, J.; Li, J.; Wang, M.; Shi, Q.; Mei, Y.; Wu, M. , miRNA-181 regulates embryo implantation in mice through targeting leukemia inhibitory factor. J Mol Cell Biol 2015, 7, 12–22. [Google Scholar] [CrossRef] [PubMed]
- Dong, X.; Sui, C.; Huang, K.; Wang, L.; Hu, D.; Xiong, T.; Wang, R.; Zhang, H. , MicroRNA-223-3p suppresses leukemia inhibitory factor expression and pinopodes formation during embryo implantation in mice. Am J Transl Res 2016, 8, 1155–1163. [Google Scholar] [PubMed]
- Dong, J.; Wang, L.; Xing, Y.; Qian, J.; He, X.; Wu, J.; Zhou, J.; Hai, L.; Wang, J.; Yang, H.; Huang, J.; Gou, X.; Ju, Y.; Wang, X.; He, Y.; Su, D.; Kong, L.; Liang, B.; Wang, X. , Dynamic peripheral blood microRNA expression landscape during the peri-implantation stage in women with successful pregnancy achieved by single frozen-thawed blastocyst transfer. Hum Reprod Open 2023, 2023, hoad034. [Google Scholar] [CrossRef]
- Sourvinou, I.S.; Markou, A.; Lianidou, E.S. , Quantification of circulating miRNAs in plasma: effect of preanalytical and analytical parameters on their isolation and stability. J Mol Diagn 2013, 15, 827–834. [Google Scholar] [CrossRef]
- Shannon, P.; Markiel, A.; Ozier, O.; Baliga, N.S.; Wang, J.T.; Ramage, D.; Amin, N.; Schwikowski, B.; Ideker, T. , Cytoscape: a software environment for integrated models of biomolecular interaction networks. Genome Res 2003, 13, 2498–2504. [Google Scholar] [CrossRef]
- Park, H.; Cho, M.; Do, Y.; Park, J.K.; Bae, S.J.; Joo, J.; Ha, K.T. , Autophagy as a Therapeutic Target of Natural Products Enhancing Embryo Implantation. Pharmaceuticals (Basel) 2021, 15. [Google Scholar] [CrossRef]
- Nagy, B.; Kovacs, K.; Sulyok, E.; Varnagy, A.; Bodis, J. , Thrombocytes and Platelet-Rich Plasma as Modulators of Reproduction and Fertility. Int J Mol Sci 2023, 24. [Google Scholar] [CrossRef] [PubMed]
- Yang, M.Y.; Rajamahendran, R. , Expression of Bcl-2 and Bax proteins in relation to quality of bovine oocytes and embryos produced in vitro. Anim Reprod Sci 2002, 70, 159–169. [Google Scholar] [CrossRef]
- Correia-da-Silva, G.; Bell, S.C.; Pringle, J.H.; Teixeira, N.A. , Patterns of expression of Bax, Bcl-2 and Bcl-x(L) in the implantation site in rat during pregnancy. Placenta 2005, 26, 796–806. [Google Scholar] [CrossRef] [PubMed]
- Gibson, C.; de Ruijter-Villani, M.; Stout, T.A. E. , Insulin-like growth factor system components expressed at the conceptus-maternal interface during the establishment of equine pregnancy. Front Vet Sci 2022, 9, 912721. [Google Scholar] [CrossRef]
- Sekulovski, N.; Whorton, A.E.; Shi, M.; Hayashi, K.; MacLean, J.A. , 2nd, Insulin signaling is an essential regulator of endometrial proliferation and implantation in mice. FASEB J 2021, 35, e21440. [Google Scholar] [CrossRef]
- Lague, M.N.; Detmar, J.; Paquet, M.; Boyer, A.; Richards, J.S.; Adamson, S.L.; Boerboom, D. , Decidual PTEN expression is required for trophoblast invasion in the mouse. Am J Physiol Endocrinol Metab 2010, 299, E936–E946. [Google Scholar] [CrossRef]
- Makker, A.; Goel, M.M.; Nigam, D.; Mahdi, A.A.; Das, V.; Agarwal, A.; Pandey, A.; Gautam, A. , Aberrant Akt Activation During Implantation Window in Infertile Women With Intramural Uterine Fibroids. Reprod Sci 2018, 25, 1243–1253. [Google Scholar] [CrossRef] [PubMed]
- Tajeddin, N.; Ahadi, A.M.; Javadi, G.; Ayat, H. , Evaluation of Myc Gene Expression as a Preventive Marker for Increasing the Implantation Success in the Infertile Women. Int J Prev Med 2020, 11, 18. [Google Scholar] [CrossRef] [PubMed]
- Tan, J.; Raja, S.; Davis, M.K.; Tawfik, O.; Dey, S.K.; Das, S.K. , Evidence for coordinated interaction of cyclin D3 with p21 and cdk6 in directing the development of uterine stromal cell decidualization and polyploidy during implantation. Mech Dev 2002, 111, 99–113. [Google Scholar] [CrossRef] [PubMed]
- Chang, Z.; Kuang, H.X.; Zhou, X.; Zhu, H.; Zhang, Y.; Fu, Y.; Fu, Q.; Jiang, B.; Wang, W.; Jiang, S.; Ren, L.; Ma, L.; Pan, X.; Feng, X.L. , Temporal changes in cyclinD-CDK4/CDK6 and cyclinE-CDK2 pathways: implications for the mechanism of deficient decidualization in an immune-based mouse model of unexplained recurrent spontaneous abortion. Mol Med 2022, 28, 100. [Google Scholar] [CrossRef]
- Lee, C.H.; Kim, T.H.; Lee, J.H.; Oh, S.J.; Yoo, J.Y.; Kwon, H.S.; Kim, Y.I.; Ferguson, S.D.; Ahn, J.Y.; Ku, B.J.; Fazleabas, A.T.; Lim, J.M.; Jeong, J.W. , Extracellular signal-regulated kinase 1/2 signaling pathway is required for endometrial decidualization in mice and human. PLoS One 2013, 8, e75282. [Google Scholar] [CrossRef]
- Gentilini, D.; Busacca, M.; Di Francesco, S.; Vignali, M.; Vigano, P.; Di Blasio, A.M. , PI3K/Akt and ERK1/2 signalling pathways are involved in endometrial cell migration induced by 17beta-estradiol and growth factors. Mol Hum Reprod 2007, 13, 317–322. [Google Scholar] [CrossRef]
- Boeddeker, S.J.; Hess, A.P. , The role of apoptosis in human embryo implantation. J Reprod Immunol 2015, 108, 114–122. [Google Scholar] [CrossRef]
- Harada, T.; Kaponis, A.; Iwabe, T.; Taniguchi, F.; Makrydimas, G.; Sofikitis, N.; Paschopoulos, M.; Paraskevaidis, E.; Terakawa, N. , Apoptosis in human endometrium and endometriosis. Hum Reprod Update 2004, 10, 29–38. [Google Scholar] [CrossRef]
- Devis-Jauregui, L.; Eritja, N.; Davis, M.L.; Matias-Guiu, X.; Llobet-Navas, D. , Autophagy in the physiological endometrium and cancer. Autophagy 2021, 17, 1077–1095. [Google Scholar] [CrossRef]
- Su, Y.; Zhang, J.J.; He, J.L.; Liu, X.Q.; Chen, X.M.; Ding, Y.B.; Tong, C.; Peng, C.; Geng, Y.Q.; Wang, Y.X.; Gao, R.F. , Endometrial autophagy is essential for embryo implantation during early pregnancy. J Mol Med (Berl) 2020, 98, 555–567. [Google Scholar] [CrossRef] [PubMed]
- Yang, S.; Wang, H.; Li, D.; Li, M. , Role of Endometrial Autophagy in Physiological and Pathophysiological Processes. J Cancer 2019, 10, 3459–3471. [Google Scholar] [CrossRef] [PubMed]
- Kusumi, M.; Ihana, T.; Kurosawa, T.; Ohashi, Y.; Tsutsumi, O. , Intrauterine administration of platelet-rich plasma improves embryo implantation by increasing the endometrial thickness in women with repeated implantation failure: A single-arm self-controlled trial. Reprod Med Biol 2020, 19, 350–356. [Google Scholar] [CrossRef] [PubMed]
- Chang, Y.; Li, J.; Chen, Y.; Wei, L.; Yang, X.; Shi, Y.; Liang, X. , Autologous platelet-rich plasma promotes endometrial growth and improves pregnancy outcome during in vitro fertilization. Int J Clin Exp Med 2015, 8, 1286–1290. [Google Scholar]
- Chang, Y.; Li, J.; Wei, L.N.; Pang, J.; Chen, J.; Liang, X. , Autologous platelet-rich plasma infusion improves clinical pregnancy rate in frozen embryo transfer cycles for women with thin endometrium. Medicine (Baltimore) 2019, 98, e14062. [Google Scholar] [CrossRef]
- Bodis, J. , Role of platelets in female reproduction. Hum Reprod 2022, 37, 384–385. [Google Scholar] [CrossRef]
- Jia, S.Z.; Yang, Y.; Lang, J.; Sun, P.; Leng, J. , Plasma miR-17-5p, miR-20a and miR-22 are down-regulated in women with endometriosis. Hum Reprod 2013, 28, 322–330. [Google Scholar] [CrossRef]
- Chen, B.; Xu, P.; Wang, J.; Zhang, C. , The role of MiRNA in polycystic ovary syndrome (PCOS). Gene 2019, 706, 91–96. [Google Scholar] [CrossRef]
- Liu, Y.; Shi, X.; Xu, B.; Wang, Z.; Chen, Y.; Deng, M. , Differential expression of plasma-derived exosomal miRNAs in polycystic ovary syndrome as a circulating biomarker. Biomed Rep 2023, 19, 92. [Google Scholar] [CrossRef]
- Fellizar, A.; Refuerzo, V.; Ramos, J.D.; Albano, P.M. , Expression of specific microRNAs in tissue and plasma in colorectal cancer. J Pathol Transl Med 2023, 57, 147–157. [Google Scholar] [CrossRef]
- Niu, Y.; Su, M.; Wu, Y.; Fu, L.; Kang, K.; Li, Q.; Li, L.; Hui, G.; Li, F.; Gou, D. , Circulating Plasma miRNAs as Potential Biomarkers of Non-Small Cell Lung Cancer Obtained by High-Throughput Real-Time PCR Profiling. Cancer Epidemiol Biomarkers Prev 2019, 28, 327–336. [Google Scholar] [CrossRef] [PubMed]
- Kin, K.; Miyagawa, S.; Fukushima, S.; Shirakawa, Y.; Torikai, K.; Shimamura, K.; Daimon, T.; Kawahara, Y.; Kuratani, T.; Sawa, Y. , Tissue- and plasma-specific MicroRNA signatures for atherosclerotic abdominal aortic aneurysm. J Am Heart Assoc 2012, 1, e000745. [Google Scholar] [CrossRef] [PubMed]
- Angelescu, M.A.; Andronic, O.; Dima, S.O.; Popescu, I.; Meivar-Levy, I.; Ferber, S.; Lixandru, D. , miRNAs as Biomarkers in Diabetes: Moving towards Precision Medicine. Int J Mol Sci 2022, 23. [Google Scholar] [CrossRef] [PubMed]
- Kyyaly, M.A.; Vorobeva, E.V.; Kothalawala, D.M.; Fong, W.C. G.; He, P.; Sones, C.L.; Al-Zahrani, M.; Sanchez-Elsner, T.; Arshad, S.H.; Kurukulaaratchy, R.J. , MicroRNAs-A Promising Tool for Asthma Diagnosis and Severity Assessment: A Systematic Review. J Pers Med 2022, 12. [Google Scholar] [CrossRef]
- Chen, X.; Ba, Y.; Ma, L.; Cai, X.; Yin, Y.; Wang, K.; Guo, J.; Zhang, Y.; Chen, J.; Guo, X.; Li, Q.; Li, X.; Wang, W.; Zhang, Y.; Wang, J.; Jiang, X.; Xiang, Y.; Xu, C.; Zheng, P.; Zhang, J.; Li, R.; Zhang, H.; Shang, X.; Gong, T.; Ning, G.; Wang, J.; Zen, K.; Zhang, J.; Zhang, C.Y. , Characterization of microRNAs in serum: a novel class of biomarkers for diagnosis of cancer and other diseases. Cell Res 2008, 18, 997–1006. [Google Scholar] [CrossRef]
- Mitchell, P.S.; Parkin, R.K.; Kroh, E.M.; Fritz, B.R.; Wyman, S.K.; Pogosova-Agadjanyan, E.L.; Peterson, A.; Noteboom, J.; O'Briant, K.C.; Allen, A.; Lin, D.W.; Urban, N.; Drescher, C.W.; Knudsen, B.S.; Stirewalt, D.L.; Gentleman, R.; Vessella, R.L.; Nelson, P.S.; Martin, D.B.; Tewari, M. , Circulating microRNAs as stable blood-based markers for cancer detection. Proc Natl Acad Sci U S A 2008, 105, 10513–10518. [Google Scholar] [CrossRef]
- Kupec, T.; Bleilevens, A.; Iborra, S.; Najjari, L.; Wittenborn, J.; Maurer, J.; Stickeler, E. , Stability of circulating microRNAs in serum. PLoS One 2022, 17, e0268958. [Google Scholar] [CrossRef]
- Gomez, E.; Ruiz-Alonso, M.; Miravet, J.; Simon, C. , Human Endometrial Transcriptomics: Implications for Embryonic Implantation. Cold Spring Harb Perspect Med 2015, 5, a022996. [Google Scholar] [CrossRef]
- Mumusoglu, S.; Polat, M.; Ozbek, I.Y.; Bozdag, G.; Papanikolaou, E.G.; Esteves, S.C.; Humaidan, P.; Yarali, H. , Preparation of the Endometrium for Frozen Embryo Transfer: A Systematic Review. Front Endocrinol (Lausanne) 2021, 12, 688237. [Google Scholar] [CrossRef]
- Kuokkanen, S.; Chen, B.; Ojalvo, L.; Benard, L.; Santoro, N.; Pollard, J.W. , Genomic profiling of microRNAs and messenger RNAs reveals hormonal regulation in microRNA expression in human endometrium. Biol Reprod 2010, 82, 791–801. [Google Scholar] [CrossRef] [PubMed]
- Sirohi, V.K.; Gupta, K.; Kumar, R.; Shukla, V.; Dwivedi, A. , Selective estrogen receptor modulator ormeloxifene suppresses embryo implantation via inducing miR-140 and targeting insulin-like growth factor 1 receptor in rat uterus. J Steroid Biochem Mol Biol 2018, 178, 272–282. [Google Scholar] [CrossRef]
- Andrews, S. , FastQC: a quality control tool for high throughput sequence data. In Babraham Bioinformatics, Babraham Institute, Cambridge, United Kingdom: 2010.
- Bolger, A.M.; Lohse, M.; Usadel, B. , Trimmomatic: a flexible trimmer for Illumina sequence data. Bioinformatics 2014, 30, 2114–2120. [Google Scholar] [CrossRef]
- Langmead, B.; Salzberg, S.L. , Fast gapped-read alignment with Bowtie 2. Nat Methods 2012, 9, 357–359. [Google Scholar] [CrossRef] [PubMed]
- Kozomara, A.; Birgaoanu, M.; Griffiths-Jones, S. , miRBase: from microRNA sequences to function. Nucleic Acids Res 2019, (D1), D155–D162. [Google Scholar] [CrossRef] [PubMed]
- Li, H.; Handsaker, B.; Wysoker, A.; Fennell, T.; Ruan, J.; Homer, N.; Marth, G.; Abecasis, G.; Durbin, R.; Genome Project Data Processing, S. , The Sequence Alignment/Map format and SAMtools. Bioinformatics 2009, 25, 2078–2079. [Google Scholar] [CrossRef]
- Ru, Y.; Kechris, K.J.; Tabakoff, B.; Hoffman, P.; Radcliffe, R.A.; Bowler, R.; Mahaffey, S.; Rossi, S.; Calin, G.A.; Bemis, L.; Theodorescu, D. , The multiMiR R package and database: integration of microRNA-target interactions along with their disease and drug associations. Nucleic Acids Res 2014, 42, e133. [Google Scholar] [CrossRef] [PubMed]
- Huang, H.Y.; Lin, Y.C.; Cui, S.; Huang, Y.; Tang, Y.; Xu, J.; Bao, J.; Li, Y.; Wen, J.; Zuo, H.; Wang, W.; Li, J.; Ni, J.; Ruan, Y.; Li, L.; Chen, Y.; Xie, Y.; Zhu, Z.; Cai, X.; Chen, X.; Yao, L.; Chen, Y.; Luo, Y.; LuXu, S.; Luo, M.; Chiu, C.M.; Ma, K.; Zhu, L.; Cheng, G.J.; Bai, C.; Chiang, Y.C.; Wang, L.; Wei, F.; Lee, T.Y.; Huang, H.D. , miRTarBase update 2022: an informative resource for experimentally validated miRNA-target interactions. Nucleic Acids Res 2022, 50, D222–D230. [Google Scholar] [CrossRef]
- Yu, G.; Wang, L.G.; Han, Y.; He, Q.Y. , clusterProfiler: an R package for comparing biological themes among gene clusters. OMICS 2012, 16, 284–287. [Google Scholar] [CrossRef] [PubMed]
- Kanehisa, M.; Goto, S. , KEGG: kyoto encyclopedia of genes and genomes. Nucleic Acids Res 2000, 28, 27–30. [Google Scholar] [CrossRef]
- Ashburner, M.; Ball, C.A.; Blake, J.A.; Botstein, D.; Butler, H.; Cherry, J.M.; Davis, A.P.; Dolinski, K.; Dwight, S.S.; Eppig, J.T.; Harris, M.A.; Hill, D.P.; Issel-Tarver, L.; Kasarskis, A.; Lewis, S.; Matese, J.C.; Richardson, J.E.; Ringwald, M.; Rubin, G.M.; Sherlock, G. , Gene ontology: tool for the unification of biology. The Gene Ontology Consortium. Nat Genet 2000, 25, 25–29. [Google Scholar] [CrossRef]
- Croft, D.; O'Kelly, G.; Wu, G.; Haw, R.; Gillespie, M.; Matthews, L.; Caudy, M.; Garapati, P.; Gopinath, G.; Jassal, B.; Jupe, S.; Kalatskaya, I.; Mahajan, S.; May, B.; Ndegwa, N.; Schmidt, E.; Shamovsky, V.; Yung, C.; Birney, E.; Hermjakob, H.; D'Eustachio, P.; Stein, L. , Reactome: a database of reactions, pathways and biological processes. Nucleic Acids Res 2011, 39, D691–D697. [Google Scholar] [CrossRef]
- Kinsella, R.J.; Kahari, A.; Haider, S.; Zamora, J.; Proctor, G.; Spudich, G.; Almeida-King, J.; Staines, D.; Derwent, P.; Kerhornou, A.; Kersey, P.; Flicek, P. , Ensembl BioMarts: a hub for data retrieval across taxonomic space. Database (Oxford) 2011, 2011, bar030. [Google Scholar] [CrossRef] [PubMed]
- Cohen, J.; Cohen, J. , Applied multiple regression/correlation analysis for the behavioral sciences., 3rd ed.; L. Erlbaum Associates: Mahwah, N.J, 2003. [Google Scholar]
Figure 1.
Overview of dynamic DE miRNAs discovered in endometrial tissue. (A) Heatmap plot showing 76 dynamic DE miRNAs identified from 62 endometrial tissue samples sorted top to bottom by their pattern of change. The complete list of 76 dynamic DE miRNAs is shown in Supplemental Table 2. (B) The 76 dynamic DE miRNAs are classified into two main categories based on their expression patterns: 1) “increasing pattern”, where expression levels increase over time, and 2) “decreasing pattern”, where expression levels decrease over time. Further classification divides these patterns into four subcategories based on the changes observed between day P+3 and P+7. In the “increasing pattern” category, from left to right: the first graph shows an initial decrease followed by an increase (lowest point at day P+4); the second shows a continuous increase; the third graph shows an initial increase followed by a decrease (peak at day P+6 ); and the fourth shows an increase followed by a decrease (peak at day P+5). The x-axis represents days P+3 to P+7, while the y-axis represents miRNA expression levels. The “decreasing pattern” subcategories exhibit the opposite trend of the “increasing pattern” subcategories. (C) One representative dynamic DE miRNA is selected for each of the 8 expression patterns described in (B).
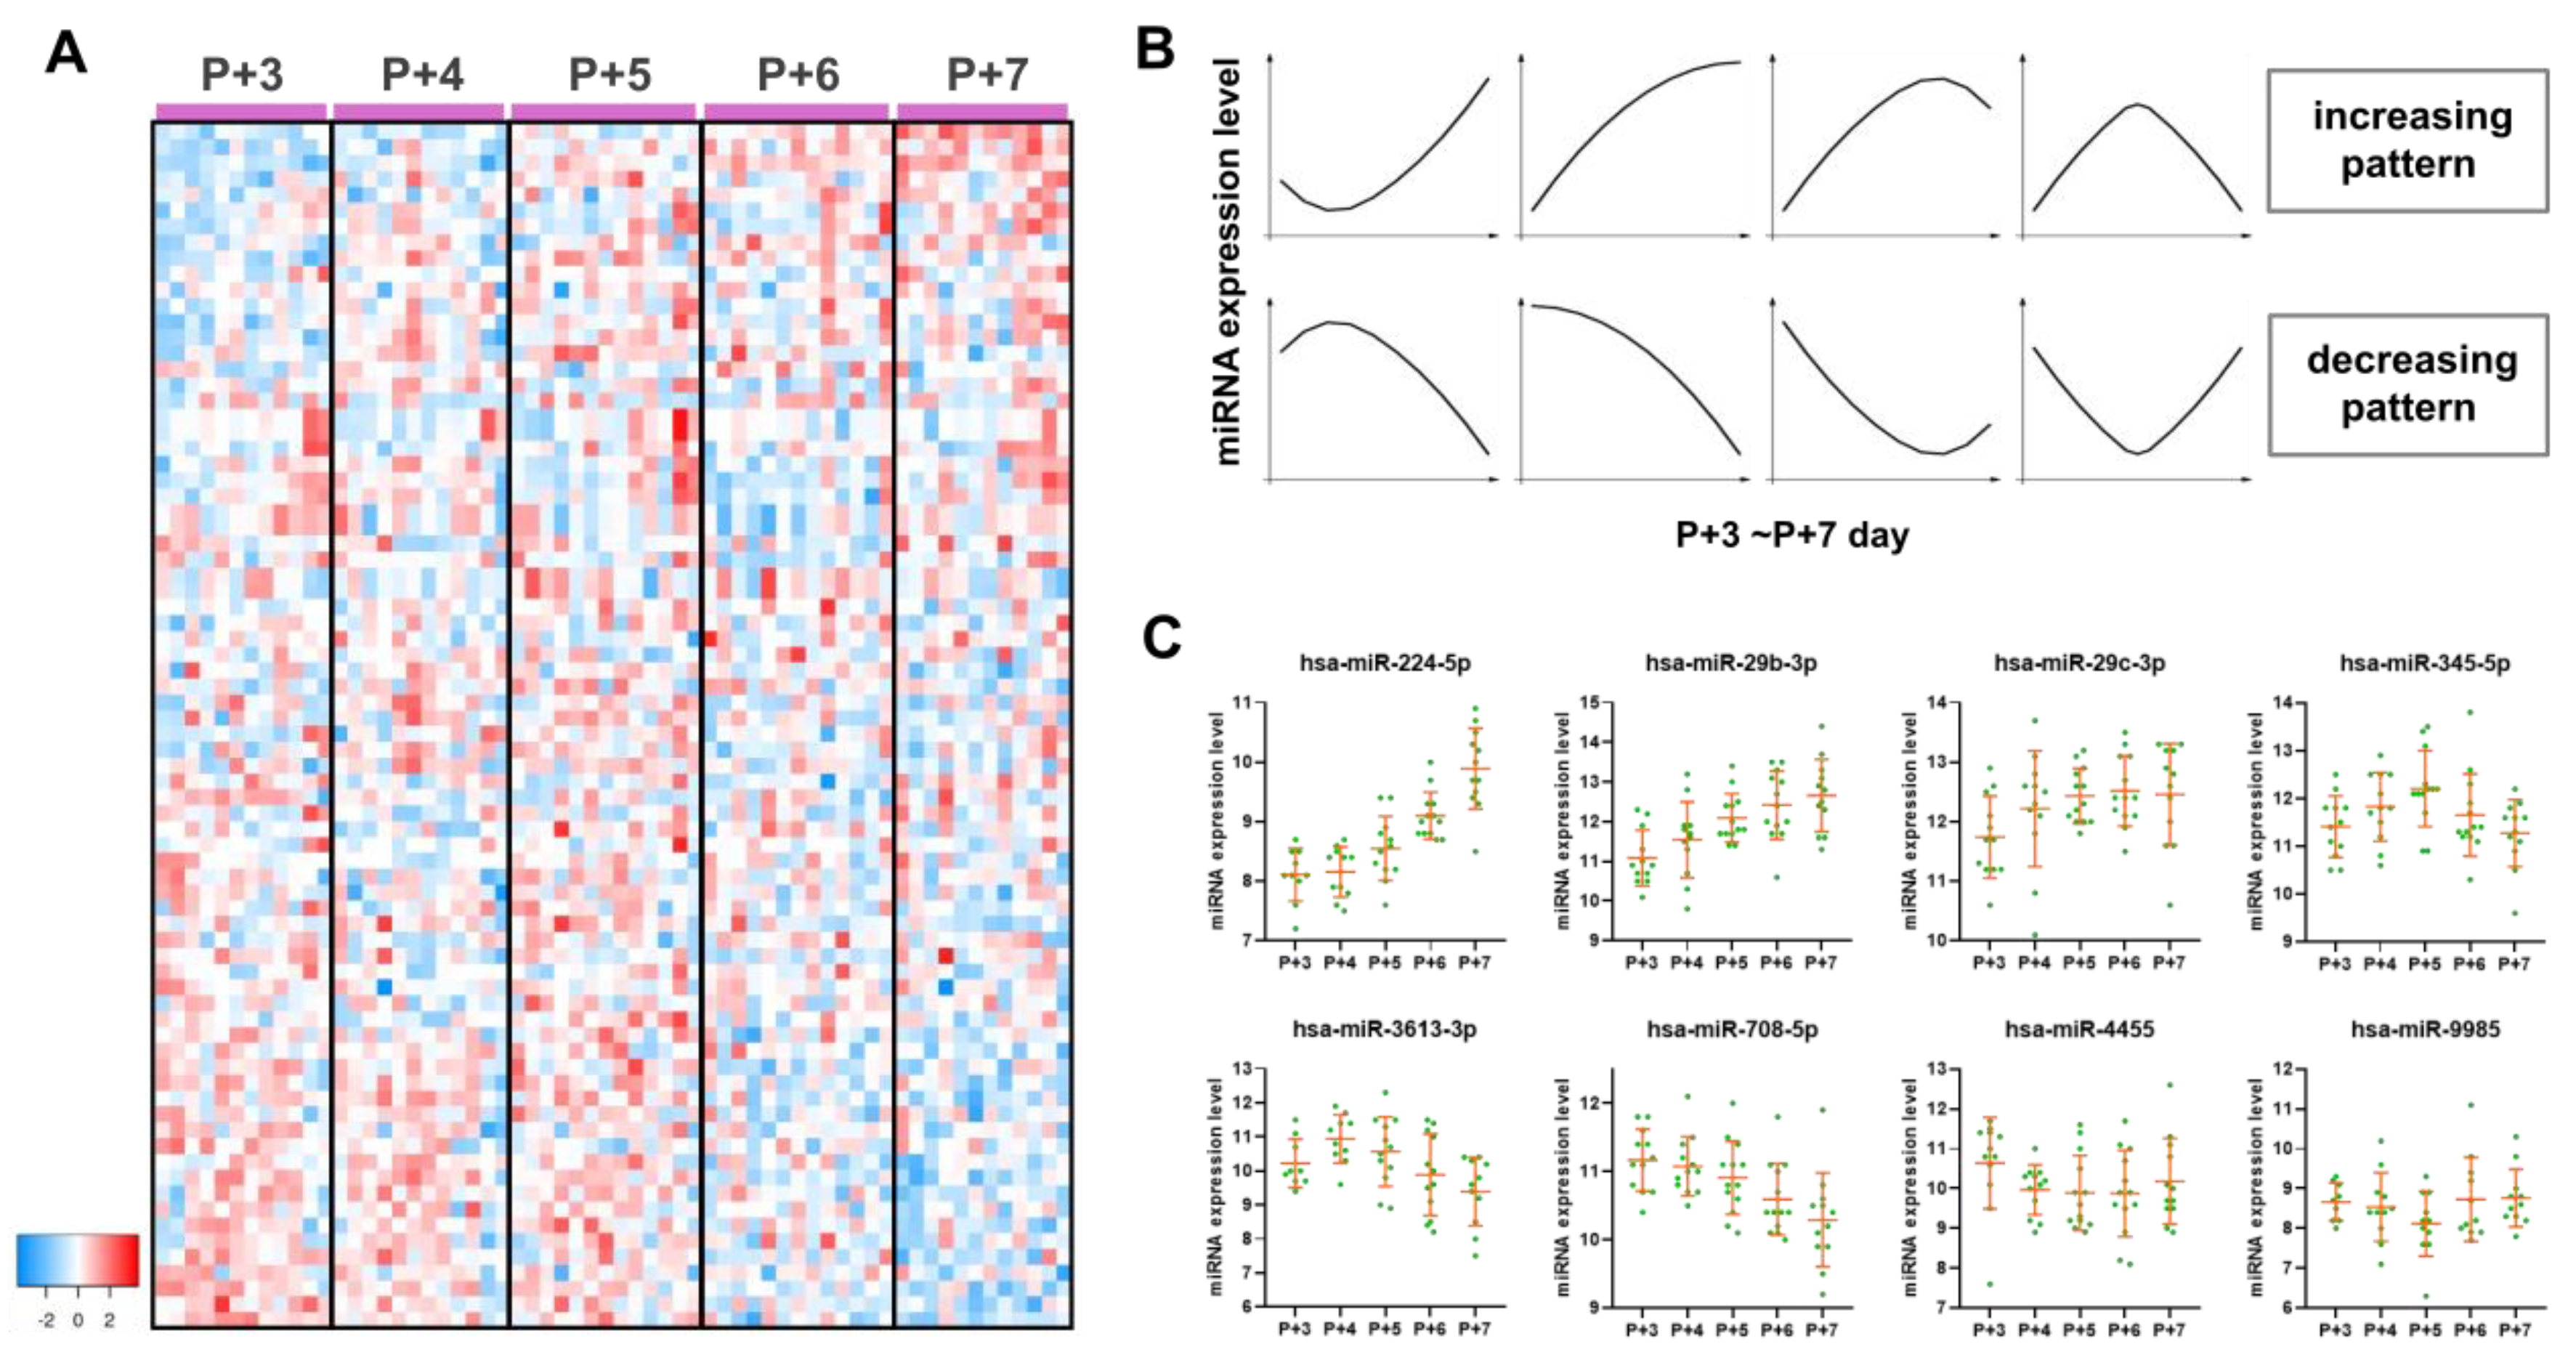
Figure 2.
Target gene and functional enrichment analysis of dynamic DE miRNAs discovered in endometrial tissue. The miRNA-mRNA network is constructed using dynamic DE miRNAs and their target genes, including those with increasing patterns (A) and decreasing patterns (B). Dynamic DE miRNAs are highlighted in yellow. Target genes targeted by one dynamic DE miRNA are highlighted in light blue, while those regulated by two or more dynamic DE miRNAs are highlighted in dark blue. Supplemental Table 5 provides a comprehensive list of dynamic DE miRNAs and their target genes. (C) Functional enrichment analysis employs Kyoto Encyclopedia of Genes and Genomes (KEGG) pathways, Gene Ontology (GO) biological process, and Reactome pathway database. The y-axis displays enriched pathways and biological functions, while the x-axis shows the number of target gene involved in the pathway or biological function.
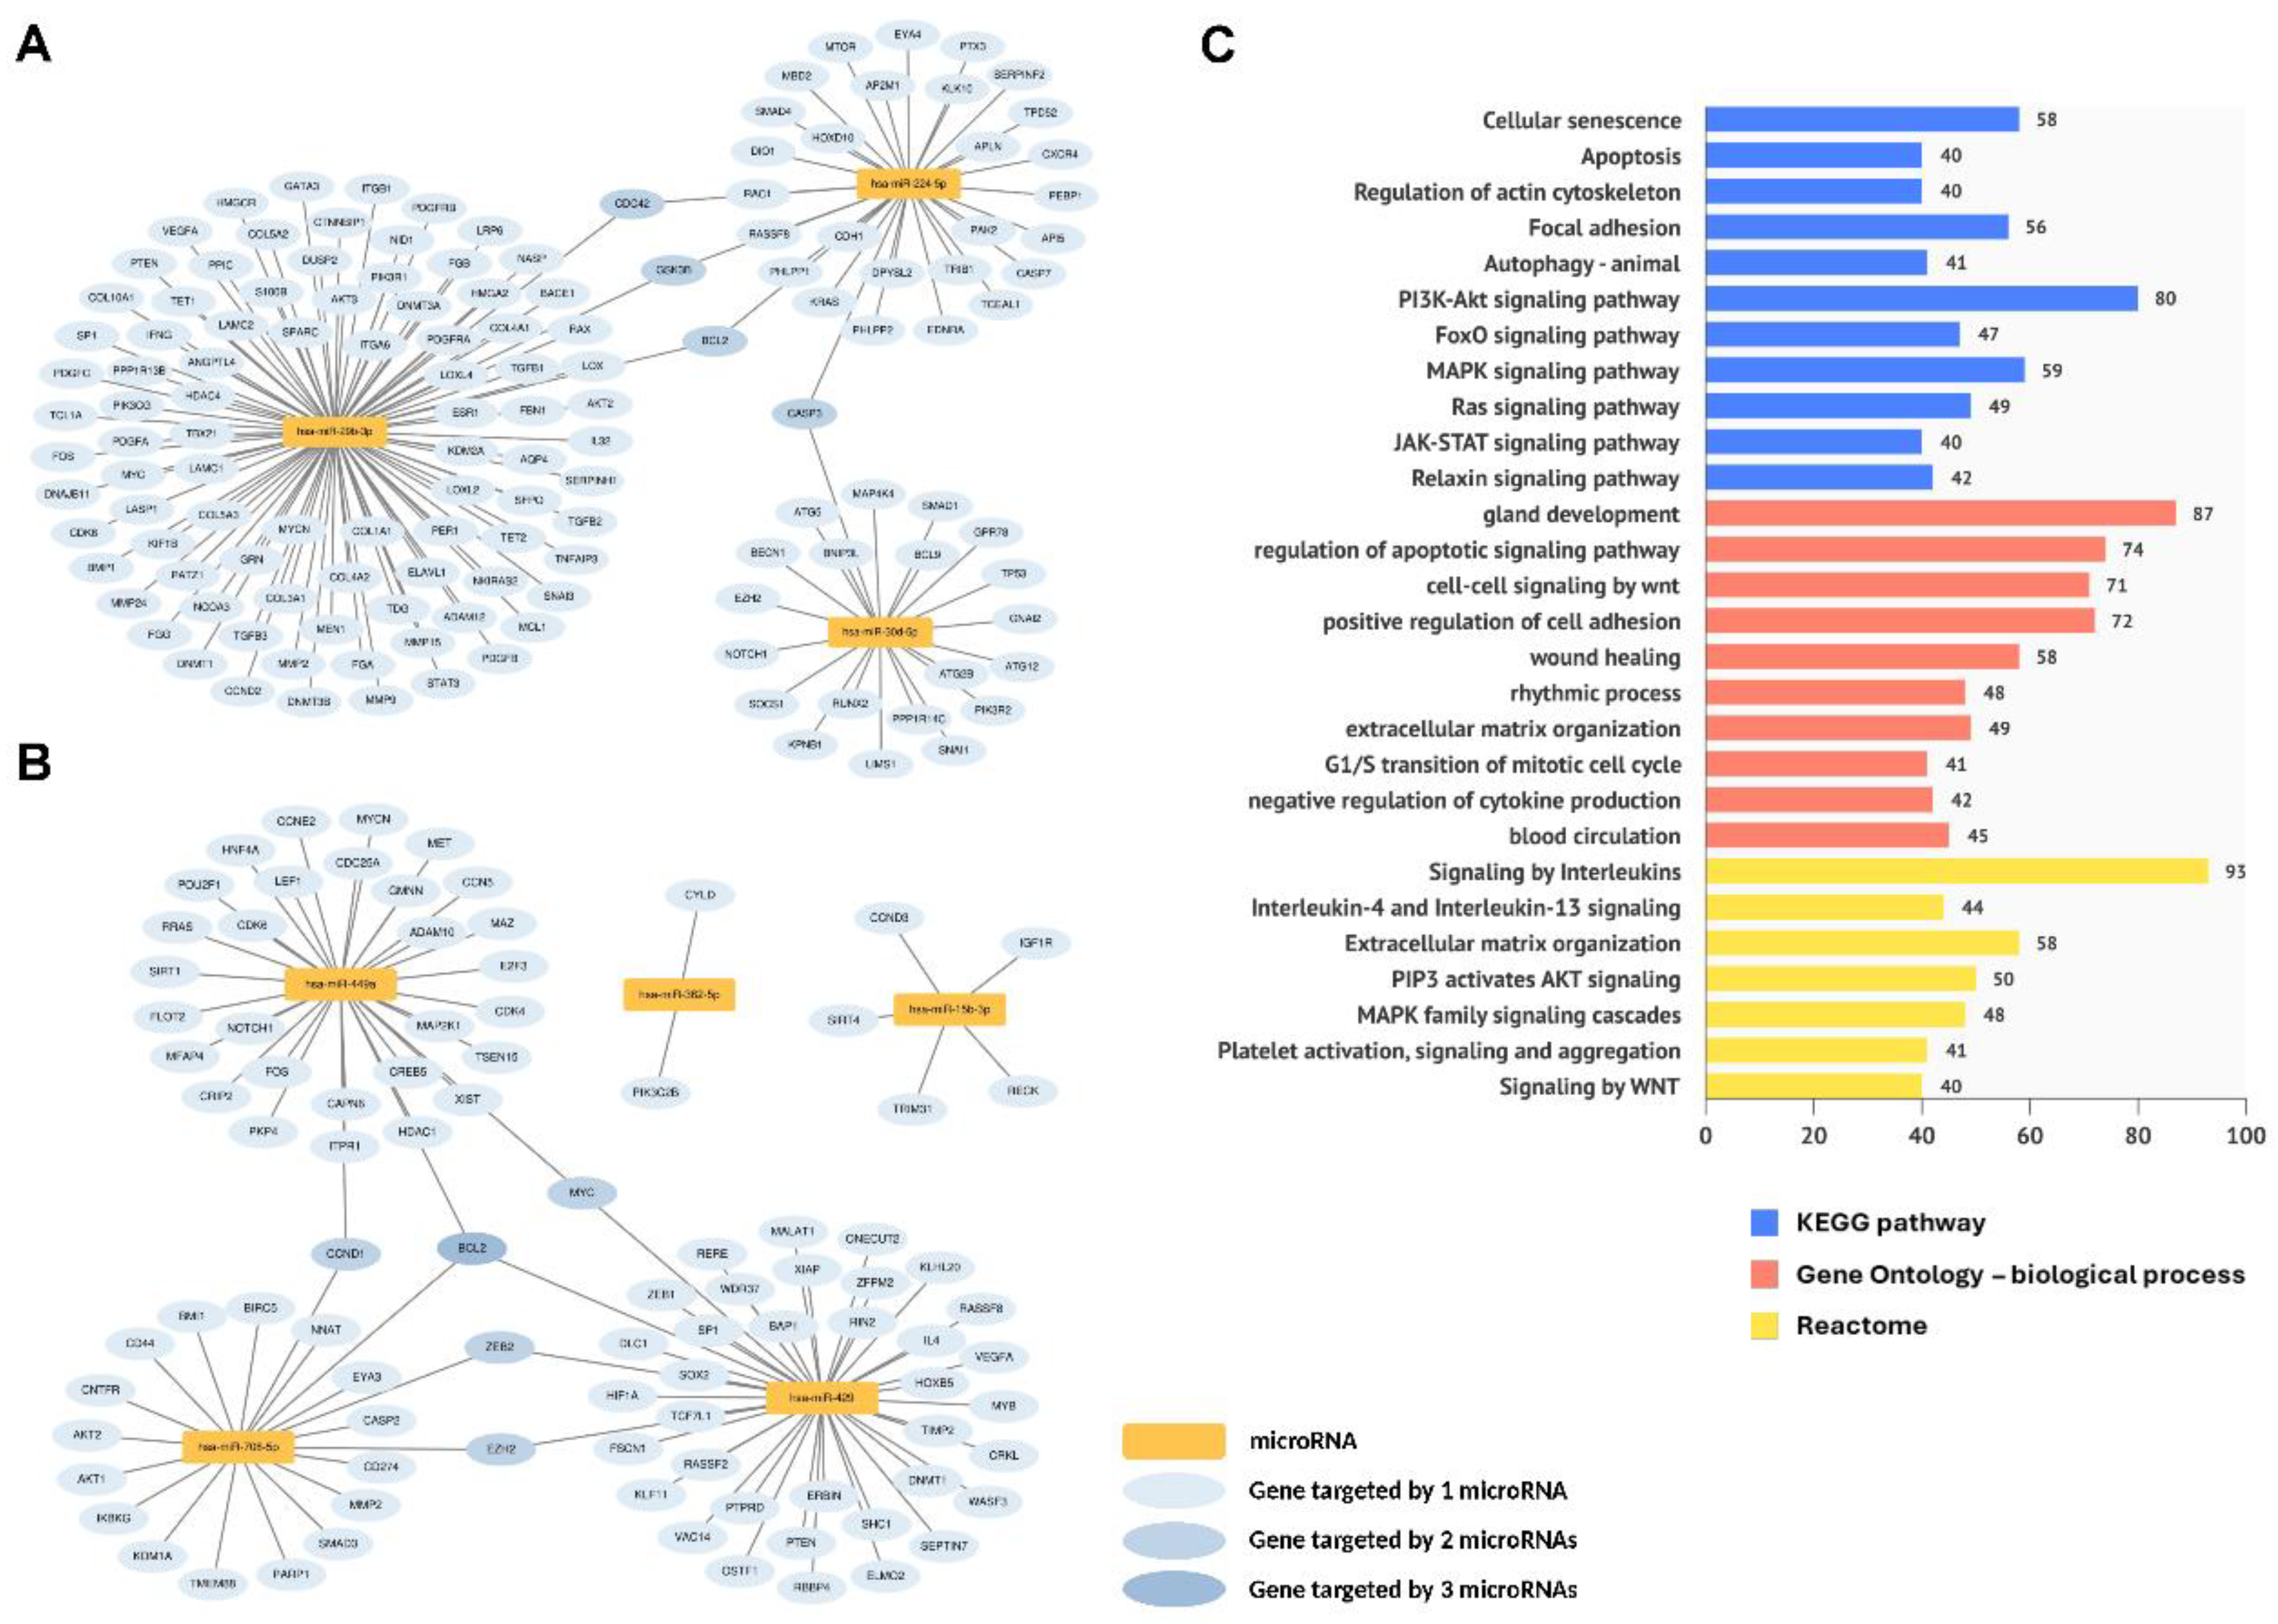
Figure 3.
Overview of dynamic DE miRNAs identified in plasma samples. (A) Heatmap plot displaying 48 dynamic DE miRNAs identified from 62 plasma samples arranged top to bottom based on their pattern of dynamic change. The full list of these 48 dynamic DE miRNAs can be found in Supplemental Table 8. (B) Four examples of dynamic DE miRNAs that exhibit drastic changes: hsa-miR-182-5p, which shows an "increasing pattern“, while hsa-miR-1260b, hsa-miR-7-5p, and hsa-miR-99a-5p display a "decreasing pattern“.
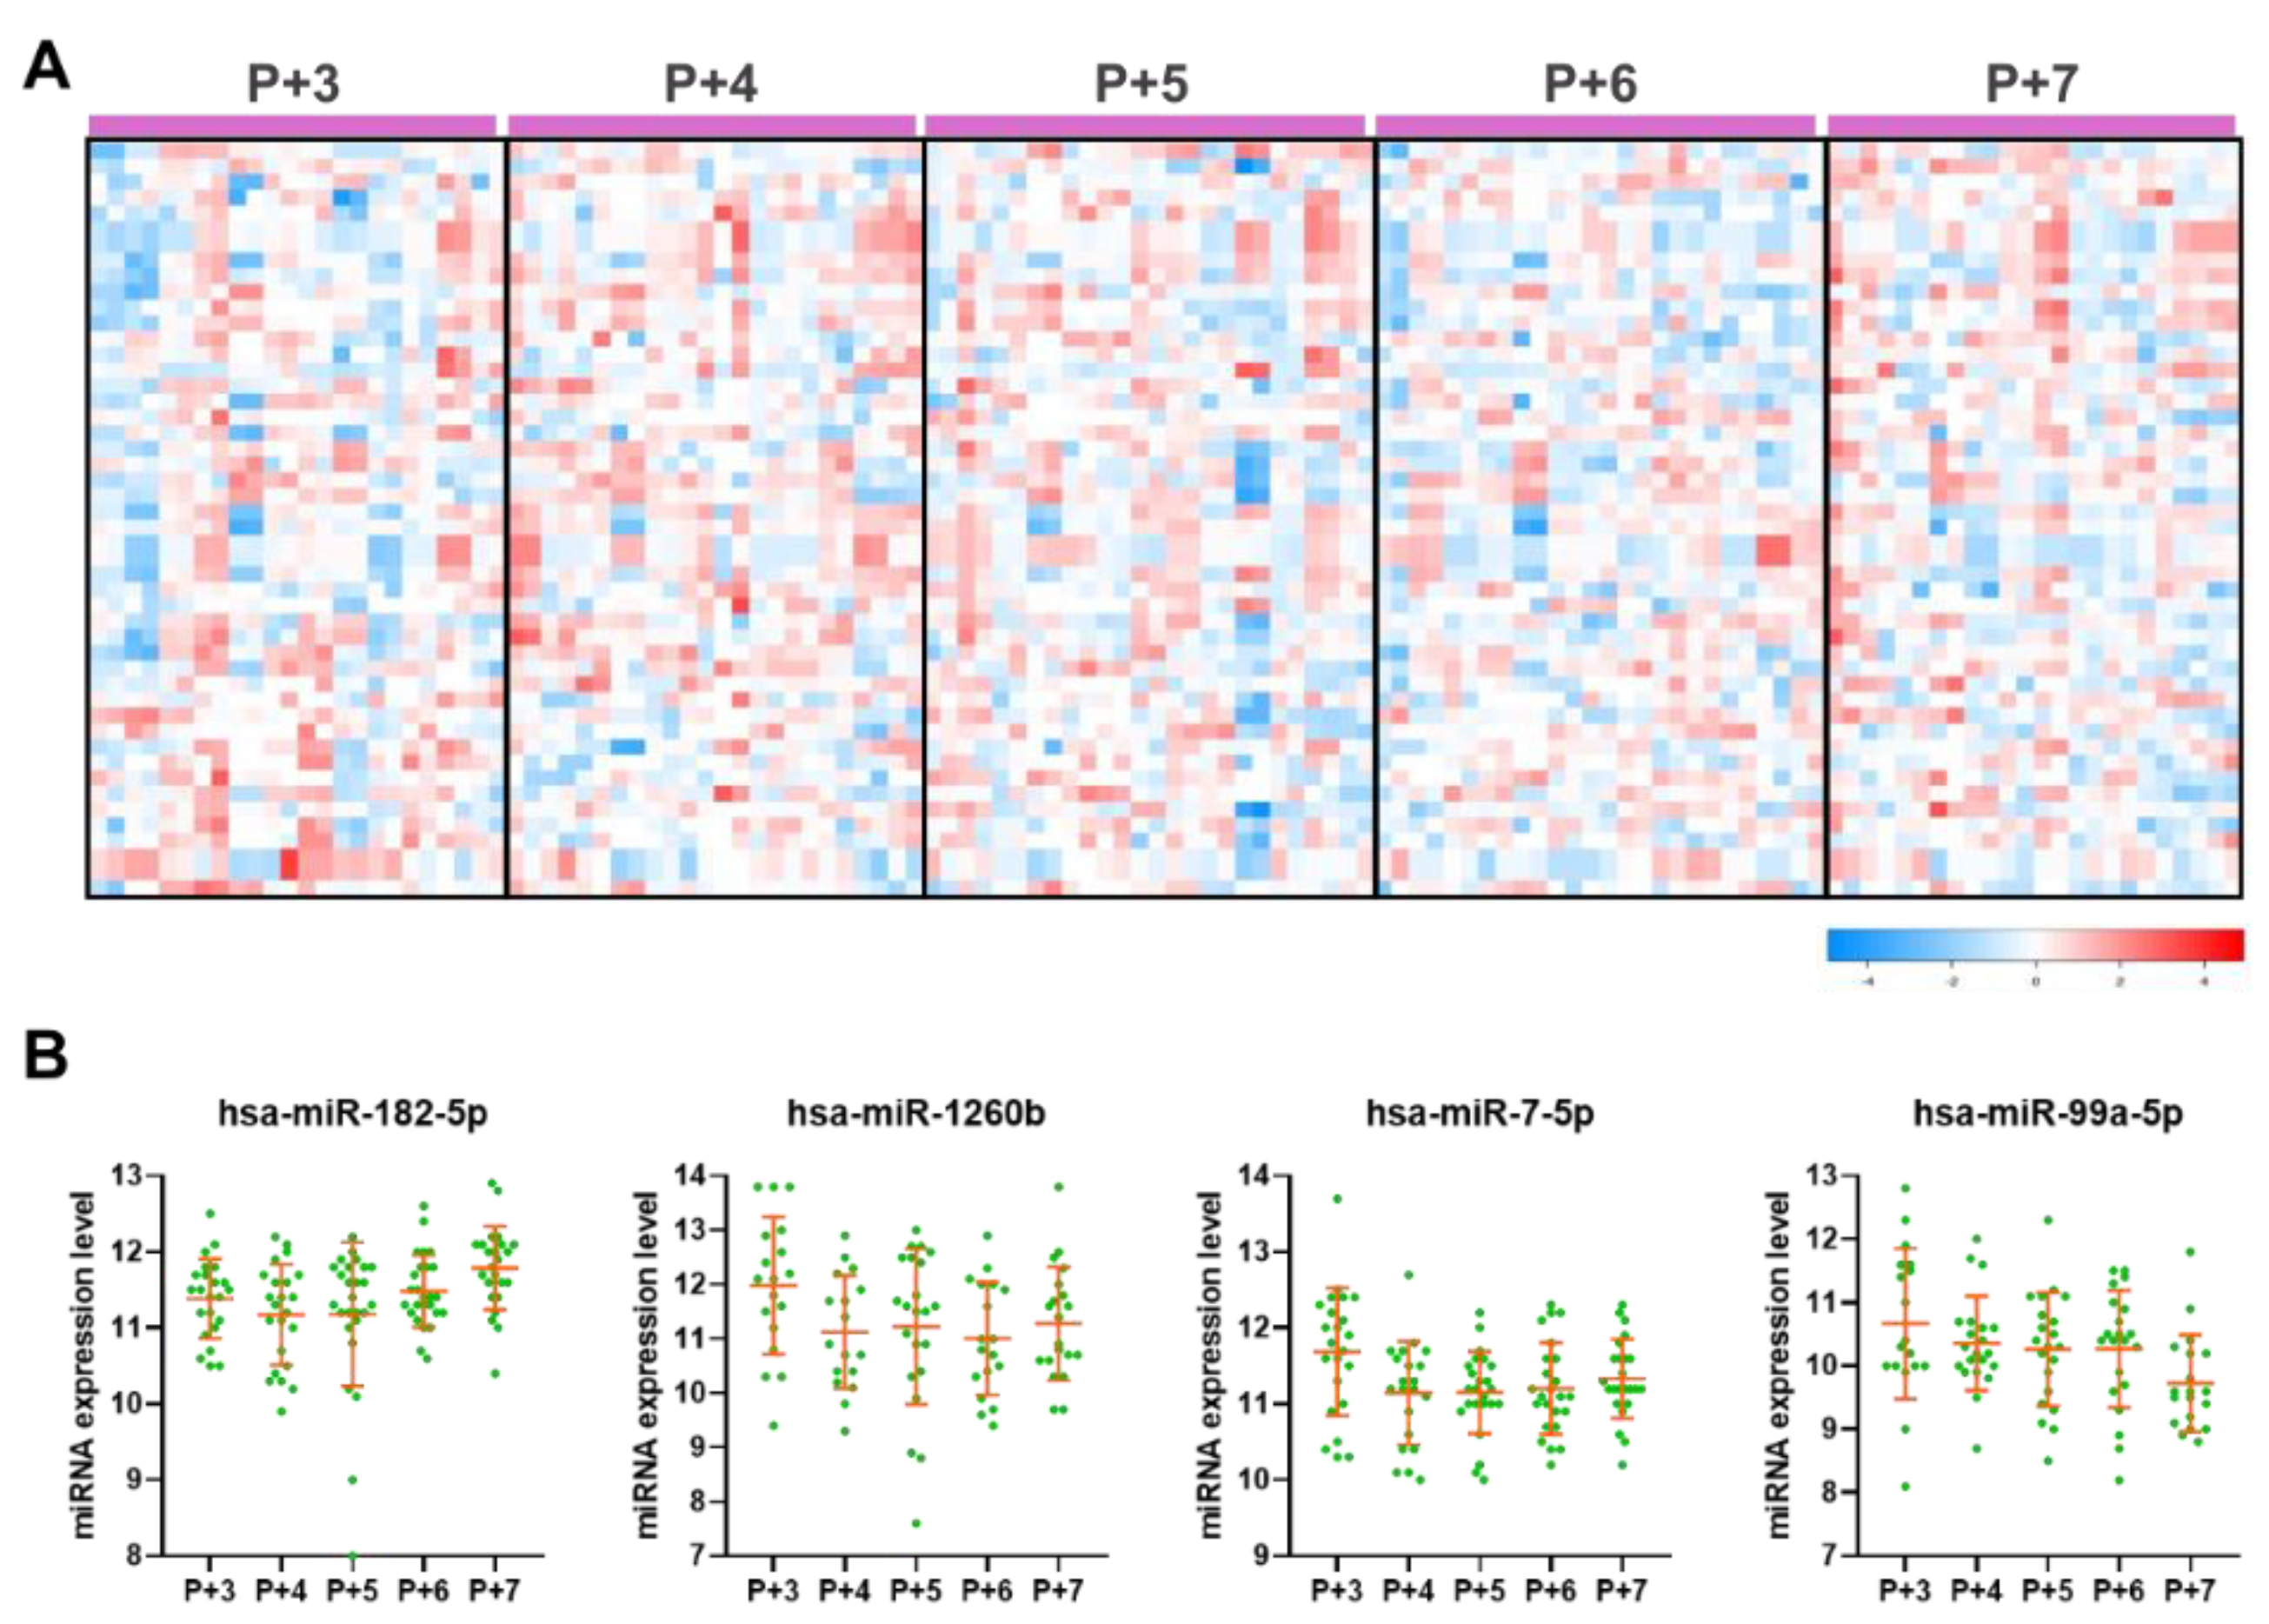
Figure 4.
Target gene and functional enrichment analysis of dynamic DE miRNAs identified in plasma samples. The miRNA-mRNA network is constructed using dynamic DE miRNAs and their target genes, including those with increasing (A) and decreasing (B) expression patterns. Dynamic DE miRNAs are shown in yellow, while target genes are color-coded: light blue for those targeted by a single dynamic DE miRNA, and dark blue for those targeted by two or more. A comprehensive list of dynamic DE miRNAs and their target genes is available in Supplemental Table 9. (C) Functional enrichment analysis conducted using the Kyoto Encyclopedia of Genes and Genomes (KEGG) pathways, Gene Ontology (GO) biological processes, and the Reactome pathway database. The y-axis presents enriched pathways and biological functions, while the x-axis indicates the number of target genes involved in each pathway or function.
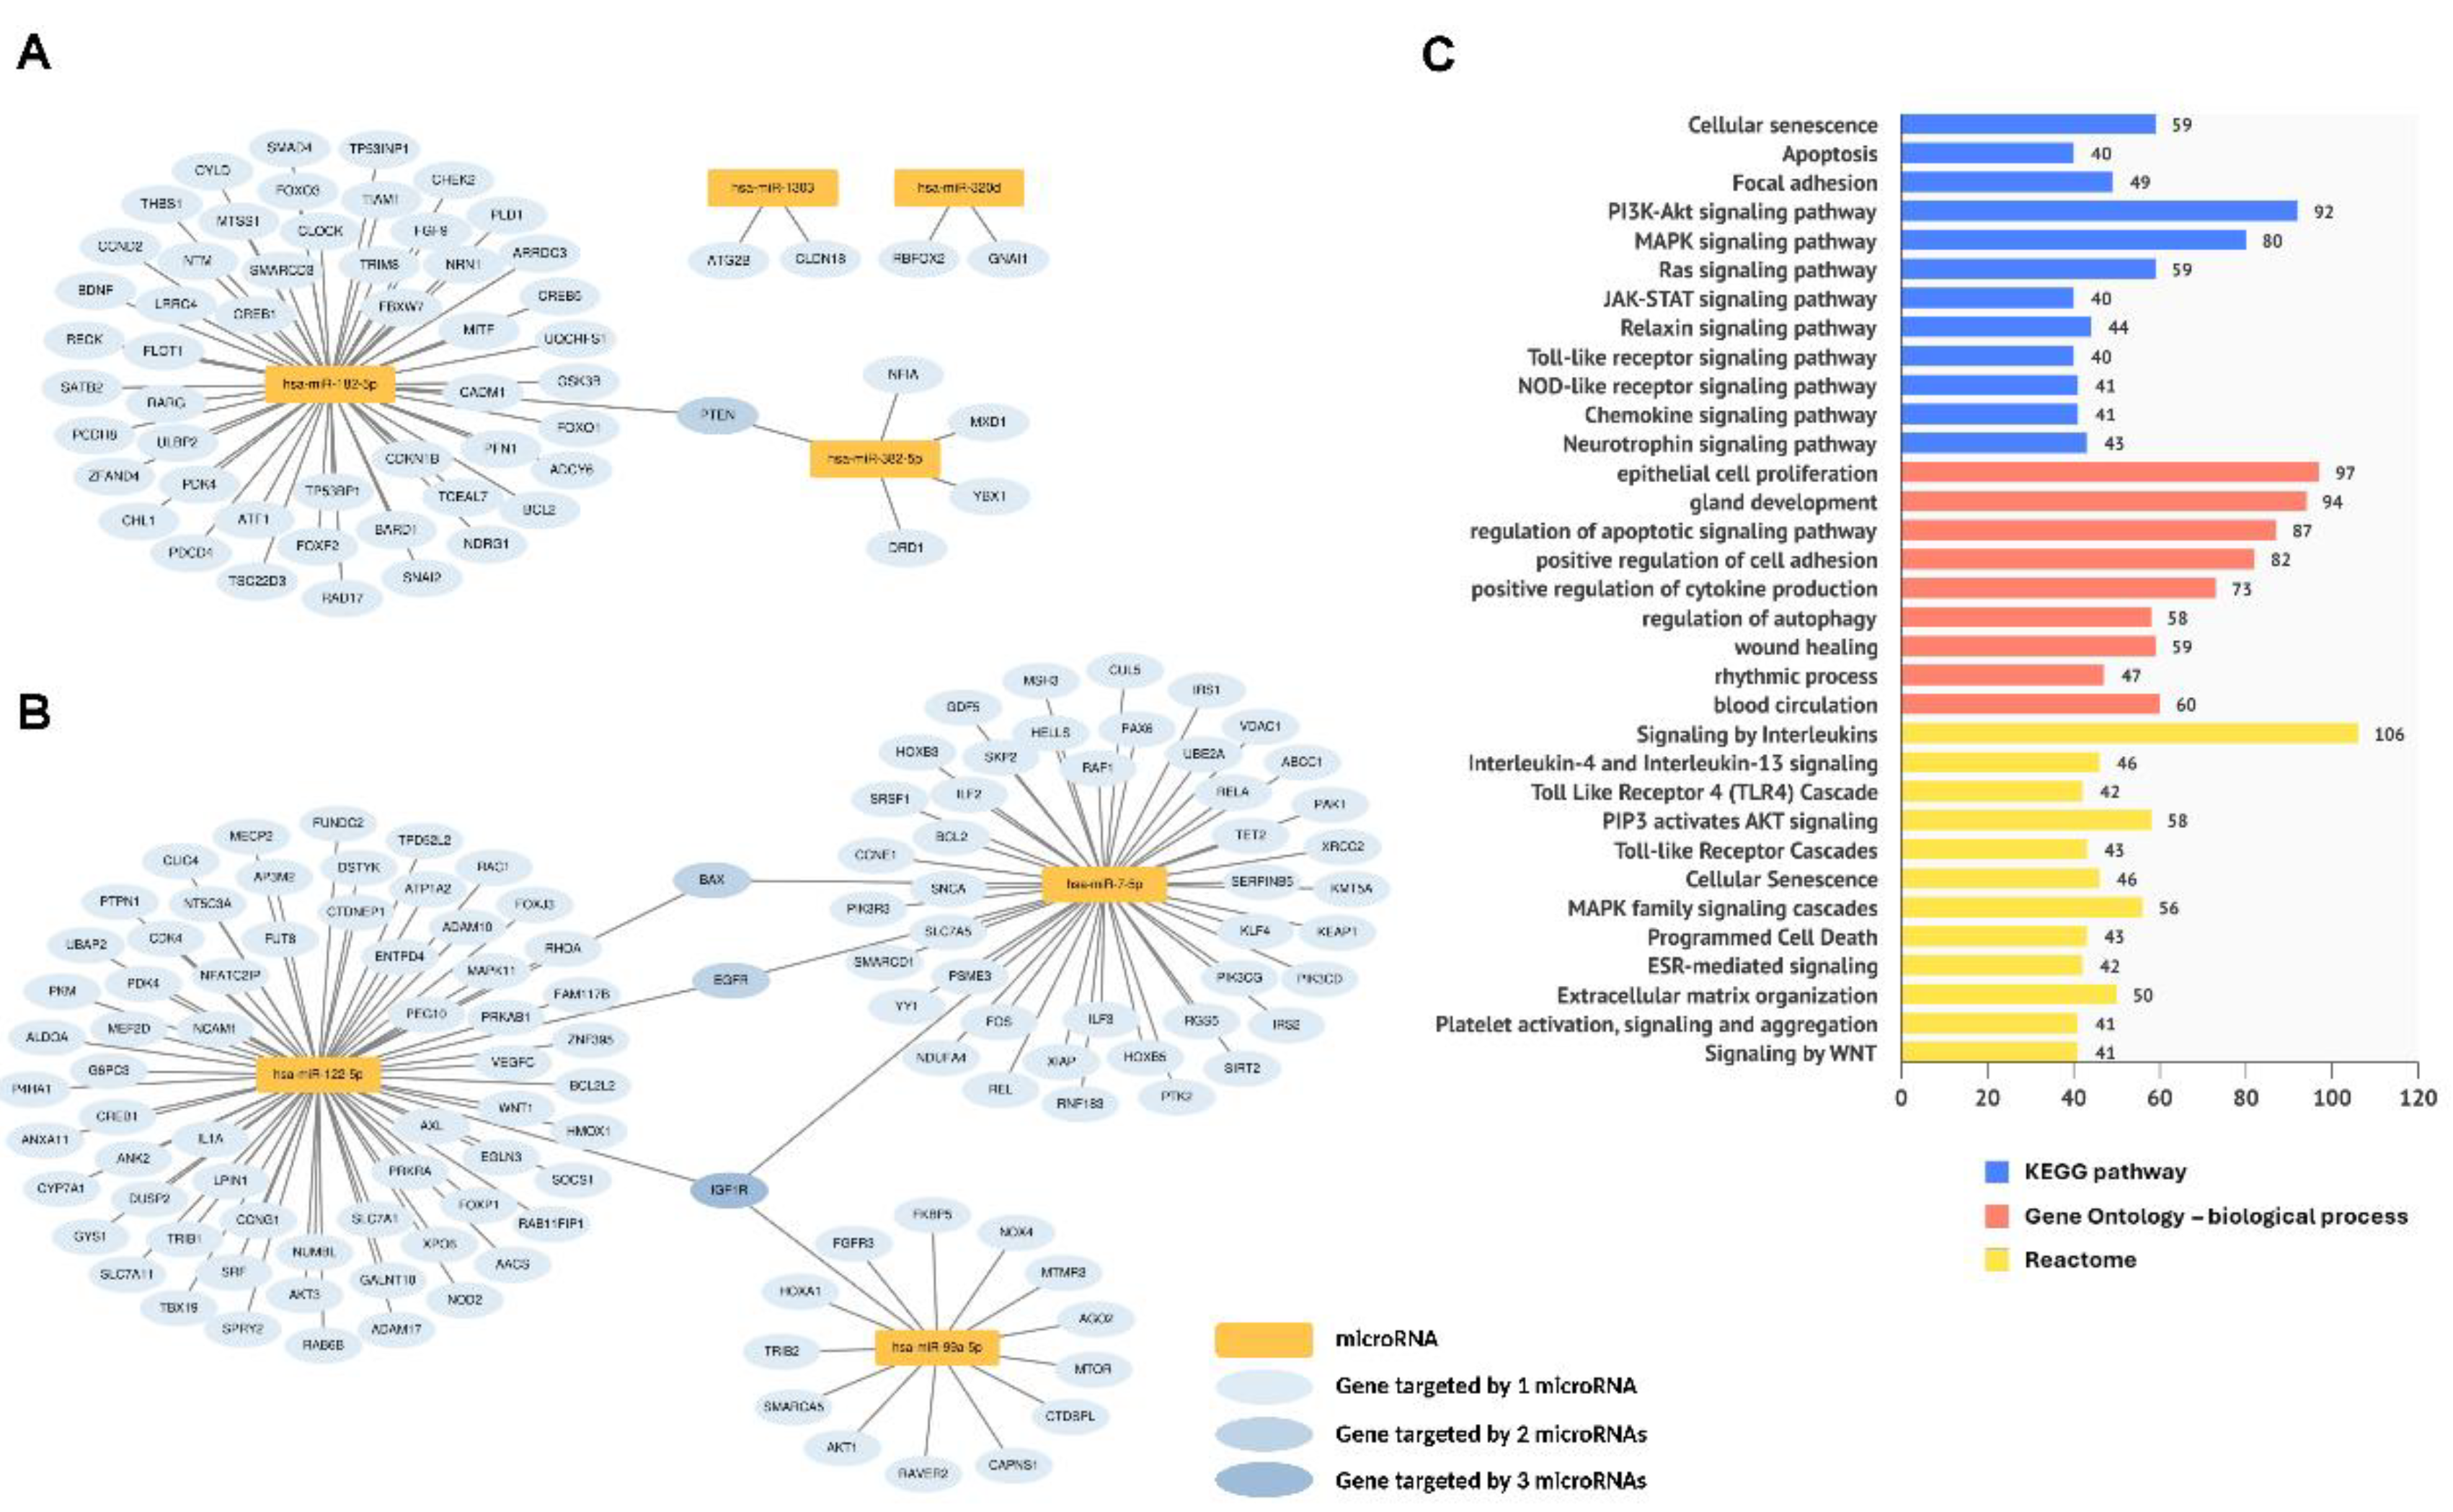
Figure 5.
Dynamic DE miRNAs overlapping in endometrial tissue and plasma samples. The 10 overlapping dynamic DE miRNAs in endometrial tissue and plasma samples are sorted by miRNA name from left to right. The x-axis displays day P+3 to P+7 groups, while the y-axis shows the relative expression level (relative to day P+3 group). Blue lines indicate the relative expression levels in endometrial tissue, and red lines represent those in plasma samples.
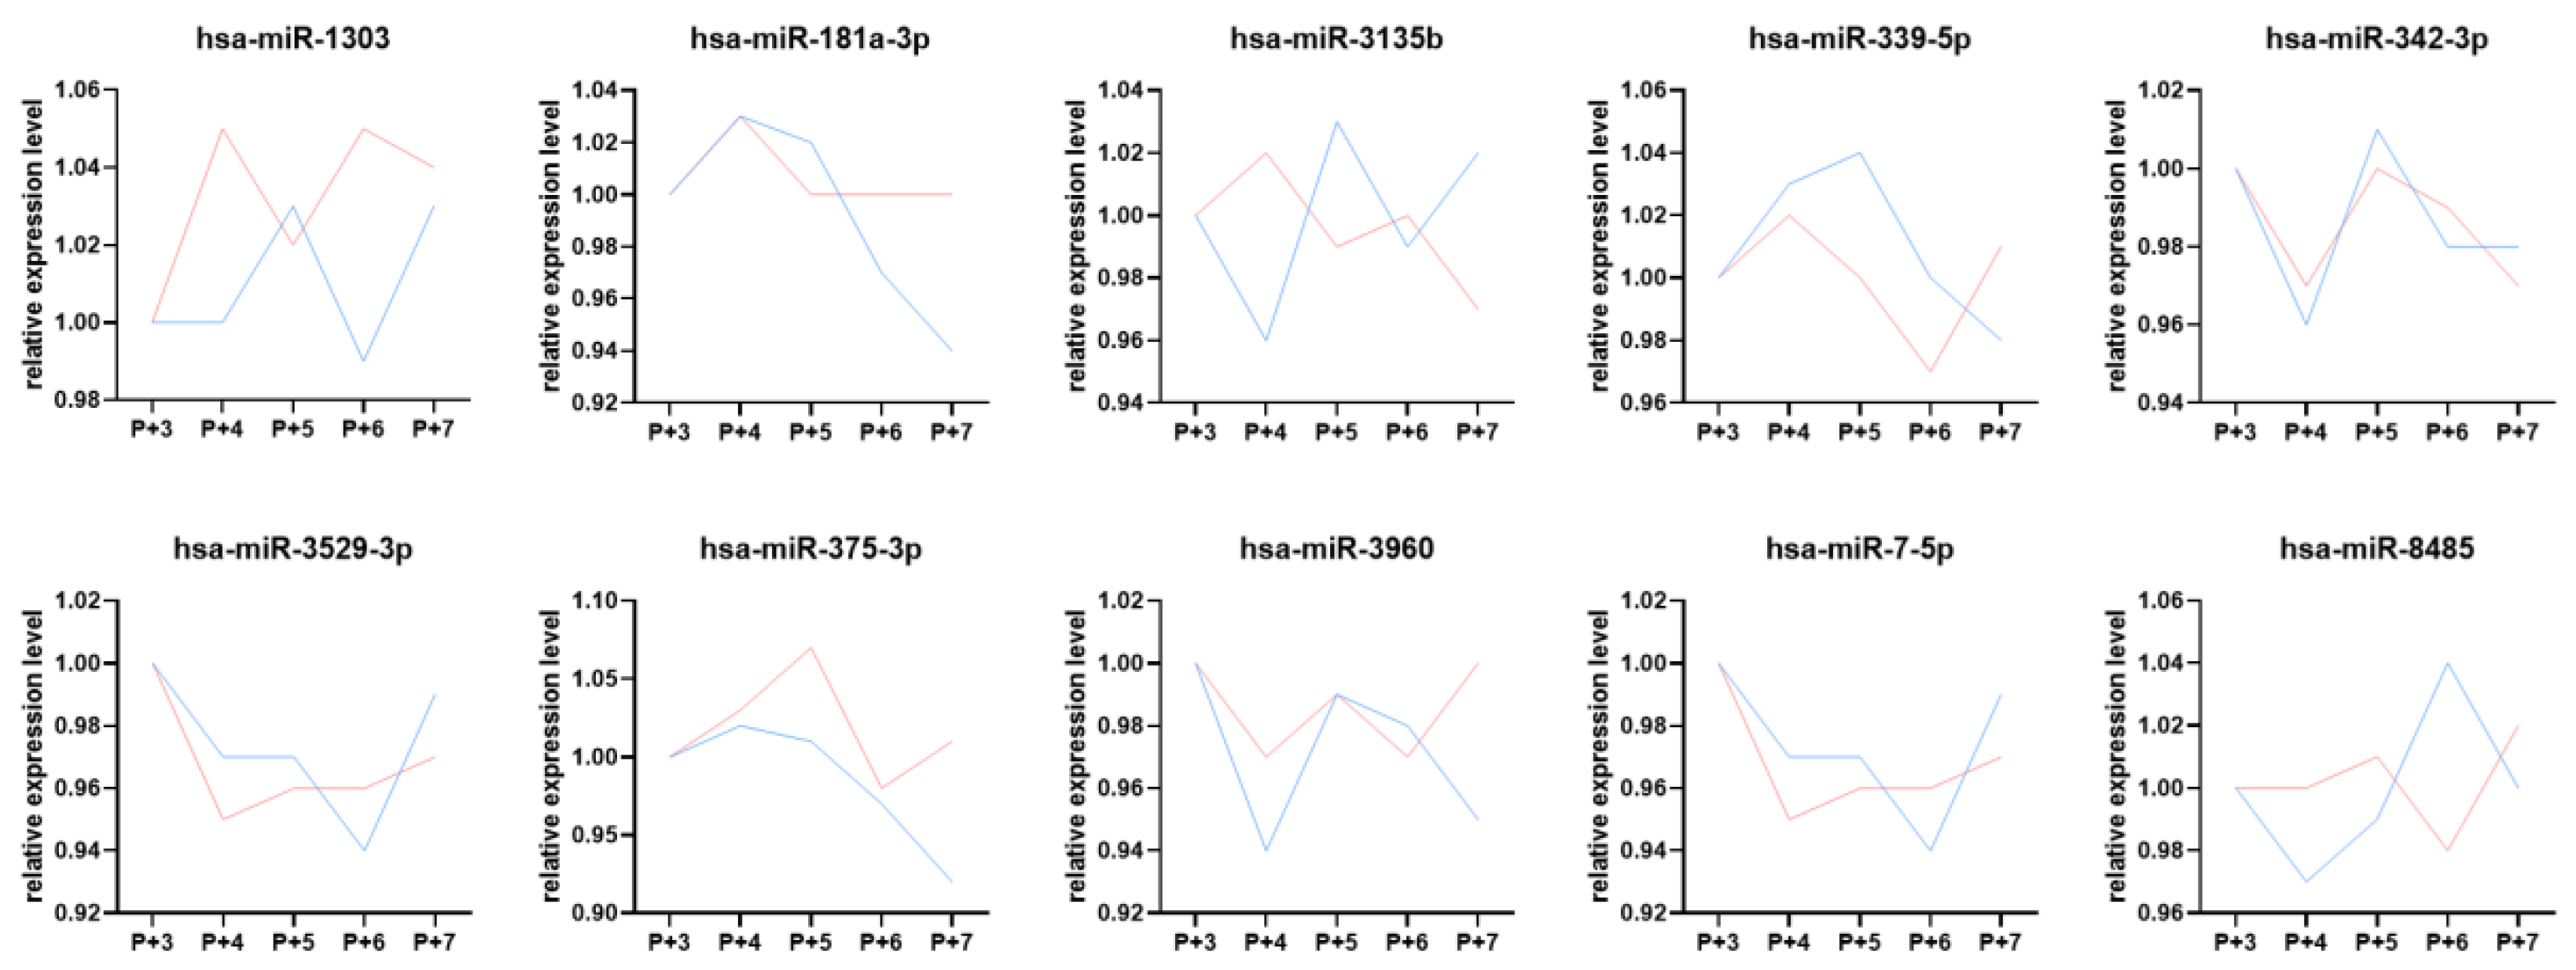

Table 1.
Performance of prediction model building dataset.
| P+ Day | P+3 | P+4 | P+5 | P+6 | P+7 | ANOVA p-value |
|||||||||||
| Sample number |
12 | 12 | 13 | 13 | 12 | - | |||||||||||
| Age (mean ± SD) |
31.3 | ± | 4.6 | 29.2 | ± | 2.8 | 30.3 | ± | 4.1 | 31.6 | ± | 4.7 | 30.6 | ± | 3.7 | 0.599 | |
| BMI (mean ± SD) |
21.9 | ± | 2.1 | 22.1 | ± | 1.9 | 22.6 | ± | 3.7 | 21.4 | ± | 2.4 | 22.3 | ± | 2.4 | 0.796 | |
| sample number with a history of pregnancy |
7 | 3 | 5 | 9 | 6 | - | |||||||||||
| sample number without a history of pregnancy |
5 | 9 | 8 | 4 | 6 | - | |||||||||||
| FSH (mIU/ml) (mean ± SD) |
Day 2 | 6.28 | ± | 1.90 | 6.16 | ± | 1.45 | 8.09 | ± | 2.43 | 7.25 | ± | 2.04 | 6.50 | ± | 1.78 | 0.085 |
| Day 10-12 | 6.19 | ± | 2.16 | 6.05 | ± | 2.14 | 6.33 | ± | 1.63 | 6.33 | ± | 2.08 | 6.15 | ± | 1.24 | 0.995 | |
| P+ day | 3.30 | ± | 1.37 | 3.88 | ± | 1.33 | 4.14 | ± | 1.90 | 3.26 | ± | 0.89 | 4.02 | ± | 1.61 | 0.411 | |
| LH (mIU/ml) (mean ± SD) |
Day 2 | 4.19 | ± | 1.43 | 4.09 | ± | 1.40 | 4.05 | ± | 1.79 | 4.81 | ± | 3.86 | 4.83 | ± | 3.23 | 0.880 |
| Day 10-12 | 15.78 | ± | 8.78 | 14.09 | ± | 9.49 | 11.98 | ± | 7.12 | 15.53 | ± | 7.42 | 16.74 | ± | 7.58 | 0.622 | |
| P+ day | 4.66 | ± | 2.12 | 5.36 | ± | 2.91 | 5.08 | ± | 2.24 | 7.00 | ± | 3.55 | 6.99 | ± | 4.24 | 0.196 | |
| Estrogen (pg/ml) (mean ± SD) |
Day 2 | 42.83 | ± | 29.66 | 49.67 | ± | 16.91 | 52.31 | ± | 19.86 | 48.00 | ± | 26.36 | 50.17 | ± | 23.51 | 0.890 |
| Day 10-12 | 503.42 | ± | 187.38 | 462.17 | ± | 137.92 | 505.54 | ± | 259.17 | 616.08 | ± | 317.34 | 535.17 | ± | 261.35 | 0.590 | |
| P+ day | 376.58 | ± | 192.60 | 238.17 | ± | 94.36 | 353.23 | ± | 179.89 | 363.08 | ± | 190.00 | 336.08 | ± | 213.03 | 0.341 | |
| Progesteron (ng/ml) (mean ± SD) |
Day 2 | 0.33 | ± | 0.25 | 0.39 | ± | 0.31 | 0.67 | ± | 0.57 | 0.32 | ± | 0.17 | 0.48 | ± | 0.20 | 0.059 |
| Day 10-12 | 0.30 | ± | 0.21 | 0.28 | ± | 0.14 | 0.34 | ± | 0.20 | 0.38 | ± | 0.24 | 0.37 | ± | 0.24 | 0.685 | |
| P+ day | 3.82 | ± | 1.50 | 3.90 | ± | 1.46 | 3.05 | ± | 1.33 | 3.55 | ± | 1.70 | 3.06 | ± | 1.34 | 0.448 | |
| Endometrial thickness (mm) (mean ± SD) |
Day 2 | 5.55 | ± | 1.22 | 7.33 | ± | 2.89 | 6.55 | ± | 2.08 | 6.65 | ± | 2.21 | 6.46 | ± | 1.78 | 0.367 |
| Day 10-12 | 9.43 | ± | 1.69 | 9.78 | ± | 1.98 | 10.00 | ± | 2.67 | 10.27 | ± | 1.60 | 12.15 | ± | 2.16 | 0.019 | |
| P+ day | 10.47 | ± | 2.53 | 10.18 | ± | 2.14 | 11.24 | ± | 2.92 | 11.38 | ± | 2.32 | 12.13 | ± | 3.21 | 0.397 | |
Disclaimer/Publisher’s Note: The statements, opinions and data contained in all publications are solely those of the individual author(s) and contributor(s) and not of MDPI and/or the editor(s). MDPI and/or the editor(s) disclaim responsibility for any injury to people or property resulting from any ideas, methods, instructions or products referred to in the content. |
© 2025 by the authors. Licensee MDPI, Basel, Switzerland. This article is an open access article distributed under the terms and conditions of the Creative Commons Attribution (CC BY) license (http://creativecommons.org/licenses/by/4.0/).
Copyright: This open access article is published under a Creative Commons CC BY 4.0 license, which permit the free download, distribution, and reuse, provided that the author and preprint are cited in any reuse.


