Submitted:
30 October 2025
Posted:
03 November 2025
You are already at the latest version
Abstract
Amphibious light sport aircraft (LSA) combine the versatility of land and water operations but suffer aerodynamic penalties from their inherent design requirements, limiting cruise performance. This study investigates two drag reduction features for a proposed high-performance amphibious LSA developed by Altavia Aerospace. The concept targets a 140-knot cruise speed, using retractable wingtip pontoons and a novel retractable hull step fairing. A 1/5-scale flying model was built and flight tested to assess the aerodynamic benefits of these features and evaluate sub-scale flight testing as a tool for drag measurement. Estimated propulsive power and GPS-based speed data corrected for wind were used to compute an estimated 17% reduction in drag coefficient by retracting the pontoons. The hull step fairing showed no measurable gains, likely due to inconsistent battery voltage, despite literature indicating potential 5% drag savings. Drag measurement precision of 7–9% was achieved using the power-based method, with potential precision better than 3% achievable if the designed thrust data system were fully validated and an autopilot integrated. A performance estimation for Altavia Aerospace’s concept predicts a cruise speed of 134 knots at 10000 ft. Achieving the 140-knot target may require further aerodynamic refinement, with investigation of a tandem seating configuration to reduce frontal area recommended. The study provides an initial drag assessment of retractable wingtip pontoons and demonstrates the potential of sub-scale flight testing for comparative drag analysis – two novel contributions to the field.
Keywords:
amphibious aircraft
; light sport aircraft
; aerodynamic drag
; retractable pontoon
; instrumented thrust
; sub-scale testing
; hull step fairing
1. Introduction
Amphibious aircraft are designed with the unique ability to takeoff and land from runways and water. The convenience, broader range of destinations and improved safety for over-water operations are key appealing factors. Amphibians designed for the light sport aircraft (LSA) category are built primarily for recreation, personal utility and flight training.
LSA aircraft are defined independently by each regulatory authority, with broadly similar limitations among most. Australia’s Civil Aviation Safety Authority (CASA), the European Aviation Safety Authority (EASA), and America’s Federal Aviation Authority (FAA) impose a maximum takeoff weight of 600 kg for landplanes or 650 kg for seaplanes (unless otherwise exempted), seating for no more than two occupants, and a stall speed not exceeding 45 kts [1,2,3]. Under the FAA’s definition in 14 CFR § 1.1, additional restrictions apply, including a maximum level-flight speed of 120 kts and use of a fixed-pitch or ground-adjustable propeller [3]. Aircraft meeting these criteria may be factory-produced and self-certified to industry consensus LSA design standards, rather than undergoing full type certification under regulations such as 14 CFR Part 23 for general aviation aircraft. This concession greatly reduces the workload required to produce new, innovative aircraft compared to the traditional pathways.
In July 2023, the FAA published a formal Notice of Proposed Rulemaking for the Modernization of Special Airworthiness Certification (MOSAIC), proposing new definitions for LSA [4]. After a period of stakeholder consultation, the final regulatory changes were made in July 2025 [3]. The key changes to LSA definitions include the removal of the weight limits, up to 4 seat occupancy, a stall speed of 61kts CAS, a maximum sea level speed of 250kts and the allowance of in-flight adjustable propellers [5]. These expanded definitions allow manufacturers to produce more capable aircraft with increased performance, additional safety features, and more sophisticated systems. The weight increase specifically makes way for greater structural safety margins, larger powerplants and the easier incorporation of ballistic recovery parachutes, to name a few. While this currently only applies to the US market, other national aviation authorities are expected to re-evaluate their definitions of LSA in their own context. For example, CASA have announced that they will "review these changes for the Australia environment, develop policies and work with stakeholders to implement them," with an expected end date of quarter four of 2028 [6].
Existing amphibious LSA designs, built to the traditional pre-MOSAIC standards, were researched to establish a baseline for performance in this class of aircraft. Table 1 summarises the key specifications of all production amphibious LSA aircraft found by the authors, as reported by the manufacturers. The current range of cruise speeds is relatively limited, with the highest being 120 kts for the Super Petrel XP. These data highlight the performance constraints of conventional amphibious LSA designs and indicate potential for improvement under expanded regulatory limits.
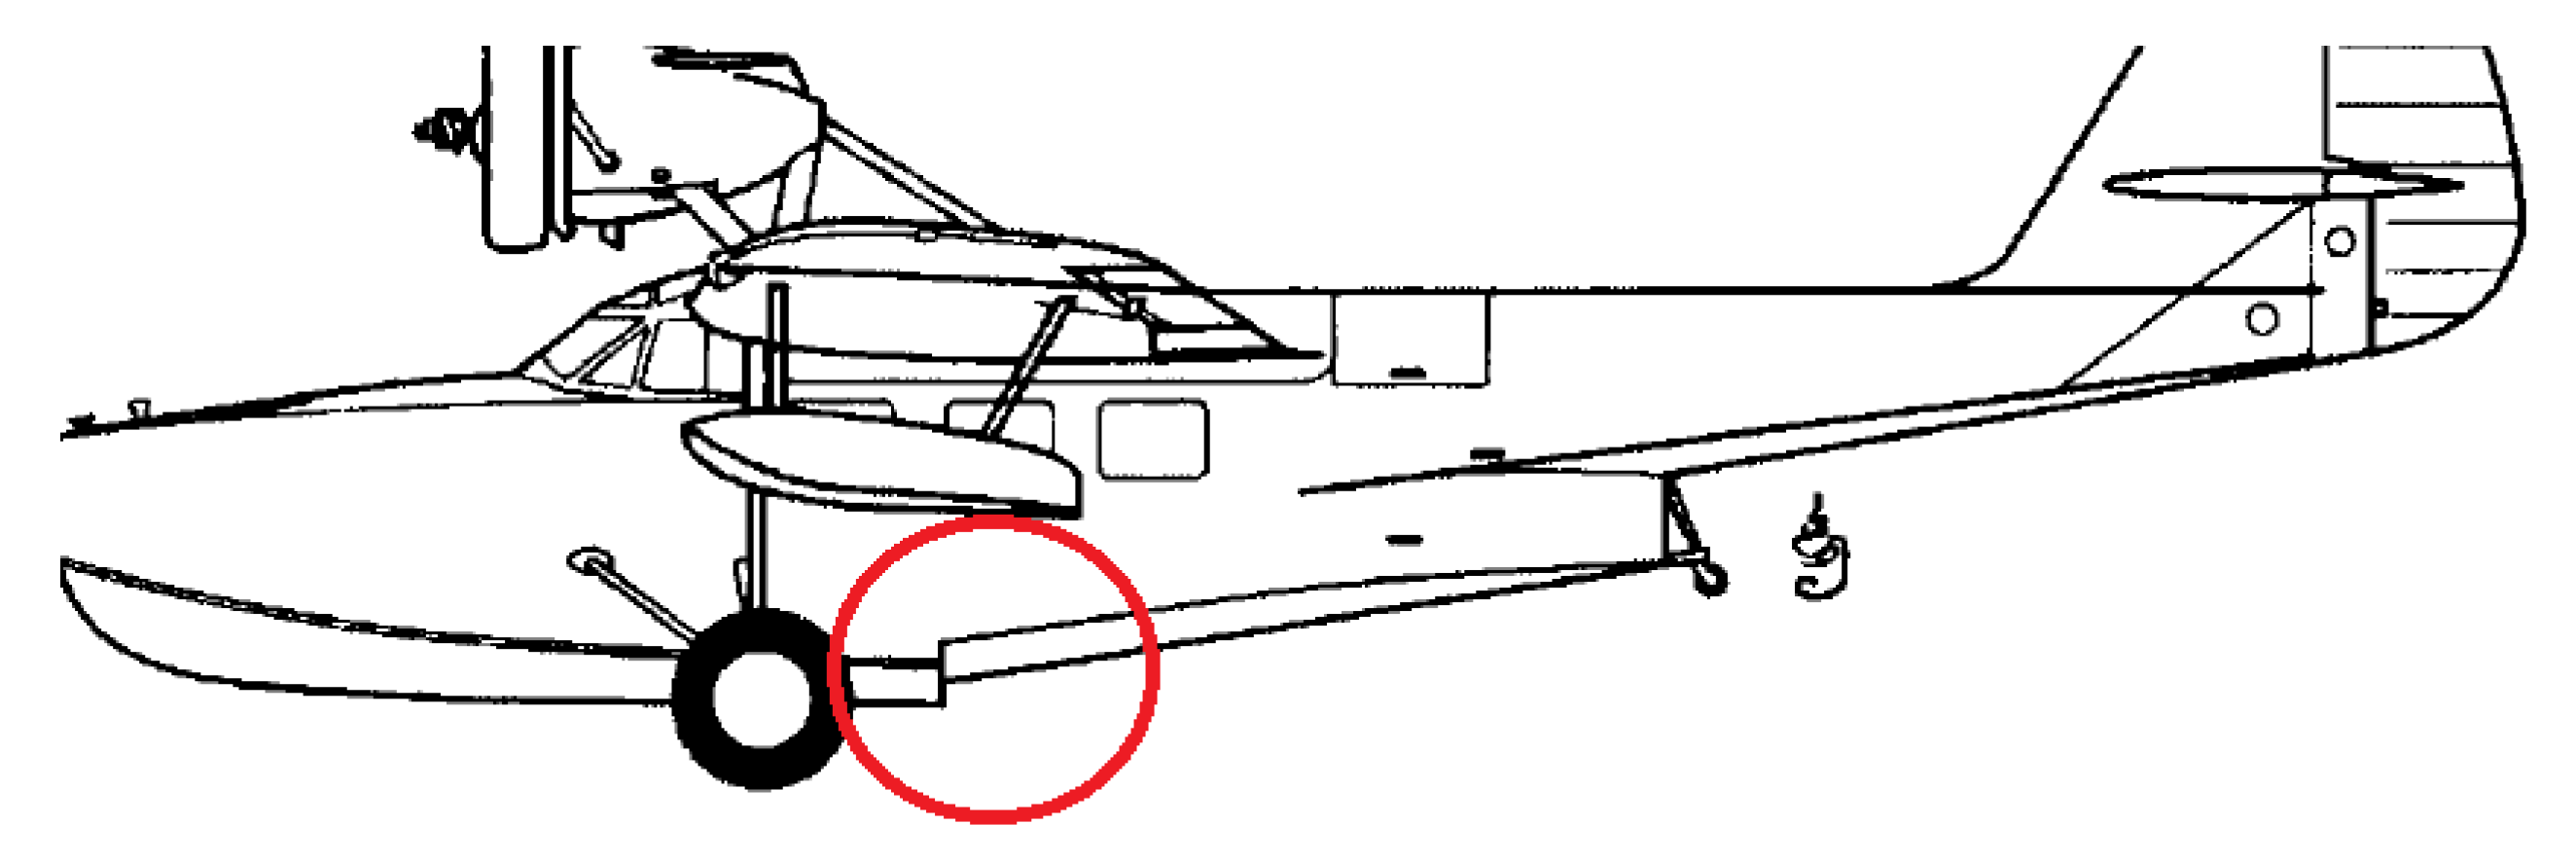
Performance of amphibious aircraft is inherently constrained by their dual-function requirements. In addition to standard aerodynamic considerations for safe and efficient flight, amphibians must also have sufficient buoyancy and both lateral and longitudinal stability on water. These factors contribute to increased drag and limit achievable cruise speeds, and hence must be carefully designed to minimise their impact on high-performance amphibious aircraft concepts. Altavia Aerospace propose the design of a new amphibious LSA featuring a retractable hull step fairing and wing-mounted pontoons that retract to the wingtips, constructed with a carbon-fibre cantilever wing and powered by a BRP Rotax 916iS engine. Altavia Aerospace seek a target cruise speed of 140kts or greater.
In this report, the effectiveness of these drag reduction features are assessed to determine the feasibility of the Altavia Aerospace concept. A sub-scale flying model aircraft with representative proportions was built with the proposed design features. Speed and thrust data were recorded for the sub-scale aircraft using an onboard GPS and load-cell data acquisition system to quantify the drag coefficient between configurations. While sub-scale flight testing is an established research method for evaluating stability, control and stall behaviour, no cases have been found where it has been used for direct drag measurement.
The increasing miniaturisation of electronics and data-recording systems has made sub-scale flight testing a practical tool for aerodynamic research. The minute size of modern sensors, GPS modules, and low-cost microcontrollers allows accurate measurement of speed, thrust, and attitude on small aircraft, enabling aerodynamic data to be collected in free flight. This approach may potentially offer a lower-cost alternative to conventional wind tunnel testing or computational fluid dynamics (CFD) analysis. It likely also provides the opportunity to evaluate multiple aerodynamic characteristics, such as drag, stability, and control response. Assessing the effectiveness of this sub-scale method forms a key research question in this project in its own right, and represents a novel contribution to the field of aerodynamics. If deemed feasible, this method offers a valuable option for developers or research groups with limited resources or without access to appropriate wind tunnel facilities.
2. Literature Review
2.1. Hull Design
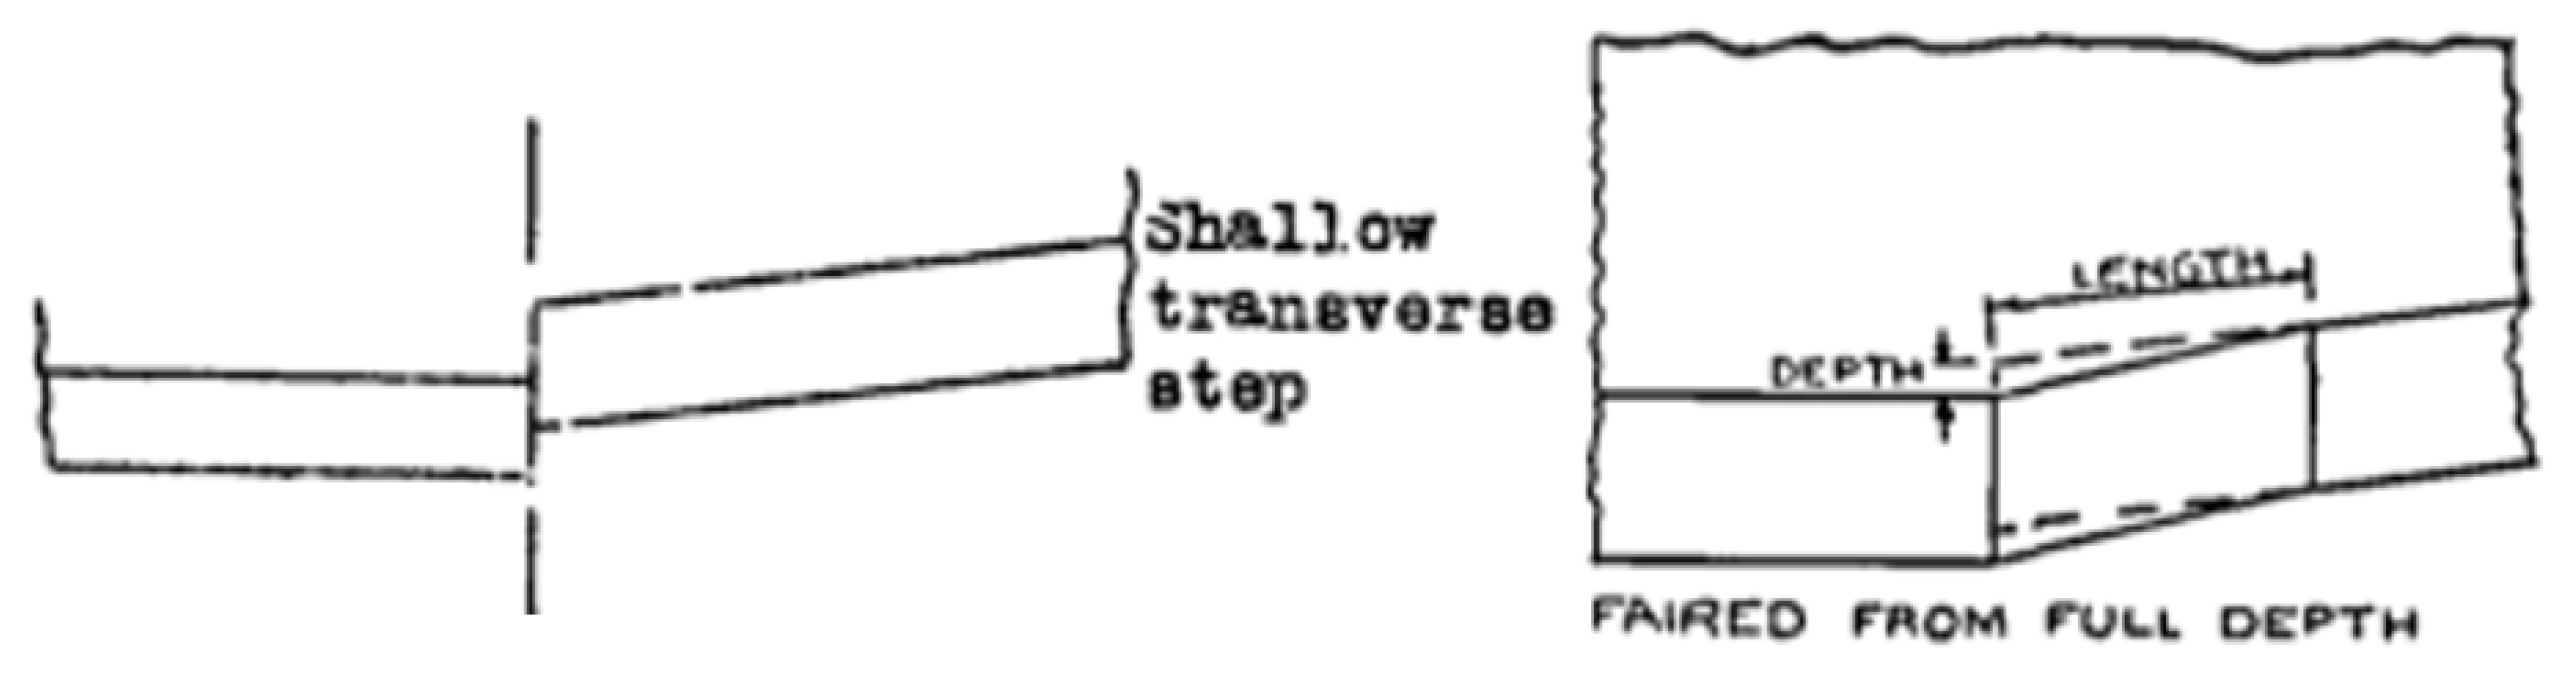
Amphibious aircraft hulls are widely studied for aerodynamic drag characterisation and refinement [15,16,17,18,19,20,21,22]. The hull must have sufficient volume to provide buoyancy, increasing both the frontal and wetted areas over conventional aircraft. A hull step is also required to minimise skin friction drag and suction and allow the aircraft to hydroplane and then, usually with relatively large wing set angles, to rotate slightly in water to a suitable takeoff attitude.
Figure 1.
A typicalhull step (adapted from [23]).
Figure 1.
A typicalhull step (adapted from [23]).
These additional requirements for water takeoff cause the hull drag to contribute more significantly to profile drag for amphibious aircraft, with a study by [24] finding hull drag accounting for up to 34% of the total profile drag. According to [15], the hull step is one of the main drivers of drag for seaplane hulls. That study focused on the drag produced by the hull step and the savings possible through variations in step depth, shape, and the addition of fairings for a 9-seat electric seaplane concept design. He found that the inclusion of fairings alone could reduce the hull drag by up to 15% through wind tunnel and CFD tests. Further, he noted that the second biggest improvement could be made through wing incidence angle optimisation, with a total of 20% reduction in hull drag possible by these two factors.
Figure 2.
Hull step fairing diagram (adapted from [15]).
Figure 2.
Hull step fairing diagram (adapted from [15]).
A wind tunnel report by [16] compared several modifications to flying-boat hulls and the overall drag to landplanes. For the length-to-beam (or max hull width) ratio of nine that they tested, more typical of large flying boats, they found an 11% reduction in drag by fairing the hull step by a length nine times the step depth. It was determined that fairing the step further provided no additional benefit. The overall drag for the flying-boat hull was compared to a standard transport-category fuselage shape, and found to have 85% higher drag with no fairings, highlighting the relatively poor performance of flying boats compared to landplanes. It was further noted that the aerodynamic lateral and longitudinal stability were generally the same between faired and standard hulls. Another wind tunnel study by [25] determined a drag coefficient of 0.21 relative to the step area (step width x depth), noting the drag increases were proportional to step depth. They recorded these hull drag data across a range of pitch angles, highlighting the importance of optimising the wing incidence angle in agreement with [15].
While there is an abundance of literature on the hull drag of amphibious aircraft and seaplanes, and significant studies on hull step fairings, these fairings are yet to be implemented on an amphibious aircraft or seaplane. A US patent was granted in September 2000 and expired in 2018 for a retractable hull step fairing hinged at the rear that extends to the edge of the step after takeoff [26]. The same basic concept is used for the design of the hull step fairing for this research, but with a different arrangement for the sides. The mechanism described in the patent includes side panels that hinge via a piano-type hinge to the sides of the extendable panel, while a simpler approach is taken for the side panels in this project. The design of the hull step fairing is described in Section 3.6 of this project.
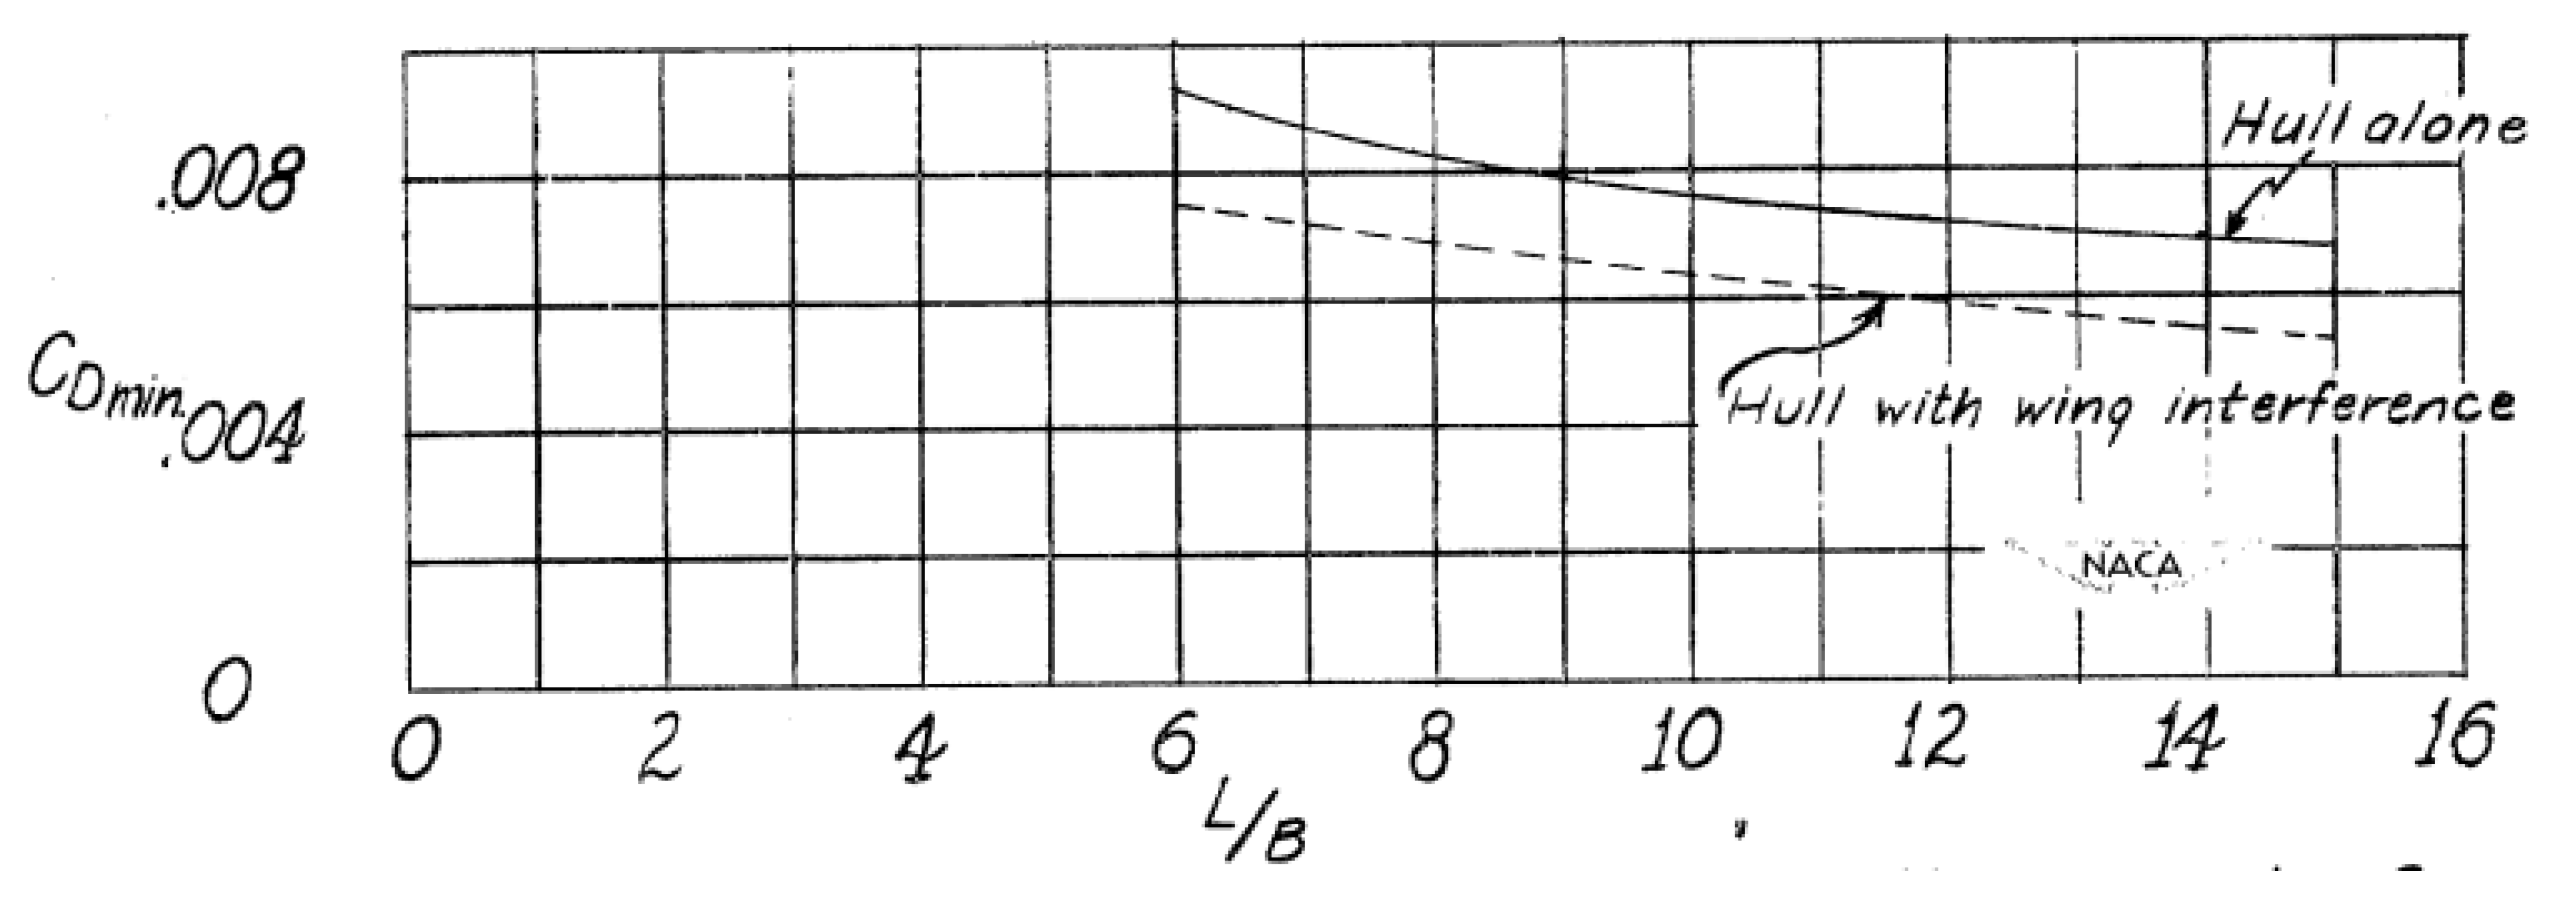
Another significant factor in hull drag is the length-to-beam ratio, which closely corresponds to the slenderness ratio typical of landplane fuselages [20,21,22,27]. Figure 3 graphically shows the effect of length-to-beam ratio on a hull’s minimum drag. A major performance increase may be gained if a tandem seating layout is adopted for an amphibious LSA, reducing the required hull width. This approach may also reduce the structural weight as well by reducing the width where water impact loads act during landing, which, according to [28], significantly impacts the hull weight. While the vast majority of 2-seat LSA aircraft adopt side-by-side seating for greater passenger comfort and visibility, Altavia Aerospace is open to the tandem layout if required. This study will focus on the side-by-side seating configuration, noting the tandem layout as a possibility if still required to meet the cruise speed target.
Figure 3.
Wind tunnel test results on effect of length-to-beam ratio (adapted from [20]).
Figure 3.
Wind tunnel test results on effect of length-to-beam ratio (adapted from [20]).
2.2. Wingtip Pontoons
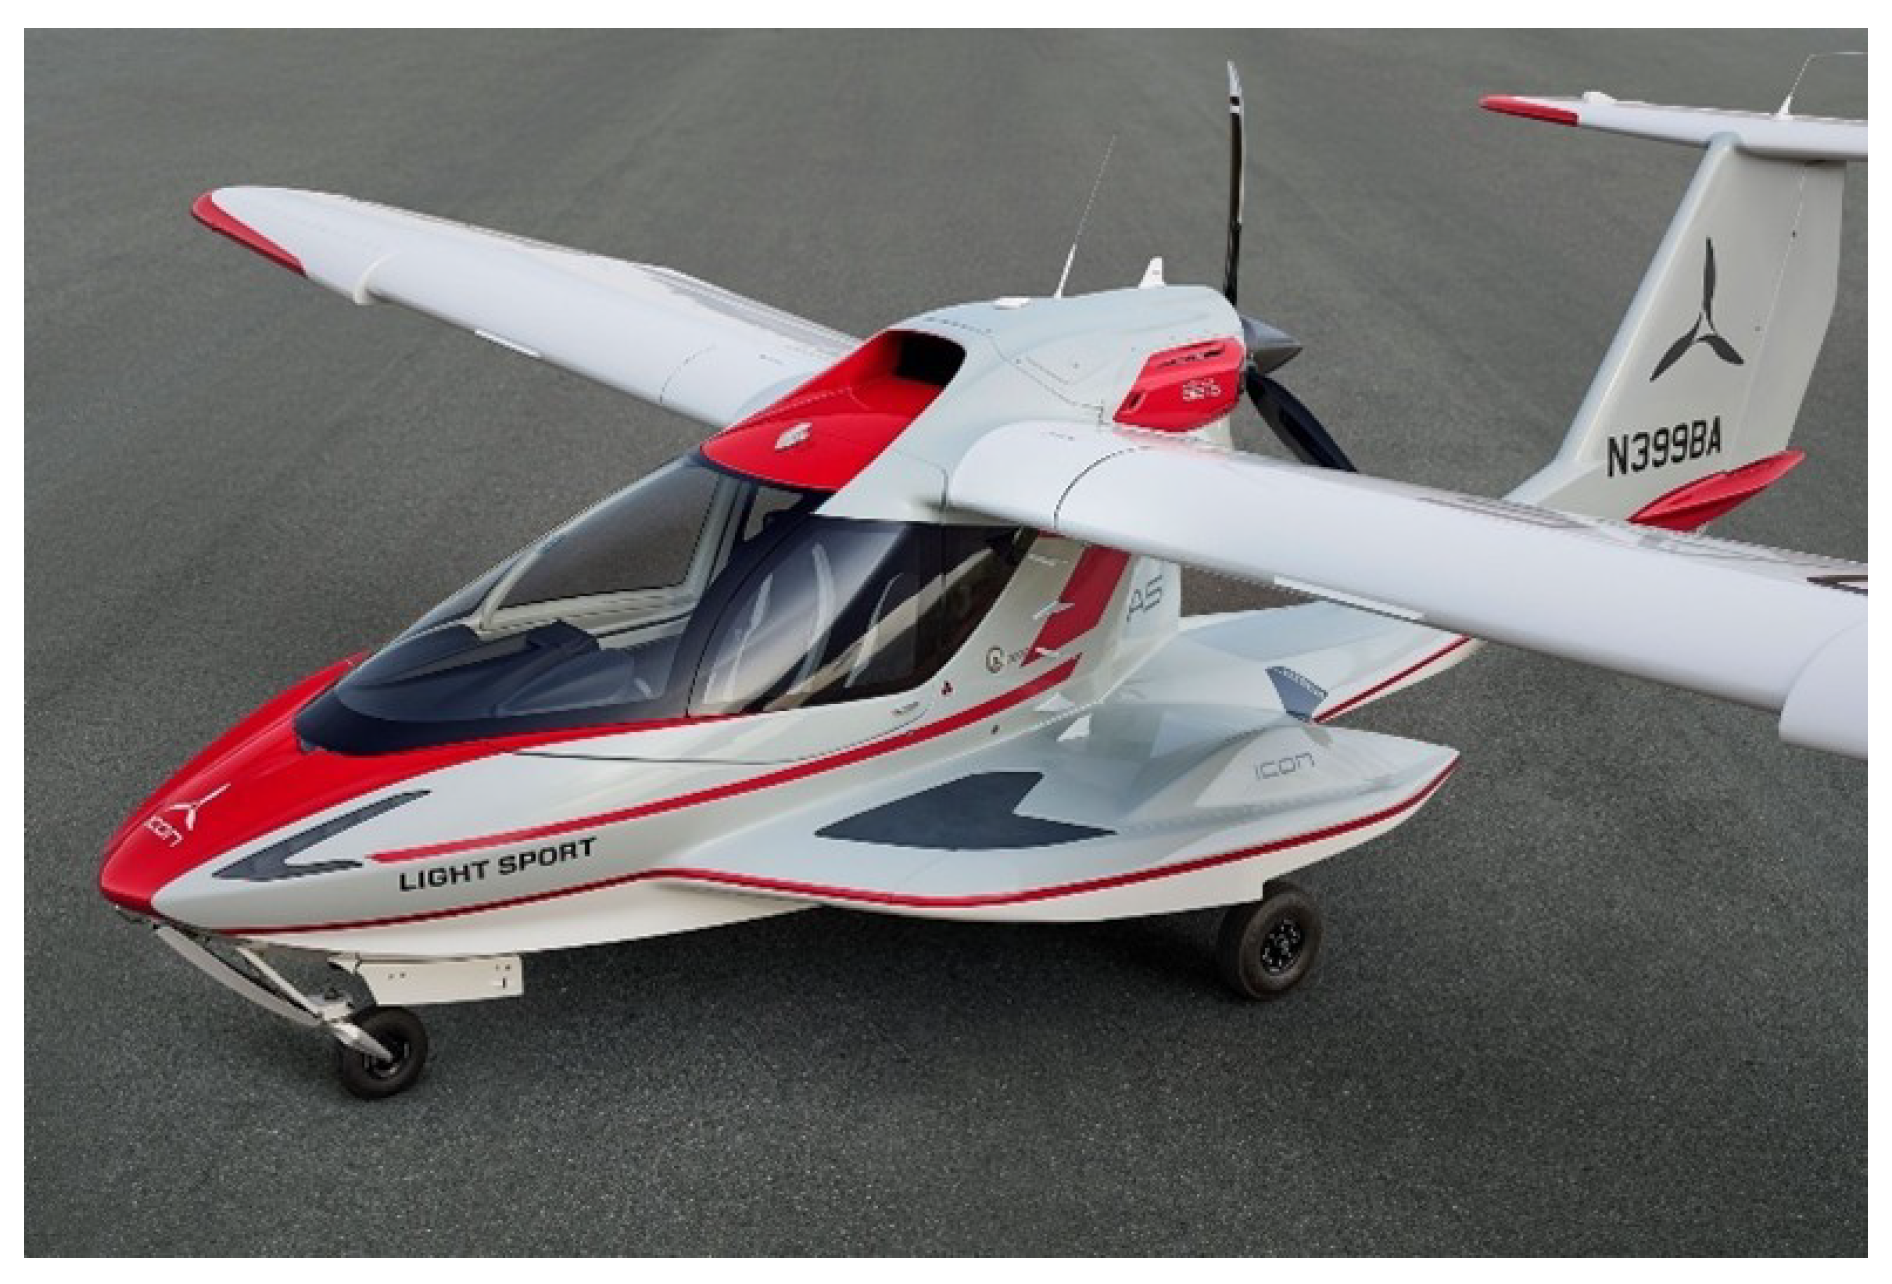
In addition to the high drag caused by the hull’s large size, shape, and step, amphibious aircraft must also provide means for lateral stability when stationary or moving slowly on the water [29]. For the amphibious aircraft presented in Table 1, this is most commonly achieved using pontoons mounted from the outboard wing via struts. Some designs, such as the Icon A5 pictured in Figure 4, use pontoons integrated with the fuselage. Mounting the pontoons on the fuselage has the added benefit of providing a platform for recreational use on the water. On the downside, since the same lateral stability moment is required from a shorter distance from the aircraft centreline, larger buoyancy forces must be provided by the pontoon. This feature increases weight, as well as drag due to frontal area, wetted area, and interference effects.
Figure 4.
Icon A5 with fuselage-mounted pontoons (adapted from [8]).
Figure 4.
Icon A5 with fuselage-mounted pontoons (adapted from [8]).
Wingtip pontoons may be smaller and lighter, but still produce additional drag not incurred by landplanes. Several aircraft have been produced with retractable wingtip pontoons. Examples include the Consolidated PBY Catalina, Ellison-Mahon Gweduck, and Saro SR.A.1, while an aftermarket modification for retractable pontoons was produced by McKinnon Enterprises for the Grumman Goose [30,31,32,33]. The Catalina, Gweduck, and Goose pontoons retract to the wingtips, while the SR.A.1’s pontoons form a blister shape under the outboard wing.
Figure 5.
Retractable wingtip mechanism of the Catalina (adapted from [31]).
Figure 5.
Retractable wingtip mechanism of the Catalina (adapted from [31]).
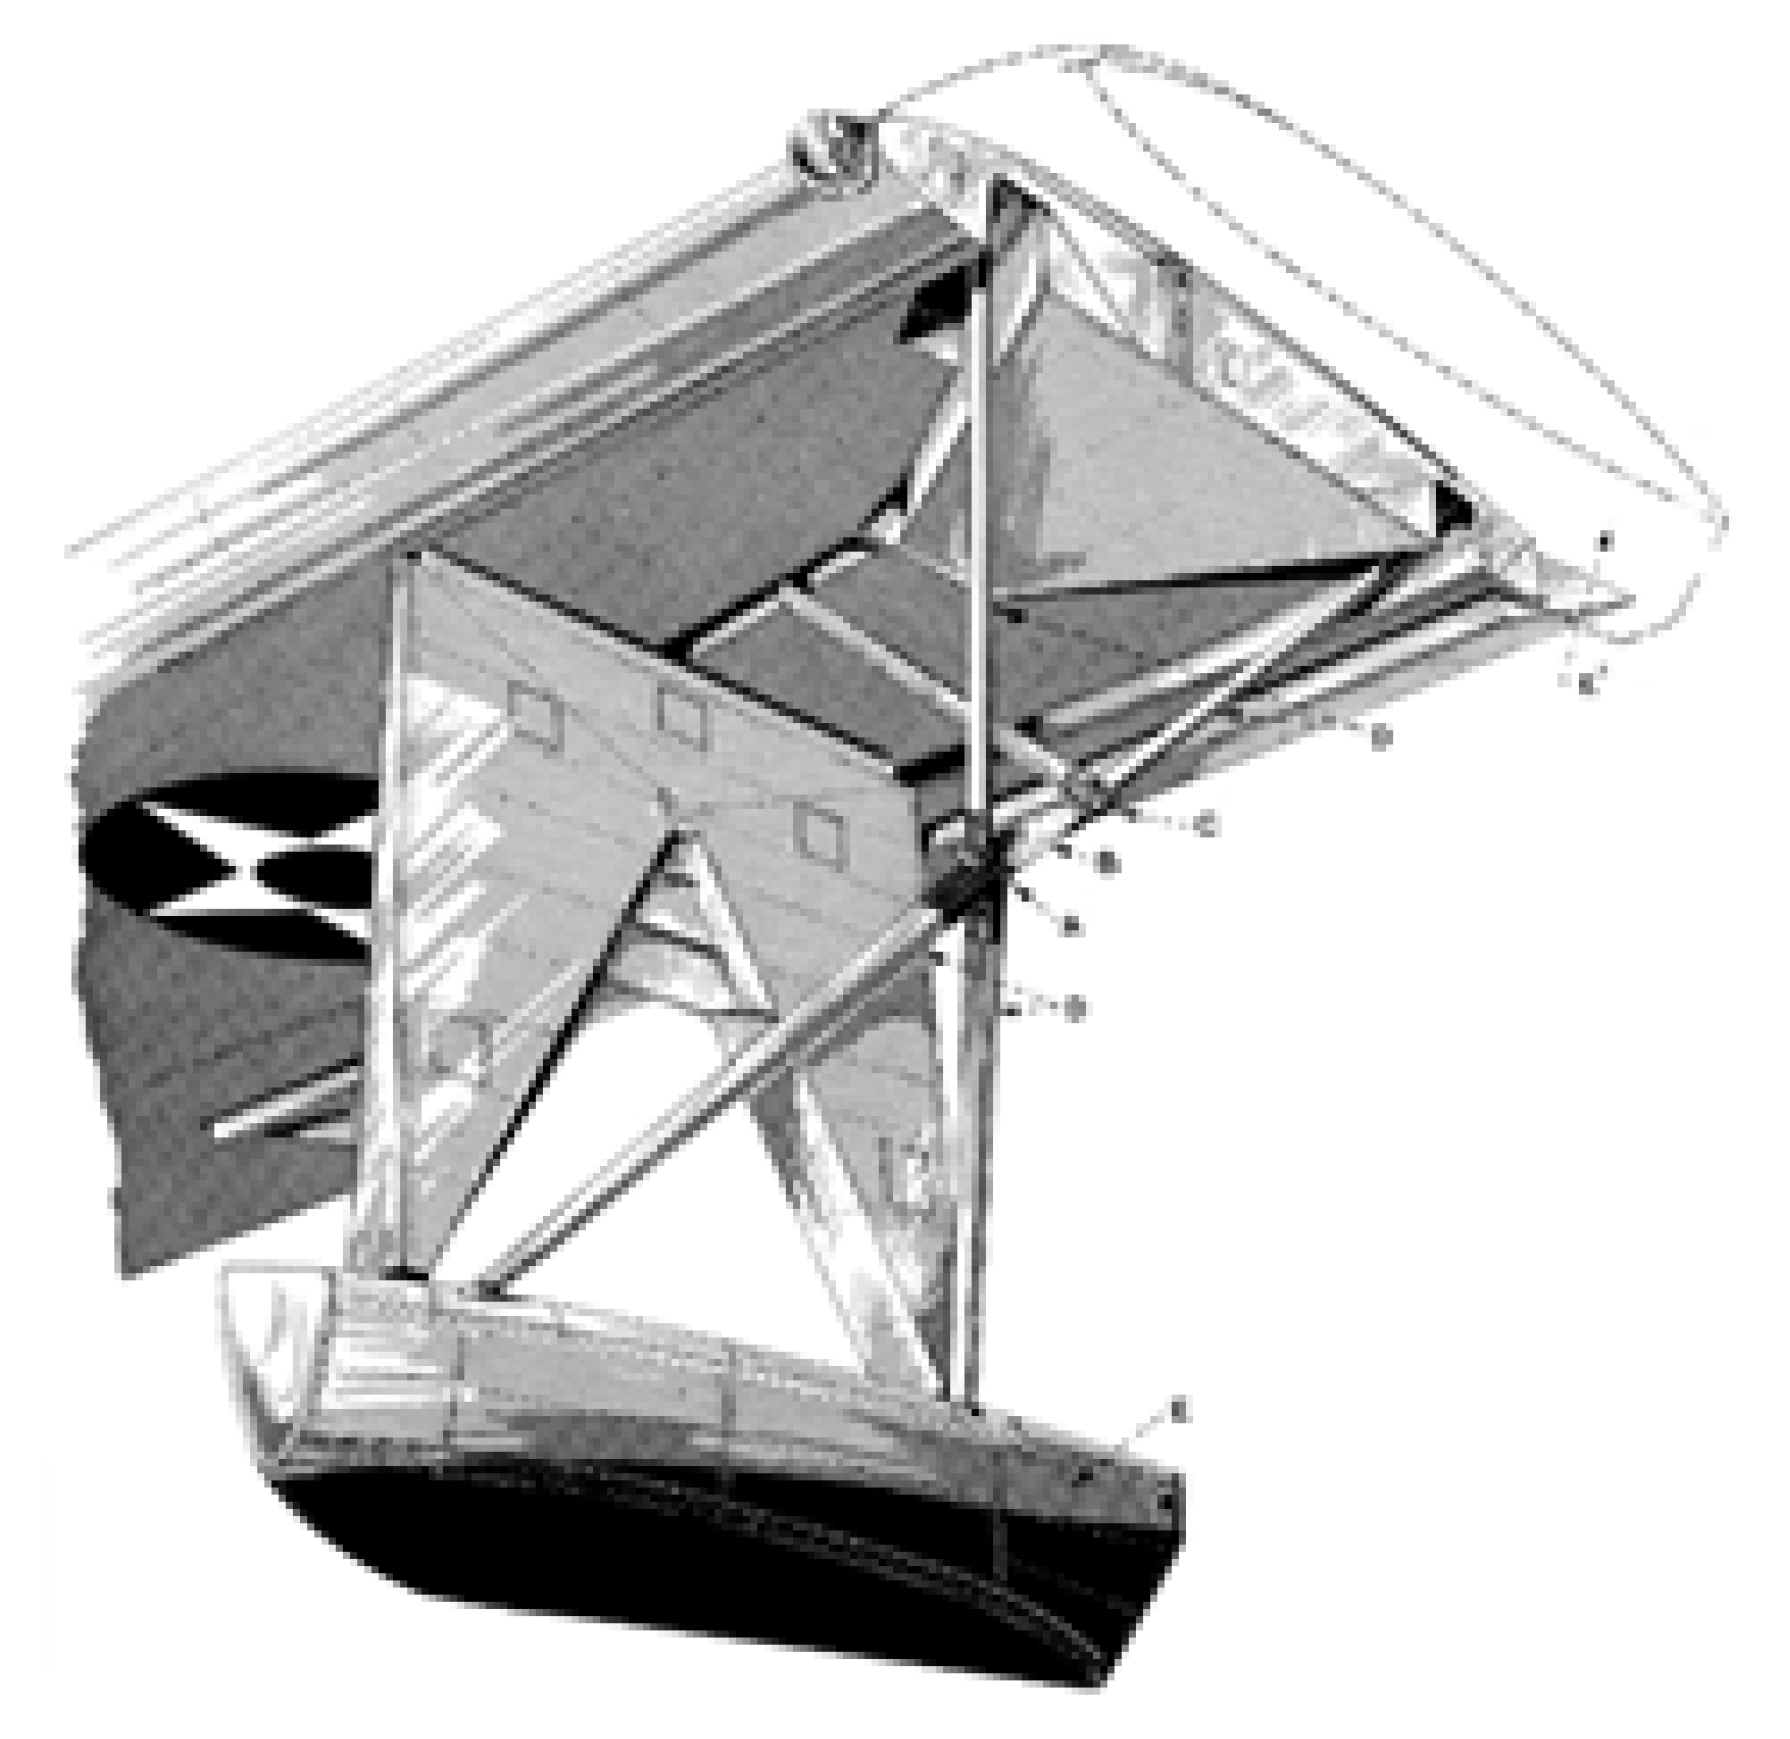
Figure 6.
Retractable wingtip mechanism of the SR.A1 (adapted from [30]).
Figure 6.
Retractable wingtip mechanism of the SR.A1 (adapted from [30]).
An article by Key.Aero magazine states that the Grumman Goose retractable wingtip modification allowed increased payload and single-engine performance, otherwise no other sources were found characterising the aerodynamic effects of retractable wingtip floats [32]. However, these systems are comparable in form when retracted to wingtip fuel tanks on the existing amphibians surveyed. In this configuration, the fuel tanks are noted to act as endplates, increasing the effective aspect ratio of the wing [34,35]. A wind tunnel study by [36] determined a 6–8% increase in lift slope with wingtips on a swept wing operating at Reynolds and Mach numbers typical of light general aviation aircraft, with similar results obtained by [37,38,39]. Comparative flight tests were conducted in [40] with two E33A Bonanza aircraft, one fitted with tip tanks and one without. They found that at higher speeds, the added parasite and interference drag decreased performance. However, below 157 KTAS and 62% power, the increase in Oswald efficiency factor outweighed the parasite drag increase, and the aircraft performance was superior with tip tanks. The Grumman Goose’s claimed payload and single-engine performance improvements stated in [32] following the installation of retractable pontoons are consistent with these literature findings.
Figure 7.
Tip tanks (left) and plain tips (right) on the E33A Bonanza (adapted from [40]).
Figure 7.
Tip tanks (left) and plain tips (right) on the E33A Bonanza (adapted from [40]).
Additional benefits noted to wingtip tanks are that the addition of weight outboard of the spanwise centre-of-lift alleviates some bending stress on the wing. In the case of the Bonanza studied in [40], the aircraft is allowed to operate at a higher gross weight due to this effect. While the baseline case of fixed-wing pontoons also has this effect, shifting their mass outward further to the wingtip provides a small advantage in this manner.
Given that pontoons are essential on amphibious aircraft, this research indicates that positioning them at the wingtips in cruise could not only minimise their drag penalty but even enhance performance in some flight regimes. While the Saro SR.A1 flying boat does have retractable pontoons that have been academically studied for their drag savings, these retract into a pod beneath the wing, unlike the proposed wingtip location. The investigation of wingtip-retractable pontoons for drag reduction, as presented in this paper, represents a valuable contribution to the field.
2.3. Sub-Scale Flight Testing
Several options are available to predict drag performance for an LSA-class amphibious aircraft. Full-aircraft CFD predicts aerodynamic behaviour to the highest fidelity, solving detailed flow around the fuselage, wings, and pontoons. However, full-aircraft CFD is very computationally expensive and usually also requires experimental validation to correct uncertainties and errors, typically via a wind tunnel [41,42]. Lower-order methods, such as the inviscid panel method, capture lift performance relatively well up to moderate angles of attack and can apply viscous corrections to account for skin friction, but these do not model separated flow [43]. Significant portions of hull step and wingtip pontoon drag are expected to arise due to separated flow and interference; hence, the inviscid panel method is not suitable. Wind tunnel testing is a viable method if access to a wind tunnel of reasonable size is available. UNSW Canberra’s wind tunnel has a test section width of 450 mm and a maximum velocity of approximately 40 m/s. A NASA wind tunnel guide in [44] suggests model spans no greater than 0.8 of the test section width, which for UNSW Canberra’s tunnel corresponds to a span of 360mm. Taking the Seamax M22’s aspect ratio of 8.44 [7], typical among amphibious LSA’s, the resulting wind tunnel model chord would be 43mm. These restrictions would result in a maximum chord-based Reynolds number () of
For the full-scale aircraft at a cruise speed of 140 kt (72 m/s), the would approximately be
Unconventional ground-based testing methods have occasionally been used when wind tunnel facilities were unavailable. One notable example is the early work of Burt Rutan in the 1960s-70s, founder of Scaled Composites and designer of more than forty experimental and production aircraft. During the development of his first designs, the canard-layout VariViggen and VariEze, Rutan conducted tests using a model mounted on a ball joint at its centre of gravity, supported by an instrumented arm mounted to his car roof. This configuration enabled assessment of stability and control in the absence of a wind tunnel and well before CFD was available for such applications [45,46]. Although informal and largely qualitative, Rutan’s approach provided sufficient confidence to proceed with full-scale construction of the unconventional aircraft and highlights the potential for simple, low-cost aerodynamic testing methods when conventional facilities are inaccessible or impractical.
Sub-scale flight testing, or SFT, also allows physical testing to be conducted without the size limitations imposed by the wind tunnel. Moderate-sized flying models may be constructed within reasonable time and resource constraints and can be flown at speeds allowing much higher than in a small wind tunnel. The main challenges foreseen with SFT are the uncontrolled environment, difficulty in flying precisely and accuracy of on-board data measurement. These factors are addressed later in this report with controls implemented to minimise their effects. Ultimately, the results will demonstrate the feasibility of SFT for aircraft drag analysis.
SFT is a well-established method in aerospace research, particularly for evaluating aircraft stability, control, and handling qualities [43,48,49,50,51,52,53]. It is widely used when exploring unconventional configurations or complex flow environments, especially post-stall behaviour where computational predictions may fall short or full-scale testing poses unacceptable risk [48,49]. A 1/5th scale Cessna 182 is used for upset and post-stall flight modelling in [49], highlighting the utility in test conditions hazardous for manned aircraft. Another study investigated SFT dynamic response data of an 8.8% and 17.6% scale Cessna Citation Mustang II and compared it to full-scale flight test results, finding 89% and 97% degree of similitude, respectively, for short-period motion [54]. While these papers indicate the accepted use and highlight the utility of SFT, no research was found using SFT for drag study. The lack of such research may be due to the aforementioned high costs in previous decades, difficulties in recording accurate drag measurement in flight, or the inadequate dynamic similitude, discussed further in the next section.
Figure 9.
NASA AirSTAR 5.5%-scale loss of control research aircraft (adpated from [53]).
Figure 9.
NASA AirSTAR 5.5%-scale loss of control research aircraft (adpated from [53]).
2.4. Scale Effects on Drag and Boundary Layer Behaviour
Full-scale aircraft operate under different Reynolds number regimes compared to sub-scale wind tunnel or free-flight models, resulting in differences in the drag they experience. These differences result in variations in the drag coefficient between scales. One of the primary causes is the dependence of skin friction drag on , as shown in the flat plate drag relations developed from the Blasius and 1/7th power law for laminar and turbulent boundary layers, respectively [55,56]. For a given boundary layer type, a lower produces a higher skin friction drag coefficient.
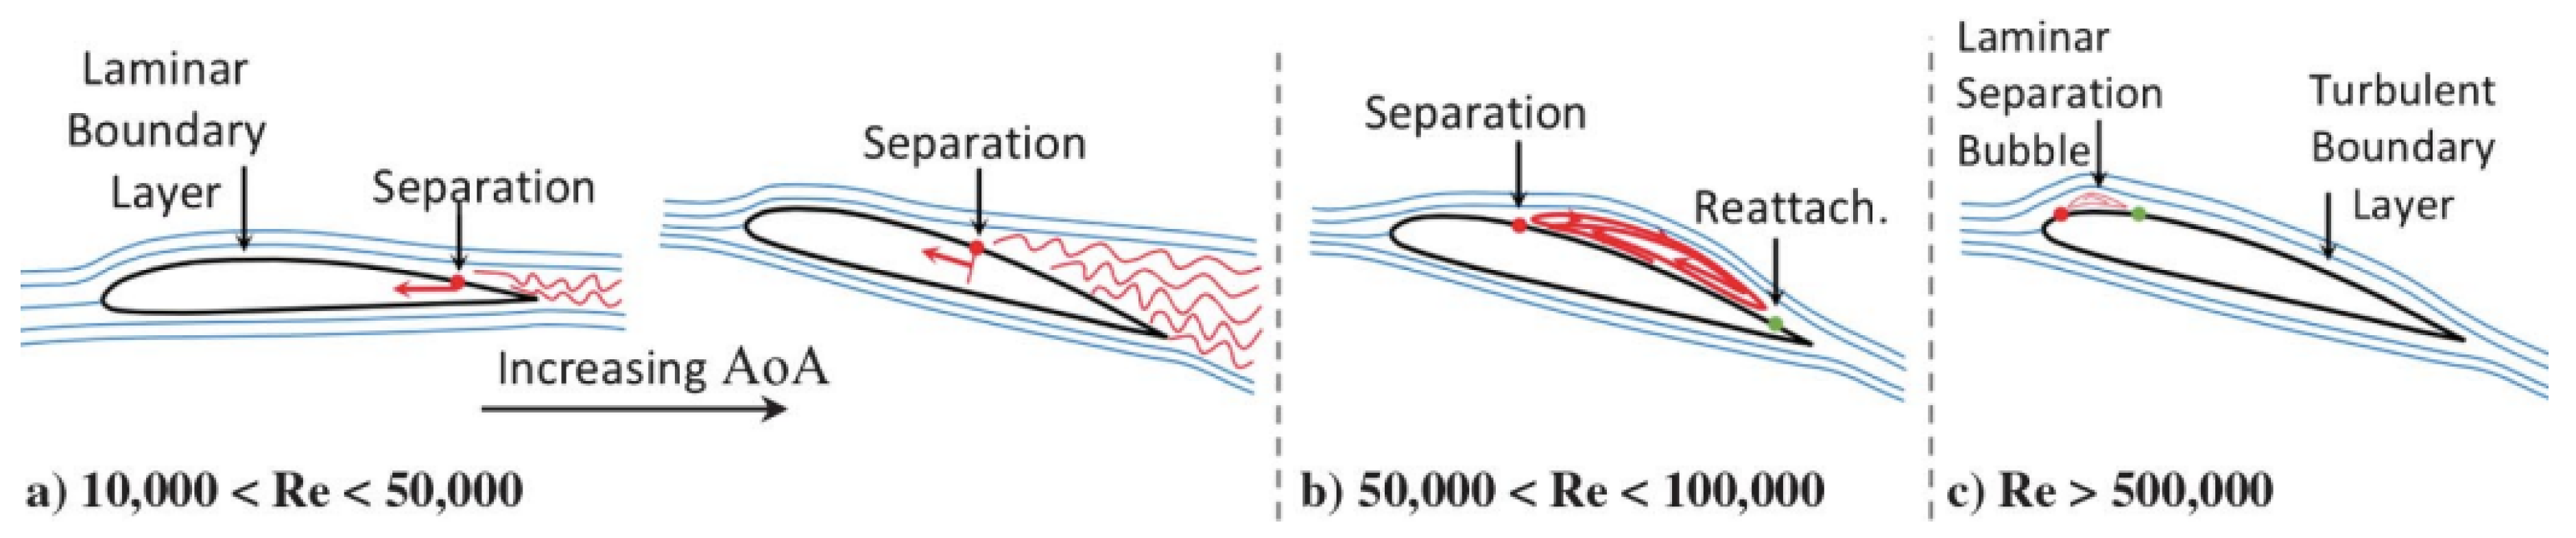
Another important scale effect arises from differences in boundary layer type. A general rule of thumb, particularly for flat plates, is that laminar-turbulent transition typically occurs at a Reynolds number based on the distance from the leading edge of approximately [55]. Hence, a full-scale aircraft often operates with a predominantly turbulent boundary layer, whereas a smaller-scale model may experience a greater extent of laminar flow.
As stated in [57], the greater extent of laminar flow over an airfoil at low reduces its ability to overcome adverse pressure gradients, making it more prone to laminar separation. This characteristic increases drag by effectively altering the freestream path and reduces lift by lowering the pressure reduction. A turbulent boundary layer, on the other hand, has higher momentum close to the wall due to its “fuller” velocity profile, allowing it to resist a significantly stronger adverse pressure gradient without separating [58]. In comparison, if a laminar boundary layer is maintained at high , it also has a greater capacity to withstand an adverse pressure gradient compared to a low laminar boundary layer (albeit less than if it were turbulent).
It is further noted in [58] that boundary layer variation with is significant below , but becomes relatively consistent at higher values.
Figure 10.
Typical variation in boundary layer type with Reynolds number (adapted from [58]).
Figure 10.
Typical variation in boundary layer type with Reynolds number (adapted from [58]).
The sub-scale flight testing conducted in this work operated at a relatively high of approximately as calculated in Equation (4) from the environmental conditions present on test day [59,60]. This scaling places it above the 500,000 Reynolds number regime whereby boundary-layer behaviour is expected to be largely consistent with full-scale conditions. Trip strips were also applied to the model surfaces, following the approach used in previous wind-tunnel studies referred to earlier [15,20,21]. Trip strips force the boundary layer to transition from laminar to turbulent, where the full-scale aircraft naturally would, further enhancing the aerodynamic similarity.
Despite the relatively high experimental Reynolds number and use of trip strips, the skin friction coefficients are still Reynolds-dependent and thus the overall drag coefficient is not directly transferable from model to full scale. To compare drag results to full scale, this report will assume that a relative drag saving amount on the sub-scale aircraft will correspond to the same relative difference on the full-scale. Given the high test and use of trip strips, this is a reasonable assumption and is used in the previously mentioned wind tunnel reports [15,20,21].
3. Method
3.1. Scope
This study investigated the performance potential of Altavia Aerospace’s proposed amphibious LSA concept, which incorporates retractable wingtip pontoons and a retractable hull step fairing to meet a target cruise speed of 140kts. This work examined in parallel the feasibility of SFT for drag measurement. To achieve these objectives, the authors designed and constructed a representative 1/5th scale amphibious aircraft model, incorporating the drag reduction features proposed by Altavia Aerospace. A custom data acquisition (DAQ) system was designed to record flight data to quantify drag. Flight tests were conducted and Python-based data analysis scripts were written to extract flight test data from which drag values were estimated. The results were compared with published literature and empirical estimations to evaluate both the performance of the Altavia Aerospace concept and the validity of SFT as a new method for aircraft drag analysis.
The scope of this study did not include experimental validation against wind-tunnel or CFD data due to time and resource constraints. The analysis was further limited to flight at full power, with drag derived from estimated propulsive power rather than direct force measurement due to equipment difficulties. Broader characteristics such as stability, control, and hydrodynamic performance were beyond the intended scope of this investigation.
3.2. Method Selection and Rationale
Alternative methods such as CFD and wind-tunnel testing were considered for this investigation. However, CFD was excluded due to the complexity of modelling separated and interference flows around the hull step and pontoons with sufficient fidelity and the requirement to validate results experimentally. Wind tunnel testing was considered but not selected due to limitations in Reynolds number capability and technical issues with the facilities available at UNSW Canberra. Sub-scale, free-flight testing was selected as it enables physical testing at higher and provides the most realistic flow environment. Although subject to greater environmental variability, if controlled suitably, the approach provides a practical, low-cost alternative to CFD or wind tunnels for drag analysis. Hence, assessing its feasibility became a second primary objective of this study.
3.3. Model Aircraft Design
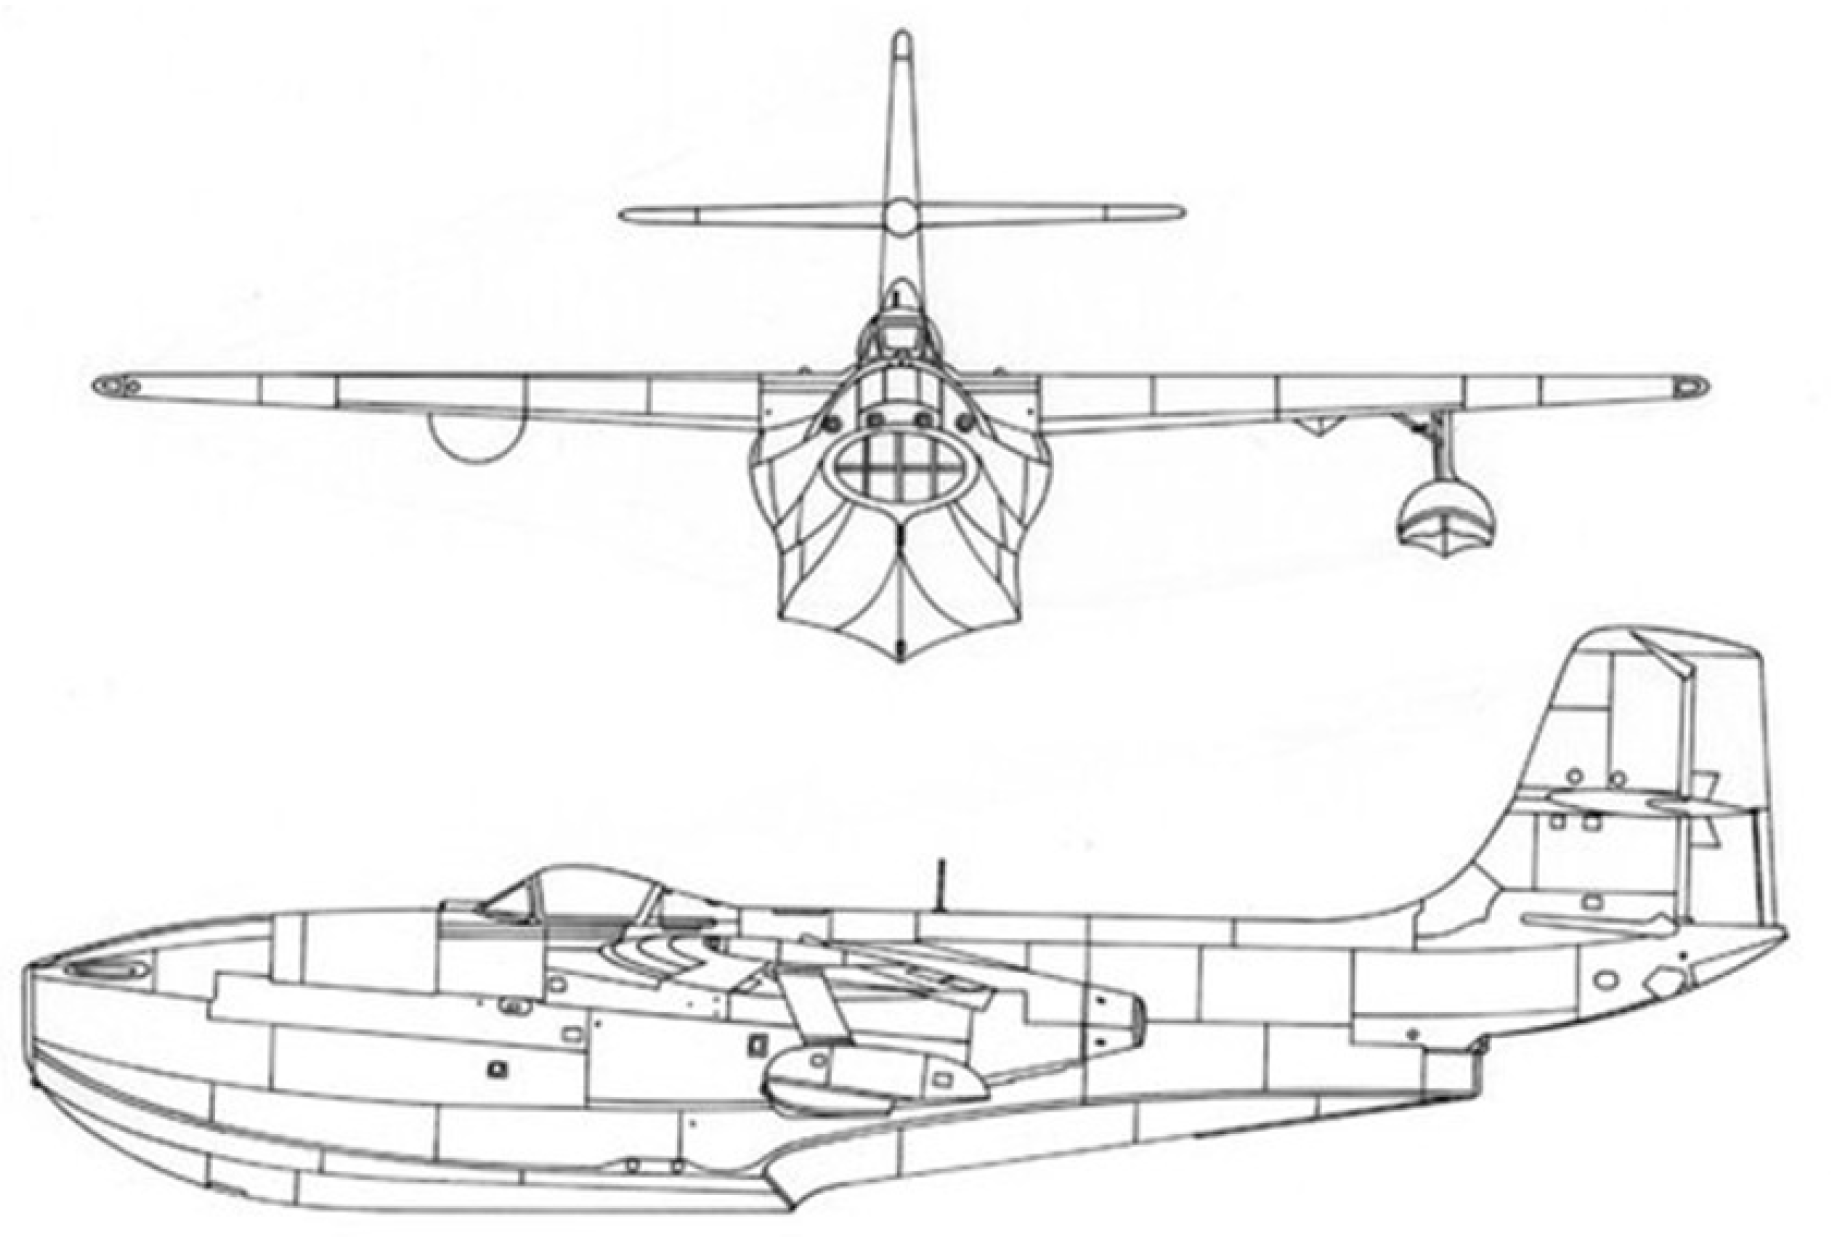
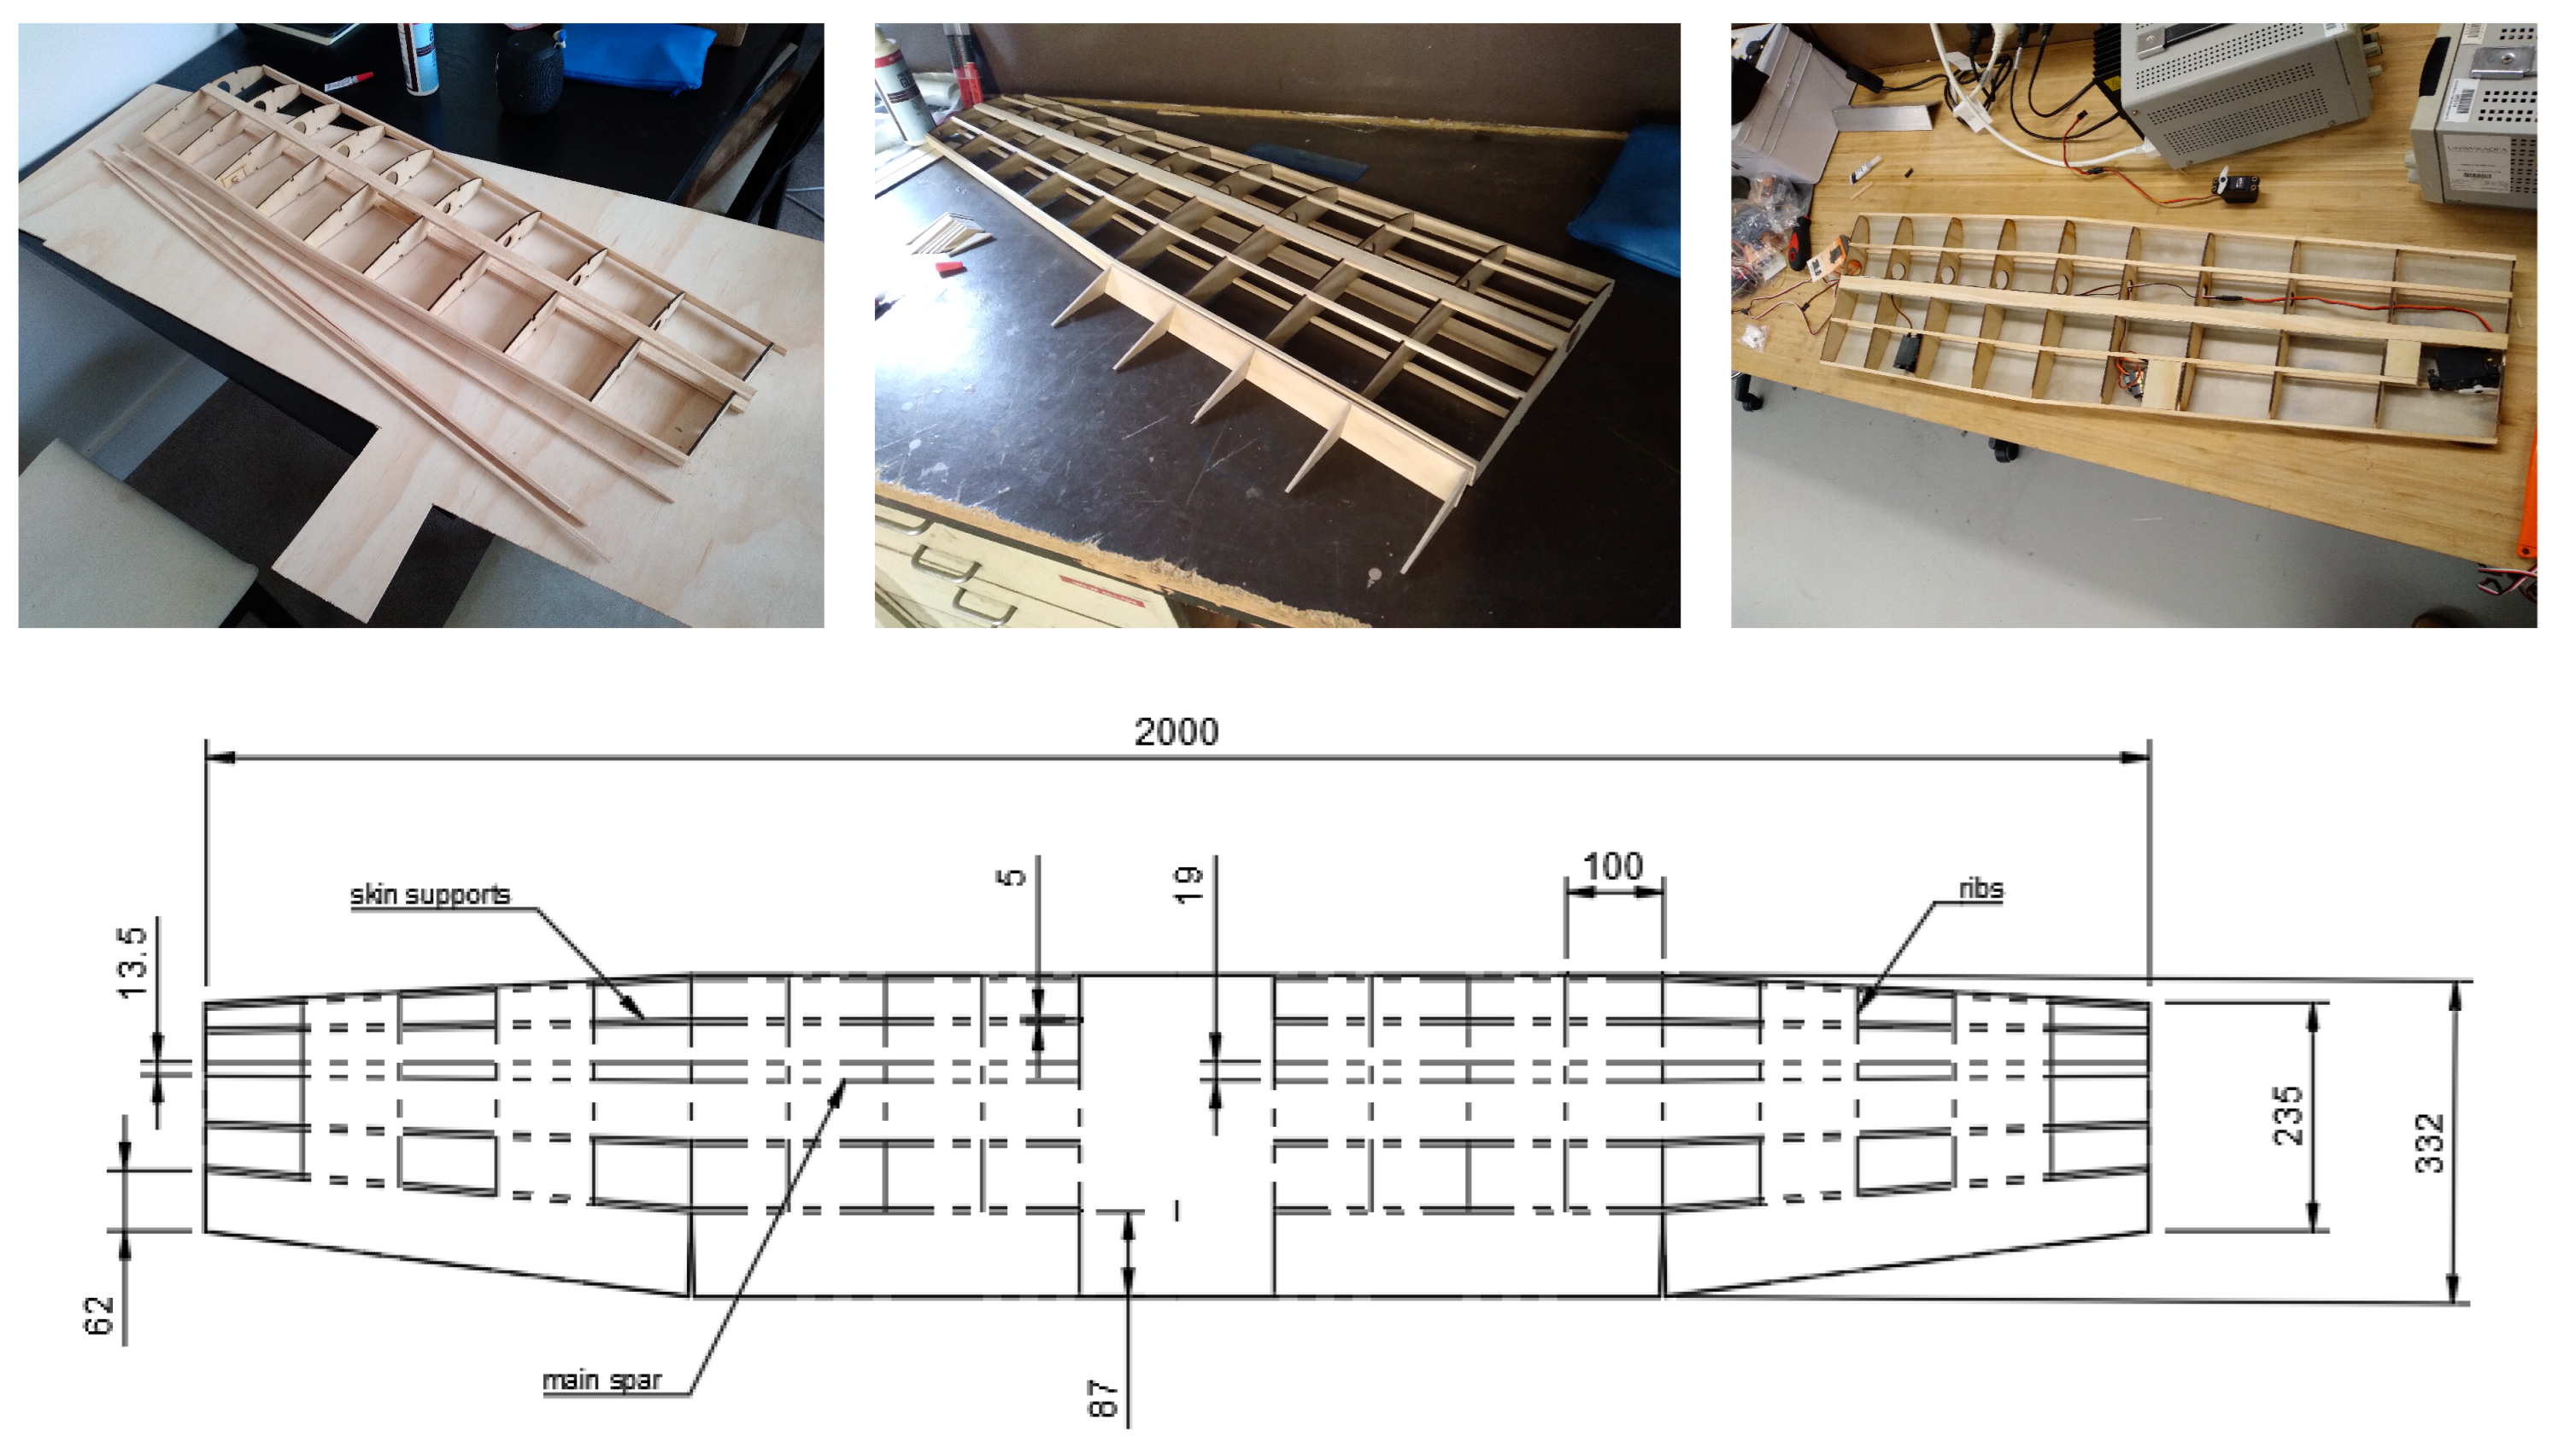
No full-scale aircraft concept design currently exists for this project. A representative model was designed loosely based on key features and dimensions of the amphibious LSA aircraft in Table 1, particularly the SeaMax M22 and Icon A5, as relevant to the Altavia Aerospace concept. For example, the hull dimensions were modelled mainly from the SeaMax M22 since the aircraft concept is to have short, wing-mounted pontoons that do not significantly contribute to the buoyancy, in contrast with the Icon A5’s fuselage-mounted pontoons. A ∼2 m wingspan was selected as a balance between maximal test Reynolds number, construction effort, and cost. Key dimensions for the sub-scale aircraft are outlined in Table 2.
High-level design drawings are shown in Figure 11 and Figure 12 to illustrate the layout and sizing of the aircraft’s proportions.
Key stability and handling parameters were selected to ensure satisfactory flight characteristics. The horizontal tail volume coefficient was set to 0.55, within the range recommended for light aircraft [28]. A static margin of approximately 10% was achieved by estimating the neutral point and adding forward ballast until the model balanced at the required mean geometric chord position. The wing incidence for the Clark Y airfoil was set to 0° for cruise, with a 1° tail incidence to offset the pitching moment and minimise trim drag. The estimated stall speed was 9.7 m/s, used as a pilot reference for take-off and landing expectations.
Construction methods and photos are outlined in Appendix A along with a complete bill of materials for the aircraft, control and DAQ systems.
3.4. Trip Strips
Trip strips were applied to the fuselage and wings in accordance with the discussion in Section 2.4. The trip strips were located at the same relative location on the fuselage and wings as in [15]. On the fuselage a 10mm wide strip of 80-grit sandpaper was applied. The wings used a different boundary layer trip method used by performance-seeking R/C plane hobbyists seeking to eliminate laminar separation bubbles. A guide presented by airfoil designer, Hepperle, in [61] discusses the use of zig-zag, offset-wire and plain straight tape turbulators. The guide contains a graphical method to determine the required thickness for the straight tape variety based on Reynolds number and desired chord-wise position. The wing trip strips were applied in accordance with this advice, with two layers of vinyl tape applied on top of each other on the upper and lower wing surface to meet the desired thickness of 0.2 mm.
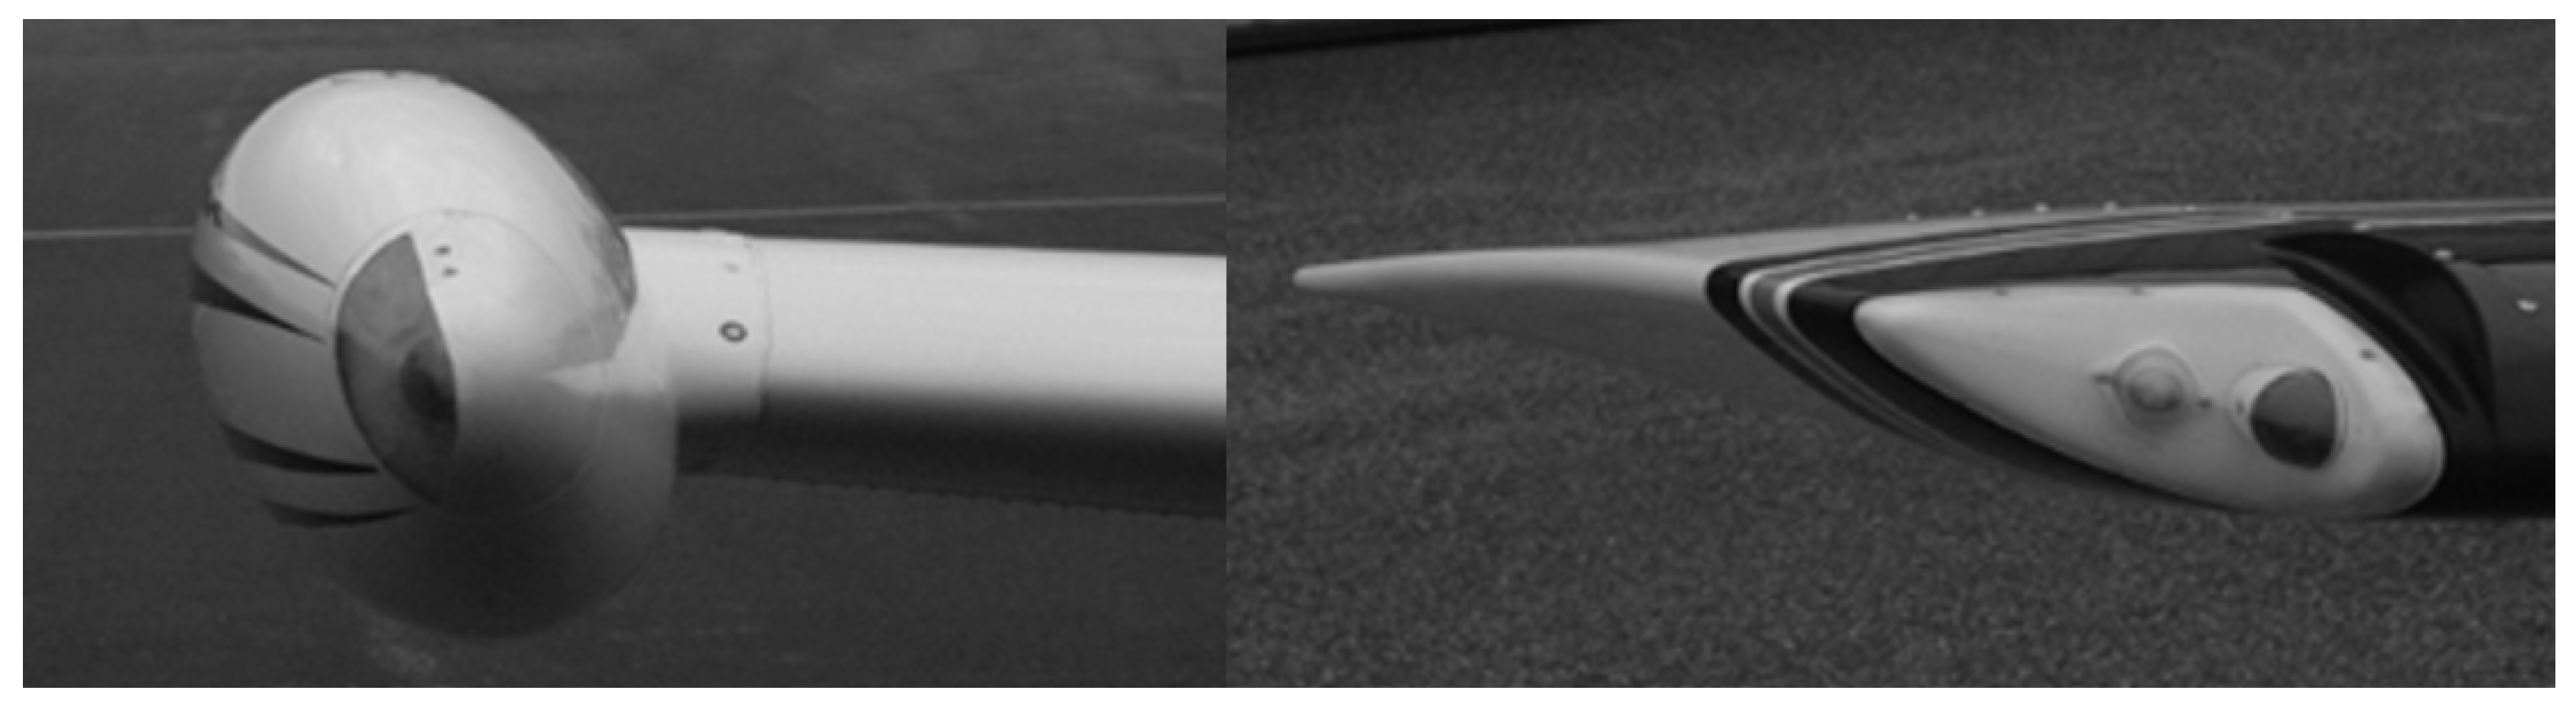
3.5. Retractable Wingtip Pontoons
The wingtip pontoons are designed to retract inboard using a compact servo mechanism, allowing the aircraft to reduce drag in cruise while extending before landing to maintain stability on the water. The system is shown in Figure 13 in the extended and retracted configurations before the servo cover was fitted. The pontoon was designed with the inboard section transitioning between the Clark Y cambered wing profile and a NACA 0012 to ensure that the pontoons do not generate a sideward force in the water. In hindsight, to avoid a sharp transition between airfoil profiles, the transition may be designed to take place over a small portion of the outboard wing itself to avoid any abrupt changes and minimise profile drag. This reduction in tip camber may also be used as a means of reducing the spanwise lift distribution at the wingtips to ensure safe stalling characteristics. Unfortunately, the wing had already been constructed before the pontoons were designed, so this concept was not implemented. However, the pontoons as designed may still provide a significant increase in the "cleanliness" of the wing compared to a fixed pontoon mounted on a strut.
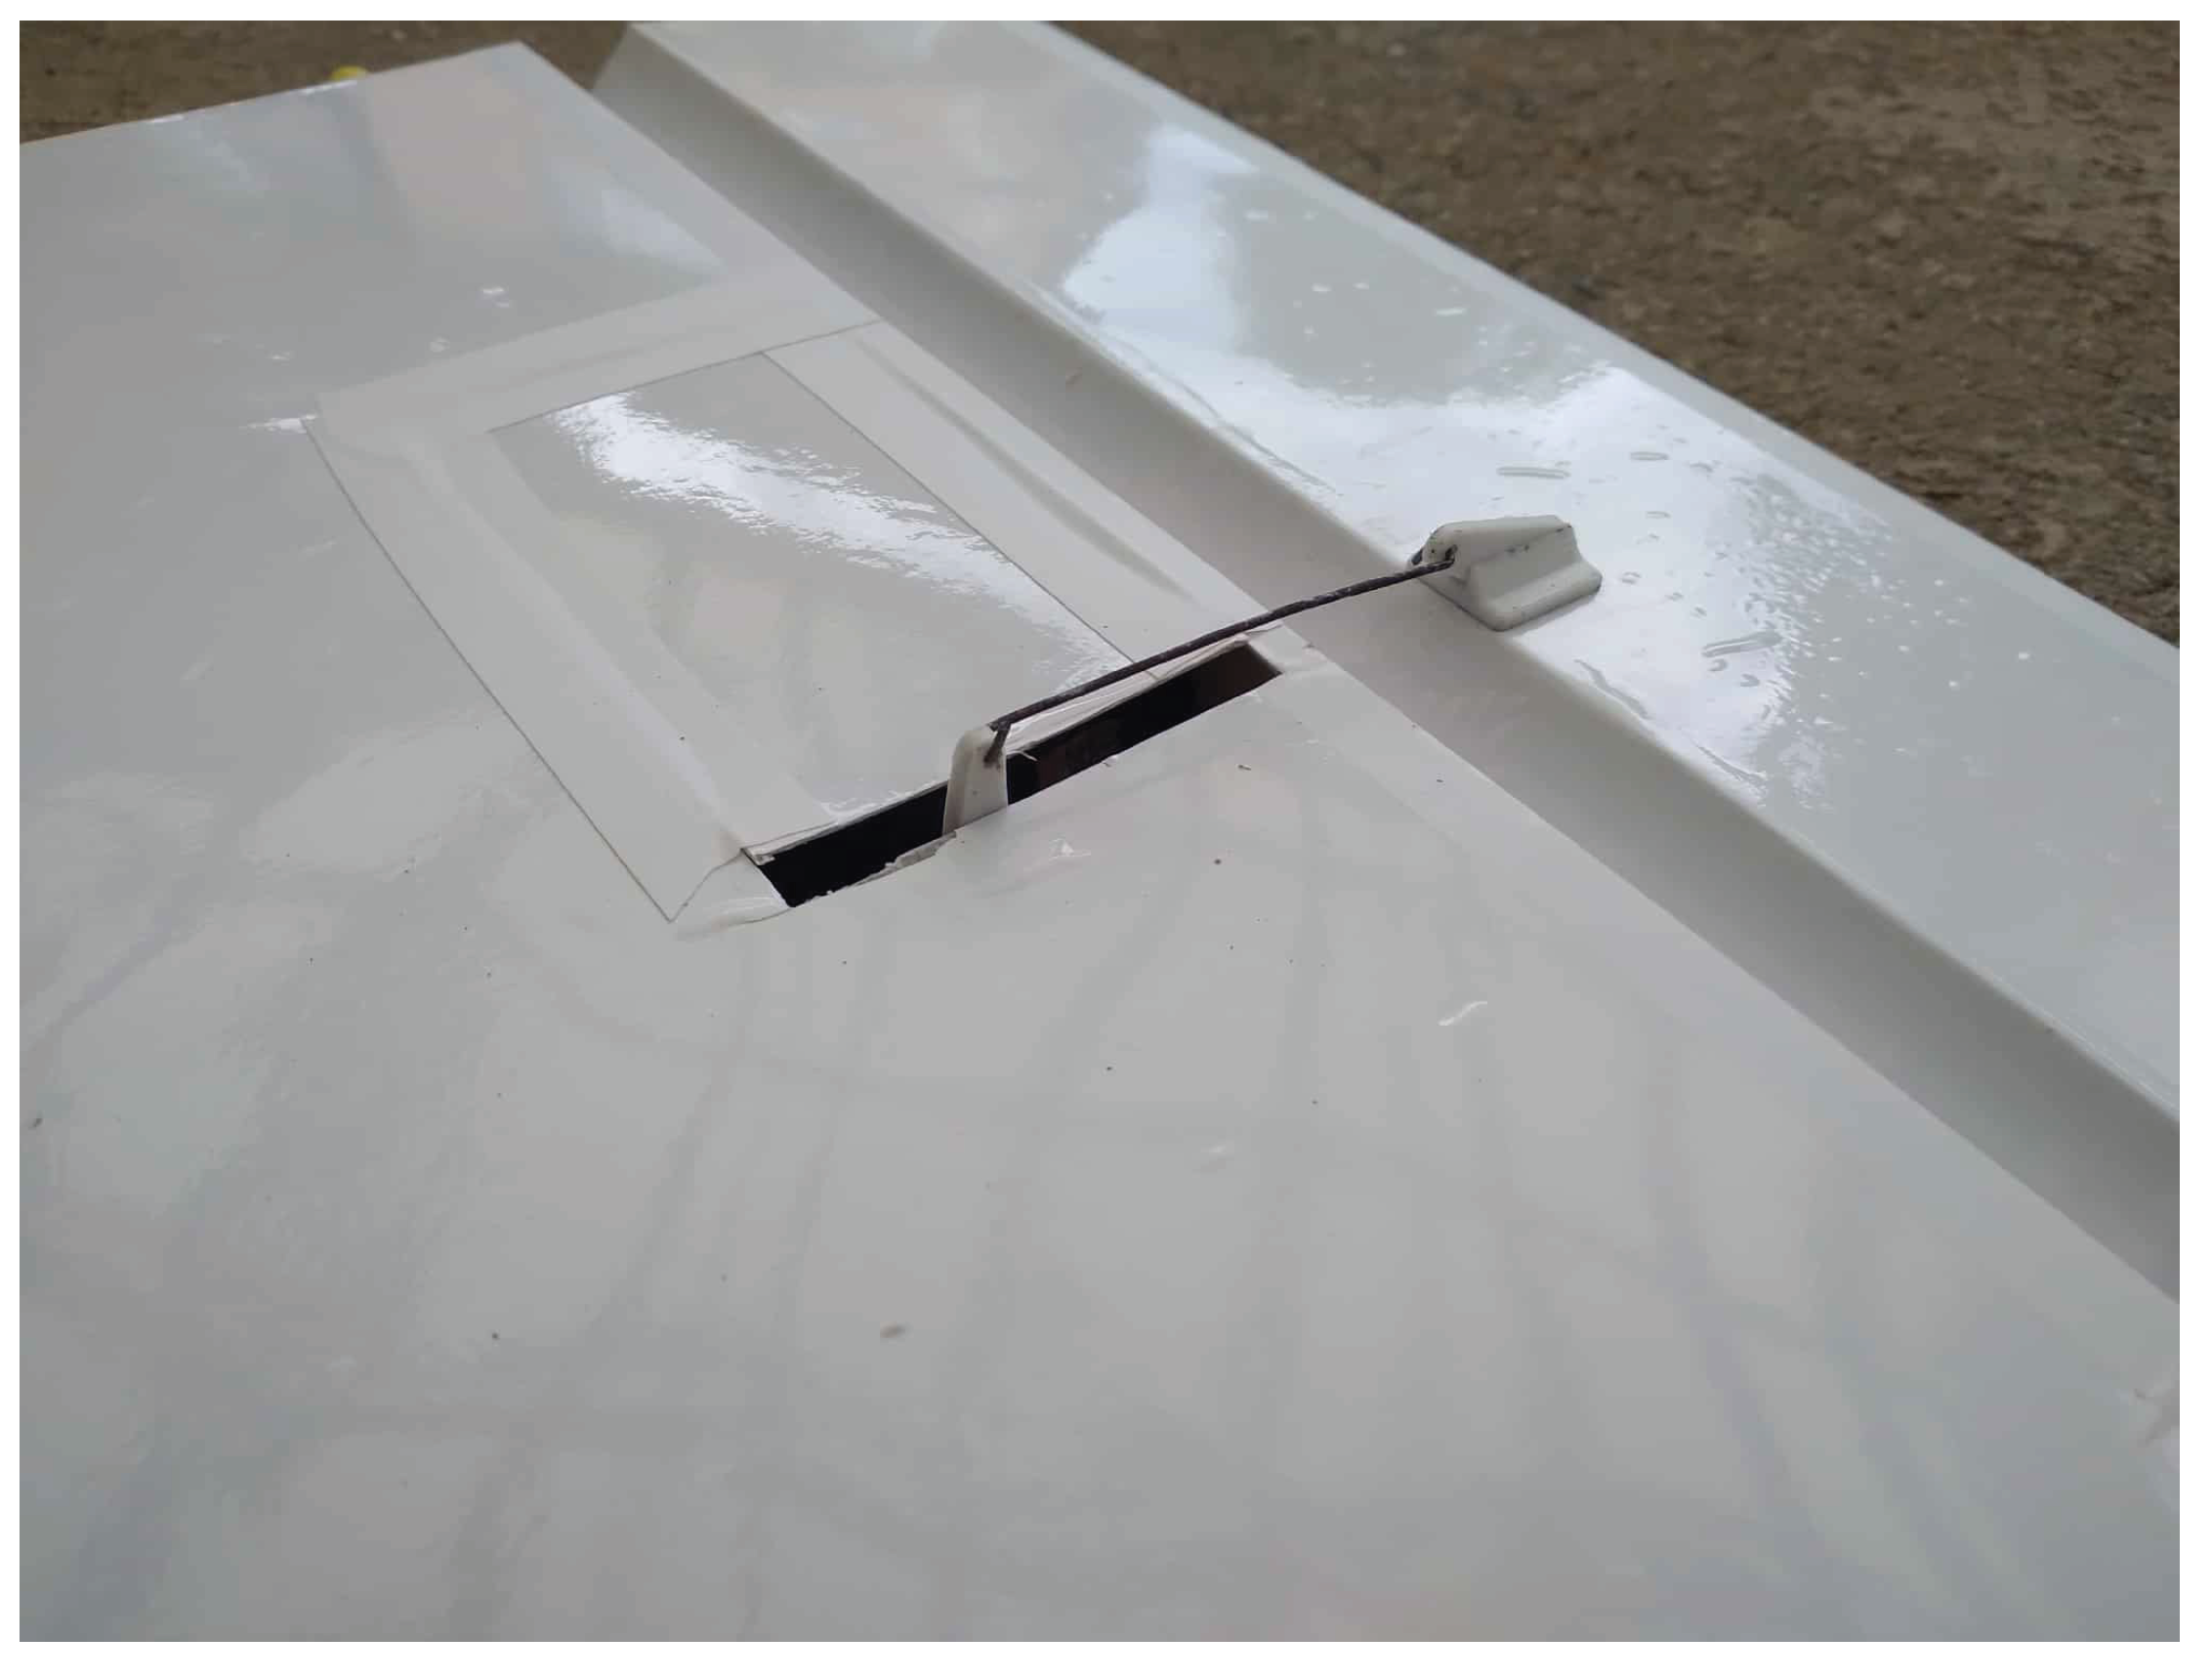
3.6. Hull Step Fairing
The hull step fairing was designed to extend nine times the step depth to provide the optimal benefit as recommended from the literature [16]. It is hinged at the rear and sits flush to the fuselage underside behind the step while retracted. After takeoff, it extends to the edge of the step, as shown in Figure 14. The fairing sides slide into a narrow slot along the fuselage sides a distance of 5mm while extended and retract fully into the slot when retracted. The fairing is actuated via a servo inside the fuselage with a guide tube directing a pushrod to the underside of the fairing to extend and retract it as required. While this actuating arrangement involves a hole in the bottom of the fuselage below the waterline, as long as the top of the guide tube is positioned above the waterline no water will exit the top of the guide tube.
3.7. Data Acquisition
3.7.1. System Description
Drag data was determined by measuring speed via an onboard GPS module and thrust via a load cell built into a data acquisition (DAQ) system with an onboard microcontroller/SD card. The specific DAQ components are listed in the aircraft bill of materials in the appendix, and a system diagram is shown in Figure 15. The DAQ system is powered from a household 9V battery and initiates satellite connection immediately after power is connected. A buzzer indicates a successful GPS fix and confirms the system is recording. The general system architecture was specified by the author and the device manufactured externally.
The thrust generated by the motor and propeller is equal to the aircraft’s total drag when in steady, level flight. It is read directly through the load cell and time-averaged over the test run. The load cell is inbuilt into the motor mount housed in the pod above the wing, as shown in Figure 16. The load cell reading with the horizontal model at zero motor RPM may be used to tare the load cell reading for each flight data set. The GPS module records position against time, from which the average velocity over a test run may be determined. With drag and speed known, the total drag coefficient is computed through Equation 5.
Drag coefficient was plotted against velocity at various throttle settings to produce a drag versus speed plot for the entire aircraft at each configuration. The radio control system is programmable, allowing the typically gradual, proportional throttle curve to be turned into a ‘stepped’ profile, where the motor operates at several discrete throttle settings across the control stick’s range. This feature enables constant throttle settings throughout an individual test run and between flights with different configurations.
3.7.2. Load Cell Calibration
The load cell, as installed in the motor mount, was calibrated to ensure accurate propulsive force measurement and to detect any systematic errors from the motor mount integration. The fuselage was positioned on its nose on the ground, and a part 3D-printed to slide over the propeller shaft and hold 1kg weights, as shown in Figure A9. The model was levelled with a spirit level and adjusted so that the propeller shaft was vertical, then the weights were added to the holder one at a time with a 10-second pause and then unloaded one at a time.
The corresponding load cell data were recorded through the DAQ system, and a thrust/time plot generated in Python. Time-averaged thrust was determined for each loading over the horizontal line segments in the plot and these values are plotted against the known loadings. The direct load cell data is shown in Appenix Appendix C and the calibration plot is shown in Figure 17. Overall, a very close match to the true load is observed, with values for loading and unloading of 0.9952 and 0.9909 compared to the reference line y = x. It is thought that the error in the detected load is caused by the weight holder tolerance around the prop shaft and natural flexing causing the weights to tilt slightly and act eccentrically to the propeller shaft and load cell. For the flight tests, it is assumed that no gain factor or correction curve is required. To gain a more accurate calibration, one might be able to measure force with a scale supported horizontally and using the motor and propeller to generate actual thrust, comparing recorded values to scale readings.
3.8. Measurement Accuracy and Data Uncertainty
Uncertainty in results due to measurement accuracy is a key challenge for SFT. In this case, the key limitations are due to speed and thrust measurement and wind effects. The load cell has a rated uncertainty of 1% of its 10 lb (45.4 N) capacity [62] and the GPS has a horizontal accuracy to within 2.0 m [63]. Since the speed used to compute drag is ground speed, any headwind or tailwind effects must be minimised. Calm days and times are required for the flight testing to minimise the effect of wind. Any present wind was accounted for by completing test runs in opposing directions for each drag feature configuration and throttle setting. The wind speed was then estimated from the following equation:
where is the measured ground speed in one direction and is the measured ground speed in the opposite direction. The airspeed for each run was then calculated by subtracting or adding the wind speed from the ground speed as appropriate. The uncertainty in final drag measurement is estimated from the measurement guide in [64] for a conservative airspeed of 25 m/s over a 300 m run:
where x is the measured displacement and are the position uncertainties at each end.
Assuming time is measured accurately by the microcontroller, the relative uncertainty in ground speed is:
Assuming a maximum wind speed of , and that testing in both directions reduces the wind error to (1/4), the relative uncertainty in airspeed is:
The thrust uncertainty from the load cell is , which is 1% of its 45.4 N range. For a maximum expected thrust of [65], the relative thrust uncertainty is:
The drag coefficient is computed using:
where T is thrust, is air density, S is reference area, and V is airspeed.
The relative uncertainty in drag coefficient is therefore:
Hence, a minimum relative uncertainty of 2.6% is expected. The uncertainty will increase if, for example, flying altitude cannot be accurately held or the wind is stronger.
This uncertainty must be compared to the potential savings from the drag reduction features to determine if the testing is feasible. In [40], comparing drag difference with and without wingtip tanks that are similar in form to wingtip-retracted pontoons, a drag saving of 3.3% at 130 KTAS and a drag penalty of 3% at 167 KTAS were found. The drag differences diverged increasingly rapidly on either side of these speeds.
In addition, this report compares the drag of pontoons retracted to the wingtip to a baseline case of fixed pontoons and struts below the wing, so the drag difference is expected to be significantly greater than that for the wingtip fuel tanks.
Studies indicate that hull step fairings may improve the hull drag by 15% [15]. In [24], the hull drag is stated to account for 34% of the Saro S.R.A1 total drag. This equates to 5.1% potential savings of the total drag by implementing a hull step fairing for this particular aircraft.
The potential drag savings from both the hull step fairing and retractable pontoons are above the drag measurement uncertainty, hence should be detectable through the proposed method. Individually, they are only marginally higher, but especially when combined, a clear trend in drag difference should be demonstrable.
4. Results and Discussion
4.1. Data Extraction
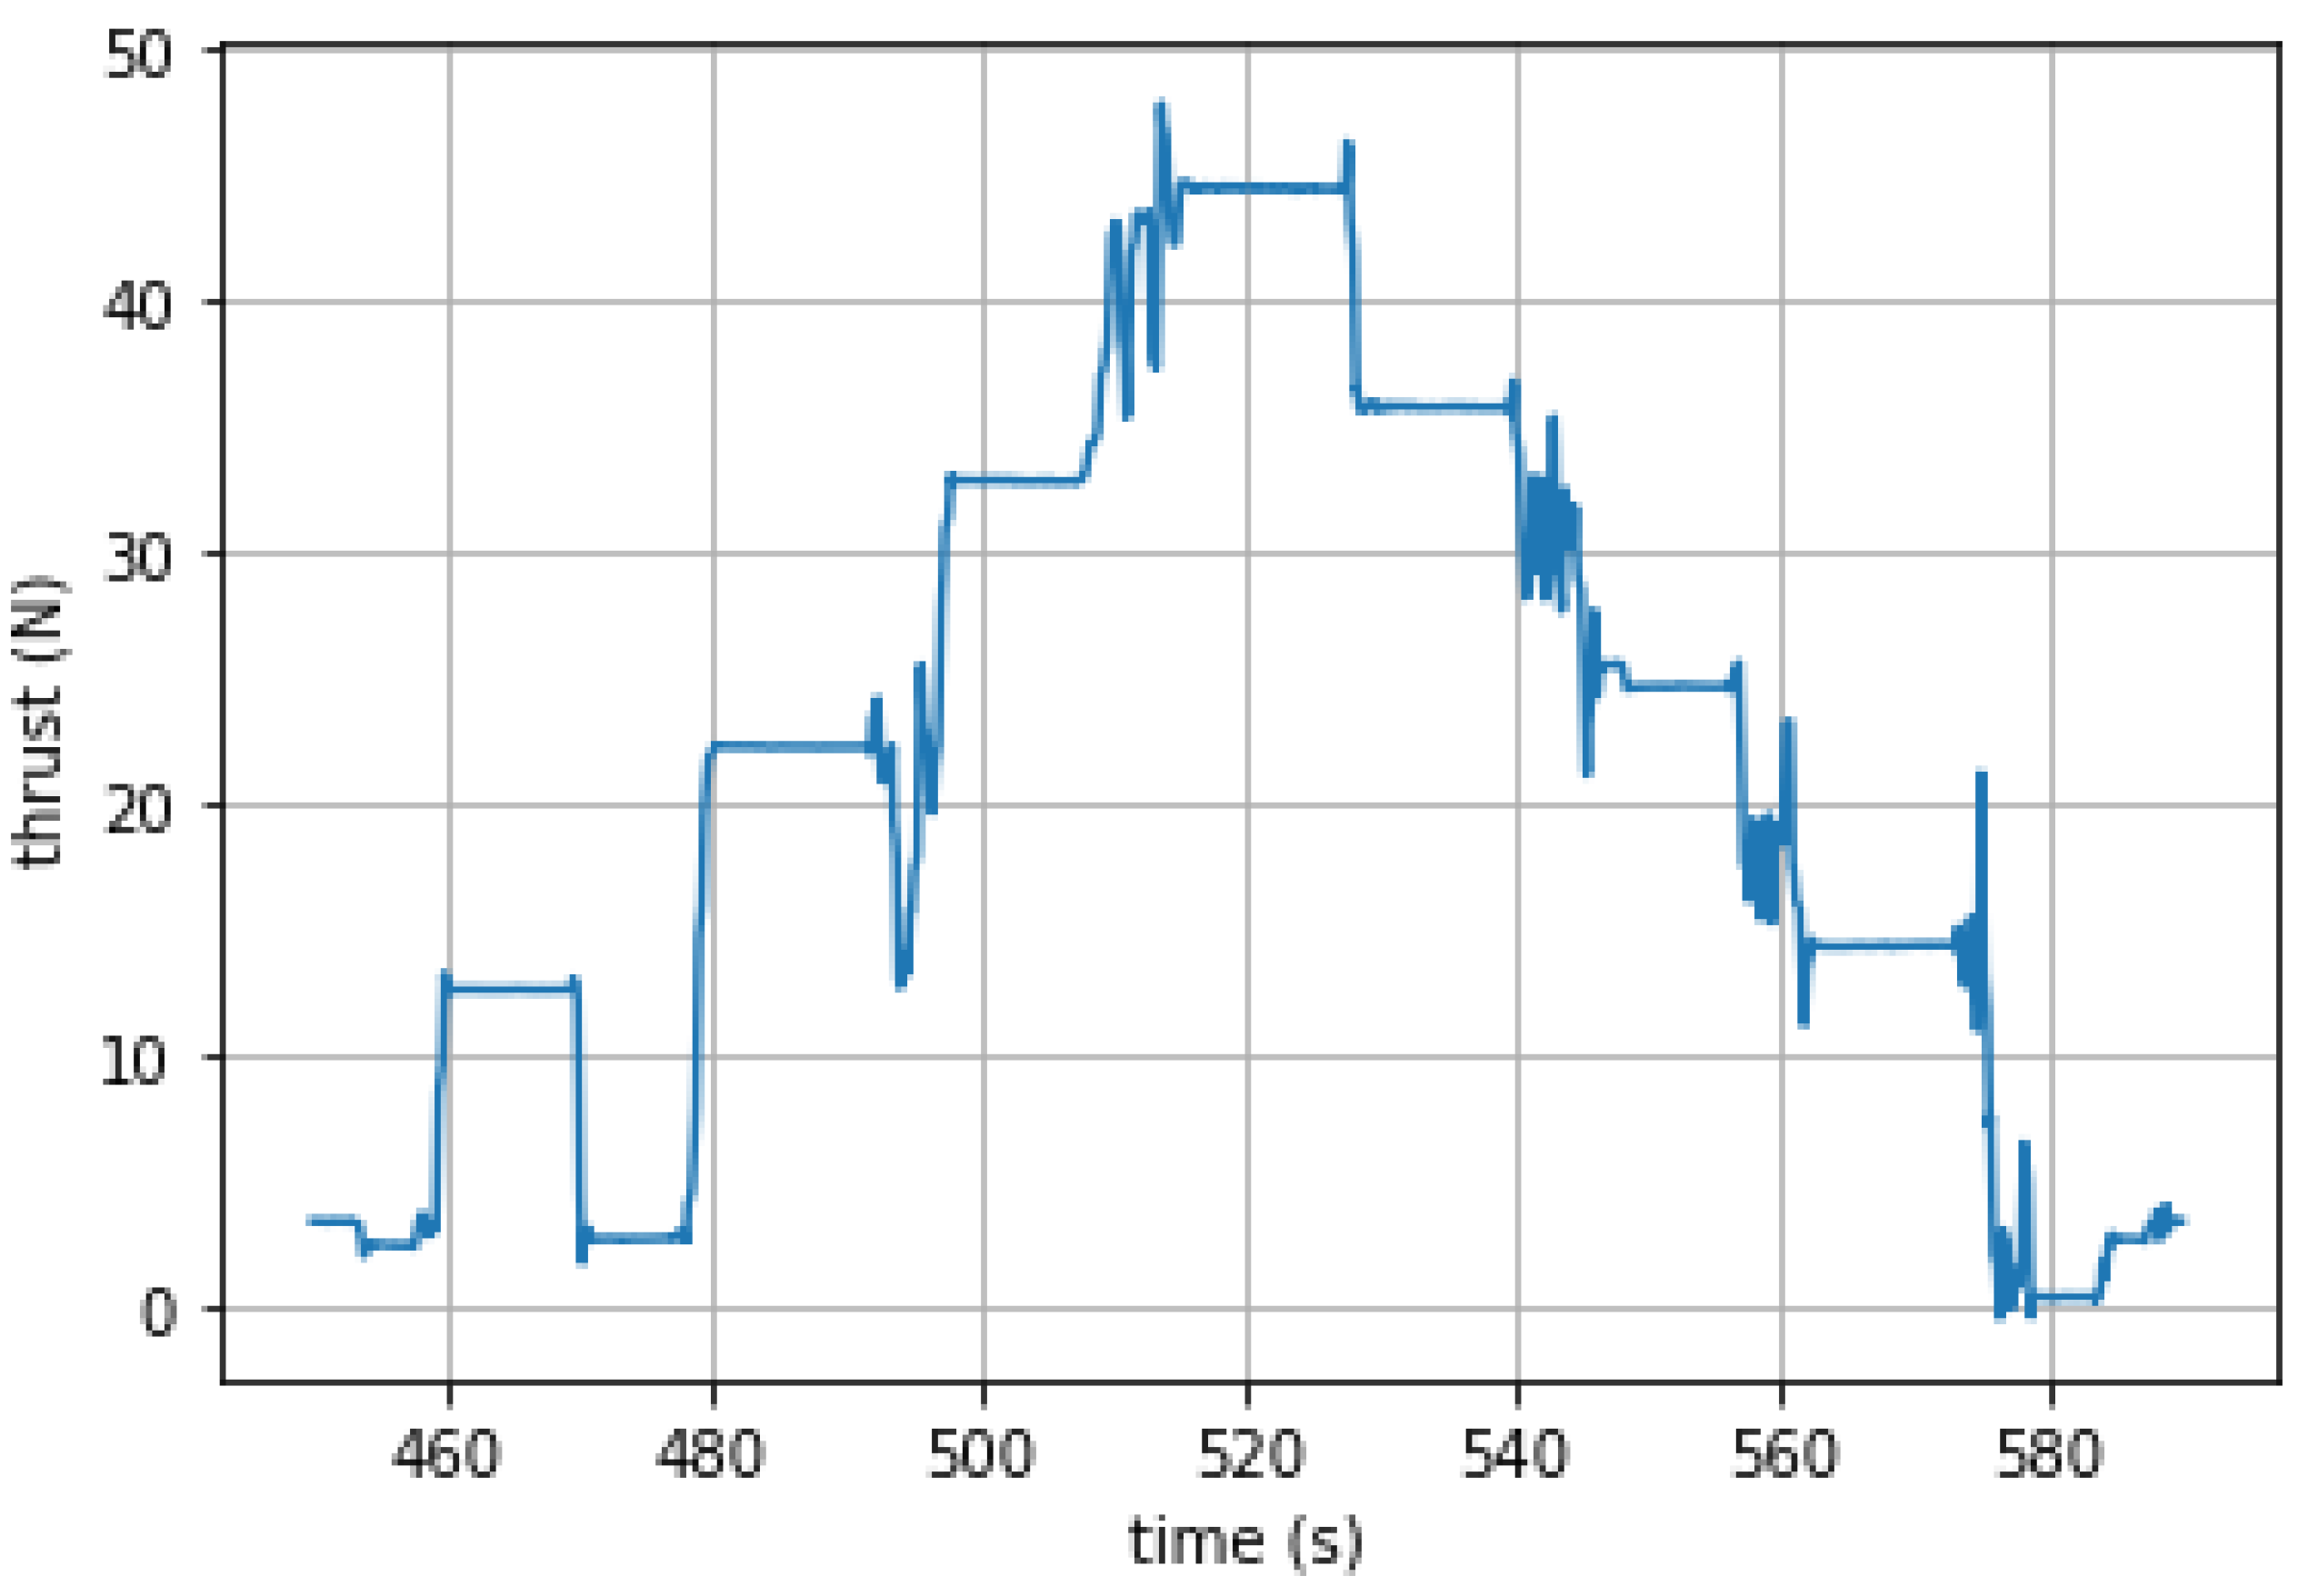
A Python script was developed to process and plot the GPS and thrust data as flight path, speed–time, and thrust–time plots. Figure 18 and Figure 19 show the plots generated for one of the test configurations, with some highlighted example straight segments extracted for data collection. Although the thrust sensor functioned correctly during the aircraft commissioning phase, the thrust data did not record properly during the test campaign. Consequently, all flight test runs were performed at full throttle to maintain an approximately constant power output between runs, enabling direct comparison of results.
Provisions were made within the code to select a time window and plot a chosen segment of data. This time window was adjusted for each flight path to isolate straight and steady segments of flight, ensuring that any transient accelerations at the start or end of each run were excluded and that the aircraft was in approximate equilibrium. This was verified by inspecting the speed–time plot for each run to confirm that the velocity remained nearly constant and the flight path plot confirmed to be sufficiently straight. The code determined the flight path distance for each segment, along with the average speed and the duration of the run.
Uncertainty in speed measurement for each run are caused mainly by positional and time accuracy and wind effects. The onboard GPS reports its estimated horizontal dilution of precision (HDOP) for each fix, indicating the expected positional accuracy based on satellite connections. During all tests, HDOP values remained below 0.6 m. This uncertainty defines the resolution with which the start and finish positions of a run are known and hence the uncertainty in flight path distance. Time was originally going to be referenced against the Arduino internal clock, as recorded on the data files to the nearest millisecond. However, it was apparent from initial data analysis that the time steps recorded did not include a delay incurred while writing each line of data to the onboard memory, resulting in unrealistic speed values. The GPS recorded universal time (UTC) at each fix to the nearest second, so the data was processed using that instead. Unfortunately this introduced an uncertainty in each time value of s.
Combining these two updated sources of uncertainty with an estimate for the wind effects as discussed in Section 3.8, the approximate uncertainty for each test run is determined as follows:
and hence for a given run distance, time and average speed,
Table A1 summarises the test run data. A t-test was conducted on the speeds between each configuration and the results are presented in Table 3. Only the speeds between configurations 1 and 2 meet the standard 95% confidence interval (p-value < 0.05) criteria for statistical significance. Hence, only this difference may be confidently inferred to be the result of a difference in drag coefficient for the tests conducted in this study. The other configuration pairs may have meaningfully different drag coefficients, but failed to be statistically significant due to the precision of the measurement methods and external factors. Further testing with more precise measurement and flight path control is required to determine this.
Table A1 summarises the test run data. A t-test was conducted on the speeds between each configuration and the results are presented in Table 3. Only the speeds between configurations 1 and 2 meet the standard 95% confidence interval (p-value < 0.05) criteria for statistical significance. Hence, only this difference may be confidently inferred to be the result of a difference in drag coefficient for the tests conducted in this study. The other configuration pairs may have meaningfully different drag coefficients, but failed to be statistically significant due to the precision of the measurement methods and external factors. Further testing with more precise measurement and flight path control is required to determine this.
4.2. Power Modelling
Given that thrust data were unavailable, the propulsive power at full throttle was approximated and used to estimate the drag coefficient. To solve for the drag coefficient from power, one may simply multiply both sides of the drag equation by velocity.
A study by Smith [66] on the powertrain efficiency of a typical UAV powered by a brushless motor was used to model the propulsion system for this aircraft. The component efficiencies vary with throttle setting, but at full throttle the brushless motor and electronic speed controller (ESC) efficiencies were reported as and , respectively. The maximum propeller efficiency was taken as .
Hence, the total system propulsive efficiency was calculated as:
The propulsive power was then estimated by multiplying the approximate electrical power consumption of the Propdrive 4258 motor with a 13 × 8” propeller [65] by the total system efficiency:
These efficiency values for the specific components studied in Smith [66] are assumed to be similar to the efficiencies of the components in this study, though this cannot be guaranteed. However, any over- or under-estimation of propulsive power due to inaccurate component efficiencies will affect all drag coefficients equally. Since the relative drag difference is the measurement of interest, these assumed efficiencies should not affect the results significantly.
4.3. Drag Results
The total drag coefficient, , for each test configuration was determined from the estimated propulsive power and the measured velocity with Equation (20). The air density was estimated from [59] for an ambient temperature of 12 °C, pressure of 1012 hPa, and relative humidity of 64%, yielding a value of .
The uncertainty was calculated with Equation (21).
The calculated drag coefficients for each airframe configuration are presented in Table 5, along with their difference to the baseline configuration. The final relative uncertainties were between 7% and 9%, compared to the 3% uncertainty possible with thrust data and more accurate timing.
The profile drag coefficient, , was determined by subtracting the induced drag component from the total drag coefficient. The span efficiency factor was first estimated using Brandt’s method [28].
The total and profile drag coefficients are plotted in Figure 20 for visual comparison between configurations.
4.4. Discussion of Results
These results in Figure 20 and Table 5 and Table 6 allow direct comparison between the baseline configuration and the drag reduction features. The measured data show the retractable wingtip pontoons produced a reduction in total drag coefficient of approximately 17%. Adding the hull step fairing did not appear to reduce drag any further, but rather increased it by 6% compared to the pontoons up, fairing off configuration. During flight testing, a fresh, fully charged battery was used for the first two test configurations, but the third configuration with the step fairing was flown reusing a battery from one of the earlier test flights. The batteries used vary between 25.2 and 22.2 volts when fully charged and fully depleted, and thus, the reused battery voltage would lie somewhere between these values. While the test flights were kept short and well within the allowable flight duration, the assumption of constant power between flights is likely inaccurate for the last test configuration due to a lower voltage. It should also be noted that the speed values between the last configuration and the other two were not statistically significant, while the other two were significantly different.
The remarkably high drag savings of the retracting wingtip pontoons are measured against the drag of the extended pontoons that were not optimised for use as fixed pontoons. Their geometry includes a flat top side to interface with the wing end face, a blended section to transform the NACA 0012 underwater contour to the wingtip Clark-Y airfoil and a square-section retracting arm. Thus, further study is required to investigate the relative performance of a retracting pontoon with a pontoon optimised for fixed deployment. While the true drag difference between retractable and well-designed fixed pontoons is expected to be lower than 17%, it would likely still be large enough to justify the use of retractable designs.
Limited aerodynamic drag measuring capability via SFT was presented in this study, with a final drag measurement accuracy of 7–9% using a power-based method (when fully charged batteries are used). A measurement accuracy of less than 3% may be possible if thrust data is successfully recorded and validated. These findings indicate strong potential for SFT as an alternative to wind tunnel or CFD for drag studies, particularly with further refinement.
4.5. Analytical Performance Estimation for Seamax Amphibious LSA with Drag Reduction Features
A high-level analytical estimate was performed to assess the potential cruise performance of an existing amphibious LSA if equipped with the proposed drag reduction features and Rotax 916iS engine. The purpose of this analysis is to provide an initial estimate of the cruise speed potentially achievable by the Altavia Aerospace proposal. The Seamax was selected from the existing aircraft in Table 1 due to its relatively clean configuration compared to other designs, high cruise speed relative to its smaller engine and favourable stall speed of 39 knots, as this is another desirable quality of the Altavia Aerospace concept.
Baseline Drag Estimation
Cruise performance stated in the Seamax M22 Aircraft Flight Manual (AFM) [67] are assumed to be at maximum takeoff weight at sea level. A maximum stated cruise speed of 101 knots (51.96 m/s) at maximum continuous power corresponds to a 69 kW power output, according to the engine operators manual [68]. The aircraft wing area and aspect ratio are taken from the AFM [67]. Applying a typical propeller efficiency of 85%, the baseline drag coefficient is estimated in Equation (24).
The lift coefficient is computed to calculate induced drag, with the spanwise efficiency factor estimated using Brandt’s method [28].
The induced drag is now calculated and the parasite drag found by subtracting the induced drag from the total drag coefficient.
Drag Reduction Estimation
The retractable pontoons tested in this study were not optimised for fixed deployment and featured a square-section support arm that contributed additional drag. As such, only half of the measured 17% drag reduction was applied in this analysis (8.5%) to better approximate the expected improvement of retractable pontoons compared with a refined fixed pontoon design.
For the hull step fairing, Saugen in [15] indicated hull drag reductions of approximately 15%, increasing to 20% when the wing incidence angle is also optimised. The Seamax has a high wing incidence angle of 4.9 degrees, and hence would benefit significantly in high-speed cruise at low lift coefficient. Hull drag is stated to contribute 20–34% of the total parasite drag across six seaplanes studied in [19]. Assuming the Seamax hull contributes 27%, halfway between these values, the total parasite drag saving from hull step fairing and wing-set optimisation could be 5.4% for the complete aircraft. The hull step fairing and retractable wingtip pontoons would yield a combined 14.1% parasite drag reduction estimate. The resulting parasite drag coefficient of the modified aircraft is calculated in Equation (29).
Modified Aircraft Characteristics
Altavia Aerospace propose the use of a modern Rotax 916iS turbocharged engine, released in 2023, for their amphibious aircraft concept. The differences between this powerplant and the Rotax 912 ULS engine used on the Seamax M-22 must be analysed to determine the potential aircraft performance. Both engines share the same 1352 cm3 displacement, but the 916iS adds a turbocharger, intercooler, and fuel injection system, enabling operation at maximum continuous power up to 19,000 ft. This comes at the expense of additional weight and fuel consumption, although the specific fuel consumption is less [68,69]. Table 7 summarises the key specifications and resulting mass and fuel differences for the 471 nautical mile absolute range capable by the Seamax in still air [67].
The total weight increase from engine and fuel weight is 35.2 kg. Without reducing the useful load-carrying capacity, this would require an increase in the maximum takeoff weight. Adding another 15 kg as a conservative estimate for the drag reduction features, the new approximated MTOW will be taken as 650 kg for performance analysis. While this does increase the stall speed if the wing size is not changed, the increase is only marginal, from 39 knots to an estimated 40.6 knots as a function of [67].
To make the most of the turbocharged Rotax 916iS high altitude capability, the cruise speed is estimated at 10,000 ft for reduced drag with lower air density in Equation (31). 10,000 ft represents an approximate altitude beyond which extended flight without oxygen is not recommended and thus represents a practical maximum cruising altitude for this estimation.
Equation (31) does not have a simple closed form solution and thus requires solving numerically.
The resulting estimated cruise speed of 134 knots does not quite meet Altavia Aerospace’s 140 knot target. This outcome does, however, represent a significant improvement over the baseline Seamax cruise speed of 101 knots, and through further aerodynamic refinement and optimisation for the new configuration, the 140 knot target may be achievable.
5. Conclusions
This study demonstrated the aerodynamic potential of drag reduction features for amphibious LSA through sub-scale flight testing (SFT) and analytical performance estimation. A 1/5-scale flying model incorporating retractable wingtip pontoons and a retractable hull step fairing was designed, constructed, and tested to assess the aerodynamic effectiveness of these features and the practicality of SFT as a method for drag measurement. The retractable wingtip pontoons produced an estimated 17% reduction in total drag coefficient relative to the baseline configuration, while the hull step fairing showed no measurable benefit in this test series. The absence of a clear fairing effect is likely attributed to reduced power output during that test due to the necessary re-use of a flight battery pack from a previous flight. Nevertheless, literature findings indicate that hull step fairings can provide up to 5% total drag reduction, suggesting that further investigation into their effectiveness and feasibility is warranted.
Measurement precision of 7–9% was achieved using the power-based method adopted in this work, with potential improvement to around 3% if direct thrust data are recorded and validated. These findings confirm that SFT can provide meaningful comparative drag data for low-cost aerodynamic evaluation in the early stages of aircraft design. Further, given its established use in the literature for stability and control studies, this method could readily be extended to simultaneously investigate aerodynamic efficiency, stability, and control characteristics with a single experimental platform.
An analytical performance estimation for a Seamax M-22 modified with the proposed retractable pontoons, retractable hull step fairing and the modern Rotax 916iS turbocharged engine supports the experimental findings. The analysis predicts a cruise speed of approximately 134 knots TAS at 10,000 ft, just short of Altavia Aerospace’s 140 knot target. This estimate applies a combined 14% reduction in parasite drag from adjusted experimental and literature values and a modest increase in takeoff weight due to the new engine and design features. While the predicted performance represents a significant improvement over the baseline aircraft, the findings highlight the need for further overall aerodynamic refinement if the 140 knot cruise speed target is to be met.
Overall, this research establishes that retractable wingtip pontoons are a highly effective drag reduction measure for amphibious aircraft and that SFT can be a practical and informative tool for aircraft drag study. With continued refinement of data acquisition methods and integration of thrust measurement, the approach has strong potential to become a valuable tool for aircraft design and development.
6. Recommendations
6.1. Design Recommendations for Amphibious LSA
The initial findings in this report indicate a high drag-saving value for retractable wingtip pontoons. A literature analysis found that a hull step fairing will also provide a meaningful drag saving on the order of 5% if a reliable retractable fairing mechanism can be developed. Beyond these, previous research also emphasised the importance of wing incidence angle optimisation and the significant effect of the length-to-beam ratio. The performance estimation of a modified Seamax M-22 with these features predicted a cruise speed of approximately 134 knots at 10 000 ft, falling 6 knots short of the 140 knot target. Increasing the length-to-beam ratio through a tandem seating arrangement may present the most feasible avenue to achieve the full target speed.
In summary, amphibious LSA aircraft designers, like Altavia Aerospace, should consider the following actions:
- Investigate the feasibility of a full-scale retractable hull step fairing mechanism.
- Refine drag-saving estimates for retractable wingtip pontoons through continued sub-scale testing or complementary computational and wind-tunnel studies.
- Optimise wing incidence angle for high-speed cruise while ensuring sufficient lift for water take-off performance.
- Investigate tandem-seating configurations to increase the length-to-beam ratio and achieve the 140 knot performance goal through further drag savings.
6.2. Sub-Scale Flight Testing Improvements
Several improvements to the sub-scale flight test platform and its data acquisition systems are recommended to enhance the accuracy and repeatability of obtaining in-flight drag measurements. The testing performed in this project relied on manual piloting over a flat lake or ground surface to maintain level flight and constant altitude and heading. Although this method provided limited useful results, it relies on pilot skill, is prone to disturbances and places stricter requirements on the flying site terrain.
Automation of the test procedure would greatly improve data quality and repeatability. The use of a low-cost autopilot system, such as the SpeedyBee F405 flight controller or similar, would enable automated control of throttle, pitch, and heading, allowing for consistent airspeed and altitude throughout each run [70]. Such systems, available commercially for under $100, are capable of fully autonomous flight, waypoint navigation, and high-frequency data logging with an integrated microSD card slot. By programming the aircraft to execute repeatable straight and level flight segments at predefined power settings, the influence of pilot error and environmental variability could be significantly reduced.
Integration of the autopilot system with the onboard data acquisition unit would also allow synchronised logging of GPS and thrust data, simplifying post-processing and improving temporal alignment between measurements. Altitude-hold and auto-throttle functions would enable more precise measurement at steady-state conditions, which is essential for accurate drag estimation.
Once autonomous operation is established, the use of established flight test patterns such as the Horseshoe Method used in full-scale aircraft drag flight testing such as by Rogers in [40] could be implemented to further improve accuracy. In this method, the aircraft flies a triangular pattern under a GPS-guided autopilot, from which the leg speeds are used to solve the wind vector and the aircraft’s true airspeed. By correcting for wind in this way, drag data can be extracted without requiring calm conditions or paired opposing runs, significantly enhancing the robustness of sub-scale flight testing. Implementation of these improvements would transform the current manual testing process into a semi-automated experiment capable of delivering more reliable, repeatable drag measurements with less strict testing environment requirements.
These recommendations are summarised here:
- While testing with manual flight control demonstrated some usable results, testing accuracy may be significantly improved through the use of affordable autopilot systems.
- Automated control may be used to fly a closed triangle flight track to solve for the wind vector and true airspeed, reducing environmental requirements.
- Data acquisition equipment, such as the load cell for thrust measurement, may be integrated with autopilot data logging systems to streamline data synchronisation.
- Overall, autopilot integration will greatly enhance the feasibility of sub-scale flight testing as a valid drag evaluation tool.
7. Acknowledgments
We acknowledge the assistance of Alan Reitsma in building the data acquisition system that made this research possible.
Author Contributions
Conceptualization, J.T. and D.H.; methodology, J.T. and K.J.; software, J.T.; validation, J.T. and K.J.; formal analysis, J.T and K.J.; investigation, J.T.; resources, J.T. and K.J.; data curation, J.T.; writing—original draft preparation, J.T.; writing—review and editing, K.J. and D.H.; visualization, J.T. and K.J.; supervision, K.J. and D.H.; project administration, J.T.; funding acquisition, J.T. and K.J. All authors have read and agreed to the published version of the manuscript.”, please turn to the CRediT taxonomy for the term explanation. Authorship must be limited to those who have contributed substantially to the work reported.
Funding
This research received no external funding.
Data Availability Statement
Data is prescribed in this article or available on request to the corresponding author.
Conflicts of Interest
The authors declare no conflicts of interest.
Abbreviations
The following abbreviations are used in this manuscript:
| SFT | Sub-scale Flight Testing |
Appendix A. Model Construction
Appendix A.1. Wings
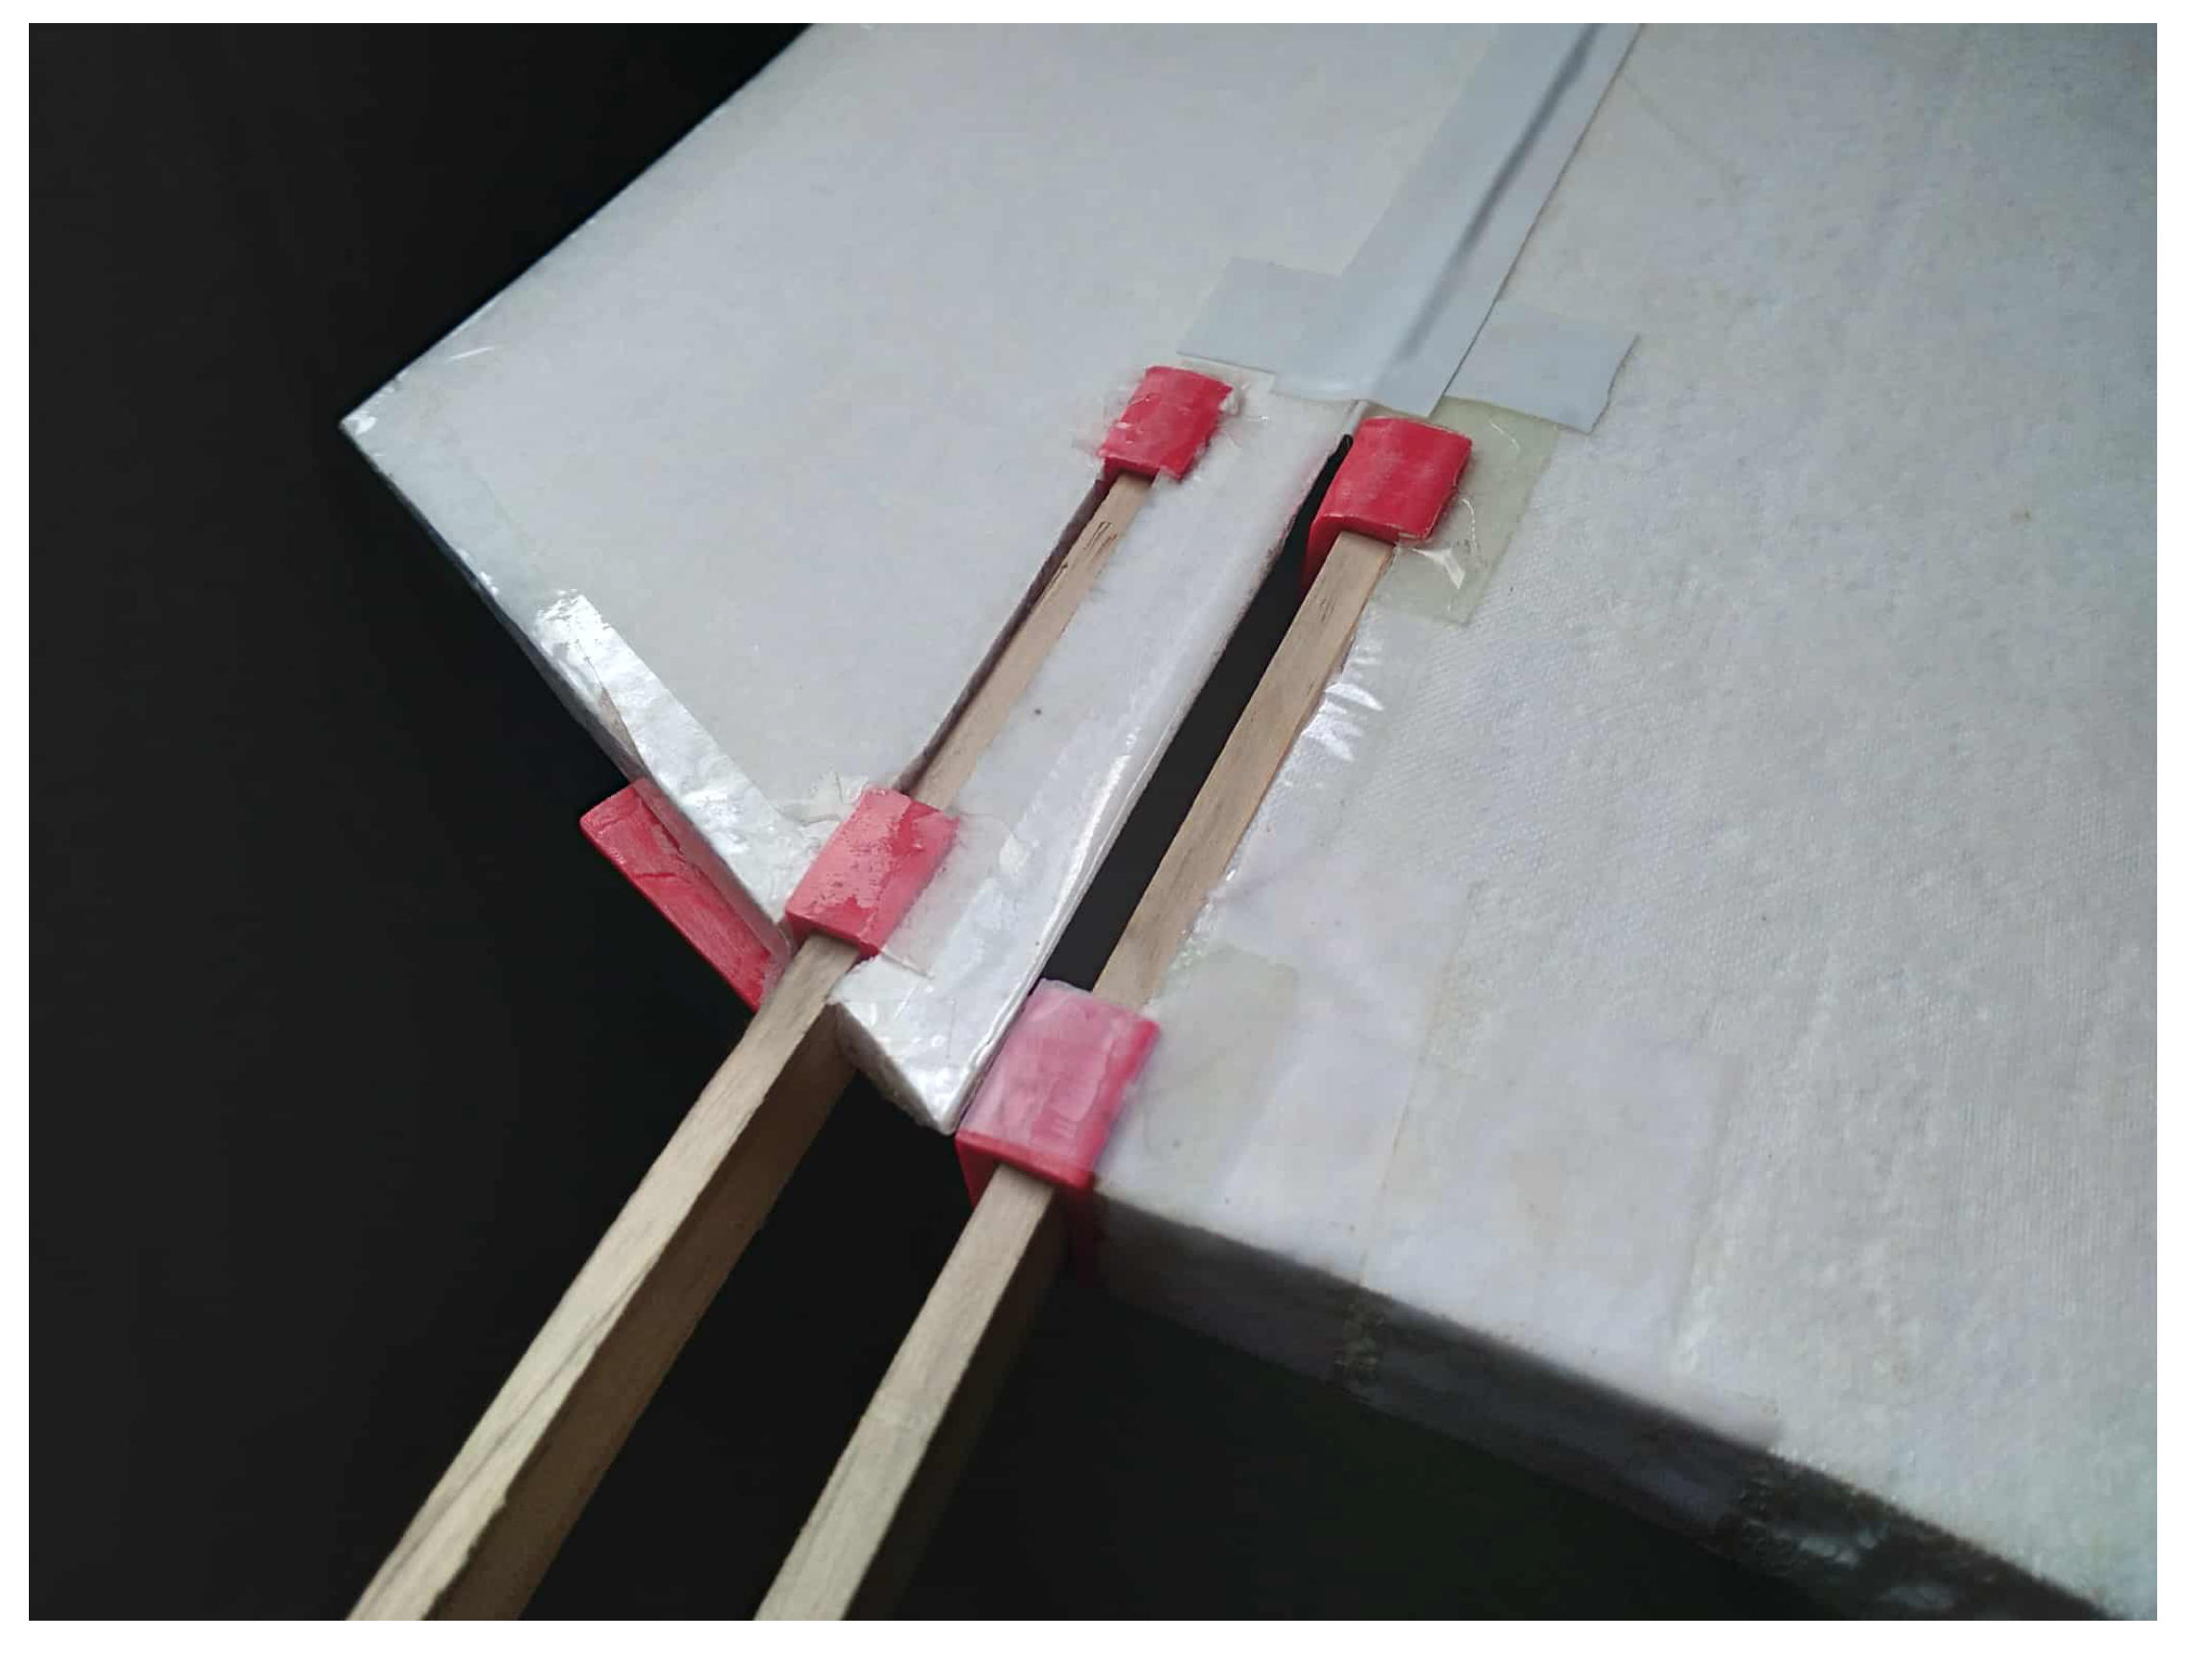
The wings were built with laser-cut 3mm plywood ribs and 5mm thick radiata pine strips for the leading edge, trailing edge, spar caps, and skin supports, as shown in Figure A1. A laminate of 2x 300 gsm plain weave fibreglass layers with epoxy resin was used for the shear webs, bonded to the spar caps on the front and back. The wing was skinned with a preformed fibreglass sheet comprising a single lamina of 300 gsm plain weave fibreglass and epoxy resin. Provisions were made in the wing ribs for a 1 m × 25 mm aluminium tube to be passed through the fuselage into both wings to transfer lift loads. The wing skins were originally intended to be spray-painted. However, the resulting surface finish did not meet the desired quality. To avoid large amounts of sanding and excessive coats of paint, a self-adhesive whiteboard film was applied instead. In future work, the wing skins should be formed with more effort made to have a wrinkle-free surface to cure the sheets on, perhaps with an adhesive protective film instead of a vacuum bag plastic sheet as used for this project. The wing plans and construction photos are shown in Figure A1.
Figure A1.
Wing assembly (own photographs and drawing).
The ailerons and plain flaps were constructed in the same manner as the wings with a plywood frame, fibreglass skin and self-adhesive covering. These are hinged from the top surface with tape on both sides of the hinge along its length.
Appendix A.1.1. Fuselage
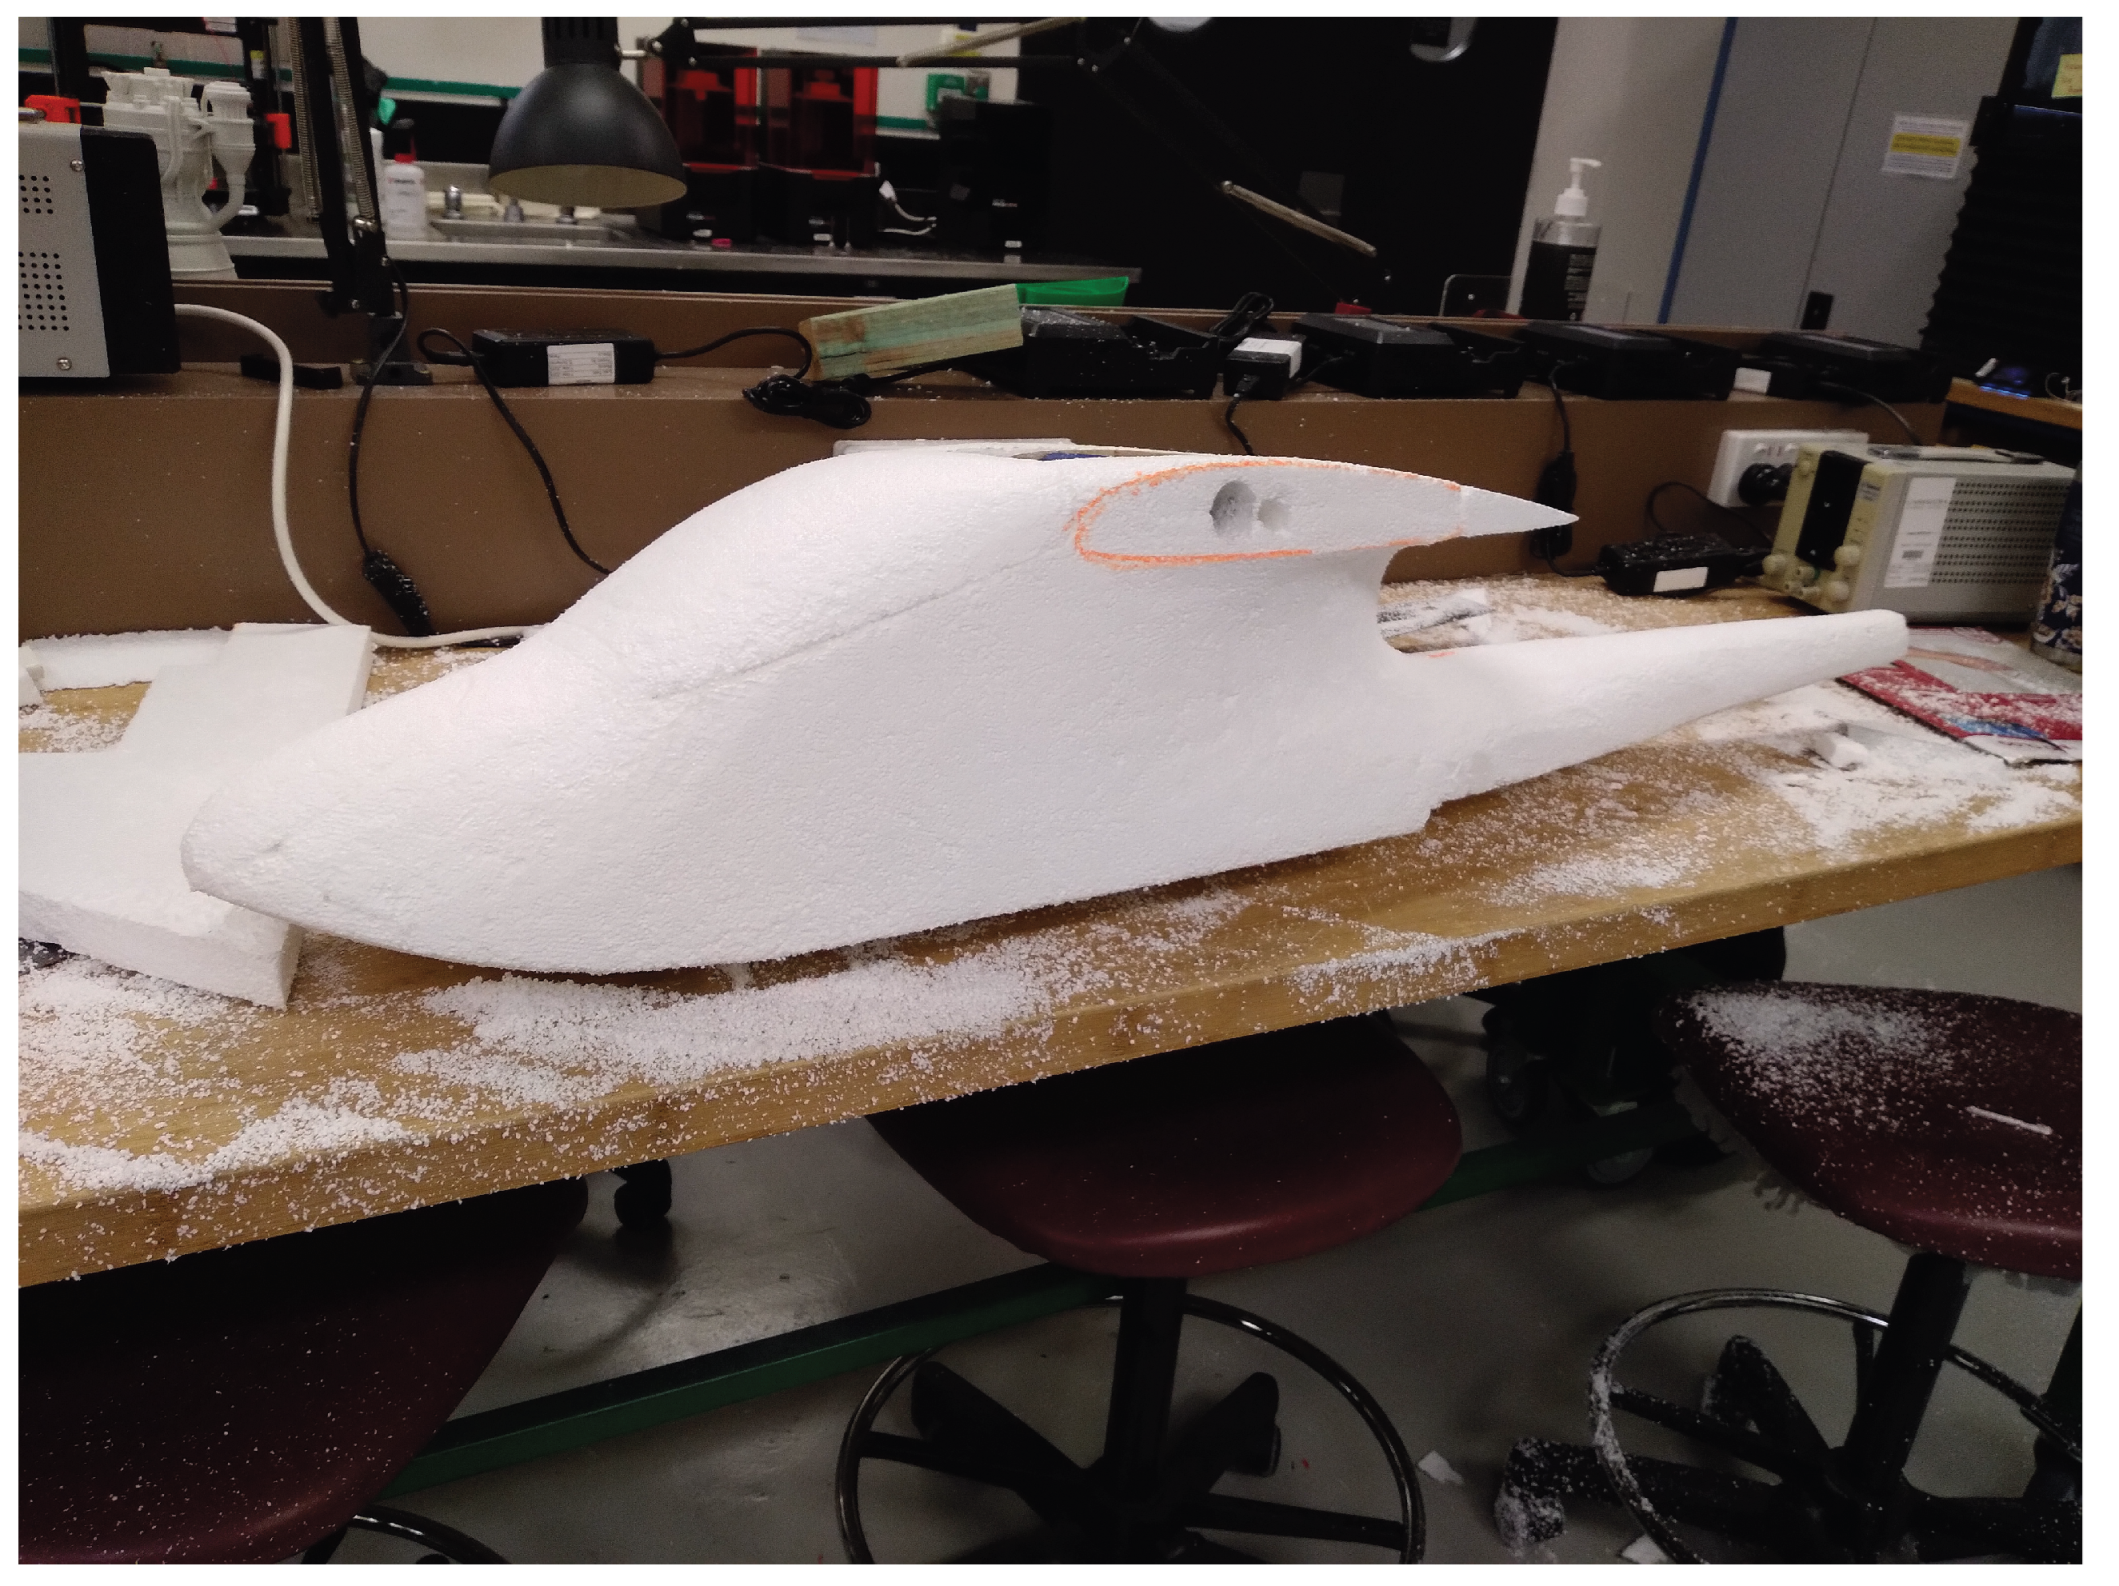
The fuselage was constructed with an internal plywood box to provide a strong frame for primary flight loads and an internal compartment for the electronics. Extruded polystyrene foam was adhered to the outer surfaces of the box, after which the side and top profiles were traced onto the foam. The final fuselage shape was then carved from the foam with a rasp and sanded smooth. The fuselage was then covered in 1 lamina of 200gsm plain weave fibreglass cloth and epoxy for waterproofing and surface strength. The final fuselage structure was then sanded lightly and painted. Figure A2–Figure A5 outline the fuselage structure and shaping process.
Figure A2.
Fuselage internal structure (own photograph).
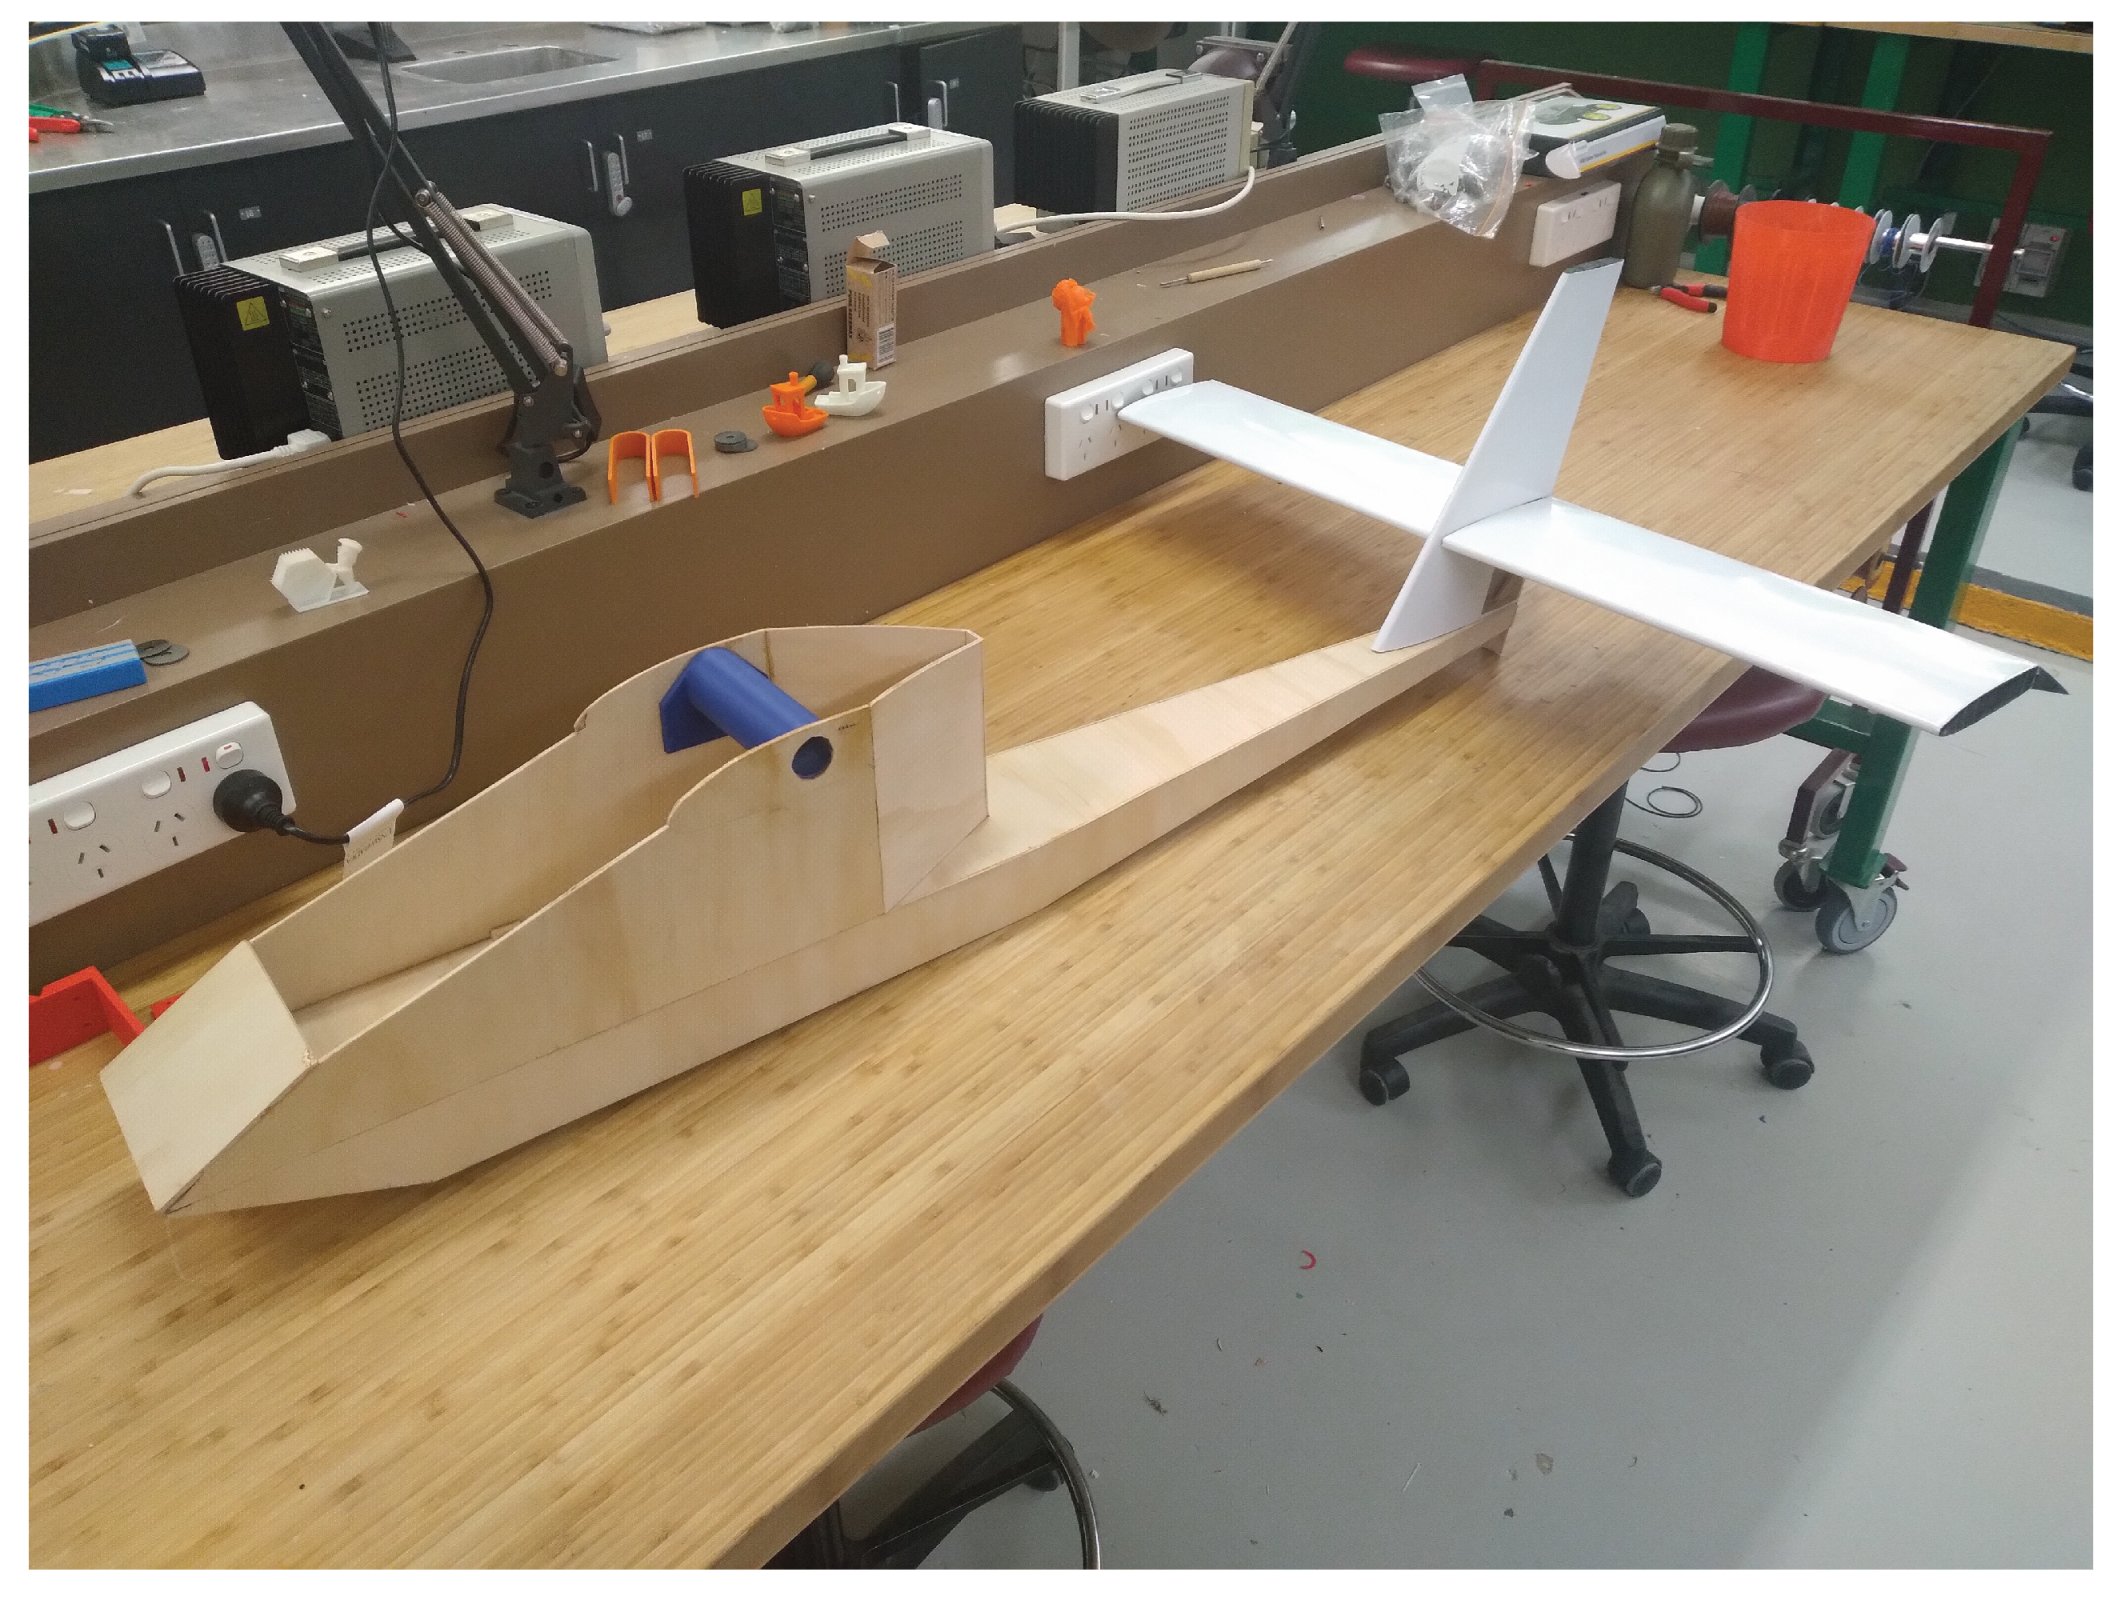
Figure A3.
Foam blocks for fuselage shaping (own photograph).
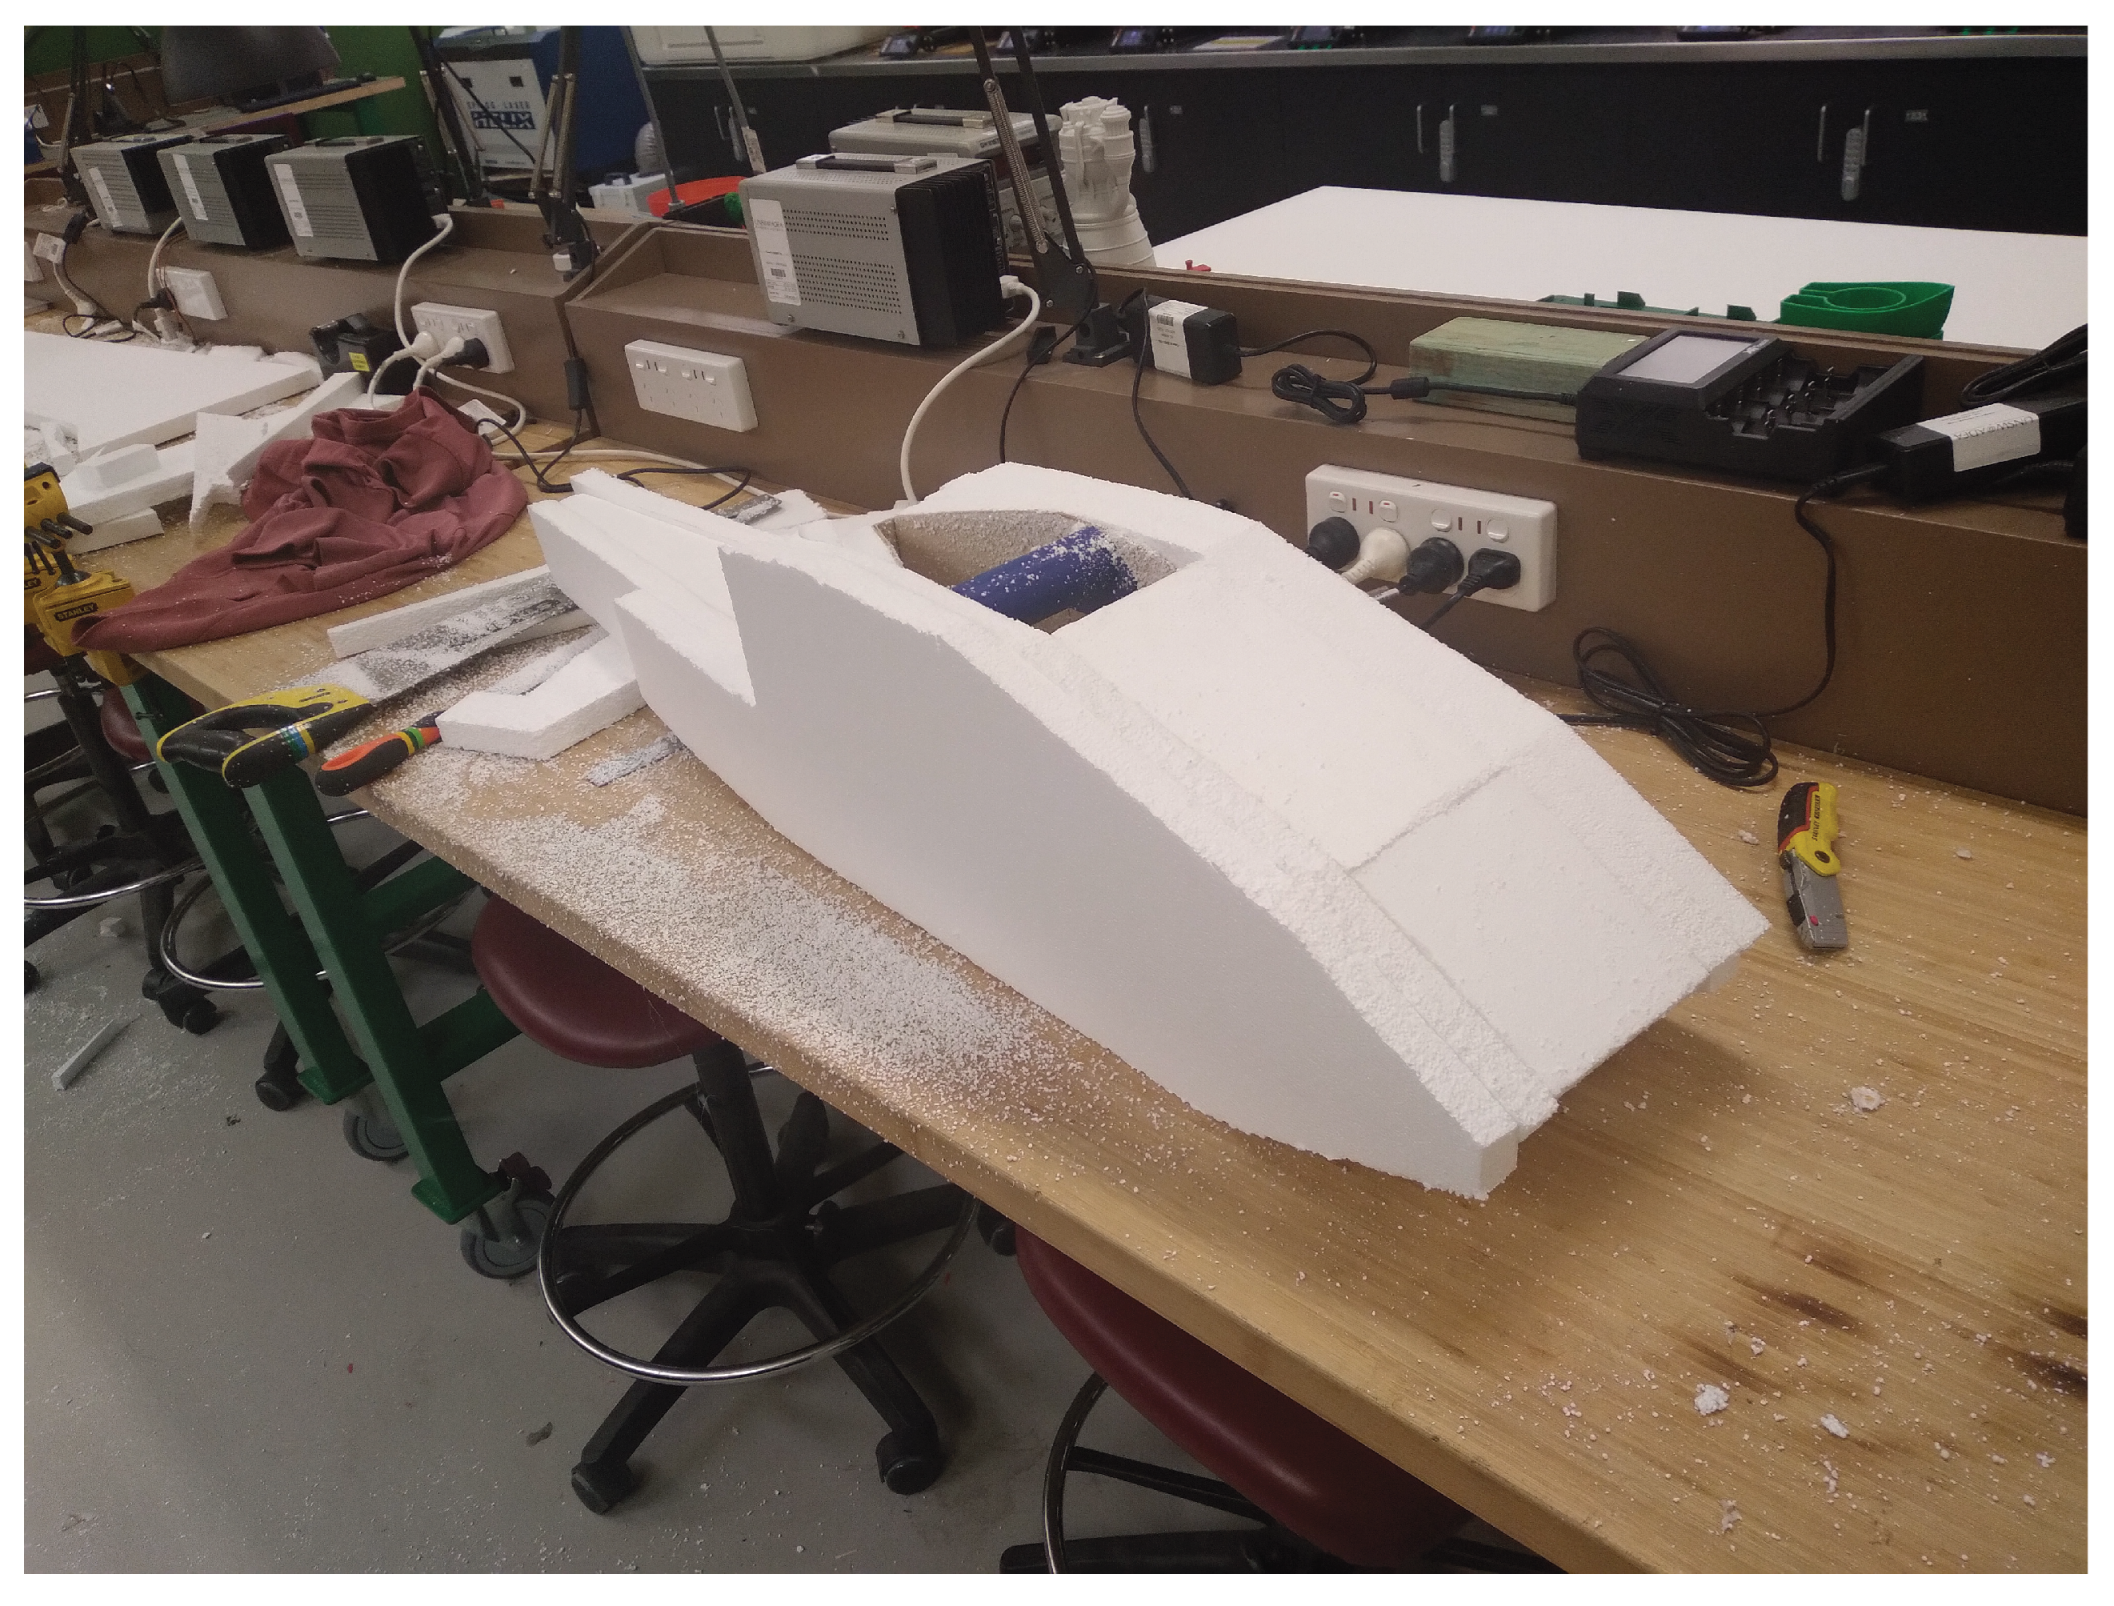
Figure A4.
Fuselage front shaping in progress (own photograph).
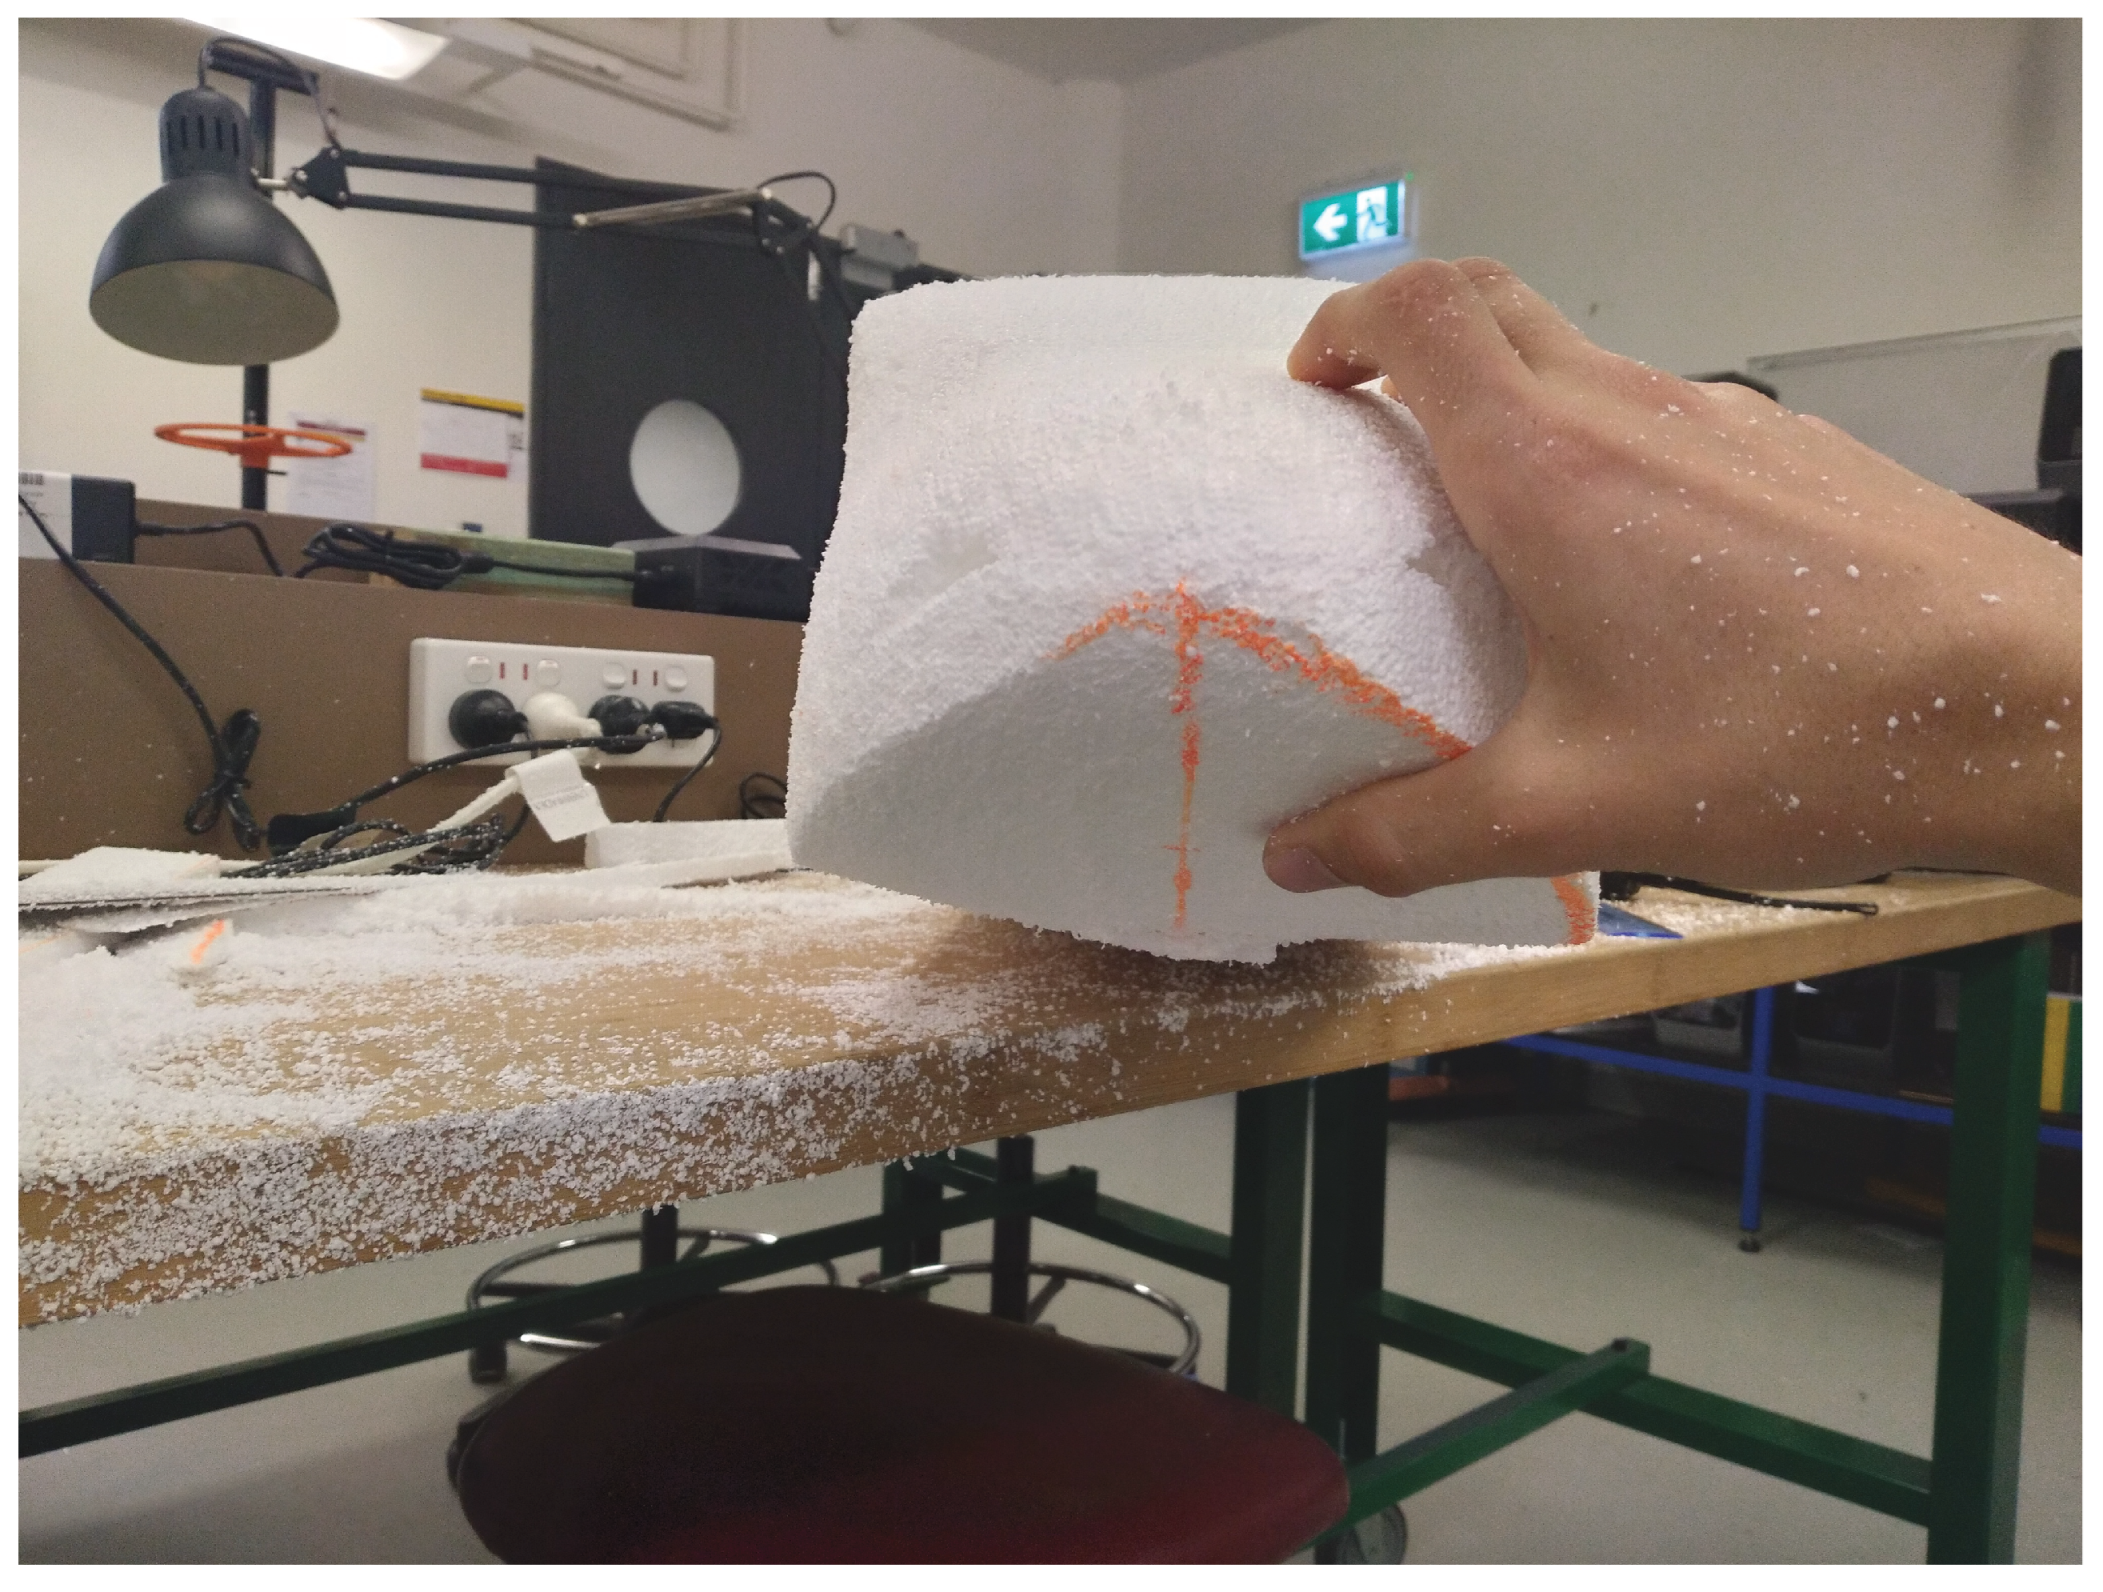
Figure A5.
Final fuselage shape (own photograph).
Appendix A.1.2. Empennage
The empennage was originally constructed in the same manner as the wings, with plywood ribs, spars, fibreglass skin and self-adhesive covering. The final model as built was close to the target weight but required substantial nose weight to reach an acceptable CG location, increasing the total flying weight to over 6.5kg. This weight increase meant the kinematic scaling laws were not met and the flight performance negatively affected. This would particularly make takeoff more difficult, with higher stall speeds, greater volume to displace in water and more mass to accelerate. A replacement horizontal tail, elevator and rudder were built to alleviate this problem. These were constructed with an EPS foam core and a layer of 50gsm plain weave fibreglass cloth with epoxy resin. The foam core was hotwire cut and imperfections sanded smooth before the fibreglass skin was applied. Interfacing parts were 3D-printed to accept the horizontal tail spar and elevator torque transfer rod. These were bonded to the foam core with araldite and some leftover wing skin sheet bonded to the surface as local skin reinforcement, as shown in Figure A6. The original horizontal tail + elevator weighed 348 grams, with the replacement weighing 118 grams. This enabled most of the nose weight to be removed. The new tail is not as rigid as the old and can be seen flexing in gusty flight conditions via onboard camera, but no stress wrinkles were noted on the skin post-flight. Adding another layer of 50gsm glass cloth or using a single layer of 100gsm glass cloth would probably increase the stiffness without adding significant weight if required in future aircraft projects.
Figure A6.
Horizontal tail and elevator joining mechanisms (own photograph).
Appendix A.1.3. Power and Control System
The power system consists of a Propdrive 4258 500kv brushless outrunner electric motor with a 13 x 6 inch propeller in diameter and pitch, respectively. The motor is controlled by a Sunnysky 80 amp electronic speed controller (ESC) and a 5000 mAh, 6-cell 40C lithium polymer battery used to power the system.
The control system used all commercial off-the-shelf components intended for hobby use and thus readily available. A Flysky FS-i6X transmitter was paired with an FS-iA10B receiver onboard the aircraft, to which the ESC and servo actuators interface, as shown in Figure A7. The flight control surfaces are actuated with pushrods connecting the servos to the control surfaces via 3D-printed control horns, shown in Figure A8.
Figure A7.
Control system diagram (own flowchart).
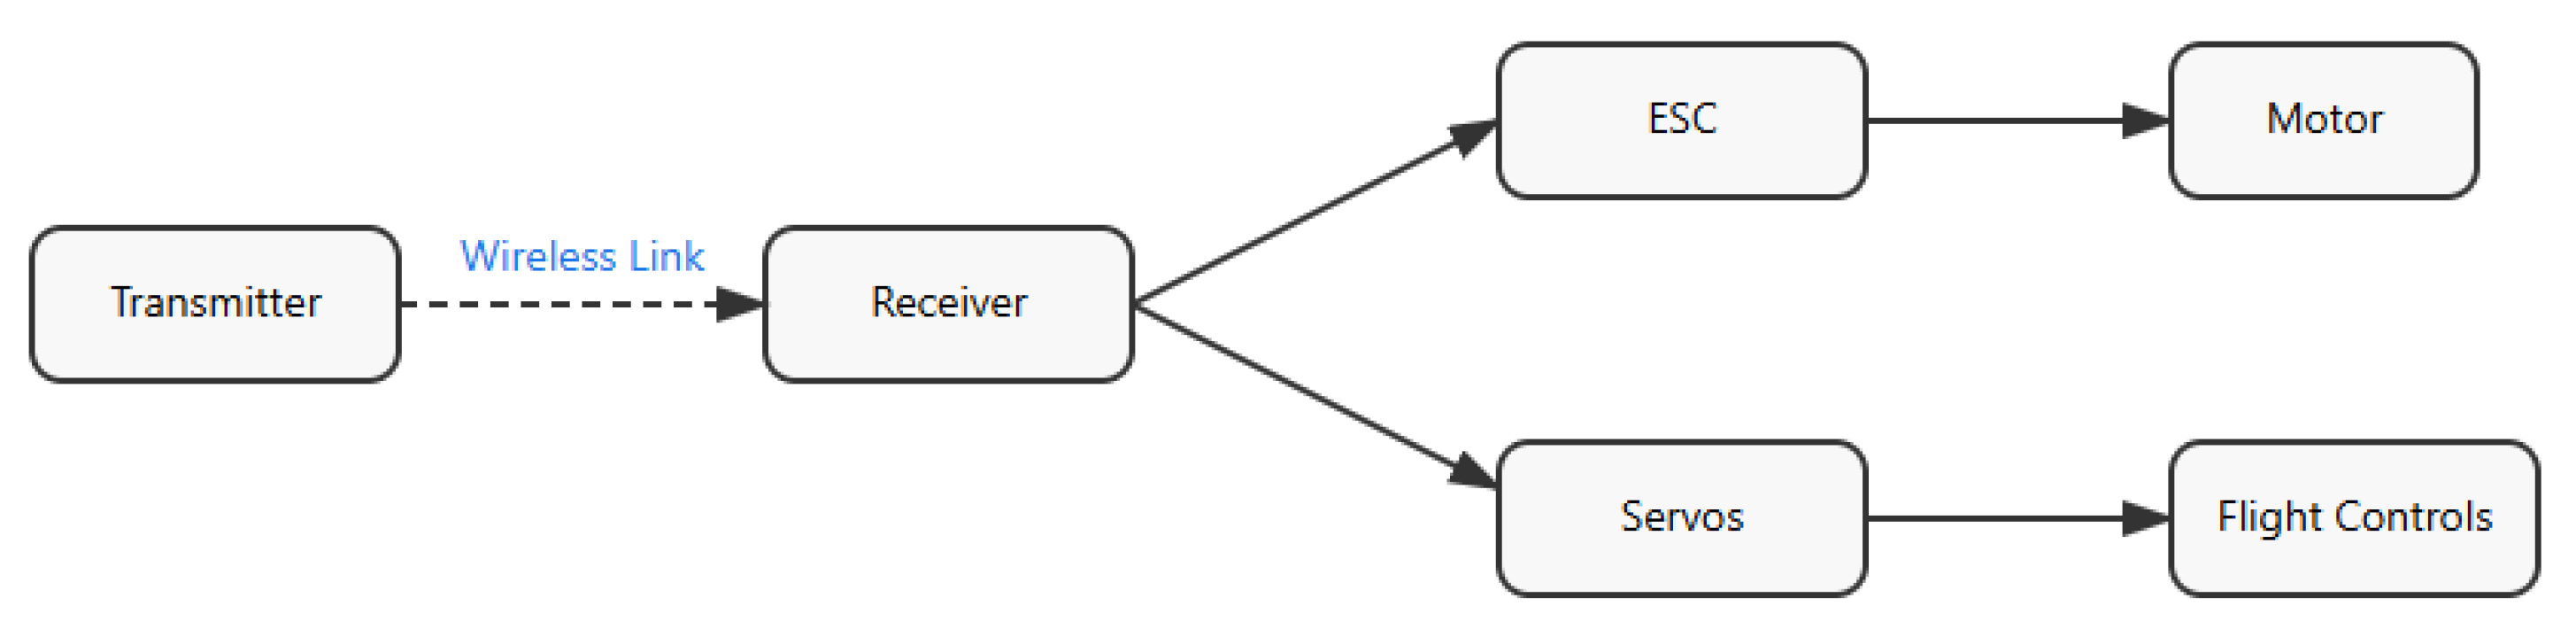
Figure A8.
Pushrod flight control linkages (own photograph).
Appendix A.1.4. Bill of Materials
| Item | Supplier | Cost | Comments |
| Airframe | |||
| 3mm plywood – 1200x810mm | Bunnings | $19 | Fuselage, ribs, motor mount |
| EPS foam – 1200x2400x25mm | Bunnings | N/A | Fuselage shaping |
| 5min epoxy | Bunnings | $5.30 | Adhesive |
| Glass fibre cloth – 200gsm | Trojan Fibreglass | N/A | Fuselage waterproofing, wing skin |
| Epoxy resin | Trojan Fibreglass | N/A | Fuselage waterproofing |
| Vinylester resin | Trojan Fibreglass | N/A | Wing skins |
| PLA filament | UNSW Canberra | N/A | Small hardware items |
| Control System | |||
| Corona CS239MG servos x3 | Hobbyking | $47 | Control surface actuators |
| Hitec HS-422 servos x4 | Self | N/A | Control surface/pontoon retract actuators |
| SG90 micro servos x2 | Banggood | N/A | Hull step/rudder actuators |
| Flysky FS-i6X Transmitter | Banggood | $70 | |
| Flysky FS-iA10B Receiver | Banggood | $15 | |
| Propulsion System | |||
| Propdrive 42-58 500kV motor | Hobbyking | $64 | |
| APC 13 x 8 propeller | Modelflight | $22 | |
| 80A Sunnysky ESC | Banggood | $61 | |
| Turnigy 5000mAh 6s 40c lipo battery x2 | Hobbyking | $113 | |
| DAQ System | |||
| M10C-180 GPS Module | Banggood | $11 | Speed measurement |
| FX293X-100A-0010-L Load Cell | RS Components | $47 | Thrust measurement |
| Arduino Nano | Jaycar | N/A | Data recording |
| Micro SD card | – | N/A | Onboard hard drive |
| Miscellaneous | |||
| iMax B6 80W charger | Banggood | $36 | |
| 4mm banana plugs | Hobbyking | $12 | |
| XT90 connector | Banggood | $6 | |
| Total cost: | $528 | ||
| Cost without battery, charger, Tx/Rx: | $289 | ||
Appendix B. Supplementary Flight Data

Table A1.
Individual run speeds.
| Config. | Description | Test No. | Duration (s) | Distance (m) | Average Speed (m/s) |
|---|---|---|---|---|---|
| 1 | Pontoons extended, fairing off (Baseline) | 1 | 15 | 404.0 | 26.9 |
| 2 | 18 | 526.1 | 29.2 | ||
| 3 | 17 | 499.3 | 29.4 | ||
| 4 | 12 | 320.8 | 26.7 | ||
| 2 | Pontoons up, fairing off | 1 | 17 | 509.0 | 29.9 |
| 2 | 17 | 532.8 | 31.3 | ||
| 3 | 23 | 692.8 | 30.1 | ||
| 4 | 10 | 302.6 | 30.3 | ||
| 5 | 10 | 302.3 | 30.2 | ||
| 6 | 15 | 425.0 | 28.3 | ||
| 3 | Pontoons up, fairing on | 1 | 9 | 262.4 | 29.2 |
| 2 | 14 | 394.1 | 28.2 | ||
| 3 | 11 | 325.5 | 29.6 | ||
| 4 | 14 | 409.9 | 29.3 | ||
| 5 | 10 | 295.0 | 29.5 |
Appendix C. Thrust Sensing Calibration Supplementary Data
Figure A9.
Thrust calibration setup (own photograph).
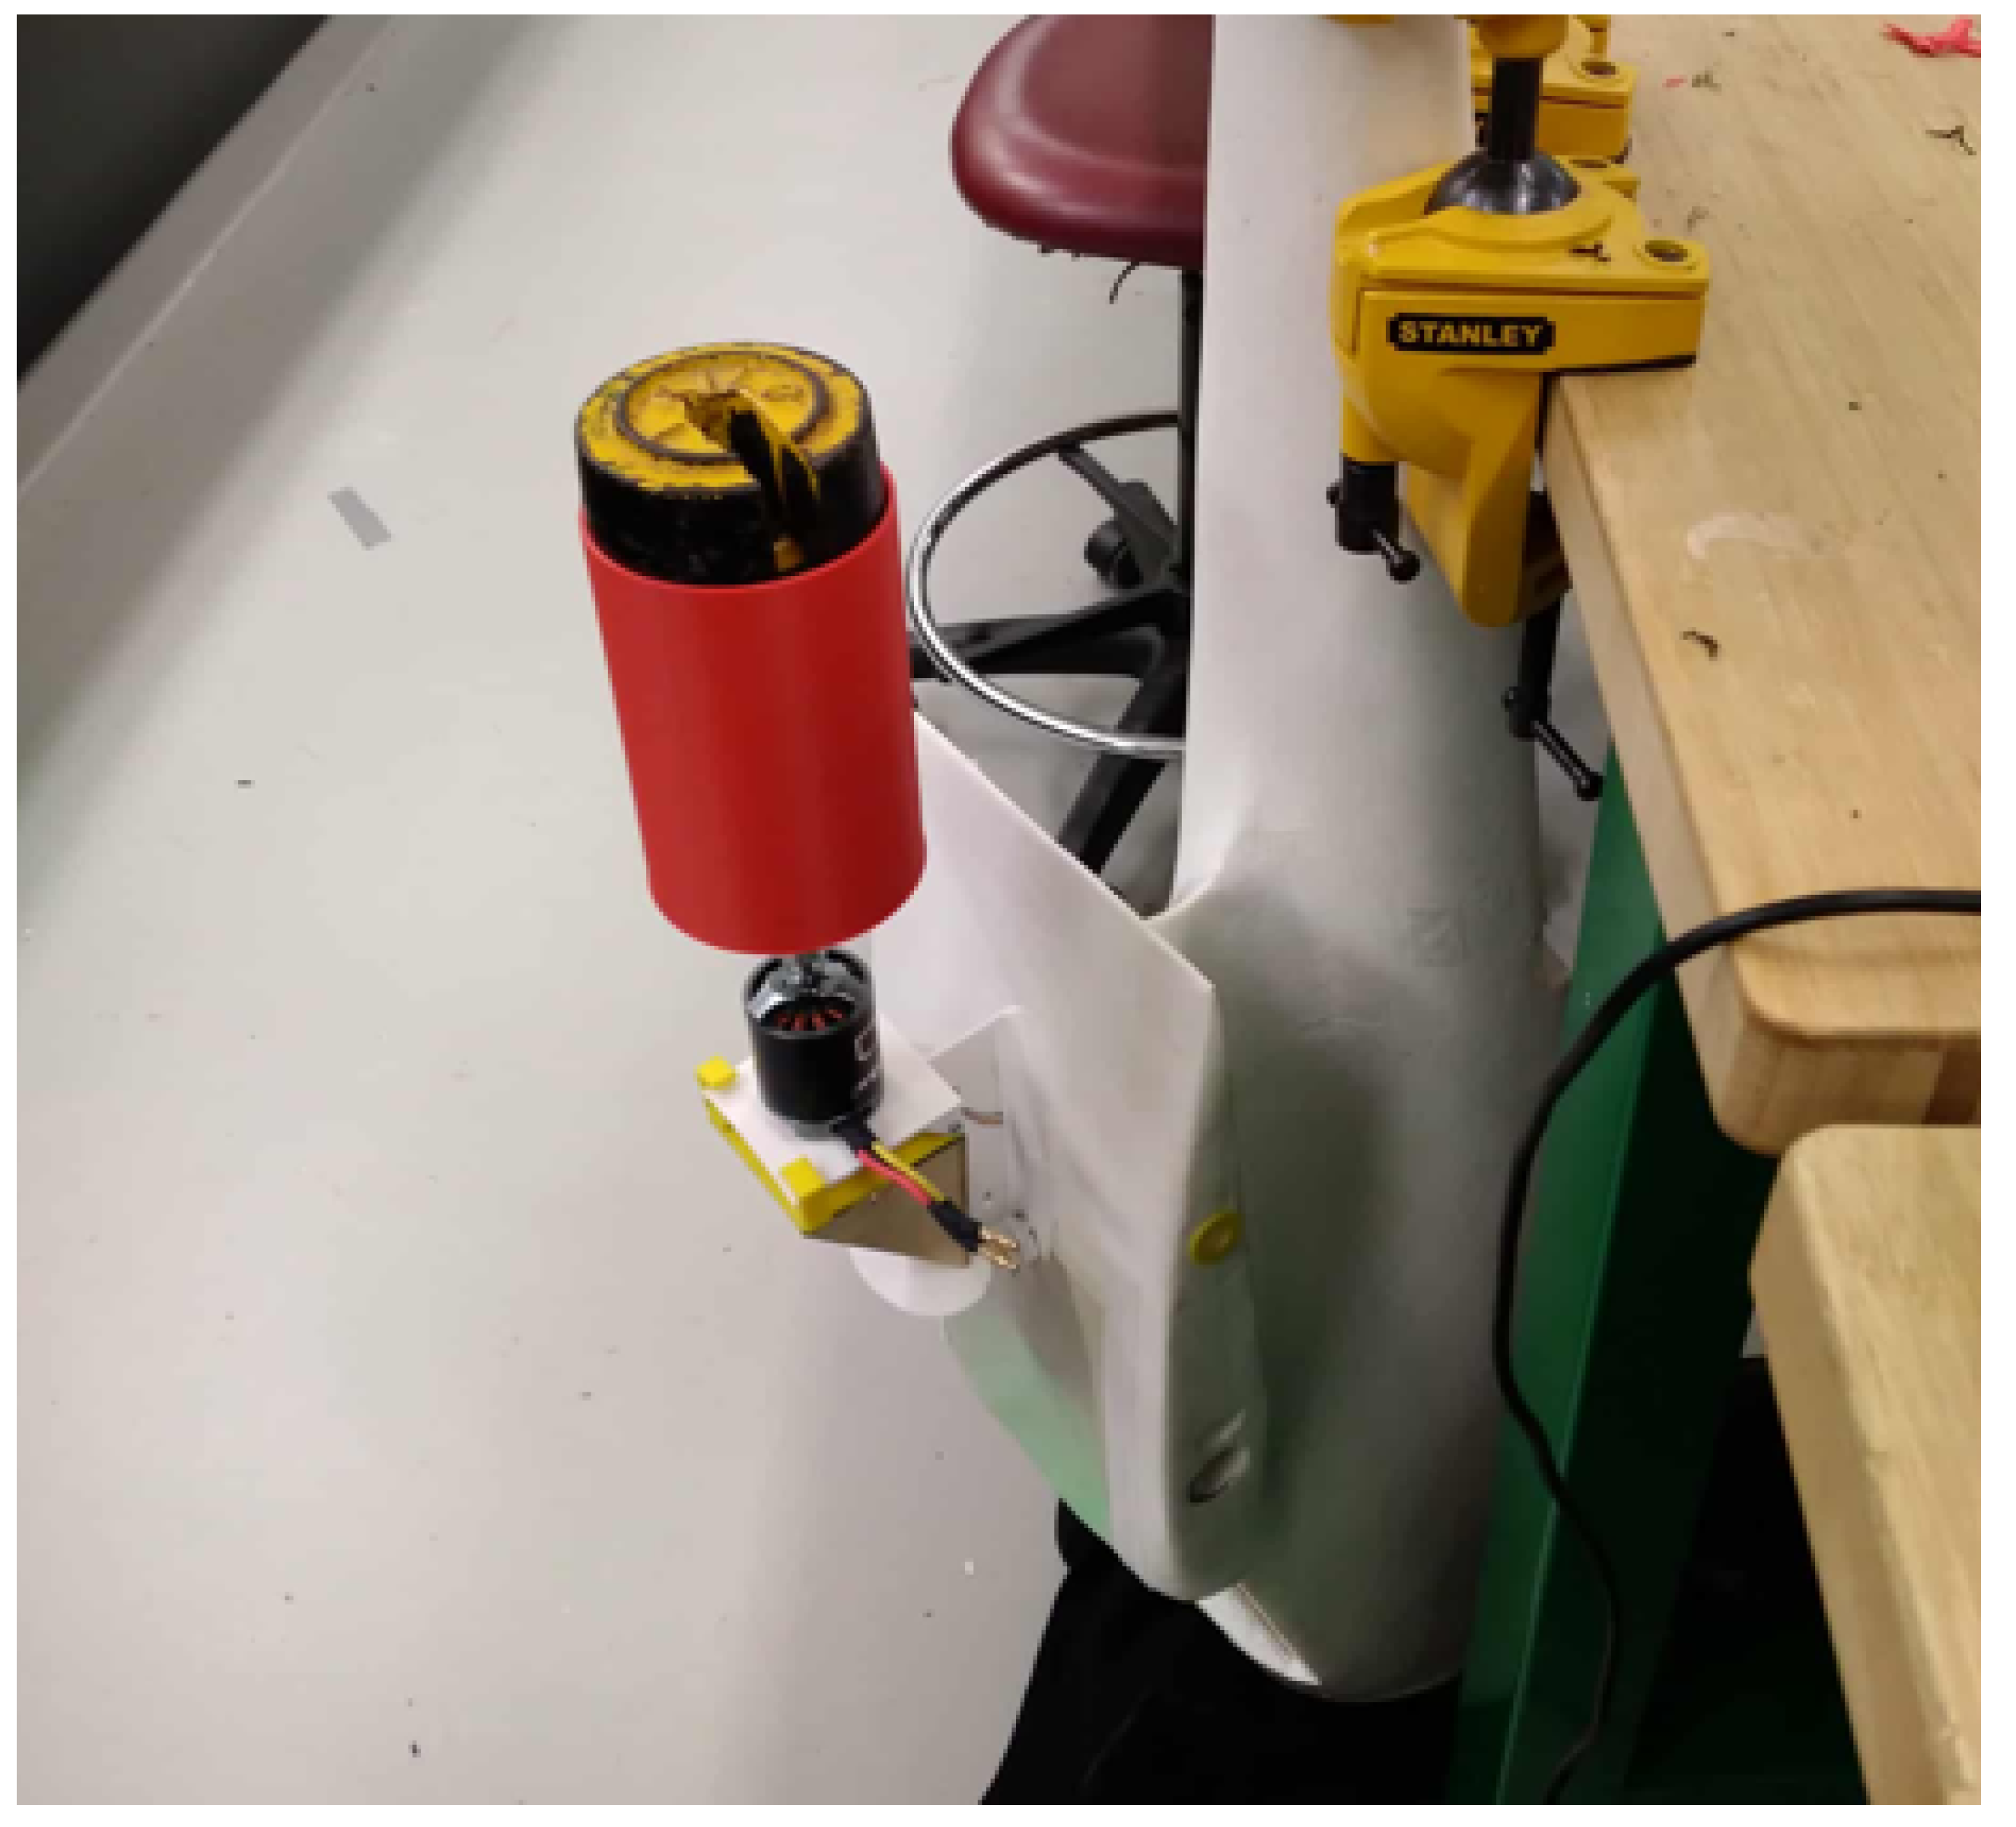
Figure A10.
Thrust sensor calibration raw data (own plot).
References
- Civil Aviation Safety Authority. Light Sport Aircraft. https://www.casa.gov.au/aircraft/sport-aviation/light-sport-aircraft, n.d. Accessed: 2025-10-09.
- European Union Aviation Safety Agency. Light Sport Aircraft FAQs. https://www.easa.europa.eu/en/the-agency/faqs/light-sport-aircraft, n.d. Accessed: 2025-10-09.
- Electronic Code of Federal Regulations. Title 14, Chapter I, Part 1, Section 1.1 – General Definitions. https://www.ecfr.gov/current/title-14/chapter-I/subchapter-A/part-1/section-1.1, n.d. Accessed: 2025-10-09.
- Kevin. FAA MOSAIC Final Rule: What Pilots, Manufacturers, and the Aviation Community Need to Know. https://www.aviatortips.com/faa-mosaic-final-rule-what-pilots-manufacturers-and-the-aviation-community-need-to-know, 2025. Accessed: 2025-10-09.
- Federal Aviation Administration. Modernization of Special Airworthiness Certification (MOSAIC) Final Rule. https://www.faa.gov/newsroom/MOSAIC_Final_Rule_Issuance.pdf, 2025. Accessed: 2025-10-09.
- Civil Aviation Safety Authority. Increasing Sport and Recreational Opportunities, 2025. Accessed: 9 October 2025.
- SeaMax Aircraft. SeaMax M-22 Specifications. https://www.seamaxaircraft.com/specs, n.d. Accessed: 2025-05-19.
- ICON Aircraft. A5 Amphibious Sport Aircraft. https://www.iconaircraft.com/a5, n.d. Accessed: 2025-05-19.
- Plane & Pilot Magazine. ICON A5 Review. https://www.planeandpilotmag.com/article/icon-a5, n.d. Accessed: 2025-05-19.
- AOPA. Progressive Aerodyne SeaRey. https://www.aopa.org/go-fly/aircraft-and-ownership/aircraft-guide/aircraft/progressive-aerodyne-searey, n.d. Accessed: 2025-05-19.
- Super Petrel USA. Super Petrel LS. https://superpetrelusa.com, n.d. Accessed: 2025-05-19.
- Aero Adventure Aircraft. Aventura II. https://www.airtech.tech/en/aero-aventura, n.d. Accessed: 2025-05-19.
- Colyaer SL. Freedom Amphibious Aircraft. https://www.colyaer.com, n.d. Accessed: 2025-05-19.
- Atol Aviation. ATOL Amphibious Aircraft. https://www.atolaviation.com, n.d. Accessed: 2025-05-19.
- Saugen, J. Aerodynamic Optimization of a Flying Boat Hull. https://ntnu.no, 2024. no.ntnu:inspera:253416236:64323149, Accessed: 2025-05-19.
- Riebe, J.M.; Naeseth, R.L. Effect of Aerodynamic Refinement on the Aerodynamic Characteristics of a Flying-boat Hull. Technical report, NACA, 1947. Accessed: 2025-05-19.
- Lina, L.J. The Use of a Retractable Planing Flap Instead of a Fixed Step – A Seaplane. Technical report, NACA, 1943. Classic technical report on retractable planing flaps for seaplane drag reduction.
- Coombes, L.P.; Clark, K.W. The Air Drag of Hulls: The Effect of Alterations in the Main Dimensions and Various Detail Features. Aircraft Engineering and Aerospace Technology 1937, 9, 315–328. [CrossRef]
- Hartmann, E. The Aerodynamic Drag of Flying Boat Models as Measured in the N.A.C.A 20-foot Wind Tunnel. Technical report, NACA, 1935.
- Lowry, J.G.; Riebe, J.M. Effect of Length-Beam Ratio on the Aerodynamic Characteristics of Flying-Boat Hulls without Wing Interference. Technical report, NACA, 1948. Accessed: 2025-05-19.
- Yates, C.C.; Riebe, J.M. Effect of Length-Beam on the Aerodynamic Characteristics of Flying-Boat Hulls. Technical report, NACA, 1947. UNT Digital Library, local-cont-no: 93R11227.
- Smith, A.G.; Attenborough, J.E. Water and Air Performance of Seaplane Hulls as Affected by Fairing and Fineness Ratio. Technical Report RM.2896, Aeronautical Research Council, 1950.
- User, R. Why the step circled in the picture found in almost seaplanes—does this step cause aerodynamic deficiency after take-off? https://www.researchgate.net/post/Why-the-step-circled-in-the-picture-found-in-almost-seaplanes-does-this-step-cause-aerodynamic-deficiency-after-take-off, 2016. Accessed: 2025-10-22.
- Smith, A.G. The Full-Scale Air Drag of Some Flying-Boat Seaplanes. Technical report, Cranfield University, Aerodynamics Research Centre, 1959. Accessed: 2025-06-16.
- Hartman, E.P. The Aerodynamic Drag of Flying-boat Hull Model as Measured in the NACA 20-foot Wind Tunnel I. Technical report, NACA, 1935. Accessed: 2025-05-19.
- Smith, D.E. Retractable step fairing for amphibian airplane. US6042052A, 2000. Granted Mar. 28, 2000; priority filed Sep. 25, 1998.
- Academy, U.N. 10 - Early Stage Sizing, 2024. Accessed: 2025-10-09.
- Gudmundsson, S. General Aviation Aircraft Design: Applied Methods and Procedures, 2nd ed.; Butterworth-Heinemann: Oxford, UK, 2022.
- Anoop, G.; Meharu, G.; Rajesh, A.K. Conceptual Design of Amphibious Aircraft. Technical report, Aircraft Research and Design Centre, Hindustan Aeronautics Limited (HAL), Bangalore, India, 2017.
- Saunders Roe SR/A-1. https://www.secretprojects.co.uk/threads/saunders-roe-sr-a-1.36245/, 2020. Accessed: 2025-05-19.
- PBY Specifications. https://pbycatalina.com/specifications/, n.d. Accessed: 2025-05-19.
- Kightly, J.; Pemberton, R. An In-Depth Look at the Grumman Goose. Key Aero, Key Publishing Ltd, 2022. Accessed: 2025-10-08.
- Wilson, T. Nothing Small About This Amphibian - KITPLANES. https://www.kitplanes.com/nothing-small-about-it/, 2024. Accessed: 2025-05-19.
- Hoerner, S.F. Fluid-Dynamic Drag; Hoerner Fluid Dynamics, 1985.
- Hoerner, S.F. Fluid-Dynamic Lift; Internet Archive, 2019. Accessed: 2025-05-19.
- Haines, A.B.; Rhodes, C.W. Tests in the R. E. A. 10 ft x 7 ft High-Speed Wind Tunnel on Drop Tanks Fitted to Two Swept-Back Wings. Technical report, Royal Aircraft Establishment (R.A.E.), 1952.
- Salter, C.; Jones, R. Tests on a Sweep-Back Wing and Body with End Plates and Wing Tip Tanks in the Compressed Air Tunnel. Technical report, Ministry of Supply, 1954.
- Tinling, B.E.; Kolk, W.R. The Effects of Mach Number and Reynolds Number on the Aerodynamic Characteristics of Several 12-Percent-Thick Wings Having 35° of Sweepback and Various Amounts of Camber. Technical report, NACA, 1951.
- Tinling, B.E.; Kolk, W.R. The Effects of Centrally Mounted Wing-Tip Tanks on the Subsonic Aerodynamic Characteristics of a Wing of Aspect Ratio 10 With 35° of Sweepback. Technical report, NACA, 1951.
- Rogers, D.F. Comparative Flight Tests with and Without Tip Tanks. Technical report, U.S. Naval Academy, 2007.
- Greenwell, D. A Review of Unsteady Aerodynamic Modelling for Flight Dynamics of Manoeuvrable Aircraft. In Proceedings of the AIAA Atmospheric Flight Mechanics Conference and Exhibit. American Institute of Aeronautics and Astronautics, 2004, p. 5276. [CrossRef]
- Ghoreyshi, M.; Badcock, K.J.; Ronch, A.D.; Marques, S.; Swift, A.; Ames, N. Framework for Establishing Limits of Tabular Aerodynamic Models for Flight Dynamics Analysis. Journal of Aircraft 2011, 48, 42–55.
- Kulkarni, A.R.; Varriale, C.; Voskuijl, M.; Rocca, G.L.; Veldhuis, L.L. Assessment of Sub-scale Designs for Scaled Flight Testing. In Proceedings of the AIAA Aviation 2019 Forum, American Institute of Aeronautics and Astronautics, Dallas, TX, USA, 2019. Accessed: 2025-10-09, . [CrossRef]
- Daugherty, J.C. Ames Unitary Plan Wind Tunnel Blockage Recommendations, 1984. Accessed: 2025-10-08.
- The Loop Newspaper. VariViggen — Burt Rutan’s First Homebuilt Aircraft Design, 2019. Accessed: 2025-10-09.
- Cox, J. Burt Rutan: An EAA Perspective. https://burtrutan.com/downloads/BurtRutanEAAPerspectiveJackCox.pdf, 2011. Accessed: 16 October 2025.
- Factory, R.A. VariEze–Long-EZ Performance Data Summary. Technical report, Aero Resources, Inc., 1987. Available at https://aeroresourcesinc.com/uploads/198708-1987%20VariEze-Long-EZ.pdf.
- Kulkarni, A.R.; Voskuijl, M.; Varrialle, C.; La Rocca, G.; Veldhuis, L.L.M. Flight Testing Stability and Controllability Otto Lilienthal’s Monoplane Design from 1893. In Proceedings of the AIAA AVIATION Forum, 2019. Accessed: 2025-05-19.
- Ananda, G.K.; Vahora, M.; Dantsker, O.D.; Selig, M.S. Design Methodology for a Dynamically-Scaled General Aviation Aircraft. In Proceedings of the 35th AIAA Applied Aerodynamics Conference, 2017. Accessed: 2025-05-19.
- Rocha, A.C.S.e.a. Takeoff Parameter Estimation for a Subscale Flight Test of an Amphibious Floatplane. Manuscript in preparation – citation details unavailable.
- Chambers, J.R.; III, H.P.S. Summary of NASA Stall/Spin Research for General Aviation Configurations. In Proceedings of the Proceedings of the AIAA/Aerospace Sciences Meeting, American Institute of Aeronautics and Astronautics, Reno, NV, 1986; Number AIAA 86-2597. [CrossRef]
- Cunningham, K.; Foster, J.V.; Morelli, E.A.; Murch, A.M. Practical Application of a Subscale Transport Aircraft for Flight Research in Control Upset and Failure Conditions. In Proceedings of the Proceedings of the AIAA/Aerospace Sciences Meeting. American Institute of Aeronautics and Astronautics, 2008, number AIAA Paper No. 2008-34480. Accessed: 2025-10-22.
- Cox, D.E.; Cunningham, K.; Jordan, T.L. Subscale Flight Testing for Aircraft Loss of Control: Accomplishments and Future Directions. In Proceedings of the Proceedings of the AIAA Guidance, Navigation, and Control Conference. American Institute of Aeronautics and Astronautics, 2012, number AIAA Paper 2012-5029. Accessed: 2025-10-22.
- Kulkarni, A.R.; La Rocca, G.; Veldhuis, L.L.M. Degree of Similitude Estimation for Sub-Scale Flight Testing. In Proceedings of the AIAA Scitech 2019 Forum, 2019. Accessed: 2025-05-19.
- of Technology Bombay, I.I. CE223 – Lecture 29: Boundary Layers. Lecture slides, 2024. Available online.
- Wassgren, C. Boundary Layers – Laminar Boundary Layers. Lecture Notes / Technical Report ME30800, Purdue University, School of Engineering and Technology, 2010. Last updated 14 August 2010.
- Aero-ComLab, S.U. Airfoil Design. Lecture notes, Stanford University, Department of Aeronautics & Astronautics, 2010. Available online.
- Winslow, J.; Otsuka, H.; Govindarajan, B.; Chopra, I. Basic Understanding of Airfoil Characteristics at Low Reynolds Numbers (104–105). Journal of Aircraft 2018, 55, 1067–1080. [CrossRef]
- Czernia, O.C.D.; Szyk, B. Air Density Calculator. https://www.omnicalculator.com/physics/air-density, n.d. Accessed: 2025-10-13.
- Śmietańska, J. Kinematic Viscosity of Air Calculator. https://www.omnicalculator.com/physics/kinematic-viscosity-of-air, n.d. Accessed: 2025-10-15.
- Hepperle, M. Turbulators (Boundary-Layer Trips), 1996. Accessed: 2025-10-24.
- TE Connectivity Product Datasheet 20009605-12. https://www.te.com/usa-en/product-20009605-12.datasheet.pdf, n.d. Accessed: 2025-06-16.
- UBX NEO-7 GPS Module Datasheet. https://au.mouser.com/datasheet/2/1025/NEO_7_DataSheet__UBX_13003830_-2010064.pdf, 2014. Accessed: 2025-06-16.
- Norton, M. Uncertainty Analysis. Technical report, Southern Illinois University Edwardsville, 2010.
- PropDrive V2 4258 500KV Reversed Shaft Brushless Outrunner Motor. https://hobbyking.com/en_us/propdrive-v2-4258-500kv-reversed-shaft-brushless-outrunner-motor.html, n.d. Accessed: 2025-06-16.
- Gong, A.; Verstraete, D. Development of a Dynamic Propulsion Model for Electric UAVs. In Proceedings of the Proceedings of the 7th Asia-Pacific International Symposium on Aerospace Technology (APISAT 2015), Cairns, Australia, November 2015. Accessed: 12 October 2025.
- SeaMax Aircraft. M-22 System Pilot Operating Handbook: With Engine ULS, n.d. Retrieved from https://www.seamaxaircraft.com/support.
- BRP-Rotax GmbH & Co. KG. Operators Manual for Rotax Engine Type 912 Series. Gunskirchen, Austria, edition 4, revision 2 ed., 2025. Retrieved from https://www.flyrotax.com/p/service/technical-documentation.
- BRP-Rotax GmbH & Co. KG. Operators Manual for Rotax Engine Type 916 i A/C24 Series. Gunskirchen, Austria, edition 0, revision 1 ed., 2023. Retrieved from https://www.flyrotax.com/p/service/technical-documentation.
- SpeedyBee. SpeedyBee F405 WING MINI Fixed Wing Flight Controller. https://www.speedybee.com/speedybee-f405-wing-mini-fixed-wing-flight-controller/, n.d. Accessed: 2025-10-22.
Figure 11.
Sub-scale Model top view (own figure).
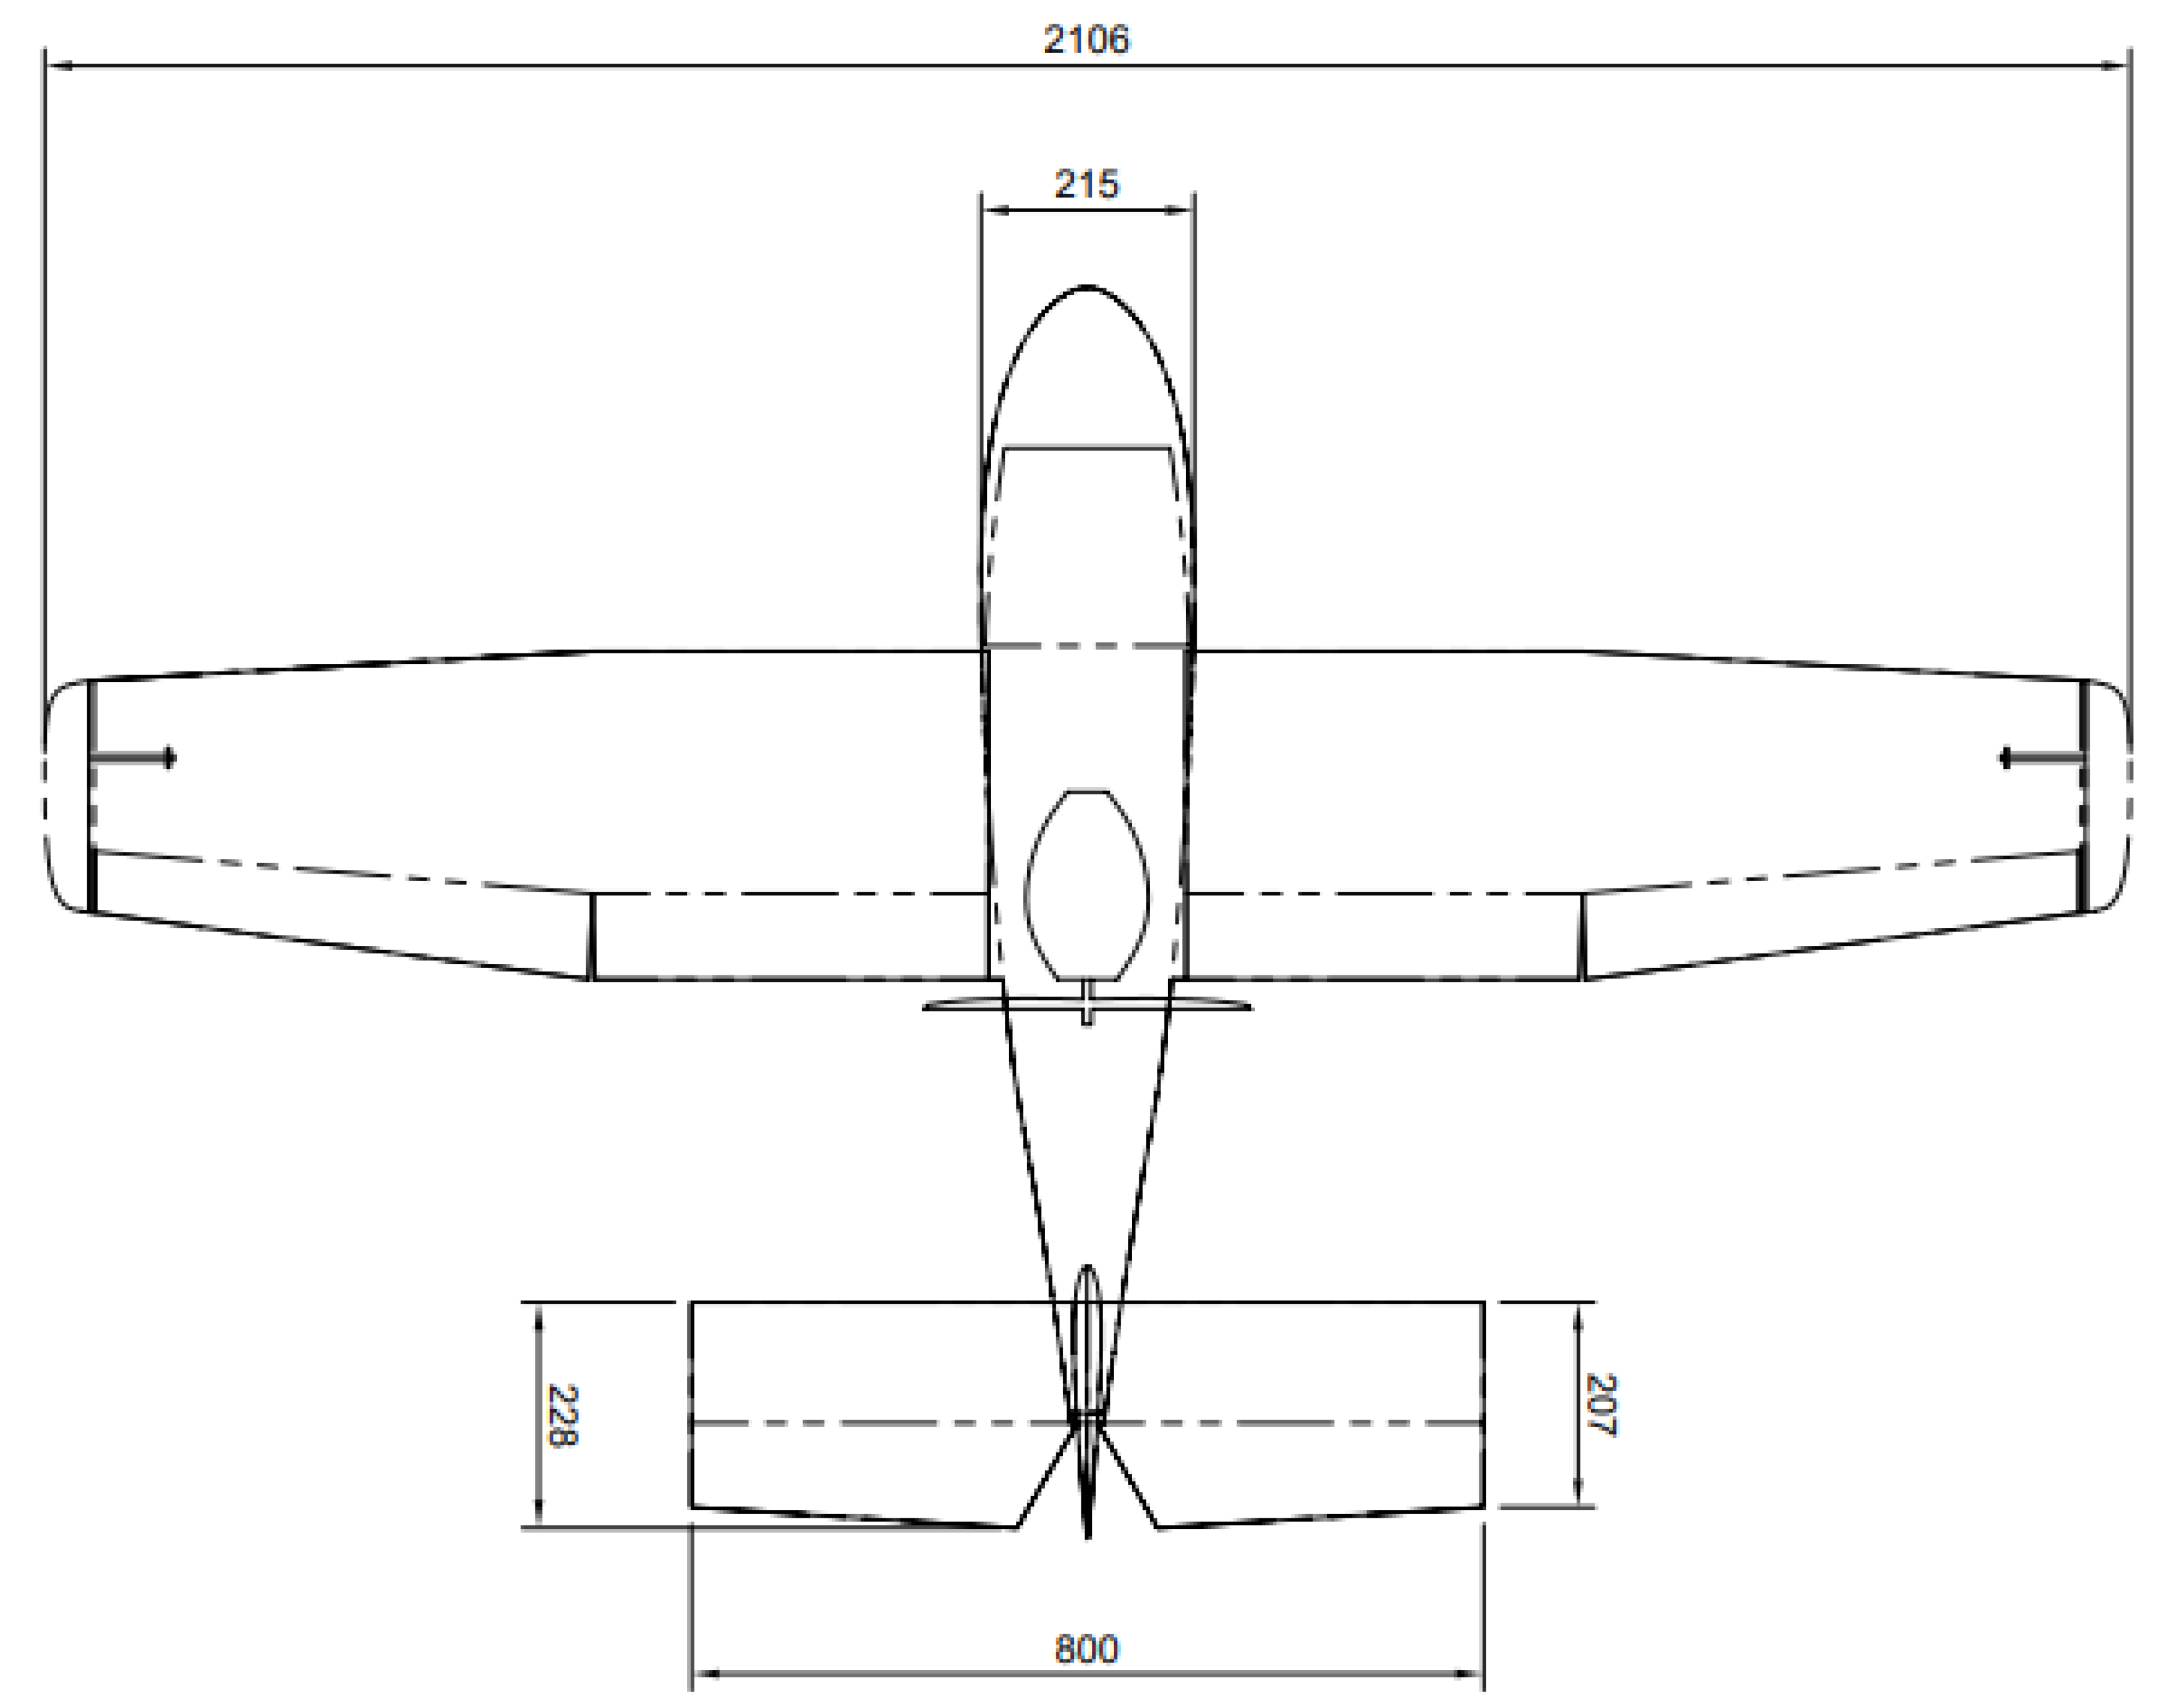
Figure 12.
Sub-scale Model side view (own figure).
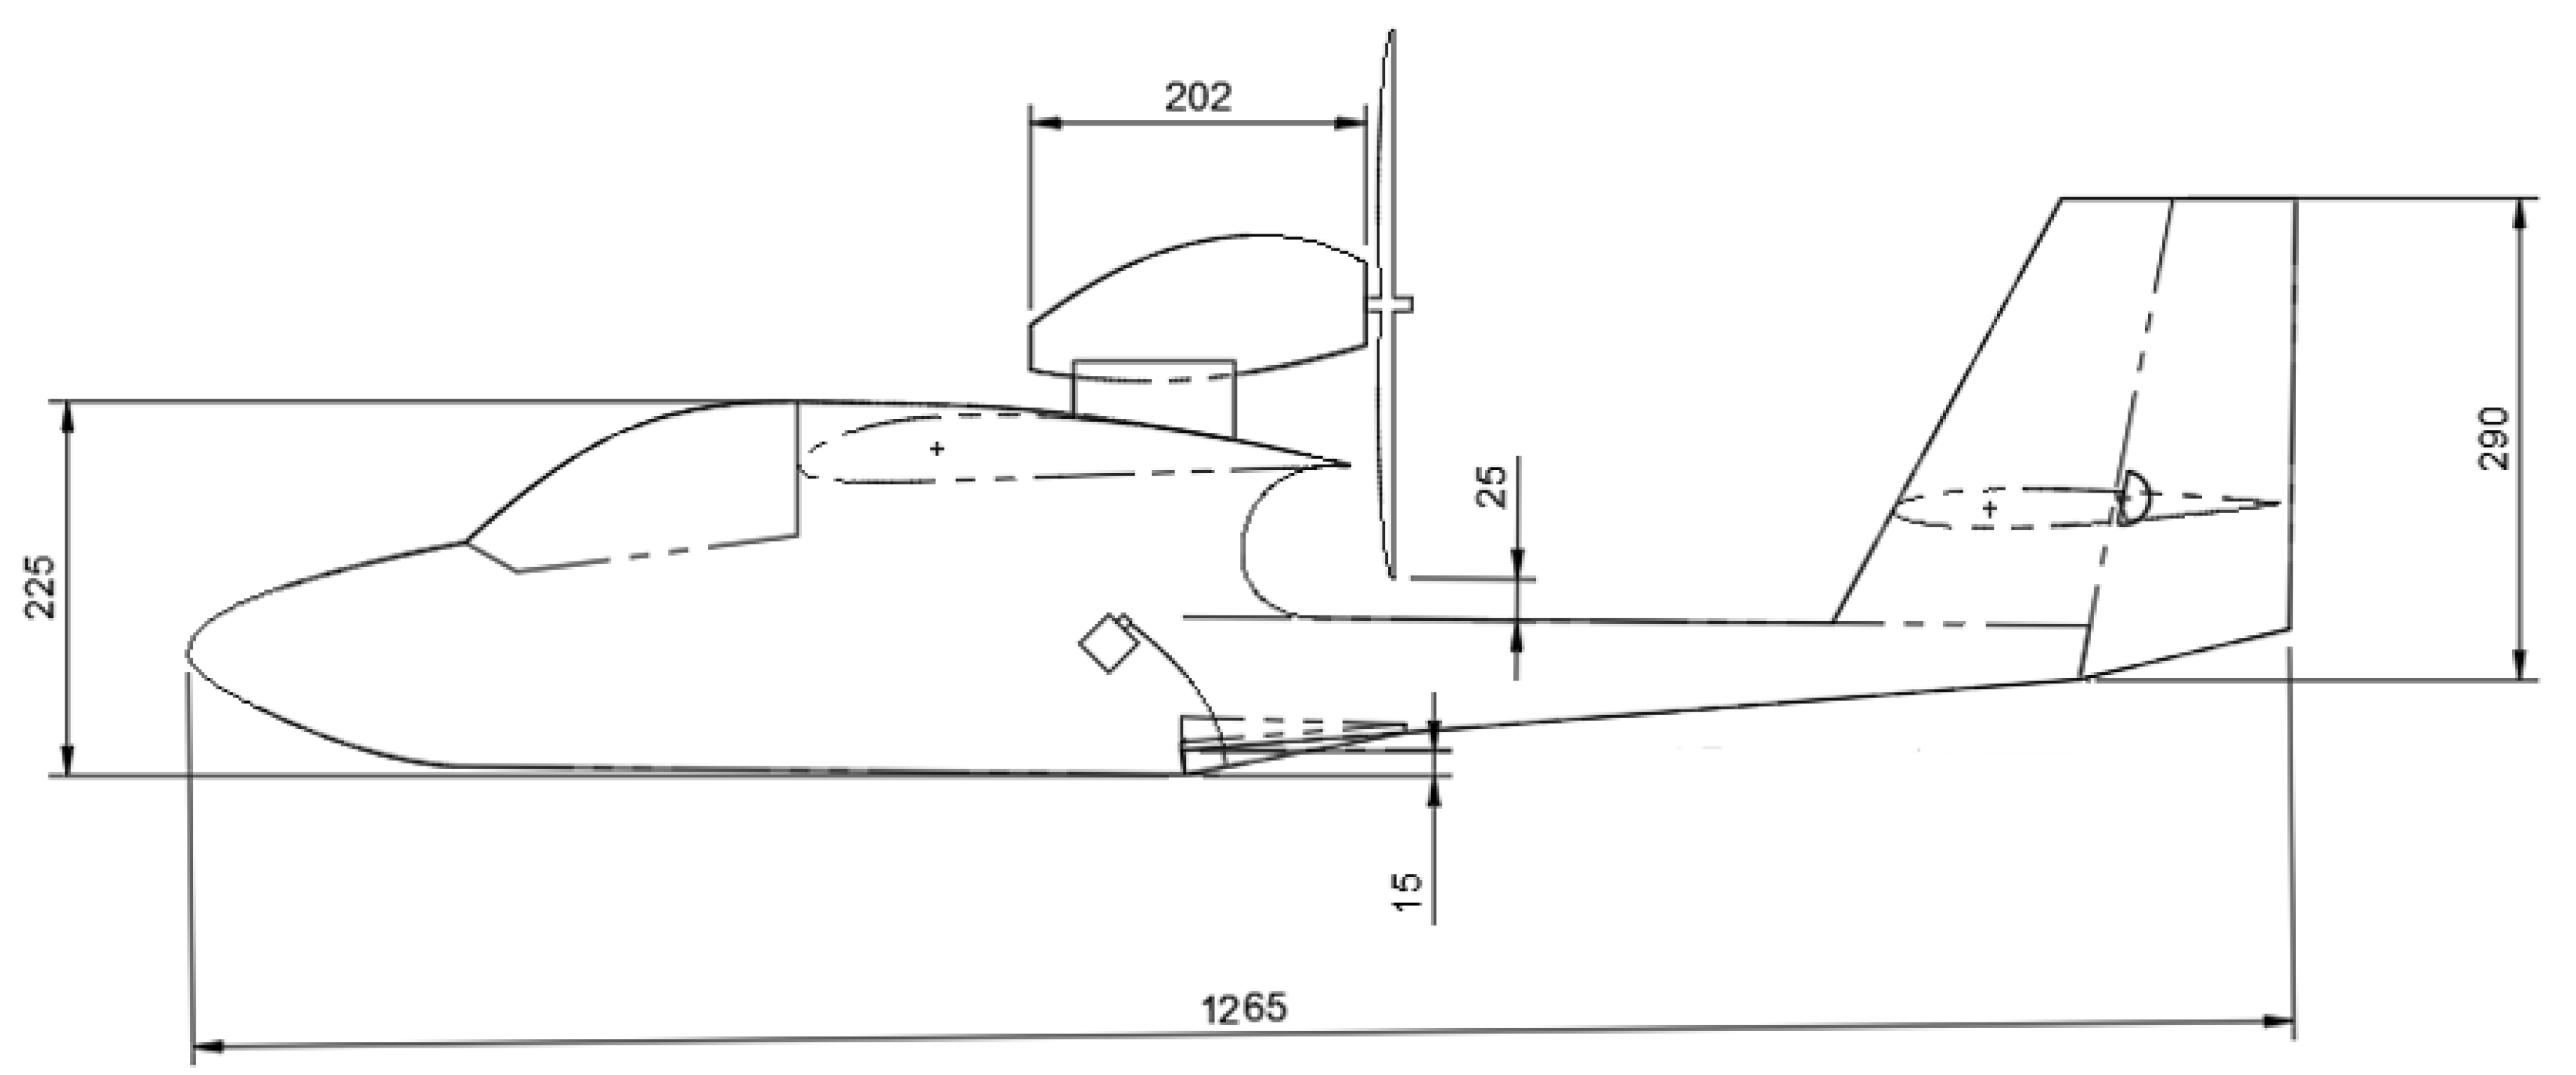
Figure 13.
Extended and retracted wingtip pontoons (own photographs).
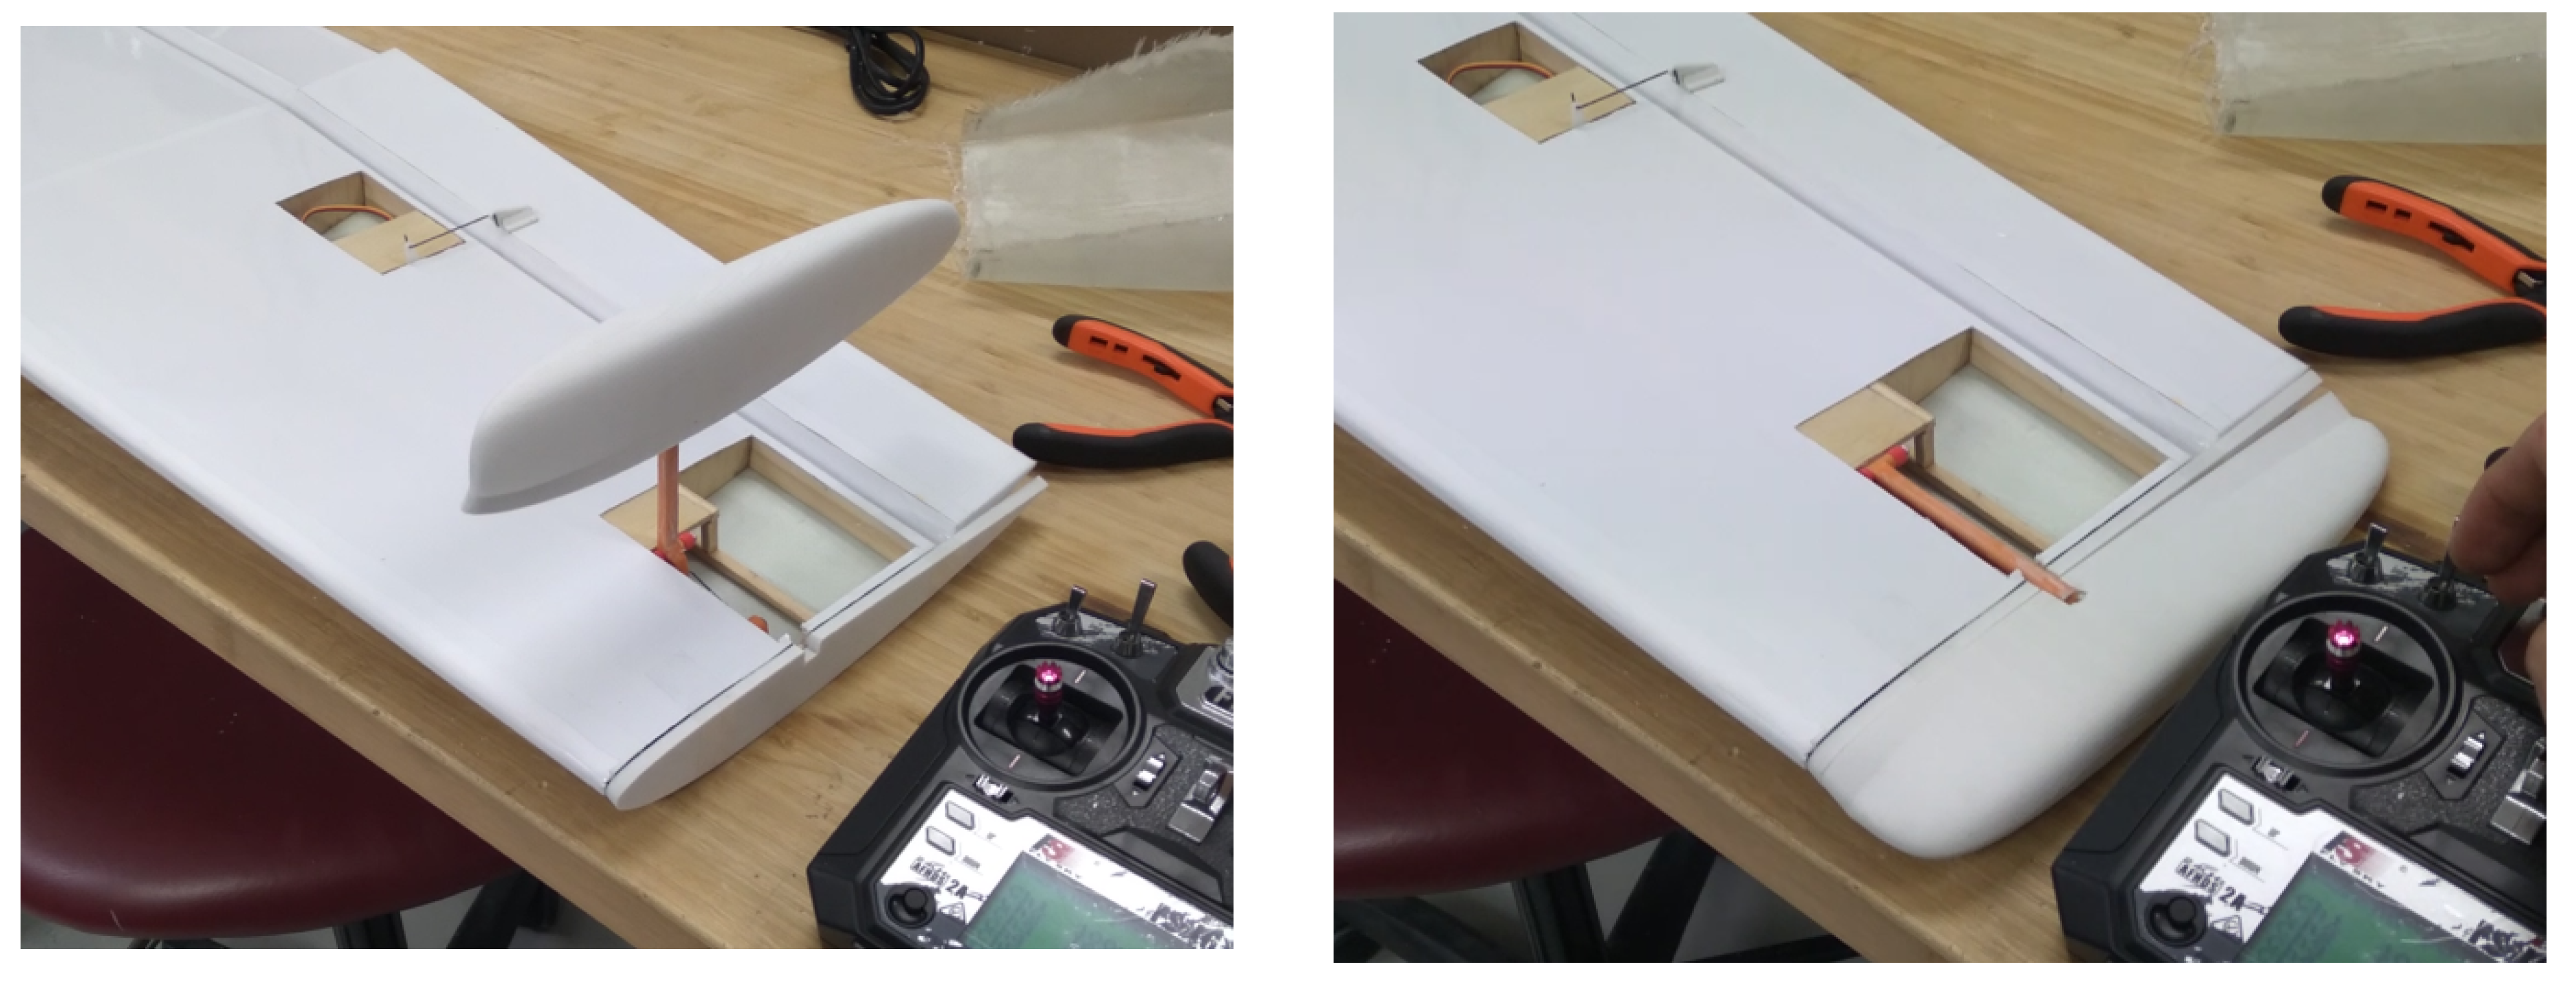
Figure 14.
Hull step fairing (own diagram).
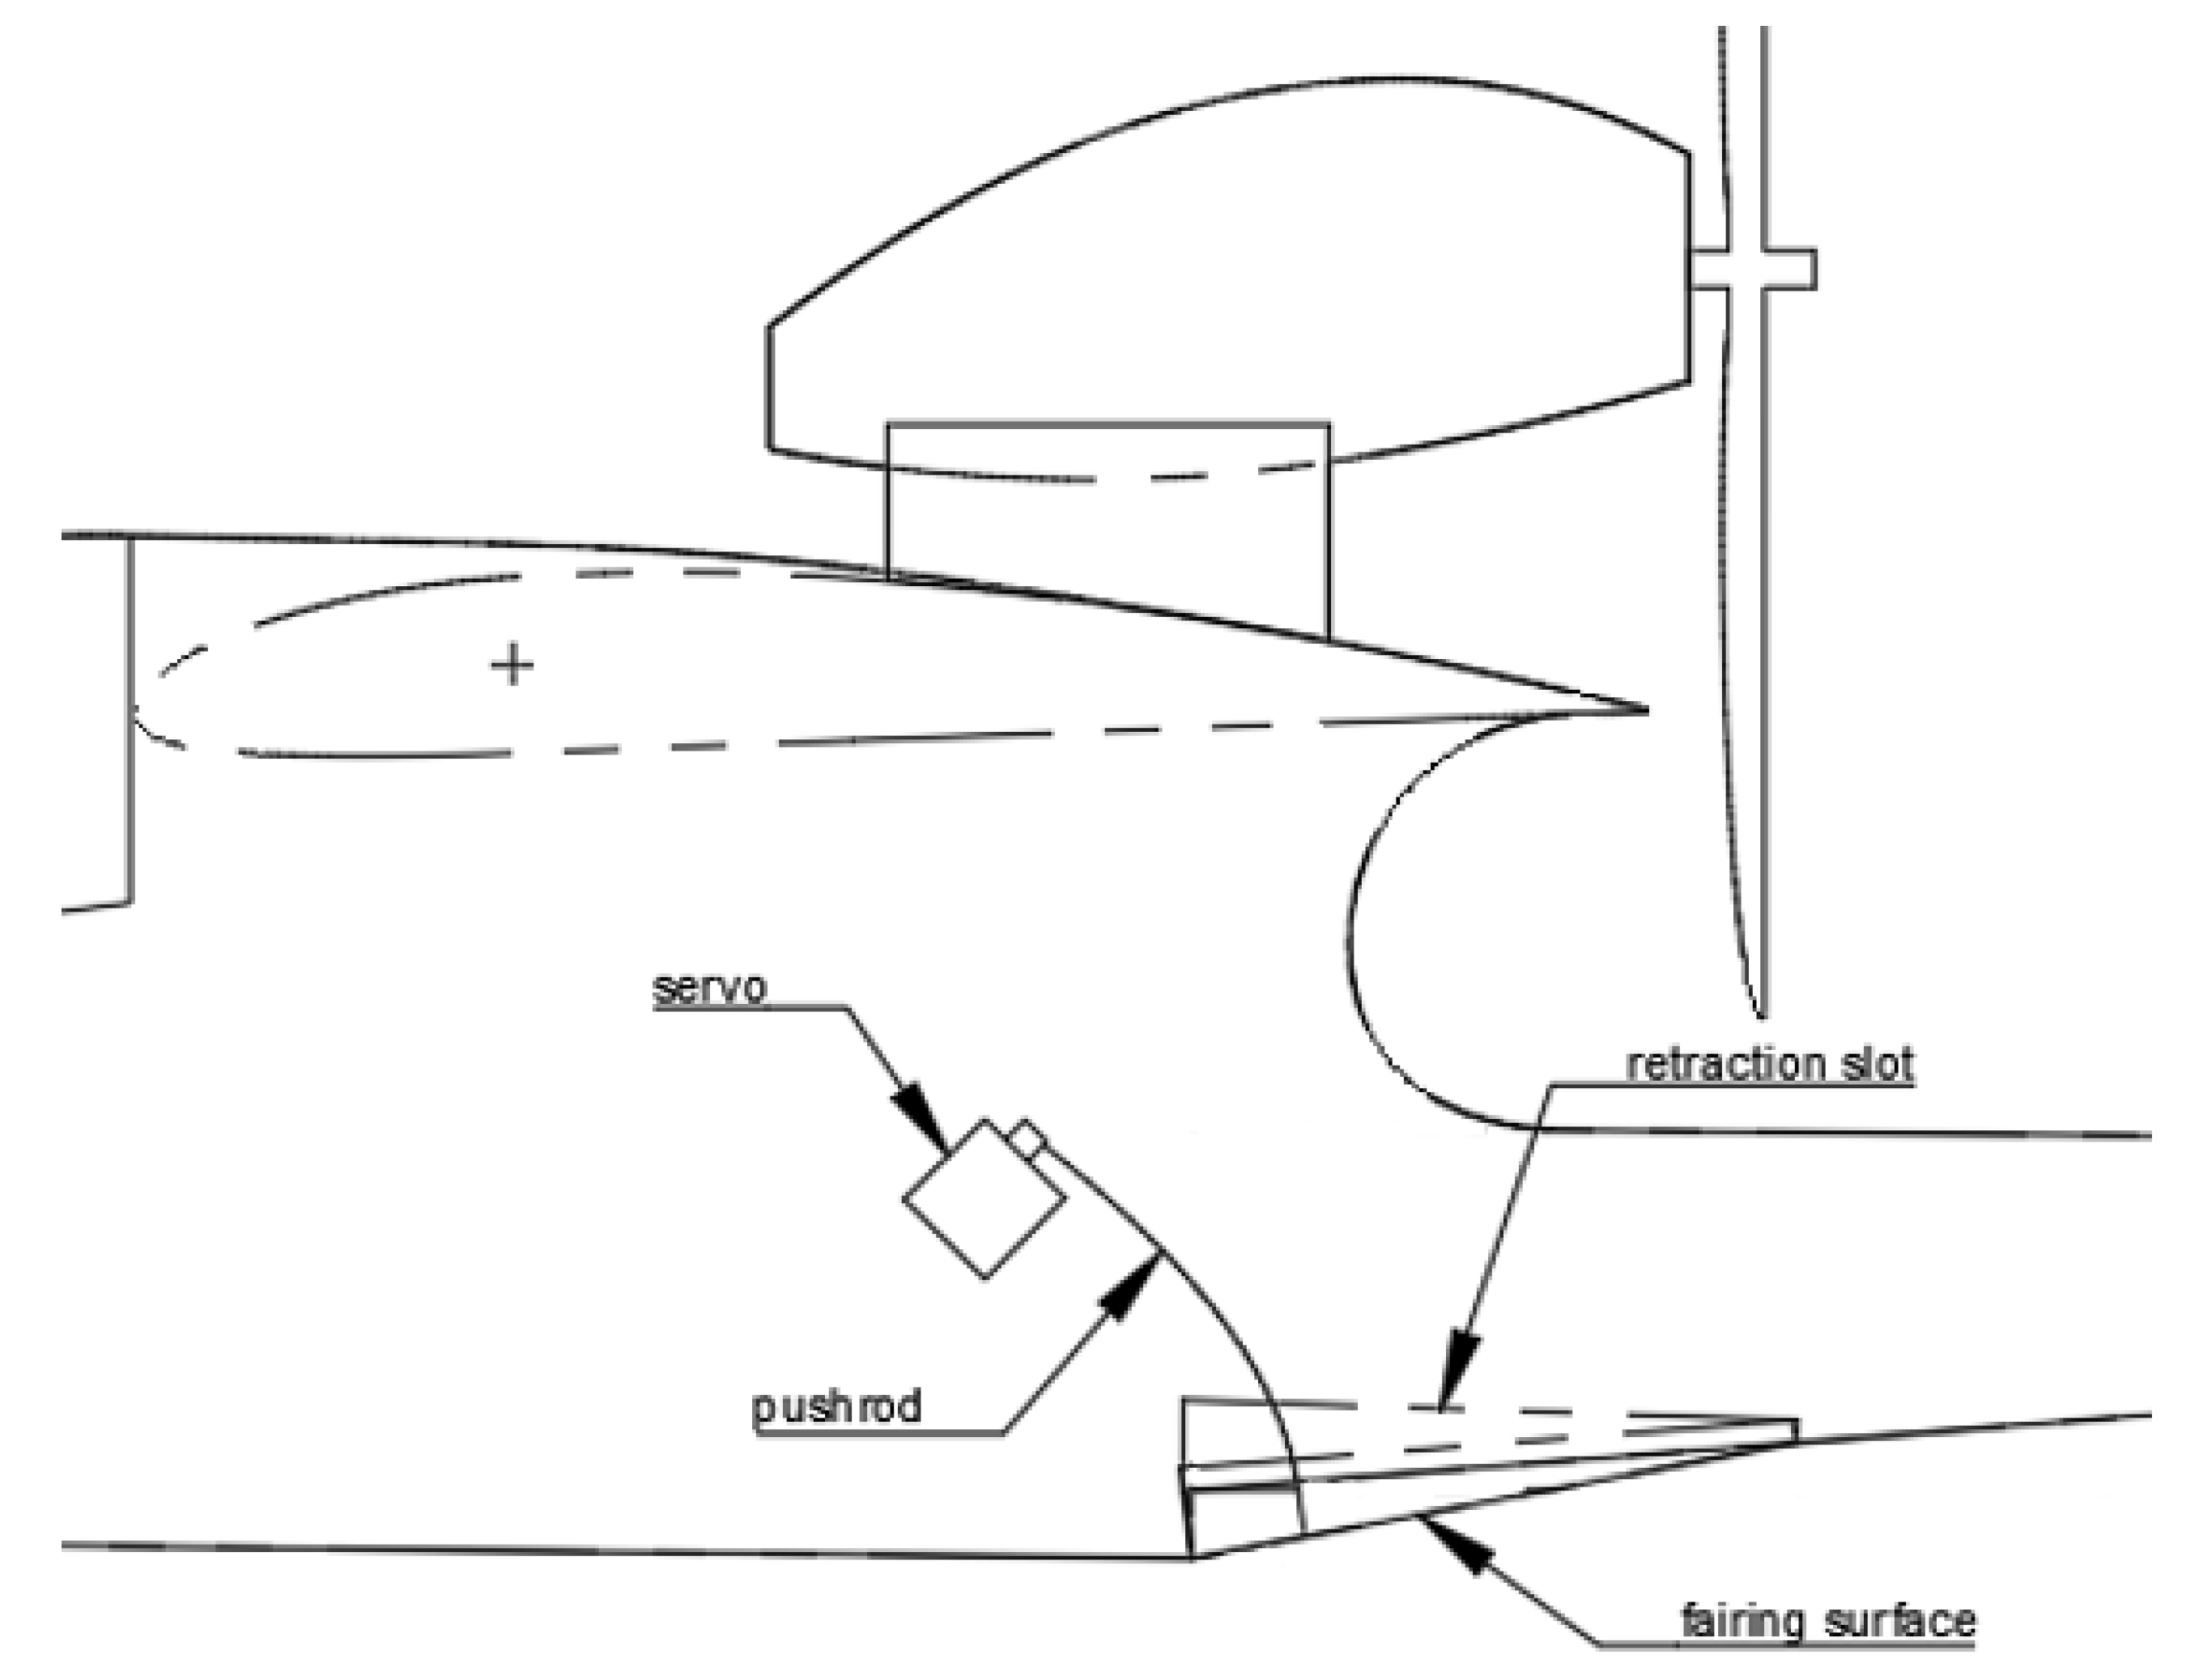
Figure 15.
DAQ system diagram (own flowchart).
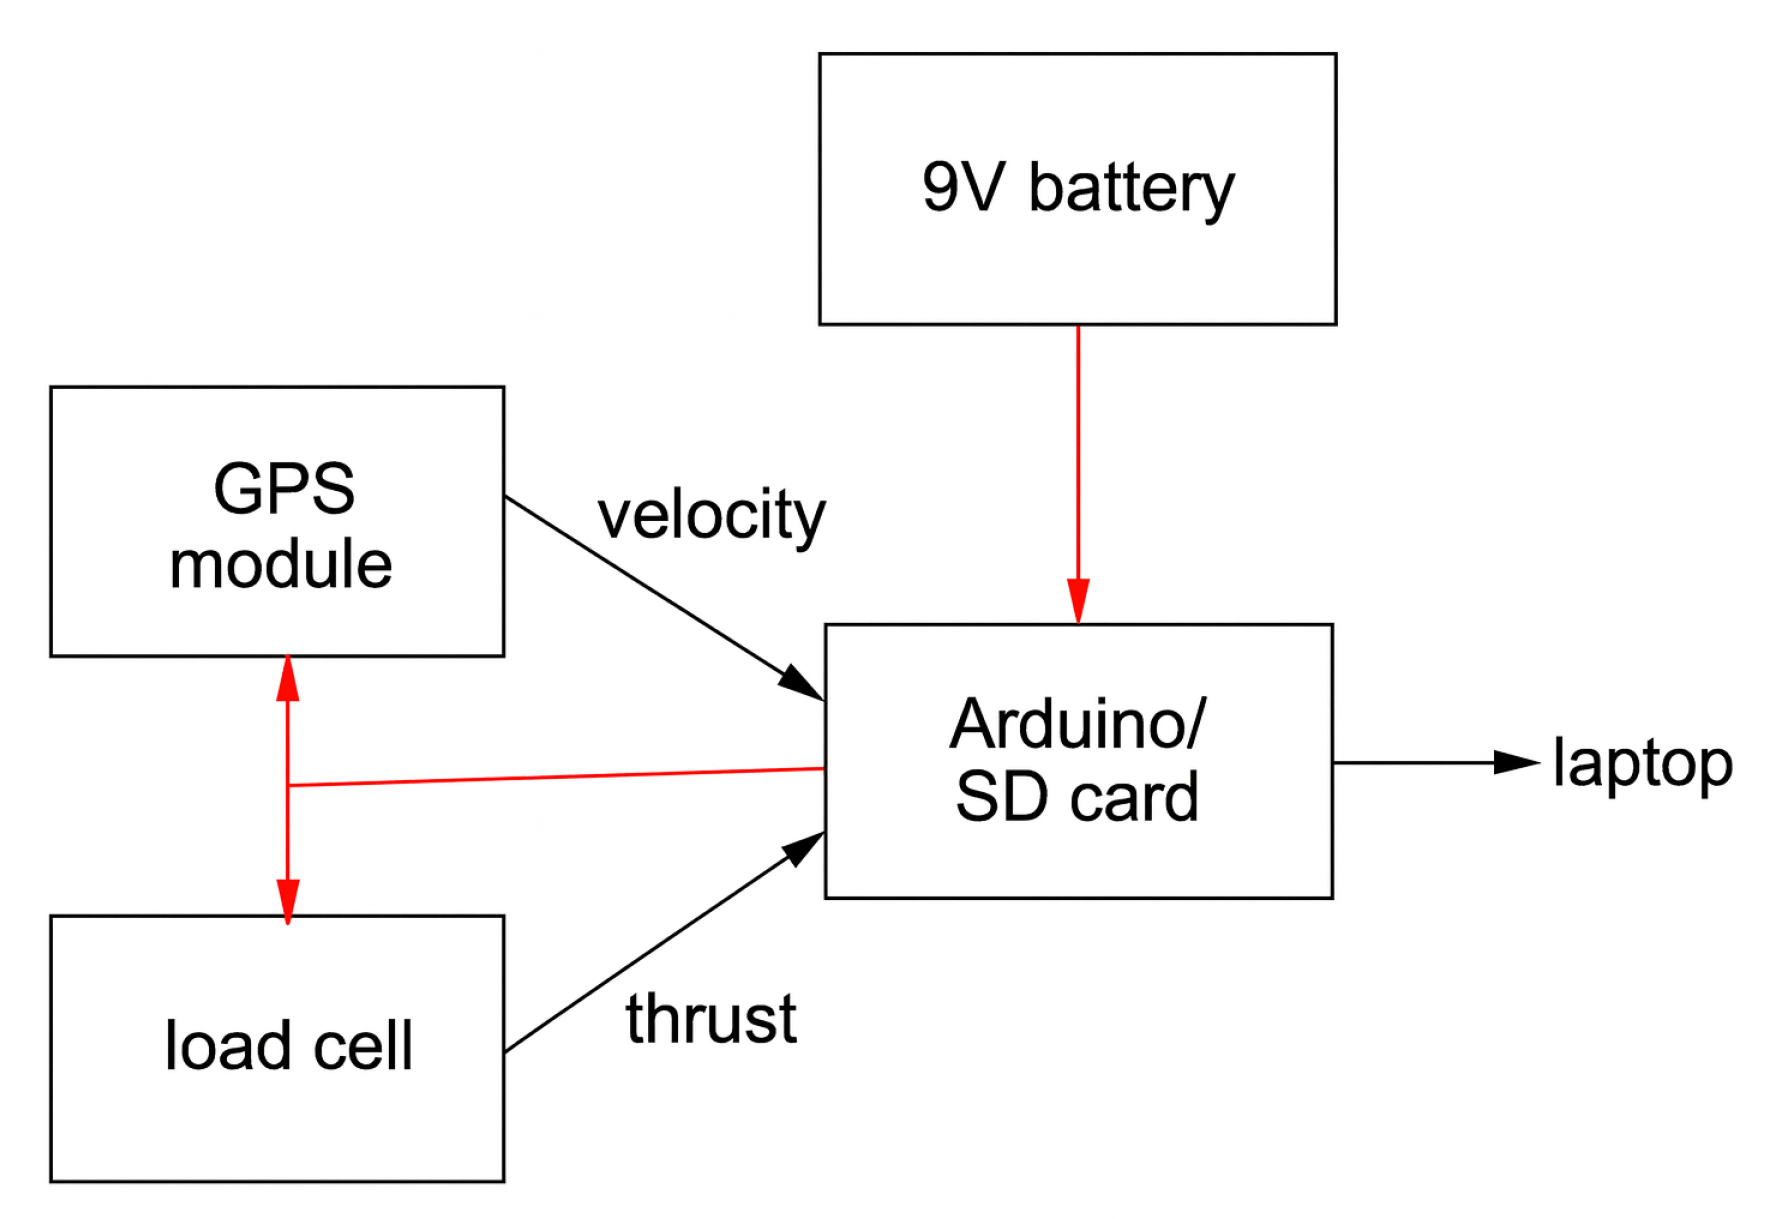
Figure 16.
Motor mount with load cell (own diagram).
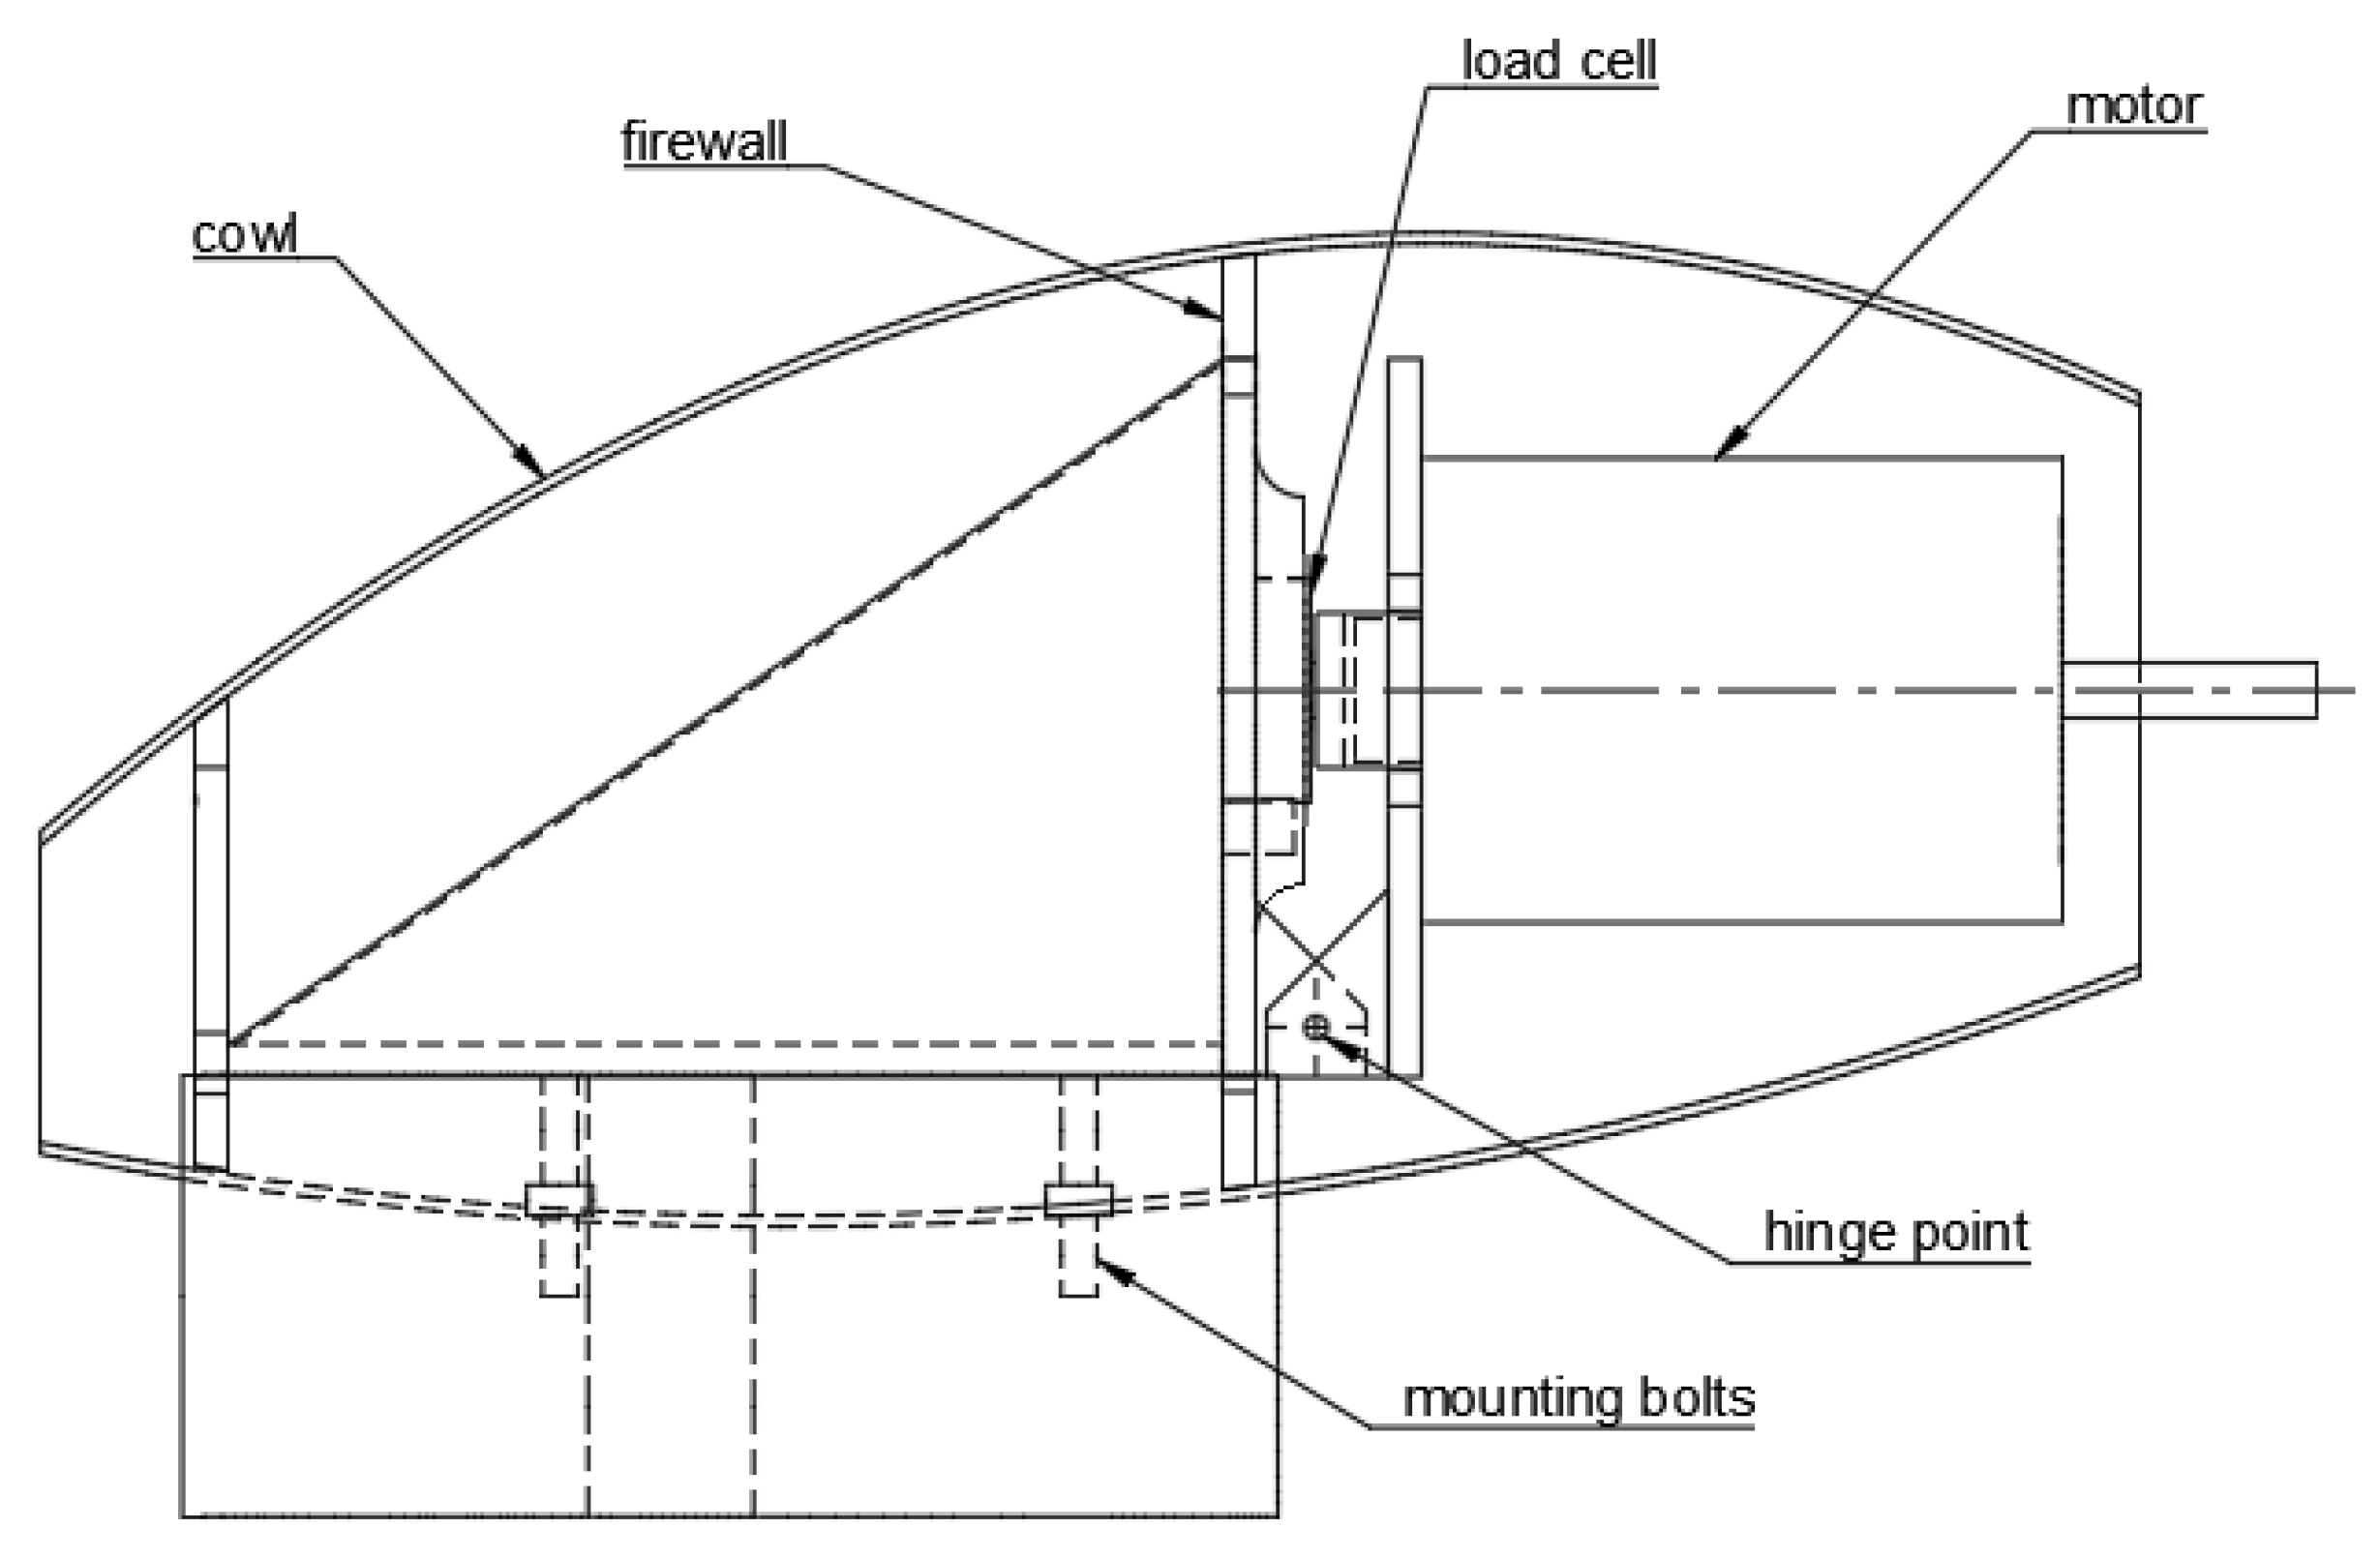
Figure 17.
Thrust sensor calibration results (own graph).
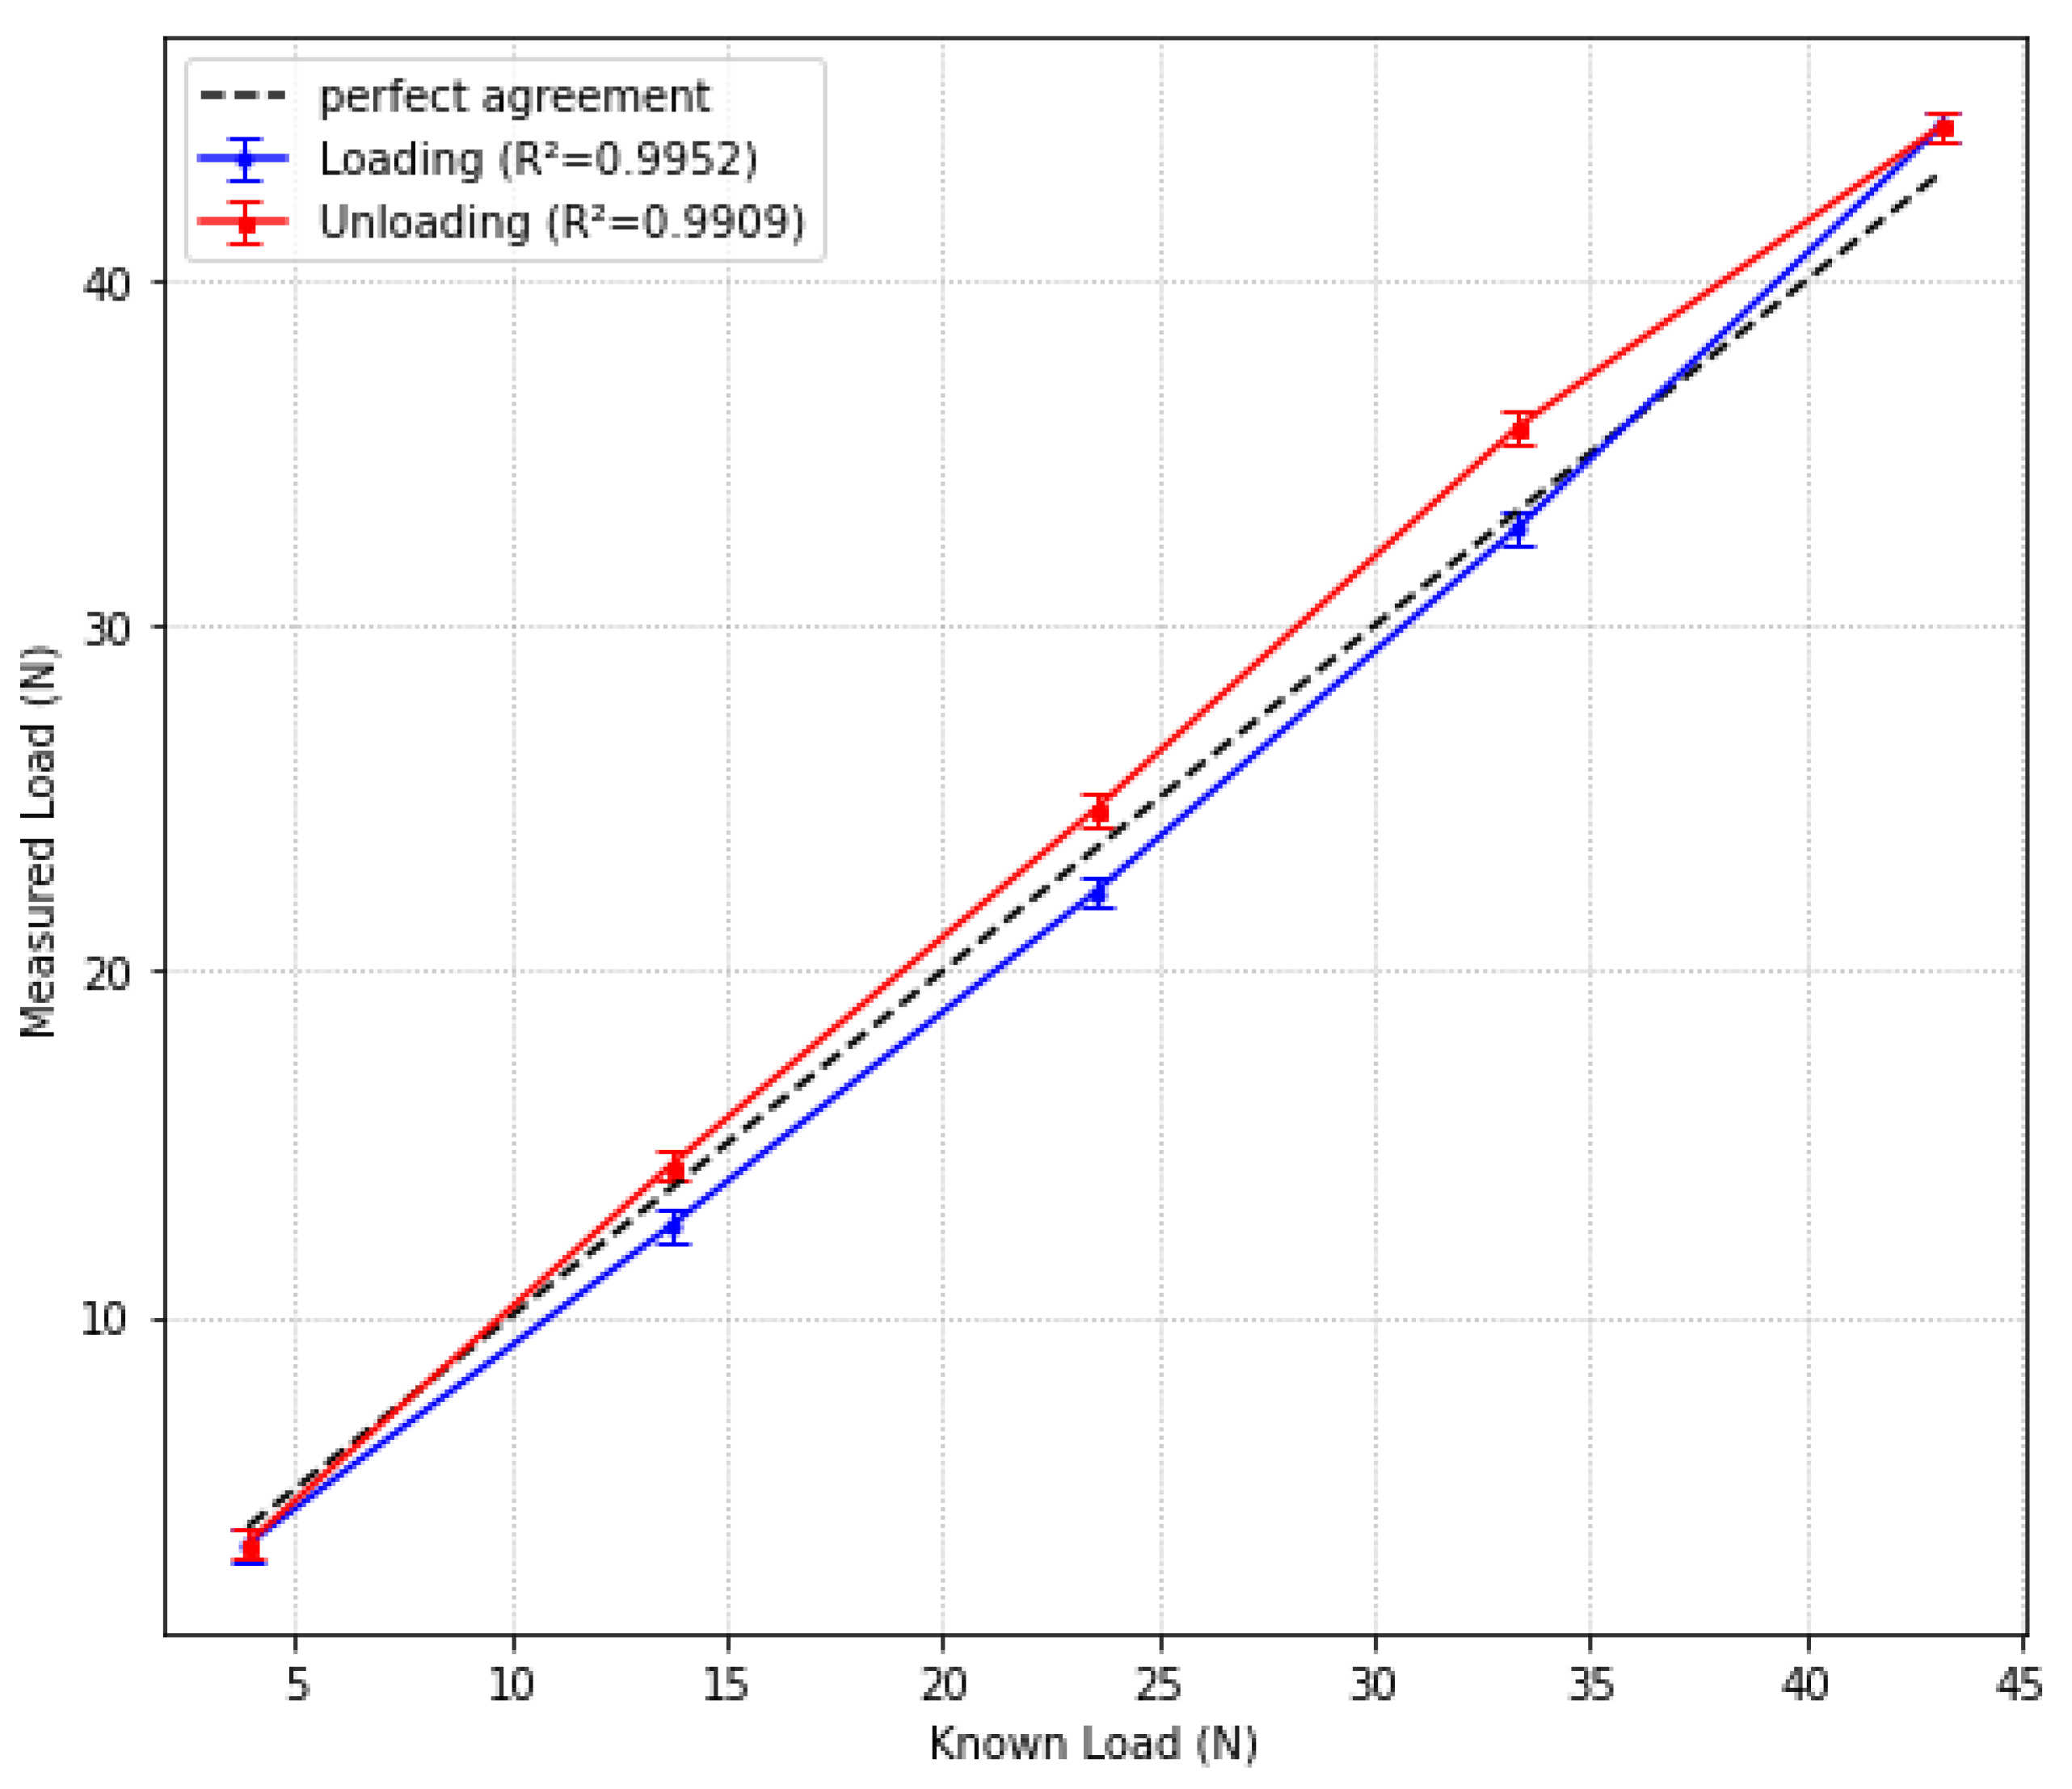
Figure 18.
Example flight path with highlighted test runs (own plot).
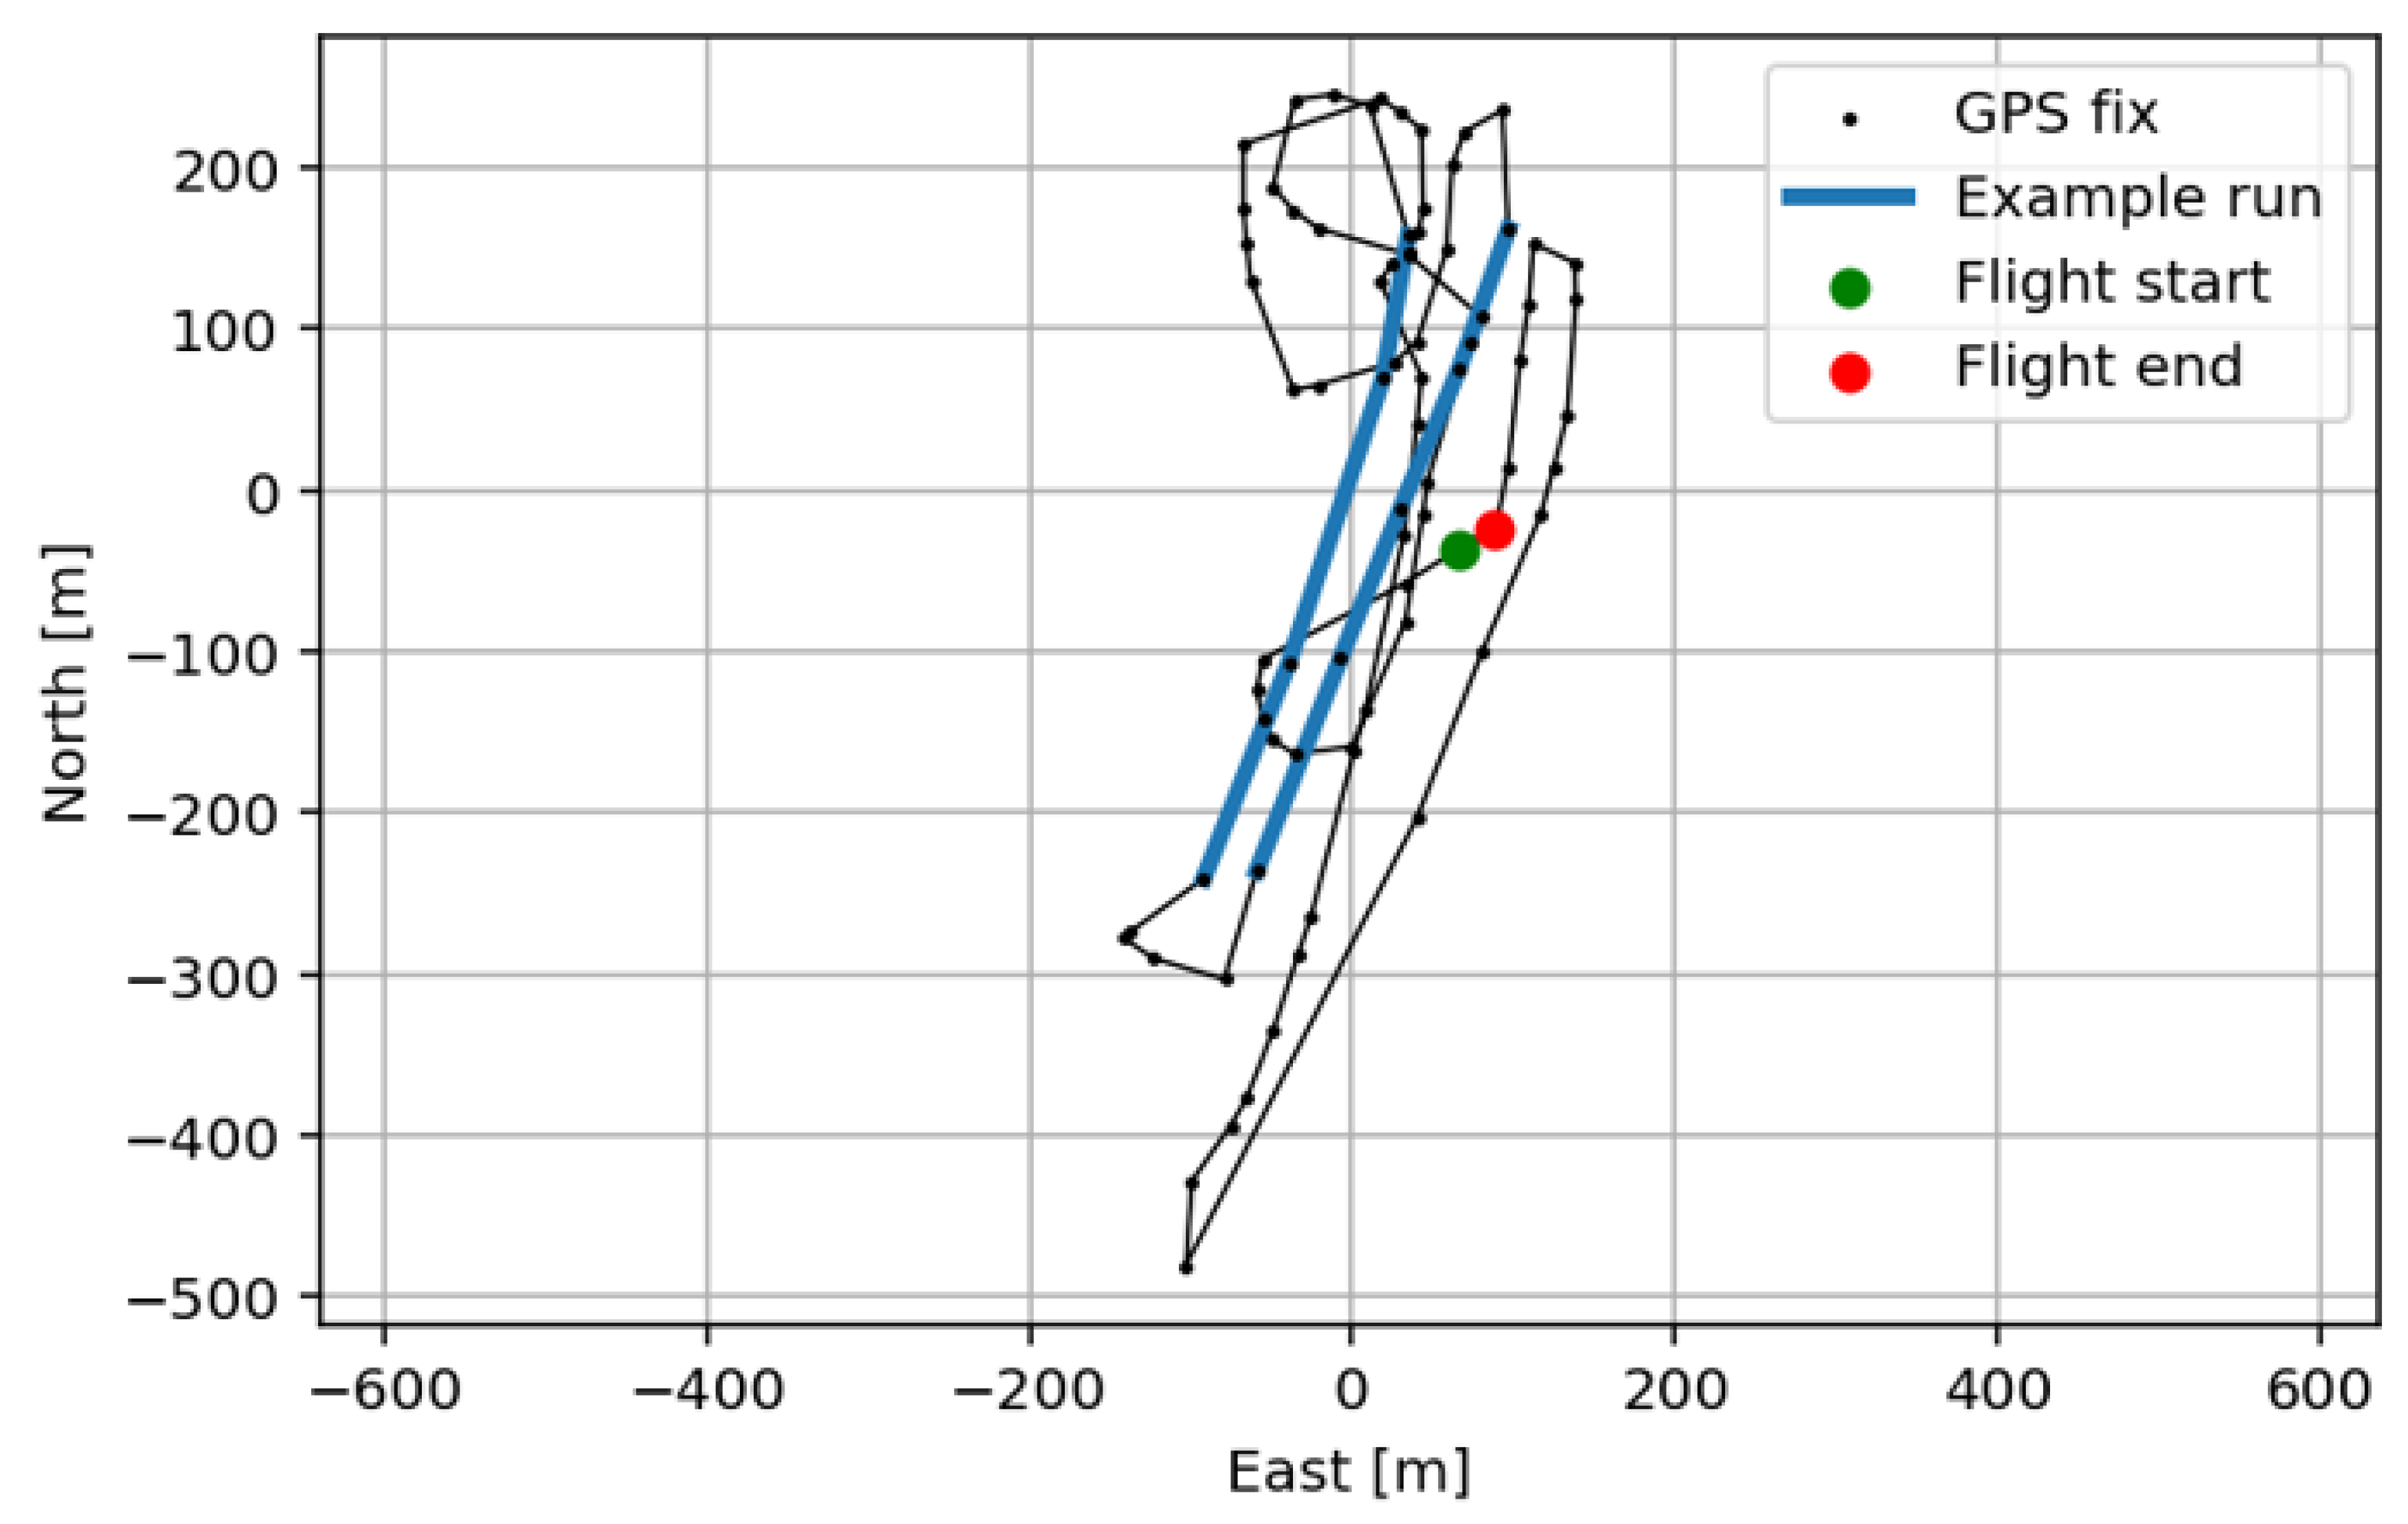
Figure 19.
Example thrust data (own plot).
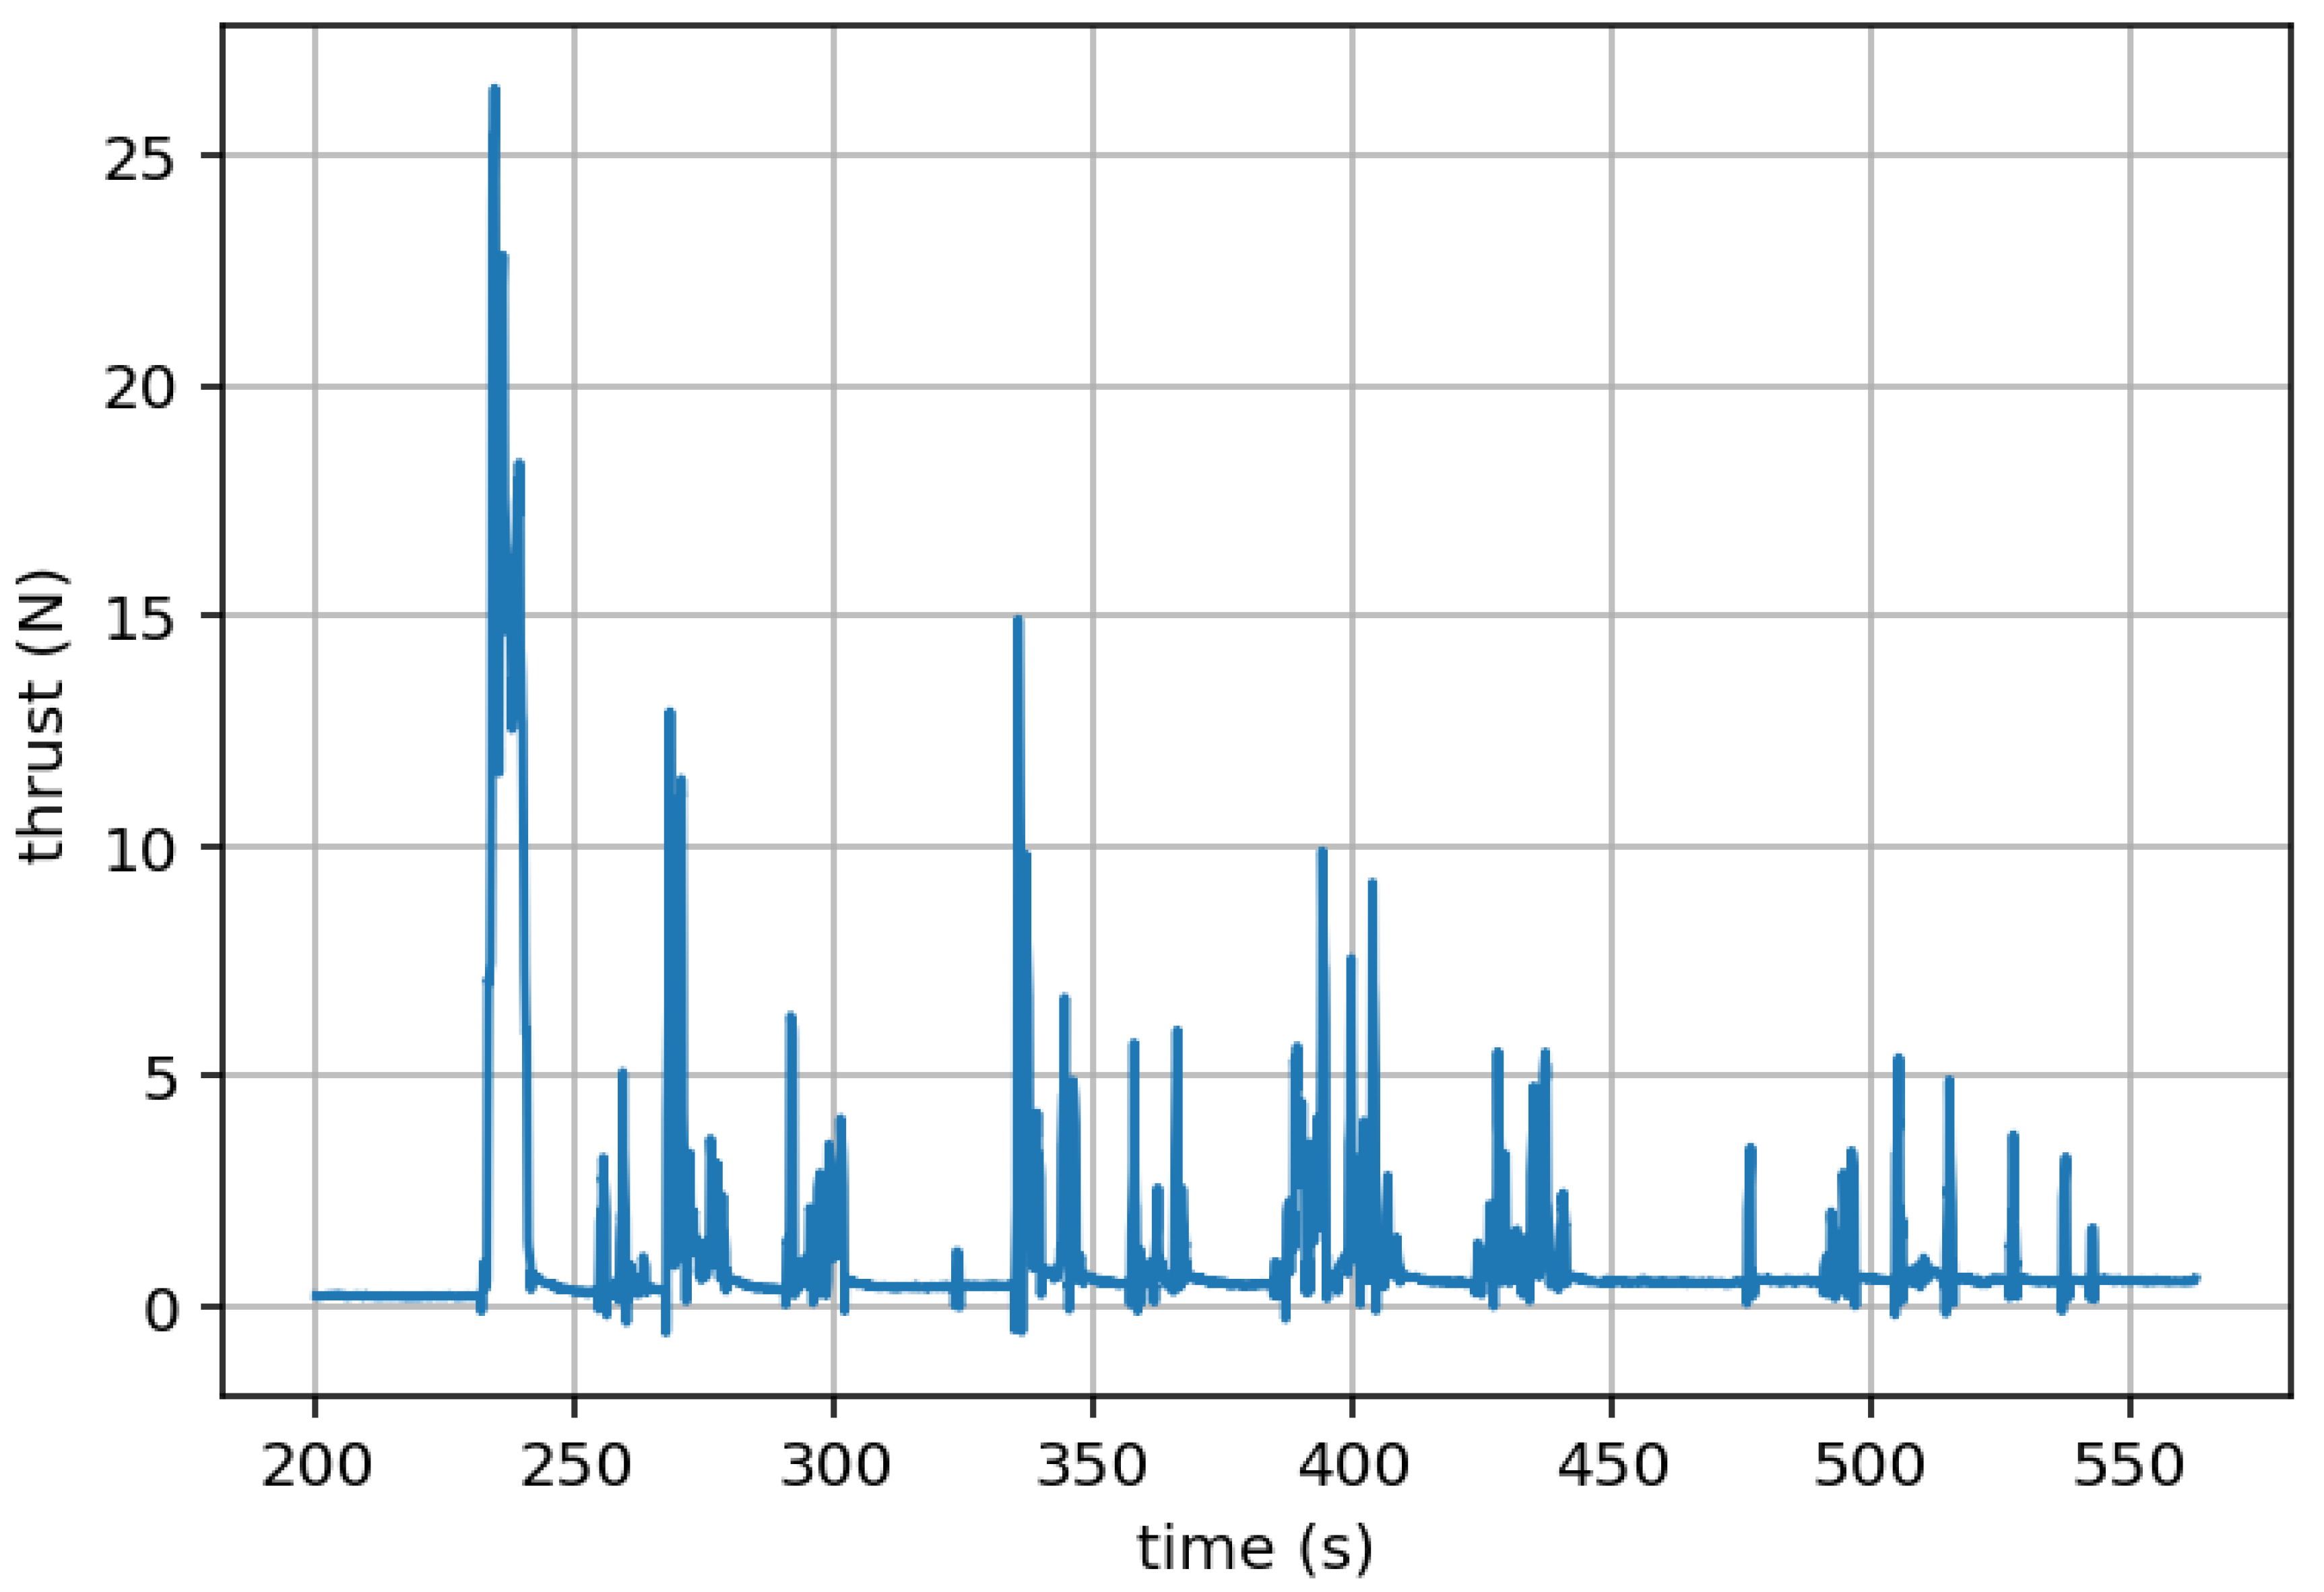
Figure 20.
Comparison between total and profile drag coefficient between configurations (own plot).
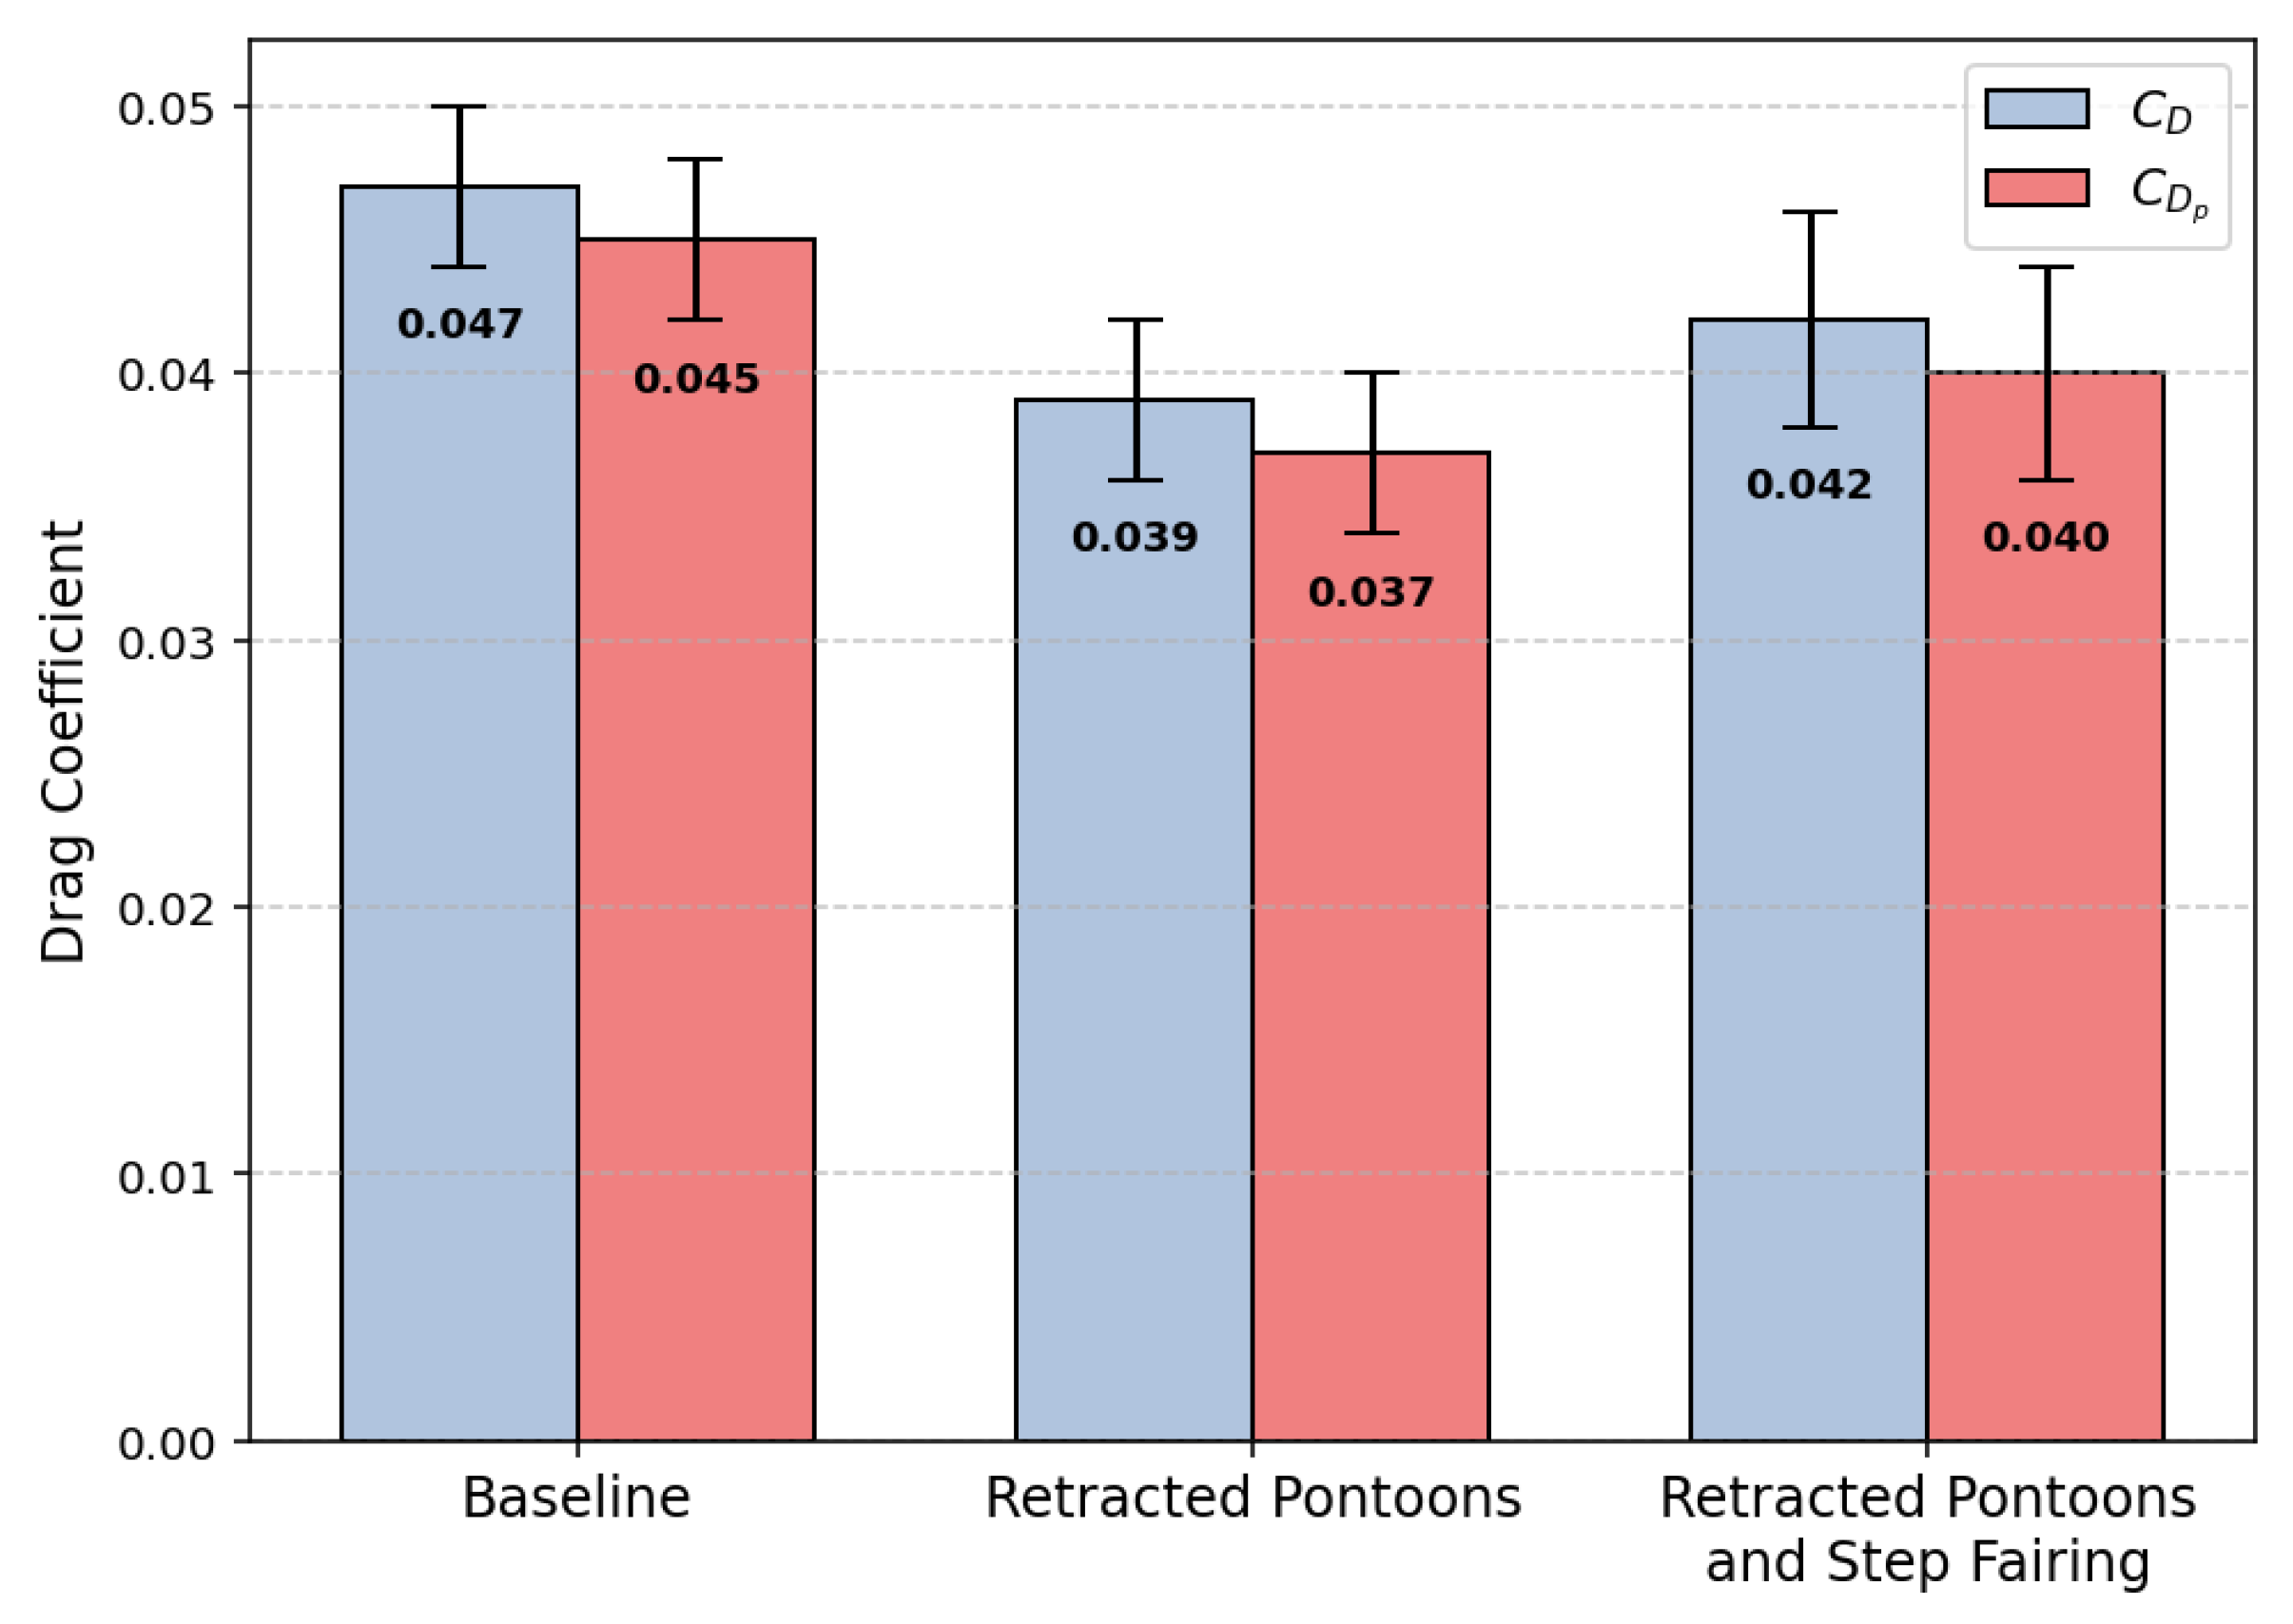
| Aircraft Model | Empty / Max Weight (kg) | Engine | Stall Speed (kts) | Cruise Speed (KTAS) |
|---|---|---|---|---|
| M22 Seamax | 325 / 599 | Rotax 912 ULS/iS | 39 | 100 |
| Icon A5 | 491 / 686 | Rotax 912 iS | 39 | 84 |
| SeaRey | 449 / 649 | Rotax 912 iS | 33 | 83 |
| Super Petrel LS | 386 / 649 | Rotax 912 iS | 37 | 100 |
| Super Petrel XP | 422 / 681 | Rotax 916 iS | 41 | 120 |
| Aero Adventura II | 375 / 650 | Rotax 912 ULS/iS, Aeromomentum AM13, AM15 | 33 | 74 |
| Freedom S100 | 410 / 650 | Rotax 912 ULS | 45 | 100 |
| ATOL 650 | 380 / 650 | Rotax 912 iS | 40 | 86 |
Table 2.
Model aircraft key specifications.
| Parameter | Value |
|---|---|
| Scale (approx) | 1/5th |
| Length (m) | 1.26 |
| Wingspan (m) | 2.11 |
| Wing area () | 0.634 |
| Aspect ratio | 7.02 |
| Mean geometric chord (m) | 0.307 |
| Mass (kg) | 6.14 |
| Wing Loading (kg/) | 9.68 |
Table 3.
T-test results on speed data.
| Config. Pair | t | p |
|---|---|---|
| 1 and 2 | 2.62 | 0.0305 |
| 1 and 3 | 1.54 | 0.1666 |
| 2 and 3 | 1.82 | 0.1023 |
Table 4.
Mean velocities for each configuration.
| Config. | Description | n | Velocity (m/s) |
|---|---|---|---|
| 1 | Baseline | 4 | 28.1 ± 0.7 |
| 2 | Pontoons Up, Fairing Off | 6 | 30.0 ± 0.7 |
| 3 | Pontoons Up, Fairing On | 5 | 29.1 ± 0.8 |
Table 5.
Measured speed and drag coefficient for each configuration.
| Configuration | Avg. Speed (m/s) | Speed vs Baseline | vs Baseline | |
|---|---|---|---|---|
| Baseline | 28.1 | — | % | |
| Pontoons retracted, fairing off | 30.0 | +6.7% | % | |
| Pontoons retracted, fairing on | 29.1 | +3.8% | % |
Table 6.
Profile drag coefficients for each configuration.
| Configuration | vs Baseline | |
|---|---|---|
| Baseline | % | |
| Pontoons retracted, fairing off | % | |
| Pontoons retracted, fairing on | % |
| Parameter | Rotax 912 ULS (Seamax) | Rotax 916iS (Altavia Aerospace proposal) |
|---|---|---|
| Rated power (max continuous) | 73.5 kW | 101 kW |
| Engine + mount weight (kg) | 67.7 | 91.2 |
| Weight difference (kg) | — | +23.5 |
| Fuel consumption (kg/hr) | 15.75 | 25.25 |
| Fuel for 471 NM mission (kg) | 73.4 | 85.1 |
| Total added fuel weight (kg) | — | +11.7 |
Disclaimer/Publisher’s Note: The statements, opinions and data contained in all publications are solely those of the individual author(s) and contributor(s) and not of MDPI and/or the editor(s). MDPI and/or the editor(s) disclaim responsibility for any injury to people or property resulting from any ideas, methods, instructions or products referred to in the content. |
© 2025 by the authors. Licensee MDPI, Basel, Switzerland. This article is an open access article distributed under the terms and conditions of the Creative Commons Attribution (CC BY) license (http://creativecommons.org/licenses/by/4.0/).
Copyright: This open access article is published under a Creative Commons CC BY 4.0 license, which permit the free download, distribution, and reuse, provided that the author and preprint are cited in any reuse.


