Preprint
Article

This version is not peer-reviewed.

The Question About the Question: Is There Any Relationship Between Formulating an Explicit Research(able) Question and Citation Impact in Engineering-Based Systematic Literature Reviews?

Submitted:

29 October 2025

Posted:

30 October 2025

You are already at the latest version

Abstract

Systematic Literature Reviews (SLRs) have become essential apparatus for critical appraisal of evidence outside of the medical and healthcare profession. However, although SLRs often require a clearly stated Research Question (RQ), followed by a rigorous protocol for assuring transparency and replicability of findings, misuse has been reported. Using a sample of 400 SCOPUS-indexed engineering-based SLRs (Systematic Literature Reviews), this study investigates the citation impact of formulating an explicit RQ using both parametric and non-parametric statistical tests (p < 0.05). The results suggest a significant positive association with studies proposing a clearly stated RQ (p < 0.01), particularly within top-ranked engineering-based SLRs, suggesting that RQs enhance the clarity and focus of the research, thereby increasing visibility and citation count. Despite the findings, the evidence suggests small effect sizes (φ = 0.138) in terms of the association between RQ and class category and small effect sizes (r = 0.238) in terms of impact difference in citation count, which is no surprise given that extensive number of factors influence the prediction of citation impact.

Keywords: 
;  ;  ;  ;  ;  

Introduction

Background and Problem Statement

Systematic Literature Reviews (SLRs) are review studies aimed at answering a specific Research Question (RQ) using a systematic and transparent methodology designed for critical apprisal of evidence in primary studies (Nightingale 2009; Rother 2007; Torres-Carrion et al. 2018). However, although predominantly applied in health and medical sciences, the (ab)use in other scientific domains has been reported (Orošnjak et al. 2024). Nevertheless, this has led many to engage in the scientific practice of producing an SLR study, given that the theoretical probability of acceptance is relatively high (Montori et al. 2003). The underlying reason is that an SLR is considered a “gold standard” due to the ability to provide transparency and replicability of results (Lame 2019). With the idea of providing a uniform conclusion about whether examined methods (e.g., interventions, tools) are effective or not (Linares-Espinós et al. 2018), an SLR can aid in identifying and exposing biased findings within examined studies (Kung et al. 2010).
Acknowledging that SLRs are predominantly inductive, meaning that premises are built from the evidence of retrieved studies, the SLR authors agreeably rely on previous findings to justify the need for starting an SLR without questioning the evidence (Nightingale 2009) behind such studies. However, this is not the case in medical and health sciences, where meta-analyses (-regression) became vital for exposing and dissecting evidence to dichotomise bias from unbiased studies. In the engineering domain, however, SLRs seem to disregard such practices. This is mainly because engineering-based SLRs are heterogeneous and vertical, and meta-analysis is hard to perform. Consequently, these SLR types should be classified instead as Scoping Reviews (ScR) because the authors mainly misunderstood the concept and identified them as SLRs.
Such a lack of incoherence and engagement in questioning previous findings raises concerns about the purpose of an SLR in the first place. Chasing the h-index and other citation-related altmetrics leads many to follow the idea of producing an SLR with a lack of substance behind such arguments, ultimately leading to many self- and tokenistic citations (Booth and Carroll 2015) by capturing only articles’ meta-data (Oelen et al. 2020). As a consequence of such practice, SLRs yield excessive or, in some instances, insufficient information, consequently creating unnecessary “research waste” (Roberts and Ker 2015). This can be attributed to today’s practice in which authors reformulate or reinvent existing concepts by proposing new jargon (Chawla 2020). Arguably, this can be attributed to two fundamental issues (Munn et al. 2018): The RQ being asked and the evidence used to answer the question.
Many argue that a well-formulated RQ (Booth 2016; Lame 2019; Torres-Carrion et al. 2018) is pivotal in starting an SLR. This provoked many information/library scientists to propose frameworks when developing an RQ. The prime intent of these frameworks is to scope and guide the review (Booth et al. 2016), delineate parts of the RQ for aiding the SLR search strategy, and reduce the diffuseness of literature for optimising sensitivity and specificity (Methley et al. 2014). Although the corpus of retrieved studies in the SLR mostly depends on the quality of a search strategy, this ultimately leads back to the proposed RQ from which the search strategy is defined. From previous experience, it seems that many SLR authors in the engineering-based domains either omit or fail to propose an explicit RQ at the start of the review. In other instances, if a clear and sound RQ (Solarino et al. 2024) is proposed, poor methodological rigour usually follows. These issues have led us to question whether or not an explicit RQ has anything to do with citation count. We first delve into factors affecting citation impact to answer such a question. Next, we overview existing literature on the relationship between proposing an explicit RQ and citation count. Lastly, we test several hypotheses using a case study of engineering-based SLRs to see whether such findings can be valid.

Related Work

Most of the prior work is built upon OLS (Ordinary Least Squares) regression models (Judge et al. 2007; Soheili et al. 2022) regarding factors affecting citation impact. Most of the scientometric studies are dedicated to primary (original) articles, while factors affecting the citation impact of secondary (review) articles are limited (Royle et al. 2013; Wagner et al. 2021; Xie, Gong, Li, et al. 2019). The existing body of knowledge reports an extensive amount of factors affecting citation count, but most agree that journal metrics (e.g., WoS-IF) (Bornmann and Leydesdorff 2017; Yu et al. 2014), paper length (Xie, Gong, Cheng, et al. 2019; Xie, Gong, Li, et al. 2019), the number of authors (Cheng et al. 2017; So et al. 2015; Uthman et al. 2013), and inter- and intra-institutional collaboration (Chen et al. 2023), are primarily associated with the rise of citation impact. Some propose the existence of an effect between citations and open peer-review policies (Zong et al. 2020), number of references (Liskiewicz et al. 2021), among others, but with much less confidence in findings. Tahamtan et al. (2016) provide a comprehensive review of factors affecting citation impact, arguing that most factors could be categorised into study-, journal- and author-related features. Ultimately, although the existing scientometric literature mainly provides evidence on factors affecting citation impact consisting mainly of meta-data metrics, there is a gap of about content-based metrics, such as methodological, topic and paper-related factors, especially within an engineering-based domain.
For instance, in their RCE (Rationale-Cogency-Extent) criterion, Orošnjak et al. (2024) recognised the potential impact of different content aspects of engineering-based SLRs, specifically of Rationale features, such as ILQ (Informal Question Logic), MRQ (Motivation for the Research Question), QFL (Question Formulation Logic), RQS (Research Question Strength), QEA (Question Evidence Aim), and QDA (Question Data Aim). In contrasting the results between top- and bottom-ranked SLRs in the first sample of their study, the results suggest inconclusive findings regarding the presence of statistical significance, especially after controlling for confounding effects. In their second sample of the “Big 3” journals, significant relationships are observed between citation count and the variables, particularly after considering the log-transformed citation count. After controlling for confounding effects, this led to the conclusion that RQS (r = 0.351, p < 0.001), QEA (r = 0.408, p < 0.001), QDA (r = 0.395, p < 0.001), ILQ (r = 0.343, p < 0.001), and MRQ (r = 0.351, p < 0.001) show significant results but with log-transformed citation count.
A study by Solarino et al. (2024) showcased the importance of simplicity, alignment of hypotheses to the RQ, and the contribution of the RQ as being necessary to the academia or practice, the latter capturing a greater audience. Their findings suggest that (a) there is evidence that a match between RQ and hypotheses is associated with citations (p < 0.01); (b) meta-analysis articles and more extended studies, presumably review articles, tend to receive higher citation counts; and (c) a more straightforward conceptualisation of the RQ tends to show higher association with citation count. The takeaways from their analysis suggest that RQ that address the main effects tend to receive more citations, bringing us back to the point that horizontal-type RQ offers more to the scientific community by delineating the effects of a particular variable or phenomenon, often used in meta-analysis.

Research Questions and Hypotheses

In light of the arguments, the objectives of the study are straightforward. We first synthesise engineering-based SLRs from the SCOPUS indexbase. Secondly, we hypothesise that formulating an explicit RQ is a common practice of top-ranked SLRs, and there is a statistically significant difference with bottom-ranked SLRs. Thirdly, there is a higher theoretical probability of gaining more citations, regardless of whether such studies are published in top- or bottom-ranked SLRs when providing an explicit RQ. Lastly, given that RQ frameworks are commonly used in SLRs for designing and developing appropriate RQ, we hypothesise that studies using an explicit QFL tend to receive more citations. Following the idea that closely aligned RQ with hypothesis tends to receive a higher impact (Solarino et al. 2024), the RQ and hypotheses are formulated as follows:
RQ1: 
Is formulating an explicit research question a practice more prevalent in top-ranked engineering-based systematic literature reviews?
RQ2: 
Does formulating an explicit research question increase the probability of receiving a higher citation count compared to those who do not?
Based on the proposed RQ, the following null hypotheses are tested.
H10. 
There is no association between studies that propose an explicit research question and SCOPUS-indexed systematic literature reviews ranked by the citation impact.
H20. 
There is no association between studies that use an explicit research question framework (or question formulation logic) and SCOPUS-indexed systematic literature reviews ranked by the citation impact.
H30. 
There is no statistically significant difference in citations between studies with and without an explicit research question considering engineering-based systematic literature reviews.
H40. 
There is no statistically significant difference in citations between studies that use an explicit question formulation logic compared to studies that do not consider engineering-based systematic literature reviews.
The first two hypotheses aim to assess the association between top- and bottom-ranked SLRs and state an explicit RQ on one side and designated RQ framework used to develop the RQ on the other, using contingency models of Chi-square (i.e., H1a and H2a: OiEi , for at least one i, such that O is observed frequency for category i, and E is the expected frequency for category i) and Fisher’s exact test. The last two hypotheses aim to test whether or not the practice of stating an explicit RQ and usage of question formulation logic (i.e., H3 a and H4a: μ1 ≠ μ2), which is commonly the first step of an SLR protocol, consequently attains more citations.
The rest of the study is structured as follows. The second section provides an in-depth explanation of the a priori required sample size estimation considering the power (1-β = 0.80) of the test and at least moderate effect size (d = 0.5) and also the calculation of the representative sample considering the population of SCOPUS-indexed engineering-based SLRs. Lastly, the section provides variables and test statistics used in the analysis. The third section provides results from the analysis, including test statistics, diagnosticity of p values and effect size calculation. The discussion section reports the findings and reconciles with the evidence in making arbitrary conclusions about the study's results, implications and limitations.

Methodology

A Priori Sample

Determination of a priori required sample is performed using G*Power (v.3.1.9.7). For χ2 test considering medium effect size of w = 0.3, α error = 0.05, and Power (1-β) = 0.80, the total sample size required is at least n = 88, with noncetranlity parameter λ = 7.92 and χ2crit = 3.84. For the two-tail independent t-test statistic, the parameters Cohen’s d = 0.5 (moderate effect), confidence level α = 0.05, allocation ratio of n2/n1 = 1 and Power (1-β) = 0.80 are used. The output metrics suggest non-centrality parameter δ = 2.828, tcritical = 1.979, df = 126, with a minimum required sample size of n = 128, with ni = 64 per group for obtaining at least 0.80 power. Next, the representative sample is calculated per Hamburg (1985):
n = z 2 · p ^ ( 1 p ^ ) ε 2 1 + z 2 · p ^ ( 1 p ^ ) ε 2 N
where z is the z-score statistic, ε is the margin of error (5%), N is the population size, and p is the population proportion. (Note that this estimates a finite population regarded as a total number of indexed engineering-based SLR articles on SCOPUS).
The search was performed on 14.06.2024 on SCOPUS with the search string “systematic literature review”. Given that many authors either use partial SLR, such that a methodology is used in literature review but not as a standalone review, or in other instances cite “systematic literature review”, the search is limited only to ABS-TITL-KEY (Abstract-Title-Keywords). For the sake of replicability of findings, the SCOPUS search string is given as: (TITLE-ABS-KEY ("systematic literature review") AND (LIMIT-TO(SUBJAREA, "ENGI")). The SCOPUS search identified 8486 SLR engineering-based articles. This suggests that at least nsample = 368 SLRs are required for a sample to be representative. However, given the possibility of bias from measuring citation count, the search is limited to 2020-2021 publications, resulting in a final population of N = 2137 articles and a minimum sample size of n = 326 articles. The reason for limiting the search is due to the effect where articles’ citation count tends to peak two to four years after publication (Aksnes 2003; Eysenbach 2006; Galiani and Galvez 2017; Vieira and Gomes 2011). Even so, 400 engineering-based SLRs, consisting of 200 top- and bottom-ranked SLRs, were extracted. The list of SLR studies is given in supplementary files.

Variables and Data Description

The following variables are of primary concern: Publication Citation Number (PCN), SCOPUS CiteScore, Web of Science Impact Factor (WoS-IF), binary coded variables of having an RQ (1 = True; 0 = False), binary coded form of a QFL stated as 1 = True and 0 = False; and SLR ranking class as Top = top and Bot = bottom ranked SLR. The following article meta-data variables are included: author(s) list; title of the publication; institution name; location of the institution; country/state; publisher; title of the information source; classification of the publication source as journal article, conference proceeding paper or book chapter.
From the obtained sample, there are five authors with two SLR publications; the rest published one SLR study. Only three SLRs are conference papers, and two are in the top-ranked class category. The largest number of SLRs originates from Brazil (36), Italy (27), India (25), and China (25), followed by Malaysia (20), United Kingdom (20), and Germany (19). The highest number of SLR papers is published by Elsevier (149), followed by MDPI (64) and IEEE (43). Considering the publication source, most amount of SLR papers are published in the Journal of Cleaner Production (60), IEEE Access (39) and Sustainability (18). Most SLRs are published by the Norwegian University of Science and Technology (6) and Bina Nusantara University (5), followed by the Federal University of Santa Catarina (4), KU Leuven (4), and Universiti Teknologi Malaysia (4).
Regarding the focused qualitative and quantitative variables used for hypothesis testing, 294/391 studies propose an explicit RQ. By explicit RQ, we consider a proposed RQ before starting the search strategy, commonly in the introduction section of an SLR study. In addition, since some studies do not propose an explicit standalone research question but in the formulation of the sentence, for instance, “…Missing from literature, however, is a consolidated and consistent view on what the Digital Twin is, and how the concept is evolving to meet the needs of the many use-cases to which it is being tied.” proposed by Jones et al. (2020), it was not easy to distinguish and code the RQ variable as True or False. Nevertheless, we took an ORS (Objective Review Strategy) (Orošnjak et al. 2021) and performed Cohen’s kappa (κ = 95.3) test for evaluating interrater agreement between raters. Namely, since two raters independently performed coding of variables, in cases of disagreement (<5%), the third reviewer stepped in to make a final decision based on the example above. Lastly, only 17 SLR studies have been using research question frameworks, i.e., QFL, which are mostly PICO (Population-Intervention-Comparison-Outcome) (Richardson et al. 1995) and its variants (Booth 2016). An in-detail descriptive statistics are provided in later sections.

Test Statistics

Given the proposed hypotheses, two groups of statistical models are used (including parametric and non-parametric alternatives): contingency models (χ2 and Fisher’s exact test) and t-test (e.g., Student’s t-test, Welch’s t-test, Mann-Whitney U test). Although the aim is to perform the statistical analysis on 2x2 contingency tables, which are commonly employed by the Chi-square test, we included Fisher’s exact test as a more accurate measure for small samples, especially in cases where expected frequencies in cells are < 5 (Kim 2017). The Chi-square test only provides an approximate measure, even though Chi-square provides a more accurate measure on large samples. We primarily rely on Student’s and Welch’s t-tests to test the mean difference between proposed groups. However, since the existing body of scientometrics knowledge usually reports a normality violation, especially in the skewness of citation distributions, we use the Mann-Whitney U test as a non-parametric alternative. Lastly, considering that most of the existing research relies on the correlation and regression family of models, we provide results, in addition to effect sizes of investigated variables, to provide an understanding of the amount of variance explained and provided by the explored variables.
For assessing whether data violates assumptions of normality, the Shapiro-Wilk test is performed (p < 0.05). The Brown-Forsythe test is performed to assess whether the homogeneity of variance is violated (p < 0.05). This will ultimately determine whether data can be reliable and valid. In cases where these assumptions are broken, a non-parametric alternative is used instead. In addition, given that the extensive amount of work exists in the scientometrics regarding variables affecting citation impact, although additional inferential statistical values are presented (e.g., standard error estimates, effect sizes), the diagnosticity of two-sided p values via VS-MPR (Vovk-Sellke Maximum p Ratio) is performed (Sellke et al. 2001; Vovk 1993) to provide insights about the maximum possible odds in favour of the null or the alternative hypothesis.

Results

Descriptive Statistics

From the corpus of SLRs (Table 1), the evidence shows higher performance metrics on the side of top-ranked articles. For instance, the average CiteScore of top-ranked SLRs (x̄Mean-Top = 16.8 with 95%CISE[14.83, 18.03]) is much higher than bottom-ranked SLRs (x̄Mean-Top = 6.14 with 95%CISE[5.49, 6.83]), with median values placing more emphasis on the difference between the score of top-ranked (Med = 17.4, IQR = 10.6) and bottom-ranked SLRs (Med = 5.3, IQR = 4.4). The CoV (Coefficient of Variation) suggests similarity in groups, i.e., both samples are highly variable relative to the mean (~0.7). Lastly, it should be noted that 69 articles indexed in SCOPUS did not have an impact factor, out of which 62 articles were bottom-ranked SLRs.
The descriptive statistics of retrieved SLRs suggest that almost a quarter of the sample has no explicit RQ. Next, the CiteScore show slightly higher citation impact of studies with an explicit RQ considering both Median (MedTrue = 9.8, MedFalse = 7.3) and Mean values (x̄CiteScore-True = 11.58 with 95%CISE[10.56, 12.89]; x̄CiteScore-False = 9.93 with 95%CISE[8.51, 11.22]), with higher variation in studies that do have an explicit RQ (CoV = 0.94). The mean difference of PCN indicates a much higher citation rate in studies with the RQ (x̄PCN-True = 90.74 with 95%CISE[78.83, 104.72], x̄PCN-False = 55.61 with 95%CISE[40.94, 72.38])). It is important to note that both samples had the same WoS-IF when comparing Median scores (MedTrue = 3.9, IQRTrue = 5.7; MedFalse = 3.9, IQRFalse = 7.5). These results are similar in Mean scores (x̄WoS-IF-True = 5.57 with 95%CISE[5.05, 6.08], x̄WoS-IF-False = 5.00 with 95%CISE[4.15, 5.84])), which suggests that SLRs with and without RQ do not significantly differ from each other considering publication type.
Table 2. Descriptive Statistics RQ Split.
Feature RQ n Med Mean SE 95%CIU 95%CIL STD CoV IQR Var Min Max
CiteScore False 97 7.30 9.93 0.70 11.22 8.51 6.93 0.70 11.60 47.97 0.00 23.60
CiteScore True 294 9.80 11.58 0.64 12.89 10.56 10.91 0.94 12.80 119.09 0.00 138.00
WoS-IF False 97 3.90 5.00 0.42 5.84 4.15 4.09 0.82 5.70 16.76 0.00 12.80
WoS-IF True 294 3.90 5.57 0.27 6.08 5.05 4.56 0.82 7.50 20.79 0.00 35.60
PCN False 97 11.00 55.61 8.12 72.38 40.94 79.9 1.44 84.0 6390 0.00 392.0
PCN True 294 79.50 90.74 6.54 104.72 78.33 112.1 1.24 132.0 12567 0.00 1081
Note: Med = Median; SE = Standard Error of the Mean; 95%CIL = 95% confidence interval lower; 95%CIu = 95% confidence interval upper; STD = Standard Deviation; CoV = Coefficient of Variation; IQR = Interquartile Range; Var = Variance; Min = Minimum; Max = Maximum.
Finally, after splitting the sample of SLR studies into samples with and without QFL, the results suggest a significantly higher proportion of studies that did not use the RQ framework (nQFL-True = 17, nQFL-False = 374), i.e., QFL when constructing and proposing an explicit RQ. Next, the descriptive statistics indicate almost the same average point estimates when considering CiteScore and WoS-IF between studies with and without QFL. However, there is a slightly higher score when comparing CiteScore mean values in studies without the QFL (x̄CiteScore-False = 11.256 with 95%CISE[8.62, 11.20], x̄CiteScore-True = 9.30 with 95%CISE[10.49, 12.98]), with higher dispersion in studies without QFL explained by CoVQFL-False = 0.91 and CoVQFL-True = 0.5.
Table 3. Descriptive Statistics QFL Split.
Feature QFL n Med Mean SE 95%CIU 95%CIL STD CoV IQR Var Min Max
CiteScore False 374 9.80 11.26 0.53 11.20 8.62 10.26 0.91 13.60 105.35 0.00 138.00
CiteScore True 17 9.80 9.30 1.12 12.98 10.49 4.63 0.50 7.40 21.42 3.20 20.40
WoS-IF False 374 3.90 5.45 0.23 5.83 4.22 4.51 0.83 7.58 20.30 0.00 35.60
WoS-IF True 17 3.90 4.92 0.74 6.12 5.05 3.03 0.62 5.20 9.18 0.30 11.10
PCN False 374 43.50 81.49 5.46 96.23 43.18 105.6 1.30 118.8 11151 0.00 1081.0
PCN True 17 73.00 93.77 28.68 98.36 77.23 118.2 1.26 145.00 13982 3.00 466.0
Note: Med = Median; SE = Standard Error of the Mean; 95%CIL = 95% confidence interval lower; 95%CIu = 95% confidence interval upper; STD = Standard Deviation; CoV = Coefficient of Variation; IQR = Interquartile Range; Var = Variance; Min = Minimum; Max = Maximum.
Overall, the descriptive statistics provide interesting remarks. Namely, a quarter of SLR studies in the engineering-based domain do not have an explicit RQ, while more concerning is the fact that only 4.3% (17/391 SLRs) use an explicit QFL, i.e., RQ framework in designing and constructing their RQ.

Contingency Models

The results (Table 4) suggest that many articles that contain an explicit RQ are published, regardless of the class of engineering-based SLR defined. However, this difference is more prevalent in top-ranked SLRs when comparing within-group and bottom-ranked SLRs. The results of the contingency table suggest that 54.3% (159/293) propose an explicit RQ are placed within top-ranked SLRs. In contrast, 61.22% (60/98) of SLRs do not provide an explicit RQ and are bottom-ranked SLRs.
The Chi-square test statistics (Table 5) suggest a significant association between RQ and class (p = 0.009). After performing the diagnosticity of p values, the evidence suggests strong evidence favouring the alternative hypothesis (VS-MPR = 11.259), i.e., there exists an association between proposing an explicit RQ and class of SLRs and there is more than ten times higher likelihood of finding the evidence under the alternative hypothesis. The Fisher’s exact test (Table 6) report a significant association between the class of SLRs and RQ (p = 0.007). The odds ratio suggests that it is 0.5 less likely that RQ will appear in bottom-ranked SLRs, i.e., the top-ranked SLRs are 1.91 times more likely to propose an explicit RQ. However, although reported statistics are significant, the strength of the relationship shows a small effect size of φ = 0.138, as recommended by Cohen (1992).
Interestingly, the between-class analysis on whether SLRs have utilised QFL in their RQ design, the results (Table 7) show almost exact results with no association between them. Thus, there was no reported statistically significant association between QFL and RQ considering Chi-square (p = 0.812) and Fisher’s test statistic (p = 0.504).

Independent Samples’ Statistics

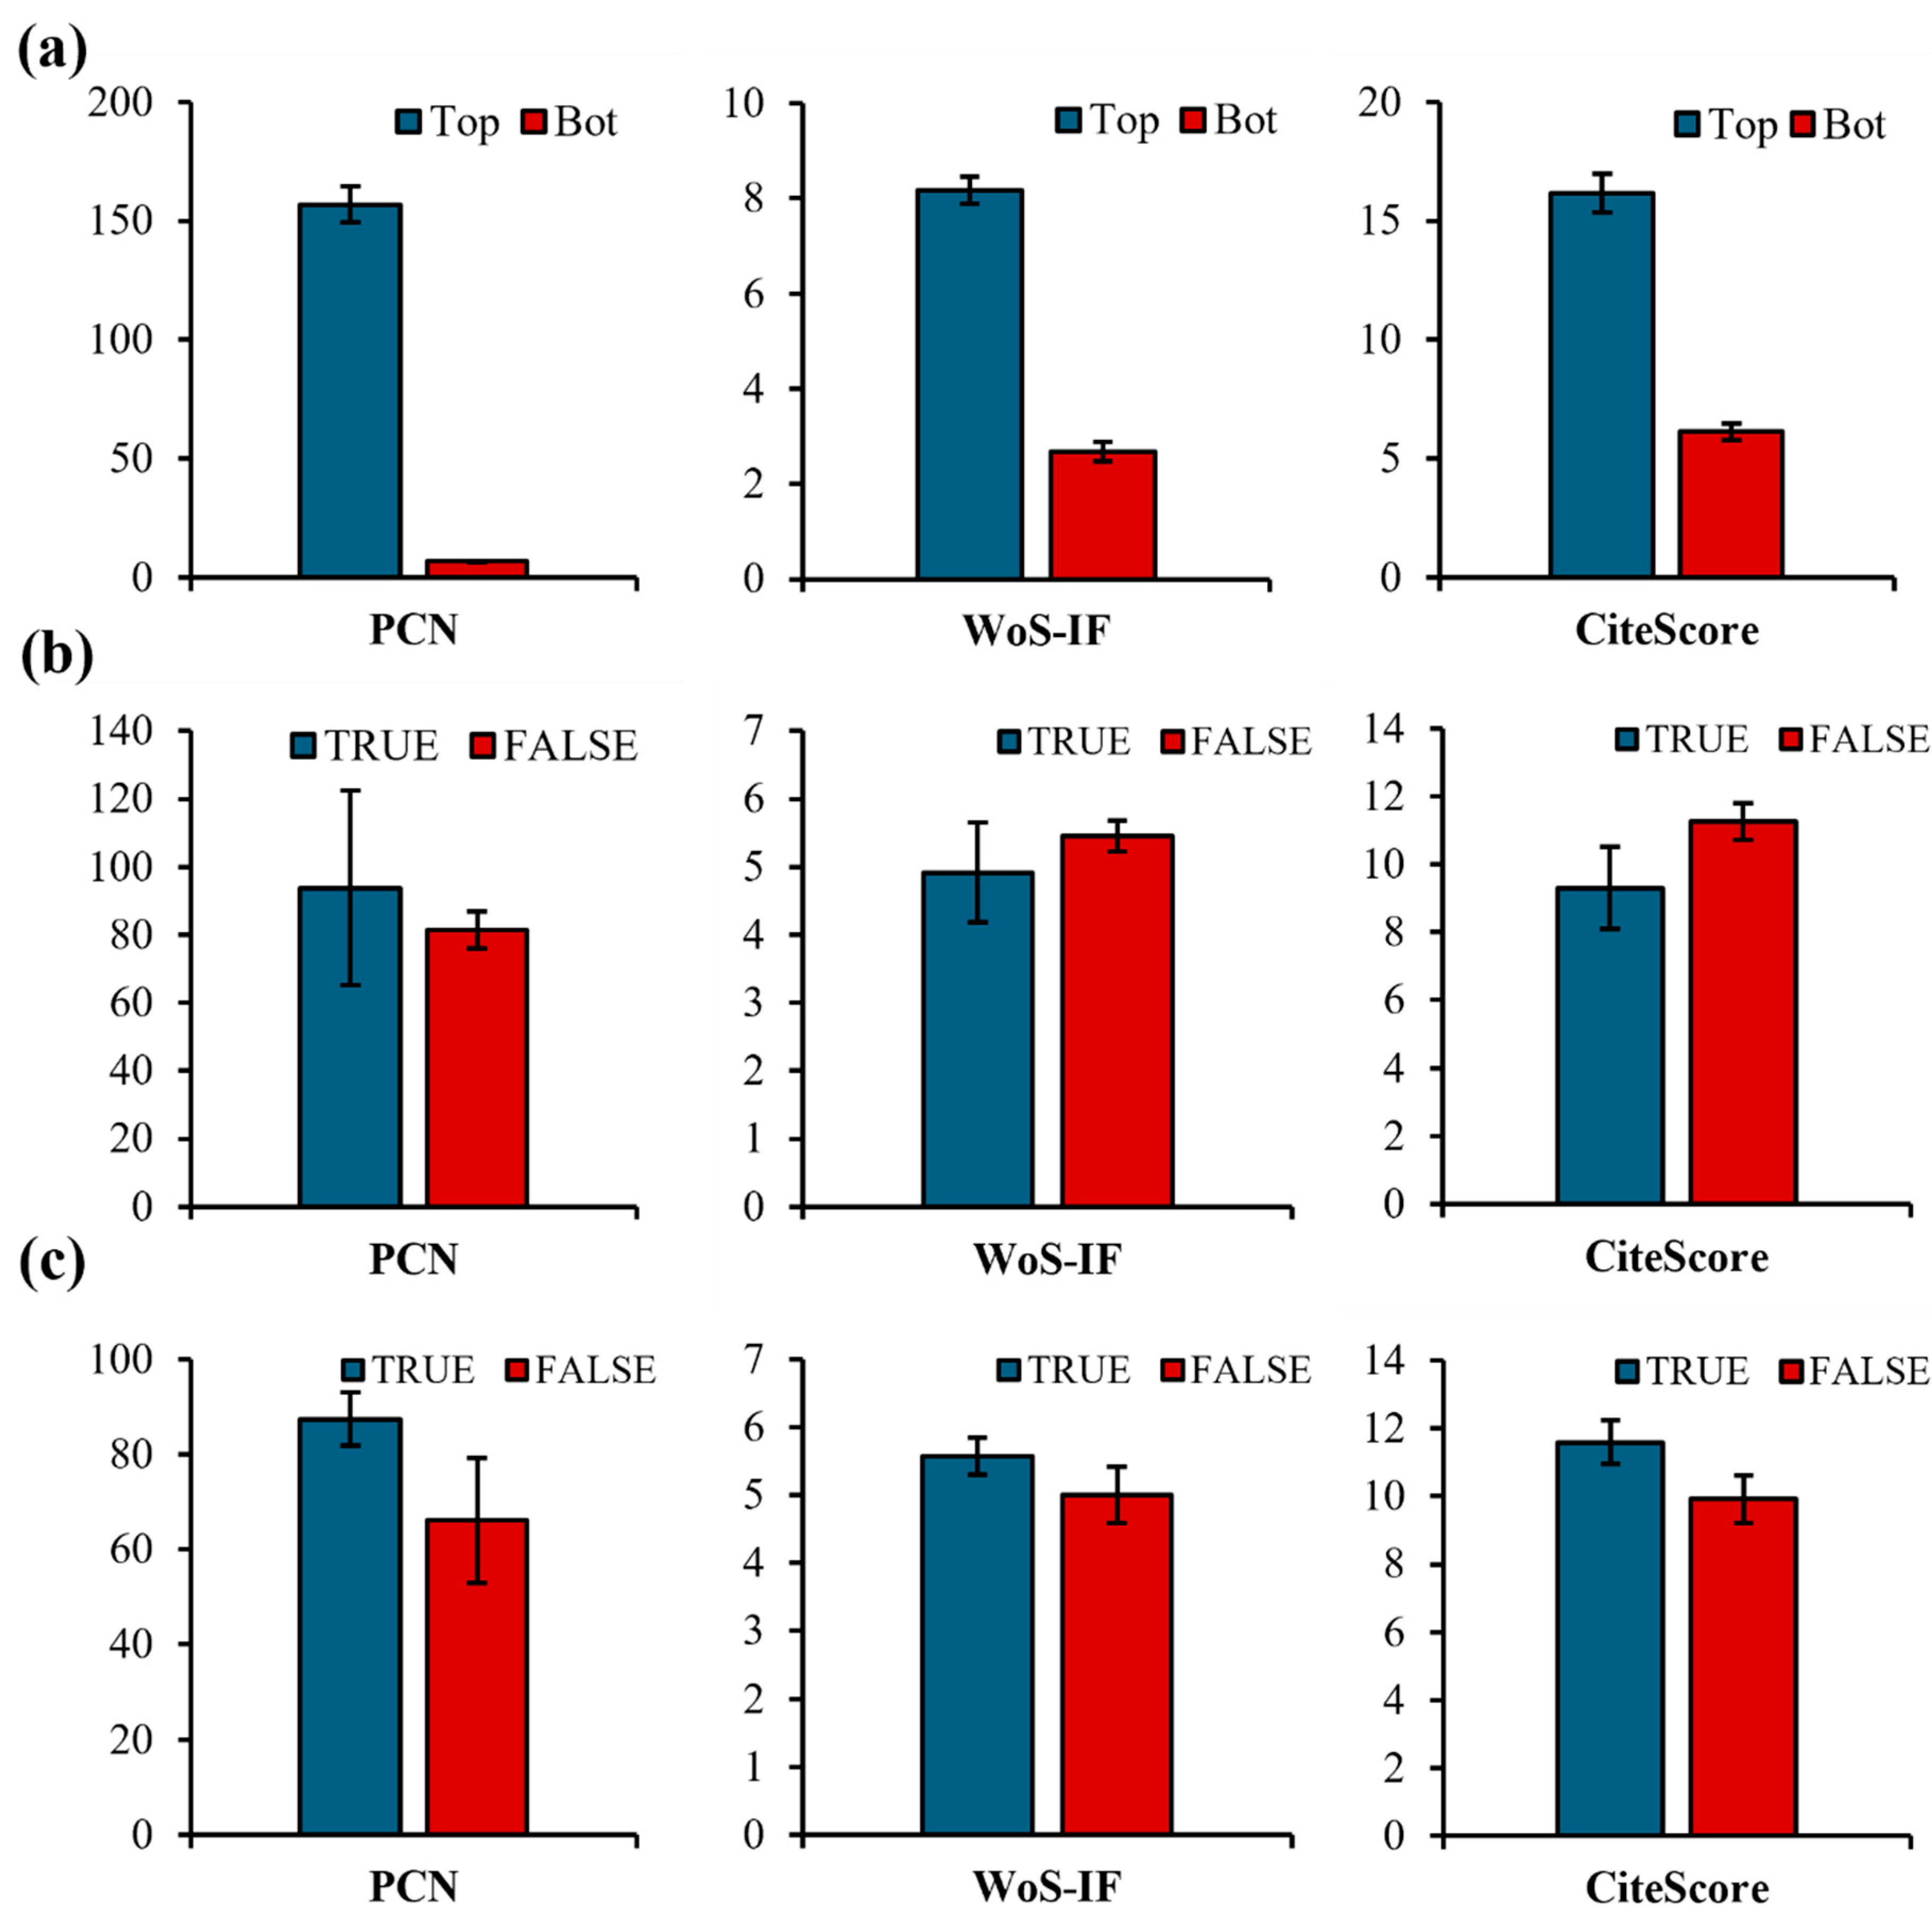
Descriptives are provided visually to gain more insights about the effects of samples. Namely, when comparing top- and bottom-ranked engineering-based SLRs, the data (a) exhibits a difference in means when considering PCN, WoS-IF, and CiteScore. Next, the QFL assessment (Figure 1b-left) suggests that papers that include QFL tend to receive higher citation counts; however, no statistically significant difference supports such claims. Surprisingly, contrasting QFL in WoS-IF (Figure 1b-middle) and (Figure 1b-right), the results show a higher tendency to include QFL in lower-ranked journals considering WoS-IF and CiteScore. Lastly, the RQ analysis (Figure 1c), suggests that SLRs with an explicit RQ may expect a higher citation rate (Figure 1c-left). This is also seen more in journals with higher WoS-IF (Figure 1c-middle) and CiteScore (Figure 1c-right). Therefore, additional inferential analysis is performed using parametric and non-parametric independent samples t-tests.
The results (Table 8) suggest that the Student’s t-test did not provide statistically significant results (p < 0.05) on whether the proposed RQ is seen more in journals with higher CiteScore. For the analysis of means between samples, Welch’s statistic (p = 0.041) can be considered more suitable given the unequal samples (true = 294, false = 97). However, although Brown-Forsythe did not suggest a violation of equality of variances (F = 1.075; p = 0.301), the normality assumption is violated in both samples per Shapiro-Wilk (WRQ-true = 0.893, WRQ-false = 0.591, p < 0.001). Thus, the non-parametric Mann-Whitney U test suggests that current evidence fails to reject the null (p = 0.117), which leads to the conclusion that there was not enough evidence that proposing RQ within SLRs is most likely to be present in journals (or conferences) with higher CiteScore. The performed analysis offers similar results when analysing WoS-IF (p > 0.05). Ultimately, this suggests that although there is a tendency that explicit RQ is most likely to be seen in journals with higher WoS-IF and CiteScore, the findings are inconclusive since the statistically significant difference is only reported per Welch’s t-test statistic but with violation of normality assumption.
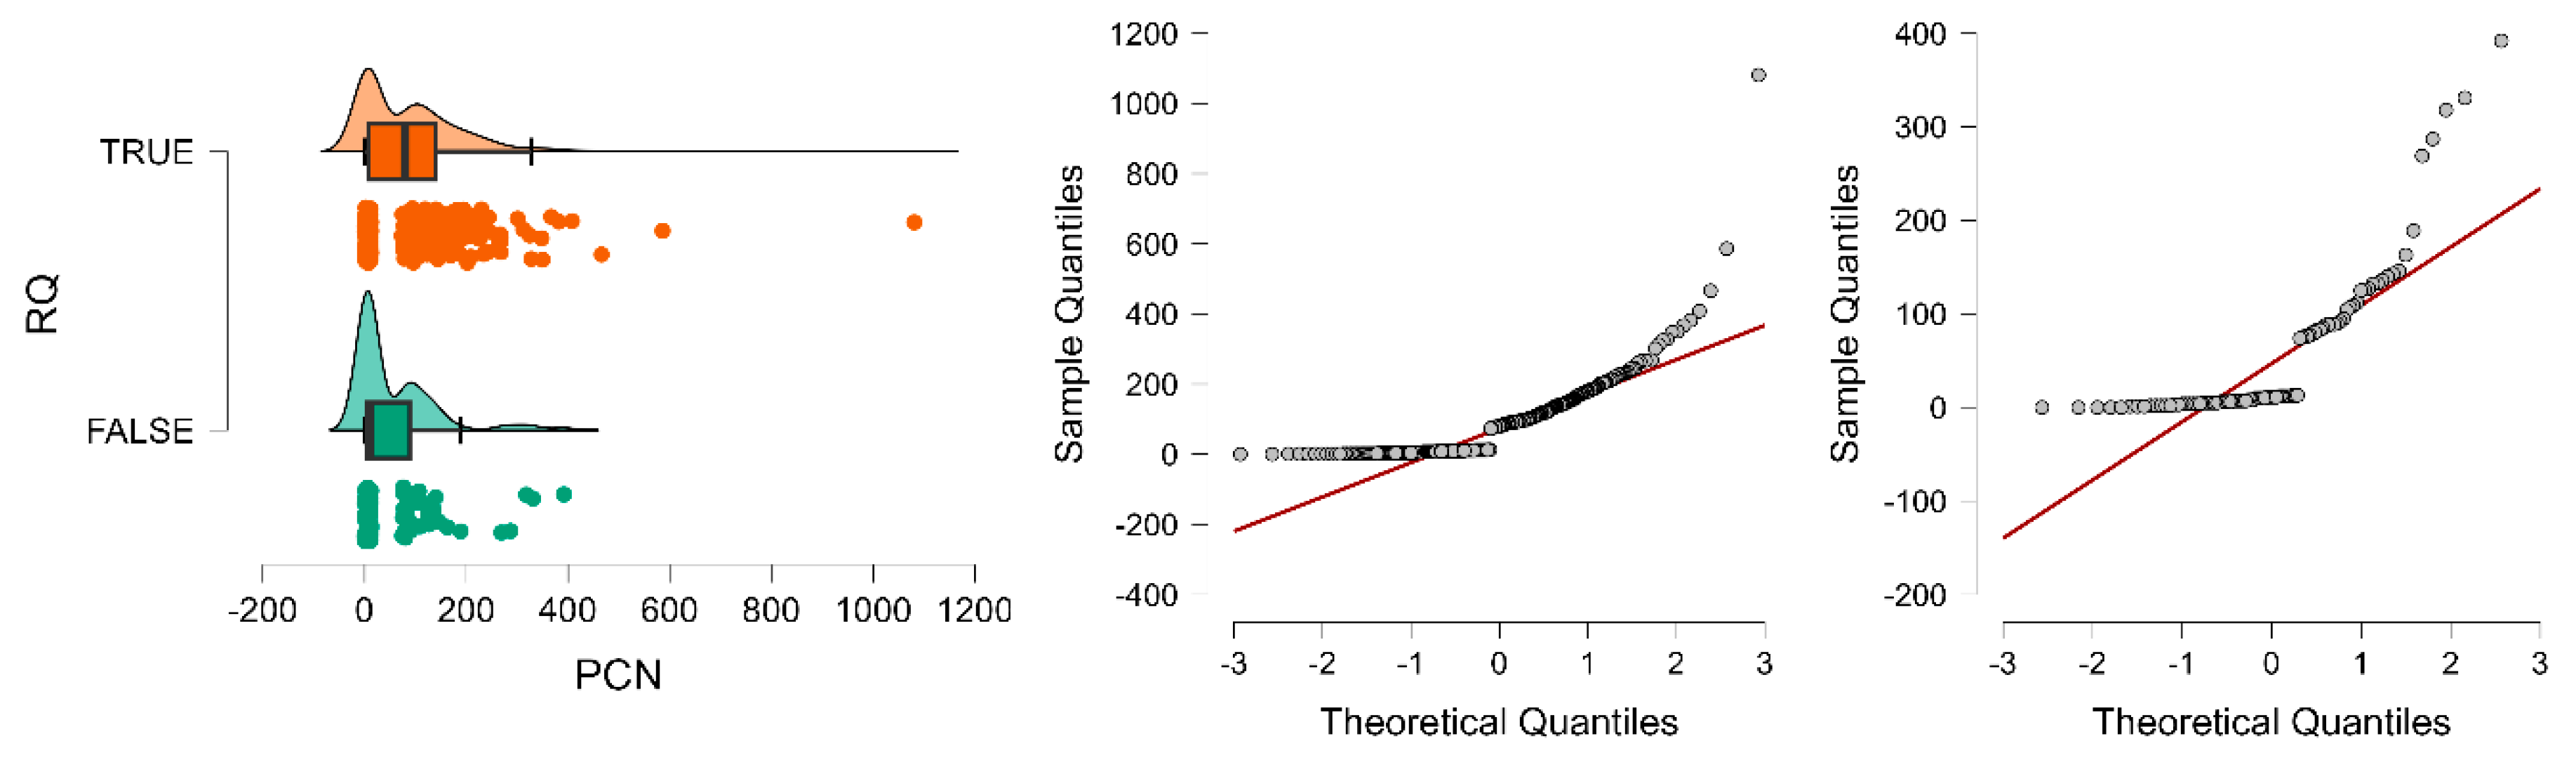
After contrasting the PCN scores based on the RQ split, the analysis suggests statistically significant results. Namely, both Student's (p = 0.002; VS-MPR = 26.652) and Welch's t-test (p < 0.001; VS-MPR = 108.211) suggest the presence of a significant difference. However, due to the presence of extreme values (outliers) of citations in particular studies (Figure 2-left), the Brown-Forsythe test suggests inequality of variances (p = 0.004). Shapiro-Wilk shows the absence of normality (p < 0.001) in both cases (Figure 2, middle and right). Thus, the interpretation relying on point (mean) estimates does not guarantee rigorous findings. Thus, turning to the Mann-Whitney U test as a non-parametric alternative, the evidence indeed suggests significant results (U = 10951, p < 0.001, VS-MPR = 149.6) but with small effect sizes (RBC = -0.232) per Cohen (2013).
Although the proposed findings indicate the presence of significant differences, a comparison is performed to investigate the presence of an effect within class categories. Thus, after performing the analysis of PCN within top-ranked SLRs, the results (Table 9) suggest no statistically significant difference in Student’s t-test (p = 0.086), while Welch’s t-test (p = 0.050) is on the borderline. Nevertheless, due to the violation of normality and inequality of samples, the Mann-Whitney U test is performed, and results suggest a significant difference (p = 0.009, VS-MPR = 8.351) with a small effect size (RBC = -0.248). Conversely, the analysis of bottom-ranked SLRs regarding PCN did not show statistically significant results considering both parametric and non-parametric test statistics.
Table 10. Independent sample test of bottom-ranked SLRs.
Test Statistic df p VS-MPR Effect Size* SE Effect Size
PCN Student -0.936 194 0.175 1.206 -0.145 0.156
Welch -0.921 71.594 0.180 1.193 -0.144 0.156
Mann-Whitney 3744.5 0.200 1.143 -0.075 0.090
Note: For the Student’s t-test and Welch’s t-test, the effect size is given by Cohen’s d, while for the Mann-Whitney U test, the effect size is given by the Rank Biserial Correlation (RBC).
Overall, a general trend suggests that SLRs with an explicit RQ tend to receive higher PCN, indicating an influence of clearly defined RQ within top-ranked engineering-based SLRs. However, although this is consistent in the retrieved sample, the within-group comparison suggests that this trend is more common in journals with higher CiteScore or WoS-IF. Given that the violation of normality is observed in both samples, parametric Student’s and Welch’s tests show no significant evidence indicating that SLRs with explicit RQs receive more citations. Instead, due to violation of normality, the results of the Mann-Whitney U test support the trend that articles with explicit RQs tend to receive higher citations but within journals with higher CiteScore and WoS-IF. Still, the effect size suggests that practical significance might be limited.

Discussions and Conclusions

Study Findings

The disparity between the quality of SLR studies and their peer-review standard, as an active counterpart, is highlighted in the sense that SLRs are becoming more narrative and often avoid testing evidence behind the results of previous studies due to the lack of clear-cut RQ. Typical examples are seen through an ampliative rationale where authors use segways to justify starting an SLR by implying that the new information should be genuinely more interesting. This is why we suspect the authors often omit or are reluctant to propose an explicit research(able) question (Booth et al. 2019), leaving a reader questioning dubious findings that differ from the study's aims and objectives. We placed the idea under the hypothetical framework to add a more nuanced understanding of whether such practice affects research impact regarding citations.
The obtained findings suggest statistically significant results (p < 0.01) with ten times more likely to find such evidence under the alternative hypothesis (VS-MPR = 11.259), confirming that top-ranked SLRs are more likely to provide an explicit RQ at the start of their SLR study. Similarly, the findings are also supported by Fisher’s exact test statistics (p < 0.01). However, although existing evidence supports the fact that proposing an explicit RQ is a practice more common within higher-ranked SLR studies, the relationship suggests a small effect size (φ = 0.138). This is no surprise, considering the myriad factors affecting the impact of citations (Tahamtan et al. 2016) that ultimately places an SLR study in the top-ranked category. Such factors include authors-related impact, h index, previous publications, and even confounding effects of journal factors, which have also been confirmed here suggesting relatively high association between citations and CiteScore and WoS-IF (see Appendix 1). However, this is the first study to question the relationship of such phenomena, directly adding evidence about the importance of following protocols and rigor that affects the citation impact.
Moreover, by answering the proposed questions from the study, this also suggests that publications with higher CiteScore and WoS-IF place a “premium” on the clarity and relevance of the RQ, which was observed by both parametric and non-parametric statistics (p < 0.05). The second assumption about the role of RQ frameworks, i.e., QFLs, in elevating the confidence in obtained findings by constructing specific and focused RQ, presumably attracting more citations, did not offer significant findings. In fact, there was only a handful of studies (17/391) that utilised the RQ framework (e.g., PICO), and presumably, such findings would be more apparent in medical and health sciences. This ultimately indicates a potential area for methodological improvement in the engineering domain and the relevance of formulating clear and concise RQ that could impact citation metrics (Orošnjak et al. 2024; Solarino et al. 2024).
In sum, proposing an explicit RQ as a core part of the SLR directly guides the methodology and impacts the study outcome (Solarino et al. 2024). However, although RQs invoke new ideas, many SLRs lack substance behind arguments in delivering relevant and researchable questions. It seems plausible that researchers often (re)start their RQs when acknowledging and discovering new evidence along with previously published studies. Driven by the need to make a scientific footprint by working on improving citation-associated metrics and in fear of ‘publish or perish’ phenomena, many scientists engage in the scientific production of SLRs without significant efforts or a more profound understanding of the existing body of work for designing a relevant and valuable RQ. This raises another critical question: Do existing scientific practices, particularly those in the engineering-based domain, prioritise quality over quantity, or is the opposite true? Roberts and Ker (2015) argued that excessive SLR production has started generating research waste. To put these SLRs on the right path, we provide empirical evidence showcasing the importance of using an explicit RQ at the start of an SLR study, using a representative sample of engineering-based SCOPUS-indexed SLRs.

Implications

The study point out the statistical significance of formulating an explicit RQ in enhancing the citation impact of SLRs. The empirical evidence shows that top-ranked, more cited SLRs, tend to clearly articulate their RQs, suggesting a focus on their research objectives. This seems to be prioritised in high-impact journals and shows that there is a higher theoretical probability that such questions resonate more with the scientific community. In contrast, most lower-ranked SLRs use less clear and explicit RQs, leading to many inconclusive findings and a vague understanding of a particular SLR study. This is becoming a significant issue, as many authors simply provide a summary or overview of existing evidence and propose, often subjective, research agendas, frameworks or concepts without invoking new ideas or challenging existing ones. Such incoherence, lack of engagement and critical thinking to synthesise something genuine leads many authors to withdraw from proposing an explicit horizontal-type RQ and challenge previous findings, and often provide overview or summary of studies, especially with the rise of bibliometric softwares like VosViewer and Bibliometrix, and LLMs (Large Language Models) for simply generating a study by text mining of articles meta-data, ultimately failing to demonstrate significant contribution to the existing body of knowledge.
Acknowledging that most SLR studies are misused as narrative and vertical, the limited adoption of RQ frameworks, i.e., question formulation logic, demonstrates a lack of specificity and focus of the RQ. For such reasons, we argue that many SLRs do not differentiate between systematic and scoping reviews, eventually providing unclear and irrelevant findings. Such methodological gaps in structuring RQs using available frameworks (e.g., PICO) could potentially elevate the quality and impact of future SLRs in engineering. Implementing and adopting such practices will certainly aid greater impact and increase findings' validity and reliability by requiring to manifest knowledge capacity about a particular RQ of interest by switching attention from meta-data to content-based evidence.

Limitations

Although proposing an explicit RQ is beneficial, observed across and even within top-class comparison, the small effect sizes indicate that they are far from being sole determinants of citation impact. As most previous work revolves around articles’ meta-data factors, such as journal metrics, author metrics, and reference factors, it is difficult to generalise conclusions and understand the amount of variance explicit RQ has in such models. Especially since most of the previous findings are built upon regression models. Next, given that the study is performed within the engineering-based domain of journals and conference articles indexed in SCOPUS, the generalisation of findings to other scientific disciplines is limited. Also, there may be a potential bias in obtained findings since some SLR studies are more under the domain of medical and health sciences and were categorised and included in the sample. This may be the problem since filtering in SCOPUS classifyied such studies within engineering sciences. The major setback is that engineering-based SLRs may have obtained citations from other subdisciplines. This can often have confounding effects given that citations are used as raw values and are not normalised across fields, which is often when impact factor is criticised for including citations outside of the related discipline, and perhaps JCI (Journal Citation Indicator) may have offered a more unbiased assessment. Lastly, the study solely focuses on citation metrics and ignores other (alt)metrics and citation-related factors that are commonly used to predict scientific impact, thus offering only a one-dimensional view of the actual study impact (Adler et al. 2009; Eysenbach 2011).

Conflicts of Interest

The author declares no conflict of interest.

Appendix A

Table A1. Pearson’s and Spearman’s correlation coefficients.
Variable Parameters CiteScore WoS-IF
WOS-IF Pearson's r 0.737***
p value 0.001
Upper 95% CI 0.951
Lower 95% CI 0.541
Effect size (Fisher's z) 0.945
SE Effect size 0.051
Spearman's rho 0.903***
p value 0.001
Upper 95% CI 0.936
Lower 95% CI 0.863
Effect size (Fisher's z) 1.489
SE Effect size 0.057
PCN Pearson's r 0.330*** 0.445***
p value 0.001 0.001
Upper 95% CI 0.549 0.574
Lower 95% CI 0.216 0.337
Effect size (Fisher's z) 0.343 0.479
SE Effect size 0.051 0.051
Spearman's rho 0.644*** 0.627***
p value 0.001 0.001
Upper 95% CI 0.695 0.688
Lower 95% CI 0.581 0.557
Effect size (Fisher's z) 0.764 0.736
SE Effect size 0.054 0.054
Confidence intervals are based on 1000 bootstrapped replicates. *p < 0.05, ** p < 0.01, *** p < 0.001.
Figure A1. Heatmap of (a) Pearson’s correlation coefficient and (b) Spearman’s correlation coefficient (NOTE: The statistical significance is marked as *p < 0.05, ** p < 0.01, *** p < 0.001).
Preprints 182779 g0a1

References

  1. Adler, R., Ewing, J., & Taylor, P. (2009). Citation Statistics. Statistical Science, 24(1). [CrossRef]
  2. Aksnes, D. W. (2003). Characteristics of highly cited papers. Research Evaluation, 12(3), 159–170. [CrossRef]
  3. Booth, A. (2016). Searching for qualitative research for inclusion in systematic reviews: a structured methodological review. Systematic Reviews, 5(1), 74. [CrossRef]
  4. Booth, A., & Carroll, C. (2015). Systematic searching for theory to inform systematic reviews: Is it feasible? Is it desirable? Health Information and Libraries Journal, 32(3), 220–235. [CrossRef]
  5. Booth, A., Noyes, J., Flemming, K., Moore, G., Tunçalp, Ö., & Shakibazadeh, E. (2019). Formulating questions to explore complex interventions within qualitative evidence synthesis. BMJ Global Health, 4(Suppl 1), e001107. [CrossRef]
  6. Booth, A., Sutton, A., & Papaioannou, D. (2016). Systematic Approaches to a Successful Literature Review. (M. Steele, Ed.)SAGE Publications Ltd (2nd ed.). SAGE Publications Ltd.
  7. Bornmann, L., & Leydesdorff, L. (2017). Skewness of citation impact data and covariates of citation distributions: A large-scale empirical analysis based on Web of Science data. Journal of Informetrics, 11(1), 164–175. [CrossRef]
  8. Chawla, D. S. (2020). Science is getting harder to read. Nature index. https://www.nature.com/nature-index/news-blog/science-research-papers-getting-harder-to-read-acronyms-jargon.
  9. Chen, M.-C., Chen, S.-H., Cheng, C.-D., Chung, C.-H., Mau, L.-P., Sung, C.-E., et al. (2023). Mapping out the bibliometric characteristics of classic articles published in a Taiwanese academic journal in dentistry: A scopus-based analysis. Journal of Dental Sciences, 18(4), 1493–1509. [CrossRef]
  10. Cheng, K. L., Dodson, T. B., Egbert, M. A., & Susarla, S. M. (2017). Which Factors Affect Citation Rates in the Oral and Maxillofacial Surgery Literature? Journal of Oral and Maxillofacial Surgery, 75(7), 1313–1318. [CrossRef]
  11. Cohen, J. (1992). A power primer. Psychological Bulletin, 112(1), 155–159. [CrossRef]
  12. Cohen, J. (2013). Statistical Power Analysis for the Behavioral Sciences. Routledge. [CrossRef]
  13. Eysenbach, G. (2006). Citation Advantage of Open Access Articles. PLoS Biology, 4(5), e157. [CrossRef]
  14. Eysenbach, G. (2011). Can Tweets Predict Citations? Metrics of Social Impact Based on Twitter and Correlation with Traditional Metrics of Scientific Impact. Journal of Medical Internet Research, 13(4), e123. [CrossRef]
  15. Galiani, S., & Galvez, R. H. (2017). The Life Cycle of Scholarly Articles Across Fields of Research (No. 23447). Cambridge, MA.
  16. Hamburg, M. (1985). Basic Statistics: A Modern Approach (3rd ed.). Harcourt Brace Jovanovich.
  17. Jones, D., Snider, C., Nassehi, A., Yon, J., & Hicks, B. (2020). Characterising the Digital Twin: A systematic literature review. CIRP Journal of Manufacturing Science and Technology, 29, 36–52. [CrossRef]
  18. Judge, T. A., Cable, D. M., Colbert, A. E., & Rynes, S. L. (2007). What Causes a Management Article to be Cited—Article, Author, or Journal? Academy of Management Journal, 50(3), 491–506. [CrossRef]
  19. Kim, H.-Y. (2017). Statistical notes for clinical researchers: Chi-squared test and Fisher’s exact test. Restorative Dentistry & Endodontics, 42(2), 152. [CrossRef]
  20. Kung, J., Chiappelli, F., Cajulis, O. O., Avezova, R., Kossan, G., Chew, L., & Maida, C. A. (2010). From Systematic Reviews to Clinical Recommendations for Evidence- Based Health Care: Validation of Revised Assessment of Multiple Systematic Reviews (R-AMSTAR) for Grading of Clinical Relevance. The Open Dentistry Journal, 4(2), 84–91. [CrossRef]
  21. Lame, G. (2019). Systematic Literature Reviews: An Introduction. Proceedings of the Design Society: International Conference on Engineering Design, 1(1), 1633–1642. [CrossRef]
  22. Linares-Espinós, E., Hernández, V., Domínguez-Escrig, J. L., Fernández-Pello, S., Hevia, V., Mayor, J., et al. (2018). Methodology of a systematic review. Actas Urológicas Españolas (English Edition), 42(8), 499–506. [CrossRef]
  23. Liskiewicz, T., Liskiewicz, G., & Paczesny, J. (2021). Factors affecting the citations of papers in tribology journals. Scientometrics, 126(4), 3321–3336. [CrossRef]
  24. Methley, A. M., Campbell, S., Chew-Graham, C., McNally, R., & Cheraghi-Sohi, S. (2014). PICO, PICOS and SPIDER: A comparison study of specificity and sensitivity in three search tools for qualitative systematic reviews. BMC Health Services Research, 14(1). [CrossRef]
  25. Montori, V. M., Wilczynski, N. L., Morgan, D., & Haynes, R. B. (2003). Systematic reviews: a cross-sectional study of location and citation counts. BMC Medicine, 1(1), 2. [CrossRef]
  26. Munn, Z., Stern, C., Aromataris, E., Lockwood, C., & Jordan, Z. (2018). What kind of systematic review should I conduct? A proposed typology and guidance for systematic reviewers in the medical and health sciences. BMC Medical Research Methodology, 18(1), 5. [CrossRef]
  27. Nightingale, A. (2009). A guide to systematic literature reviews. Surgery (Oxford), 27(9), 381–384. [CrossRef]
  28. Oelen, A., Jaradeh, M. Y., Stocker, M., & Auer, S. (2020). Generate FAIR Literature Surveys with Scholarly Knowledge Graphs. In Proceedings of the ACM/IEEE Joint Conference on Digital Libraries in 2020 (pp. 97–106). New York, NY, USA: ACM. [CrossRef]
  29. Orošnjak, M., Jocanović, M., Čavić, M., Karanović, V., & Penčić, M. (2021). Industrial maintenance 4(.0) Horizon Europe: Consequences of the Iron Curtain and Energy-Based Maintenance. Journal of Cleaner Production, 314, 128034. [CrossRef]
  30. Orošnjak, M., Štrbac, B., Vulanović, S., Runje, B., Horvatić Novak, A., & Razumić, A. (2024). RCE (rationale–cogency–extent) criterion unravels features affecting citation impact of top-ranked systematic literature reviews: leaving the impression…is all you need. Scientometrics. [CrossRef]
  31. Richardson, W. S., Wilson, M. C., Nishikawa, J., & Hayward, R. (1995). The well-built clinical question: a key to evidence-based decisions. ACP Journal Club, 123(Nov-Dec), 1–3.
  32. Roberts, I., & Ker, K. (2015). How systematic reviews cause research waste. The Lancet, 386(10003), 1536. [CrossRef]
  33. Rother, E. T. (2007). Revisão sistemática X revisão narrativa. Acta Paulista de Enfermagem, 20(2), v–vi. [CrossRef]
  34. Royle, P., Kandala, N.-B., Barnard, K., & Waugh, N. (2013). Bibliometrics of systematic reviews: analysis of citation rates and journal impact factors. Systematic Reviews, 2(1), 74. [CrossRef]
  35. Sellke, T., Bayarri, J. M., & Berger, J. O. (2001). Calibration of p Values for Testing Precise Null Hypotheses. The American Statistician, 55(1), 62–71.
  36. So, M., Kim, J., Choi, S., & Park, H. W. (2015). Factors affecting citation networks in science and technology: focused on non-quality factors. Quality & Quantity, 49(4), 1513–1530. [CrossRef]
  37. Soheili, F., Khasseh, A. A., Mokhtari, H., & Sadeghi, M. (2022). Factors Affecting the Number of Citations: A Mixed Method Study. Journal of Scientometric Research, 11(1), 01–14. [CrossRef]
  38. Solarino, A. M., Rose, E. L., & Luise, C. (2024). Going complex or going easy? The impact of research questions on citations. Scientometrics, 129(1), 127–146. [CrossRef]
  39. Tahamtan, I., Safipour Afshar, A., & Ahamdzadeh, K. (2016). Factors affecting number of citations: a comprehensive review of the literature. Scientometrics, 107(3), 1195–1225. [CrossRef]
  40. Torres-Carrion, P. V., Gonzalez-Gonzalez, C. S., Aciar, S., & Rodriguez-Morales, G. (2018). Methodology for systematic literature review applied to engineering and education. In 2018 IEEE Global Engineering Education Conference (EDUCON) (pp. 1364–1373). IEEE. [CrossRef]
  41. Uthman, O. A., Okwundu, C. I., Wiysonge, C. S., Young, T., & Clarke, A. (2013). Citation Classics in Systematic Reviews and Meta-Analyses: Who Wrote the Top 100 Most Cited Articles? PLoS ONE, 8(10), e78517. [CrossRef]
  42. Vieira, E. S., & Gomes, J. A. N. F. (2011). The journal relative impact: an indicator for journal assessment. Scientometrics, 89(2), 631–651. [CrossRef]
  43. Vovk, V. G. (1993). A Logic of Probability, with Application to the Foundations of Statistics. Journal of the Royal Statistical Society. Series B (Methodological), 55(2), 317–351.
  44. Wagner, G., Prester, J., Roche, M. P., Schryen, G., Benlian, A., Paré, G., & Templier, M. (2021). Which factors affect the scientific impact of review papers in IS research? A scientometric study. Information & Management, 58(3), 103427. [CrossRef]
  45. Xie, J., Gong, K., Cheng, Y., & Ke, Q. (2019). The correlation between paper length and citations: a meta-analysis. Scientometrics, 118(3), 763–786. [CrossRef]
  46. Xie, J., Gong, K., Li, J., Ke, Q., Kang, H., & Cheng, Y. (2019). A probe into 66 factors which are possibly associated with the number of citations an article received. Scientometrics, 119(3), 1429–1454. [CrossRef]
  47. Yu, T., Yu, G., Li, P.-Y., & Wang, L. (2014). Citation impact prediction for scientific papers using stepwise regression analysis. Scientometrics, 101(2), 1233–1252. [CrossRef]
  48. Zong, Q., Xie, Y., & Liang, J. (2020). Does open peer review improve citation count? Evidence from a propensity score matching analysis of PeerJ. Scientometrics, 125(1), 607–623. [CrossRef]
Figure 1. Description of publication citation count (left), Web of Science Impact Factor (middle) and SCOPUS CiteScore metric (right) considering the split by (a) class, (b) question formulation logic, and (c) RQ.
Preprints 182779 g001
Figure 2. Comparison of SLRs with RQ (left) and QQ plots of (middle) having RQ and (right) without the RQ.
Preprints 182779 g002
Table 1. Descriptive Statistics Class Split.
Feature Class n Med Mean SE 95%CIL 95%CIU STD CoV IQR Var Min Max
CiteScore Top 196 17.40 16.18 0.81 14.83 18.03 11.39 0.70 10.60 129.82 0.00 138.0
CiteScore Bot 195 5.30 6.14 0.35 5.49 6.83 4.83 0.79 4.40 23.34 0.00 23.60
WoS-IF Top 196 8.90 8.17 0.29 7.61 8.79 4.05 0.50 7.20 16.36 0.00 35.60
WoS-IF Bot 195 2.50 2.67 0.20 2.26 3.08 2.85 1.07 3.90 8.12 0.00 12.10
PCN Top 196 126.5 156.8 7.5 143.6 173.2 105.8 0.67 92.75 11189 73.0 1081.0
PCN Bot 195 7.00 6.81 0.28 6.26 7.32 3.91 0.57 7.00 15.30 0.00 13.00
Note: Med = Median; SE = Standard Error of the Mean; 95%CIL = 95% confidence interval lower; 95%CIu = 95% confidence interval upper; STD = Standard Deviation; CoV = Coefficient of Variation; IQR = Interquartile Range; Var = Variance; Min = Minimum; Max = Maximum.
Table 4. Contingency table RQ and Class.
Class-Top Class-Bot Total
RQ-FALSE 37 60 98
Unstandardised residuals -11.624 11.624
Pearson’s residuals -1.667 1.671
Standardised residuals -2.722 2.722
RQ-TRUE 159 135 293
Unstandardised residuals 11.624 -11.624
Pearson’s residuals 0.958 -0.96
Standardised residuals 2.722 -2.722
Total Count 196 195 391
Table 5. The chi-square test statistic of RQ and Class.
χ2 Tests Value df p VS-MPR
χ² raw 7.410 1 0.009 11.259
χ² continuity correction 6.785 1 0.009 8.540
Likelihood ratio 7.465 1 0.009 11.536
Table 6. Log odds ratio of RQ and Class.
Raw value 95%CIL 95%CIU Log Odds Ratio Log95%CIL Log95%CIU p
Odds ratio 0.524 0.327 0.837 -0.647 -1.117 -0.178
Fisher's exact test 0.524 0.317 0.858 -0.645 -1.148 -0.153 0.007
Table 7. Contingency table of QFL and Class.
Class-Top Class-Bot Total
QFL-FALSE 187 187 374
Unstandardised residuals -0.478 0.478
Pearson residuals -0.035 0.035
Standardised residuals -0.237 0.237
QFL-TRUE 9 8 17
Unstandardised residuals 0.478 -0.478
Pearson residuals 0.164 -0.164
Standardised residuals 0.237 -0.237
Total Count 196 195 391
Table 8. Independent sample test statistics.
Test Statistic df p VS-MPR Effect Size SE Effect Size
CiteScore Student -1.402 389 0.081 1.809 -0.164 0.118
Welch -1.744 260.424 0.041 2.803 -0.181 0.118
Mann-Whitney 13112.5 0.117 1.466 -0.080 0.068
WoS-IF Student -1.086 389 0.139 1.340 -0.127 0.117
Welch -1.146 180.758 0.127 1.406 -0.131 0.117
Mann-Whitney 13404.5 0.186 1.175 -0.060 0.068
PCN Student -2.855 389 0.002 26.652 -0.334 0.120
Welch -3.371 229.359 < 0.001 108.211 -0.361 0.120
Mann-Whitney 10951 < 0.001 149.593 -0.232 0.068
Table 9. Independent sample test of top-ranked SLRs.
Test Statistic df p VS-MPR Effect Size* SE Effect Size
PCN Student -1.374 194 0.086 1.750 -0.251 0.185
Welch -1.671 71.594 0.050 2.472 -0.274 0.185
Mann-Whitney 2211.5 0.009 8.352 -0.248 0.105
Note: For the Student’s t-test and Welch’s t-test, the effect size is given by Cohen’s d, while for the Mann-Whitney U test, the effect size is given by the Rank Biserial Correlation (RBC).
Disclaimer/Publisher’s Note: The statements, opinions and data contained in all publications are solely those of the individual author(s) and contributor(s) and not of MDPI and/or the editor(s). MDPI and/or the editor(s) disclaim responsibility for any injury to people or property resulting from any ideas, methods, instructions or products referred to in the content.
Copyright: This open access article is published under a Creative Commons CC BY 4.0 license, which permit the free download, distribution, and reuse, provided that the author and preprint are cited in any reuse.
Prerpints.org logo

Preprints.org is a free preprint server supported by MDPI in Basel, Switzerland.

Subscribe

Disclaimer

Terms of Use

Privacy Policy

Privacy Settings

© 2025 MDPI (Basel, Switzerland) unless otherwise stated