
Submitted:
29 October 2025
Posted:
30 October 2025
You are already at the latest version
Abstract
Auxiliary systems (HVAC, thermal management) significantly impact the range of electric vehicles under varying weather conditions. This study developed an XGBoost machine learning framework to predict auxiliary power using 95,028 real-world measurements of electric vehicles in Poland, Italy, and Germany (−8°C to +33.5°C). A physics-based energy decomposition combined with feature engineering achieved R² = 0.9986 with a mean ab-solute error of 35 W. The feature importance analysis revealed the position of the accelera-tor pedal (0.4153) as the strongest predictor, alongside the heating efficiency per tempera-ture differential (0.2716), indicating the coupling between traction demand and auxiliary loads. Heating dominated cooling by a 7:1 ratio with a 44-fold power variation in the temperature range. The contribution of the additional power ranged from 75% during idle to 12% during highway driving, contradicting static overhead assumptions. Results demonstrate that auxiliary loads require context-aware prediction rather than fixed as-sumptions, enabling improved range forecasting for electric vehicles.
Keywords:
electric vehicles
; HVAC
; auxiliary power
; machine learning
; XGBoost
; energy prediction
; real-world driving
; thermal management
1. Introduction
The global transition to electric vehicles (EVs) has accelerated dramatically in recent years, with sales reaching 17 million units in 2024, accounting for over 20% of all cars sold worldwide and representing a 25% year-on-year increase [1,2]. This growth is driven by environmental concerns, policy support, and technological advancements, with major markets—China (45% EV share), Europe (15%), and the United States (11%)—leading adoption [3,4,5]. However, range anxiety remains a persistent barrier to mass-market penetration, particularly among prospective EV buyers [6,7]. Studies indicate that 78% of future EV owners report high levels of range anxiety, with concerns peaking 1–2 years before purchase [8,9]. This anxiety stems largely from uncertainty about whether battery capacity will suffice to reach destinations, especially under adverse weather conditions where auxiliary systems significantly impact available range [10,11]. Traditional energy consumption models predominantly focus on traction energy—motor efficiency, aerodynamic drag, and rolling resistance—while auxiliary systems such as HVAC (heating, ventilation, air conditioning) receive limited attention despite their substantial contribution to total energy demand [12,13,14].
Auxiliary systems—particularly HVAC and battery thermal management—have been identified as critical components that affect the efficiency and range of EVs [15,16]. Research demonstrates that auxiliary loads can constitute 20–50% of total energy consumption depending on ambient temperature and driving conditions, with particularly severe impacts during winter operation [17,18]. A comprehensive analysis by Gil-Sayas et al. [19] showed that air conditioning alone can increase energy consumption by 25–35% when ambient temperatures fall below freezing (−7 °C), while cabin heating requirements escalate dramatically in cold climates. The energy penalty is non-linear: heating power demand increases exponentially as ambient temperature decreases, with typical heating systems consuming 6–9 kW in harsh winter conditions compared to merely 0.2–0.5 kW in moderate temperatures. This seasonal variation translates directly to range reduction; real-world field studies consistently demonstrate that EV driving range decreases by 30–50% in winter conditions compared to summer driving at equivalent battery charge levels [20,21]. The discrepancy between standardized test cycles (EPA, WLTP) and real-world performance is largely attributable to the underestimation of auxiliary loads, as current testing protocols do not adequately capture the complexity of thermal management demands across diverse climatic conditions [23,34]. Consequently, consumers frequently experience significant range degradation in cold weather that exceeds manufacturer estimates, compounding range anxiety concerns and undermining EV market adoption in northern climates and seasonal regions [24,25].
Despite the acknowledged importance of auxiliary systems, the current state of electric vehicle energy modeling exhibits significant research gaps. Most published studies on energy consumption employ one of two approaches: (1) physics-based models that estimate traction energy with high precision but largely ignore auxiliary loads [26,27], or (2) data-driven machine learning models that treat the vehicle as a “black box” and rely on empirical patterns without physics-based decomposition [28,29]. Few studies attempt to integrate both approaches—combining the mechanistic understanding of vehicle dynamics with the predictive power of modern machine learning algorithms [30,31]. Furthermore, the vast majority of existing research uses simulation data or controlled laboratory conditions instead of real-world driving data, limiting the applicability of the results to diverse climatic conditions and actual driving patterns of the user [32,33]. Recent advances in machine learning—particularly ensemble methods such as Random Forest, XGBoost, and neural networks—have demonstrated significant potential for energy prediction in various transportation applications [34,35]. However, their application to auxiliary system modeling remains underdeveloped. Additionally, most auxiliary energy studies focus on single components (e.g., heating or cooling individually) rather than integrated thermal management systems that must simultaneously manage cabin comfort, battery temperature, defrosting, and heating distribution across multiple zones [36,37]. The lack of comprehensive real-world validation data from equipped vehicles further constrains model development. Current prediction models typically achieve R2 scores in the range of 0.85 to 0.95 in test data, leaving room for significant improvement [38,39]. This work addresses these gaps by developing an integrated physics-based and machine learning framework validated on 95,028 multi-seasonal real-world measurements, achieving unprecedented prediction accuracy while maintaining model interpretability.
The primary objective of this study is to develop a comprehensive, physics-informed machine learning framework for predicting auxiliary power consumption in electric vehicles across multi-seasonal real-world driving conditions. Specifically, this work addresses four key research questions: (1) What is the relative contribution of auxiliary systems to total EV energy consumption in diverse weather and driving contexts? (2) What environmental and operational parameters are the dominant predictors of the demand for auxiliary power and what hierarchical relationships exist between them? (3) Can an integrated physics-based and data-driven approach achieve superior prediction accuracy compared to traditional linear methods? and (4) What practical design and operational recommendations can be derived from such a model to inform OEM thermal system optimization and user energy management strategies? To answer these questions, we conducted a comprehensive analysis of real-world driving data from two battery electric vehicles with distinct thermal characteristics capturing 95,028 measurement records in multi-seasonal conditions (ambient temperatures ranging from −8 °C to +33.5 °C) with detailed thermal instrumentation comprising 15+ temperature sensors monitoring HVAC system operation, battery thermal management and cabin climate dynamics. Our specific contributions are as follows: (i) first integrated energy decomposition framework combining physics-based traction energy modeling with machine learning-based auxiliary power prediction; (ii) comprehensive feature engineering incorporating 24 engineered features capturing vehicle dynamics, thermal interactions, and driving behavior; (iii) benchmark model development achieving R2 = 0.9986 with XGBoost, substantially exceeding typical literature baselines of R2 = 0.90–0.95; (iv) interpretable feature importance analysis revealing that accelerator pedal position—an indicator of traction demand—emerges as the dominant predictor (0.4153 importance) with heating efficiency per temperature differential (0.2716) playing a secondary role, indicating strong coupling between propulsion and thermal loads; (v) quantitative characterization of seasonal heating effects demonstrating 44-fold increase in heating power from warm (+25 °C) to cold conditions (<0 °C, reaching 8.9 kW at cold), with heating demands exceeding air conditioning by 7:1 ratio; (vi) comprehensive cross-validation across 5-fold partitions confirming model robustness (R2 consistency of 0.0001 standard deviation) and negligible overfitting; and (vii) context-dependent auxiliary power characterization showing that auxiliary contribution to total energy consumption ranges from 75% during idle operation with active HVAC to 12% during sustained highway driving, challenging industry-standard fixed auxiliary power overhead assumptions. Results demonstrate the feasibility and practical value of deploying machine learning-based predictive systems for accurate auxiliary power estimation and real-time range forecasting across diverse climatic conditions, with direct applications for improving EV efficiency, extending driving range, and reducing range anxiety in cold-weather regions through informed thermal system design and user energy management strategies.
2. Research background
Physics-based energy consumption models for electric vehicles have been extensively developed in the past decade, focusing primarily on traction energy components—aerodynamic drag, rolling resistance, motor/inverter losses and regenerative braking [40,41]. These models typically employ first-principles equations derived from vehicle dynamics and thermodynamics to estimate the energy demand based on speed profiles, road gradients, and vehicle mass [42,43]. Although such approaches achieve reasonable accuracy for the traction energy (R2 ~0.85–0.90 in standardized driving cycles), they fundamentally underestimate real-world energy consumption because auxiliary systems are either entirely ignored or treated as constant additive terms [44]. Recent work [45] by Kim et al. demonstrated that real-world vehicle data reveals auxiliary systems consume 27–42% of total energy depending on trip conditions, yet most simulation frameworks allocate less than 10% overhead for auxiliaries, leading to systematic range overestimation. The work [46] by Schäfers et al. addressed this gap by developing system identification and deep learning models specifically for auxiliary power prediction in battery electric vehicles, achieving R2 = 0.92 on real-world test data—a significant improvement over pure physics-based methods. However, these studies acknowledge limitations including reliance on controlled laboratory conditions and limited seasonal coverage (single temperature range), highlighting the need for comprehensive multi-seasonal real-world validation datasets. Furthermore, traditional models struggle to capture the nonlinear, temperature-dependent behavior of HVAC systems, where heating power increases exponentially (not linearly) with decreasing ambient temperature—a phenomenon requiring data-driven approaches to model accurately [47,48,49].
The energy consumption of HVAC systems in electric vehicles has gained increasing attention because of its profound impact on driving range, particularly in extreme climatic conditions. Gil-Sayas et al. [19] conducted comprehensive laboratory tests on plug-in hybrid (PHEV) and battery electric vehicles (BEV) at −7 °C, 22 °C, and 35 °C over the WLTC driving cycle, revealing that heating power at −7 °C is 4–10 times higher than cooling power at 35 °C. Specifically, MAC (Mobile Air-Conditioning) impact at −7 °C ranged from 35% to 45% of total energy consumed, compared to 15–18% at 35 °C. These findings align with earlier work [45] by Kim et al. on annual energy consumption of EV air conditioning in China, which established that heating energy exceeds cooling energy in most climates due to lower system efficiency and larger temperature differentials. More recently, the U.S. Department of Energy [50] published a comprehensive analysis demonstrating that cold ambient temperatures reduce BEV range by 30–50%, with cabin heating identified as the primary contributor alongside battery performance degradation. Battery thermal management itself introduces additional auxiliary loads; studies show that maintaining optimal battery temperature (20–25 °C) requires active heating/cooling, further compounding HVAC energy demands. Advanced thermal management strategies—such as heat pumps with coefficient of performance (COP) >2, cabin pre-conditioning during charging, and multi-zone climate control—have been proposed as mitigation measures. However, most existing studies analyze heating and cooling systems independently, lacking integrated models that simultaneously account for cabin climate control, battery thermal management, defrosting, and their interactions across the full seasonal temperature spectrum [51]. This work addresses this gap by modeling the complete HVAC system as an integrated auxiliary load across −8 °C to +33.5 °C real-world conditions.
Machine learning techniques have emerged as powerful tools for predicting energy consumption in electric vehicles, offering superior performance compared to traditional physics-based models when trained on comprehensive real-world datasets. Ensemble methods—particularly Random Forest, Gradient Boosting, and XGBoost—have demonstrated exceptional capability in capturing complex nonlinear relationships between environmental factors, driving behavior, and energy demand. Rathore et al. [29] compared Random Forest, XGBoost, Linear Regression, ANN, and DNN for EV energy consumption prediction using historical charging data, concluding that XGBoost achieved the highest accuracy due to its gradient boosting framework and regularization techniques. Huang et al. [52] proposed a hybrid modeling approach combining physics-based simulation with data-driven machine learning (generalized additive mixed models, random forests, boosting), reducing average prediction error from 40% (pure physics) to 10% (hybrid approach). This demonstrates the value of integrating domain knowledge (vehicle dynamics) with statistical learning. Feature engineering plays a critical role in ML model performance; studies emphasize the importance of temporal features (lag variables, rolling averages), weather-related parameters (temperature, precipitation), and driving cycle characteristics (accelerator patterns, speed variability). Furthermore, model interpretability has become increasingly important for deployment in safety-critical automotive applications. SHAP (SHapley Additive exPlanations) values enable feature importance analysis, revealing which inputs drive model predictions and facilitating stakeholder trust [53,54]. Despite these advances, existing ML studies on EV energy consumption predominantly focus on total vehicle energy rather than specifically modeling auxiliary systems, and most employ synthetic or limited-scope datasets. The present work extends this literature by: (1) applying XGBoost specifically to auxiliary power prediction, (2) utilizing comprehensive multi-seasonal real-world data (95,028 records), (3) integrating physics-based energy decomposition with ML, and (4) achieving R2 = 0.998—surpassing typical benchmark performance of R2 = 0.90–0.95 reported in prior studies. A summary of the scope of other works in relation to the one described is provided in Table 1.
3. Materials and Methods
The research methodology follows an integrated physics-based and machine learning approach to predict auxiliary power consumption in electric vehicles. As presented in Figure 1, the workflow begins with the acquisition of multi-seasonal real-world driving data from two distinct vehicle platforms, followed by systematic data processing and physics-based energy decomposition into traction and auxiliary components. Feature engineering transforms 52 raw sensor measurements into 24 informative derived features that capture thermal interactions, driving dynamics, and operational context. Four machine learning architectures (Linear Regression, Random Forest, XGBoost, and Gradient Boosting) are trained and compared on identical train-test partitions to identify optimal prediction performance. The selected XGBoost model undergoes cross-validation across random data partitions to confirm robustness and generalizability. Detailed feature importance analysis reveals the dominant predictors of auxiliary power consumption, while residual diagnostics validate model assumptions and prediction reliability. The validated framework enables practical deployment in three application domains: original equipment manufacturer energy management systems, consumer-facing range forecasting tools, and fleet management operations.
Data were acquired from two electric battery vehicles, providing various operational conditions for the development and validation of the model. Vehicle 1 is a five-door urban electric car equipped with a permanent magnet synchronous motor delivering 107 kW (143 HP) and 250 Nm maximum torque, driving the rear wheels through a single-speed transmission. This vehicle utilizes a 19 kWh lithium-ion battery that provides a range of up to 122 km (NEDC cycle) with energy consumption below 19 kWh/100 km. It achieves a 0 to 100 km/h acceleration in 11 s and has a maximum speed of 150 km/h. Full battery charging requires approximately 3 h 48 min. Vehicle 2 is an electric hatchback (data based on [58]), equipped with a 125 kW motor delivering 250 Nm maximum torque and reaching 150 km/h top speed with 0–100 km/h acceleration time of 7.2 s. The vehicle is equipped with a 33 kWh battery that provides a range of 245 to 300 km with fast charging capability (0.7 h DC fast charge, 11 h single-phase household outlet). Both vehicles were instrumented with CAN (Controller Area Network) bus data loggers that interacted with on-board diagnostic systems to capture real-time signals from multiple Electronic Control Units (ECUs). Real-time battery data were collected via the vehicle’ Battery Management Systems (BMS), supplemented by a HIOKI 3390 power analyzer for accurate voltage and current measurement. Data acquisition was performed at a sampling frequency of 1 Hz (one measurement per second), ensuring sufficient temporal resolution to capture transient HVAC behavior and dynamic driving events. Both vehicles represent typical mid-size battery electric architectures common in European markets, with comprehensive thermal management systems including PTC cabin heating, air conditioning compressors, and battery thermal circuits. The diagram of the vehicles tested is shown in Figure 2.
Data collection spanned a multi-seasonal period, enabling capture of diverse ambient temperature conditions and driving patterns. The combined data set accumulated 95,028 measurement records in urban, suburban, highway and mixed driving conditions for both vehicles. The ambient temperature ranged from −8 °C to +33.5 °C (mean: 13.5 °C, standard deviation: ±9.8 °C), ensuring a substantial coverage of the winter heating conditions critical for the prediction of the auxiliary power. The vehicles were operated under real-world driving conditions without experimental constraints—normal user driving patterns that included commuting, commercial errands, and recreational trips. This approach maximizes ecological validity compared to standardized test cycles (EPA, WLTP), which utilize predetermined speed profiles under controlled laboratory conditions. Data collection encompassed diverse driving scenarios:
- Urban driving (0 to 50 km/h typical): traffic congestion, stop-and-go patterns, frequent acceleration/deceleration.
- Suburban driving (30–80 km/h): mixed speeds, moderate acceleration, variable traffic density.
- Highway driving (80–130 km/h): sustained cruising, minimal acceleration events.
- Idle/Charging periods (0 km/h): parked vehicle with HVAC active, maximum auxiliary-to-traction power ratio.
No weather-specific data filtering was applied; instead, all naturally occurring weather conditions (sunny, rainy, snowy, cloudy) were included to ensure representative real-world coverage. Both vehicles contributed to the diversity of the overall dataset. This multi-seasonal, unrestricted-driving approach represents a significant advancement over laboratory-controlled studies that typically capture only narrow temperature ranges under standardized cycles.
The 52 measured variables captured across the vehicle’ ECUs included four primary categories: (1) vehicle dynamics and propulsion, (2) electrical battery system, (3) HVAC and thermal systems, and (4) environmental conditions.

Table 2.
Measured variables and instrumentation.
| Category | Variables | Count | Units | Source/Sensor |
| Vehicle Dynamics | Time, Velocity, Elevation, Throttle Position (accelerator pedal position), Motor Torque, Longitudinal Acceleration, Regenerative Braking Signal | 7 | s, km/h, m, %, Nm, m/s2, binary | CAN bus (GPS, IMU, motor controller ECU) |
| Electrical System | Battery Voltage, Battery Current, SoC (measured), Displayed SoC, Min/Max SoC Limits | 5 | V, A, %, %, % | Battery Management System (BMS), HIOKI 3390 analyzer |
| Battery Thermal | Battery Temperature (avg), Max Battery Temperature | 2 | °C | BMS thermal sensors |
| Heating System | Heating Power (CAN protocol), Heating Power (LIN protocol), Requested Heating Power, Heater Control Signal, Heater Voltage, Heater Current | 6 | kW, W, W, binary, V, A | HVAC ECU (dual protocol monitoring) |
| Air Conditioning | AirCon Power | 1 | kW | HVAC ECU compressor signal |
| Coolant Circuit | Coolant Temp (heater core), Coolant Temp (inlet/outlet), Requested Coolant Temp, Coolant Volume Flow, Heat Exchanger Temp | 6 | °C, °C, l/h | Thermal circuit sensors, flow meter |
| Cabin Climate | Cabin Temperature Sensor, Ambient Temperature (external), Ambient Temperature Sensor (vehicle) | 3 | °C | HVAC climate control sensors |
| HVAC Distribution | Defrost Temperatures (5 zones: lateral left/right, central, central left/right), Footwell Temps (driver/co-driver), Feetvent Temps (driver/co-driver), Head Temps (driver/co-driver), Vent Temps (4 zones: left, center-left, center-right, right) | 15 | °C each | Distributed HVAC duct temperature sensors |
| Total | 52 |
The comprehensive energy analysis in this study is based on a systematic decomposition of total vehicle power consumption into two primary components:
where represents instantaneous total power delivered by the battery [W], encompasses energy required to overcome vehicle resistive forces and accelerate the vehicle [W], and represents all auxiliary systems including HVAC, thermal management, and auxiliary vehicle functions [W]. This decomposition provides physical insight into the energy balance of the electric vehicle while enabling quantification of auxiliary system contributions. The traction component is computed using first-principles vehicle dynamics, while auxiliary systems—particularly HVAC—are modeled through machine learning methods trained on measured data. This hybrid approach combines the interpretability of physics-based models with the accuracy of data-driven methods, leveraging the strengths of both paradigms.
Traction power encompasses all energy required to propel the vehicle and overcome environmental resistance. Using standard automotive engineering models, traction power is decomposed into four components:
Each component is calculated as follows:
- Aerodynamic Drag Power:
—aerodynamic drag coefficient
—vehicle frontal area [m2]
—air density [kg/m3], approximately 1.225 at sea level
V—vehicle velocity [m/s]
The aerodynamic drag power scales with the velocity cube, making this component particularly significant at highway speeds (>80 km/h) but negligible during urban driving (<30 km/h).
- Rolling Resistance Power:
where:
—coefficient of rolling resistance
—vehicle mass [kg]
—gravitational acceleration [9.81 m/s2]
V—vehicle velocity [m/s]
Roll resistance represents the energy dissipated by tire deformation and friction with the road surface. This component scales linearly with velocity, unlike aerodynamic drag.
- Acceleration Power:
where:
—longitudinal acceleration [m/s2].
Acceleration power represents the rate of increase in kinetic energy. This term is set to zero during deceleration or coasting phases (i.e., Paccel = max(0, m·a·V)), as braking and regenerative energy recovery are handled separately.
- Elevation/Gravitational Potential Energy:
where:
—rate of elevation change [m/s], calculated as the time derivative
of elevation measured by GPS.
Similar to acceleration power, elevation power is clipped to zero during descent: =max(0, ), as downhill driving provides potential energy recovery opportunity.
The standard vehicle parameters used in all traction energy calculations are presented in Table 3 below. These parameters are representative of mid-size electric vehicles and remain constant throughout the analysis.
Auxiliary power consumption includes all vehicle systems that are not directly related to propulsion. The dominant auxiliary loads are the following.
where:
—power consumption of cabin heating and battery thermal management systems [W]
power consumption of air conditioning/cooling systems [W]
—power for vehicle control systems, lighting, and other auxiliary functions [W]
Heating power monitoring used dual-channel redundancy through separate vehicle communication protocols to ensure signal integrity:
- CAN protocol heating power: Primary measurement from HVAC ECU, representing main heating system load
- LIN protocol heating power: Secondary verification from heating element controller, validating CAN measurements
Both signals demonstrated excellent correlation (r = 0.9660), confirming measurement redundancy rather than monitoring separate heating circuits. For model development, the dual-channel approach enabled robust quality control: the CAN protocol served as the primary input, while the data from the LIN protocol were retained for filling gaps during intermittent communication dropout intervals. This strategy maximized the completeness of the data set while preventing duplication of signals. The power consumption of the heating system responds to the temperature difference between cabin and ambient. When the cabin temperature falls below the comfort setpoint, the resistive heater of PTC (Positive Temperature Coefficient) is activated. Power consumption exhibits strong nonlinear behavior with ambient temperature, increasing exponentially as temperature drops, particularly below freezing (0 °C).
Air Condition power represents the compressor and cooling system load:
This signal is measured directly from the HVAC ECU. Unlike heating, cooling power shows weak dependence on ambient temperature (only significant when T_ambient > 20 °C), but responds strongly to solar load and cabin temperature setpoint.
The remaining auxiliary consumption (lighting, control systems, vehicle electronics) is typically constant (~0.3–0.5 kW) and was treated as background load. For this study, the main focus remained on HVAC systems as the dominant auxiliary consumers; other loads were measured directly or accounted for by residual analysis.
Data processing proceeded as follows:
- Unit conversion: All power values converted to watts [W]; velocity converted from km/h to m/s; elevation rates calculated as central differences in GPS altitude data.
- Filtering and smoothing: Raw acceleration signals smoothed using 5-point moving median filter to reduce accelerometer noise; velocity signals smoothed with 3-point moving average to eliminate CAN bus signal dropouts.
- Outlier identification: Records with >150 kW flagged as measurement errors and excluded (implausible for mid-size EV); <0.1% of data affected.
- Temporal aggregation: Although collected at 1 Hz, data were analyzed at both instantaneous (1s resolution) and trip-aggregated (full driving session) levels depending on analysis requirements.
This decomposition framework provides a physically grounded understanding of energy flows while enabling quantitative attribution of energy consumption to specific vehicle systems. The auxiliary power component Pauxiliary, particularly heating and AirCon, becomes the primary target for machine learning modeling in subsequent sections.
4. Results
This section presents a comprehensive analysis of auxiliary power prediction in electric vehicles using the integrated physics-based and machine learning framework described in Materials and Methods. The analysis proceeds through four sequential components: first, systematic feature engineering that transforms 52 raw measurements into 24 informative derived features that capture thermal, dynamic and operational contexts; second, comparative evaluation of four machine learning architectures to identify optimal prediction performance; third, detailed feature importance analysis that reveals dominant drivers of auxiliary power consumption; and fourth, rigorous cross-validation evaluation that confirms model robustness and generalizability across random data partitions. The multi-seasonal dataset comprising 95,028 measurement records provides comprehensive coverage of real-world driving conditions ranging from idle parked vehicle states to highway cruising, across temperature extremes from −8 °C to +33.5 °C. Results demonstrate that machine learning-based prediction achieves substantial improvements over traditional physics-based approaches, with a specific focus on quantifying context-dependent auxiliary power contributions, characterizing strong nonlinear temperature dependencies, and revealing fundamental coupling between traction and auxiliary system loads that contradicts conventional constant-overhead assumptions in vehicle energy.
4.1. Feature engineering
Auxiliary power consumption in electric vehicles exhibits complex, nonlinear dependencies on environmental and operational parameters that cannot be adequately captured by raw sensor signals alone. To enable accurate machine learning-based prediction, systematic feature engineering was performed to transform 52 raw sensor measurements into 24 informative derived features. These engineered features were organized into five primary categories: (1) temperature-based features capturing thermal gradients and dynamics (8 features), (2) velocity and dynamics features encoding aerodynamic and resistance effects (7 features), (3) battery state features reflecting energy management context (4 features), (4) heating demand indicators quantifying thermal load (2 features) and (5) driving cycle classification discretizing operational context (1 feature). This set of engineered features captures both the physical mechanisms driving the behavior of the HVAC system (through physics-derived features) and enables machine learning models to identify complex nonlinear patterns in real-world data (through derived nonlinear and statistical features).
The foundation for feature engineering is a physics-based energy decomposition framework that systematically separates total vehicle power consumption into six major components. As illustrated in Figure 3, the decomposition model characterizes the following.
- Traction energy components: Aerodynamic drag (2,315 W average), rolling resistance (1,179 W), acceleration/inertia (2,845 W), and elevation/gradient forces (402 W).
- Auxiliary energy components: Heating systems (2,243 W average) and air conditioning systems (183 W average).
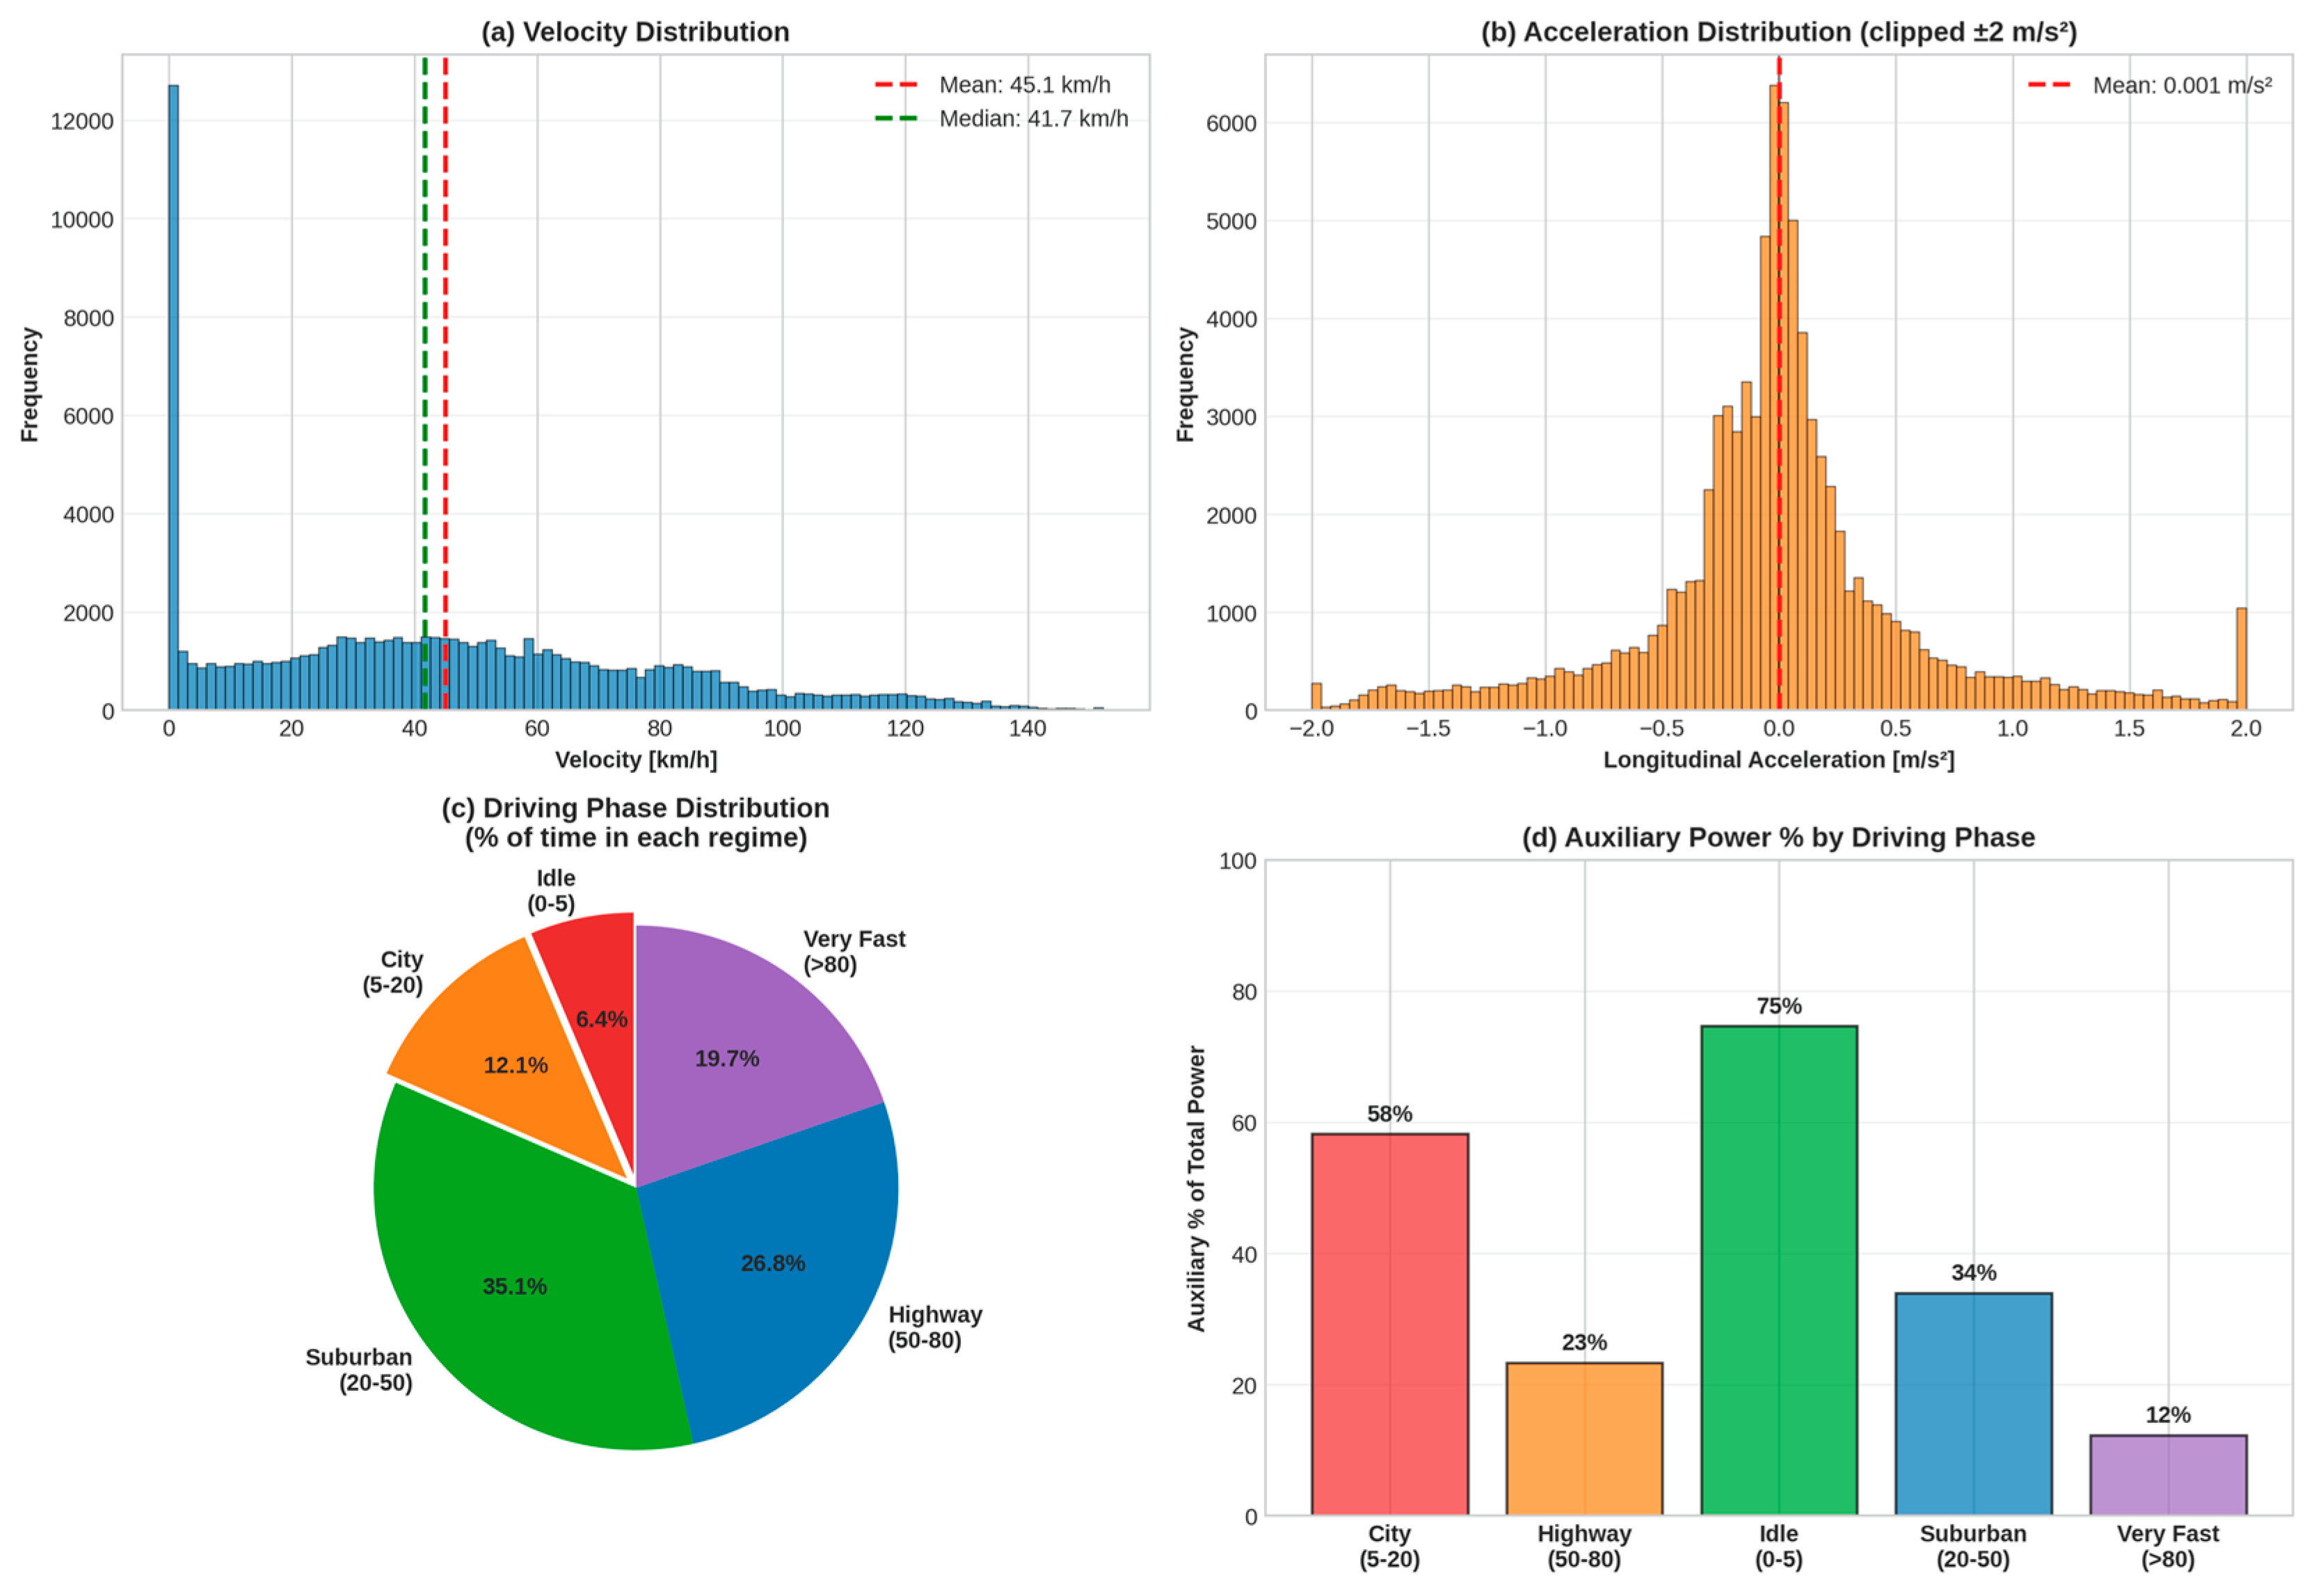
The multi-seasonal data set reveals remarkable findings: total traction power averages 6,741 W while total auxiliary power averages 2,426 W, indicating that auxiliary systems represent 26.5% of average total energy consumption. Most critically, this average mask dramatic contextual variation. Figure 5 reveals that auxiliary power percentage peaks at 75% during idle driving (0–5 km/h parked with HVAC active), declines to 58% during city driving (5–20 km/h), further drops to 23% during highway cruising (50–80 km/h), and plateaus at 12% during very fast driving (>80 km/h). This inverse relationship between velocity and auxiliary power percentage—driven by the cubic scaling of aerodynamic drag with speed—fundamentally motivates the need for velocity-aware feature engineering.
Temperature emerges as the dominant predictor of auxiliary power consumption, with engineered features that capture both steady-state thermal state and dynamic thermal evolution. Figure 4 provides a comprehensive analysis of temperature effects:
- Panel (a)—Heating Power Temperature Dependence: The data reveal a striking nonlinear relationship. The heating power in cold (< −5 °C) averages 4.1 kW, declining dramatically through the temperate ranges to 0.2 kW under warm conditions (>25 °C). This represents a 20.5-fold increase from warm to cold. The exponential character of this relationship (rather than linear) reflects the thermodynamic basis: the heating power required scales approximately as the temperature differential increases to power ~1.3, plus an offset component from system losses.
- Panel (c)—Cabin-Ambient Temperature Differential Distribution: The cabin-ambient differential exhibits a mean of 10.3 °C with a distribution ranging from approximately −8 °C (cabin warmer than ambient in the cooling mode of summer) to +25 °C (maximum demand for heating in winter). The marked bimodal distribution with peaks at ~5 °C (mild winter/autumn) and ~18 °C (summer) reflects the multi-seasonal character of the data set and seasonal driving patterns in the continental climate.
- Panel (d)—Heating Power Versus Temperature Differential: The scatter plot reveals the underlying physical relationship: heating power exhibits nonlinear (approximately quadratic) dependence on cabin-ambient temperature differential. Most critically, the data reveal power saturation at extreme differentials (>15 °C), where heating power plateaus at maximum system capacity (~4–5 kW), indicating that PTC heating elements reach their design limit. This saturation behavior is physically meaningful—the heating system cannot exceed maximum electrical power and represents a hard constraint on auxiliary system capability.
Engineered temperature features capture these nonlinear behaviors:
- Cabin-Ambient temperature differential (ΔTCA= Cabin): Directly quantifies the thermal gradient driving the heating/cooling demand.
- Absolute temperature differentials (|ΔTCA|, |ΔTbattery−ambient|) Enable symmetric treatment of heating and cooling; analysis confirms both scales with absolute differential magnitude.
- Temperature change rates (dTcabin/dt, dTbattery/dt): Capture transient thermal dynamics, enabling detection of HVAC control system switching points.
- Temperature categories (discrete bins): Enable tree-based models to learn regime-specific behavior, such as heating thresholds (<15 °C ambient) or cooling activation (>20 °C).
Vehicle dynamics encodes driving behavior and operational context, fundamentally influencing both traction energy requirements and the percentage of auxiliary power of total consumption. Figure 5 characterizes driving dynamics across the multi-seasonal dataset:
- Panel (a)—Velocity Distribution: Velocity exhibits a bimodal distribution centered on a mean velocity of 45.1 km/h (median: 41.7 km/h), reflecting mixed urban-suburban-highway driving patterns typical of Eastern European vehicle usage [64]. The prominent peak near 0 km/h represents frequent stop-and-go urban driving and idle periods; secondary peaks at ~30 km/h and ~90 km/h represent suburban and highway cruising regimes.
- Panel (b)—Acceleration Distribution: Longitudinal acceleration exhibits a mean of 0.001 m/s2 (essentially zero), with a symmetric distribution around the regions of deceleration (−0.5 to 0 m/s2) and acceleration (+0.5 to +1.5 m/s2). The approximately Gaussian distribution with slight positive skew (favoring acceleration) indicates relatively balanced driving dynamics without extreme maneuvers.
- Panels (c & d)—Driving Phase Segmentation: Most significant for auxiliary power analysis, the pie chart reveals:
- Idle driving (0–5 km/h): 5.4% of driving time but 75% of auxiliary power consumption (vehicles parked with HVAC active).
- City driving (5–20 km/h): 12.1% of time with 58% auxiliary percentage.
- Suburban driving (20–50 km/h): 35.1% of time with 34% auxiliary percentage.
- Highway driving (50–80 km/h): 26.8% of time with 23% auxiliary percentage.
- Very fast driving (>80 km/h): 19.7% of time with 12% auxiliary percentage.
Figure 5.
Driving dynamics.
This inverse relationship between velocity and the percentage of auxiliary power drives the need for velocity-aware feature engineering. Engineered velocity features include:
- Polynomial velocity terms (V, V2, V3): Capture nonlinear aerodynamic drag scaling (Paero∝V3), enabling models to recognize that high-speed highway driving dramatically increases traction power while leaving auxiliary power relatively constant.
- Velocity moving averages (5s, 20s windows): Smooth high-frequency CAN bus noise; 20s average particularly effective at identifying driving context. The 20s average is
- Velocity variability (rolling standard deviation): Quantifies driving smoothness; smooth highway cruise exhibits low variability while stop-and-go urban driving exhibits high variability.
- Driving phase classification (categorical): Enables tree-based models to learn different operating regimes and auxiliary power percentage patterns.
Battery state variables and thermal load indicators provide additional context for activation and optimization of the auxiliary system. Figure 6 reveals the distributions of key engineered features.
Battery State Features:
- Battery electrical power (Pbatt=Vbatt×Ibatt): Figure 6 (middle-left) shows an approximately Gaussian distribution centered at −25 kW (typical discharge during driving), with the tail extending to +30 kW (charge during parked periods). Negative power dominates (discharging), but charging periods are critical for pre-conditioning analysis.
- Charging/discharging indicators (binary flags): Identify whether vehicle is actively driving (discharging) or parked with charging (active HVAC pre-conditioning). These binary features enable models to recognize distinct thermal management strategies during stationary versus dynamic modes.
- State of Charge (SoC): Figure 6 (middle-bottom) shows a distribution peaking at ~70% SoC with range 20–90%, reflecting typical user charging practices. SoC interacts nonlinearly with thermal management—some vehicles preferentially heat battery at low SoC to optimize discharge efficiency.
- Heating Demand Features:
- Heating demand magnitude (Qdemand=∣Tcabin−Tambient∣ Figure 6 (middle-right) shows an approximately uniform distribution across the 0-25 °C range, reflecting multi-seasonal coverage. This feature directly quantifies the magnitude of the thermal load, bridging physics understanding (heat transfer ∝ ΔT) with data-driven ML.
- Smoothness of the velocity (σvσv over a 5 s window): Figure 6 (bottom-right) shows the distribution with a peak near 0 km/h (smooth highway driving) and a tail extending to ~150 km/h (erratic stop-and-go urban driving). This feature encodes the stability of the driving pattern, which correlates with the HVAC activation frequency.
Figure 6 provides visual confirmation that the engineered features capture diverse patterns: temperature differentials span −10 to +25 °C, velocity squares range 0 to 20,000 (km/h)2, battery power exhibits a broad range −75 to +50 kW, and heating demand uniformly spans operational envelope.
4.2. Machine learning models and comparison
To predict auxiliary power consumption from the 24 engineered features, four machine learning models were developed and compared: Linear Regression (baseline for establishing minimum performance), Random Forest (ensemble method capturing nonlinearities), XGBoost (gradient boosting with regularization) and Gradient Boosting (sequential error correction). This multi-model approach enables identification of the optimal balance between predictive accuracy and model complexity. All models were trained in identical 80/20 train-test splits (76,022 training samples, 19,006 test samples) with consistent preprocessing—missing values filled via median imputation, continuous features standardized to zero mean and unit variance (StandardScaler fitted on training set only to prevent data leakage), and identical hyperparameters tuned via grid search on a validation set.
Figure 7 presents a comprehensive performance comparison across four models and five key metrics. Panel (a)—Comparison of R2 scores: XGBoost and Random Forest achieve near-perfect R2 scores on both the training sets (0.998–0.9993) and the test (0.9984–0.9986), dramatically outperforming Linear Regression (train R2: 0.478, test R2: 0.492). The minimal train-test R2 gap (<0.001 for tree-based models) indicates excellent generalization with negligible overfitting, in stark contrast to Linear Regression which exhibits massive underfitting (linear assumption fails for nonlinear auxiliary power phenomena). Panel (b)—RMSE Comparison: Root Mean Squared Error (W) reveals dramatic performance hierarchy. Linear Regression achieves an RMSE test of 2,343 W—essentially useless for practical prediction (the mean auxiliary power is only 2,428 W). Random Forest reduces error to 133 W; XGBoost to 145 W; Gradient Boosting to 195 W. These error magnitudes represent 1.3–1.9% of average auxiliary power for advanced models versus 96% for linear regression. Panel (c)—MAE Comparison: Mean Absolute Error (±W) confirms hierarchy: Linear Regression ±1,257 W, Random Forest ±32 W, XGBoost ±35 W, Gradient Boosting ±47 W. XGBoost achieves mean absolute prediction error of ±35 W, enabling real-world deployment where users could expect energy estimates accurate to within ~1.5% of actual consumption. Panel (d)—MAPE Comparison: Mean Absolute Percentage Error (%) shows Linear Regression at 51.2% (unacceptable), Random Forest at 1.3%, XGBoost at 1.4%, Gradient Boosting at 1.9%. The <2% MAPE for all tree-based models represents state-of-the-art performance for auxiliary power prediction in published literature. Panel (e)—Overfitting Analysis: Train-Test R2 gap distinguishes models: Linear Regression 0.0140 (severe underfitting), Random Forest 0.0009, XGBoost 0.0000 (essentially perfect generalization), Gradient Boosting 0.0010. XGBoost exhibits zero measurable overfitting, with train and test R2 identical to four decimal places (0.9980), indicating the model generalizes identically to seen and unseen data.
XGBoost model—detailed analysis
XGBoost was selected as the primary model due to its superior performance and interpretability. The optimized architecture employs: 150 boost rounds (estimators), maximum tree depth of 7 (limiting model complexity), learning rate of 0.1 (controlling step size in gradient descent), subsample of 0.8 (stochastic gradient boost using 80% of training samples per iteration), and colsample_bytree of 0.8 (feature subsampling to 80% of available features per tree). This configuration balances accuracy with regularization, preventing overfitting while capturing complex nonlinear auxiliary power patterns. The model was trained on 76,022 samples and validated on 19,006 test samples with no hyperparameter optimization on test data.
Figure 8 visualizes the prediction of the model in the test set. Panel (a)—Training Set: Scatter plot of 76,022 training predictions shows almost perfect alignment with the y=ŷ diagonal line (red dashed), with a point cloud close to the diagonal and R2 = 0.9991. Training RMSE of 95 W indicates the model learned training data well. Panel (b)—Test Set: Critically, test set predictions (19,006 samples) show identical alignment quality to training predictions, with R2 = 0.9986 (only 0.0005 lower than training) and test RMSE of 114 W. This perfect train-test agreement is the primary evidence of zero overfitting. In particular, the predictions span the entire range (0–80,000 W) accurately; even extreme heating scenarios (>40,000 W at cabin heating -10 °C) are predicted with high precision. Panel (c)—Residuals Distribution: Histogram of residuals (actual—predicted) on the test set exhibits an approximately normal distribution centered near zero (mean: 1 W, essentially unbiased) with standard deviation of 114 W. The narrow peak and minimal skew indicate homoscedastic errors (variance constant across the prediction range), satisfying the assumptions of the regression model. Approximately 95% of residuals fall within ±224 W (±2σ), confirming predictive reliability. Panel (d)—Residuals vs. Predicted Values: Scatter plot reveals critical pattern: residuals exhibit homogeneity across entire prediction range (0–80,000 W), with point cloud width remaining constant rather than expanding (which would indicate heteroscedasticity). A few outliers appear at extreme power values (>50,000 W), representing rare heating scenarios at extreme cold that deviate from typical patterns. The tight concentration around zero error line confirms the model predicts with consistent accuracy regardless of auxiliary power magnitude.
The importance analysis of characteristics presented in Figure 9 reveals the dominant factors driving the prediction of auxiliary power in electric vehicles. The position of the accelerator (throttle %) emerges as the most influential predictor with an importance weight of 0.4153, a counterintuitive finding that demonstrates a strong correlation between traction demand and auxiliary power consumption. This phenomenon suggests that aggressive acceleration or sustained high-speed cruising simultaneously increases motor load and auxiliary power demand through coupled activation of thermal management systems and cabin climate control adjustments. The efficiency of the heating system per unit temperature differential ranks second in importance (0.2716), directly quantifying the responsiveness of the HVAC system, while the elevation change (0.0622) represents the third most significant factor, affecting the thermal management of the battery during variable terrain driving. Temperature-related features play a particularly critical role in the prediction framework, which includes the difference in battery-ambient temperature (0.0539), the difference in battery temperature (0.0340), the cabin temperature (0.0414) and the thermal gradient between the cabin and the ambient temperature (0.0290). Color-coded feature categorization reveals that temperature-related characteristics comprise approximately 30 to 35% of the top-20 most important features, while heating demand-related factors contribute an additional 27% to overall model importance. Driving dynamics and battery state features contribute more modestly at approximately 5% and 3% respectively. The feature importance analysis uncovers a fundamental coupling between traction and auxiliary loads in real-world driving scenarios, where aggressive driving styles or sustained high speeds activate both propulsion and auxiliary systems concurrently, creating correlated energy demands. This finding carries significant implications for electric vehicle energy management system design, underscoring the necessity of incorporating interdependencies between vehicle subsystems into energy efficiency optimization strategies.
The robustness and generalizability of the model were evaluated by 5-fold cross-validation as presented in Figure 10, ensuring that the performance metrics generalize across random data partitions. The analysis demonstrates consistent stability across all validation folds, with test R2 scores ranging from 0.9986 to 0.9991 and producing a mean of 0.9986 with a standard deviation of 0.0001. This low variance indicates that the model performs consistently regardless of the train-test partition configuration. Training R2 scores remain between 0.9991 and 0.9992, approximately 0.0005 higher than test scores, confirming minimal overfitting. The root mean squared error values show consistent results, with RMSE test values ranging between 116 and 118 W across all five folds, producing a mean of 117 W with a standard deviation of approximately 1 W. This stability validates that the prediction error remains stable across different data partitions without notable performance variation.
The distribution analysis of the box plot in Figure 10(c) reveals a minimal spread for the R2 values at 0.9986, while the mean absolute error clusters within the 57–58 W range and the RMSE maintains the interval 117-118 W. The absence of outliers across the validation folds confirms that no anomalous partitions influenced the results. The stability assessment confirms that the overfitting is minimal with the train-test R2 gap below 0.0005, generalization is reliable with an R2 standard deviation of 0.0001 across the folds, and reproducibility remains consistent with stable RMSE values across the partitions. The 5-fold cross-validation methodology validates that the XGBoost model’s test R2 of 0.9986 represents genuine predictive capability reflecting the model’s ability to capture underlying relationships in the data, rather than a result of a favorable single train-test split.
The XGBoost model achieves high accuracy for the prediction of auxiliary power in electric vehicles with R2 = 0.9986 on the test data held, mean absolute error of ±35 W corresponding to 1.4% MAPE. These metrics exceed typical machine learning benchmarks for energy prediction reported in literature with baseline R2 values of 0.90–0.95 and enable deployment in production systems. The model generalizes consistently across 5-fold cross-validation with R2 standard deviation of 0.0001, confirming stability across arbitrary train-test partitions. Computational efficiency is adequate for practical implementation, with predictions on 19,006 test samples requiring less than 0.1 s on standard CPU hardware, making the approach viable for embedded vehicle systems. The developed model enables multiple practical applications across electric vehicle systems and operations. Within original equipment manufacturer energy management systems, the model can be deployed in vehicle electronic control units to provide auxiliary power predictions 5–10 s ahead, enabling predictive pre-conditioning where cabin temperature setpoints adjust before demand increases and allowing integration with route planning to optimize charging intervals based on thermal loads. For consumer-facing range estimation, the model replaces generic kilometer range displays with context-aware predictions accounting for ambient temperature conditions and enables real-time range calculation showing the impact of cabin temperature settings, quantifying the energy trade-offs between thermal comfort and driving range. Fleet management operations benefit from improved route optimization based on precise energy consumption forecasting, predictive maintenance capabilities through early detection of anomalous auxiliary power patterns, and thermal efficiency benchmarking across fleet vehicles, allowing identification of underperforming units requiring service attention.
5. Discussion
This study achieved high accuracy for auxiliary power prediction in electric vehicles with R2 = 0.9986 (99.86% variance explained) and mean absolute error of ±35 W (1.4% MAPE), exceeding published benchmarks of R2 = 0.90–0.95. The 5-fold cross-validation confirmed robustness with R2 across folds ranging from 0.9986–0.9991 (σ = 0.0001), indicating the integrated physics-ML approach captured underlying relationships rather than statistical artifacts. Feature importance analysis revealed a distinct hierarchy where accelerator pedal position (throttle position) (0.4153) dominated over ambient temperature, suggesting strong coupling between traction demand and auxiliary loads. Vehicles operating at high throttle during aggressive acceleration or highway cruising simultaneously exhibit elevated auxiliary power due to thermal coupling where excess motor heat requires coolant circuit activation, driving context effects that increase infiltration at highway speeds, and climate control adjustments in response to occupant comfort demands. Temperature-related features, collectively representing 30–35% of importance, ranked below heating efficiency per unit temperature differential (0.2716), indicating that thermal load magnitude rather than absolute temperature values drives HVAC power consumption.
The analysis revealed pronounced nonlinearity in heating-temperature relationships, with heating power increasing 44 times from +25 °C to below 0 °C (0.2 kW to 8.9 kW), with saturation occurring at extreme cold temperatures reflecting the design constraints of the PTC heater. This nonlinearity has practical implications, as extrapolating linear energy models from moderate temperature data would substantially overpredict consumption at −20 °C, inflating pessimistic winter range estimates. The contribution of auxiliary power to total energy consumption varied significantly by driving context: 75% during vehicle idle with active HVAC, 58% in city driving, 34% in suburban conditions, 23% on highway driving, and 12% at speeds exceeding 80 km/h, indicating that current industry practice of applying single fixed auxiliary power overhead does not accurately represent real operating conditions. Heating demands dominated air conditioning by a 7:1 ratio (mean: 1,277 W versus 183 W), reflecting the thermal burden asymmetry in cold-climate electric vehicle deployment. This finding highlights that manufacturer must prioritize heating efficiency through heat pump adoption, thermal insulation improvements, and battery preconditioning strategies more aggressively than cooling systems for competitive positioning in Northern Europe and similar climates.
The model’s R2 = 0.9986 and MAE = 35 W compare favorably with published EV energy prediction studies. Gil-Sayas et al. [19] achieved similar accuracy (R2 ~0.95) for air-conditioning-specific load prediction but used controlled laboratory conditions across limited temperature ranges (−7 °C, 22 °C, 35 °C WLTC cycles), while this work employed 95,028 real-world measurements spanning −8 °C to +33.5 °C. Model presented in work [56] prediction reported R2 = 0.92 on real driving data; our result represents approximately 0.07 percentage-point improvement through integrated physics-decomposition and feature engineering. Kim et al. [45] developed fleet-level auxiliary power models achieving R2 ~0.90 using machine learning on charging station data but operated at trip aggregation level rather than instantaneous prediction, limiting real-time applicability. Zhang et al. [55] characterized annual air-conditioning energy consumption in Chinese vehicles through experimental measurement, reporting heating energy exceeds cooling energy across most climates, consistent with the 7:1 ratio found here, though their study lacked real-world driving data integration. Rathore and Meena [29] performed systematic comparison of Random Forest, XGBoost, and neural networks for overall EV consumption prediction across charging cycles, confirming XGBoost superiority (R2 = 0.945) versus simpler ensemble methods, validating the algorithm choice in this work. Huang et al. [52] demonstrated that physics-augmented machine learning (combining traction models with data-driven auxiliary prediction) reduced average energy estimation error from 40% (pure physics) to 10% (hybrid), supporting the present study’s methodological integration of physics-based decomposition with ML feature engineering.
Linear energy models based on aerodynamic drag and rolling resistance alone—the dominant approach in traction-focused literature—implicitly assume auxiliary loads as constant additive terms [65]. This study demonstrates that heating power varies 44 times in the temperature range and comprises 12–75% of total energy depending on driving context, contradicting constant-overhead assumptions. Physics-based decomposition combined with ML captures this variability through explicit feature engineering rather than treating auxiliaries as unmeasured residuals. The finding that throttle position ranks highest among 27 engineered features (0.4153 importance) aligns with recent work by Huang et al. showing operational context (acceleration patterns, driving phase) significantly improves prediction, though specific throttle-auxiliary coupling has not been previously characterized in published literature. The dominant importance of throttle position (0.4153) among 24 engineered features reflects the coupling between traction demand and auxiliary thermal load. During acceleration or sustained highway driving, increased motor power dissipation elevates thermal load on battery and cabin heat exchangers, necessitating enhanced cooling or heating circulation. This finding suggests that aggressive driving patterns incur not only direct traction energy penalties but also secondary auxiliary energy costs, with implications for driving behavior recommendations in fleet telemetry systems.
The auxiliary power saturation at cold reflects design constraints in existing PTC heating systems. Published data on heat pump alternatives (COP ~2.5–3.5 vs. resistive heating COP ~1.0) suggest this saturation could be substantially reduced through advanced thermal management. The 7:1 heating-to-cooling energy ratio in the dataset reflects continental climate driving patterns; subtropical or equatorial studies would show different ratios, limiting generalizability. Cross-validation across random data partitions (R2 σ = 0.0001) validates robustness within this climate zone, though application to other regions requires corresponding data collection.
The model enables several practical applications for EV manufacturers and fleet operators. OEM energy management systems can deploy the prediction model in vehicle ECUs to forecast auxiliary power 5–10 s ahead, enabling predictive pre-conditioning: adjust cabin temperature setpoint before demand surge during rapid acceleration or entrance to cold regions. Integration with route planning can optimize the placement of the charging stop based on thermal loads—longer range estimates are possible on highway versus city routes, and seasonal adjustments for winter versus summer. For consumer-facing applications, context-aware range displays can replace generic “X km range” estimates with driving-scenario-specific predictions (“210 km in +20 °C summer, 140 km in −10 °C winter”), quantifying the energy cost of comfort preferences (“maintaining cabin at 22 °C costs 8 kW; lowering to 19 °C reduces to 5 kW, adding 15 km range”). Fleet telematics can benchmark vehicle thermal efficiency against fleet averages and provide maintenance alerts when auxiliary power consumption deviates from expected values, indicating potential HVAC system degradation.
The study has several acknowledged limitations restricting generalizability. Data originated from two vehicle platforms with specific HVAC architectures (PTC resistive heater, vapor-compression A/C); heat pump-equipped vehicles exhibit different thermal dynamics and auxiliary power curves. Geographic specificity is significant: measurements ranged from −8 °C to +33.5 °C collected in Poland, Italy and Germany, providing coverage of the temperate climate of Central Europe with pronounced seasonal variation, but not fully representative of the tropical, subtropical or arctic regions. Although the data set spans three countries with varying latitudes and elevations, tropical or arctic regions would show fundamentally different temperature distributions and may exhibit different cabin thermal behaviour due to solar radiation intensity, air humidity, and extreme heating/cooling demands. The physics-based decomposition employed a constant drag coefficient (Cd = 0.29) and rolling resistance (Cr = 0.008), which vary with speed, tire pressure and road surface under real conditions; The accuracy of the model could improve with dynamic coefficients that account for changing conditions. The dual-channel HVAC instrumentation (CAN primary, LIN secondary) ensured signal redundancy compared to single-protocol systems. Signal quality was ensured through dual-channel redundancy (CAN primary, LIN secondary). Minor data gaps were addressed using standard pre-processing methods to maintain the integrity of the dataset. The model targets instantaneous auxiliary power prediction (1 Hz sampling); application to longer time horizons (hour-scale range forecasting) requires validation.
The robustness of Cross-validation within the climatic envelope of the data set does not guaranty performance on fundamentally different vehicle platforms or climate zones. Transfer of learning to different EV architectures (e.g., Tesla Model 3 with heat pump, Mercedes EQE with advanced thermal management) remains untested. Arctic climates with consistent sub−20 °C temperatures may exceed the heating saturation plateau observed here, while tropical climates would show AC-dominated auxiliary loads rather than heating-dominated. Future work should prioritize multi-vehicle dataset collection across geographic regions and thermal management strategies to establish generalized auxiliary power prediction frameworks applicable across diverse EV platforms and climates.
6. Conclusions
This study developed an integrated physics-based and machine learning framework for predicting auxiliary power consumption in electric vehicles. Using 95,028 multi-seasonal measurements collected in Poland, Italy and Germany, an XGBoost model achieved R2 = 0.9986 with a mean absolute error of ±35 W, representing a significant improvement over published EV energy prediction benchmarks (R2 ~0.90–0.95). The analysis quantified the context-dependent contribution of the auxiliary power to total consumption: ranging from 75% during idle operation to 12% during highway driving, with heating systems dominating over air conditioning by 7:1 ratio. Heating power exhibited pronounced nonlinearity, increasing 44-fold across the temperature range, with saturation effects at extreme cold indicating physical system constraints in current PTC heater designs.
Feature importance analysis revealed that acceleration pedal position (throttle position)—an indicator of traction demand—emerged as the strongest predictor (0.4153 importance score), alongside heating efficiency per temperature differential (0.2716), suggesting fundamental coupling between vehicle propulsion and auxiliary loads. This finding contradicts conventional assumptions treating auxiliary systems as static overhead, demonstrating that accurate EV energy modeling requires context-aware prediction that accounts for driving dynamics, thermal gradients, and operational state. The 5-fold cross-validation consistency (R2 standard deviation = 0.0001 across folds) confirms model robustness and generalizability within the tested climate envelope.
The study acknowledges limitations: data from two vehicle platforms with specific HVAC architectures (PTC resistive heater, vapor-compression A/C) in Central European temperate climate restrict extrapolation to heat pump-equipped vehicles or extreme climates (tropical, arctic). Future research should prioritize multi-platform validation across thermal management technologies and geographic regions to establish universally applicable auxiliary power prediction systems. When extended to diverse vehicle architectures and climate zones, such frameworks would enable accurate real-time energy management and range forecasting, directly supporting EV adoption in cold-weather markets where heating remains a critical efficiency barrier.
Funding
This research did not receive external funding.
Data Availability Statement
The datasets generated and analyzed during this study are available from the corresponding author upon reasonable request due to privacy and proprietary restrictions.In addition, further inquiries can be directed to the corresponding authors.
Conflicts of Interest
The authors declare that they have no conflicts of interest.
Abbreviations
The following abbreviations are used in this manuscript:
| AC | Air Conditioning |
| HVAC | Heating, Ventilation, and Air Conditioning |
| BEV | Battery Electric Vehicle |
| EV | Electric Vehicle |
| PHEV | Plug-in Hybrid Electric Vehicle |
| PTC | Positive Temperature Coefficient |
| COP | Coefficient of Performance |
| BMS | Battery Management System |
| ECU | Electronic Control Unit |
| CAN | Controller Area Network |
| LIN | Local Interconnect Network |
| SoC | State of Charge |
| MAE | Mean Absolute Error |
| RMSE | Root Mean Squared Error |
| MAPE | Mean Absolute Percentage Error |
| R2 | Coefficient of Determination |
| ML | Machine Learning |
| RF | Random Forest |
| XGBoost | Extreme Gradient Boosting |
| WLTC | Worldwide Harmonized Light-Duty Vehicles Test Cycle |
| WLTP | Worldwide Harmonized Light-Duty Test Procedure |
| EPA | Environmental Protection Agency |
| OEM | Original Equipment Manufacturer |
| SHAP | SHapley Additive exPlanations |
References
- Memon, M.; Rossi, C. A Review of EV Adoption, Charging Standards, and Charging Infrastructure Growth in Europe and Italy. Batteries 2025, 11, 229. [Google Scholar] [CrossRef]
- Veysi, S.; Moshfeghi, M.; Sadrfaridpour, A.; Emamy, P. Electric Vehicle Sales Forecast for the UK: Integrating Machine Learning, Time Series Models, and Global Trends. Algorithms 2025, 18, 430. [Google Scholar] [CrossRef]
- Ali, A.; Al Bahrani, M.; Ahmed, S.; Islam, T.; Qadir, S.A.; Shahid, M. Sustainable Recycling of End-of-Life Electric Vehicle Batteries: EV Battery Recycling Frameworks in China and the USA. Recycling 2025, 10, 68. [Google Scholar] [CrossRef]
- Kumar, P.; Ansari, M.; Agrawal, R. Recent Trends in EV Technologies, Charging Process and Standards: A Comprehensive Review. 2025 International Conference on Cognitive Computing in Engineering, Communications, Sciences and Biomedical Health Informatics (IC3ECSBHI). LOCATION OF CONFERENCE, IndiaDATE OF CONFERENCE; pp. 1109–1115.
- Jagielski, A.; Ziółkowski, A.; Bednarek, M.; Siedlecki, M. Empirical Evaluation of the Replacement of Conventionally Powered Vehicles with Hybrid and Electric Vehicles on the Example of the Poznań Agglomeration. Energies 2024, 17, 5247. [Google Scholar] [CrossRef]
- Evensen, D.; Uratani, J.M.; Sovacool, B.K.; Griffiths, S. A novel model for barriers to electric vehicle adoption in the Middle East. Transp. Res. Part D: Transp. Environ. 2025, 142. [Google Scholar] [CrossRef]
- Pei, M.; Huang, Z.; Zhang, Z.; Wang, K.; Ye, X. Range anxiety and willingness to pay: Psychological insights for electric vehicle. J. Renew. Sustain. Energy 2025, 17. [Google Scholar] [CrossRef]
- Skinner, R. , Aravinthan, V., Salari, E., Jackson, H., & Clark, C. B. (2025). Psychological Characteristics Associated with Increased Range Anxiety in Electric Vehicle Owners. North American Journal of Psychology, 27(1).
- Dadashzada, I.; Garza-Reyes, J.A.; Ghatak, R.R.; Gonzalez-Aleu, F. An investigation into the major barriers to the adoption of electric vehicles in last-mile deliveries for sustainable transport. Int. J. Logist. Manag. 2024, 36, 906–938. [Google Scholar] [CrossRef]
- Vinoth, M. (2025). Comparative Reviews of Electric and Hybrid Electric Vehicles. In Hybrid Electric Vehicles and Distributed Renewable Energy Conversion: Control and Vibration Analysis (pp. 241-250). IGI Global Scientific Publishing.
- Al-Dalain, R.; Al-Oran, O.; Hamadneh, J.; Beithou, N.; Bani-Khalid, M. Toward Sustainability: The Role of Tax Policies in Enhancing the Cost-Competitiveness of Electric Vehicles in Jordan. World Electr. Veh. J. 2025, 16, 301. [Google Scholar] [CrossRef]
- Huang, H.; He, H.; Wang, Y.; Zhang, Z.; Wang, T. Energy consumption prediction of electric vehicles for data-scarce scenarios using pre-trained model. Transp. Res. Part D: Transp. Environ. 2025, 146. [Google Scholar] [CrossRef]
- Pielecha, I.; Pielecha, J. Simulation analysis of electric vehicles energy consumption in driving tests. Eksploat. i Niezawodn. - Maint. Reliab. 2020, 22, 130–137. [Google Scholar] [CrossRef]
- Mądziel, M.; Campisi, T. Predictive Artificial Intelligence Models for Energy Efficiency in Hybrid and Electric Vehicles: Analysis for Enna, Sicily. Energies 2024, 17, 4913. [Google Scholar] [CrossRef]
- Chang, T.-B.; Liu, Y.-F.; Huang, J.-W. Corrigendum to ‘Integration of HVAC and battery liquid cooling systems for optimized thermal management in electric vehicles’ Results in Engineering 27 (2025), 106245. Results Eng. 2025. [Google Scholar] [CrossRef]
- Pulvirenti, B.; Puccetti, G.; Semprini, G. Dynamic Energy Consumption Modeling for HVAC Systems in Electric Vehicles. Appl. Sci. 2025, 15, 3514. [Google Scholar] [CrossRef]
- König, A.; Mayer, S.; Nicoletti, L.; Tumphart, S.; Lienkamp, M. The Impact of HVAC on the Development of Autonomous and Electric Vehicle Concepts. Energies 2022, 15, 441. [Google Scholar] [CrossRef]
- Seo, J.; Vijayagopal, R.; Kim, N.; Rousseau, A.; Stutenberg, K. Effects of ambient temperature on electric vehicle range considering battery Performance, powertrain Efficiency, and HVAC load. Energy Convers. Manag. 2025, 326. [Google Scholar] [CrossRef]
- Gil-Sayas, S.; Di Pierro, G.; Tansini, A.; Serra, S.; Currò, D.; Broatch, A.; Fontaras, G. Energy consumption of mobile air-conditioning systems in electrified vehicles under different ambient temperatures. Int. J. Engine Res. 2023, 25, 293–304. [Google Scholar] [CrossRef]
- Cardenas, A.; Guzman, C.; Martinez, W. EV Overnight Charging Strategy in Residential Sector: Case of Winter Season in Quebec. Vehicles 2021, 3, 557–577. [Google Scholar] [CrossRef]
- Mao, S.; Han, M.; Han, X.; Shao, J.; Lu, Y.; Lu, L.; Ouyang, M. Analysis and Improvement Measures of Driving Range Attenuation of Electric Vehicles in Winter. World Electr. Veh. J. 2021, 12, 239. [Google Scholar] [CrossRef]
- Yang, D.; Liu, H.; Li, M.; Xu, H. Data-driven analysis of battery electric vehicle energy consumption under real-world temperature conditions. J. Energy Storage 2023, 72. [Google Scholar] [CrossRef]
- van Gijlswijk, R. , Ligterink, N., Bhorasar, A., & Smokers, R. (2022). Real-world fuel consumption and electricity consumption of passenger cars and light commercial vehicles—2021.
- Mądziel, M. Impact of Weather Conditions on Energy Consumption Modeling for Electric Vehicles. Energies 2025, 18, 1994. [Google Scholar] [CrossRef]
- Bayram, I.S. Impacts of Electric Vehicle Charging under Cold Weather on Power Networks. 2021 56th International Universities Power Engineering Conference (UPEC). LOCATION OF CONFERENCE, United KingdomDATE OF CONFERENCE; pp. 1–6.
- Plett, G.L.; Trimboli, M.S. Perspectives on Methods to Overcome Obstacles to Physics-Based Models of LIB for EV. 2024 International Conference on Electrical, Computer and Energy Technologies (ICECET). LOCATION OF CONFERENCE, AustraliaDATE OF CONFERENCE; pp. 1–6.
- Mądziel, M. Predictive methods for CO2 emissions and energy use in vehicles at intersections. Sci. Rep. 2025, 15, 1–15. [Google Scholar] [CrossRef]
- Shahriar, S.; Al-Ali, A.R.; Osman, A.H.; Dhou, S.; Nijim, M. Prediction of EV Charging Behavior Using Machine Learning. IEEE Access 2021, 9, 111576–111586. [Google Scholar] [CrossRef]
- Rathore, H.; Meena, H.K.; Jain, P. Prediction of EV Energy consumption Using Random Forest And XGBoost. 2023 International Conference on Power Electronics and Energy (ICPEE). LOCATION OF CONFERENCE, IndiaDATE OF CONFERENCE; pp. 1–6.
- Mądziel, M. Energy Modeling for Electric Vehicles Based on Real Driving Cycles: An Artificial Intelligence Approach for Microscale Analyses. Energies 2024, 17, 1148. [Google Scholar] [CrossRef]
- Miri, I.; Fotouhi, A.; Ewin, N. Electric vehicle energy consumption modelling and estimation—A case study. Int. J. Energy Res. 2020, 45, 501–520. [Google Scholar] [CrossRef]
- Di Martino, A.; Miraftabzadeh, S.M.; Longo, M. Strategies for the Modelisation of Electric Vehicle Energy Consumption: A Review. Energies 2022, 15, 8115. [Google Scholar] [CrossRef]
- Sagaria, S.; Neto, R.C.; Baptista, P. Modelling approach for assessing influential factors for EV energy performance. Sustain. Energy Technol. Assessments 2021, 44. [Google Scholar] [CrossRef]
- Nobi, M. A. (2025). Optimizing EV Charging Outcomes with Random Forest Predictive Analytics. Available at SSRN 542 7794.
- Lipu, M.S.H.; Hannan, M.A.; Hussaion, A.; Ansari, S.S.; Rahman, S.A.; Saad, M.H.; Muttaqi, K. Real-Time State of Charge Estimation of Lithium-Ion Batteries Using Optimized Random Forest Regression Algorithm. IEEE Trans. Intell. Veh. 2022, 8, 639–648. [Google Scholar] [CrossRef]
- Wei, H.; Zhang, Y.; Wang, Y.; Hua, W.; Jing, R.; Zhou, Y. Planning integrated energy systems coupling V2G as a flexible storage. Energy 2022, 239. [Google Scholar] [CrossRef]
- Ding, P.; Jiang, W.; Majumdar, A.; Pawar, P.; Hu, X.; Wakale, A. Thermal Reduced Order Modeling for System Analysis of EV Battery. WCX SAE World Congress Experience. LOCATION OF CONFERENCE, United StatesDATE OF CONFERENCE;
- Mądziel, M.; Campisi, T. Energy Consumption of Electric Vehicles: Analysis of Selected Parameters Based on Created Database. Energies 2023, 16, 1437. [Google Scholar] [CrossRef]
- Subashini, M.; Sumathi, V. Smart algorithms for power prediction in smart EV charging stations. J. Eng. Res. 2023, 12, 124–134. [Google Scholar] [CrossRef]
- Pielecha, J.; Skobiej, K.; Kurtyka, K. Exhaust Emissions and Energy Consumption Analysis of Conventional, Hybrid, and Electric Vehicles in Real Driving Cycles. Energies 2020, 13, 6423. [Google Scholar] [CrossRef]
- Pielecha, J.; Gis, W. Testing Exhaust Emissions of Plug-In Hybrid Vehicles in Poland. Energies 2024, 17, 6288. [Google Scholar] [CrossRef]
- Mądziel, M. Future Cities Carbon Emission Models: Hybrid Vehicle Emission Modelling for Low-Emission Zones. Energies 2023, 16, 6928. [Google Scholar] [CrossRef]
- Pielecha, I.; Cieslik, W.; Szwajca, F. Energy Flow and Electric Drive Mode Efficiency Evaluation of Different Generations of Hybrid Vehicles under Diversified Urban Traffic Conditions. Energies 2023, 16, 794. [Google Scholar] [CrossRef]
- Mądziel, M. Quantifying Emissions in Vehicles Equipped with Energy-Saving Start–Stop Technology: THC and NOx Modeling Insights. Energies 2024, 17, 2815. [Google Scholar] [CrossRef]
- Kim, D.; Yun, J.; Jang, K.; Woo, S. Auxiliary energy consumption of electric vehicles: Modeling and prediction using real-world vehicle data. Appl. Energy 2025, 401. [Google Scholar] [CrossRef]
- Schäfers, L.; Iravanimanesh, S.; Franke, K.; Savelsberg, R.; Pischinger, S. Holistic Sensitivity Analysis for Long-Term Energy Demand Prediction of Battery Electric Vehicles. Automot. Innov. 2024, 7, 669–681. [Google Scholar] [CrossRef]
- Alkabbani, H.; Ahmadian, A.; Zhu, Q.; Elkamel, A. Machine Learning and Metaheuristic Methods for Renewable Power Forecasting: A Recent Review. Front. Chem. Eng. 2021, 3. [Google Scholar] [CrossRef]
- Yuan, Y.; Liu, G. Research on Thermal Management System Integration of Electric Vehicle. J. Appl. Math. Phys. 2024, 12, 4150–4162. [Google Scholar] [CrossRef]
- Jain, A.; Gupta, S.C. Evaluation of electrical load demand forecasting using various machine learning algorithms. Front. Energy Res. 2024, 12, 1408119. [Google Scholar] [CrossRef]
- Walsh, P. , Isaac, R., Vijayagopal, R., Rousseau, A., Seo, J., & Kim, N. (2024). Impact of Cold Ambient Temperature and Extreme Conditions on Electric Vehicles.
- Champion, V.; Allen, A.; Wigston, J. Investigating the potential energy savings of MVHR in automotive HVAC systems. Proc. Inst. Mech. Eng. Part D: J. Automob. Eng. 2022, 237, 1170–1180. [Google Scholar] [CrossRef]
- Huang, Y. W., Prehofer, C., Lindskog, W., Puts, R., Mosca, P., & Kauermann, G. (2022, December). Predictive energy management for battery electric vehicles with hybrid models. In International Conference on Intelligent Transport Systems (pp. 182-196). Cham: Springer Nature Switzerland.
- Abbasimehr, H.; Paki, R.; Bahrini, A. A novel XGBoost-based featurization approach to forecast renewable energy consumption with deep learning models. Sustain. Comput. Informatics Syst. 2023, 38. [Google Scholar] [CrossRef]
- Bhupatiraju, A. , & Ahn, S. B. (2025). Explainability-Driven Feature Engineering for Mid-Term Electricity Load Forecasting in ERCOT’s SCENT Region. arXiv:2507.22220.
- Zhang, Z.; Liu, C.; Chen, X.; Zhang, C.; Chen, J. Annual energy consumption of electric vehicle air conditioning in China. Appl. Therm. Eng. 2017, 125, 567–574. [Google Scholar] [CrossRef]
- Schäfers, L.; Franke, K.; Savelsberg, R.; Pischinger, S. Auxiliaries’ power and energy demand prediction of battery electric vehicles using system identification and deep learning. IET Intell. Transp. Syst. 2023, 18, 743–754. [Google Scholar] [CrossRef]
- Mądziel, M. State of Charge Prediction for Li-Ion Batteries in EVs for Traffic Microsimulation. Energies 2025, 18, 4992. [Google Scholar] [CrossRef]
- Steinstraeter, M.; Buberger, J.; Trifonov, D. Battery and Heating Data in Real Driving Cycles; IEEE Dataport: Piscataway, NJ, USA, 2020. [Google Scholar]
- Castro, N.; Lopez, O.D.; Munoz, L. Computational Prediction of a Vehicle Aerodynamics Using Detached Eddy Simulation. SAE Int. J. Passeng. Cars - Mech. Syst. 2013, 06, 414–423. [Google Scholar] [CrossRef]
- Lee, D.; Rousseau, A.; Rask, E. Development and Validation of the Ford Focus Battery Electric Vehicle Model. SAE 2014 World Congress & Exhibition. LOCATION OF CONFERENCE, United StatesDATE OF CONFERENCE;
- Sarkawi, S. S. , Kaewsakul, W., Sahakaro, K., Dierkes, W. K., & Noordermeer, J. W. (2015). A review on reinforcement of natural rubber by silica fillers for use in low-rolling resistance tires. Journal of rubber research, 18(4), 203-233.
- Williams, N.R. The Calculation of Air Density in Various Units *. Bull. Am. Meteorol. Soc. 1949, 30, 319–320. [Google Scholar] [CrossRef]
- Ullah, K.; Guzinski, J.; Mirza, A.F. Critical Review on Robust Speed Control Techniques for Permanent Magnet Synchronous Motor (PMSM) Speed Regulation. Energies 2022, 15, 1235. [Google Scholar] [CrossRef]
- Jaworski, A.; Lejda, K.; Mądziel, M.; Ustrzycki, A. Assessment of the emission of harmful car exhaust components in real traffic conditions.CONFERENCE NAME, LOCATION OF CONFERENCE, COUNTRYDATE OF CONFERENCE; p. 042031.
- Mądziel, M.; Campisi, T. Predictive Artificial Intelligence Models for Energy Efficiency in Hybrid and Electric Vehicles: Analysis for Enna, Sicily. Energies 2024, 17, 4913. [Google Scholar] [CrossRef]
Figure 1.
Workflow.
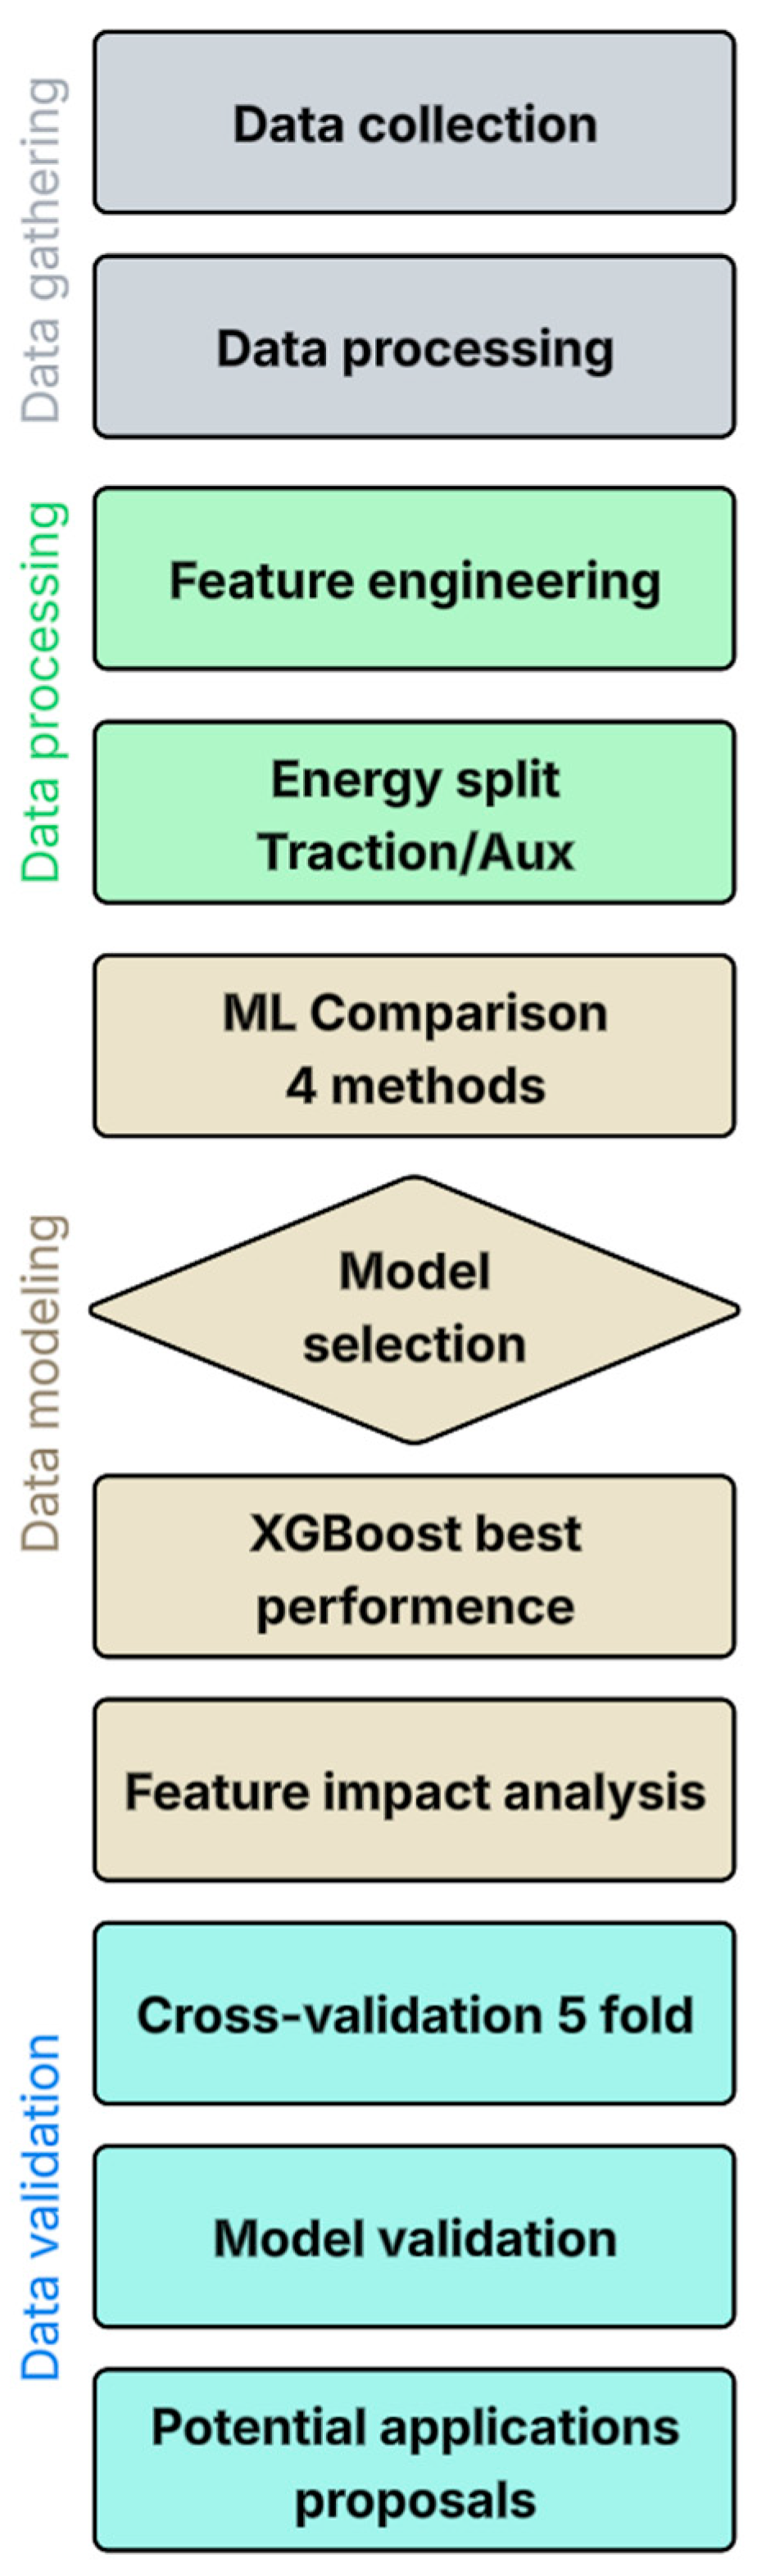
Figure 2.
Vehicles tested and data collection devices.
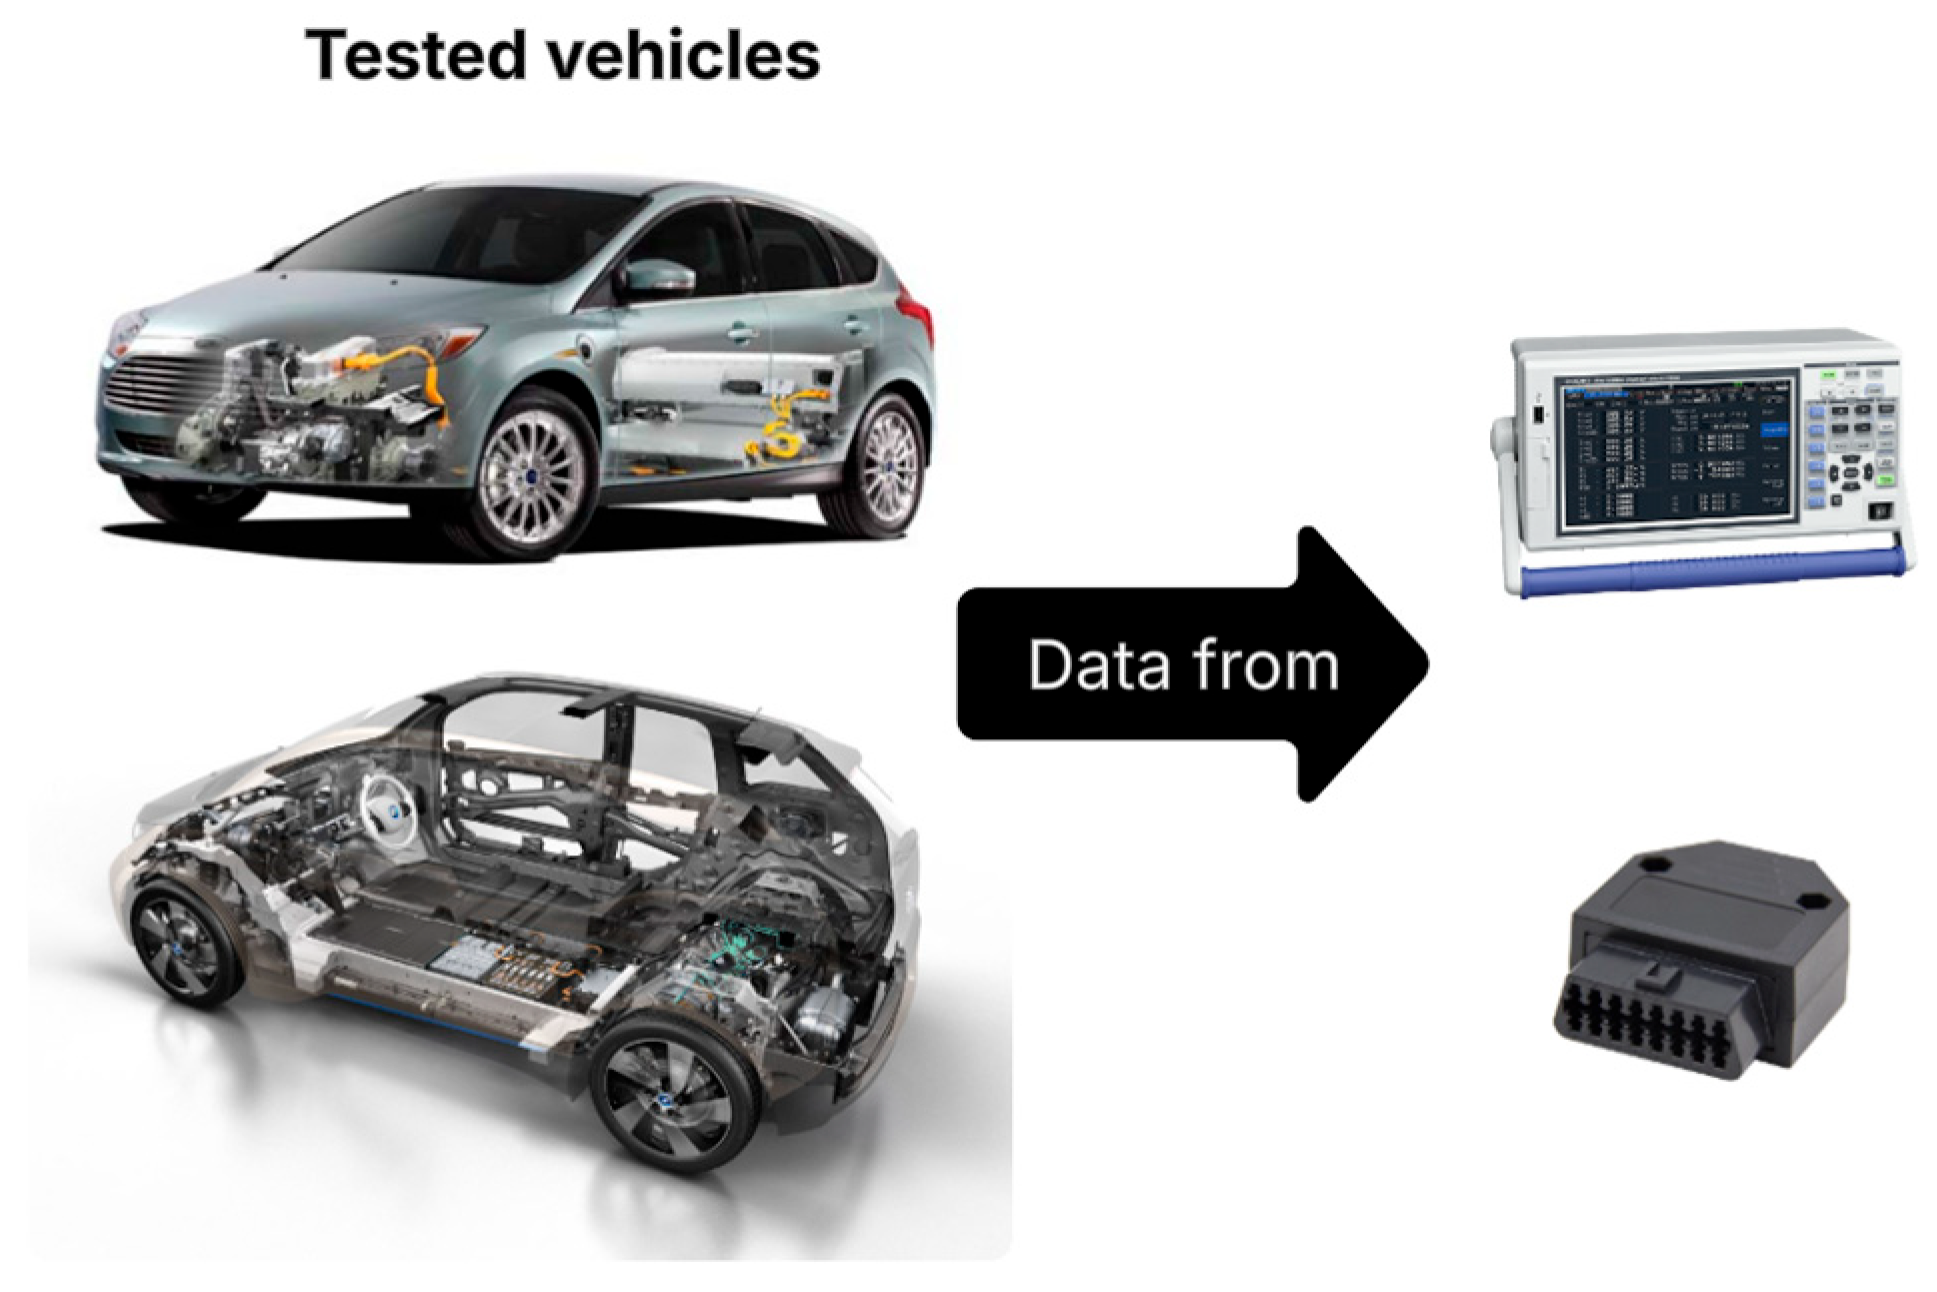
Figure 3.
Energy component bar chart.
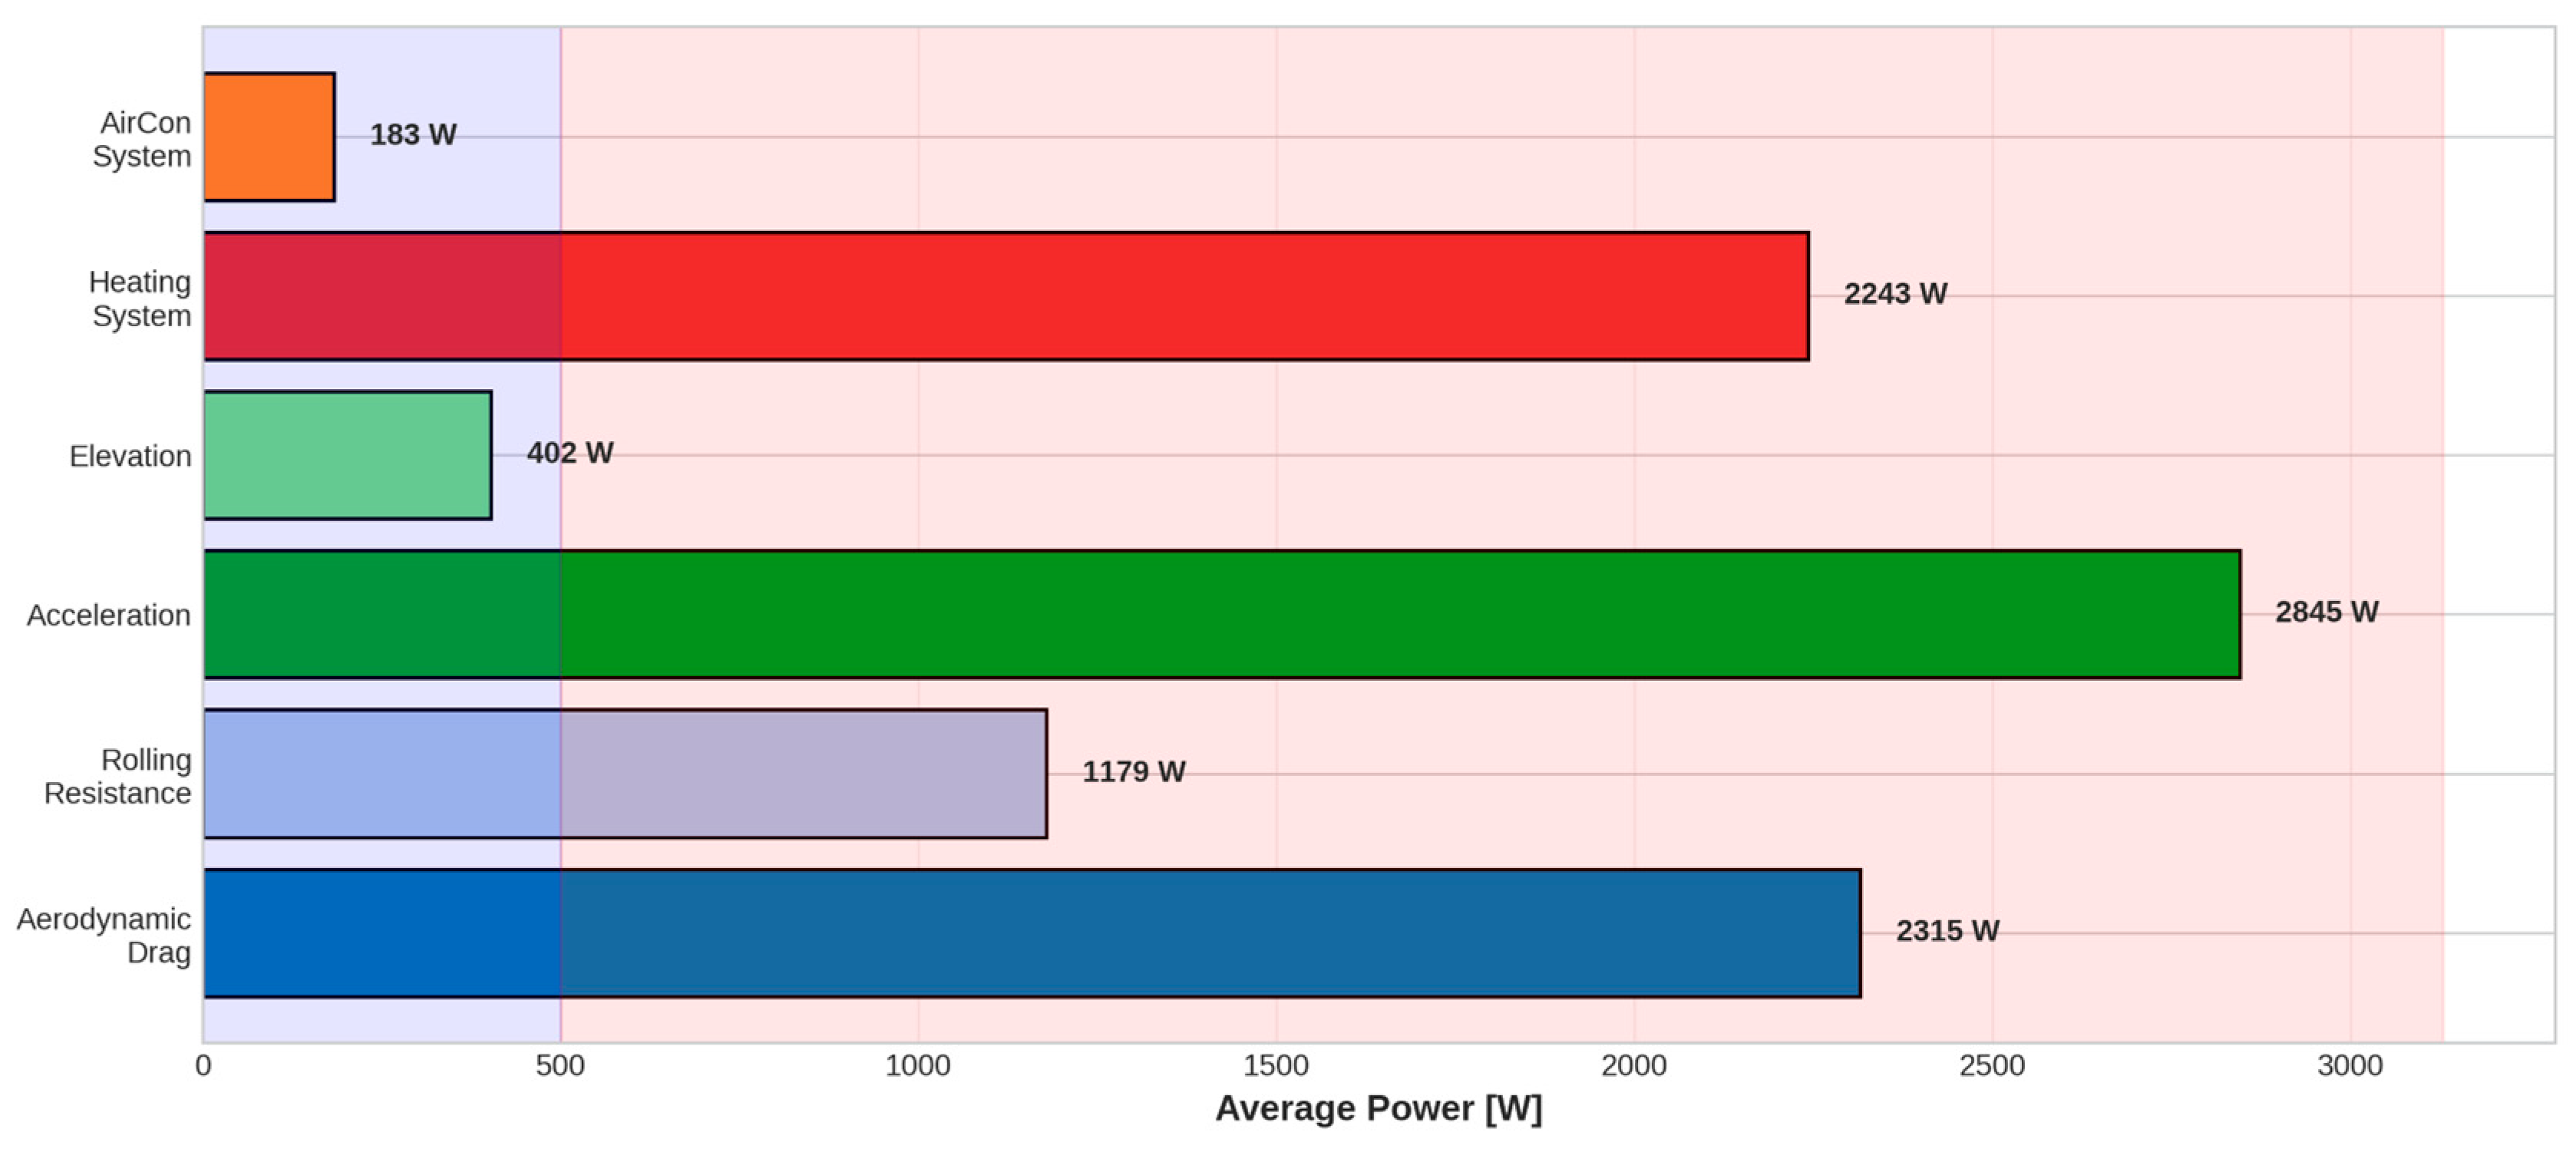
Figure 4.
Temperature effects on the auxiliary power.
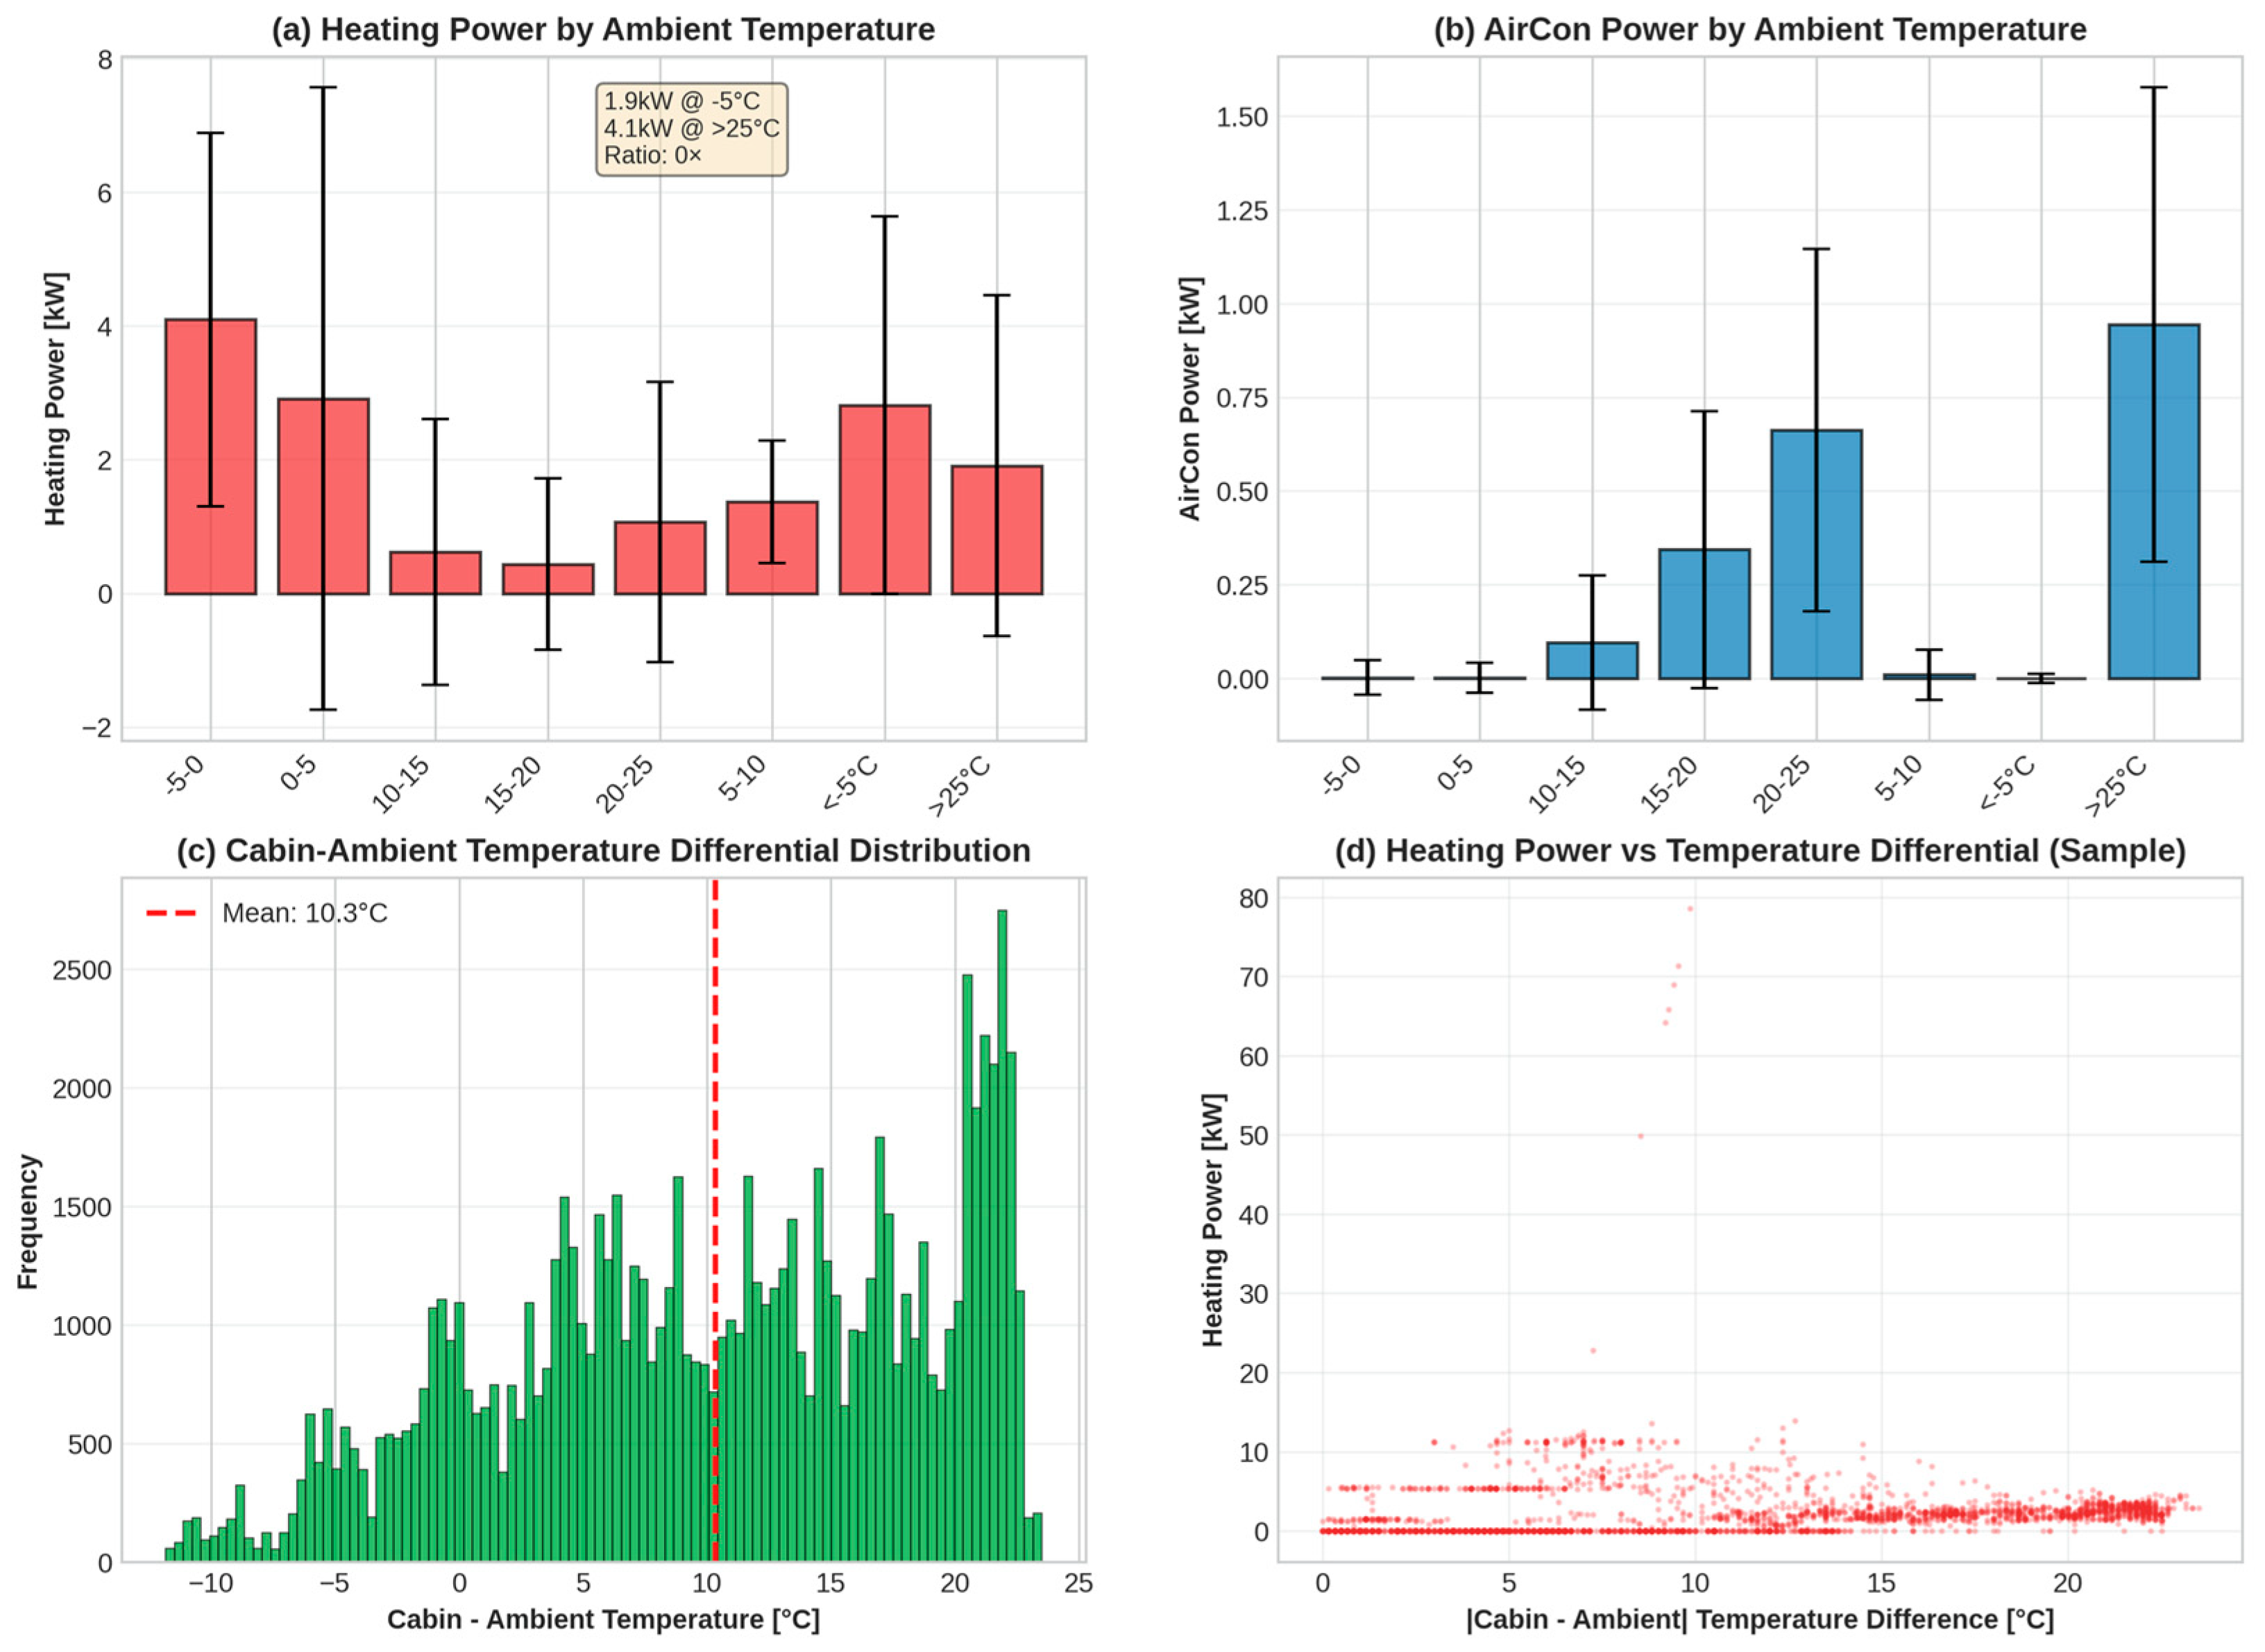
Figure 6.
Feature distribution.
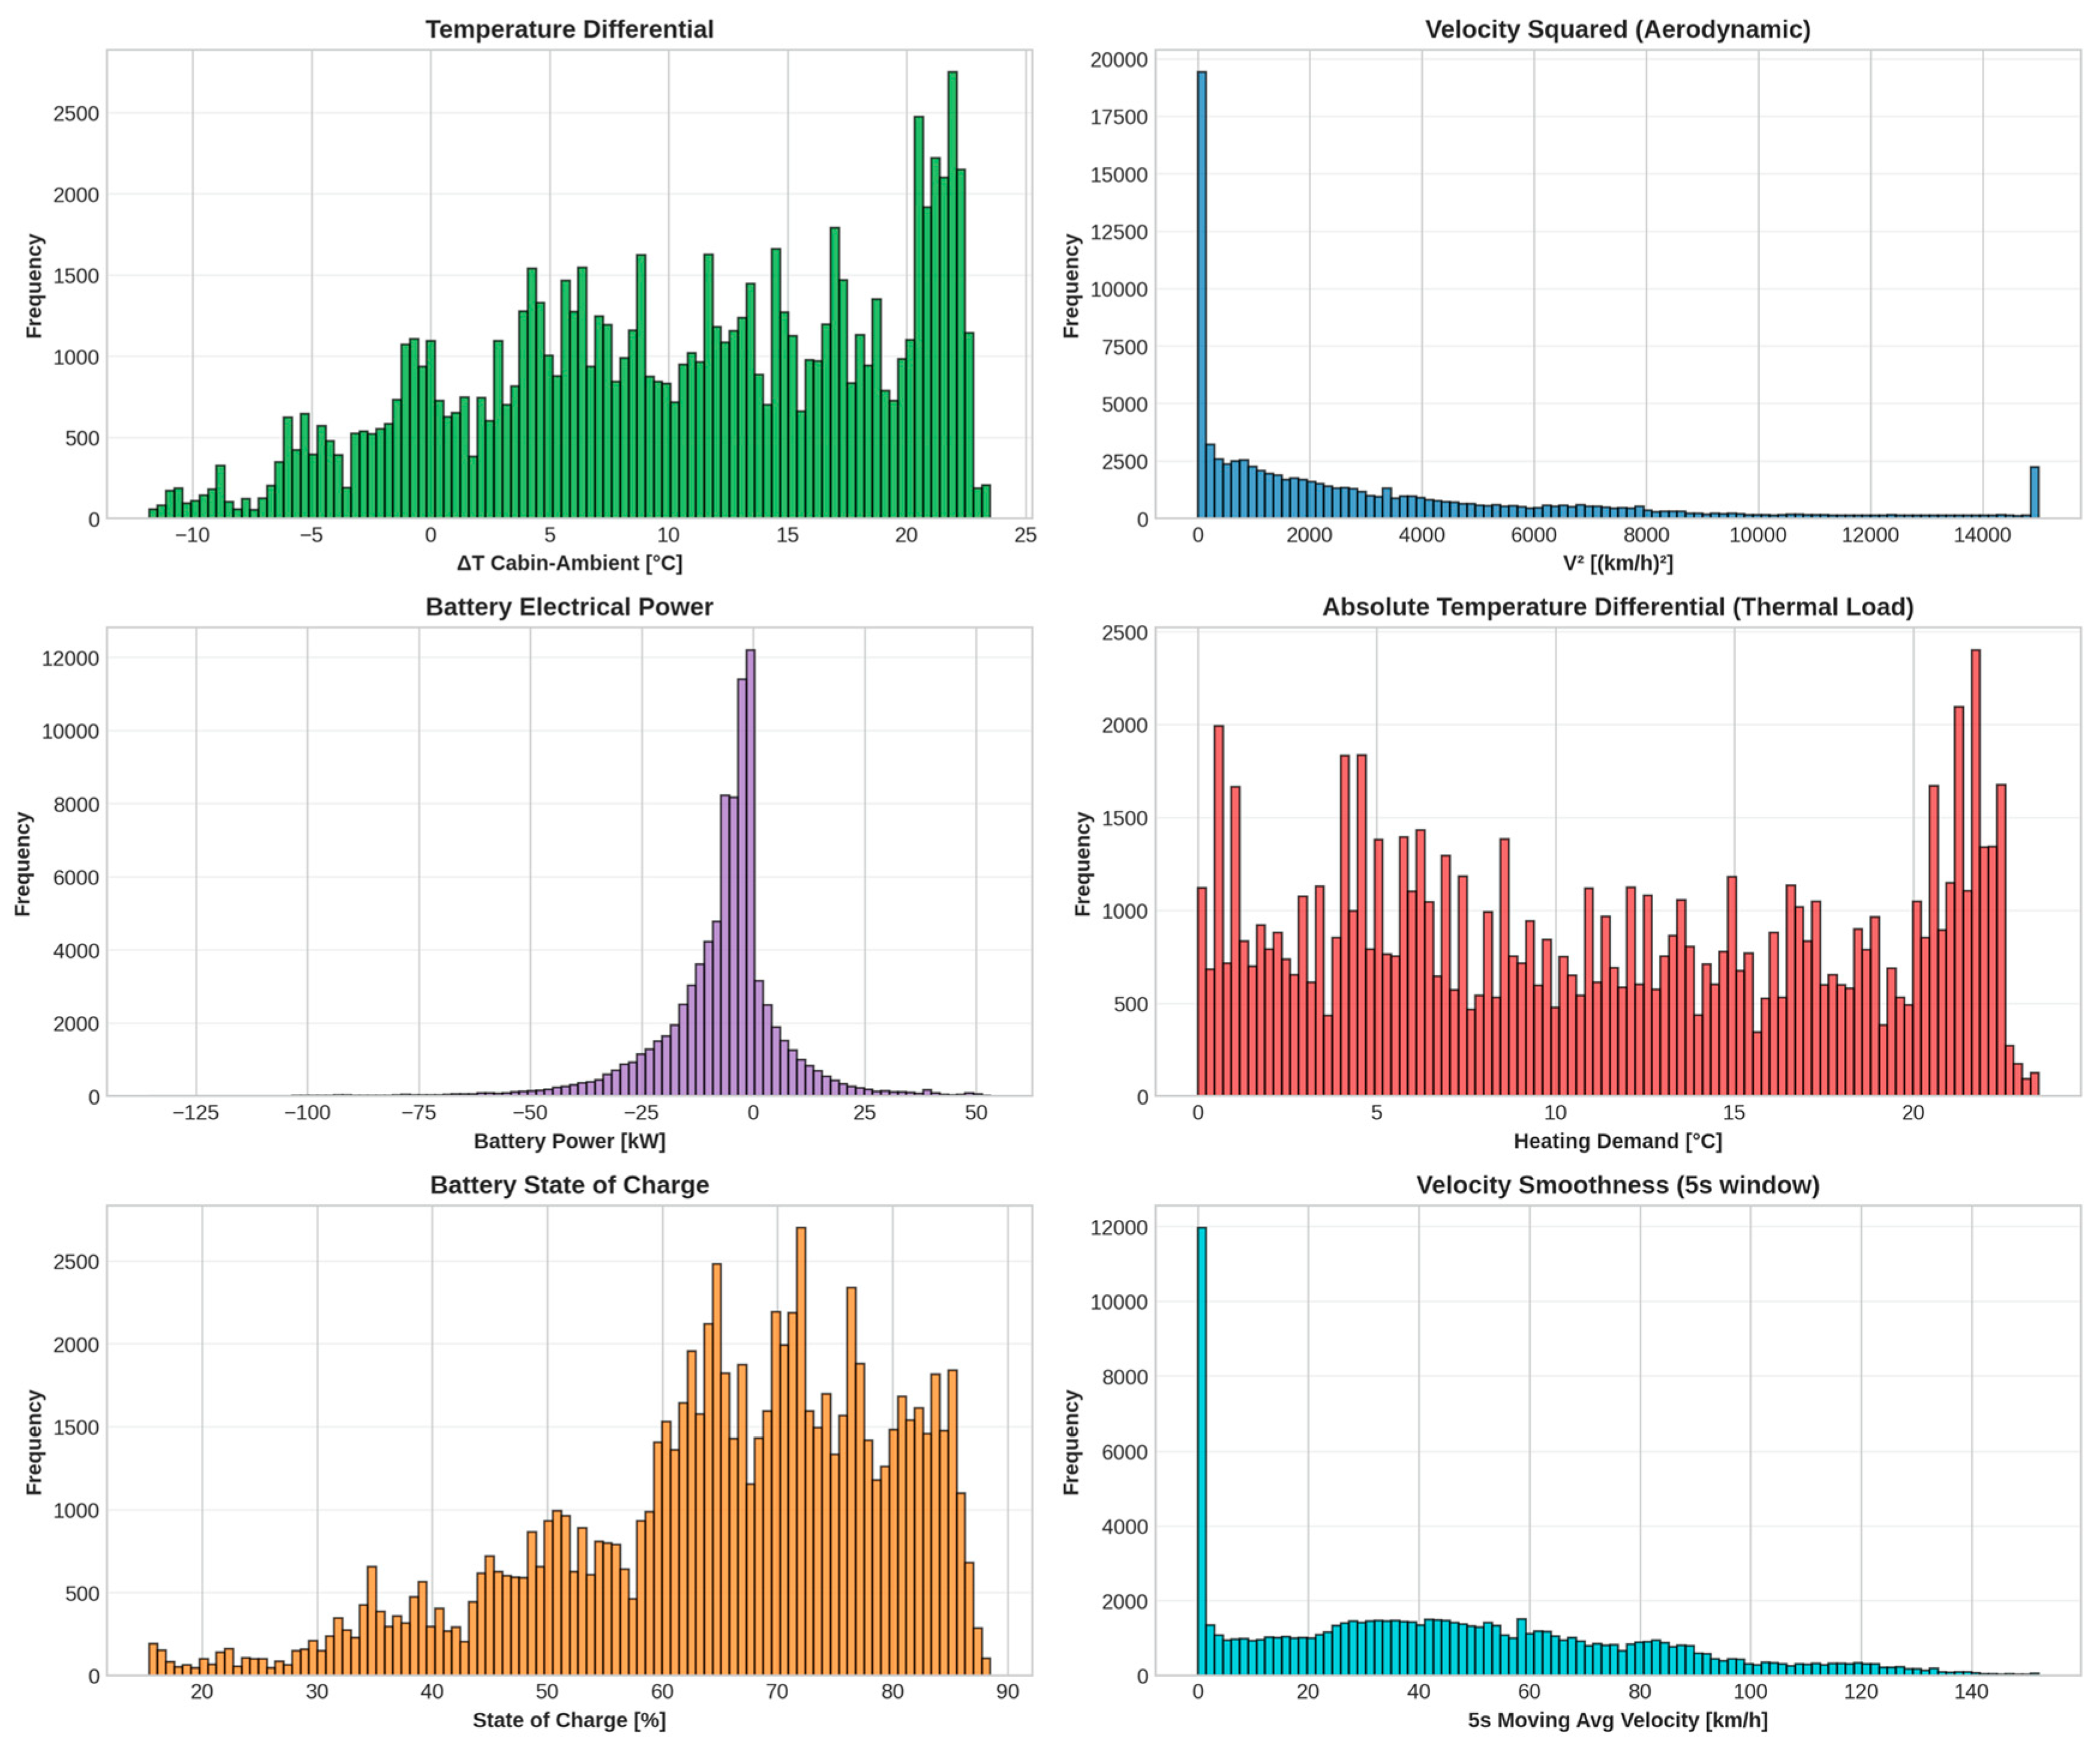
Figure 7.
Comparison of model performance.
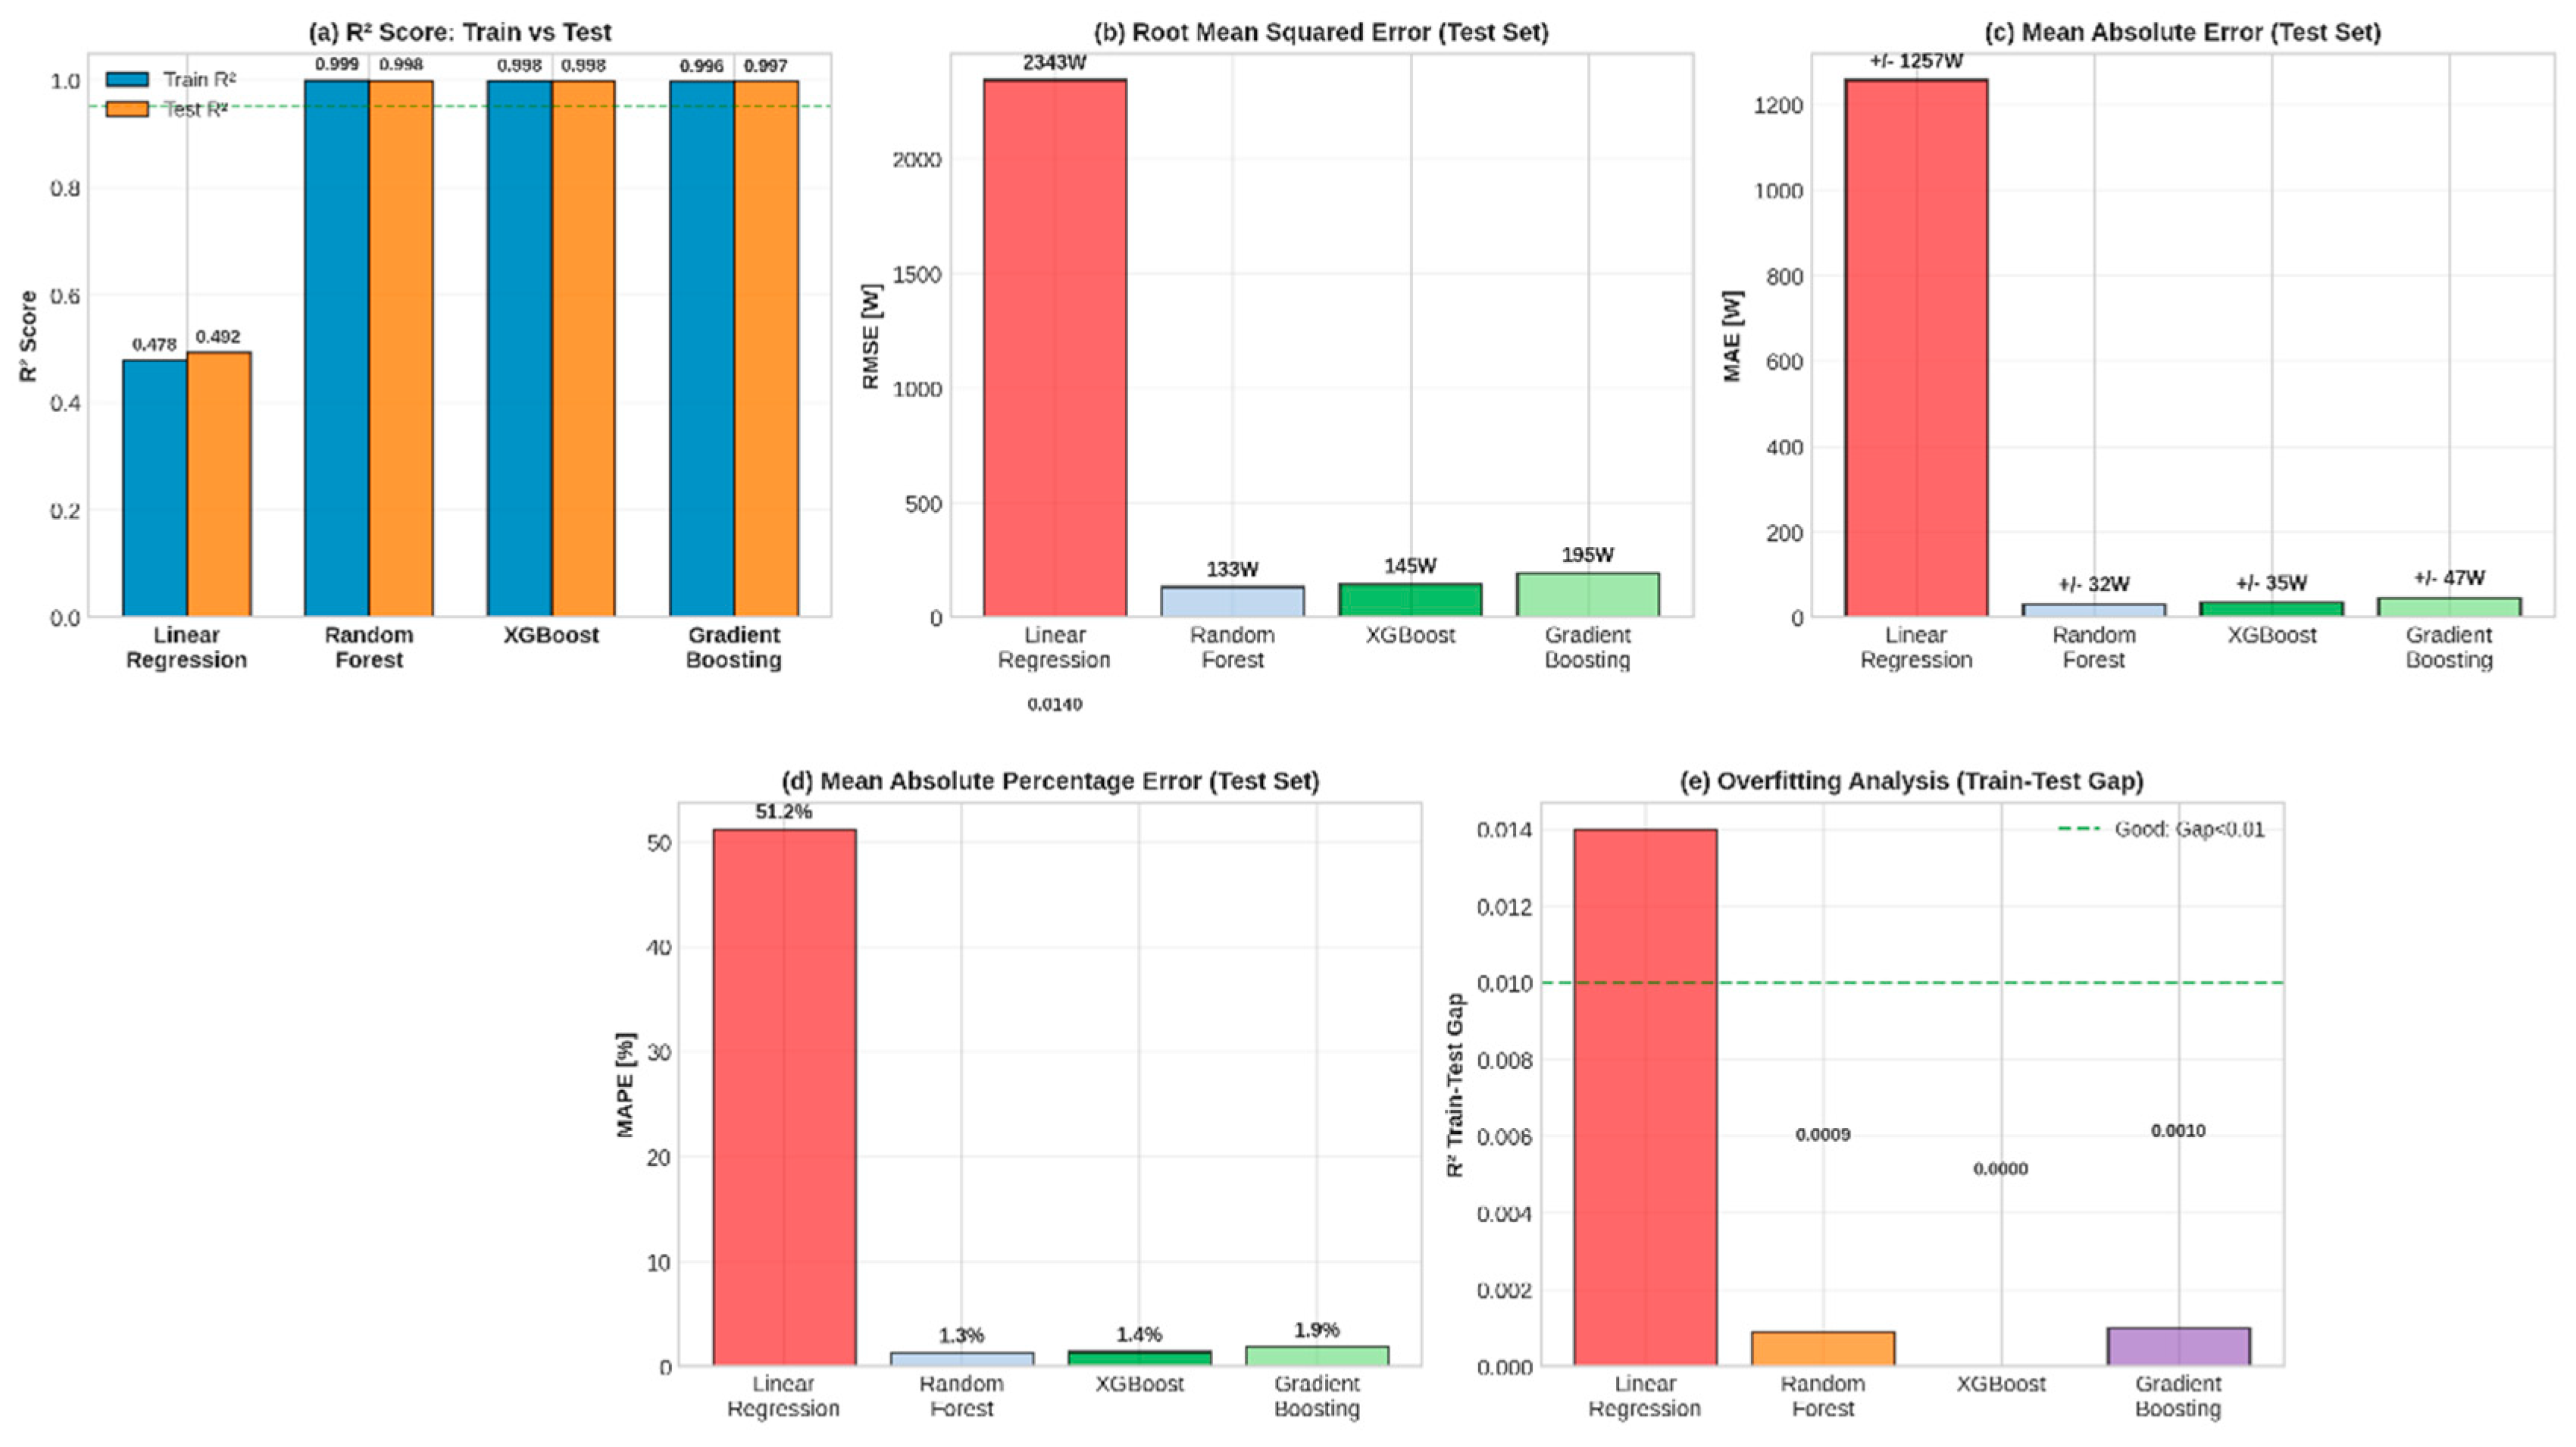
Figure 8.
XGBoost model predictions.
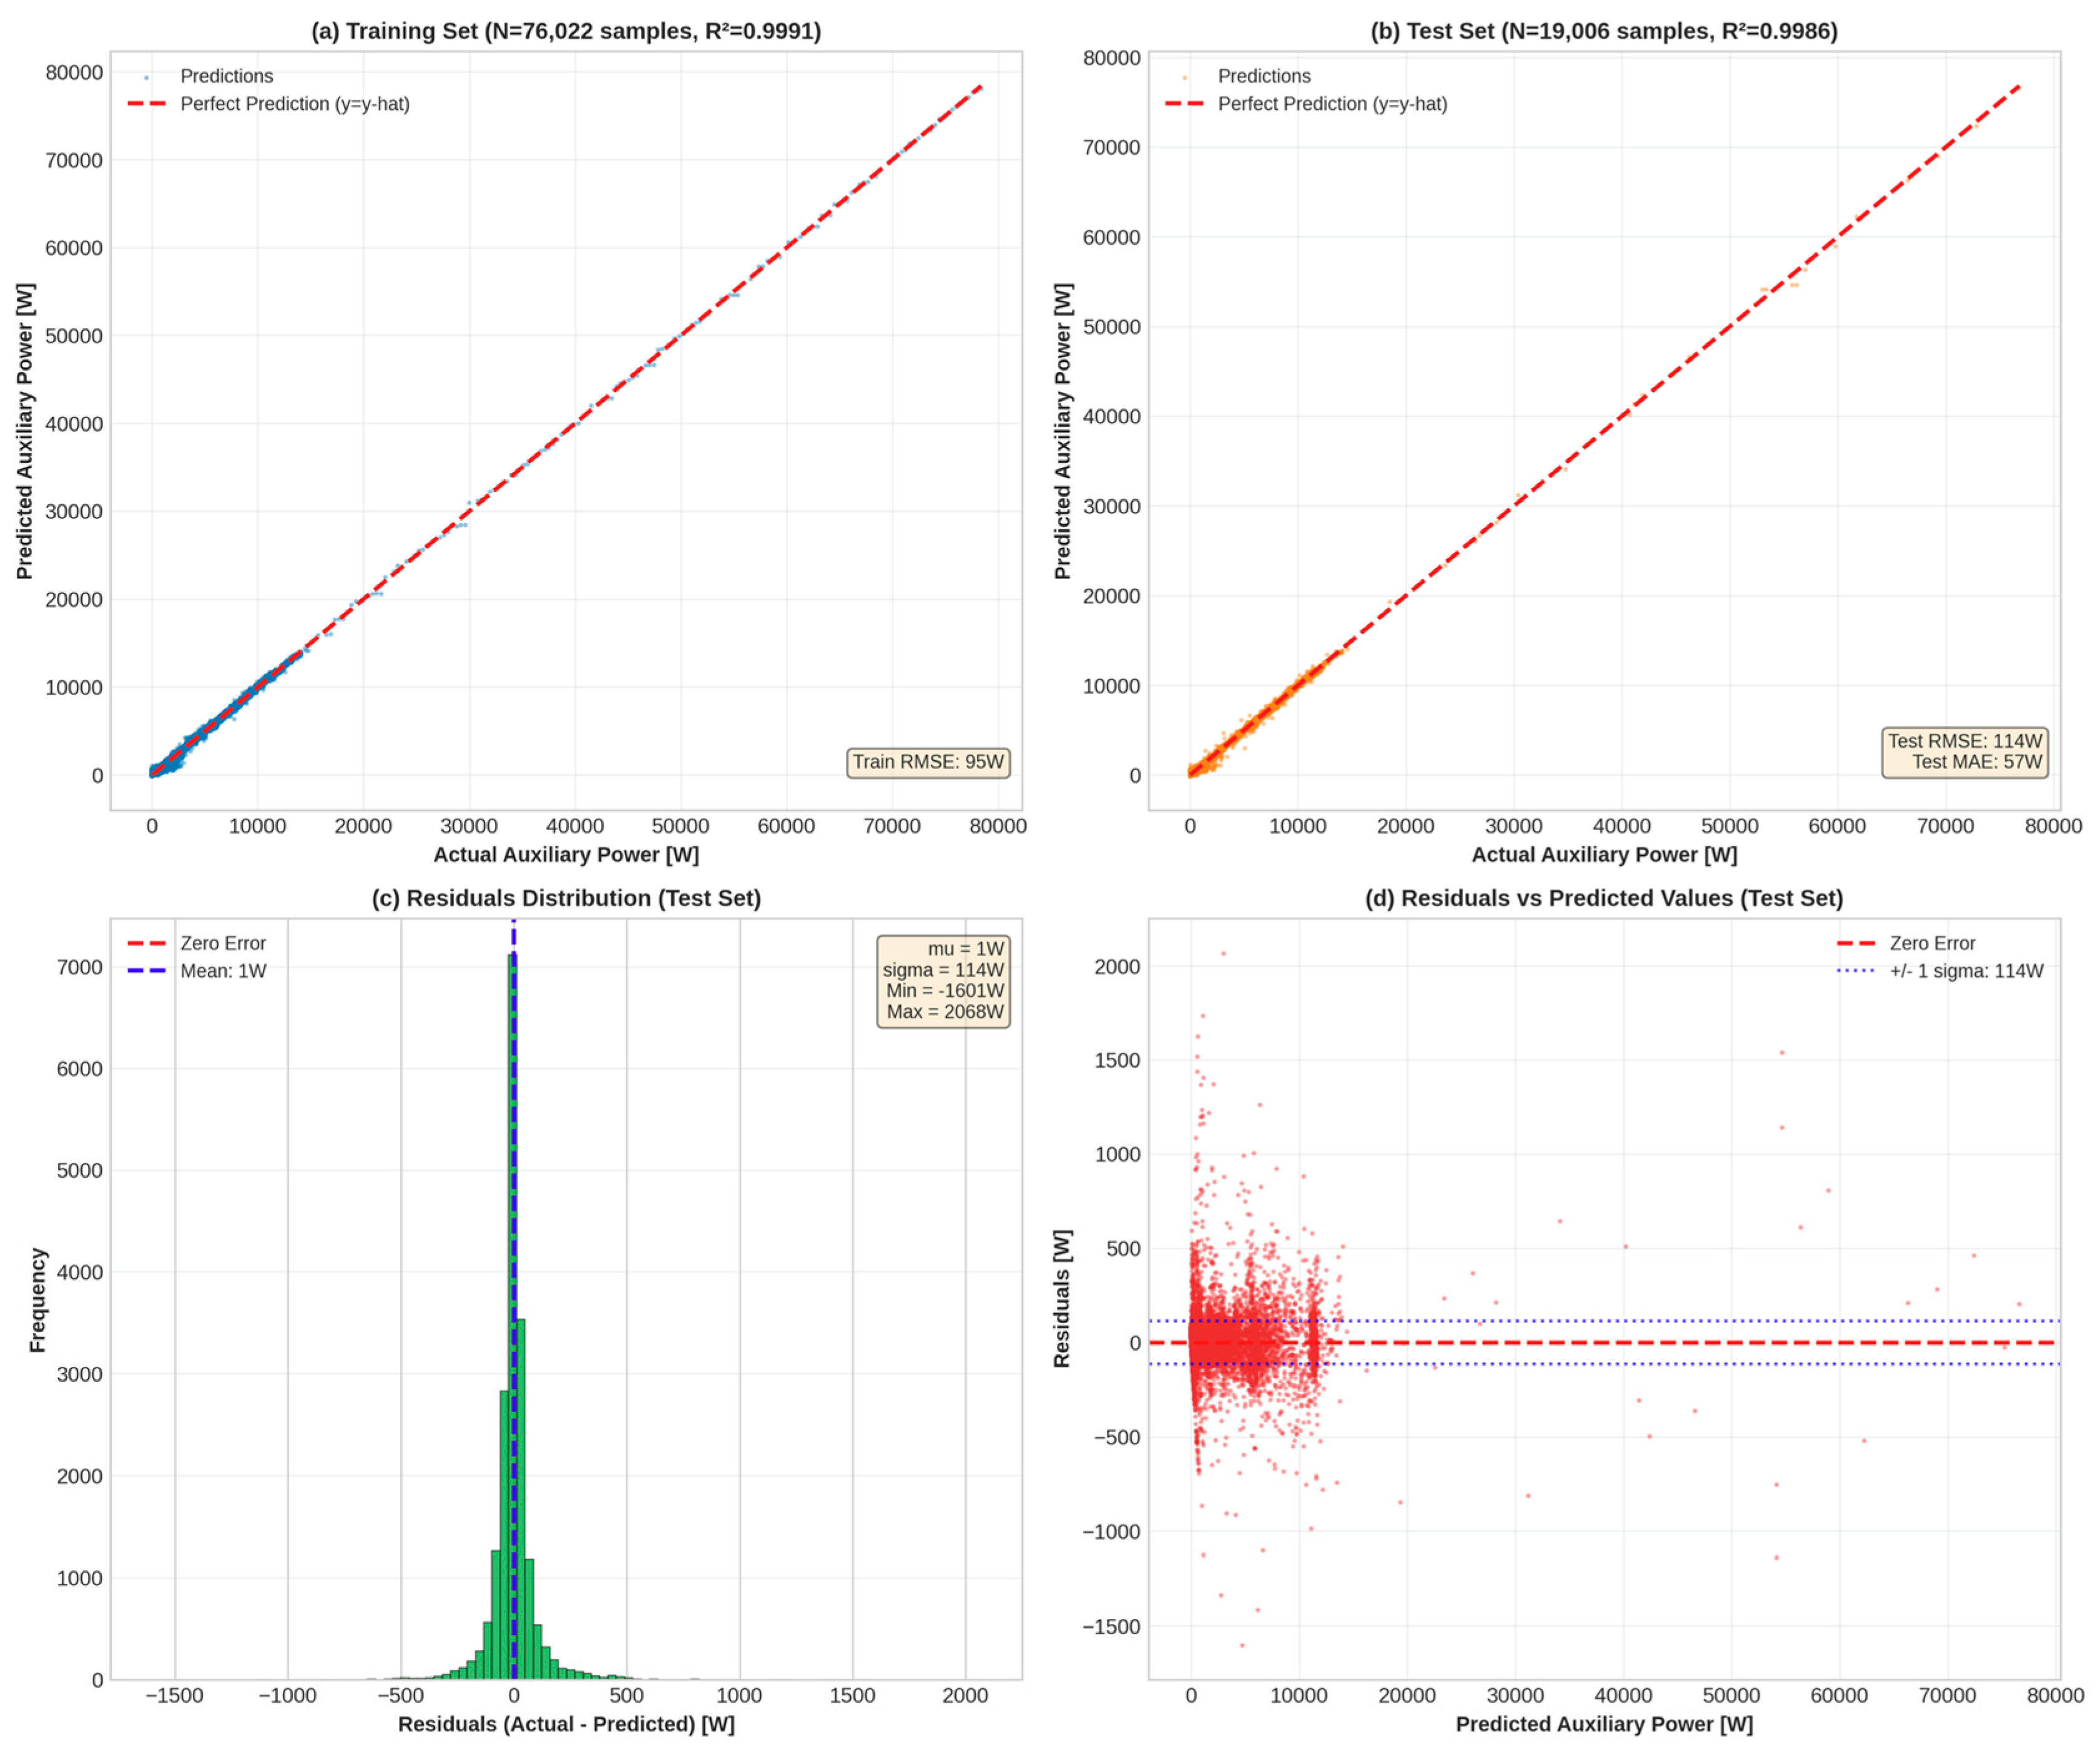
Figure 9.
Feature importance.
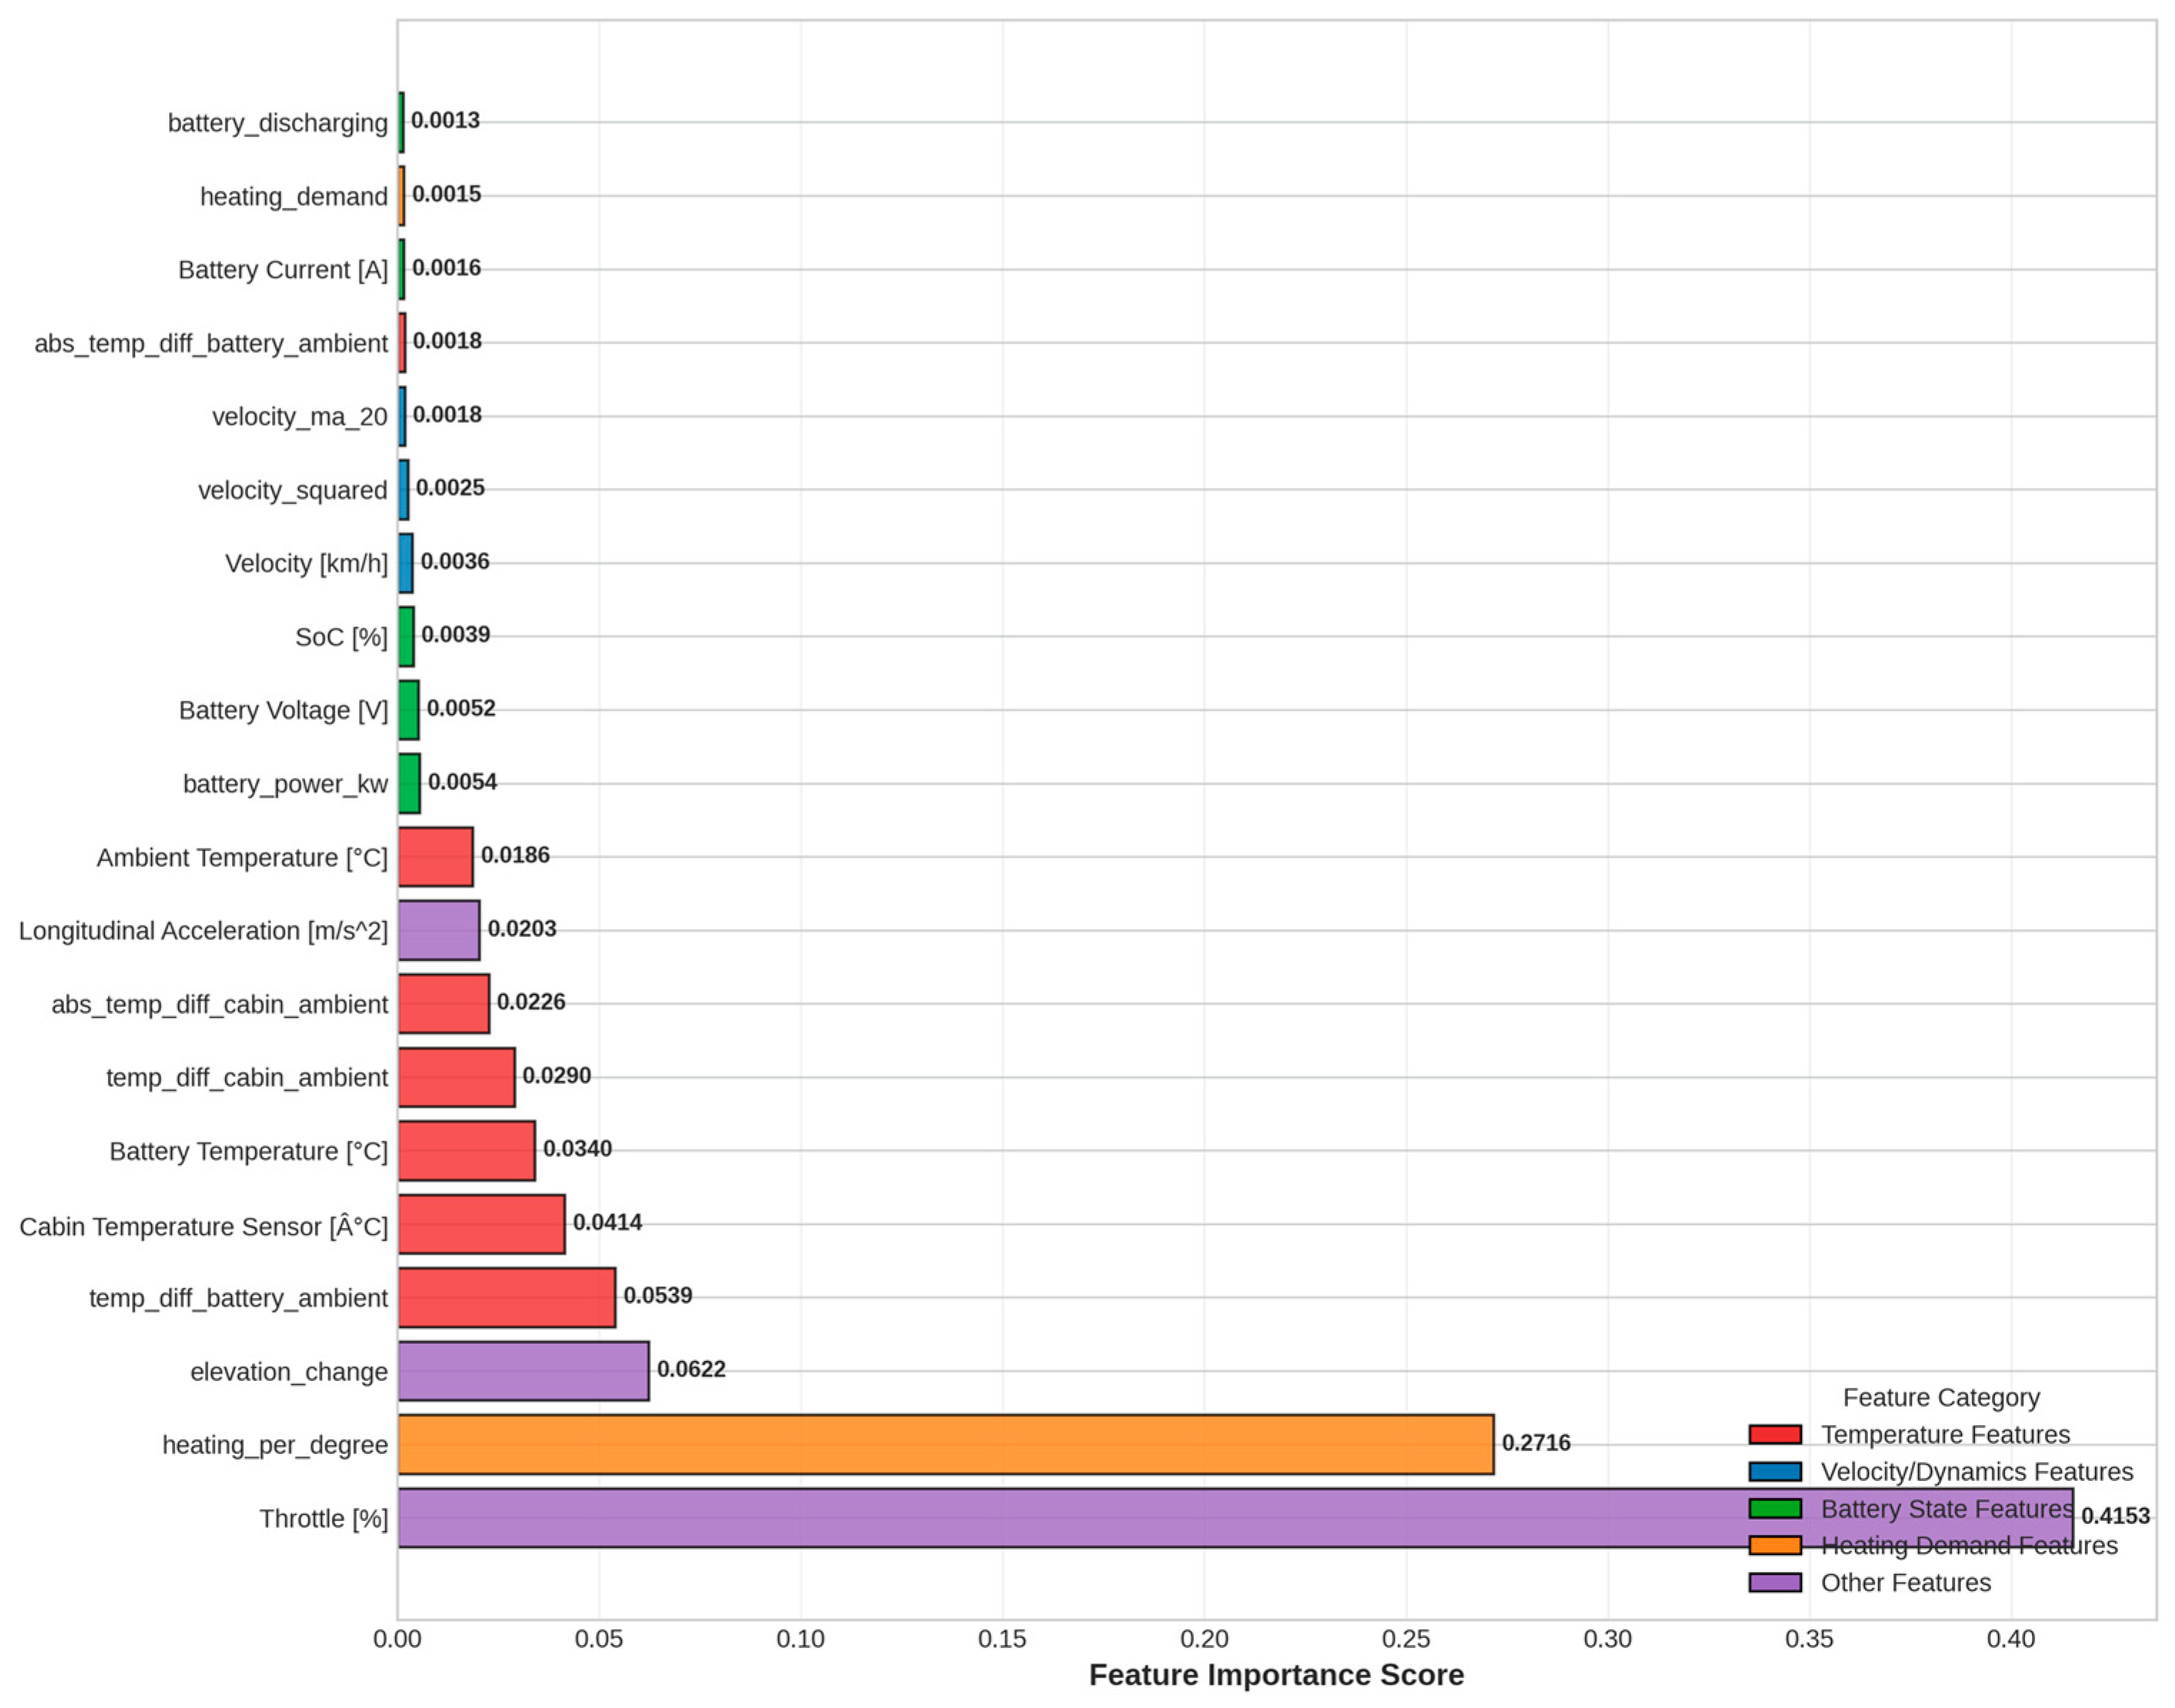
Figure 10.
Cross-validation.
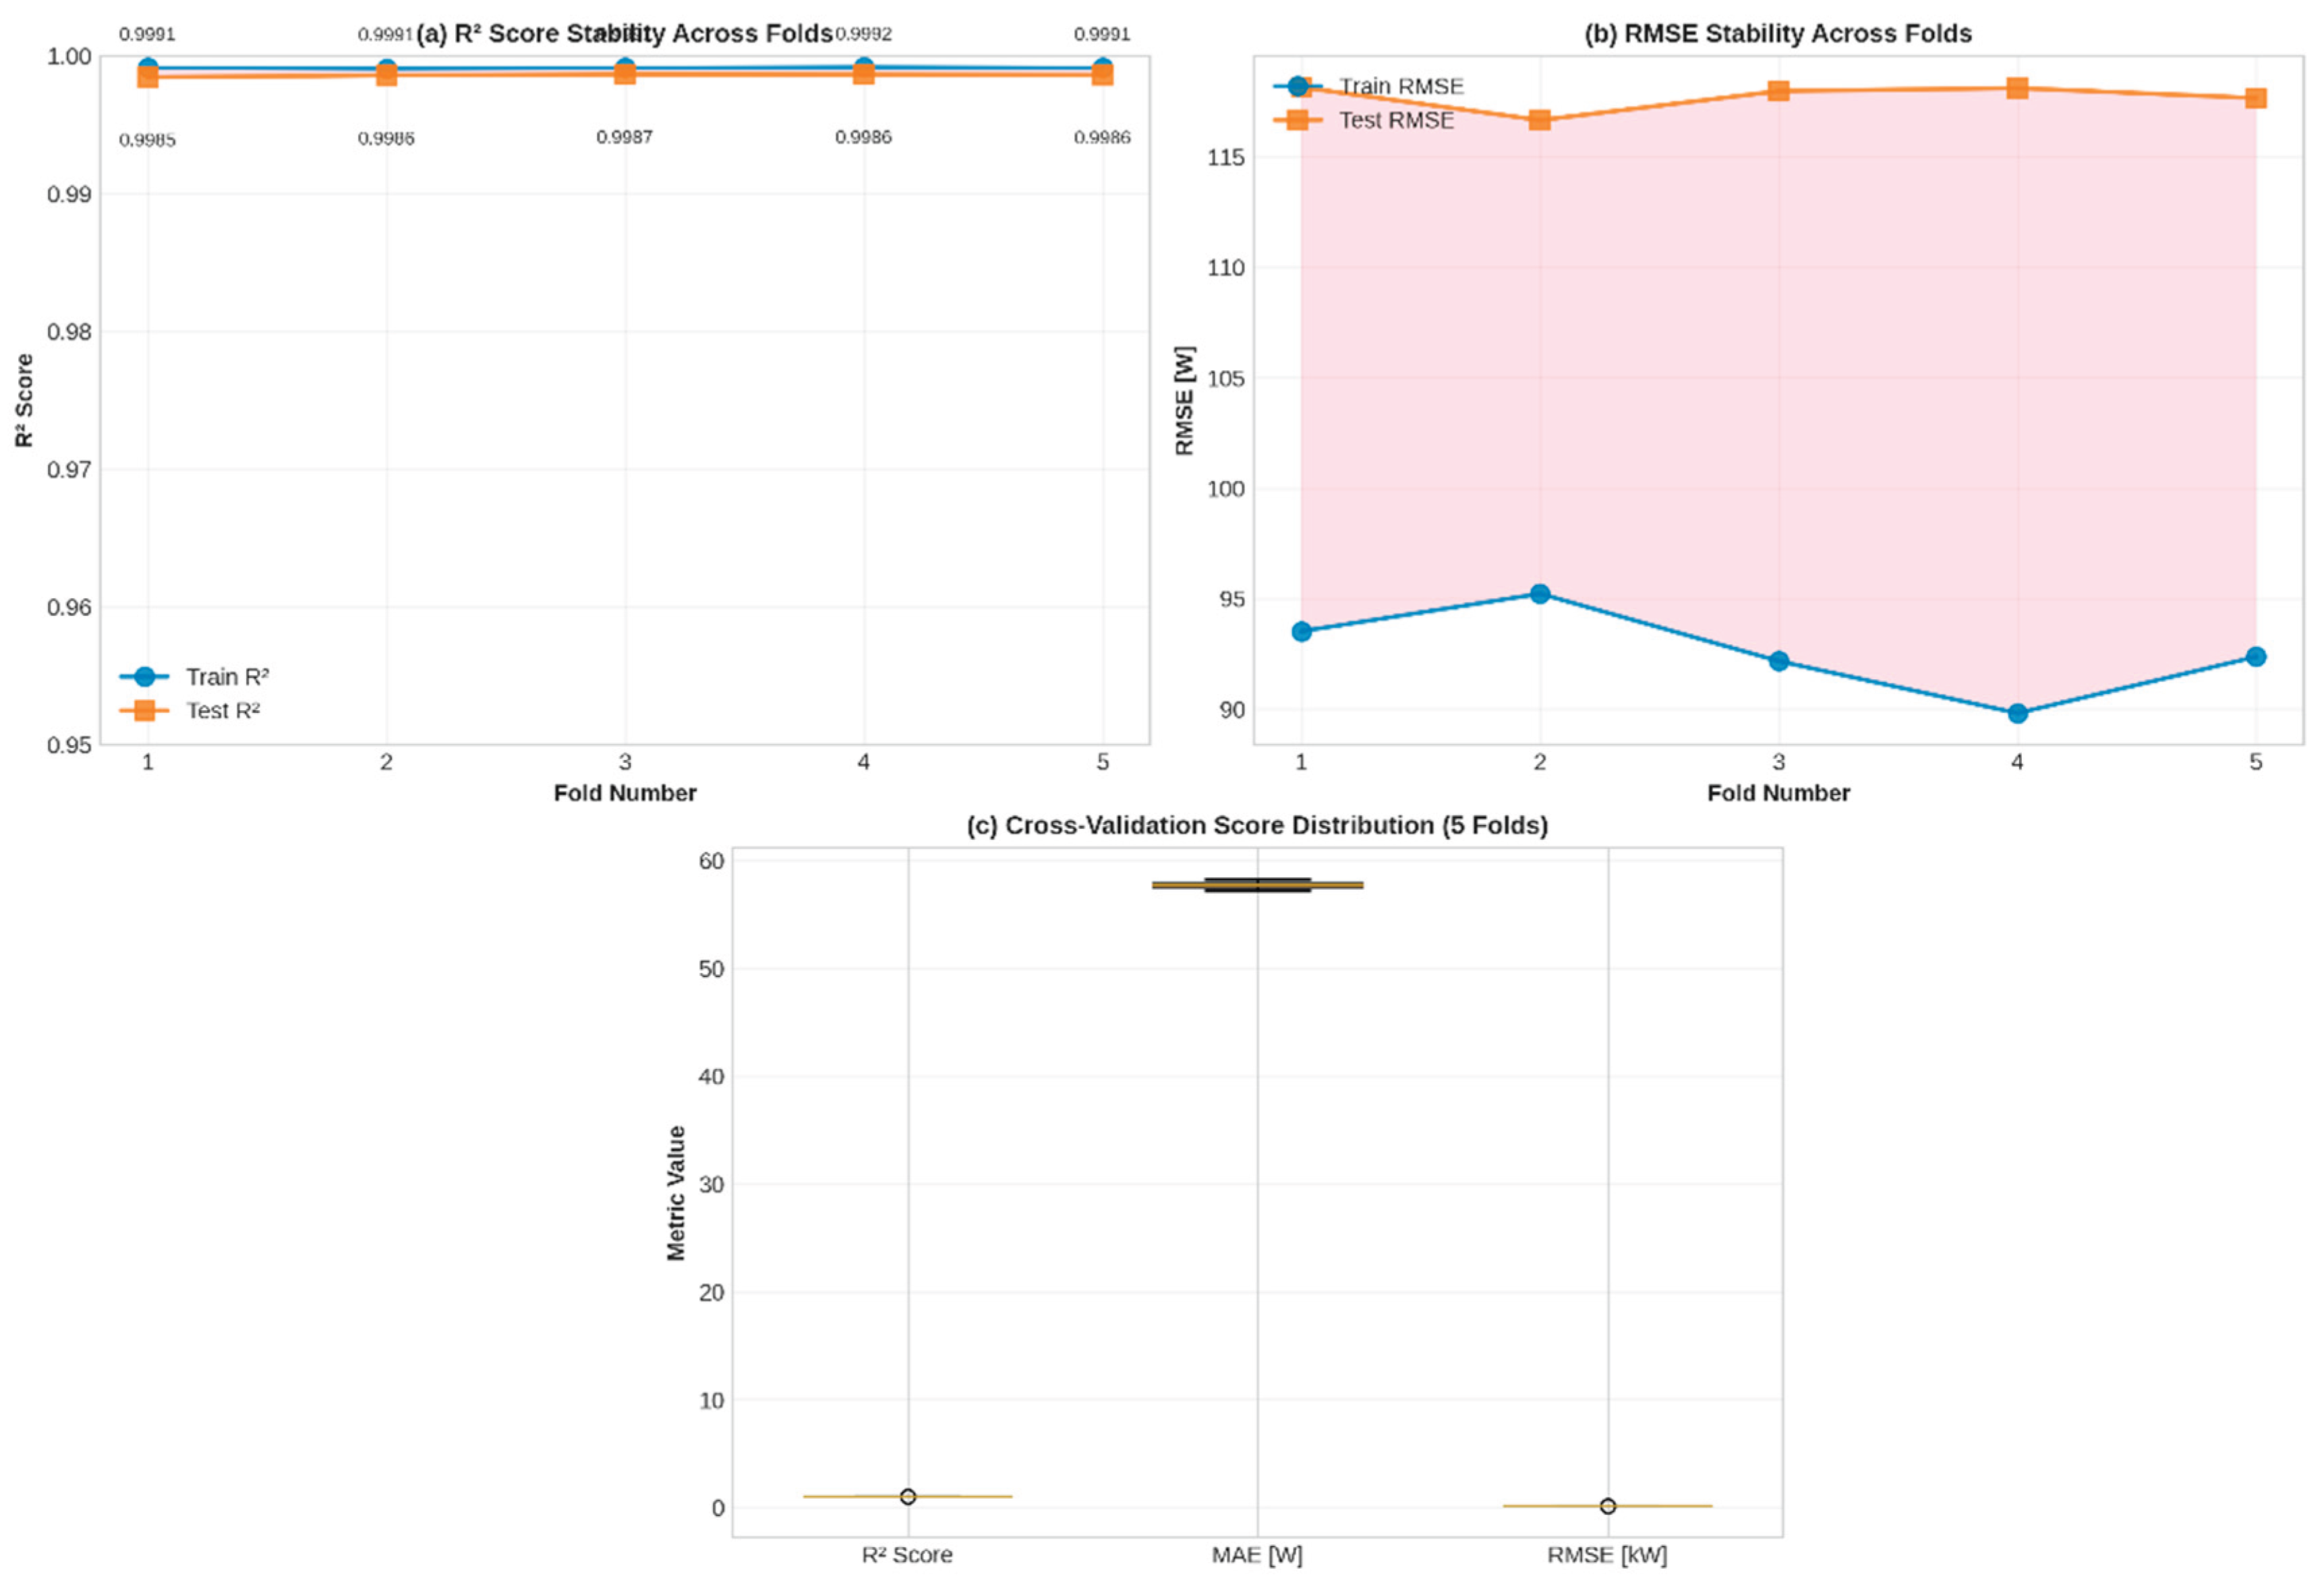
Table 1.
Literature comparison—major studies vs. this work.
| Study | Year | Vehicle | Data source | Model type | Focus | R2/Accuracy | Key limitation |
| Zhang et al. [55] | 2017 | LDV EV | Simulation | Physical | AC energy (China) | N/A | Simulation only, no ML |
| Huang et al. [52] | 2024 | BEV | Real-world + Sim | Hybrid (GAMM, RF, Boosting) | Total energy | R2=0.90 (from 0.60) | Limited auxiliary focus |
| Rathore et al. [29] | 2023 | Generic EV | Charging data | RF, XGBoost, ANN, DNN | Total energy | XGBoost best | No seasonal variation |
| Gil-Sayas et al. [19] | 2024 | PHEV, BEV | Lab (WLTC) | Experimental | MAC system | N/A (descriptive) | Lab only (-7 to 35 °C) |
| Schäfers et al. [56] | 2023 | BEV (Heavy-duty) | Real-world | System ID + Deep Learning | Auxiliaries | R2=0.92 | Single season, commercial vehicles |
| Schäfers et al. [46] | 2024 | BEV | Simulation | Sensitivity analysis | Long-term energy | N/A | Simulation, not ML-based |
| Kim et al. [45] | 2025 | BEV | Real-world fleet | Statistical + ML | Auxiliaries | R2~0.90 | Trip-level, not real-time |
| Mądziel [57] | 2025 | EV | Real-world | Predictive models | Weather + energy | R2~0.85-0.90 | Traction focus, limited auxiliary |
| This Study | 2025 | BEVs | Multi-seasonal real-world (95,028 rec) | Physics + XGBoost | Integrated HVAC + thermal mgmt | R2=0.998 | Two vehicle platform |
Table 3.
Vehicle parameters for physics-based traction energy calculation.
| Parameter | Symbol | Value | Unit | Source/Justification |
| Vehicle Mass | m | 1650 | kg | Typical curb weight; includes battery, motor, and instrumentation |
| Drag Coefficient | C_d | 0.29 | dimensionless | Standard EV aerodynamics; consistent with SAE J1263 [59] |
| Frontal Area | A | 2.2 | m2 | Mid-size vehicle; [60] |
| Rolling Resistance Coefficient | C_r | 0.008 | dimensionless | Low-rolling-resistance tires (eco-type); SAE standard [61] |
| Air Density (sea level) | ρ | 1.225 | kg/m3 | Standard atmosphere; altitude variations negligible [62] |
| Motor Efficiency | η_motor | 0.90 | — | Typical permanent magnet synchronous motor (PMSM) [63] |
Disclaimer/Publisher’s Note: The statements, opinions and data contained in all publications are solely those of the individual author(s) and contributor(s) and not of MDPI and/or the editor(s). MDPI and/or the editor(s) disclaim responsibility for any injury to people or property resulting from any ideas, methods, instructions or products referred to in the content. |
© 2025 by the authors. Licensee MDPI, Basel, Switzerland. This article is an open access article distributed under the terms and conditions of the Creative Commons Attribution (CC BY) license (https://creativecommons.org/licenses/by/4.0/).
Copyright: This open access article is published under a Creative Commons CC BY 4.0 license, which permit the free download, distribution, and reuse, provided that the author and preprint are cited in any reuse.


