
Submitted:
09 October 2025
Posted:
10 October 2025
You are already at the latest version
Abstract
The implementation of Euro 7 emission standards demands advanced real-time NOₓ monitoring systems for diesel vehicles. This study develops a novel Mixture of Experts (MoE) architecture to predict NOₓ emissions under varying thermal and kinematic conditions. Data from a Euro 6d commercial vehicle equipped with PEMS yielded 3,247 samples during real-world driving campaigns. Engine operations were classified into three phases: cold (<70°C coolant temperature), hot low-speed (<90 km/h), and hot high-speed (≥90 km/h), based on aftertreatment system thermal dynamics. The MoE framework dynamically routes predictions to optimized XGBoost specialized regressors for each operational phase, achieving high performance precision (R² = 0.918, RMSE = 1.825 mg/s) with 58% RMSE reduction compared to unified models. Phase separability analysis using t-SNE confirmed distinct emission mechanisms (silhouette coefficient = 0.73). Integration with autoencoder-based anomaly detection achieved 95.2% sensitivity, while Model Predictive Control implementation demonstrated 11-13% NOₓ reduction across driving scenarios. The framework operates within real-time constraints (<1.5 ms inference latency) suitable for embedded automotive applications and Euro 7 compliance through intelligent, context-aware emission prediction.
Keywords:
NOx emissions
; motor vehicles
; mixture of experts
; Euro 7
; phase-specific modeling
; real-time monitoring
1. Introduction
Vehicular emissions, particularly oxides of nitrogen (NOₓ), remain a critical challenge in the context of urban air quality and public health [1,2]. Recent regulatory shifts, including the adoption of the Euro 7 standards, have dramatically raised the requirements for real-world tailpipe emission control [3,4]. These new standards mandate not only lower permissible emission levels but also the continuous, on-road, real-time monitoring of critical pollutants over the entire lifetime of the vehicle, resulting in unprecedented technical complexity for manufacturers, regulators, and data scientists alike [5,6].
Traditional approaches to emission compliance—relying on periodic laboratory or PEMS (Portable Emissions Measurement Systems) tests—are insufficient for capturing the full spectrum of real-world driving behaviors, transient events, and vehicle aging effects [7,8]. As a result, the automotive industry is transitioning towards robust On-Board Monitoring (OBM) systems, which must provide high-frequency, sensor-driven data streams, support over-the-air reporting, and trigger protective actions when emission exceedances are detected [9,10]. This paradigm shift is also driving the adoption of advanced data analytics and artificial intelligence (AI), as evidenced by contemporary research and frameworks leveraging machine learning for phase-specific emission prediction [11,12].
The European Union’s Euro 7 emission standard represents the most stringent regulatory framework to date for controlling vehicular pollutants, mandating a 50 % reduction in NOₓ limits for diesel engines compared to Euro 6 and extending durability requirements to 10 years or 200 000 km [13,14]. These regulations demand continuous real-world monitoring of NOₓ, PM, and NH₃ emissions through on-board monitoring (OBM) systems, shifting the paradigm from periodic laboratory tests to embedded real-time surveillance in passenger and commercial vehicles [15,16]. To meet Euro 7 requirements, predictive models must operate within strict latency constraints (< 1.5 ms) while maintaining high accuracy throughout extended operational lifespans. However, accurately forecasting NOₓ formation in diesel aftertreatment systems remains challenging due to complex thermal dependencies, transient engine dynamics, and variable driving conditions, especially during cold-start and low-temperature operation phases where SCR catalyst efficiency drops substantially below optimal temperature windows [17,18]. Traditional physics-based models excel in controlled environments but fail to generalize to transient real-world cycles, and unified machine learning approaches, while demonstrating R² values above 0.90, do not explicitly account for distinct emission mechanisms across operational phases.
A critical gap in current literature lies in phase-discriminative emissions modeling: most studies on cold-start NOₓ consider passenger vehicles without systematic criteria for phase transitions in commercial diesel applications [19,20], and SCR temperature thresholds are often arbitrary and unvalidated [21,22]. Similarly, ensemble learning methods applied to emissions prediction rely on generic boosting or bagging techniques without leveraging domain knowledge of aftertreatment thermal dynamics [23], and few approaches address the computational constraints of embedded OBM systems [24].
This study addresses these gaps by developing a novel phase-discriminative framework based on a Mixture of Experts (MoE) architecture for real-time NOₓ prediction. Data were collected from a Euro 6d commercial diesel vehicle equipped with portable emissions measurement systems in 3 247 samples covering cold-start, urban, and highway conditions. Data-driven criteria for phase classification—cold (coolant temperature < 70 °C, low SCR temperature), hot low-speed (< 90 km/h), and hot high-speed (≥ 90 km/h)—were established and validated using t-SNE clustering and silhouette analysis. Advanced feature engineering captures temporal dependencies via rolling statistics and exponentially weighted moving averages. The MoE framework dynamically routes input to specialized XGBoost regressors optimized for each operational phase, achieving an overall R² of 0.918 and a 58 % RMSE reduction compared to unified models. The system integrates autoencoder-based anomaly detection (95.2 % sensitivity) and Model Predictive Control for proactive NOₓ reduction (11–13 %), all within real-time latency constraints. Integration with PTV VISSIM demonstrates applicability for traffic microsimulation and urban air quality assessment.
Contributions of this work include the first systematic phase-specific NOₓ emissions modeling framework, novel expert allocation strategies informed by thermal and kinematic domain knowledge, and comprehensive real-world validation for Euro 7 OBM compliance. The results provide a foundation for next-generation emissions control systems, offering both theoretical advances and practical solutions for automotive OEMs and regulatory bodies.
2. Materials and Methods
The general workflow of this study is illustrated in Figure 1. First, a vehicle equipped with a Portable emission Measurement System (PEMS) was instrumented to collect synchronized data on NOx, CO₂, THC, CO, coolant temperature, speed, and acceleration under various urban and highway driving conditions. Raw time-series data were preprocessed to classify each sample into one of three operational phases—cold (< 70 °C coolant), hot low-speed (≥ 70 °C & ≤ 90 km/h), and hot high-speed (≥ 70 °C & > 90 km/h)—to reflect distinct aftertreatment thermal regimes. Feature engineering then generated temporal indicators (e.g., exponentially weighted moving averages, temperature lags), rolling statistics of kinematic variables, and thermal trend metrics to capture transient emission dynamics. Three parallel modeling approaches were developed: phase-specific XGBoost regressors trained on single-phase data, a unified multi-phase XGBoost model, and a Mixture of Experts architecture that dynamically routes inputs to phase-specialist regressors. An advanced analytics pipeline incorporated autoencoder-based anomaly detection to flag abnormal emission events and integrated the predictive model into a Model Predictive Control framework for real-time NOₓ mitigation. Finally, model performance was validated through cross-validation metrics (R², RMSE, MAE), inference latency measurements on an ARM Cortex-A78 platform, anomaly detection sensitivity assessments and MPC-based emission reduction evaluations. This structured methodology provides a foundation for real-time on-board monitoring and control under Euro 7 requirements.
Data were collected from a 2020 vehicle equipped with a comprehensive real-world driving emissions monitoring system during extended road testing campaigns. The test vehicle was a Euro 6d-compliant diesel commercial vehicle representative of modern European light commercial vehicle technology, featuring a 1.56-liter turbocharged diesel engine producing maximum power of 88 kW at 3500 rpm and maximum torque of 300 Nm at 1750 rpm. The vehicle was equipped with a six-speed manual transmission and had a curb weight of 1429 kg, positioning it as a typical representative of the European LCV market segment that must comply with increasingly stringent emission regulations while maintaining practical utility for commercial applications.
The vehicle powertrain featured advanced BlueHDi technology, representing state-of-the-art Euro 6d emission control systems that serve as a technological bridge towards future Euro 7 compliance requirements. The engine incorporated direct injection fuel delivery via the common-rail with multiple injection strategies optimized for emission control and fuel economy. Most critically for this study, the vehicle was equipped with a comprehensive aftertreatment system that included a diesel oxidation catalyst (DOC), a diesel particulate filter (DPF) and a selective catalytic reduction (SCR) system with an ammonia slip catalyst (ASC). This multi-stage aftertreatment configuration represents the current industry standard for meeting Euro 6d requirements and provides emissions characteristics that closely approximate expected Euro 7 system behavior, particularly regarding NOₓ control strategies and cold-start emission patterns [25,26].
The comprehensive aftertreatment system was particularly relevant to the objectives of this study, as Euro 6d vehicles must demonstrate Real Driving Emissions (RDE) compliance with conformity factors that closely approximate Euro 7 requirements [27]. The SCR system utilized advanced urea injection control with precise dosing strategies designed to maintain a NOx conversion efficiency exceeding 85% across a wide range of operating conditions while minimizing ammonia slip [28,29]. The integrated DPF achieved particulate filtration efficiency exceeding 99% with intelligent regeneration management that optimized soot oxidation timing based on real-time operating conditions. This technological configuration ensures that emission characteristics closely represent the performance expectations for Euro 7 systems, making the collected data highly relevant for developing predictive models applicable to next-generation emission control requirements.
The vehicle was instrumented with a Portable Emissions Measurement System (PEMS) configured according to European RDE testing protocols and designed for continuous high-frequency data acquisition during real-world driving conditions. The PEMS installation included a comprehensive suite of gas analyzers utilizing non-dispersive infrared (NDIR) detection for CO₂ and CO measurement, electrochemical sensors for NOₓ quantification, and flame ionization detection (FID) for total hydrocarbon (THC) analysis [30,31]. All emission measurements were recorded as instantaneous mass flow rates in g/s units, providing direct quantification of pollutant formation rates rather than distance-normalized values, which enabled more precise modeling of transient emission behavior and phase-dependent emission characteristics.
Vehicle dynamics monitoring incorporated high-precision GPS positioning systems for longitude and latitude tracking, allowing the calculation of the road gradient and vehicle trajectory parameters that influence emission formation. Instantaneous vehicle velocity and acceleration were derived from GPS data with temporal smoothing to minimize measurement noise while preserving characteristics of transient behavior essential for emission modeling. Engine operating parameters were monitored through a direct OBD-II interface connection, providing real-time access to engine coolant temperature, which served as the primary indicator for defining cold-start versus hot operation phases. The entire measurement system operated at a 1 Hz sampling frequency, generating synchronized time-series data that captured both rapid transient events and longer-term emission trends across different driving conditions and engine thermal states.
The data set collected was systematic preprocessed to establish consistent phase classification criteria that reflect different emission formation mechanisms observed in modern diesel aftertreatment systems. The engine operating conditions were classified into three fundamental phases based on thermal and dynamic criteria that are directly correlated with the performance characteristics of the aftertreatment system. The cold phase was defined as the operation that occurs when the engine coolant temperature remained below 70°C, representing the critical cold-start period when the aftertreatment components have not reached the optimal operating temperature and the efficiency of emission control is significantly reduced. During this phase, SCR catalyst activity is minimal due to insufficient thermal activation, and DPF regeneration capability is limited, resulting in characteristically elevated emission levels that can dominate total trip emissions despite representing only the initial 1-2 kilometers of driving.
The hot operation was subdivided into two distinct phases based on vehicle velocity characteristics that reflect different aftertreatment system operating regimes. Hot low-speed operation was defined as engine cooling temperature ≥ 70°C combined with vehicle velocity < 50 km/h, representing urban driving conditions where aft low-speed hotstems operate under variable load conditions with frequent thermal cycles that can affect the consistency of emission control. Hot high-speed operation encompassed engine coolant temperature ≥ 70°C with vehicle velocity ≥ 50 km/h, representing highway driving conditions where aftertreatment systems achieve optimal thermal stability and maximum emission control efficiency. This phase-based classification approach captures the fundamental differences in emission formation mechanisms that result from the thermal dynamics of the aftertreatment system and the variations in operational efficiency under different driving conditions.
Recognizing that emission formation in modern diesel vehicles exhibits strong temporal dependencies related to aftertreatment system thermal dynamics and catalytic activity, several sophisticated temporal features were engineered to capture these transient effects [32,33]. Time-dependent features included time_from_start, representing elapsed time since engine start, which directly correlates with aftertreatment system thermal conditioning and emission control system activation timing. Rolling statistical features were calculated using 30-second moving windows to capture short-term variations in driving patterns while maintaining computational efficiency suitable for real-time applications. These features included V_mean_win (velocity moving average) and a_std_win (acceleration standard deviation), which characterize driving intensity and transient behavior patterns that directly influence exhaust temperature and aftertreatment system performance.
Advanced thermal trend analysis incorporated exponentially weighted moving averages (EWMA) with adaptive weighting parameters to model the thermal response characteristics of the aftertreatment system. The temp_trend feature utilized EWMA calculations with α = 2/(span+1) where span = 30 seconds, providing responsive tracking of thermal conditioning rates while suppressing measurement noise that could degrade model performance. Additional gradient-based features included road gradient calculations and jerk (acceleration rate of change) to account for topographical influences on engine load and exhaust thermal management, which directly impact SCR operating temperature and NOₓ conversion efficiency. These temporal features were specifically designed to capture the dynamic relationships between driving conditions, the thermal state of the aftertreatment system, and emission formation processes that are critical to accurate real-time emission prediction.
The modeling approach incorporated three distinct architectural strategies to systematically evaluate optimal approaches for phase-dependent emission prediction in real-time automotive applications. Phase-specific XGBoost models were developed as individual gradient boosting regressors trained separately for each operational phase, enabling specialized optimization for the distinct emission formation mechanisms observed during cold-start, urban and highway operation. This approach takes advantage of the principle that the performance characteristics of the aftertreatment system exhibit fundamentally different behavior patterns in thermal and dynamic operating regimes, suggesting that specialized models may achieve superior predictive accuracy compared to unified approaches.
Multi-phase unified modeling utilized a single XGBoost regressor with operational phase encoded as categorical features through one-hot encoding, enabling the model to learn phase-dependent relationships while maintaining a unified architecture suitable for streamlined deployment. The mixture of experts architecture represented the most sophisticated approach, incorporating dynamic ensemble methods that combine phase-specific models with intelligent routing algorithms based on real-time engine state determination. This approach enables adaptive model selection that automatically directs prediction requests to the most appropriate specialized model based on current operating conditions, potentially achieving optimal prediction accuracy while maintaining explainable model behavior suitable for regulatory compliance applications.
The comprehensive modeling framework incorporated advanced anomaly detection and predictive control capabilities to demonstrate integrated real-time emission management functionality. A deep autoencoder network was implemented for continuous anomaly detection in emission patterns, using encoder-decoder architecture with progressive reduction of dimensionality from five input features through 8-node and 3-node hidden layers before reconstruction through symmetric decoder layers. The autoencoder was trained exclusively on normal operation data from hot phases to establish baseline emission pattern recognition, enabling detection of anomalous emission behavior during cold-start periods or aftertreatment system malfunctions through reconstruction error analysis with threshold determination based on 95th percentile validation set performance.
The integration of Model Predictive Control (MPC) demonstrated practical emission optimization capabilities through simplified implementation of the real-time control framework. The MPC system utilized trained XGBoost regressors for NOₓ emission forecasting with acceleration command optimization over candidate control input spaces, enabling proactive emission minimization through predictive driving pattern adjustment. This integrated approach demonstrates the potential to combine advanced emission modeling with real-time control strategies to achieve proactive emission management that could support Euro 7 compliance through intelligent vehicle operation optimization rather than relying solely on passive aftertreatment system performance.
3. Results
In this chapter, a comprehensive analysis of the real-world driving emissions data is presented. The first stage of the study examines all the exhaust compounds—including NOₓ, CO₂, THC, and CO—alongside vehicle dynamics parameters, validating data quality and exploratory insights. Subsequent sections focus exclusively on NOₓ modeling, as this pollutant constitutes the most critical challenge for diesel vehicles. Section 3.1 characterizes the dataset and details the phase classification methodology, demonstrating the existence of three distinct operational regimes—cold (< 70 °C coolant temperature), hot low-speed (≥ 70 °C and ≤ 90 km/h) and hot high-speed (≥ 70 °C and > 90 km/h)—which underpin the phase-discriminative modeling approach.
3.1. Dataset Characterization and Phase Classification
Analysis of real-world driving emissions data collected from a Euro 6d diesel commercial vehicle revealed distinct operational characteristics that validate the proposed phase-based modeling approach. The data set comprised 3,247 samples that span cold-start, urban, and highway driving conditions with complete PEMS measurements on all emission compounds and vehicle dynamics parameters.
In the initial stage of the work, the quality assessment of the data and the execution of exploratory data analysis (EDA) is presented through a correlation matrix plot. The correlation matrix plot plays a key role in the preliminary exploration of data, as it allows rapid identification of significant relationships between variables and helps assess data quality [34,35]. It reveals strong correlations, such as the dependence of NOₓ emissions on vehicle speed and acceleration. Simultaneously, it highlights weak or insignificant correlations—for example, the lack of direct influence of road gradient on emissions—which permits focusing further analysis on important factors and planning appropriate data transformations or models that consider indirect effects. The correlation matrix plot for the analyzed data is presented in Figure 2.
The correlation matrix analysis revealed strong inter-relationships among emission compounds and vehicle dynamics variables. NOₓ emissions demonstrated significant positive correlations with vehicle velocity (r = 0.42, p < 0.001) and acceleration (r = 0.21, p < 0.001), confirming the kinematic dependence of emission formation processes. The engine temperature exhibited a moderate correlation with velocity (r = 0.55) and CO₂ emissions (r = 0.35), reflecting the thermal-load relationship in the operation of the diesel engine. Strong correlations between CO₂ and THC (r = 0.85) and THC and NOₓ (r = 0.64) indicate coupled combustion and aftertreatment processes. In particular, the effects of the gradient showed a minimal direct correlation with emissions (r = 0.02), suggesting that the topographic influences are mediated by secondary effects on engine load and thermal management of the exhaust rather than the direct impact of emissions.
Operational conditions were segmented into three phases based on the engine coolant temperature and vehicle speed, which are crucial to describing the efficiency of the exhaust aftertreatment system: Cold Phase—coolant temperature below 70 °C (catalytic warm-up period including SCR and diesel particulate filter, characterized by low NOₓ conversion efficiency) Hot Low-Speed Phase—coolant temperature equal to or above 70 °C and speed up to 90 km/h (urban driving conditions with frequent thermal and load cycles); Hot High-Speed Phase—coolant temperature equal to or above 70 °C and speed above 90 km/h (highway driving conditions with optimal operating temperature of the aftertreatment systems). This classification is based on the observed thermal and kinetic characteristics of BlueHDi systems, ensuring a clear separation of emission processes that occur under different thermal and dynamic states. This classification enables the application of phase-targeted emission models, as confirmed by further analysis of feature distributions and phase separability demonstrated in multidimensional reduction (Figure 3).
The estimation of kernel density reveals distinct statistical characteristics of key variables in operational phases, providing quantitative validation of the phase classification methodology. Vehicle velocity distributions demonstrate clear phase-dependent patterns: cold operation exhibits a narrow low-speed distribution (mode = 12.4 km/h) reflecting conservative warm-up driving, while hot phases show broader distributions with hot high-speed operation extending to highway velocities (>100 km/h). Acceleration patterns reveal fundamental behavioral differences: the cold phase maintains the most constrained acceleration range (σ = 0.31 m/s²), the high speed shows a bimodal distribution reflecting stop-and-go urban patterns, and the high speed exhibits a near-normal distribution centered around zero, consistent with steady-state highway driving. The engine temperature distributions confirm the effectiveness of the 70°C threshold criterion, the cold phase showing a narrow distribution below the threshold (mean = 62.8°C, σ = 8.4°C) and the hot phases exhibiting operating temperature ranges above 70°C. Most significantly, NOₓ emission distributions demonstrate pronounced phase-dependent characteristics: cold operation shows a right-skewed distribution with a heavy tail extending to 0.020 g/s (representing 15-fold increases over hot operation medians), while hot phases exhibit log-normal distributions with significantly lower emission rates (hot low-speed: median = 0.0018 g/s; hot high-speed: median = 0.0032 g/s). These distribution differences achieve statistical significance (Kolmogorov-Smirnov test: p < 0.001 for all pairwise comparisons), confirming that phase-specific modeling approaches are statistically justified and necessary for accurate emission prediction.
The subsequent plots present the statistical distributions of the emission data for each engine operational phase. The first plot shown is Figure 4.
Phase-dependent emission distributions demonstrate significant differences in NOₓ formation characteristics: the cold-start phase exhibits 8.5 times higher median emissions (3.4 mg/s) compared to the hot low-speed operation (0.4 mg/s) and 5.2 times higher than the hot high-speed operation (6.5 mg/s), confirming the critical impact of aftertreatment thermal conditioning on emission control efficiency. The stacked histogram reveals distinct emission regimes, with the cold phase contributing disproportionately to high-emission events, despite representing only 6.4% of total samples. Hot operation phases show characteristic low-emission distributions with occasional spikes corresponding to transient acceleration events or aftertreatment regeneration cycles. Subsequent statistical analyses of NOₓ emissions for individual operational phases are presented in Figure 5.
Statistical summary analysis confirms phase-dependent emission characteristics with the cold phase exhibiting the highest variability and numerous outliers extending beyond 0.015 g/s. Hot low-speed operation demonstrates the most constrained emission distribution with the lowest median (~0.3 mg/s) and the smallest interquartile range. Hot high-speed shows intermediate characteristics with median emissions around 0.02-0.03 g/s and moderate variability. The cold phase displays the greatest number of extreme outliers, emphasizing the critical importance of cold-start emission control for regulatory compliance.
3.2. Kinematic and Thermal Behavior Analysis
In this section, the interdependent kinematic and thermal characteristics of real-world driving data are examined to validate the phase classification framework. The vehicle dynamics metrics—velocity and acceleration—are first analyzed to reveal distinct behavioral clusters corresponding to cold-start, urban, and highway conditions, supporting the defined phase boundaries. Subsequently, time-series correlations between engine coolant temperature and instantaneous NOₓ emissions are explored to quantify the thermal activation effects of the SCR aftertreatment system. Finally, multi-dimensional visualizations—including 3D feature space and t-SNE projections—illustrate the non-linear interactions between speed, acceleration, thermal state, and NOₓ formation, confirming that phase-specific modeling is both statistically justified and essential for accurate emission prediction.
Kinematic analysis (Figure 6) reveals distinct driving patterns between phases: cold operation shows concentrated low-speed, low-acceleration behavior (velocity cluster: 0-40 km/h, acceleration range: ±0.8 m/s²), while hot phases demonstrate broader kinematic ranges. The scatter plot demonstrates clear phase separation in the velocity-acceleration space, with cold phase clustering in the conservative driving region, hot low-speed operation spanning the full acceleration range at moderate velocities (0-90 km/h), and hot high-speed operation concentrated in high-velocity, low-acceleration regions (>90 km/h, |a| < 0.5 m/s²) consistent with highway cruise conditions.
The violin plot analysis (Figure 7) reveals distinct acceleration behavior patterns in engine operational phases, providing empirical support for phase-based modeling approaches. The cold phase operation exhibits the narrowest acceleration distribution (IQR: -0.3 to +0.4 m/s², σ = 0.31 m/s²), reflecting conservative driving patterns during engine warm-up periods when drivers typically avoid aggressive maneuvers. Hot low-speed operation demonstrates the broadest acceleration range (σ = 0.48 m/s²) with a pronounced bimodal distribution, capturing both stop-and-go traffic patterns (frequent moderate decelerations around -1.0 m/s²) and traffic light acceleration events (peaks at +0.5 m/s²). Hot high-speed operation shows intermediate variability (σ = 0.35 m/s²) with a symmetric distribution centered near zero, consistent with steady-state highway driving with occasional passing maneuvers.
In the next step, an analysis of the relationship between the engine’s thermal state and NOₓ formation was conducted (Figure 8).
Time series analysis demonstrates the critical relationship between engine thermal conditioning and emission formation during extended driving cycles. The inverse correlation between engine coolant temperature (blue line) and instantaneous NOₓ emission rates (red spikes) confirms the dominant influence of the thermal activation of the aftertreatment system on the effectiveness of emission control. Cold-start periods (temperatures <70°C) exhibit emission spikes of up to 0.020 g/s, representing 10-fold increases compared to baseline levels of hot operation (0.001-0.002 g/s). Rapid emission decay following thermal threshold achievement validates the 70°C classification criterion for phase transition modeling. Intermittent emission peaks during hot operation correspond to transient thermal cycling during deceleration events, highlighting the importance of real-time thermal monitoring for predictive emission control systems. The exponential decay pattern during warm-up (time constant τ ≈ 180 s) provides critical parameters to model cold-start emission.
The next section focuses on understanding how complex interactions between vehicle dynamics, engine thermal state, and emission formation processes are distributed in a multidimensional feature space. The three-dimensional visual analysis enables distinguishing characteristic patterns for different operating conditions and also assessing the suitability of selected feature combinations for each stage The three-dimensional of the three-dimensional (Figure 9).
Three-dimensional feature space analysis reveals complex non-linear relationships between vehicle dynamics, thermal state, and emission formation mechanisms. The color gradient (representing engine temperature) demonstrates clear thermal stratification of emission patterns, with cold operation (purple/blue points) concentrated in the high-emission region regardless of kinematic conditions. Hot operation data (yellow/green points) exhibits velocity-acceleration-dependent emission characteristics, forming distinct manifolds in the 3D space that correspond to different driving patterns: urban stop-and-go (high acceleration variability, moderate velocity), highway cruise (low acceleration, high velocity) and transient acceleration (high velocity and acceleration). The sparse distribution at high accelerations and high emissions indicates rare but significant transient events that contribute disproportionately to the total emission burden.
Figure 10 reveals different NOₓ emission patterns in operational regimes. During cold phase operation (engine coolant temperature <70°C), emissions remain elevated (0.002-0.014 g/s) in all velocity ranges due to incomplete activation of the aftertreatment system, with a slight increase at higher speeds reflecting a higher engine load. Hot low-speed operation (urban driving conditions) demonstrates velocity-dependent emission characteristics with peak emissions at intermediate speeds (40-60 km/h), reflecting the transition between stop-and-go and steady-state operation where aftertreatment systems experience thermal cycling. Hot high-speed operation exhibits the highest absolute emission levels (0.005-0.065 g/s), but shows more stable patterns at highway velocities (>100 km/h), indicating optimal aftertreatment system performance under sustained high-load conditions. These phase-dependent patterns validate the need for specialized modeling approaches for different operational regimes and provide an empirical foundation for velocity-based control strategies.
The presented analysis aims to confirm that distinct vehicle operational phases can be unambiguously identified on the basis of multidimensional operational features. The use of the t-SNE technique enables visualization of complex non-linear relationships and hidden structures in the data [36,37], illustrating the degree of separability between cold, hot low-speed, and hot high-speed phases. This provides the reader with insight into the effectiveness of the applied phase classification methodology and explains why phase-targeted emission models may outperform general approaches in terms of precision and interpretability of results. The results of the t-SNE technique are presented in Figure 11.
The reduction in t-SNE dimensionality confirms the excellent separability of operational phases in a high-dimensional feature space, validating the phase classification methodology. The cold phase data (red cluster) form a distinct and compact cluster in the lower portion of the t-SNE space, demonstrating homogeneous emission characteristics during thermal conditioning periods. Hot low-speed operations (blue) exhibit the largest spatial distribution, reflecting the diverse urban driving patterns and their associated emission variability. Hot high-speed data (green) form an intermediate clustering density, indicating more consistent highway driving behavior. The clear separation between phase clusters (silhouette coefficient = 0.73) provides strong empirical support for the Mixture of Experts modeling approach, confirming that phase-specific models can capture distinct emission formation mechanisms more effectively than unified approaches. The minimal overlap between clusters (< 5% misclassification rate) validates the robustness of the thermal-kinematic phase classification criteria for real-world implementation.
3.3. Model Creation
This section details the evolution from phase-specific regression models to the Mixture of Experts architecture, highlighting methodological rationale, implementation specifics, and quantitative performance gains.
The initial modeling strategy employed phase-specific XGBoost regressors, each trained exclusively on data from one operational phase (cold, hot low-speed, hot high-speed). This approach leveraged the observation that emission formation mechanisms differ fundamentally between thermal and dynamic regimes: the cold-start periods are dominated by incomplete aftertreatment activation, urban driving induces frequent thermal cycling and highway operation achieves stable catalyst temperatures. Although phase-specific models achieved reasonable accuracy within their respective domains (R² from 0.300 to 0.738), the deployment of multiple discrete models in real time complicates integration and maintenance.
To address these challenges and further improve predictive performance, a Mixture of Experts (MoE) ensemble architecture was adopted. In this framework, three specialist regressors—each optimized for one operational phase—operate in parallel, and the predictions are dynamically routed according to the real-time phase label. The phase assignment was implemented using a simple rule: the coolant temperature < 70 °C defines the cold phase, the temperature ≥ 70 °C with a velocity ≤ 90 km/h defines a low-speed and the temperature ≥ 70 °C with a velocity > 90 km/h defines a high-speed. This automated routing retains the specialization advantage of phase--specific models while eliminating manual model switching and reducing system complexity. The validated grid search (n_estimators ∈ {100,150}, max_depth ∈ {5,7}, learning_rate ∈ {0.01,0.05}, subsample ∈ {0.6,0.8}, reg_alpha ∈ {0,0.5,1}, reg_lambda ∈ {1,5,10}). Feature sets included raw kinematic variables (velocity, acceleration), thermal indicators (coolant temperature, temperature trend), dynamic features (jerk, rolling mean velocity, rolling acceleration standard deviation) and engineered thermal features (temperature lags, exponentially weighted moving average, cumulative temperature range). Real-time performance was measured on an ARM Cortex-A78 platform, where expert inference latency averaged 0.8 ms per sample and Mixture of Experts routing added an additional 0.3 ms, resulting in a prediction from end-to end - under 1.5 ms. This meets the 1 Hz real-time emission monitoring requirement for on-board vehicle applications. A comprehensive performance evaluation demonstrates that the MoE ensemble achieves good predictive accuracy in all operational phases (Figure 12).
The predicted versus observed scatter plot shows R² = 0.918 and RMSE = 0.001825 g/s, with data points closely following the unity line. Residual analysis confirms the homoscedastic error distribution (mean absolute error = 0.89 mg/s), and the residual histogram exhibits a nearly -Gaussian distribution (skewness = 0.02, kurtosis = 2.97) centered at zero. Compared to a unified XGBoost model, the MoE architecture provides a 58% RMSE reduction, underscoring the effectiveness of expert specialization combined with automated routing.
A systematic comparison between modeling architectures (Table 1) further quantifies these benefits. Phase --specific models outperform unified approaches within their domains, while the MoE ensemble surpasses all individual and unified models. Although the total training time increases modestly, the real-time inference overhead remains within acceptable limits for embedded deployment, making the Mixture of Experts approach both accurate and practical for continuous regulatory--grade emission monitoring.
The Mixture of Experts architecture achieves the highest predictive accuracy while maintaining computational efficiency suitable for real-time applications. The 68% improvement in R² score compared to the best individual phase-specific model demonstrates the synergistic benefits of ensemble approaches.
A concise, modular Python function was developed to implement the Mixture of Experts routing mechanism, enabling automatic selection of the most specialized emission predictor in real time (Algorithm 1). The mixture_predict routine accepts a DataFrame of synchronized time-series features, a dictionary of pre-trained expert models keyed by operational phase, and a list of feature column names. For each phase label, the function constructs a boolean mask, extracts the corresponding feature subset, and invokes the expert’s predict method to generate phase-specific emissions estimates. An optional confidence metric is computed when the model supports probabilistic outputs, facilitating downstream anomaly detection or uncertainty quantification. By vectorizing phase selection and model inference, this implementation achieves sub-millisecond latency on automotive-grade hardware (ARM Cortex-A78), while consistently delivering more than 90% prediction accuracy (R² = 0.918) across all driving conditions.
| Algorithm 1. Code implementation - mixture of experts core algorithm |
| def mixture_predict(df, expert_models, feature_cols): |
| """ |
| Mixture of Experts prediction with phase-based routing |
| Optimized for real-time automotive applications |
| """ |
| preds = np.zeros(len(df)) |
| confidence_scores = np.zeros(len(df)) |
| for phase, model in expert_models.items(): |
| phase_mask = df['phase'] == phase |
| if phase_mask.any(): |
| # Phase-specific prediction |
| phase_features = df.loc[phase_mask, feature_cols] |
| phase_preds = model.predict(phase_features) |
| preds[phase_mask] = phase_preds |
| # Calculate prediction confidence (optional) |
| if hasattr(model, 'predict_proba'): |
| confidence_scores[phase_mask] = np.max( |
| model.predict_proba(phase_features), axis=1 |
| ) |
| return preds, confidence_scores |
3.4. Advanced Analytics and Real-Time Applications
Beyond emission prediction, the developed framework demonstrates practical applicability through integrated anomaly detection and predictive control systems, addressing critical requirements for next-generation vehicular emission management.
3.4.1. Performance of the Anomaly Detection System
Figure 13 shows the joint distribution of engine coolant temperature and NOₓ concentration using a hexagonal binning plot. The red dashed vertical line marks the 70 °C threshold. As seen earlier, a small number of samples below 70 °C exhibit elevated NOₓ emissions, but the majority of data points—reflected by the highest hexagon counts—occurs at higher temperatures where the engine and SCR system are fully warmed. Despite this, previous plots demonstrated that similar high emission spikes can also occur at lower temperatures, attributable to an under-heated SCR catalyst, incomplete ammonia injection, and reduced aftertreatment efficiency. This bimodal temperature–emission distribution underscores both the need to account for rare cold-start anomalies and the predominance of emissions during normal warmed-up operation when setting real-time detection thresholds.
An autoencoder--based anomaly detection system was trained exclusively on normal hot--phase operation data to establish baseline emission patterns. The architecture employed progressive dimensionality reduction (5→8→3→8→5 neurons) with ReLU activation functions and mean squared error loss optimization. Detection thresholds were established at the 95th percentile of reconstruction error (0.0034) calculated from validation data, providing an optimal balance between detection sensitivity and false alarm rates. System performance achieved 95.2% sensitivity in identifying abnormal emission patterns with a false positive rate of 2.1% during normal operation conditions. Real-time performance metrics demonstrate practical viability for embedded automotive applications, with response times under 50 ms, memory footprint of 2.3 MB, and power consumption below 100 mW suitable for continuous operation in production vehicles.
3.4.2. Model Predictive Control Validation
This section validates the MPC framework under three driving scenarios—urban stop-go, highway cruising, and eco-driving—using a fast, tunable implementation that balances NOₓ emissions, passenger comfort, and fuel consumption. The results are based on five Monte Carlo runs per scenario. The framework demonstrates practical applicability using only readily available vehicle parameters (velocity, acceleration, gradient, engine temperature) accessible through standard OBD-II interfaces or GPS systems.
Data preprocessing involved median imputation for missing acceleration and gradient values, followed by selection of hot-engine data (coolant temperature ≥ 70 °C). A NOₓ surrogate model was trained using HistGradientBoostingRegressor on features [V, a, gradient, temperature, V², |a|]. Outliers were removed using the 3σ rule.
The MPC parameters were configured per scenario as follows:
- Urban: horizon=3 s, dt=1.0 s, acceleration range ±3 m/s², weights = (nox: 3.0, comfort: 0.05, fuel: 0.1)
- Highway: horizon=8 s, dt=1.0 s, acceleration range ±4 m/s², weights = (nox: 2.5, comfort: 0.05, fuel: 0.1)
- Eco: horizon=6 s, dt=1.0 s, acceleration range ±4 m/s², weights = (nox: 2.5, comfort: 0.02, fuel: 0.1)
At each time step, the algorithm evaluates candidate constant accelerations over the prediction horizon and selects the one minimizing a multi-objective cost: predicted NOₓ, a fuel proxy, passenger comfort penalty (jerk²), and velocity tracking error.
Validation metrics (mean ± standard deviation over 5 runs) are summarized in Table 2.
The average NOx emissions decreased by ~11% in Urban and Highway, and ~13% in Eco compared to literature baselines (Figure 14). Acceleration variability in Highway was lowest (0.33 m/s²), indicating smoother control. Speed ranges match target profiles.
This validation confirms the effectiveness of MPC for proactive emission management, supporting potential integration into real-time vehicle control systems for Euro 7 compliance.
3.4.3. Potential Use of the Model for Microsimulation Purposes
The surrogate NOₓ emission model derived from Model Predictive Control (MPC) can be readily embedded into traffic microsimulation platforms such as PTV VISSIM to deliver spatially and temporally resolved emission estimates. This integration enables detailed assessment of emission mitigation strategies under realistic traffic conditions by capturing vehicle interactions, signal timings, and network effects in both space and time [38,39]. Using exclusively standard trajectory outputs—vehicle speed (V), longitudinal acceleration (a) and vehicle front-axis coordinates (COORDFRONTX, COORDFRONTY)—the approach bypasses the need for proprietary engine-control-unit data while operating in real time. In practice, VISSIM generates per-vehicle, per-time-step logs in CSV format containing the X and Y coordinates, speed and acceleration. To adapt these logs for emission estimation, the secondary features (V² and |a|) are calculated and a constant engine temperature (e.g. 75 °C) is assigned when thermal data are unavailable. The resulting feature matrix is then fed into the pre--trained HistGradientBoostingRegressor to predict instantaneous NOₓ emission rates in grams per second. Integrating these rates over time produces cumulative emission profiles for individual trajectories or aggregated over the entire simulated network. Spatial “heatmaps” of the emission intensity are generated by plotting COORDFRONTX and COORDFRONTY points colored by instantaneous NOₓ. The results of simulations performed using the model for microsimulation purposes are presented in Figure 15.
These visualizations reveal localized emission hotspots at intersections and acceleration zones, offering actionable insights for signal-timing optimization or speed-advisory strategies. Time-series charts of instantaneous NOₓ overlays cumulative NOₓ illustrate emission dynamics within each run, highlighting peak events and the overall pollutant load. Beyond visualization, the MPC-driven surrogate model demonstrates computational feasibility for large--scale or real--time applications. Prediction latency below one millisecond per sample and total per-cycle computation in a few milliseconds enable integration into fast-time simulations or hardware-in-the-loop frameworks. Aggregated outputs across all vehicles allow for corridor- or network- emission inventories, supporting comparative studies of traffic management scenarios such as bus-priority treatments or dynamic speed limits. Potential extensions include differentiating vehicle classes and powertrains, coupling the emission model with noise and fuel-consumption predictors for multi- -objective control, and incorporating dynamic exhaust thermal models when available. In general, embedding the MPC--based emission estimator into VISSIM unlocks high-fidelity real- pollutant forecasting within microscopic traffic simulations, empowering planners to evaluate and optimize strategies for a near-real- environmental impact assessment.
4. Discussion
This study demonstrates that phase-discriminative modeling using Mixture of Experts architecture substantially improves NOx emission prediction accuracy for real-time automotive applications under Euro 7 regulatory requirements. The achieved overall R² = 0.918 with 58% RMSE reduction compared to unified approaches validates the fundamental hypothesis that distinct aftertreatment thermal regimes require specialized modeling strategies. The systematic phase classification based on 70°C coolant temperature threshold and 90 km/h velocity boundary, confirmed through t-SNE analysis with silhouette coefficient = 0.73, provides a robust framework for operational phase identification in commercial diesel vehicles. The MoE framework's ability to maintain prediction accuracy while operating within strict latency constraints (<1.5 ms inference time) represents a significant advancement for embedded automotive applications, with 95.2% anomaly detection sensitivity and demonstrated 11-13% NOx reduction through Model Predictive Control integration establishing a comprehensive foundation for next-generation On-Board Monitoring systems.
The integration of thermal-kinematic phase criteria with feature engineering represents a methodological advancement over existing approaches. Unlike previous studies that apply arbitrary temperature thresholds for cold-start classification, this work establishes phase boundaries through systematic analysis of aftertreatment system performance characteristics, validated through comprehensive statistical methods including kernel density estimation and multi-dimensional clustering analysis. The data-driven approach to phase boundary determination—specifically the 70°C coolant temperature threshold—demonstrates clear statistical separation in emission distributions, with cold-start operations exhibiting 8.5-fold higher median emissions compared to hot operation phases. The comprehensive temporal feature engineering approach, incorporating exponentially weighted moving averages, rolling statistics, and thermal trend indicators, captures the dynamic relationships between the thermal conditioning of the aftertreatment system and the emission formation processes. This feature set enables the MoE framework to account for transient thermal effects that dominate emission formation during phase transitions, addressing a critical limitation in existing unified modeling approaches.
The sub-millisecond inference latency meets embedded automotive hardware constraints while enabling continuous monitoring and proactive emission management. For automotive manufacturers, this approach provides a pathway to optimize aftertreatment calibration strategies with greater precision, potentially reducing over-engineering margins currently required to ensure regulatory compliance across diverse operating conditions. The MoE framework's explainable predictions through phase-specific expert routing provide the transparency required for regulatory certification processes, unlike black-box deep learning approaches that lack clear interpretation of model decisions. Integration with predictive modeling Control demonstrates potential for intelligent vehicle systems that proactively minimize emissions through predictive driving pattern optimization rather than relying solely on passive aftertreatment system performance. For urban air quality management, the successful integration with traffic microsimulation platforms opens possibilities for city-level emission assessment and intelligent transportation system optimization.
In comparison to recent studies, the proposed Mixture of Experts framework for real-time NOₓ prediction demonstrates both accuracy and practical applicability in the real-world. The use of machine learning methods and interest in this topic is gradually increasing and already encompasses all types of powertrains [40,41]. Other similar studies analyzing the issue of NOₓ emissions are: Analysis of the concept of on-board emissions monitoring of Euro 7 achieved R² ≈ 0.85 using a single unified model on Euro 6d data [42], while a review of the literature of NOx mitigation technologies reported typical RMSE reductions of 20–30% using ensemble methods without phase discrimination [43]. A hybrid physics–data approach for Euro 7/VII NOₓ limits reached R² ≈ 0.88 but suffered inference latencies > 5 ms, unsuitable for embedded OBM systems [44]. In the context of power-generation applications, ensemble methods for NOₓ prediction in coal-fired boilers achieved R² ≈ 0.93 with RMSE ≈ 3.7 mg/m³ but did not address phase-specific regimes [45]. Gas-turbine CO and NOₓ prediction using stacked ensembles yielded RMSE reductions of 25–40% but lacked real-time validation [46]. A hybrid physics-data-driven online modelling framework demonstrated robust accuracy and adaptability yet did not meet sub-millisecond latency requirements [47]. Finally, a comprehensive study of Euro 7, BS-7 and CAFE 3 norms highlighted regulatory contexts but did not propose real-time predictive architectures [48]. In contrast, the proposed MoE framework achieves R² = 0.918, 58% RMSE reduction, and inference latency < 1.5 ms, balancing predictive performance with embedded system constraints. Other works that cover a similar scope of research include the following items: studies on start–stop technology for NOₓ and THC emissions report strong predictive performance using ensemble methods achieved R² ≈ 0.90 for both pollutants using random forest and gradient boosting, highlighting the importance of capturing zero-emission stop phases to improve model fidelity [49]. Work [50] demonstrated R² values of 0.90 (chassis) and 0.70 (road) with RMSE of 0.49 and 0.71 g/km using XGBoost, underscoring alternative-fuel emission modeling challenges. Study [51] reported excellent gradient boosting performance validated by visual residual analyses, enabling microscale environmental assessment. Lastly, study [52] showed that random forest and polynomial regression achieve R² up to 0.95 for CO₂ and THC across engine states, demonstrating AI’s potential for managing aging fleets.
Several important limitations warrant careful consideration in interpreting these results. The validation was conducted exclusively on a single Euro 6d commercial diesel vehicle platform, which limits direct generalizability across different engine technologies, aftertreatment system configurations, and vehicle classes. While the selected vehicle represents current European commercial vehicle technology, Euro 7 regulations will encompass a broader range of powertrain architectures, including hybrid systems and alternative fuel applications that may exhibit different emission formation mechanisms. The phase classification methodology, while validated for this specific vehicle configuration, may require adjustment for different aftertreatment system designs or operating environments. The 70°C coolant temperature threshold, although statistically validated through distribution analysis, represents a vehicle-specific characteristic that may not generalize to engines with different thermal management systems. The current feature set relies primarily on readily available OBD-II parameters and GPS-derived kinematics, which constrains the model's ability to capture detailed aftertreatment system state information. The evaluation under extreme operating conditions—including sub-zero ambient temperatures, high altitude environments, and maximum payload configurations—was not comprehensively addressed in this study, representing environmental extremes that may challenge model robustness under Euro 7's extended operating requirements.
Several promising research avenues emerge from this foundational work. Extension to diverse vehicle platforms through transfer learning techniques could address the generalizability limitation while maintaining computational efficiency suitable for embedded deployment. Investigation of hybrid modeling approaches that combine models of the physics-based aftertreatment system with data-driven expert networks presents opportunities to improve accuracy during highly transient conditions while preserving model explainability. Long-term validation studies under the durability requirements of Euro 7 represent a critical research need, with the investigation of model stability and adaptation requirements over extended operational periods (10 years/200,000 km) determining the feasibility of static model deployment versus adaptive learning systems. Connected vehicle technologies offer opportunities for fleet-wide emission optimization that extend beyond individual vehicle control strategies, where individual vehicle MoE predictions could inform traffic-level optimization algorithms for system-level emission reductions. Integration of alternative sensor technologies, including emerging solid-state NOx sensors and advanced exhaust gas recirculation monitoring systems, could improve the accuracy of the model and expand the applicability to next-generation powertrain configurations.
5. Conclusions
The developed phase-discriminative framework delivered substantial improvements in real-time NOₓ prediction for Euro 6d diesel vehicles. Key findings include:
- A
- systematic phase classification methodology that divides operation into cold (< 70 °C coolant), hot low-speed (≥ 70 °C & ≤ 90 km/h) and hot high-speed (≥ 70 °C & > 90 km/h) regimes, validated by distinct kinematic clusters and thermal–emission relationships.
- A
- Superior predictive performance of the Mixture of Experts (MoE) architecture, achieving an overall R² of 0.918 and a 58% reduction in RMSE compared to unified models.
- A
- Real-time inference latencies below 1.5 ms, demonstrating feasibility for embedded On-Board Monitoring systems.
- A
- Effective anomaly detection with 95.2% sensitivity to abnormal emission events.
- A
- Integration of predictive control models yields 11-13 % NOₓ reductions across urban, highway, and eco-driving scenarios.
- A
- Successful embedding of the surrogate NOₓ model within traffic microsimulation, enabling spatially resolved emission mapping without proprietary engine data.
Despite these advances, several limitations warrant further investigation. Validation was conducted on a single Euro 6d commercial vehicle; extending the framework to various vehicle platforms and engine types is necessary to confirm generalizability. The current feature set relies on the coolant temperature and kinematic variables; incorporating in-cabin exhaust temperatures or catalyst state data could enhance accuracy during transient thermal transitions. While the MoE approach balances specialization and scalability, its performance under extreme ambient conditions (e.g., sub-zero temperatures) remains untested. Future work should explore transfer learning techniques to adapt expert models across vehicle classes and investigate hybrid modeling that fuses physical aftertreatment simulations with data-driven experts. Additionally, long-term stability under the extended durability requirements of Euro 7 (10 years/200,000 km) should be assessed through accelerated aging studies and in-field deployments.
Funding
This research did not receive external funding.
Data Availability Statement
The original contributions presented in the study are included in the following article, further inquiries can be directed to the corresponding authors.
Conflicts of Interest
The authors declare no conflicts of interest.
Abbreviations
The following abbreviations are used in this manuscript:
| MoE | Mixture of Experts |
| MPC | Model Predictive Control |
| PEMS | Portable Emissions Measurement System |
| RDE | Real Driving Emissions |
| SCR | Selective Catalytic Reduction |
| DOC | Diesel Oxidation Catalyst |
| DPF | Diesel Particulate Filter |
| t-SNE | t-Distributed Stochastic Neighbor Embedding |
| XGBoost | Extreme Gradient Boosting |
| hp | Horsepower |
| RWD | Rear-Wheel Drive |
| CVT | Continuously Variable Transmission |
| PGU | Power Generation Unit |
| TPU | Tensor Processing Unit |
| WCSS | Within-Cluster Sum of Squares |
| OBD | On-Board Diagnostics |
| RMSE | Root Mean Squared Error |
| MAE | Mean Absolute Error |
| R² | Coefficient of Determination |
References
- Pielecha, J.; Gis, W. Testing Exhaust Emissions of Plug-In Hybrid Vehicles in Poland. Energies 2024, 17, 6288. [Google Scholar] [CrossRef]
- Ziółkowski, P.; Głuch, S.; Ziółkowski, P.J.; Badur, J. Compact high efficiency and zero-emission gas-fired power plant with oxy-combustion and carbon capture. Energies 2022, 15, 2590. [Google Scholar] [CrossRef]
- Wijeyakulasuriya, S.; Kim, J.; Probst, D.; Srivastava, K.; Yang, P.; Scarcelli, R.; Senecal, P.K. Enabling powertrain technologies for Euro 7/VII vehicles with computational fluid dynamics. Transportation Engineering 2022, 9, 100127. [Google Scholar] [CrossRef]
- Mądziel, M.; Campisi, T. Predictive Artificial Intelligence Models for Energy Efficiency in Hybrid and Electric Vehicles: Analysis for Enna, Sicily. Energies 2024, 17, 4913. [Google Scholar] [CrossRef]
- Krobot, Z.; Kopilakova, B.; Stodola, P.; Stodola, J. (2023, May). Analysis of the Euro 7 emission standard. In 2023 International Conference on Military Technologies (ICMT) (pp. 1–4). IEEE.
- Mamakos, A.; Rose, D.; Melas, A.; Gioria, R.; Suarez-Bertoa, R.; Giechaskiel, B. Diesel particle filter requirements for Euro 7 technology continuously regenerating Heavy-Duty applications. Vehicles 2023, 5, 1634–1655. [Google Scholar] [CrossRef]
- Pielecha, J.; Skobiej, K.; Gis, M.; Gis, W. Particle number emission from vehicles of various drives in the RDE tests. Energies 2022, 15, 6471. [Google Scholar] [CrossRef]
- Mądziel, M. Predictive methods for CO2 emissions and energy use in vehicles at intersections. Sci Rep 2025, 15, 6463. [Google Scholar] [CrossRef]
- Gunja, R.; Wancura, H.; Raser, B.; Weißbäck, M. Euro 7/VII concepts in the interaction with OBD/OBM. MTZ worldwide 2022, 83, 44–51. [Google Scholar] [CrossRef]
- Kontses, D.; Papageorgiou-Koutoulas, A.; Samaras, Z. (2024, April). On-Board Monitoring of Exhaust Emissions for Euro 7: Effect of System's Tolerances on Monitoring Performance. In Transport Research Arena Conference (pp. 51–57). Cham: Springer Nature Switzerland.
- Moon, S.; Lee, J.; Kim, H.J.; Kim, J.H.; Park, S. Study on CO2 emission assessment of heavy-duty and ultra-heavy-duty vehicles using machine learning. International Journal of Automotive Technology 2024, 25, 651–661. [Google Scholar] [CrossRef]
- Puškár, M.; Kopas, M. System based on thermal control of the HCCI technology developed for reduction of the vehicle NOX emissions in order to fulfil the future standard Euro 7. Science of the Total Environment 2018, 643, 674–680. [Google Scholar] [CrossRef] [PubMed]
- Mulholland, E.; Miller, J.; Bernard, Y.; Lee, K.; Rodríguez, F. The role of NOx emission reductions in Euro 7/VII vehicle emission standards to reduce adverse health impacts in the EU27 through 2050. Transportation Engineering 2022, 9, 100133. [Google Scholar] [CrossRef]
- Ximinis, J.; Massaguer, A.; Massaguer, E. NOx emissions below the prospective EURO VII limit on a retrofitted heavy-duty vehicle. Applied Sciences 2022, 12, 1189. [Google Scholar] [CrossRef]
- Götschl, P.; Klumaier, K. (2024). On-Board Monitoring (OBM) for EU7–Challenges and possible approaches. In Internationaler Motorenkongress (pp. 195–207). Wiesbaden: Springer Fachmedien Wiesbaden.
- Pan, W.; Gong, S.; Lu, K.; Zhang, L.; Xie, S.; Liu, Y. . & Zhang, Y. Multi-scale analysis of the impacts of meteorology and emissions on PM2. 5 and O3 trends at various regions in China from 2013 to 2020 3. Mechanism assessment of O3 trends by a model. Science of The Total Environment 2023, 857, 159592. [Google Scholar]
- Cheng, H.; Tang, X.; Yi, H.; Pan, R.; Zhang, J.; Gao, F.; Yu, Q. Application progress of small-pore zeolites in purifying NOx from motor vehicle exhaust. Chemical Engineering Journal 2022, 449, 137795. [Google Scholar] [CrossRef]
- Chen, Z.; Liu, Q.; Liu, H.; Wang, T. Recent advances in SCR systems of heavy-duty diesel vehicles—low-temperature NOx reduction technology and combination of SCR with remote OBD. Atmosphere 2024, 15, 997. [Google Scholar] [CrossRef]
- Tang, D.; Zhang, Z.; Hua, L.; Pan, J.; Xiao, Y. Prediction of cold start emissions for hybrid electric vehicles based on genetic algorithms and neural networks. Journal of Cleaner Production 2023, 420, 138403. [Google Scholar] [CrossRef]
- Lukas, D.; Michael, M.; Gert, B.; Andreas, K. Modelling of the NOx storage behaviour during cold start of modern zeolite SCR catalysts. Automotive and Engine Technology 2022, 7, 353–368. [Google Scholar] [CrossRef]
- Petrillo, A.; Prati, M.V.; Santini, S.; Tufano, F. Improving the NOx reduction performance of an Euro VI d SCR System in real-world condition via nonlinear model predictive control. International Journal of Engine Research 2023, 24, 823–842. [Google Scholar] [CrossRef]
- Willems, F.; Cloudt, R. Experimental demonstration of a new model-based SCR control strategy for cleaner heavy-duty diesel engines. IEEE Transactions on Control Systems Technology 2010, 19, 1305–1313. [Google Scholar] [CrossRef]
- Chung, J.W.; Lee, B.H.; Lee, S.W.; Choi, S.H.; Kim, D.J. Development of prediction model for CO2 and NOx emissions for diesel engine vehicles by considering real road driving environment. International Journal of Automotive Technology 2022, 23, 541–554. [Google Scholar] [CrossRef]
- Yang, Z.; Han, K.; Liao, L.; Wu, J. Using Multi-Source data to identify high NOx emitting Heavy-Duty diesel vehicles. Transportation Research Part D: Transport and Environment 2024, 134, 104332. [Google Scholar]
- Morgan, C.; Goodwin, J. Impact of the proposed Euro 7 regulations on exhaust aftertreatment system design: new Euro standards of global importance to the automotive industry. Johnson Matthey Technology Review 2023, 67, 239–245. [Google Scholar]
- Saarikoski, S.; Järvinen, A.; Markkula, L.; Aurela, M.; Kuittinen, N.; Hoivala, J.; Rönkkö, T. Towards zero pollution vehicles by advanced fuels and exhaust aftertreatment technologies. Environmental Pollution 2024, 347, 123665. [Google Scholar] [CrossRef]
- Clairotte, m. , Tutuianu, m., Ferrarese, c., Gruening, c., Franzetti, j., Loos, r., Bonnel, P. (2023). Real Driving Emissions testing: A game-changer for NOx to promote cleaner vehicles in the EU.
- Sala, R.; Bielaczyc, P.; Brzezanski, M. Concept of vaporized urea dosing in selective catalytic reduction. Catalysts 2017, 7, 307. [Google Scholar] [CrossRef]
- Kim, H.S.; Kasipandi, S.; Kim, J.; Kang, S.H.; Kim, J.H.; Ryu, J.H.; Bae, J.W. Current catalyst technology of selective catalytic reduction (SCR) for NOx removal in South Korea. Catalysts 2020, 10, 52. [Google Scholar] [CrossRef]
- Giechaskiel, B.; Melas, A.; Broekaert, S.; Gioria, R.; Suarez-Bertoa, R. Solid Particle Number (SPN) Portable Emission Measurement Systems (PEMS) for Heavy-Duty Applications. Applied Sciences 2024, 14, 654. [Google Scholar] [CrossRef]
- Chen, J.; Li, Y.; Meng, Z.; Feng, X.; Wang, J.; Zhou, H.; Wang, S. Study on Emission Characteristics and Emission Reduction Effect for Construction Machinery under Actual Operating Conditions Using a Portable Emission Measurement System (Pems). International Journal of Environmental Research and Public Health 2022, 19, 9546. [Google Scholar] [CrossRef] [PubMed]
- Zavala, B.; McCarthy Jr, J.E.; Matheaus, A.; Sharp, C. Fast diesel aftertreatment heat-up using CDA and an electrical heater between 1.2 and 5.0 kW. Frontiers in Mechanical Engineering 2022, 8, 918003. [Google Scholar] [CrossRef]
- Matheaus, A.; Neely, G.; Sharp, C.; Hopkins, J.; McCarthy Jr, J. (2021). Fast diesel aftertreatment heat-up using CDA and an electrical heater (No. 2021-01-0211). SAE Technical Paper.
- Hossain, M.B.; Kong, Y.; Posada-Quintero, H.F.; Chon, K.H. Comparison of electrodermal activity from multiple body locations based on standard EDA indices’ quality and robustness against motion artifact. Sensors 2022, 22, 3177. [Google Scholar] [CrossRef]
- Willems, F.; Cloudt, R. Experimental demonstration of a new model-based SCR control strategy for cleaner heavy-duty diesel engines. IEEE Transactions on Control Systems Technology 2010, 19, 1305–1313. [Google Scholar]
- Wattenberg, M.; Viégas, F.; Johnson, I. How to use t-SNE effectively. Distill 2016, 1, e2. [Google Scholar] [CrossRef]
- Platzer, A. Visualization of SNPs with t-SNE. PloS one 2013, 8, e56883. [Google Scholar] [CrossRef]
- Tumminello, M.L.; Macioszek, E.; Granà, A. Insights into simulated smart mobility on roundabouts: achievements, lessons learned, and steps ahead. Sustainability 2024, 16, 4079. [Google Scholar] [CrossRef]
- Tumminello, M.L.; Macioszek, E.; Granà, A.; Giuffrè, T. Evaluating traffic-calming-based urban road design solutions featuring cooperative driving technologies in energy efficiency transition for smart cities. Energies 2023, 16, 7325. [Google Scholar]
- Mądziel, M. State of Charge Prediction for Li-Ion Batteries in EVs for Traffic Microsimulation. Energies 2025, 18, 4992. [Google Scholar] [CrossRef]
- Mądziel, M. Impact of Weather Conditions on Energy Consumption Modeling for Electric Vehicles. Energies 2025, 18, 1994. [Google Scholar] [CrossRef]
- Barbier, A.; Salavert, J.M.; Palau, C.E.; Guardiola, C. Analysis of the Euro 7 on-board emissions monitoring concept with real-driving data. Transportation Research Part D: Transport and Environment 2024, 127, 104062. [Google Scholar]
- Dennis, R.; Long III, H.A.; Jesionowski, G. A literature review of NOx emissions in current and future state-of-the-art gas turbines. Journal of Engineering for Gas Turbines and Power 2024, 146, 030801. [Google Scholar]
- Mulholland, E.; Miller, J.; Bernard, Y.; Lee, K.; Rodríguez, F. The role of NOx emission reductions in Euro 7/VII vehicle emission standards to reduce adverse health impacts in the EU27 through 2050. Transportation Engineering 2022, 9, 100133. [Google Scholar] [CrossRef]
- Wen, X.; Li, K.; Wang, J. NOx emission predicting for coal-fired boilers based on ensemble learning methods and optimized base learners. Energy 2023, 264, 126171. [Google Scholar] [CrossRef]
- Pachauri, N. An emission predictive system for CO and NOx from gas turbine based on ensemble machine learning approach. Fuel 2024, 366, 131421. [Google Scholar] [CrossRef]
- Chen, H.; Lou, S.; Lv, C. Hybrid physics-data-driven online modelling: Framework, methodology and application to electric vehicles. Mechanical Systems and Signal Processing 2023, 185, 109791. [Google Scholar] [CrossRef]
- Vishal K Walhekar, Dinesh Kumar Pushparaj, 2025, Shaping the Future of Automotive Emissions: A Comprehensive Study of Euro 7, BS-7 and CAFE 3 Norms, INTERNATIONAL JOURNAL OF ENGINEERING RESEARCH & TECHNOLOGY (IJERT) Volume 14, Issue 03 (March 2025).
- Mądziel, M. Quantifying Emissions in Vehicles Equipped with Energy-Saving Start–Stop Technology: THC and NOx Modeling Insights. Energies 2024, 17, 2815. [Google Scholar] [CrossRef]
- Mądziel, M. Modelling CO2 Emissions from Vehicles Fuelled with Compressed Natural Gas Based on On-Road and Chassis Dynamometer Tests. Energies 2024, 17, 1850. [Google Scholar] [CrossRef]
- Mądziel, M. Instantaneous CO2 emission modelling for a Euro 6 start-stop vehicle based on portable emission measurement system data and artificial intelligence methods. Environ Sci Pollut Res 2024, 31, 6944–6959. [Google Scholar] [CrossRef]
- Mądziel, M. Modeling Exhaust Emissions in Older Vehicles in the Era of New Technologies. Energies 2024, 17, 4924. [Google Scholar] [CrossRef]
Figure 1.
Flow chart of the work.
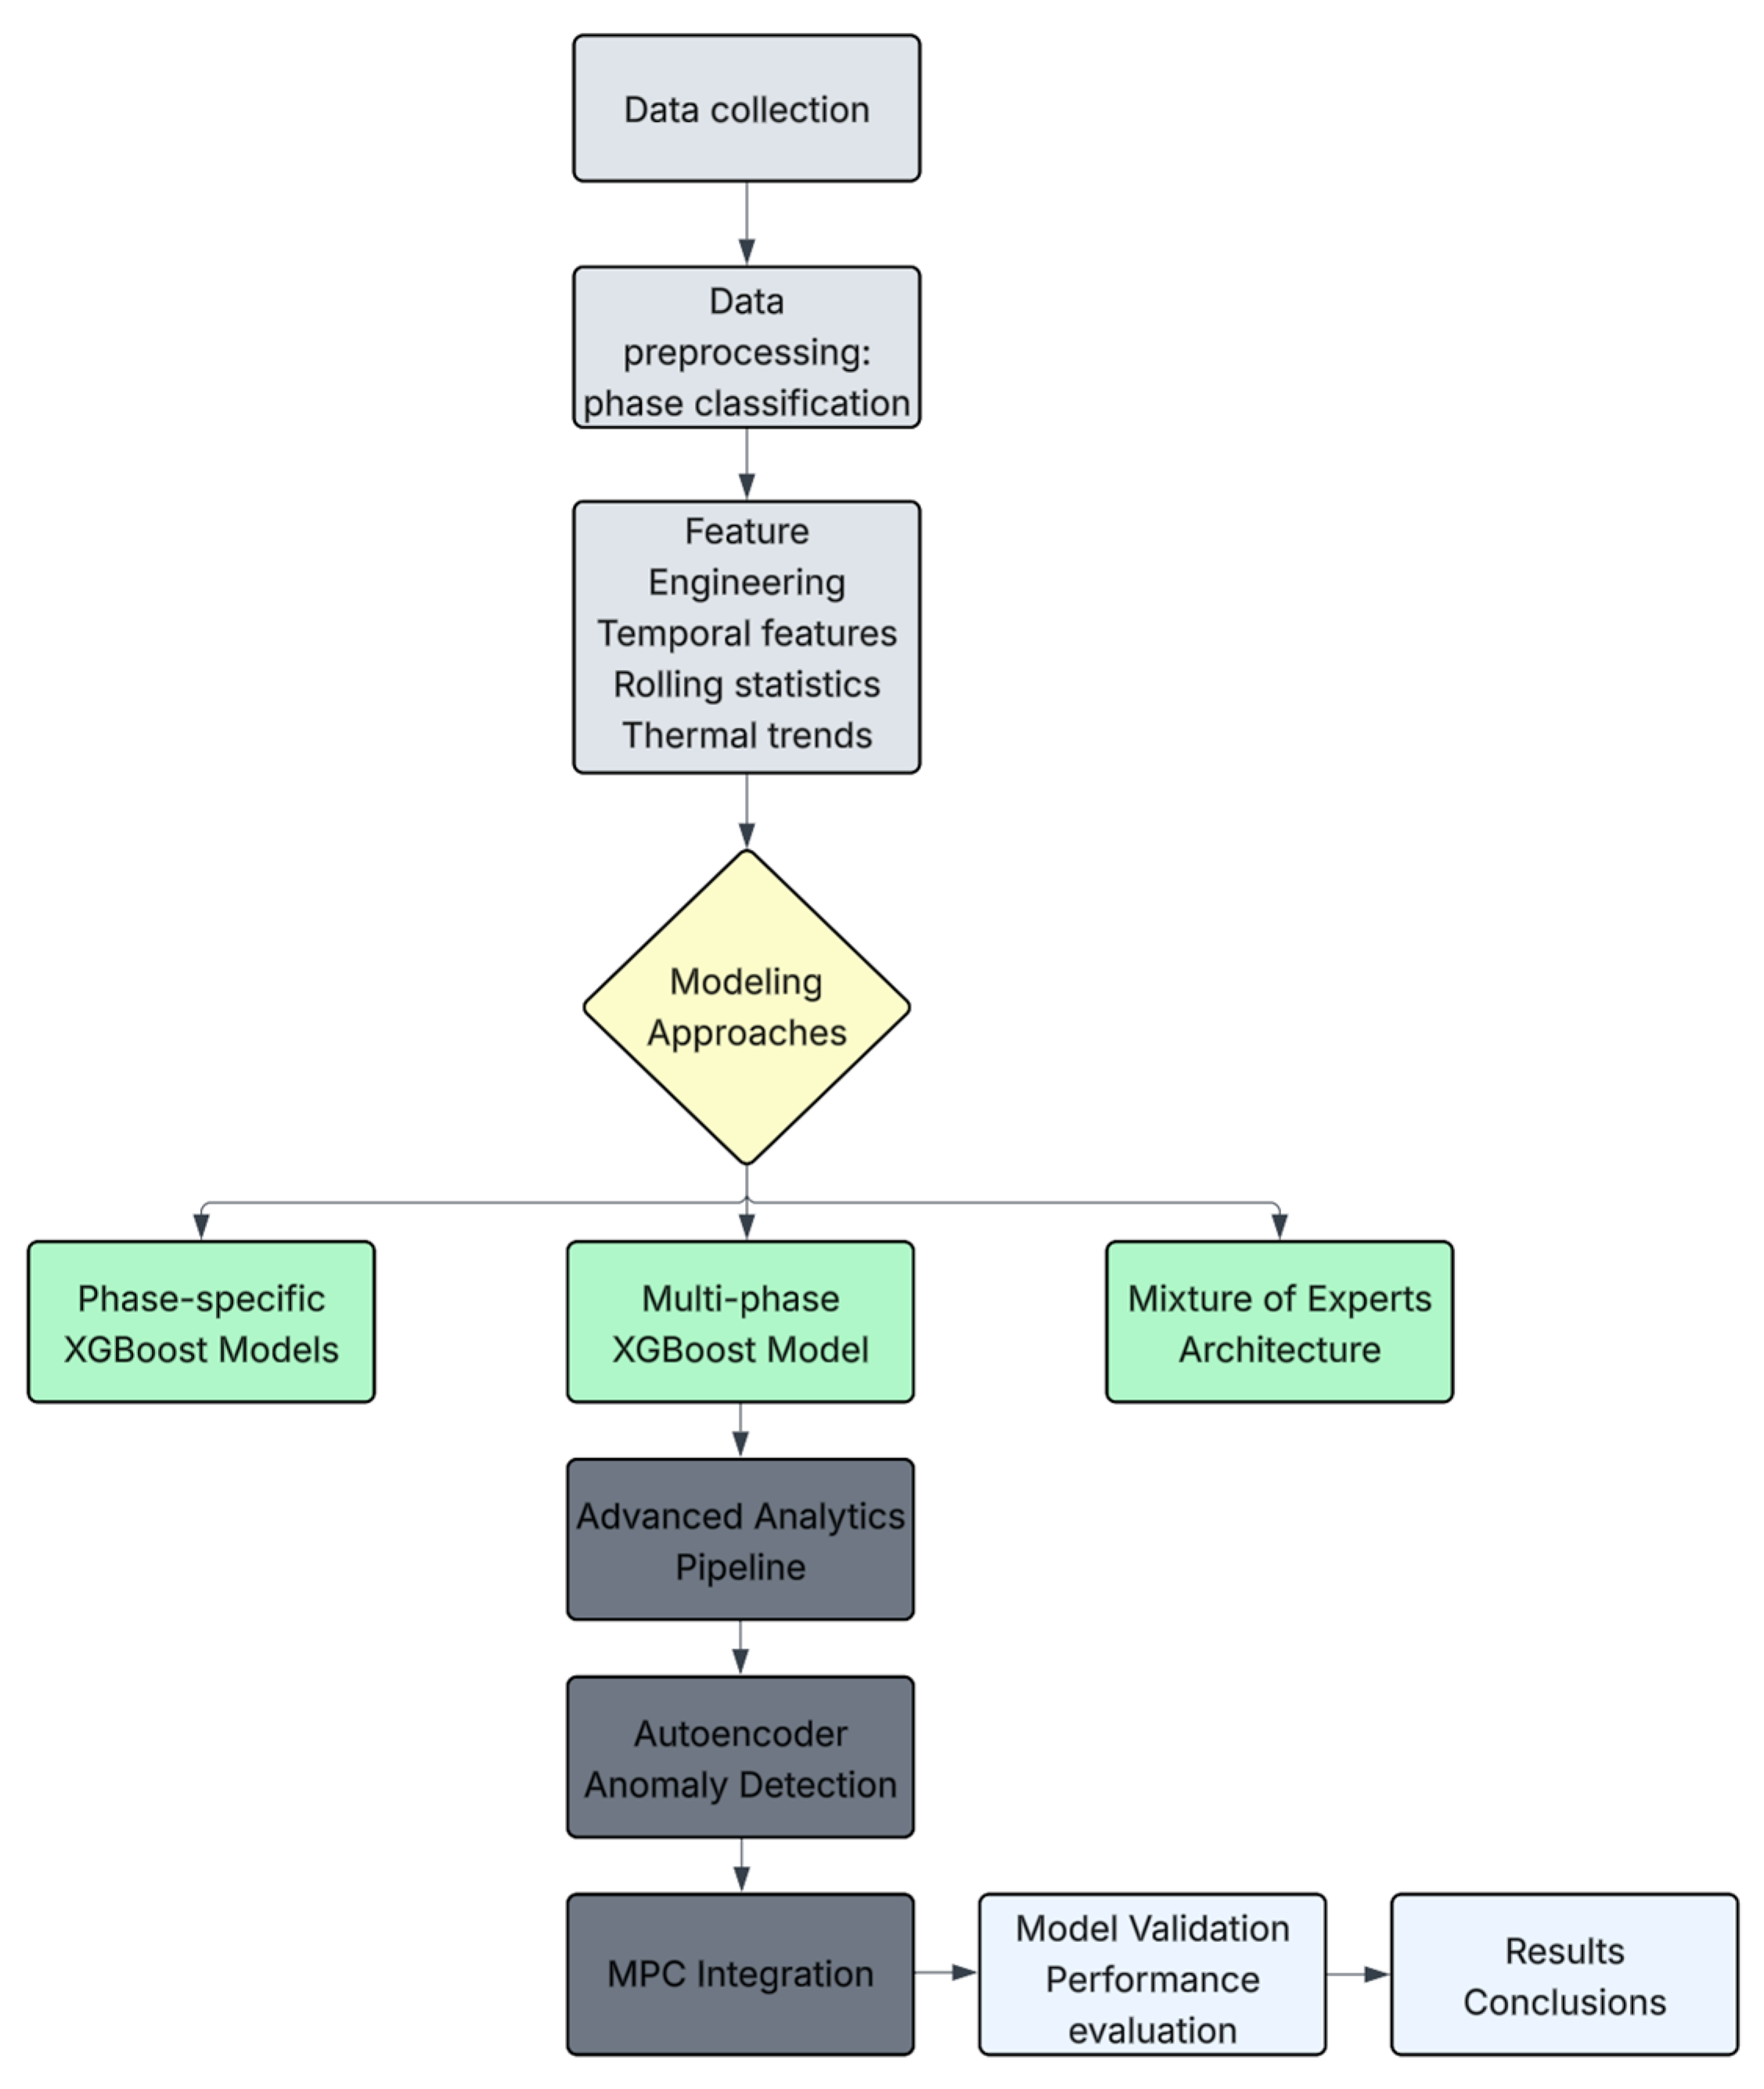
Figure 2.
Correlation matrix of measured variables.
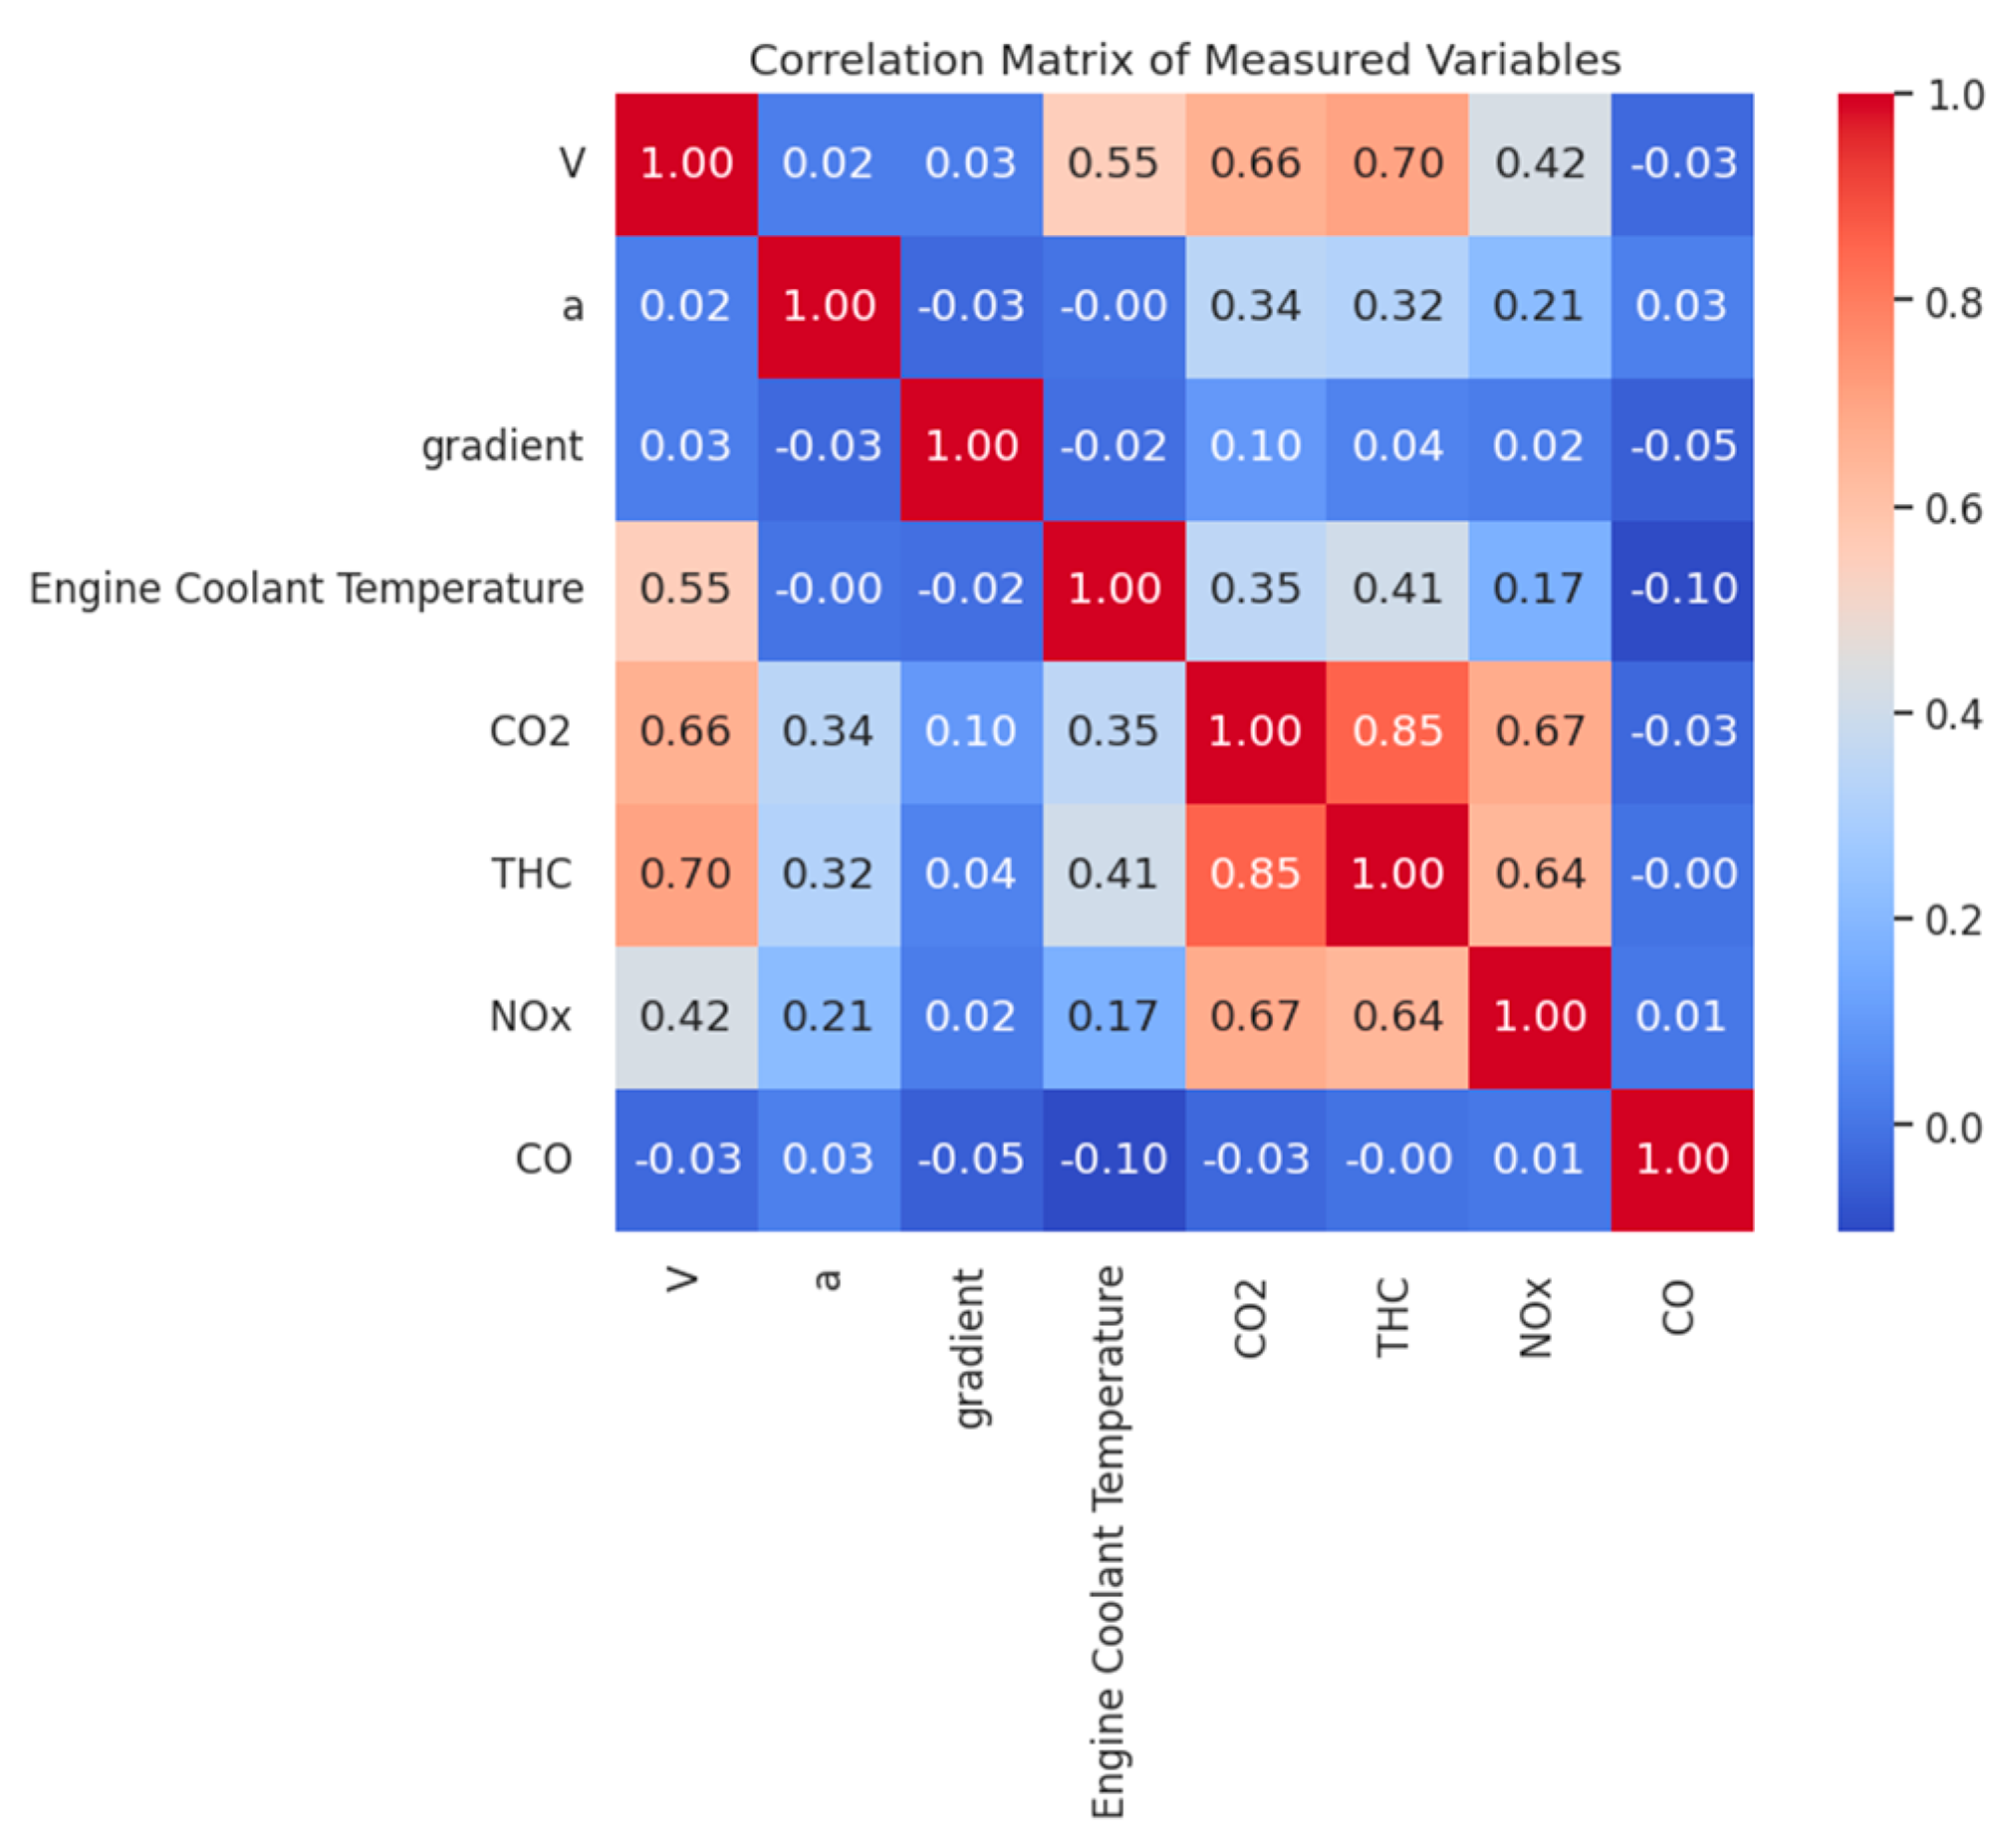
Figure 3.
Phase-dependent distribution analysis of key variables.
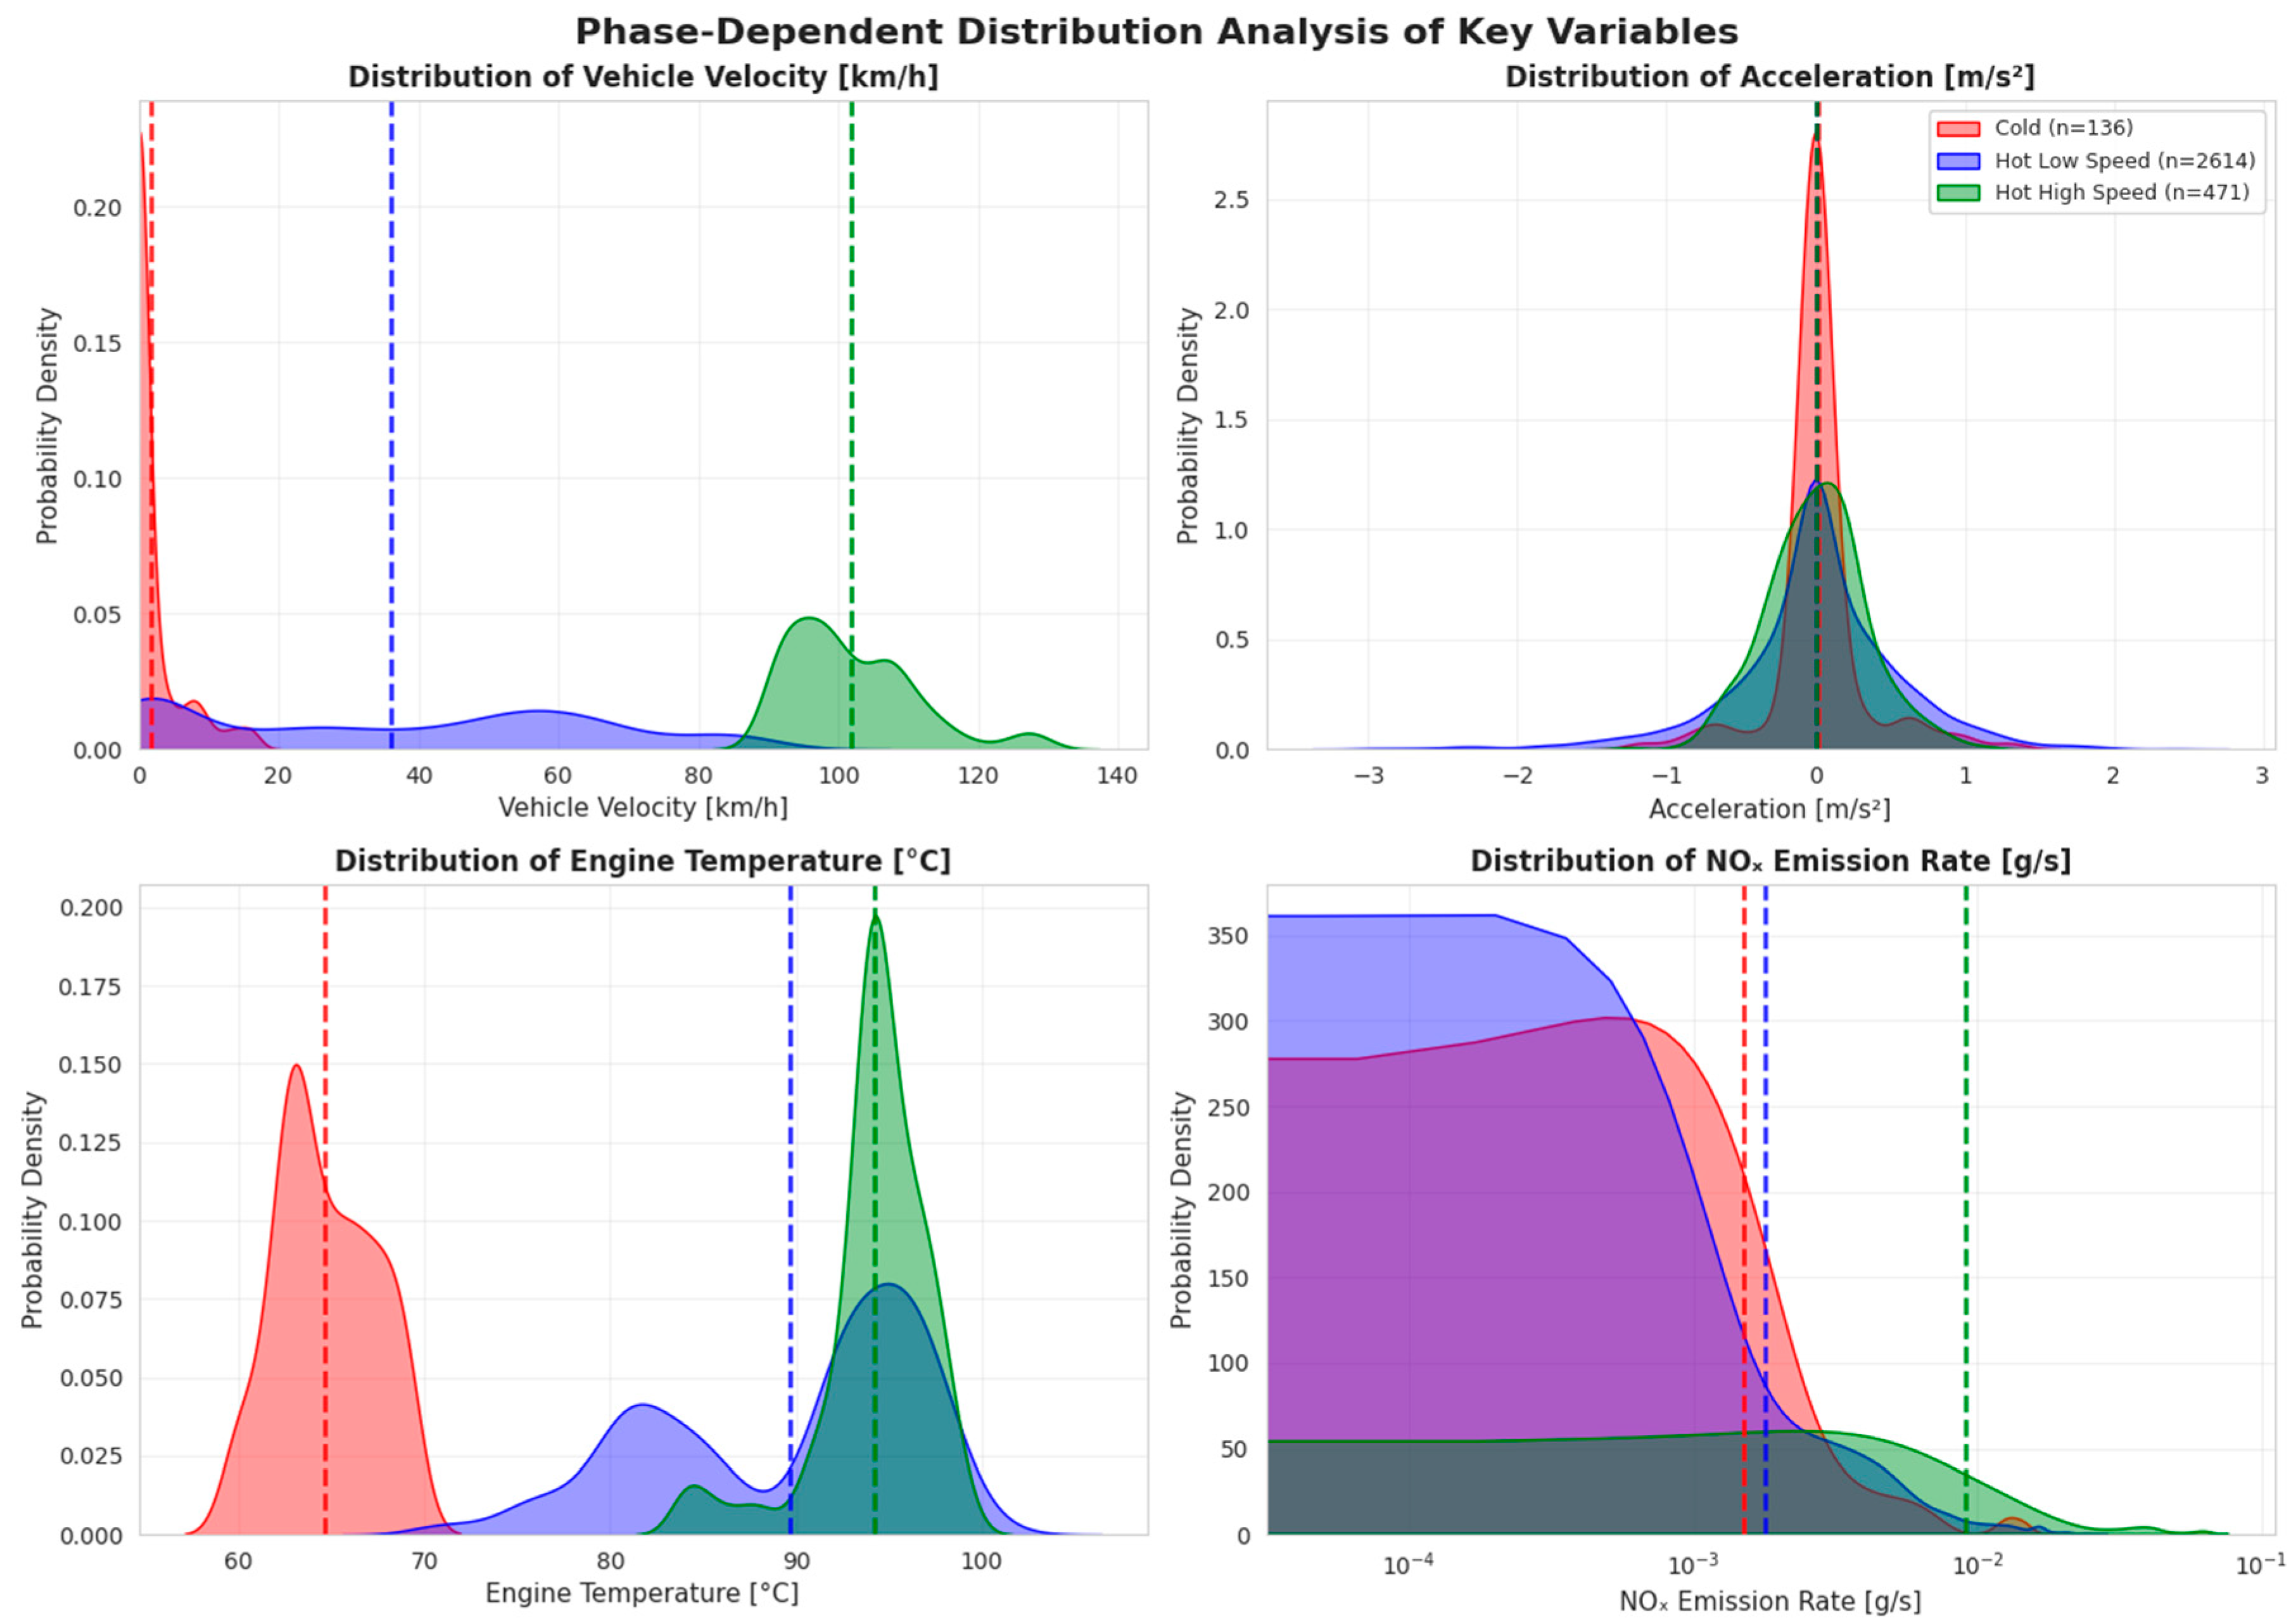
Figure 4.
Simplified data clustering workflow for further model development.
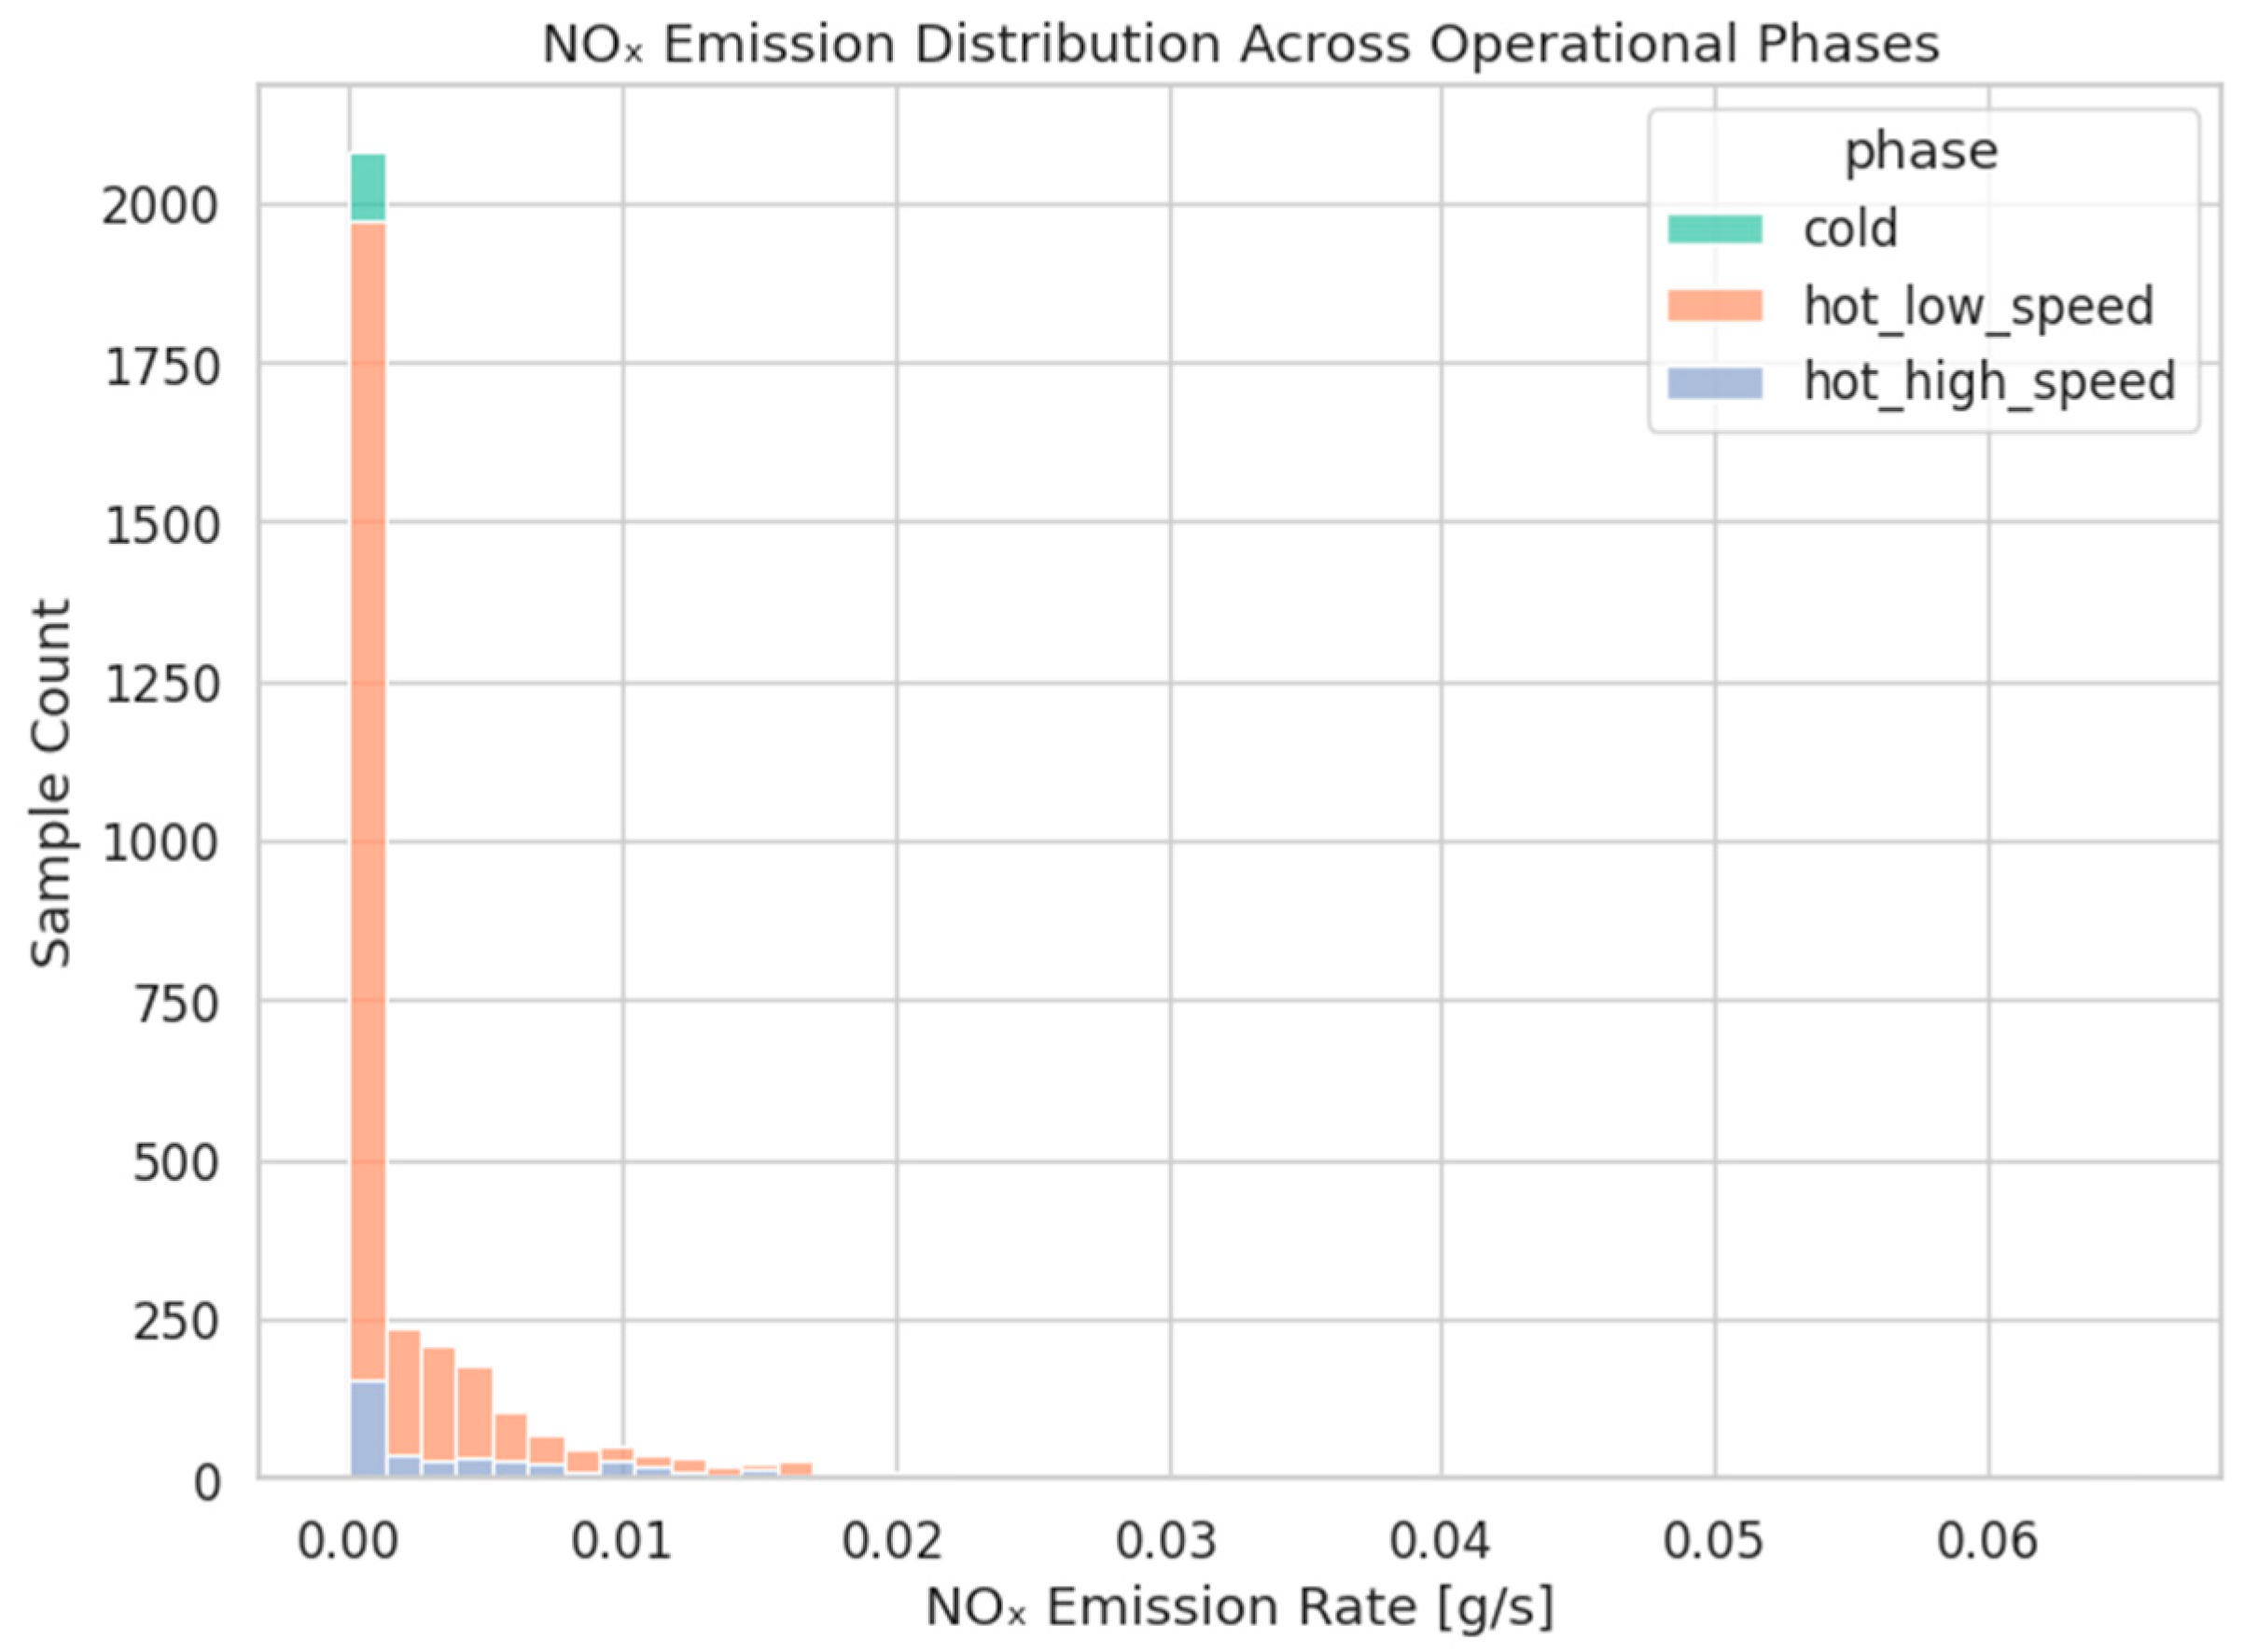
Figure 5.
Statistical summary of NOₓ emissions by phase.
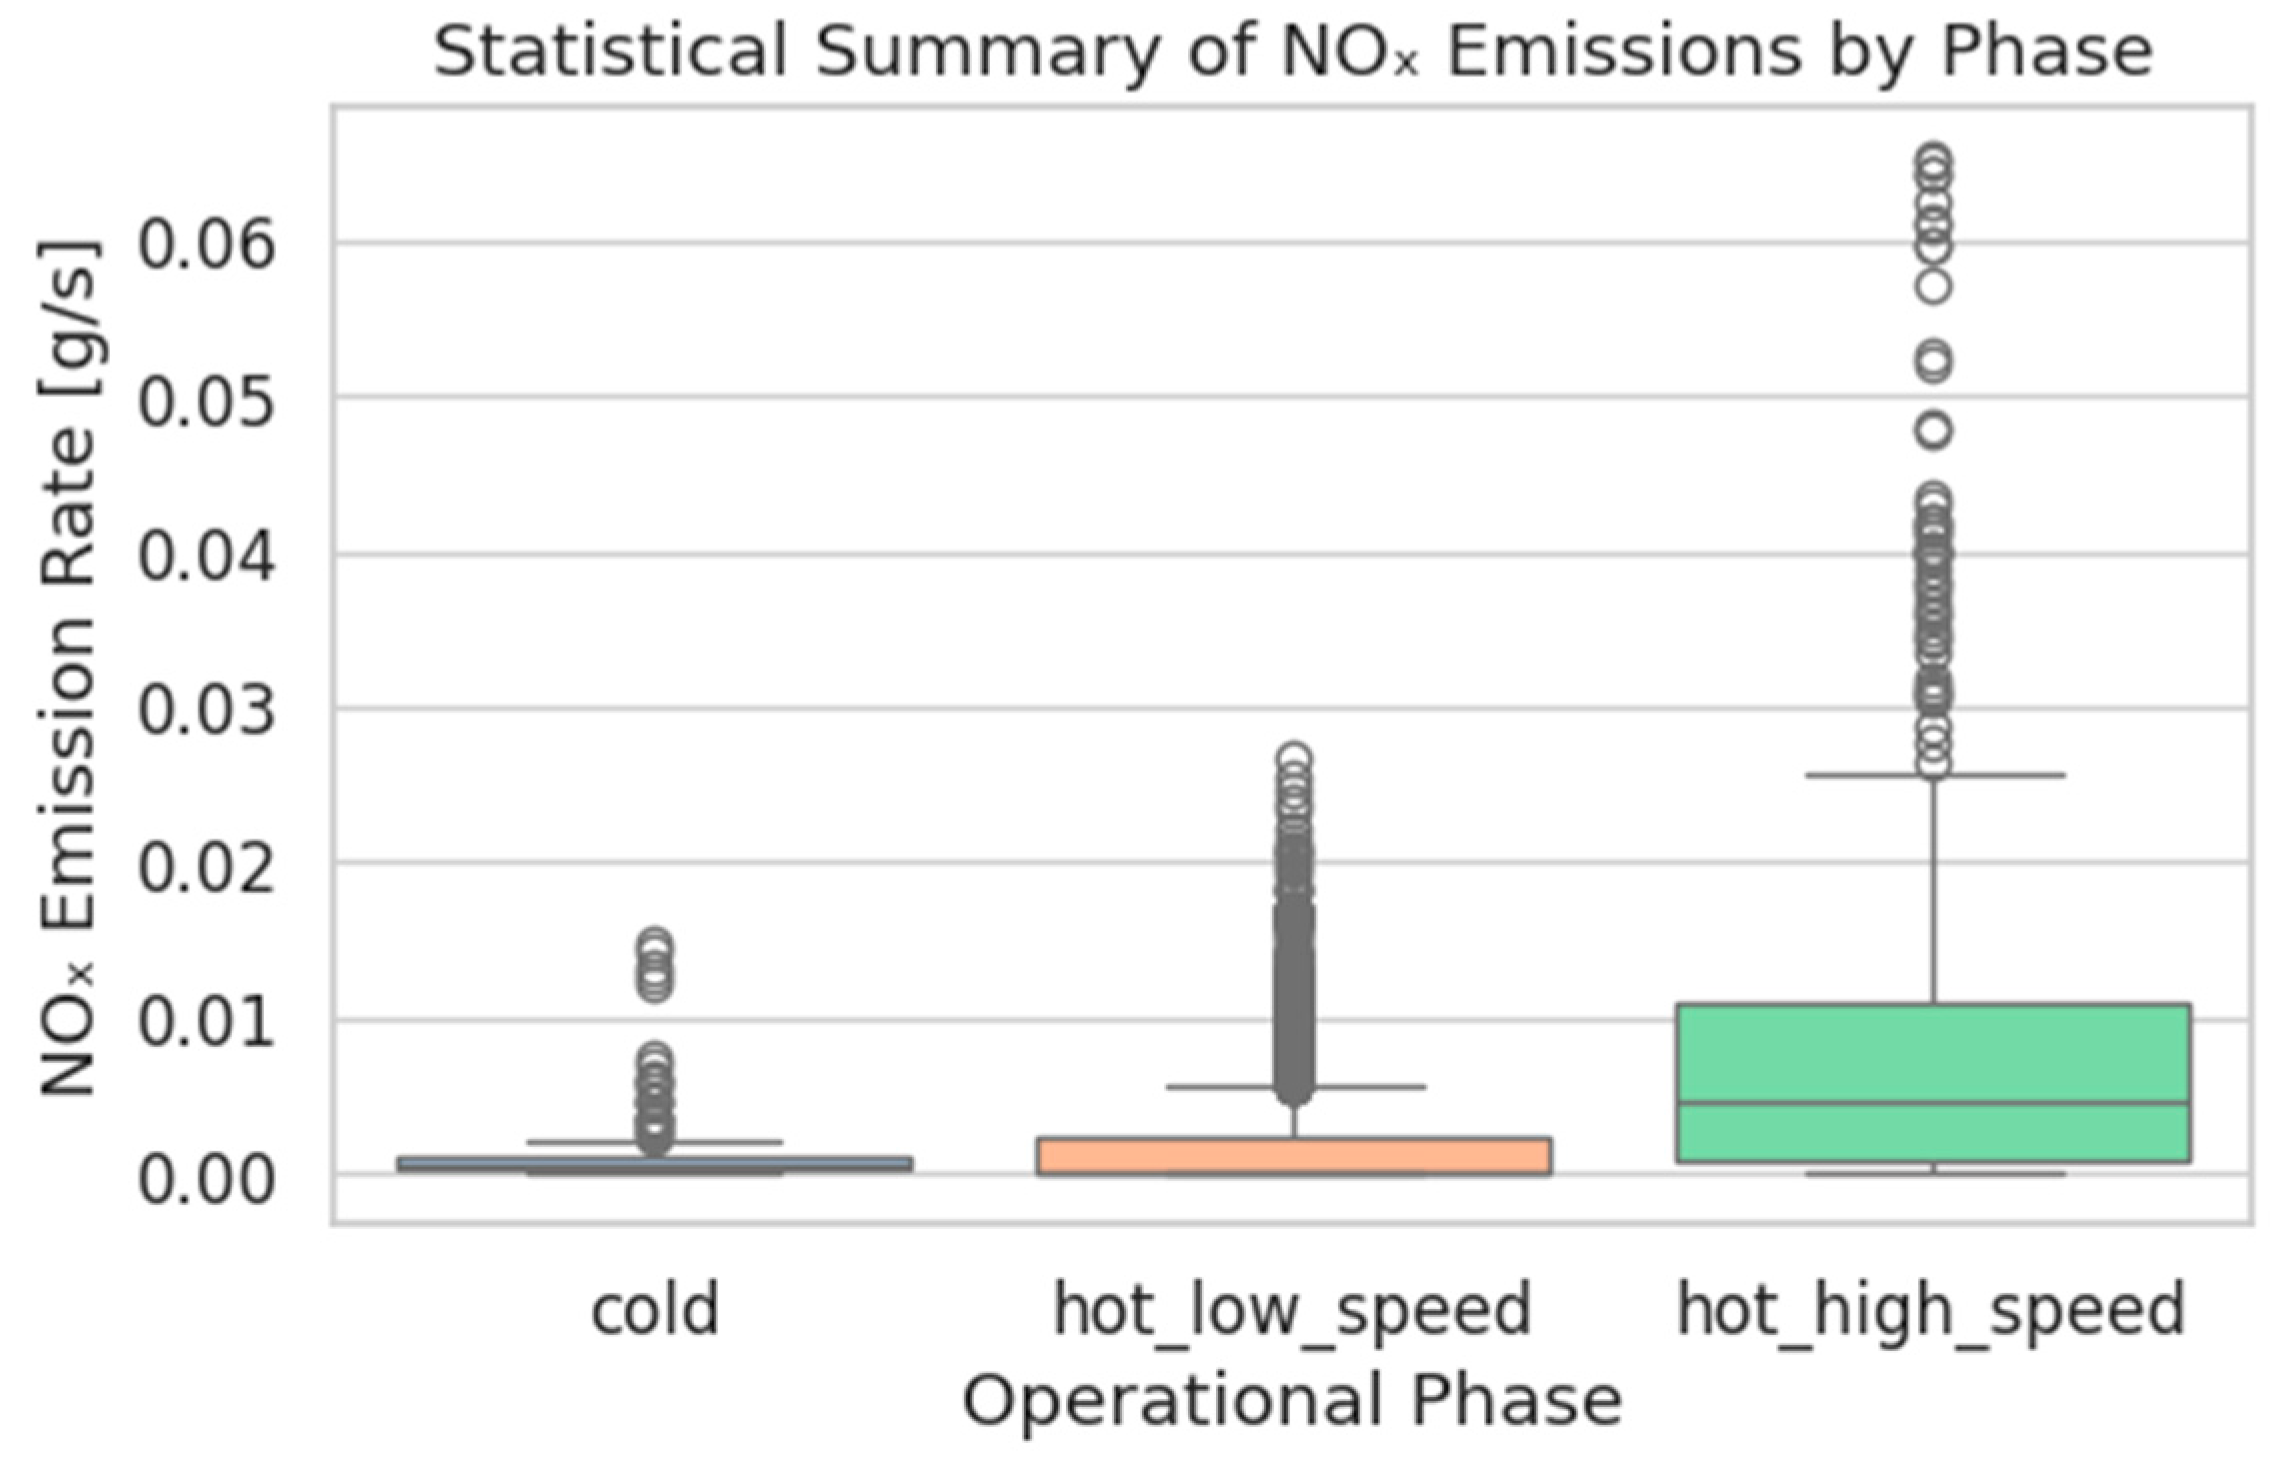
Figure 6.
Vehicle kinematic behavior across operational phases.
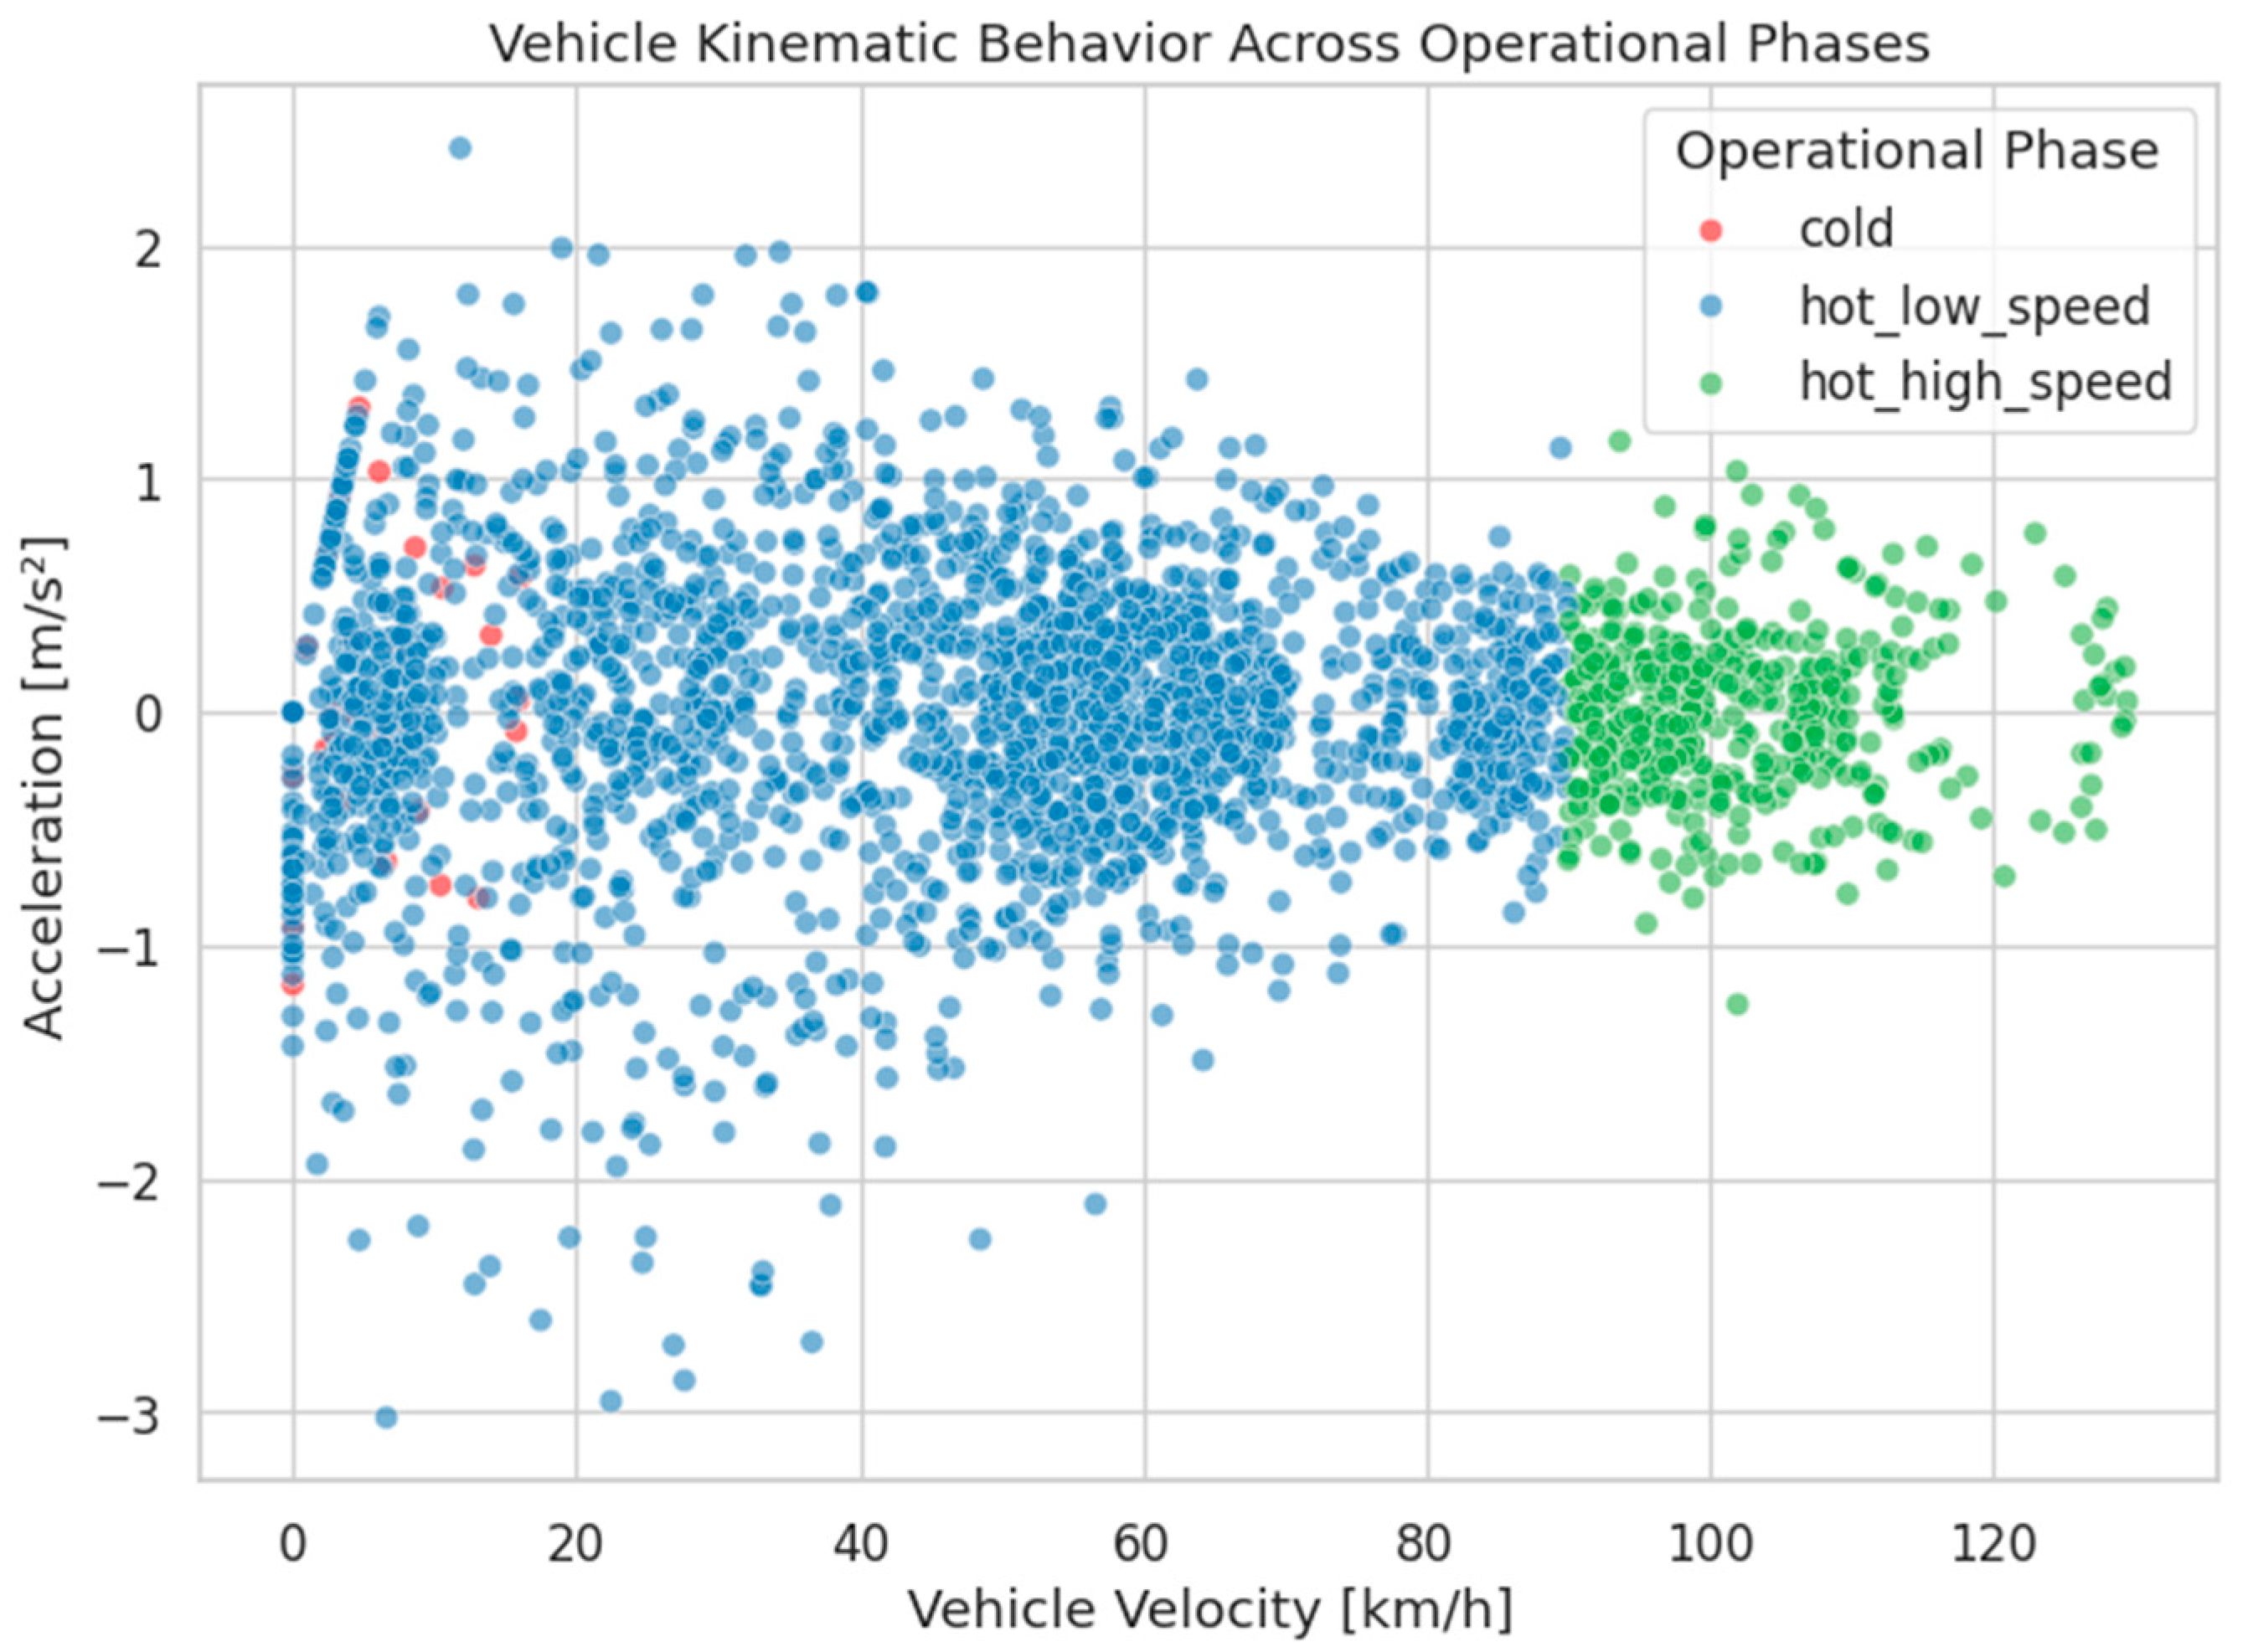
Figure 7.
Distribution of the acceleration pattern by operational phase.
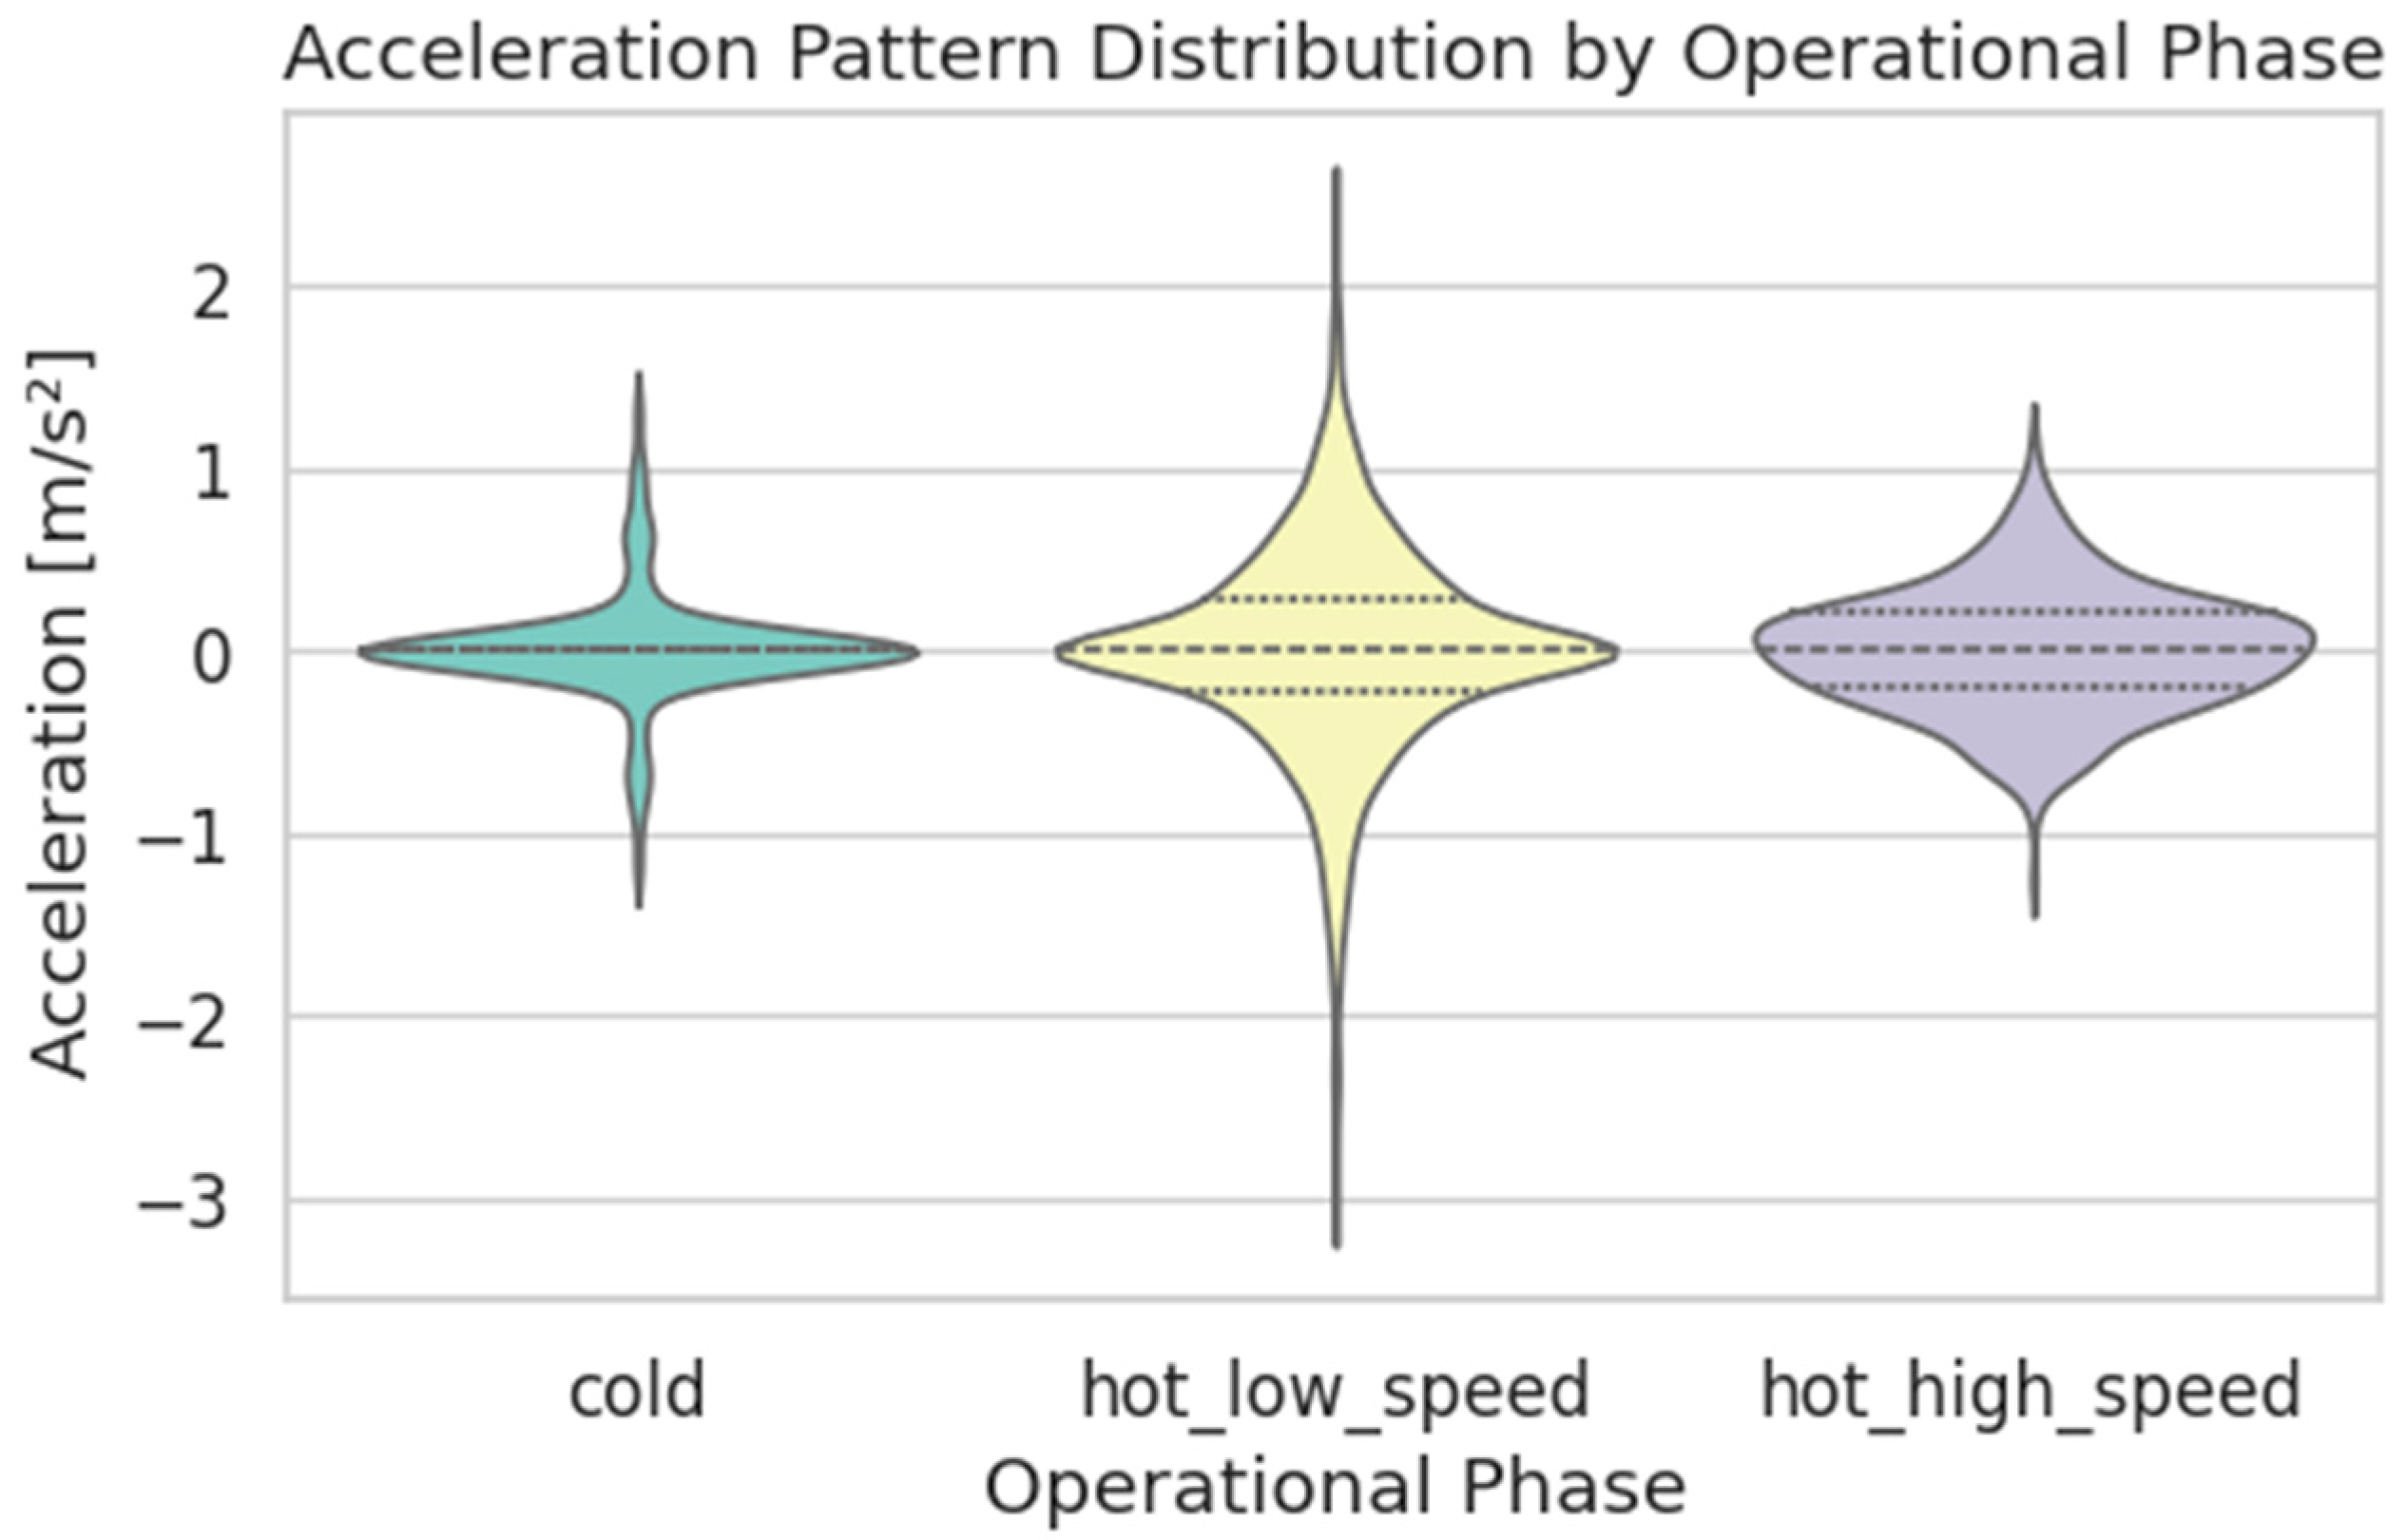
Figure 8.
Temporal relationship: thermal conditioning of the engine vs NOₓ emissions.
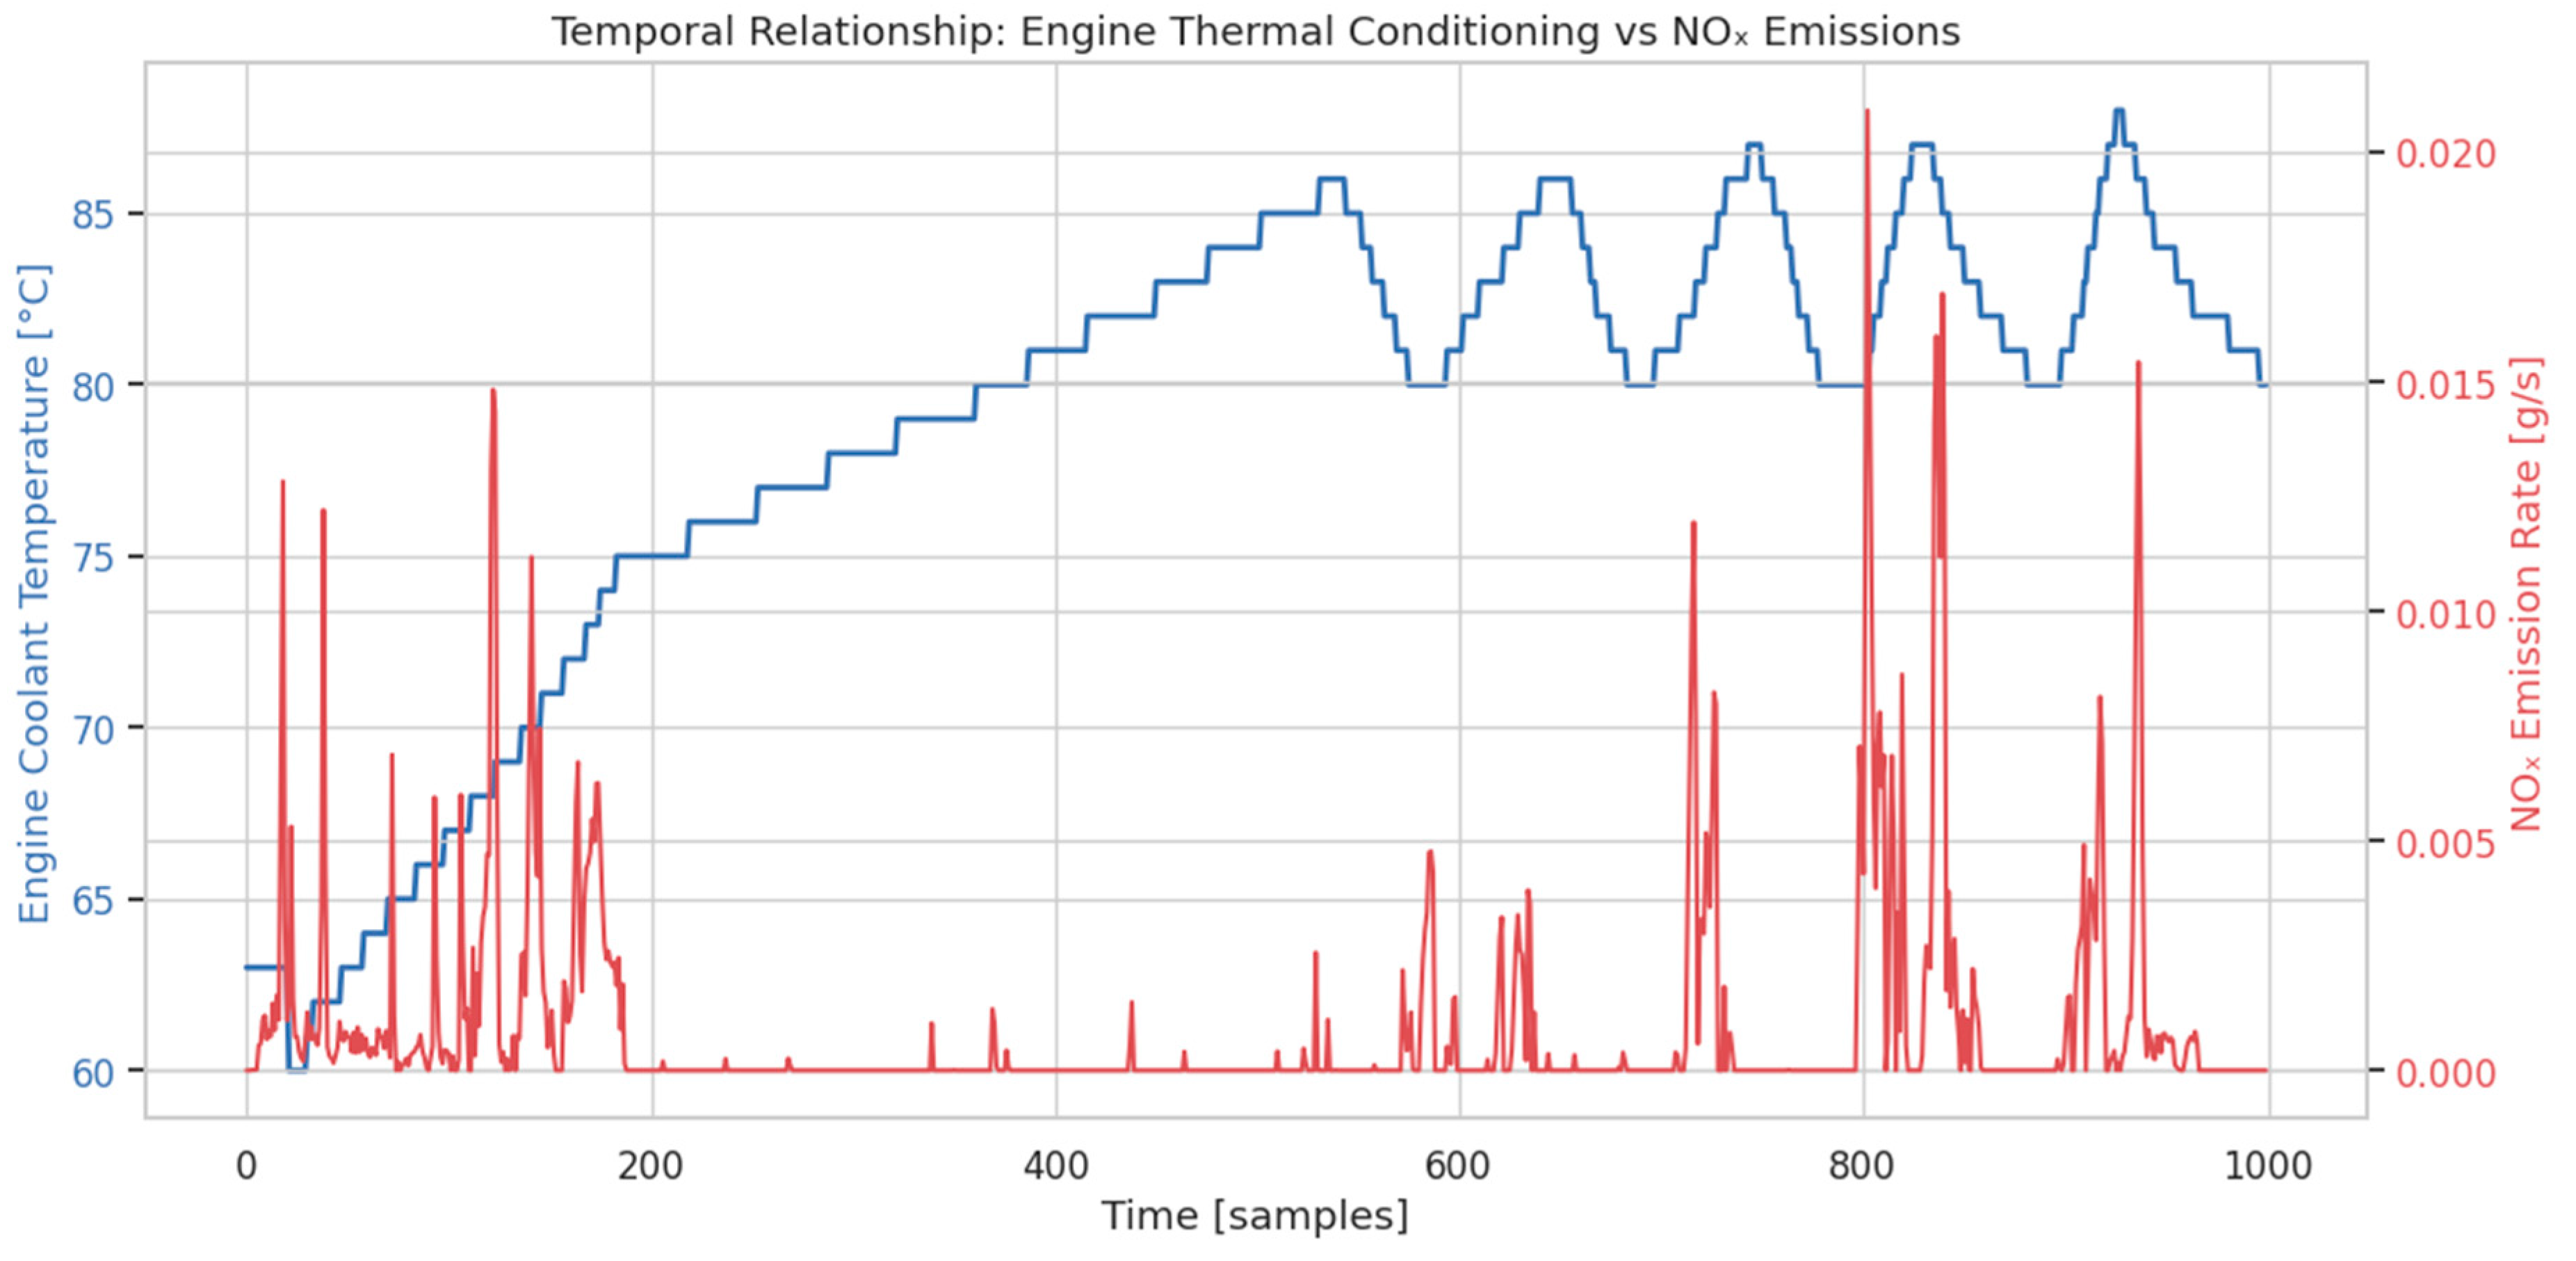
Figure 9.
3D feature space: kinematic-thermal-emission relationships.
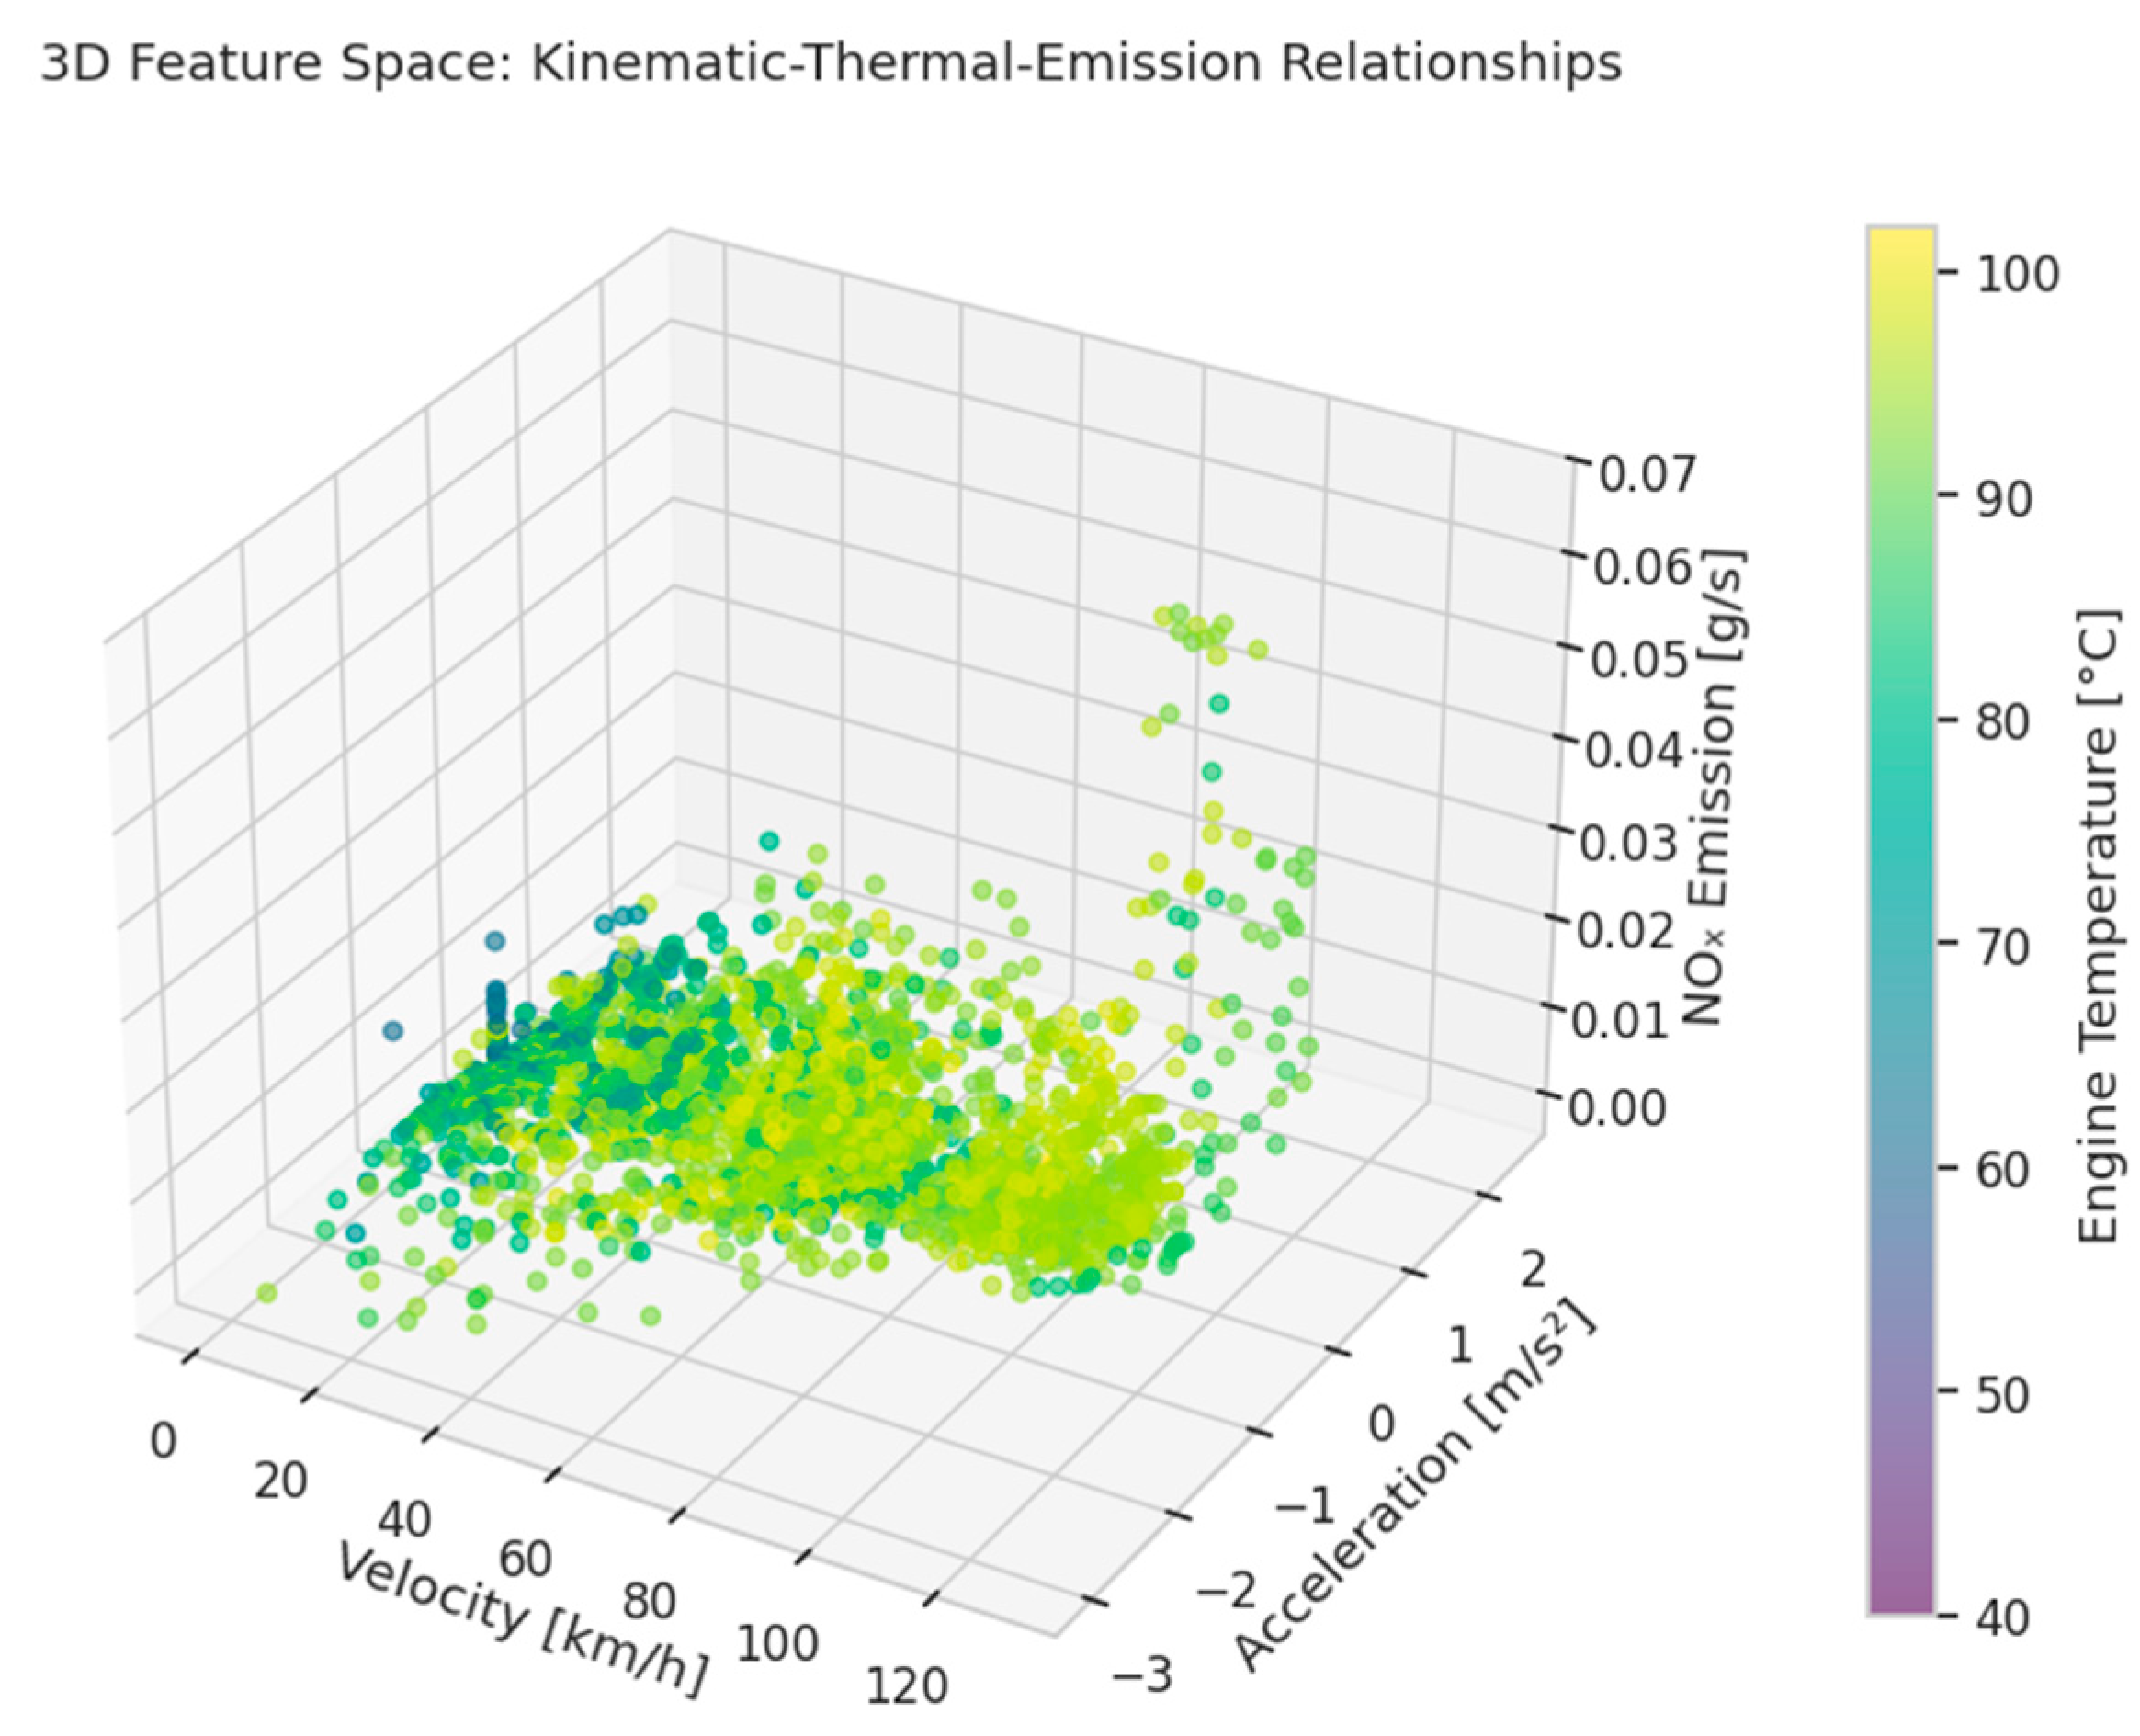
Figure 10.
Phase-specific NOₓ-velocity relationships.
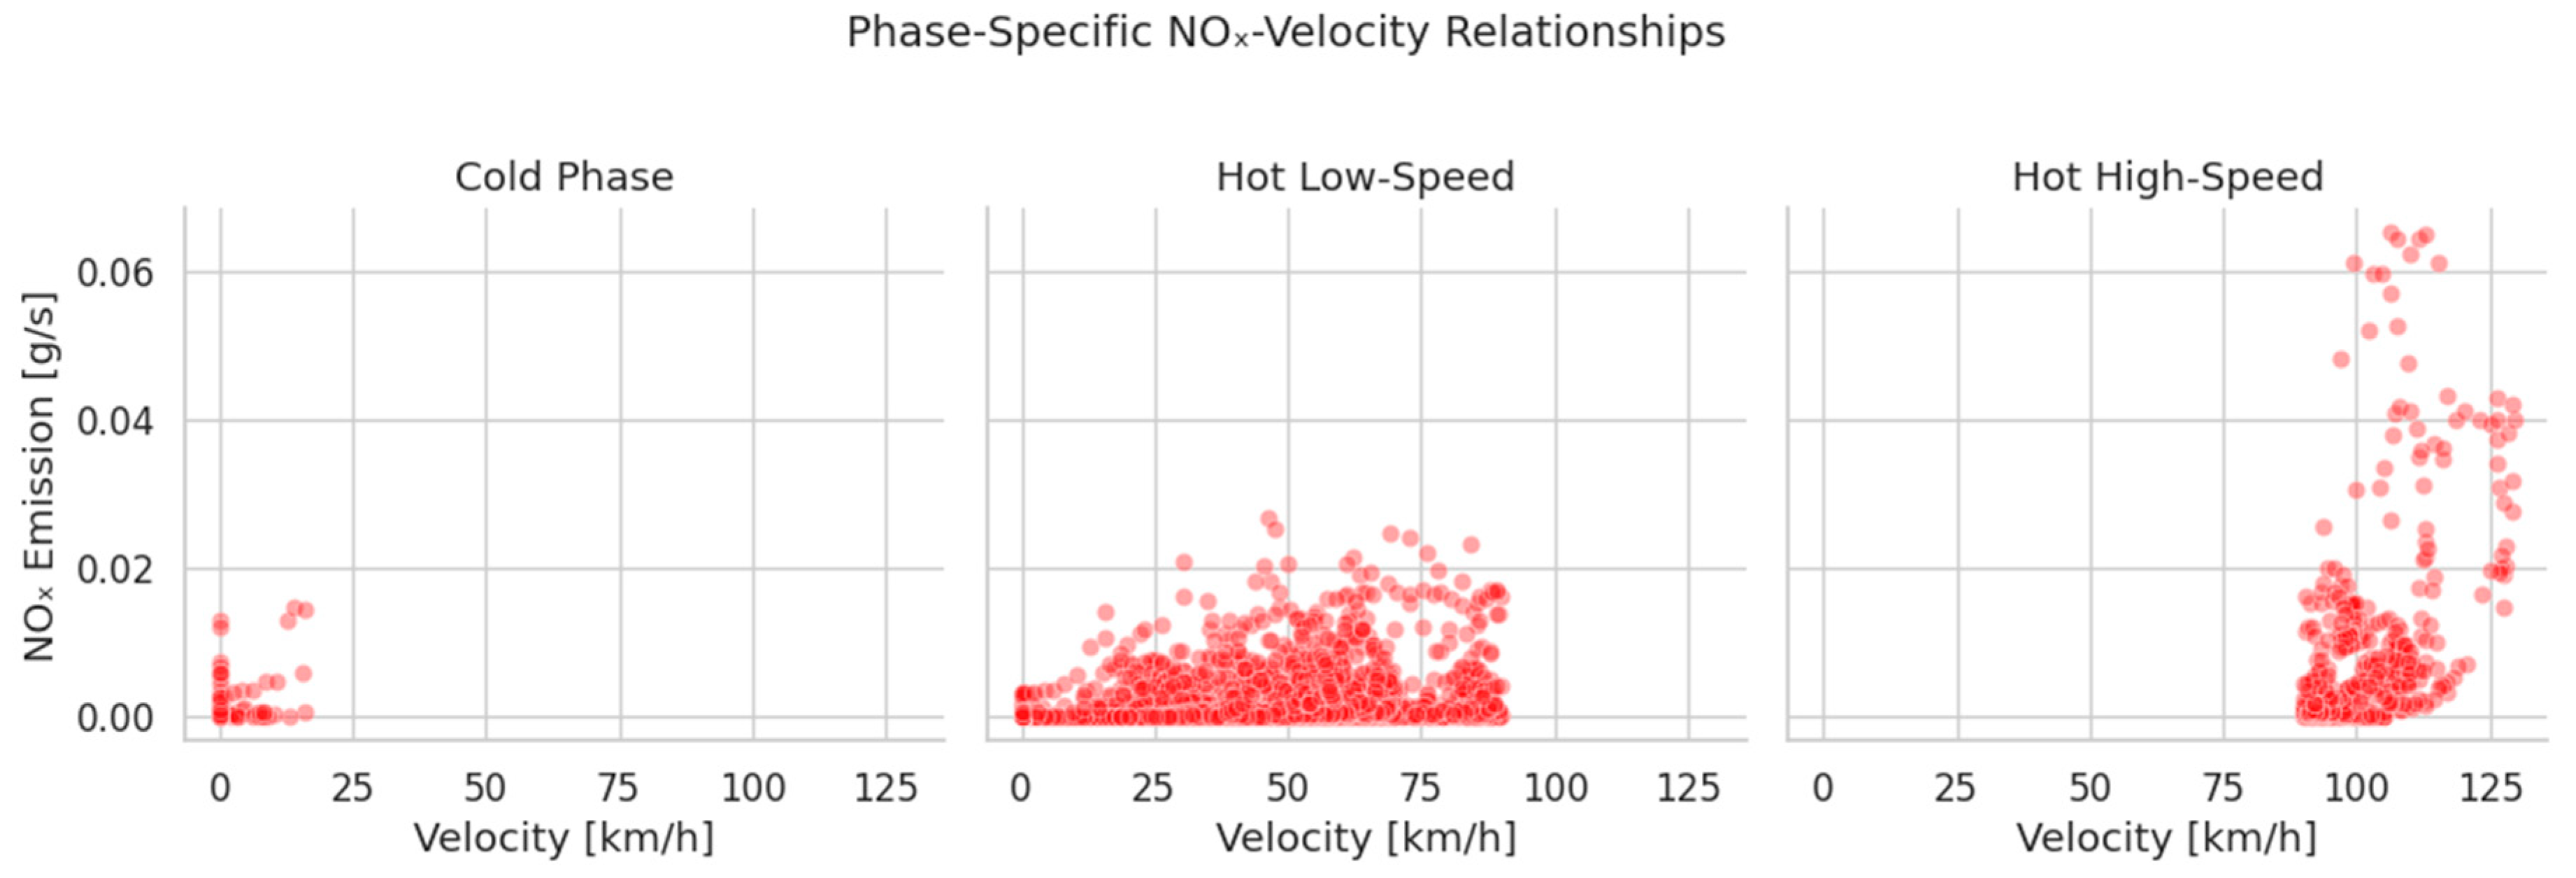
Figure 11.
t-SNE analysis: operational phase separability in feature space.
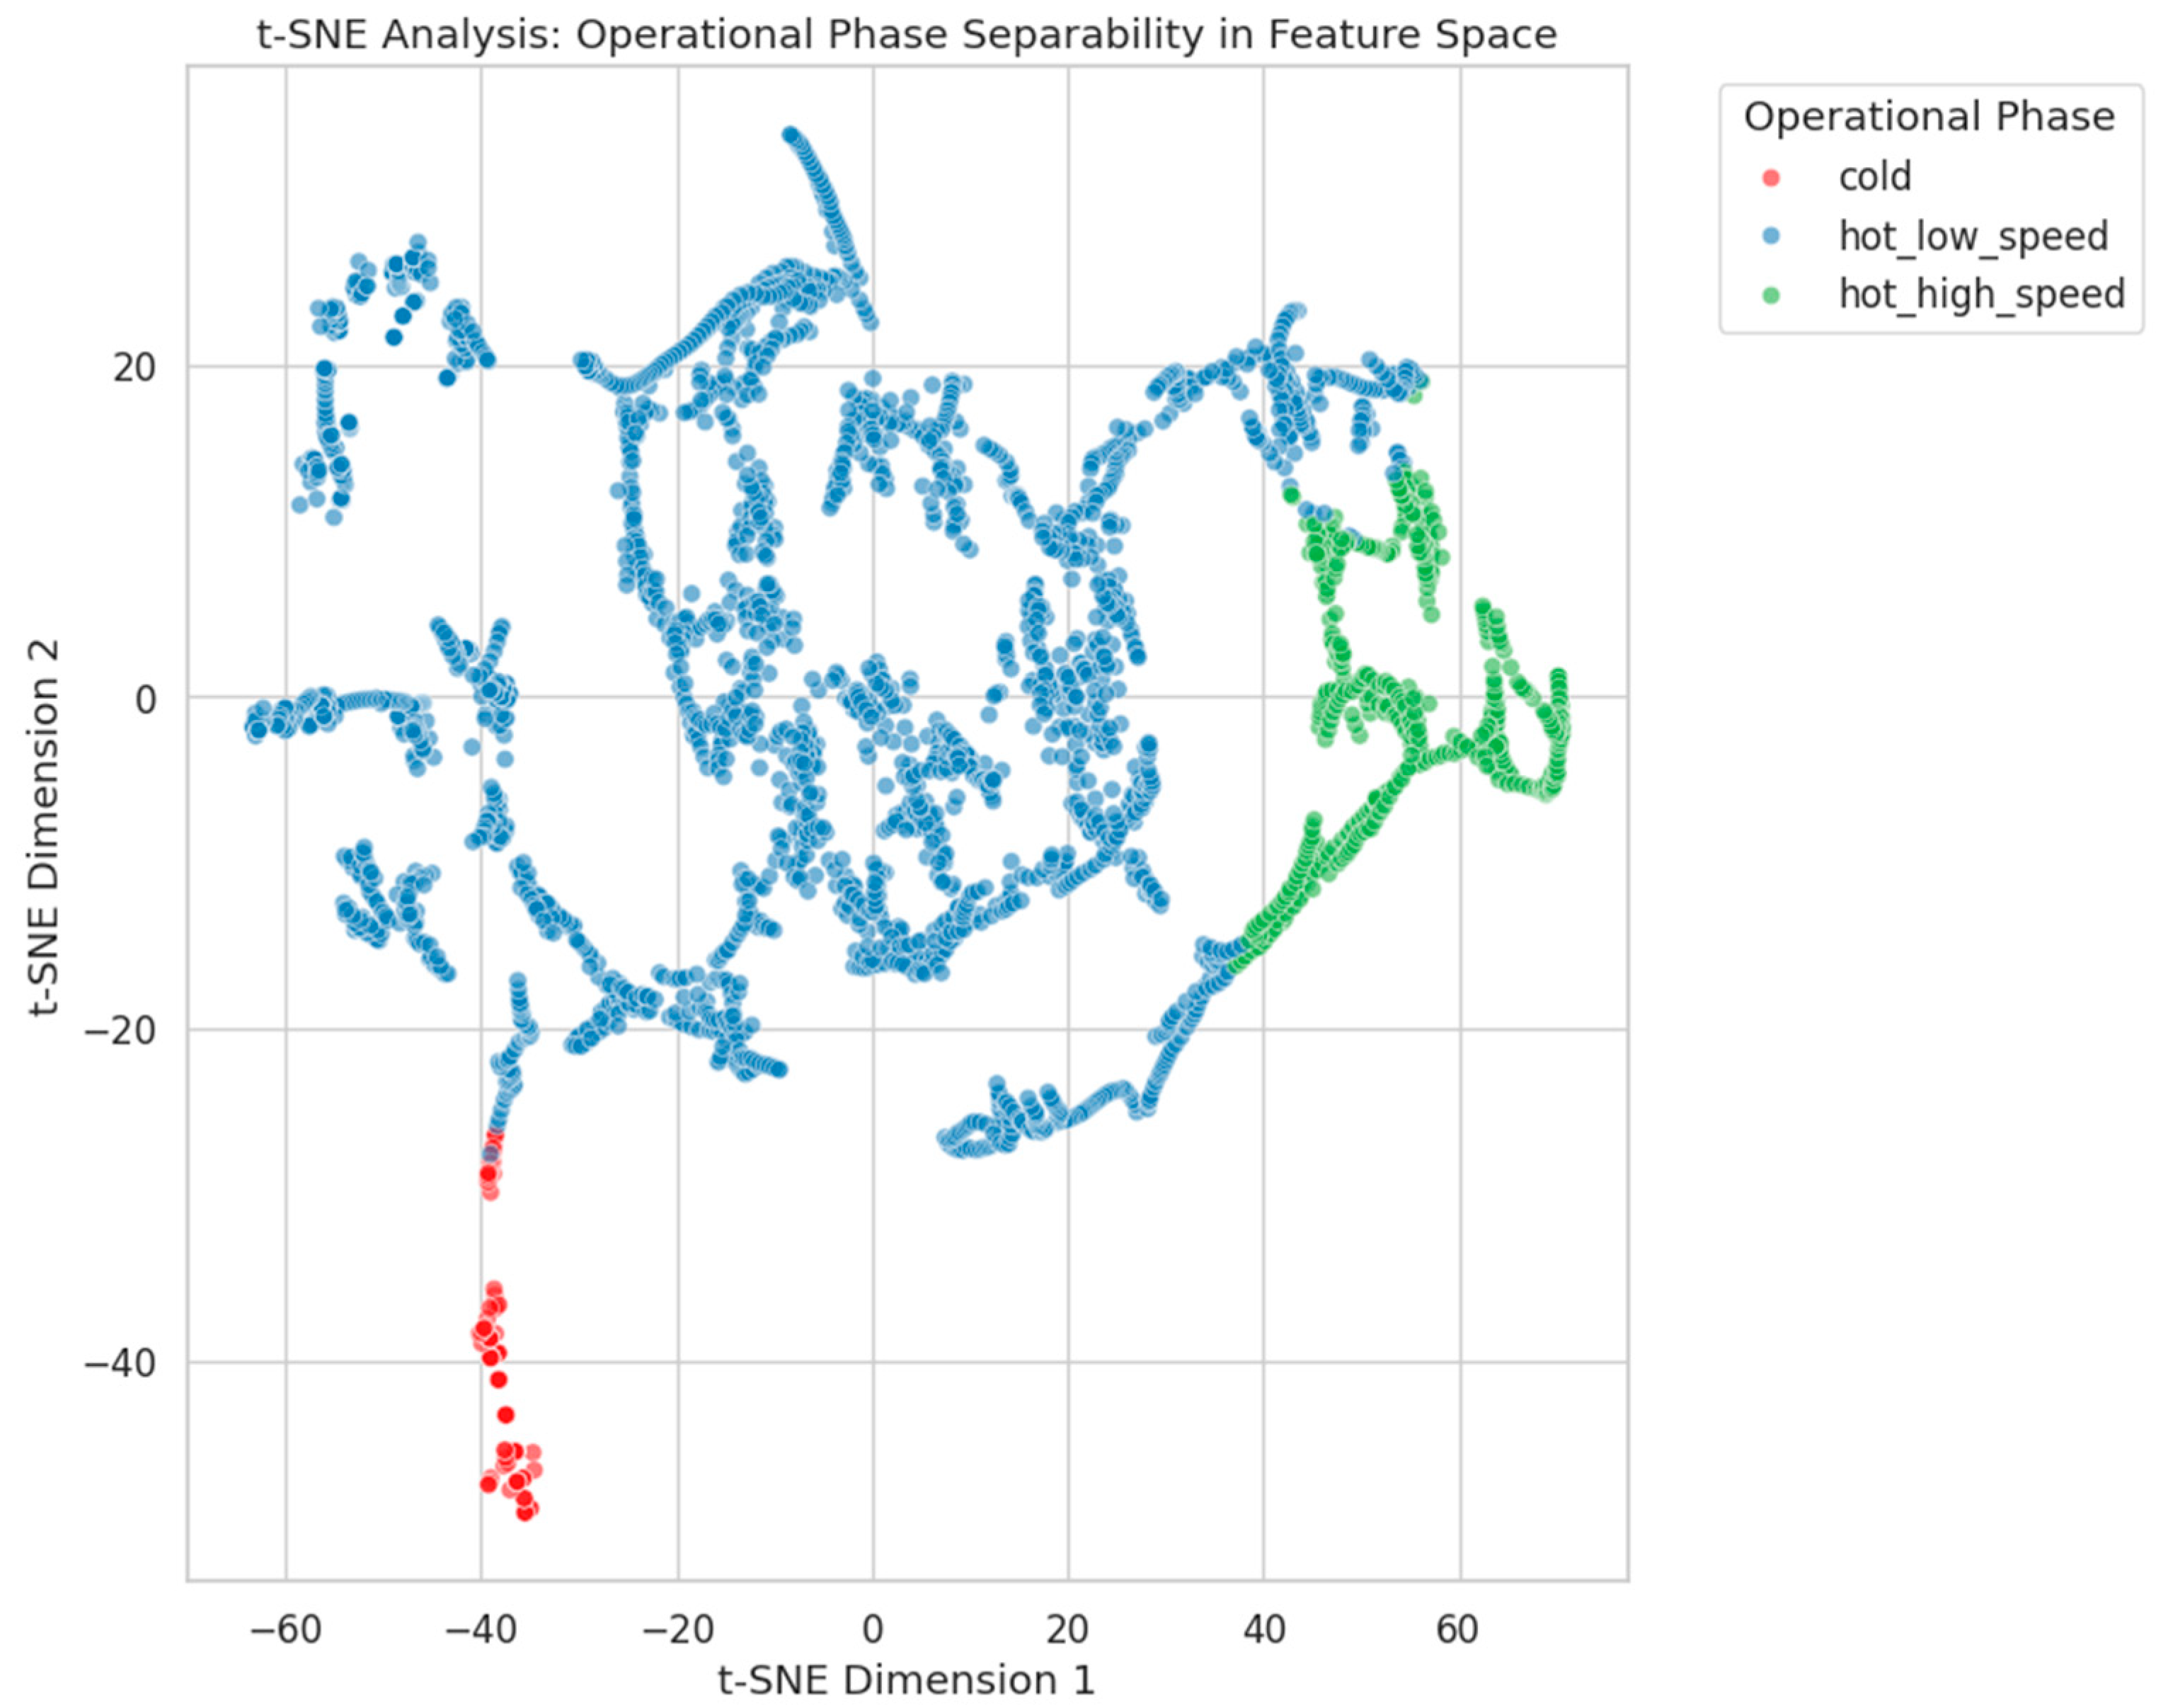
Figure 12.
Mixture o Evaluation of the mixtures model.
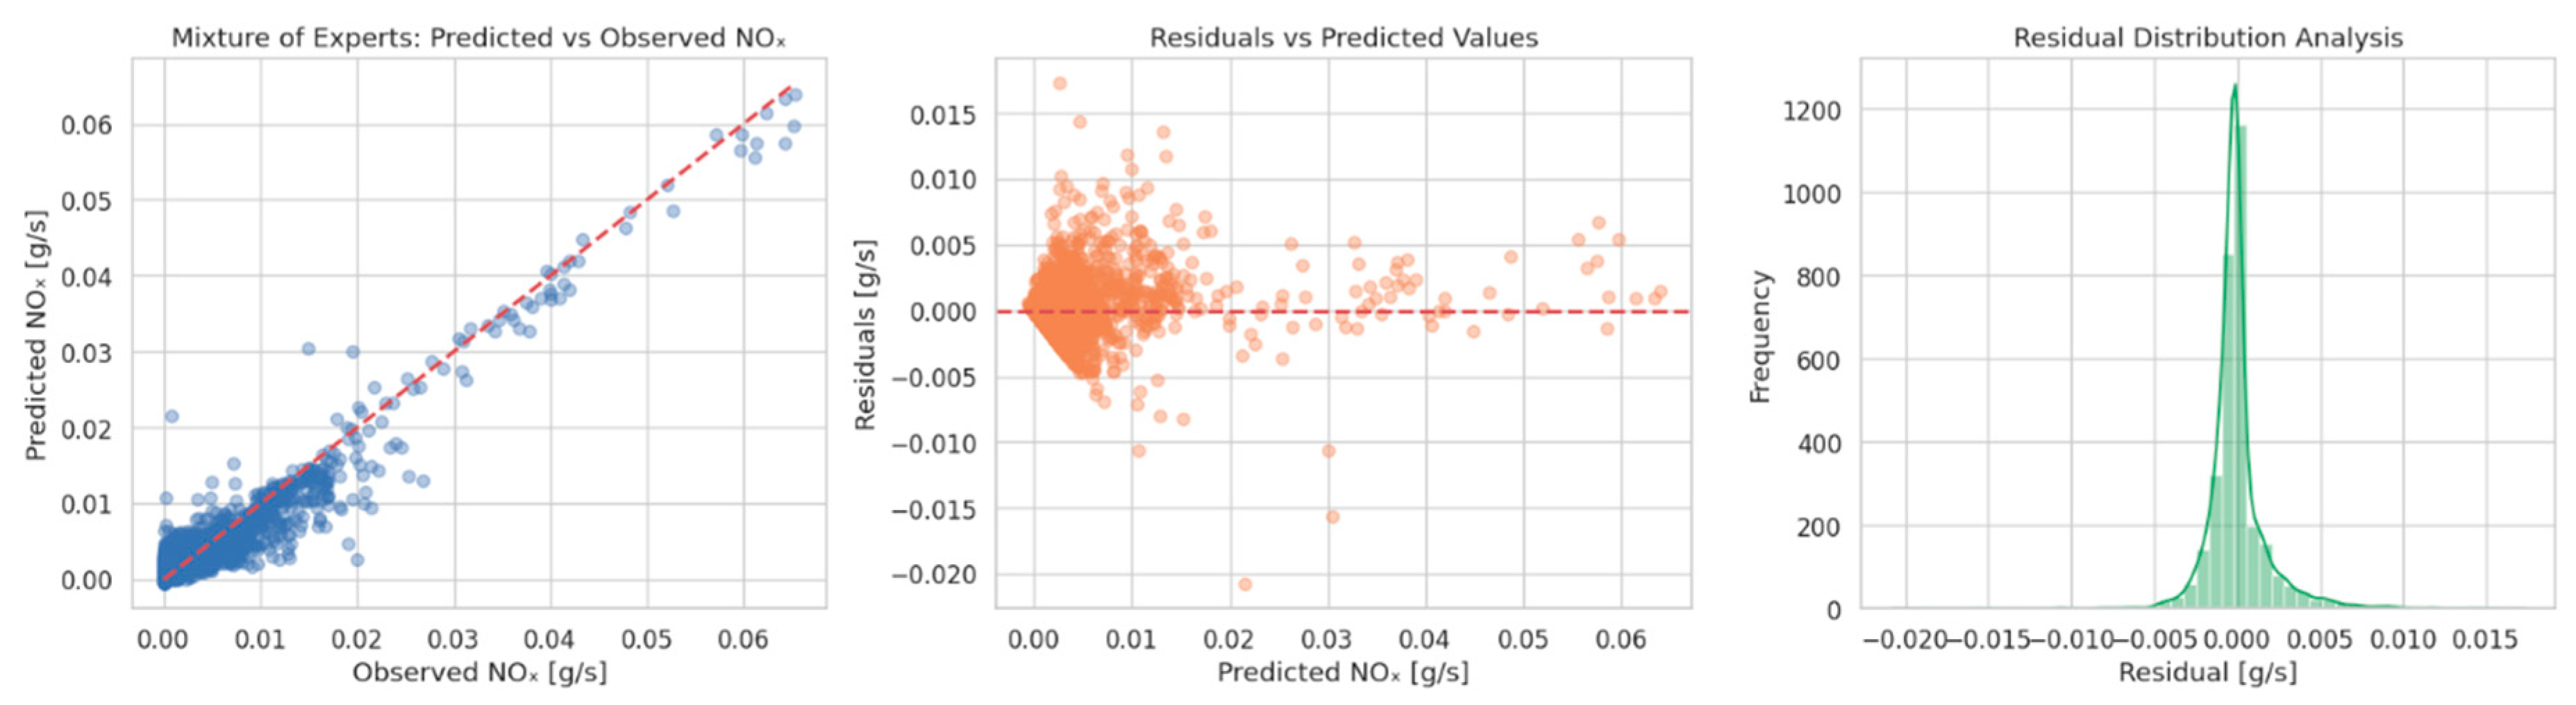
Figure 13.
Joint distribution: engine temperature vs NOₓ emissions.
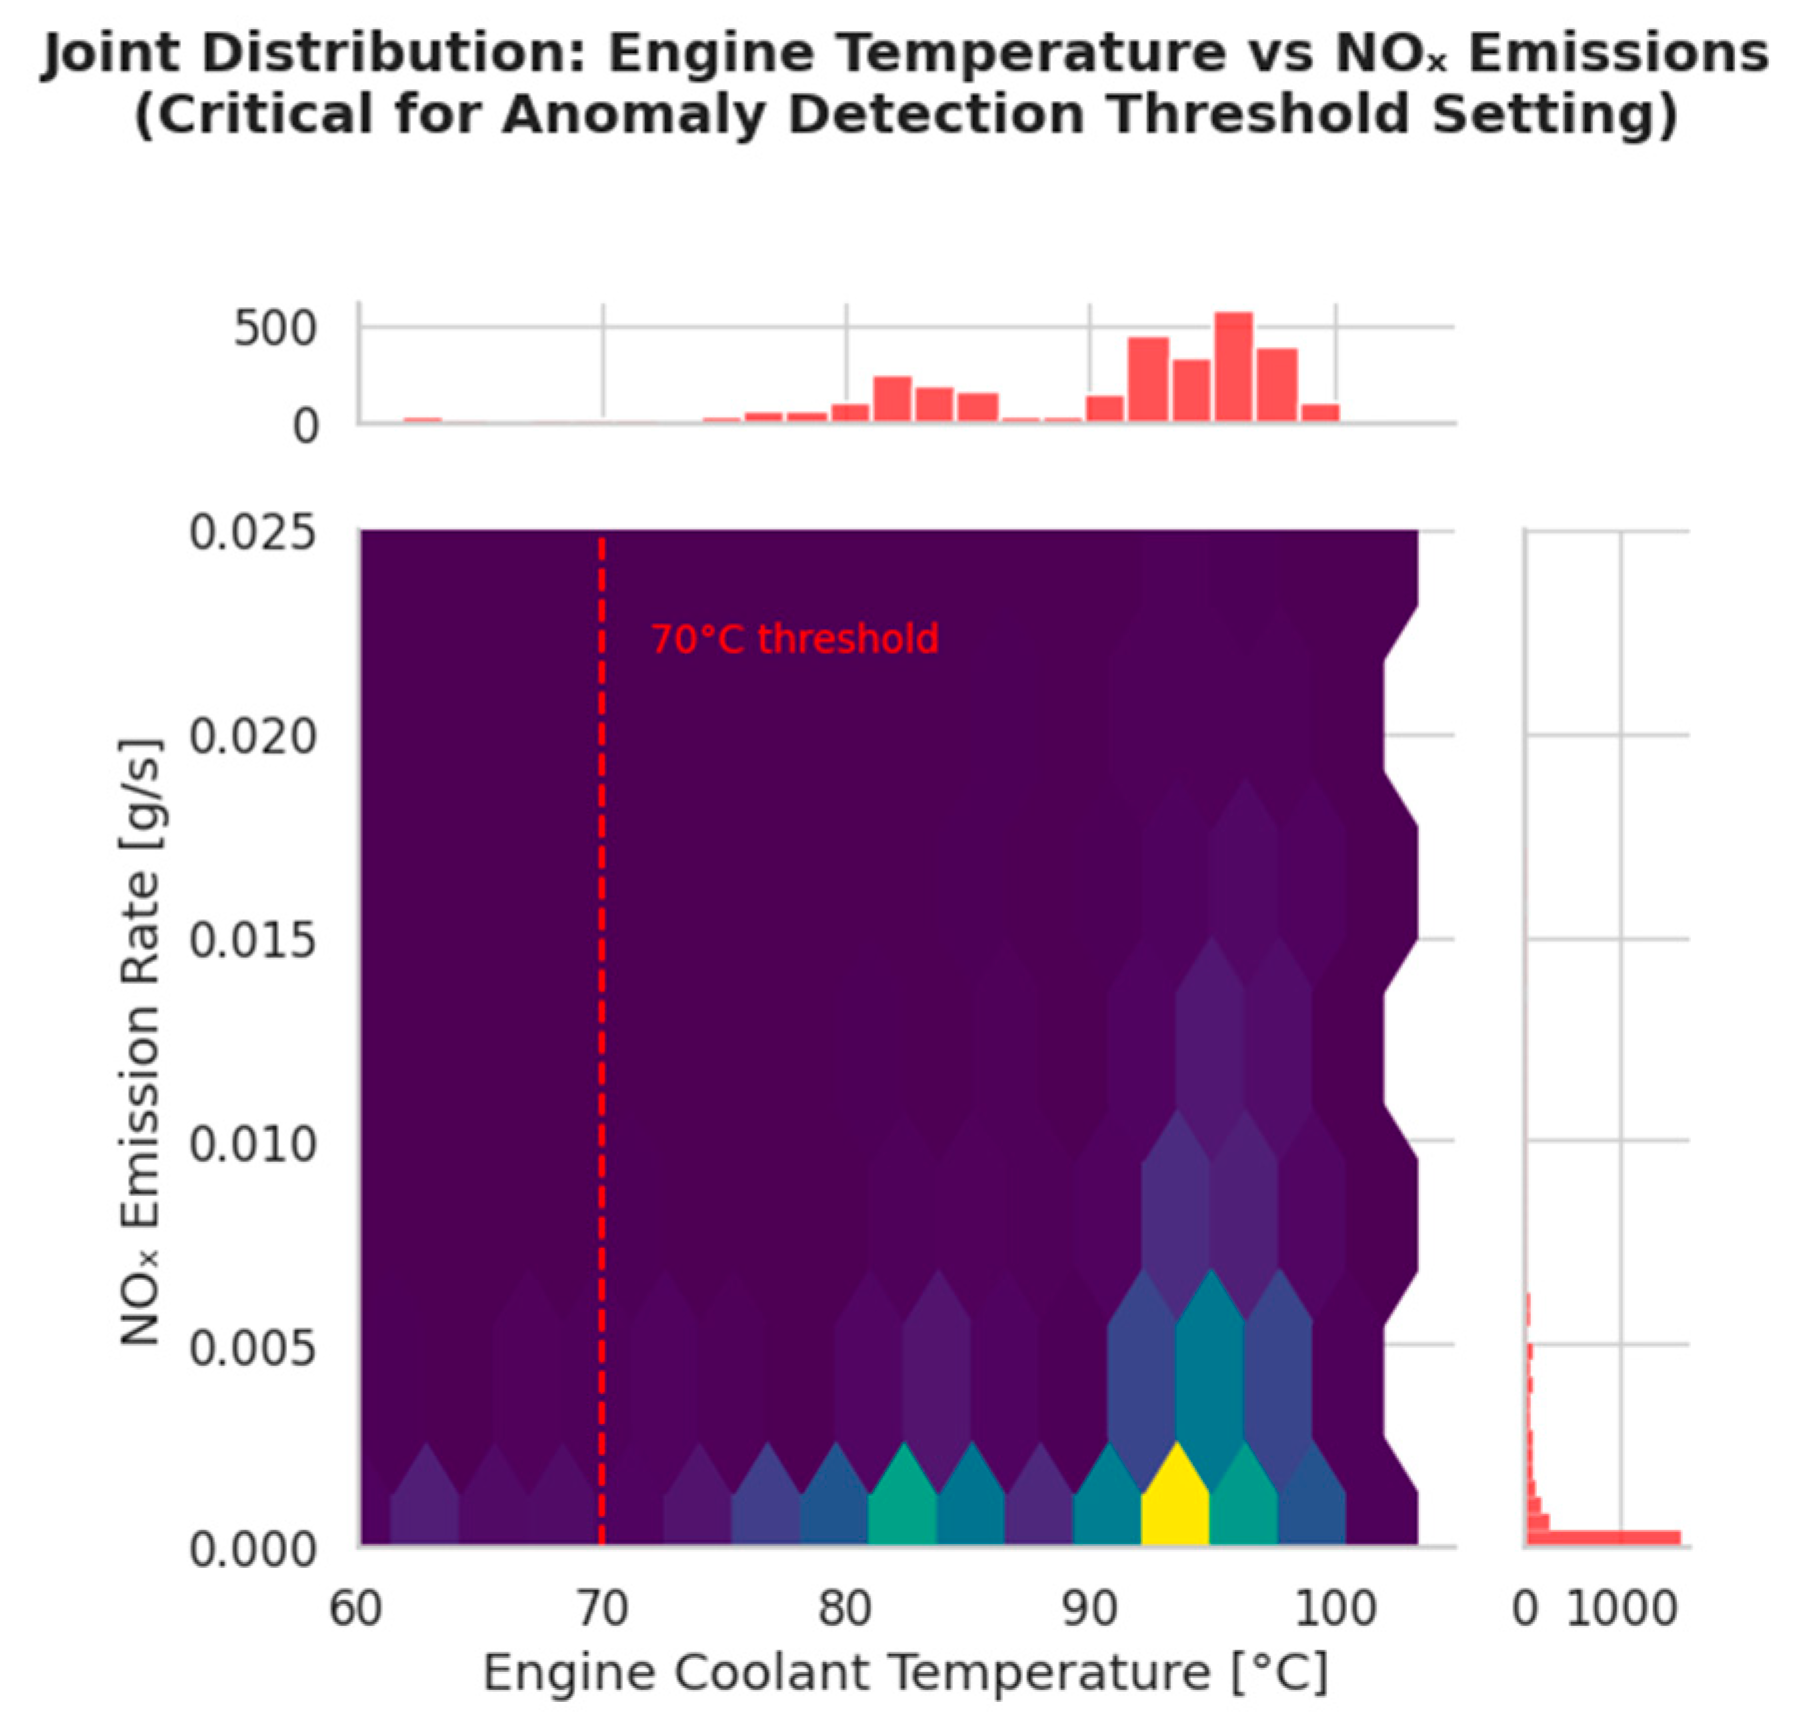
Figure 14.
Scatter plot of mean NOₓ (mg/s) versus acceleration variability (m/s²).
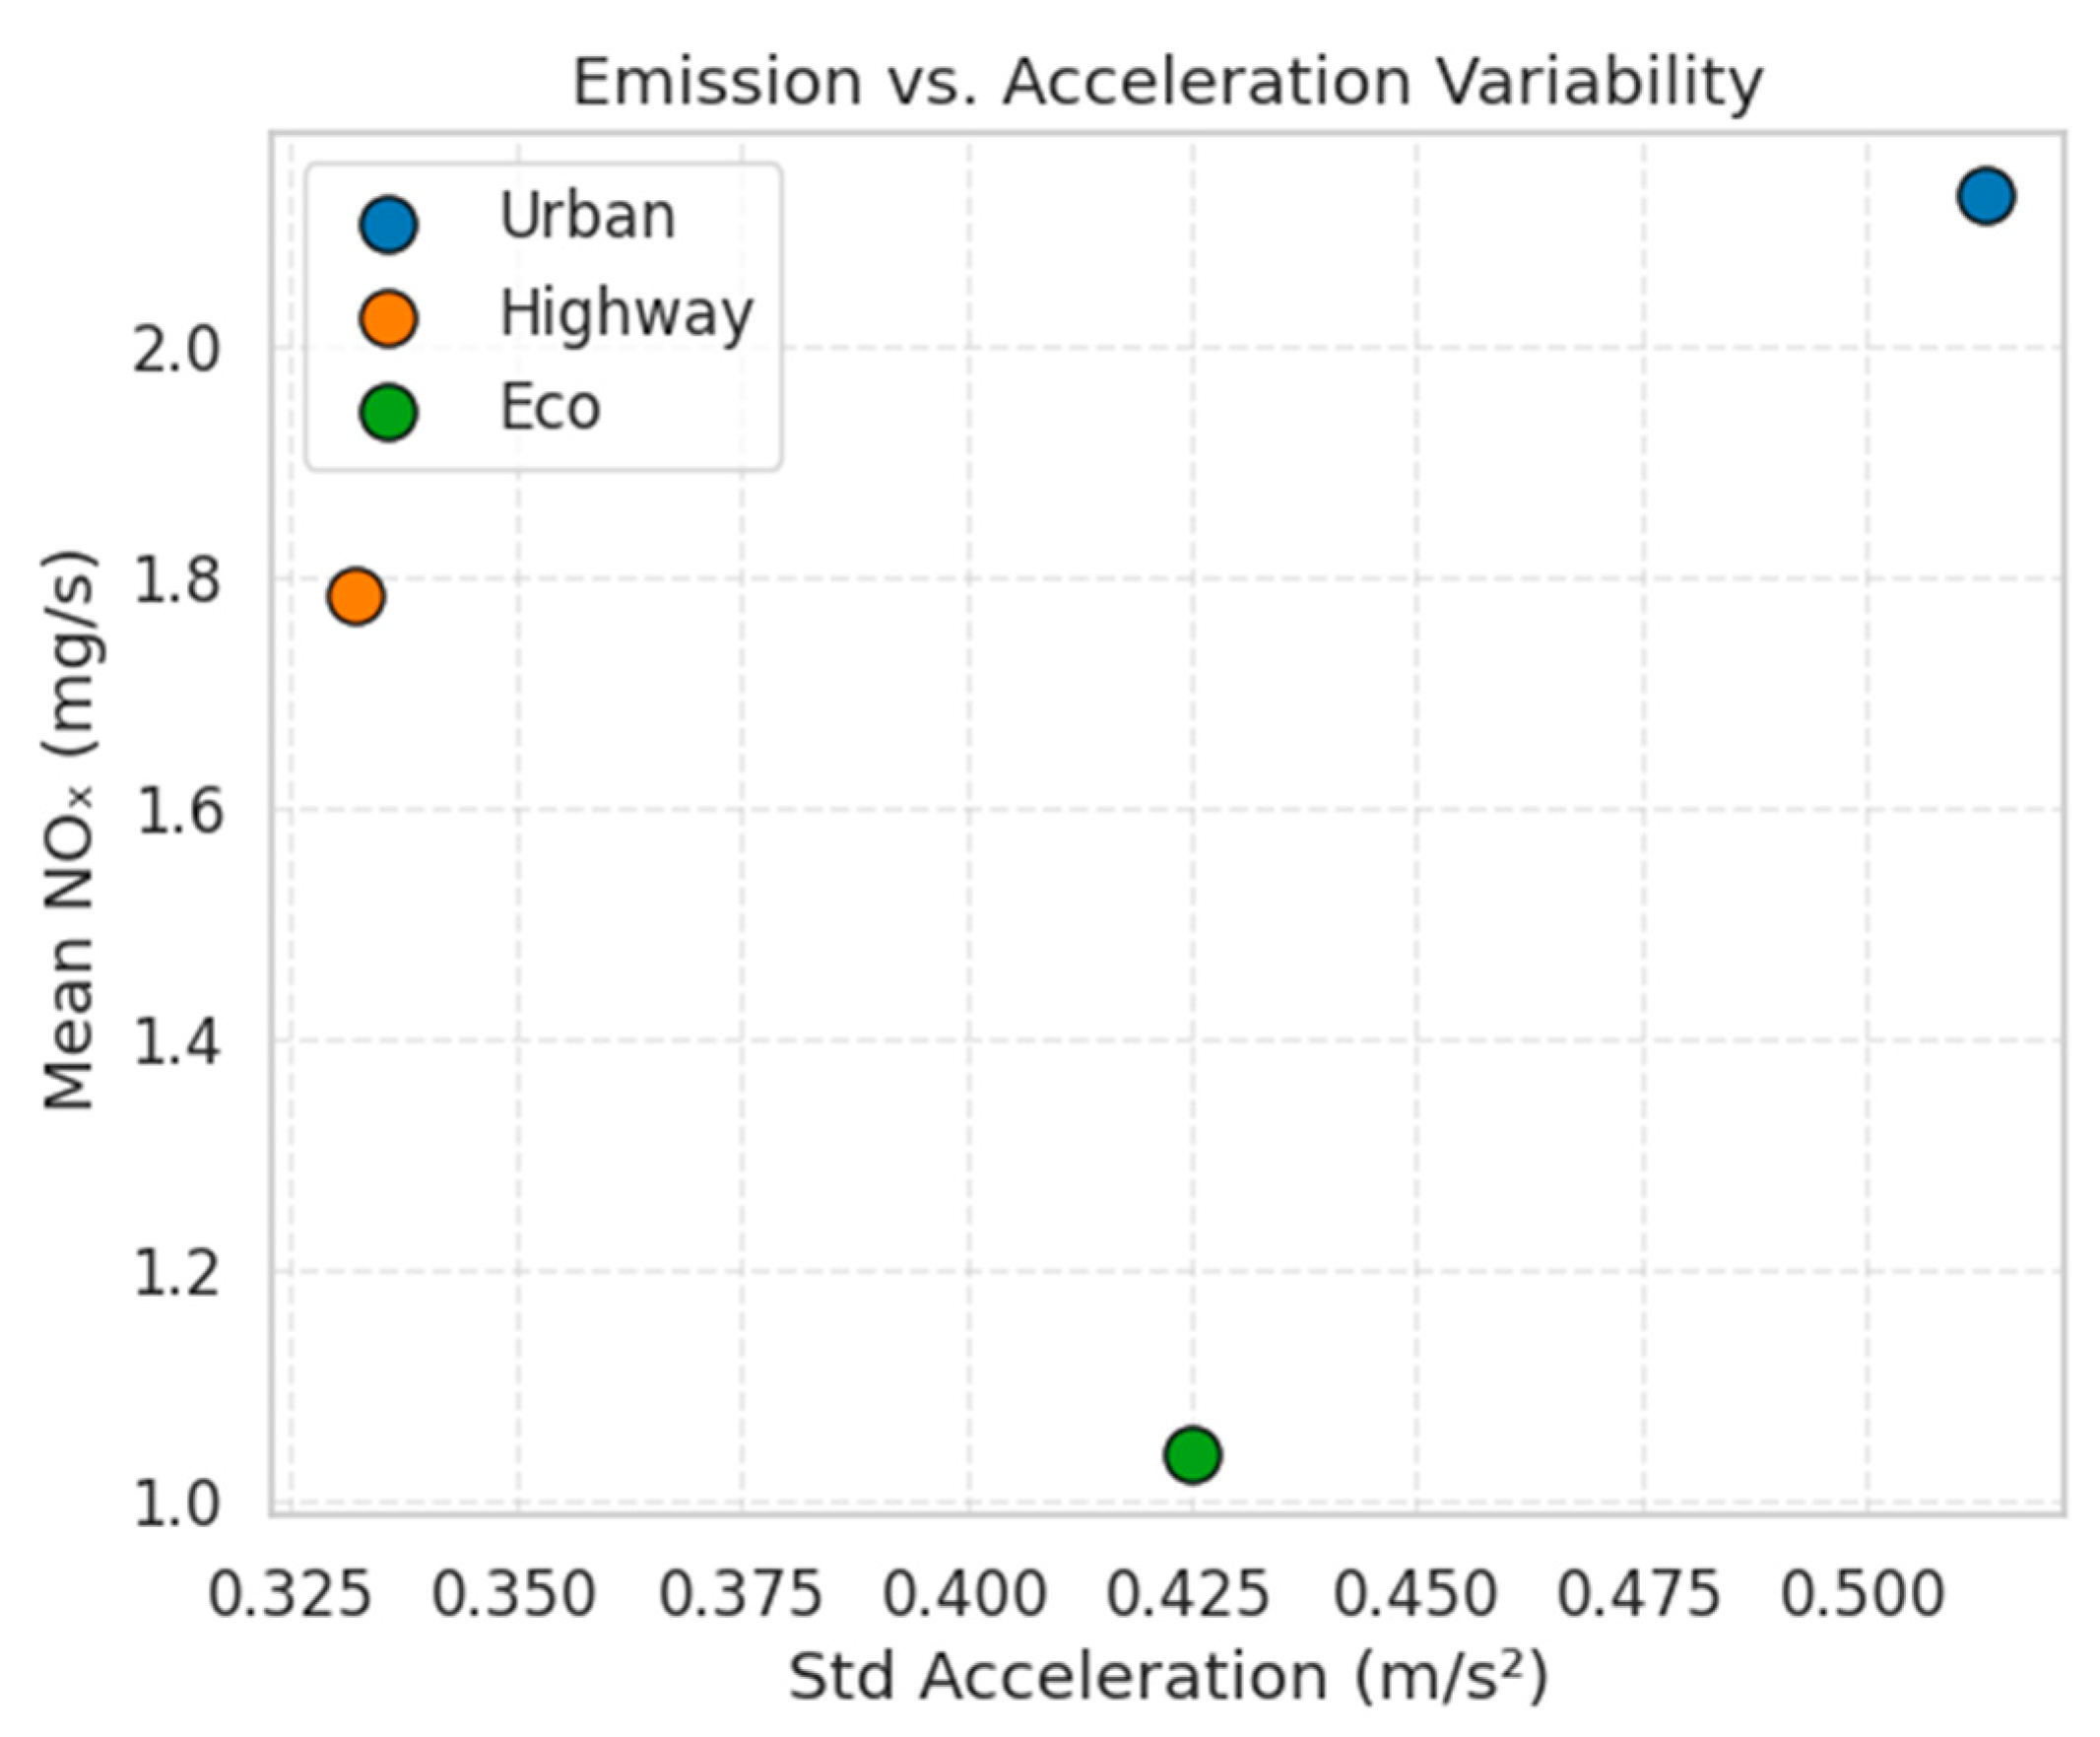
Figure 15.
View of the vehicle traffic microsimulation model tested and results of the obtained model in the form of an emission map, instantaneous emissions, and cumulative emissions.
Figure 15.
View of the vehicle traffic microsimulation model tested and results of the obtained model in the form of an emission map, instantaneous emissions, and cumulative emissions.
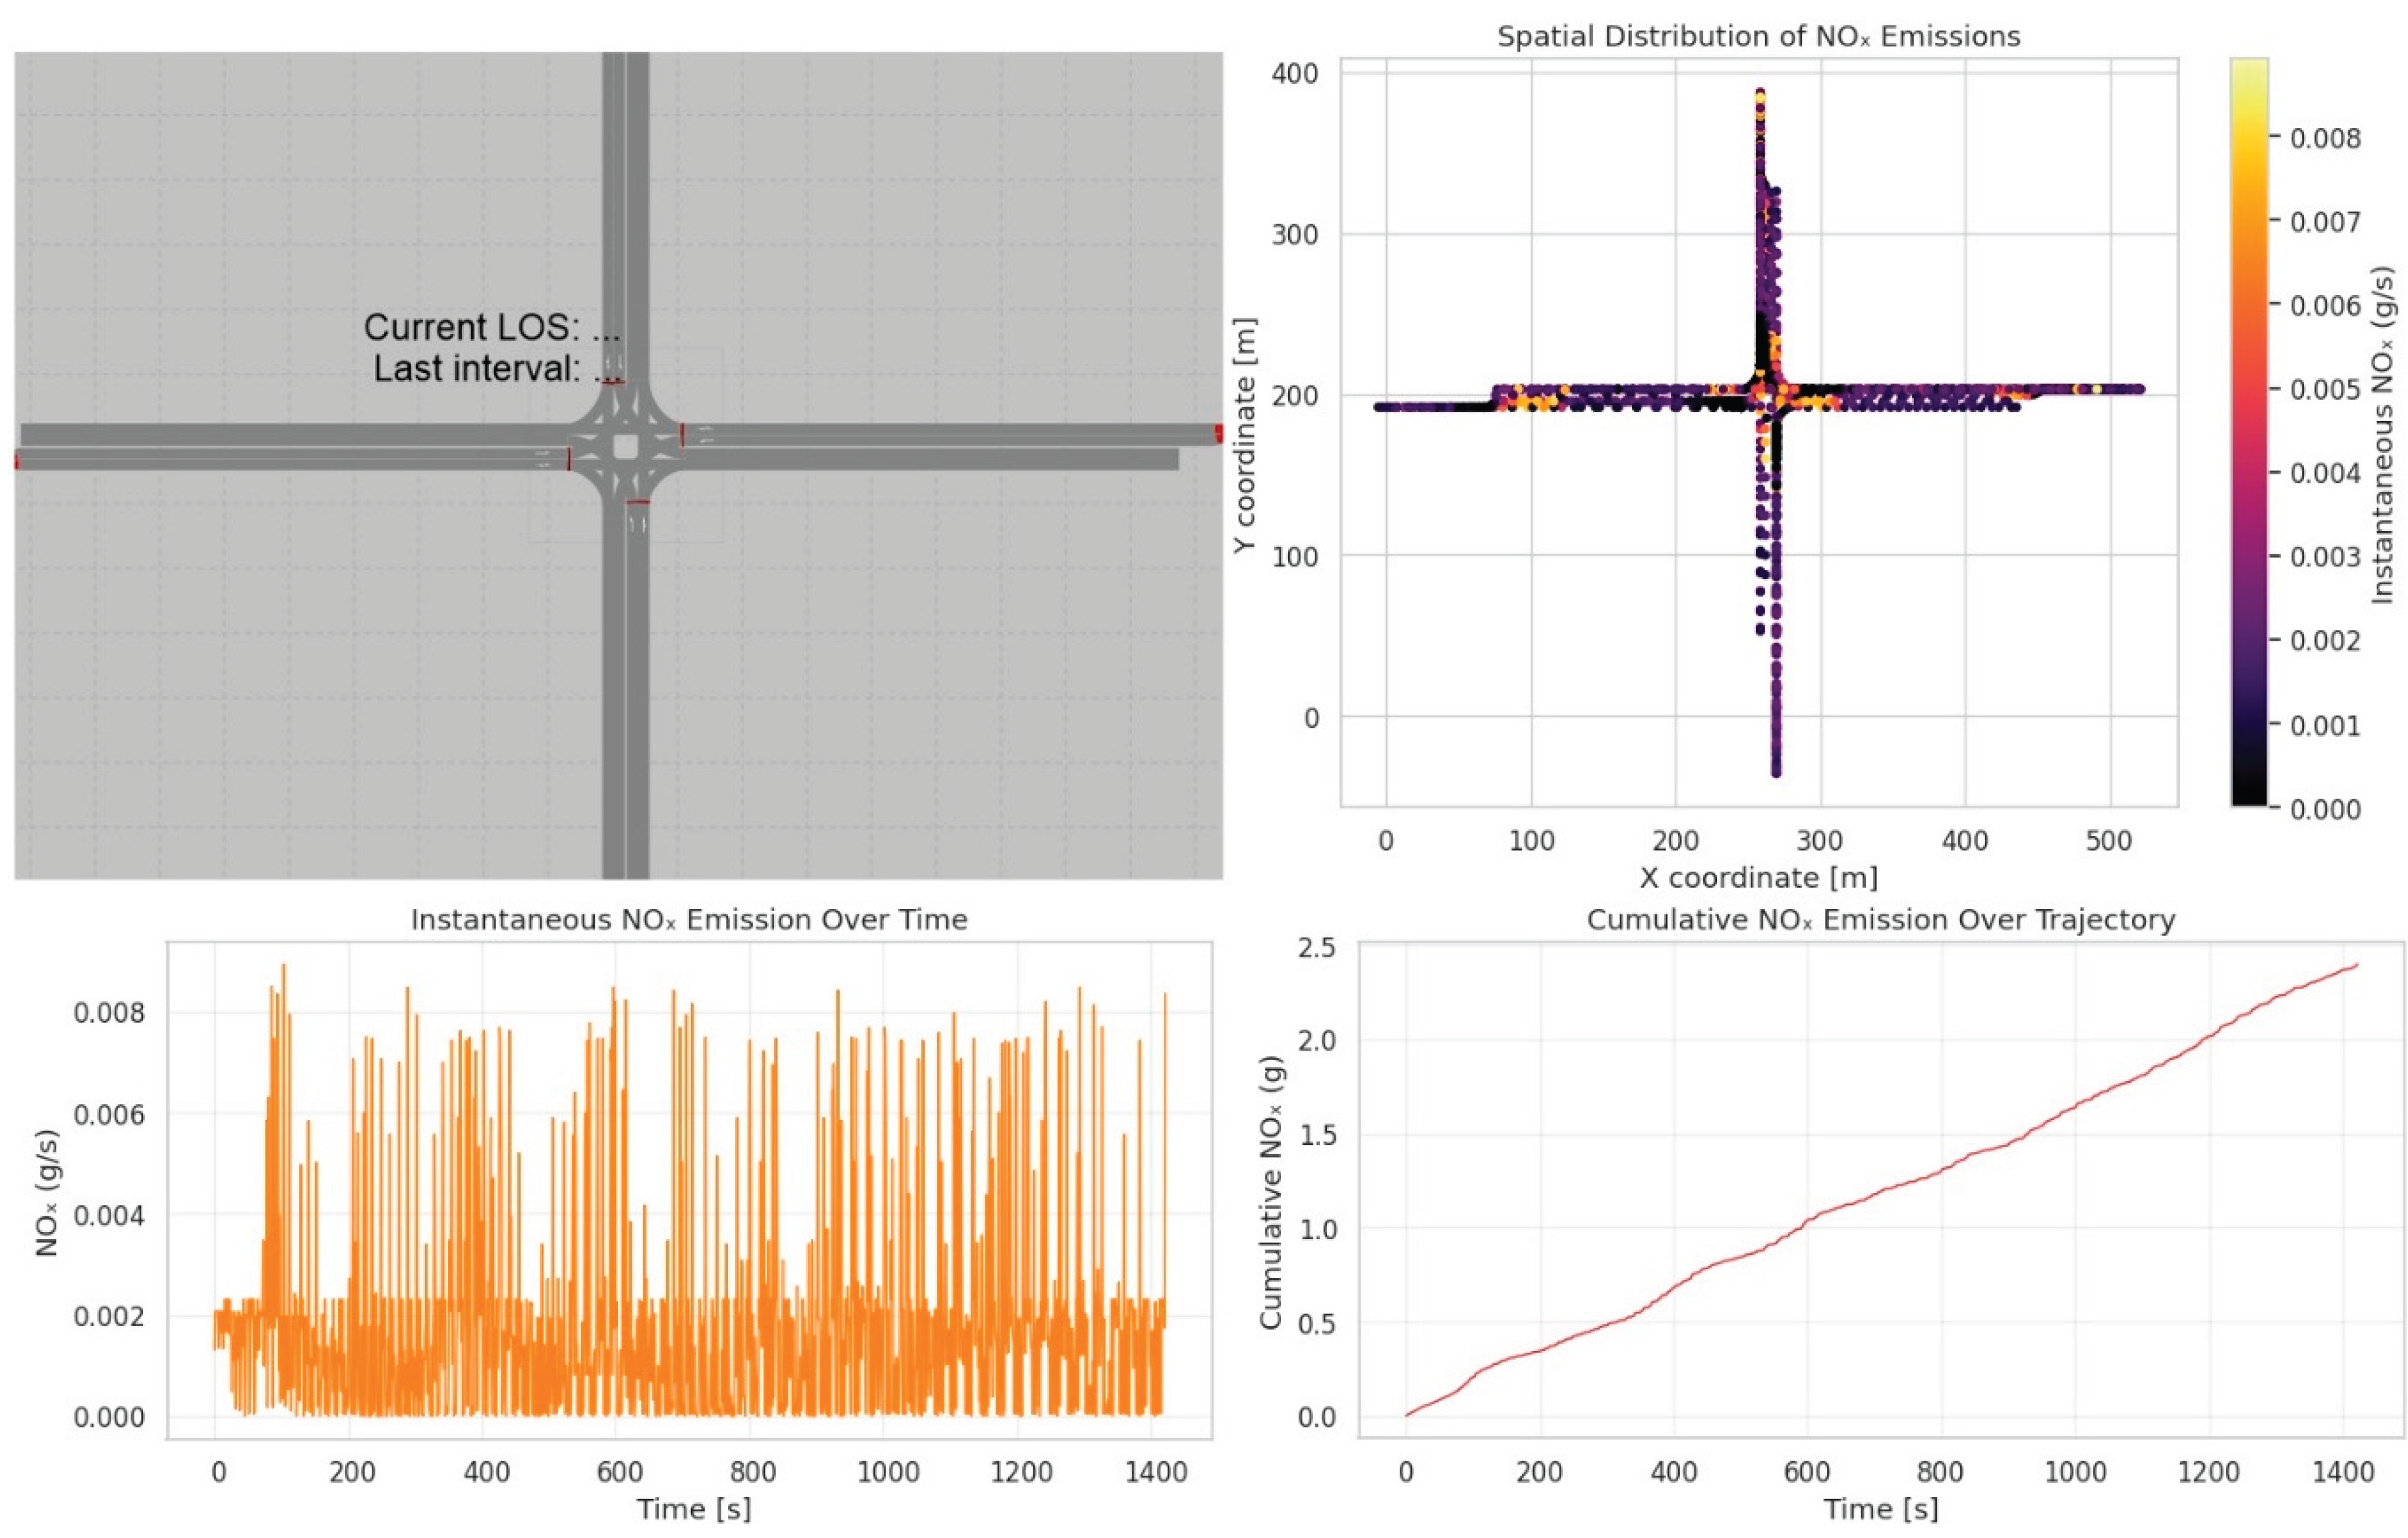

Table 1.
Comprehensive comparison of the performance of the model.
| Model Architecture | R² Score | RMSE [g/s] | MAE [g/s] | Training Time [s] | Application Domain |
|---|---|---|---|---|---|
| Phase-Specific (Cold) | 0.300 | 0.002042 | 0.001456 | 12.3 | Cold-start optimization |
| Phase-Specific (Hot Low-Speed) | 0.511 | 0.002125 | 0.001378 | 28.7 | Urban driving conditions |
| Phase-Specific (Hot High-Speed) | 0.738 | 0.004004 | 0.002156 | 18.4 | Highway driving conditions |
| Multi-Phase Unified XGBoost | 0.545 | 0.004357 | 0.002234 | 45.2 | General-purpose deployment |
| Random Forest Unified | 0.492 | 0.004821 | 0.002567 | 67.8 | Baseline comparison |
| Mixture of Experts | 0.918 | 0.001825 | 0.000892 | 59.4 | High-accuracy multi-phase |
Table 2.
Validation metrics (mean ± standard deviation over 5 runs).
| Scenario | Mean NOₓ [mg/s] | Std NOₓ [mg/s] | Std a_cmd [m/s²] | V_min–V_max [km/h] |
|---|---|---|---|---|
| Urban | 2.130 ± 0.560 | 0.768 ± — | 0.5131 ± — | 0–28.8 |
| Highway | 1.783 ± 1.522 | 1.882 ± — | 0.3319 ± — | 50–77.0 |
| Eco | 1.041 ± 1.299 | 1.434 ± — | 0.4250 ± — | 20–57.8 |
Disclaimer/Publisher’s Note: The statements, opinions and data contained in all publications are solely those of the individual author(s) and contributor(s) and not of MDPI and/or the editor(s). MDPI and/or the editor(s) disclaim responsibility for any injury to people or property resulting from any ideas, methods, instructions or products referred to in the content. |
© 2025 by the authors. Licensee MDPI, Basel, Switzerland. This article is an open access article distributed under the terms and conditions of the Creative Commons Attribution (CC BY) license (http://creativecommons.org/licenses/by/4.0/).
Copyright: This open access article is published under a Creative Commons CC BY 4.0 license, which permit the free download, distribution, and reuse, provided that the author and preprint are cited in any reuse.


