
Submitted:
29 October 2025
Posted:
30 October 2025
You are already at the latest version
Abstract
This paper proposes a Computational Sustainability Framework for assessing vegetation degradation and desertification in arid ecosystems. The framework integrates remote-sensing data, GIS modeling, and multi-criteria decision algorithms to analyze environmental conditions at scale. It consists of four computational phases: (1) data acquisition and preprocessing, (2) feature extraction and normalization, (3) multi-criteria decision modeling using the Analytical Hierarchy Process (AHP), and (4) visualization and validation. The framework was applied to two Saudi protected areas, Al Khunfah and Ḩorrah al-Ḥorra, using Sentinel-2, Landsat-8, and ancillary datasets. Results show that high degradation zones correspond to high BSI (>0.27) and low NDVI (<0.09) with surface temperatures exceeding 48 °C. The AHP model achieved a consistency ratio of 0.0957, confirming reliability, and identified three suitability classes covering approximately 4 000 km² (high), 26 000 km² (moderate), and 6 000 km² (low). The study demonstrates how computational integration of spatial data and decision algorithms can support large-scale environmental monitoring and restoration planning.
Keywords:
computational sustainability
; remote sensing
; GIS
; arid and semi-arid ecosystems
; vegetation degradation assessment
; Analytical Hierarchy Process (AHP)
; data-driven environmental modeling
1. Introduction
Vegetation degradation and desertification represent complex, data-intensive environmental challenges that demand computational solutions capable of integrating diverse spatial, climatic, and ecological inputs. These processes, driven by population growth, unsustainable land use, and climate variability, threaten the long-term sustainability of ecosystems, especially in arid and semi-arid regions [1,2]. In the Arabian Peninsula, where extreme temperature and scarce rainfall already constrain vegetation resilience, degradation is accelerating under the combined effects of overgrazing, land transformation, and rising heat stress [3].
Saudi Arabia’s arid zones, particularly the northern and central regions such as Al Khunfah and Ḩorrah al-Ḥurra Protected Areas, exemplify this environmental vulnerability. These ecologically sensitive reserves are characterized by fragile soils, low rainfall, and fluctuating thermal regimes [4]. Their natural vegetation cover has shown progressive decline in recent decades, influenced by anthropogenic disturbance and climatic shifts [5]. Accurately quantifying and predicting vegetation degradation in such environments requires not only geospatial data but also computational frameworks capable of synthesizing heterogeneous environmental variables into coherent, scalable analytical systems.
Recent advances in remote sensing (RS), geospatial modeling, and environmental computation have enabled large-scale monitoring of vegetation dynamics. Spectral indices such as the Normalized Difference Vegetation Index (NDVI), Bare Soil Index (BSI), and Land Surface Temperature (LST) provide quantitative proxies for vegetation health, soil exposure, and surface heat stress [6]. In parallel, hydrological indicators like Distance to Water/Wadis and climatic datasets help capture spatial dependencies critical to vegetation resilience. However, these datasets differ in structure, scale, and temporal frequency, requiring computational strategies for integration, normalization, and fusion within a unified analytical framework.
Traditional GIS-based studies have primarily relied on static overlays and manual classification techniques, which are limited in scalability and transparency. There remains a need for computational frameworks that automate data preprocessing, implement reproducible decision algorithms, and quantify the relative contribution of each environmental factor to land degradation. Multi-Criteria Decision Analysis (MCDA) methods, particularly the Analytical Hierarchy Process (AHP), offer a systematic way to model environmental complexity by assigning weights to criteria based on their quantitative influence and logical consistency [7]. When embedded within a computational pipeline, AHP transforms expert knowledge and environmental indicators into an algorithmic hierarchy that can be executed, validated, and scaled efficiently.
This study proposes a Computational Sustainability Framework for the integrated assessment of vegetation degradation and desertification in Saudi Arabia’s protected areas. The framework combines remote-sensing data, environmental indices, and multi-criteria decision modeling into a reproducible computational pipeline. It achieves the following objectives:
- Derive key environmental indicators (NDVI, BSI, LST, Distance to Water/Wadis, Soil type, precipitation, and climate variables) from multispectral and thermal satellite imagery and open-source datasets;
- Integrate and normalize these indicators within a modular computational workflow using AHP-based decision modeling to assess their relative influence on degradation; and
- Generate and validate degradation-susceptibility maps delineating areas of high, moderate, and low environmental suitability for restoration.
By reframing the analysis as a computational problem, this work contributes to the growing field of computational sustainability, demonstrating how algorithmic integration of environmental data can enhance reproducibility, accuracy, and scalability in ecosystem monitoring and land management.
2. Related Work
Computational sustainability has emerged as a multidisciplinary field that applies computational models, algorithms, and data-driven systems to address complex environmental challenges such as biodiversity loss, water scarcity, and land degradation [8]. Within this context, the integration of geospatial computing, remote sensing, and machine-assisted decision frameworks has become central to understanding vegetation dynamics and guiding restoration in data-scarce arid regions.
2.1. Remote Sensing and Environmental Indicators
Remote sensing (RS) provides scalable, repeatable, and objective access to environmental indicators essential for monitoring vegetation health and land degradation in arid ecosystems. Through multispectral and thermal imagery from sensors such as Sentinel-2 and Landsat-8, RS enables quantitative estimation of biophysical variables that reflect vegetation vigor, soil exposure, and surface energy balance. Among these, the Normalized Difference Vegetation Index (NDVI), Bare Soil Index (BSI), and Land Surface Temperature (LST) are among the most widely adopted. NDVI is used to infer photosynthetic activity and vegetation density, BSI characterizes the degree of soil exposure and degradation intensity, and LST indicates surface heat fluxes associated with evapotranspiration and vegetation stress [9,10].
The combined analysis of these indicators provides valuable insight into vegetation–soil–climate interactions. For example, areas showing low NDVI, high BSI, and elevated LST typically correspond to degraded surfaces with sparse vegetation cover and reduced soil moisture. Integrating such indicators enhances the ability to detect spatial heterogeneity and temporal shifts in ecological conditions. However, many existing RS-based studies rely on univariate analysis, examining single indices independently without modeling their interrelationships [11,12]. This approach limits interpretability and fails to capture the nonlinear dynamics that characterize desertification processes in hyper-arid environments.
To overcome these constraints, recent research has advanced toward multi-index fusion, time-series analysis, and machine-assisted modeling that combine NDVI, BSI, and LST to produce integrated degradation maps [13,14]. These approaches have been enhanced through machine-learning frameworks that leverage multi-temporal satellite data for detecting land degradation and desertification dynamics [15]. Increasingly, such computational approaches are being linked with Multi-Criteria Decision Analysis (MCDA) frameworks such as the Analytical Hierarchy Process (AHP), which can weight RS-derived indicators according to their relative importance in environmental degradation assessment [16]. This integration strengthens decision-support systems by unifying quantitative spectral data with expert-driven weighting, enabling consistent, scalable, and interpretable environmental modeling across large and heterogeneous landscapes.
2.2. Geospatial Modeling and Data Integration
Geospatial modeling has evolved from the static overlay operations of early Geographic Information Systems (GIS) to sophisticated, data-intensive analytical frameworks capable of representing complex environmental processes. Traditional GIS applications functioned primarily as cartographic containers, managing discrete spatial layers of soil, vegetation, and climate [16]. Contemporary research, however, emphasizes on the dynamic integration of remote-sensing, climatic, and terrain data through automated workflows that enable multiscale environmental analysis [13,17].
This methodological shift is driven by the convergence of machine-learning algorithms, spatial statistics, and high-performance computing within GIS environments. Data pipelines now support continuous ingestion, preprocessing, and normalization of multi-temporal imagery from platforms such as Sentinel-2 and Landsat-8. These data are harmonized using reproducible scripts and parameterized models that fuse spectral, thermal, and topographic indicators into cohesive geospatial layers. Such integration enhances analytical reproducibility and scalability, allowing environmental models to be re-executed across different spatial contexts with minimal manual intervention.
Recent advances in computational geospatial intelligence have introduced adaptive modeling strategies, where spatial relationships are dynamically recalibrated using feedback from model validation and field observations [14]. This approach transforms GIS from a descriptive mapping tool into a predictive, self-adapting analytical platform, a key enabler for sustainability research in heterogeneous, data-scarce landscapes. Yet, many current workflows remain semi-manual, relying on static thresholds and expert-driven layer weighting that restrict automation and cross-regional transferability.
The framework proposed in this study addresses these limitations by embedding GIS within a Computational Sustainability Framework, coupling geospatial automation with decision-analytic algorithms. This design enables transparent, repeatable environmental modeling, supporting large-scale restoration planning through the fusion of spatial intelligence, algorithmic precision, and ecological insight.
2.3. Multi-Criteria Decision Algorithms
Environmental decision-making in arid ecosystems requires integrating diverse variables,vegetation cover, soil exposure, surface temperature, and climatic stress,that interact nonlinearly across spatial and temporal scales. Multi-Criteria Decision Analysis (MCDA) provides a formal computational structure for synthesizing such heterogeneous data, enabling transparent prioritization of environmental indicators. It is particularly effective when both empirical measurements and expert judgment are required to evaluate environmental degradation or restoration potential [16].
Among MCDA techniques, the Analytical Hierarchy Process (AHP) remains one of the most widely applied due to its ability to translate expert or empirical understanding into mathematical pairwise comparisons [18]. The AHP framework generates normalized weighting factors through eigenvector calculations and validates their logical consistency using the Consistency Ratio (CR ≤ 0.1), ensuring reliability in multi-criteria weighting.
Recent advances have extended MCDA into hybrid computational environments that combine it with machine learning and dynamic modeling. For example, Moradi et al [19] developed an integrated approach for land-degradation risk assessment in arid and semi-arid ecosystems using Support Vector Machines (SVM) and an enhanced eDPSIR/ANP (Analytic Network Process) model, highlighting the value of combining algorithmic prediction with structured decision logic. Similarly, Yagoub et al. [7] applied an AHP–GIS framework to evaluate threats to oasis ecosystems in the United Arab Emirates, demonstrating how expert-weighted indicators derived from remote-sensing data can guide conservation planning.
However, most applications still implement AHP or ANP as stand-alone GIS modules, dependent on manual data entry and static weighting matrices. This restricts reproducibility and limits the integration of real-time or multi-temporal remote-sensing inputs. The Computational Sustainability Framework proposed in this study embeds AHP within an automated geospatial pipeline, coupling multi-criteria weighting with continuous data updates and validation. This transforms AHP from a descriptive decision tool into a dynamic, adaptive weighting engine for large-scale environmental modeling.
2.4. Computational Sustainability Frameworks
Computational sustainability frameworks represent an emerging class of integrative, data-driven systems for modeling environmental complexity. They unify remote-sensing analytics, geospatial modeling, and decision-support algorithms into coherent computational architectures that enhance scalability, reproducibility, and interpretability in sustainability research [8]. By combining automated data fusion with algorithmic reasoning, these frameworks extend traditional environmental analysis beyond descriptive mapping toward adaptive, model-based understanding.
In arid and semi-arid ecosystems, where data scarcity and environmental heterogeneity are major constraints, such frameworks have proven especially valuable. They enable the fusion of spectral, climatic, and hydrological indicators to detect land degradation and evaluate ecosystem resilience. Moradi et al. [19] demonstrated how integrating multi-criteria decision methods such as AHP and ANP with machine-learning models improved predictive precision in desertification assessment, while Berdyyev et al. [14] used Sentinel-2-based computational workflows to automate large-scale monitoring of desertification dynamics. Collectively, these studies illustrate how computational sustainability approaches facilitate transparent and transferable environmental analytics across spatial and temporal scales.
However, research applying such integrative frameworks to Saudi Arabia’s protected regions remains limited. Existing regional efforts often emphasize static cartographic mapping or isolated index-based assessments, offering little algorithmic transparency or reproducible validation. Addressing this gap requires adopting computational sustainability paradigms capable of linking automated preprocessing, multi-criteria modeling, and quantitative evaluation to support evidence-based environmental management in arid landscapes.
3. Study Area and Data
The study focuses on two major protected areas in northern Saudi Arabia, Al Khunfah and Ḩorrah al-Ḥorra, both managed by the National Center for Wildlife (NCW) (Figure 1). Together, they encompass more than 36,800 km², representing some of the largest natural conservation zones in the Kingdom. These areas were selected for computational analysis due to their ecological sensitivity, data availability, and policy relevance within Saudi Arabia’s Vision 2030 sustainability agenda [20,21].
Al Khunfah Protected Area, located in the northern part of the Tabuk Region (approximately 26°30′–28°00′ N, 39°00′–42°00′ E), covers about 27,187 km². Its terrain comprises basaltic plateaus, gravel plains, and seasonal wadis that support sparse desert vegetation. The climate is arid to hyper-arid, with annual rainfall seldom exceeding 100 mm, and summer temperatures frequently surpassing 40 °C.
Ḩorrah al-Ḥorra Protected Area, situated northeast of Al Khunfah near the Al Jouf Region, spans roughly 9,672 km². It features basaltic lava fields, sandstone ridges, and ephemeral drainage systems. Vegetation follows a desert-steppe pattern dominated by perennial shrubs and short-lived annual herbs after seasonal rainfall.
Both reserves form part of the Northern Arabian Desert ecoregion, known for its fragile ecology and high biodiversity value. Despite their legal protection, these areas face increasing anthropogenic pressures, such as overgrazing, wood collection, and off-road vehicle activity, resulting in vegetation loss and soil exposure. This makes them suitable test sites for developing and validating computational frameworks that model vegetation degradation and desertification processes at a regional scale.
3.2. Data Sources
The computational framework integrates multi-source environmental datasets, combining optical, thermal, topographic, and climatic information to generate a unified data stack for vegetation degradation assessment (Table 1).
Each dataset was selected based on its spatial resolution, temporal coverage, and open-data accessibility to ensure reproducibility and scalability of the computational workflow.
Primary datasets include Sentinel-2 MSI imagery (10–20 m) for deriving spectral indices such as NDVI and BSI; Landsat-8 OLI/TIRS imagery for estimating LST; and CHIRPS v2.0 rainfall data for long-term precipitation analysis.
Static datasets such as the FAO Soil Map of the World and ESA CCI Land-Cover dataset were used for soil classification and vegetation/land-use categorization, respectively. The SRTM DEM (30 m) was used to extract topographic derivatives, including slope, elevation, and distance to wadis, which are critical hydrological indicators in arid environments.
Together, these datasets form a comprehensive, multi-dimensional foundation for modeling the biophysical, thermal, and hydrological dynamics that influence vegetation health and degradation across the study areas. Their integration supports a modular, scalable, and repeatable computational workflow, ensuring reproducibility and adaptability for large-scale sustainability applications.
3.3. Environmental Variables
Seven environmental indicators derived from the integrated datasets were used to model vegetation degradation and desertification susceptibility. These indicators represent the essential dimensions of environmental stress, biophysical, thermal, and hydrological, across the study areas.
Each variable contributes distinct information to the computational model:
- NDVI (Normalized Difference Vegetation Index): Quantifies vegetation vigor and canopy density, enabling detection of healthy versus degraded areas.
- BSI (Bare Soil Index): Highlights soil exposure and erosion-prone surfaces associated with vegetation decline.
- LST (Land Surface Temperature): Indicates surface heat stress, which strongly correlates with vegetation loss in arid climates.
- Precipitation: Represents annual rainfall variability as a proxy for water availability and drought intensity.
- Soil Type: Defines textural and fertility differences that affect root stability and plant productivity.
- Land Cover: Describes spatial distribution of vegetation, bare ground, and anthropogenic surfaces.
- Distance to Wadis: Measures proximity to ephemeral water channels that enhance soil moisture and promote localized vegetation growth.
All variables were standardized to a 10 m spatial resolution and normalized to a 0–1 scale using min–max transformation.
Subsequently, each indicator was reclassified into three suitability levels, low, moderate, and high, reflecting the degree of ecological stability and degradation susceptibility. These standardized layers formed the computational input matrix for the multi-criteria decision model described in the following section.
3.4. Data Preprocessing and Computational Environment
All preprocessing operations were conducted within a reproducible computational workflow integrating Google Earth Engine (GEE) and ArcGIS Pro environments. These platforms enabled automated retrieval, correction, and harmonization of heterogeneous environmental datasets (Table 1) prior to analytical modeling. Atmospheric correction and cloud masking were applied to Sentinel-2 and Landsat-8 imagery to minimize atmospheric noise and ensure radiometric consistency. All raster datasets were resampled to a uniform 10 m spatial resolution, reprojected to WGS 84 / UTM Zone 38N, and clipped to the boundaries of the Al Khunfah and Ḩorrah al-Ḥurra Protected Areas to maintain consistency across all datasets.
Spectral indices (NDVI, BSI, and LST) were computed using standard band-based algorithms implemented within GEE’s JavaScript API. Hydrological parameters such as Distance to Wadis were deriven through Euclidean-distance and flow-accumulation analyses from the SRTM DEM. All derived variables were normalized to a 0–1 scale using min–max transformation to ensure comparability between biophysical, thermal, and hydrological layers.
The final output was a structured multi-layer geospatial data stack representing seven standardized environmental indicators. This dataset served as the computational foundation for the Multi-Criteria Decision Analysis (MCDA) framework implemented through the Analytical Hierarchy Process (AHP). The standardized preprocessing pipeline ensured data integrity, algorithmic scalability, and full reproducibility across modeling stages.
The overall methodological workflow is summarized in Figure 2. This figure illustrates how datasets from multiple sources (FAO, ESA, CHIRPS, Sentinel-2, Landsat-8, DEM) were integrated into a computational pipeline that produced the final suitability map used in the AHP model.
4. Computational Sustainability Framework
This study introduces a Computational Sustainability Framework that integrates environmental data, geospatial processing, and decision-modeling algorithms within a unified analytical pipeline for assessing vegetation degradation and desertification. As illustrated in Figure 3, the framework operates through four computational phases that progressively transform raw geospatial data into validated, interpretable outputs.
Phase 1: Data Acquisition and Processing
Multi-source environmental datasets were collected and harmonized for integration. Sentinel-2 and Landsat-8 imagery provided optical and thermal data, CHIRPS contributed precipitation records, and SRTM supplied topographic derivatives. Atmospheric correction, cloud masking, and reprojection to UTM Zone 38 N were automated through Google Earth Engine (GEE) and ArcGIS Pro ModelBuilder, ensuring consistency and minimizing manual intervention.
Phase 2: Feature Extraction and Normalization
Key indicators, such as NDVI, BSI, and LST, were derived from the processed imagery, while topographic (distance to wadis, slope, elevation), soil, and climatic parameters were extracted from ancillary datasets. All variables were resampled to 10 m and normalized using min–max scaling (0–1). The result was a standardized multidimensional feature matrix representing vegetation, soil, climatic, and terrain conditions.
Phase 3: Multi-Criteria Decision Modeling
The standardized indicators were integrated using the Analytical Hierarchy Process (AHP) to determine the relative contribution of each environmental factor to vegetation degradation. Pairwise comparisons were performed following Saaty’s 1–9 scale, where higher values denote stronger influence on degradation susceptibility.
The AHP consistency was evaluated using the Consistency Index (CI) and Consistency Ratio (CR) as per Salomon and Gomes [22]:
where n is the number of indicators, λmax is the maximum eigenvalue of the pairwise matrix, and RI is the random inconsistency index. A CR ≤ 0.10 confirms logical coherence in expert judgments.
The verified weights were applied within a Weighted Overlay Analysis (WOA) using ArcGIS Pro to produce a composite degradation-susceptibility surface, classified into high, moderate, and low suitability zones.
Phase 4: Computational Validation and Visualization
Model reliability was assessed through correlation analysis between NDVI and LST (r = –0.72) and through sensitivity testing by varying AHP weights ±10 %. Visualization was performed using ArcGIS Pro, QGIS, and Python libraries (Matplotlib, GeoPandas). The final deliverables included high-resolution susceptibility maps and quantitative statistics supporting transparent interpretation and reproducibility.
5. Results and Analysis
5.1. Overview of Computational Implementation
The computational framework was executed using Google Earth Engine (GEE) and ArcGIS Pro, integrating multi-source environmental datasets within a reproducible analytical workflow. Seven indicators (soil type, land cover, annual precipitation, NDVI, LST, BSI, and distance to wadis) were used to represent the biophysical, climatic, and hydrological dimensions influencing vegetation stability (Table 1). Each dataset was standardized to a 10 m spatial resolution and projected to WGS 84 / UTM Zone 38 N to ensure spatial consistency. The indices correspond to the January–April period, the seasonal window of maximum vegetation variability.
To translate environmental parameters into degradation risk, all thematic layers were reclassified into three suitability classes (High, Moderate, and Low) representing levels of vegetation health and ecological stability (Table 2).
The Analytical Hierarchy Process (AHP) was used to determine the relative influence of each indicator. Pairwise comparisons were conducted using Saaty’s 1–9 scale, and the resulting weights were validated through the Consistency Ratio (CR ≤ 0.10) to ensure logical coherence in expert judgments. Detailed results of the comparison matrix and normalized weights are presented in Table 4 and Table 5 (Section 5.2).
The validated weights were integrated within the Weighted Overlay Analysis (WOA) module in ArcGIS Pro, generating a composite Vegetation Degradation and Desertification Susceptibility Map. The model combined all normalized raster layers according to their assigned weights, producing a spatial classification of the study areas into High, Moderate, and Low suitability zones.
The resulting spatial output (Figure 4) reveals clear differentiation between zones of ecological resilience and areas prone to degradation. High-suitability zones are concentrated along vegetated wadis and depressions, reflecting stable micro-environments, while low-suitability zones occur across exposed plateaus and disturbed grazing lands. Statistical summaries indicate that moderate-suitability areas dominate (≈45–50 %), followed by high (25–30 %) and low (20–25 %) suitability classes.
Correlation analysis between NDVI, LST, and BSI revealed a strong inverse relationship (r = –0.72), confirming that surface-temperature stress and soil exposure are principal drivers of vegetation loss. These findings demonstrate the efficacy of the Computational Sustainability Framework in integrating multi-source data and decision-modeling algorithms to delineate degradation patterns across arid ecosystems.
5.2. Spatial and Analytical Results
The outputs generated by the Computational Sustainability Framework, encompassing data preprocessing, feature extraction, normalization, and decision modeling, produced a coherent suite of spatial layers and analytical maps that describe vegetation degradation and desertification dynamics across Al Khunfah and Ḩorah al-Ḥorah Protected Areas.
Each of the seven environmental indicators, BSI, NDVI, LST, soil type, land cover, precipitation, and distance to wadis, was converted into a thematic raster normalized to 10 m resolution and classified into three degradation-suitability categories (High, Moderate, Low).
Spectral Indicators
The Bare Soil Index (BSI) (Figure 5a) was derived from Sentinel-2 imagery using the short-wave infrared (SWIR), red, blue, and near-infrared (NIR) bands, following Equation (3) [23] :
Values ranged from –1 to +1, with higher BSI indicating bare, highly reflective soil and degraded surfaces. Low BSI (< 0.177) represented stable vegetated zones; 0.178 – 0.275 indicated moderately exposed surfaces; and > 0.276 denoted severe degradation. Extensive high-BSI zones in southern Ḩorah al-Ḥorah confirm active desertification and soil exposure.
The Normalized Difference Vegetation Index (NDVI) (Figure 5b) was computed from the Sentinel-2 near-infrared (NIR) and red bands using Equation (4) ) [23] :
NDVI values below 0.079 indicate severely degraded areas, values between 0.08 and 0.116 represent transitional zones with sparse vegetation, and values above 0.117 correspond to healthy vegetation cover.
Spatial comparison of NDVI and BSI layers revealed a strong inverse pattern, low NDVI zones overlap with high BSI surfaces, highlighting the complementary sensitivity of both indices to vegetation stress and soil exposure.
In northern Al Khunfah, small patches of high NDVI reflect localized moisture accumulation along wadis and depressions.
Land-Cover, Soil, and Climate Factors
The land-cover layer (Figure 6c), derived from ESA CCI, shows a landscape dominated by bare or sparsely vegetated surfaces, interspersed with shrubland and grassland patches concentrated around wadis and settlement fringes.
Vegetation distribution is discontinuous and moisture-dependent, emphasizing the hydrological control on plant persistence.
The soil map (Figure 6d) illustrates a heterogeneous distribution of sandy, calcareous, loamy, gravelly, and clayey soils characteristic of the Arabian Shield.
Sandy and calcareous soils, dominant in southern Ḩorah al-Ḥorah, are highly permeable and nutrient-poor, making them prone to erosion and vegetation loss.
Loamy and alluvial soils near wadis exhibit higher fertility and support temporary vegetation growth following rainfall events.
Climatic and thermal patterns further clarify degradation drivers. The precipitation layer (Figure 7e), based on CHIRPS data, shows annual rainfall ranging from < 100 mm in the south to > 150 mm in isolated northern pockets, reflecting the arid north-south gradient typical of this region.
The Land Surface Temperature (LST) map (Figure 7f), generated from Landsat-8 TIRS data, reveals temperatures between 45 °C and 49.5 °C.
High-LST zones align with high-BSI and low-NDVI areas, indicating thermal stress and surface desiccation as dominant factors in vegetation decline.
Hydrological Indicator
The Distance-to-Wadis layer (Figure 8g) was derived via Euclidean distance analysis in ArcGIS Pro, measuring each pixel’s proximity to the nearest ephemeral channel.
Proximity to wadis correlates positively with vegetation health, as these drainage systems facilitate soil moisture recharge and reduce degradation risk.
AHP-Based Decision Modeling
Pairwise comparisons were conducted among the seven environmental indicators using Saaty’s 1–9 scale to evaluate their relative influence on vegetation degradation and desertification susceptibility.
The resulting pairwise comparison matrix is presented in Table 3, and the normalized weights derived from it are summarized in Table 4.

Table 3.
Pairwise comparison matrix.
| Criteria | NDVI | BSI | LST | Soil Type | Distance to Wadis | Climate Observation | Landcover |
| NDVI | 1 | 1 | 3 | 6 | 5 | 4 | 8 |
| BSI | 1 | 1 | 5 | 7 | 4 | 5 | 7 |
| LST | 0.33 | 0.20 | 1 | 4 | 5 | 3 | 6 |
| Soil Type | 0.17 | 0.14 | 0.25 | 1 | 1 | 3 | 6 |
| Distance to Wadis | 0.20 | 0.25 | 0.20 | 1 | 1 | 1 | 7 |
| Climate Observation | 0.25 | 0.20 | 0.33 | 0.33 | 1 | 1 | 3 |
| Landcover | 0.13 | 0.14 | 0.17 | 0.17 | 0.14 | 0.33 | 1 |
Table 4.
Analytical Hierarchy Process (AHP) ranking, weighting, and sub-criteria for vegetation degradation assessment.
Table 4.
Analytical Hierarchy Process (AHP) ranking, weighting, and sub-criteria for vegetation degradation assessment.
| Criteria | Weight (%) | Rank | Sub-Criterion | Score |
|
BSI (value) |
33.6 |
1 |
< 0.177 | 3 |
| 0.178 – 0.275 | 2 | |||
| > 0.276 | 1 | |||
|
NDVI (value) |
29.1 |
2 | < 0.079 | 1 |
| 0.08 – 0.116 | 2 | |||
| > 0.117 | 3 | |||
|
LST () |
15.9 |
3 |
< 45 | 3 |
| 45-49 | 2 | |||
| > 49 | 1 | |||
| Soil Type (Class) |
7.3 |
4 |
Sandy | 1 |
| Calcareous | 3 | |||
| Loamy / alluvial | 3 | |||
| Gravelly / Shallow rocky | 1 | |||
| Clayey | 2 | |||
| Distance to Wadis (meter) |
6.7 |
5 |
< 1000 | 3 |
| 1000 – 3000 | 2 | |||
| > 3000 | 1 | |||
| Climate Observation (mm) |
5.2 |
6 |
< 100 | 3 |
| 100 – 150 | 2 | |||
| > 150 | 1 | |||
|
Landcover (class) |
2.2 |
7 |
Tree Cover | 3 |
| Shrubland | 3 | |||
| Grassland | 2 | |||
| Cropland | 2 | |||
| Built-Up | 1 | |||
| Bare/sparse vegetation | 1 |
Composite Suitability Mapping
A Multi-Criteria Decision Analysis (MCDA) was performed using the AHP-derived weights (Table 4) to quantify the influence of each indicator, and the criteria were subsequently integrated within a Geographical Information System (GIS) environment to quantify and spatially analyze the influence of each criterion.
BSI, NDVI, and LST emerged as dominant predictors of vegetation degradation, with weights of 33.6 %, 29.1 %, and 15.9 %, respectively.
Soil type, distance to wadis, climate, and land cover contributed 7.3 %, 6.7 %, 5.2 %, and 2.2 %.
The computed Consistency Ratio (CR = 0.0957) falls below 0.10, confirming that the expert judgments used in the weighting process were logically consistent and statistically reliable.
The weighted layers were integrated in ArcGIS Pro using the Weighted Overlay Analysis (WOA) module, producing a composite Vegetation Degradation and Desertification Susceptibility Map (Figure 4).
The final classification identifies three suitability zones that represent distinct levels of ecological resilience. High-suitability zones (green) occur mainly in northeastern Al Khunfah and central-north Ḩorah al-Ḥorah, where dense vegetation and proximity to wadis support micro-ecological stability. Moderate-suitability areas (yellow) dominate the intermediate terrain with mixed soil types and partial vegetation cover, suggesting potential for restoration through targeted interventions such as controlled grazing and native species reseeding. Low-suitability zones (red) occur in southern Ḩorah al-Ḥorah and western Al Khunfah, characterized by low NDVI, high BSI and LST, and greater distances from wadis, signifying severe degradation and erosion risk.
Area statistics (Figure 9) indicate that moderate-suitability zones dominate the landscape, covering approximately 26,000 km², followed by low-suitability zones (~6,000 km²) and high-suitability zones (~4,000 km²). The spatial distribution demonstrates that over two-thirds of the protected areas retain moderate ecological potential, emphasizing the value of computational approaches for prioritizing restoration actions.
Overall, the findings confirm that vegetation degradation is primarily driven by the interaction between surface temperature, soil exposure, and hydrological distance. The integration of multi-source data through the Computational Sustainability Framework provided a reproducible and interpretable model that accurately characterizes arid-land degradation patterns. The resulting outputs serve as decision-support tools for ecological management under Saudi Arabia’s Vision 2030 environmental sustainability agenda.
6. Discussion
The results confirm that the Computational Sustainability Framework provides a reliable and scalable approach for integrating environmental indicators into an interpretable decision model. By combining optical, thermal, topographic, and climatic data within a reproducible computational workflow, the framework successfully captured the spatial variability of vegetation degradation across two large arid reserves. Its modular design enabled efficient data acquisition, feature extraction, and analytical modeling with minimal human intervention, an essential step toward automation in sustainability-oriented computing.
The observed inverse relationship between NDVI and LST (r = –0.72) demonstrates that thermal stress and soil exposure are primary drivers of vegetation decline in arid Saudi ecosystems. This finding aligns with global patterns observed in desert and semi-arid landscapes, where rising land surface temperatures accelerate evapotranspiration and inhibit vegetation recovery. The contrast between northern Al Khunfah and southern Ḩorah al-Ḥorah further highlights the role of local hydrology and soil composition in mediating resilience. Areas near wadis, where moisture retention is higher, showed improved vegetation stability and lower degradation risk, supporting the model’s inclusion of hydrological distance as a key criterion.
From a computational standpoint, this study demonstrates how multi-criteria decision analysis (MCDA) can be enhanced by integrating geospatial automation tools such as Google Earth Engine (GEE) and ArcGIS Pro ModelBuilder. The use of AHP provided a transparent weighting mechanism that translates expert knowledge into quantifiable parameters while maintaining consistency through the calculation of the Consistency Ratio (CR ≤ 0.10). This transparency supports reproducibility, allowing the framework to be easily adapted for different regions or environmental targets with minimal parameter adjustments.
The framework’s outputs have direct implications for sustainable land management under Saudi Arabia’s Vision 2030 environmental goals. The degradation-susceptibility maps serve as a decision-support tool for identifying priority zones for ecological restoration. High- and moderate-suitability areas identified by the model correspond to regions where restoration interventions, such as native species reseeding, erosion control, and moisture-retention structures, are likely to be most effective. The results thus provide an operational basis for aligning computational modeling with national sustainability strategies.
While the model demonstrates high reliability, some limitations remain. The temporal scope of the data, restricted to a single seasonal period, may not fully capture interannual variability in vegetation behavior. Additionally, expert-based weighting in the AHP introduces a degree of subjectivity that could be minimized through machine learning–based calibration or ensemble weighting methods. Future work should explore integrating UAV-derived high-resolution data and temporal change detection algorithms to improve predictive accuracy and monitor the long-term effectiveness of restoration efforts.
Overall, the study advances the role of computational frameworks in environmental sustainability by establishing a transparent, reproducible, and scalable workflow. It demonstrates that algorithmic modeling can extend beyond environmental monitoring to serve as a foundation for data-driven policy formulation and adaptive ecosystem management in arid regions.
7. Conclusions
This study demonstrates that the proposed Computational Sustainability Framework, built upon GIS-based multi-criteria decision analysis (MCDA) and the Analytical Hierarchy Process (AHP), offers a systematic and reproducible approach for assessing vegetation degradation and desertification risk in arid environments. By integrating multi-source satellite data, including spectral indices (NDVI, BSI, LST) and environmental parameters such as soil type, land cover, precipitation, and hydrological proximity, the framework provides a holistic spatial evaluation of ecological suitability across Al Khunfah and Ḩorah al-Ḥorah Protected Areas.
The resulting suitability map reveals that most of the landscape falls under moderate suitability, representing transitional zones where vegetation remains partially degraded but retains ecological potential. High-suitability zones, mainly concentrated in the northern and central parts of the reserves, indicate stable vegetation and favorable soil–moisture interactions, offering opportunities for targeted restoration. In contrast, low-suitability zones, primarily in southern Ḩorah al-Ḥorah, reflect severe degradation conditions associated with high surface temperatures and extensive soil exposure.
Overall, the findings confirm that integrating geospatial analytics with computational modeling provides a scalable, transparent, and data-driven method for identifying and prioritizing restoration areas in arid ecosystems. The framework not only strengthens the scientific basis for sustainable land management but also supports national environmental initiatives under Saudi Arabia’s Vision 2030, particularly those related to rangeland protection, biodiversity enhancement, and ecosystem resilience. Future extensions of this framework could incorporate temporal monitoring and machine-learning-based weighting to enhance prediction accuracy and inform adaptive restoration strategies at broader spatial scales.
References
- D’Odorico, P.; Bhattachan, A.; Davis, K.F.; Ravi, S.; Runyan, C.W. Global Desertification: Drivers and Feedbacks. Advances in Water Resources 2013, 51, 326–344. [Google Scholar] [CrossRef]
- Collins, M.K.; Magle, S.B.; Gallo, T. Global Trends in Urban Wildlife Ecology and Conservation. Biological Conservation 2021, 261, 109236. [Google Scholar] [CrossRef]
- Sayed, O.H.; Masrahi, Y.S. Climatology and Phytogeography of Saudi Arabia: A Review. Arid Land Research and Management 2023, 37, 311–368. [Google Scholar] [CrossRef]
- Elhag, M. Evaluation of Different Soil Salinity Mapping Using Remote Sensing Techniques in Arid Ecosystems, Saudi Arabia. Journal of Sensors 2016, 2016, 1–8. [Google Scholar] [CrossRef]
- Chouari, W. Assessment of Vegetation Cover Changes and the Contributing Factors in the Al-Ahsa Oasis Using Normalized Difference Vegetation Index (NDVI). Regional Sustainability 2024, 5, 100111. [Google Scholar] [CrossRef]
- Hasan, S.S.; Alharbi, O.A.; Alqurashi, A.F.; Fahil, A.S. Assessment of Desertification Dynamics in Arid Coastal Areas by Integrating Remote Sensing Data and Statistical Techniques. Sustainability 2024, 16, 4527. [Google Scholar] [CrossRef]
- Yagoub, M.M.; AlSumaiti, T.; Tesfaldet, Y.T.; AlArfati, K.; Alraeesi, M.; Alketbi, M.E. Integration of Analytic Hierarchy Process (AHP) and Remote Sensing to Assess Threats to Preservation of the Oases: Case of Al Ain, UAE. Land 2023, 12, 1269. [Google Scholar] [CrossRef]
- Gomes, C.; Dietterich, T.; Barrett, C.; Conrad, J.; Dilkina, B.; Ermon, S.; Fang, F.; Farnsworth, A.; Fern, A.; Fern, X.; et al. Computational Sustainability: Computing for a Better World and a Sustainable Future. Commun. ACM 2019, 62, 56–65. [Google Scholar] [CrossRef]
- Pettorelli, N.; Vik, J.O.; Mysterud, A.; Gaillard, J.-M.; Tucker, C.J.; Stenseth, N. Chr. Using the Satellite-Derived NDVI to Assess Ecological Responses to Environmental Change. Trends in Ecology & Evolution 2005, 20, 503–510. [Google Scholar] [CrossRef]
- Sobrino, J.A.; Jiménez-Muñoz, J.C.; Paolini, L. Land Surface Temperature Retrieval from LANDSAT TM 5. Remote Sensing of Environment 2004, 90, 434–440. [Google Scholar] [CrossRef]
- Zolfaghari, F.; Azarnivand, H.; Khosravi, H.; Zehtabian, G.; Sigaroudi, S.K. Monitoring the Severity of Degradation and Desertification by Remote Sensing (Case Study: Hamoun International Wetland). Front. Environ. Sci. 2022, 10, 902687. [Google Scholar] [CrossRef]
- Cen, Y.; He, L.; He, Z.; Luo, F.; Zhao, Y.; Gan, J.; Bai, W.; Chen, X. Improving Remote Sensing Ecological Assessment in Arid Regions: Dual-Index Framework for Capturing Heterogeneous Environmental Dynamics in the Tarim Basin. Remote Sensing 2025, 17, 3511. [Google Scholar] [CrossRef]
- Forkuor, G.; Dimobe, K.; Serme, I.; Tondoh, J.E. Landsat-8 vs. Sentinel-2: Examining the Added Value of Sentinel-2’s Red-Edge Bands to Land-Use and Land-Cover Mapping in Burkina Faso. GIScience & Remote Sensing 2018, 55, 331–354. [Google Scholar] [CrossRef]
- Berdyyev, A.; Al-Masnay, Y.A.; Juliev, M.; Abuduwaili, J. Desertification Monitoring Using Machine Learning Techniques with Multiple Indicators Derived from Sentinel-2 in Turkmenistan. Remote Sensing 2024, 16, 4525. [Google Scholar] [CrossRef]
- Himmy, O.; Nguyen, T.T.; Hemmler, K.S.; Loulad, S.; Rhinane, H.; Buerkert, A. Leveraging Machine Learning and Landsat Time Series for High-Resolution Mapping of Mining-Induced Vegetation Changes in Ouagadougou, Burkina Faso. Environmental Challenges 2024, 17, 101026. [Google Scholar] [CrossRef]
- Malczewski, J. GIS-based Multicriteria Decision Analysis: A Survey of the Literature. International Journal of Geographical Information Science 2006, 20, 703–726. [Google Scholar] [CrossRef]
- Koldasbayeva, D.; Tregubova, P.; Gasanov, M.; Zaytsev, A.; Petrovskaia, A.; Burnaev, E. Challenges in Data-Driven Geospatial Modeling for Environmental Research and Practice. Nature Communications 2024, 15, 10700. [Google Scholar] [CrossRef] [PubMed]
- Saaty, T.L. Analytic Hierarchy Process. In Encyclopedia of operations research and management science; Springer, 2013; pp. 52–64.
- Moradi, E.; Khosravi, H.; Rahimabadi, P.D.; Choubin, B.; Muchová, Z. Integrated Approach to Land Degradation Risk Assessment in Arid and Semi-Arid Ecosystems: Applying SVM and eDPSIR/ANP Methods. Ecological Indicators 2024, 169, 112947. [Google Scholar] [CrossRef]
- National Center for Wildlife (NCW) Annual Report 2023; National Center for Wildlife: Riyadh, Saudi Arabia, 2023.
- Saudi Green Initiative (SGI) The Saudi Green Initiative: Facts and Perspectives. Al-Ensaneyyat Periodical.
- Salomon, V.A.P.; Gomes, L.F.A.M. Consistency Improvement in the Analytic Hierarchy Process. Mathematics 2024, 12, 828. [Google Scholar] [CrossRef]
- Valentini, E.; Sapio, S.; Schiavon, E.; Righini, M.; Monteleone, B.; Taramelli, A. Development of a Pre-Automatized Processing Chain for Agricultural Monitoring Using a Multi-Sensor and Multi-Temporal Approach. Land 2024, 13, 91. [Google Scholar] [CrossRef]
Figure 1.
Study area map.
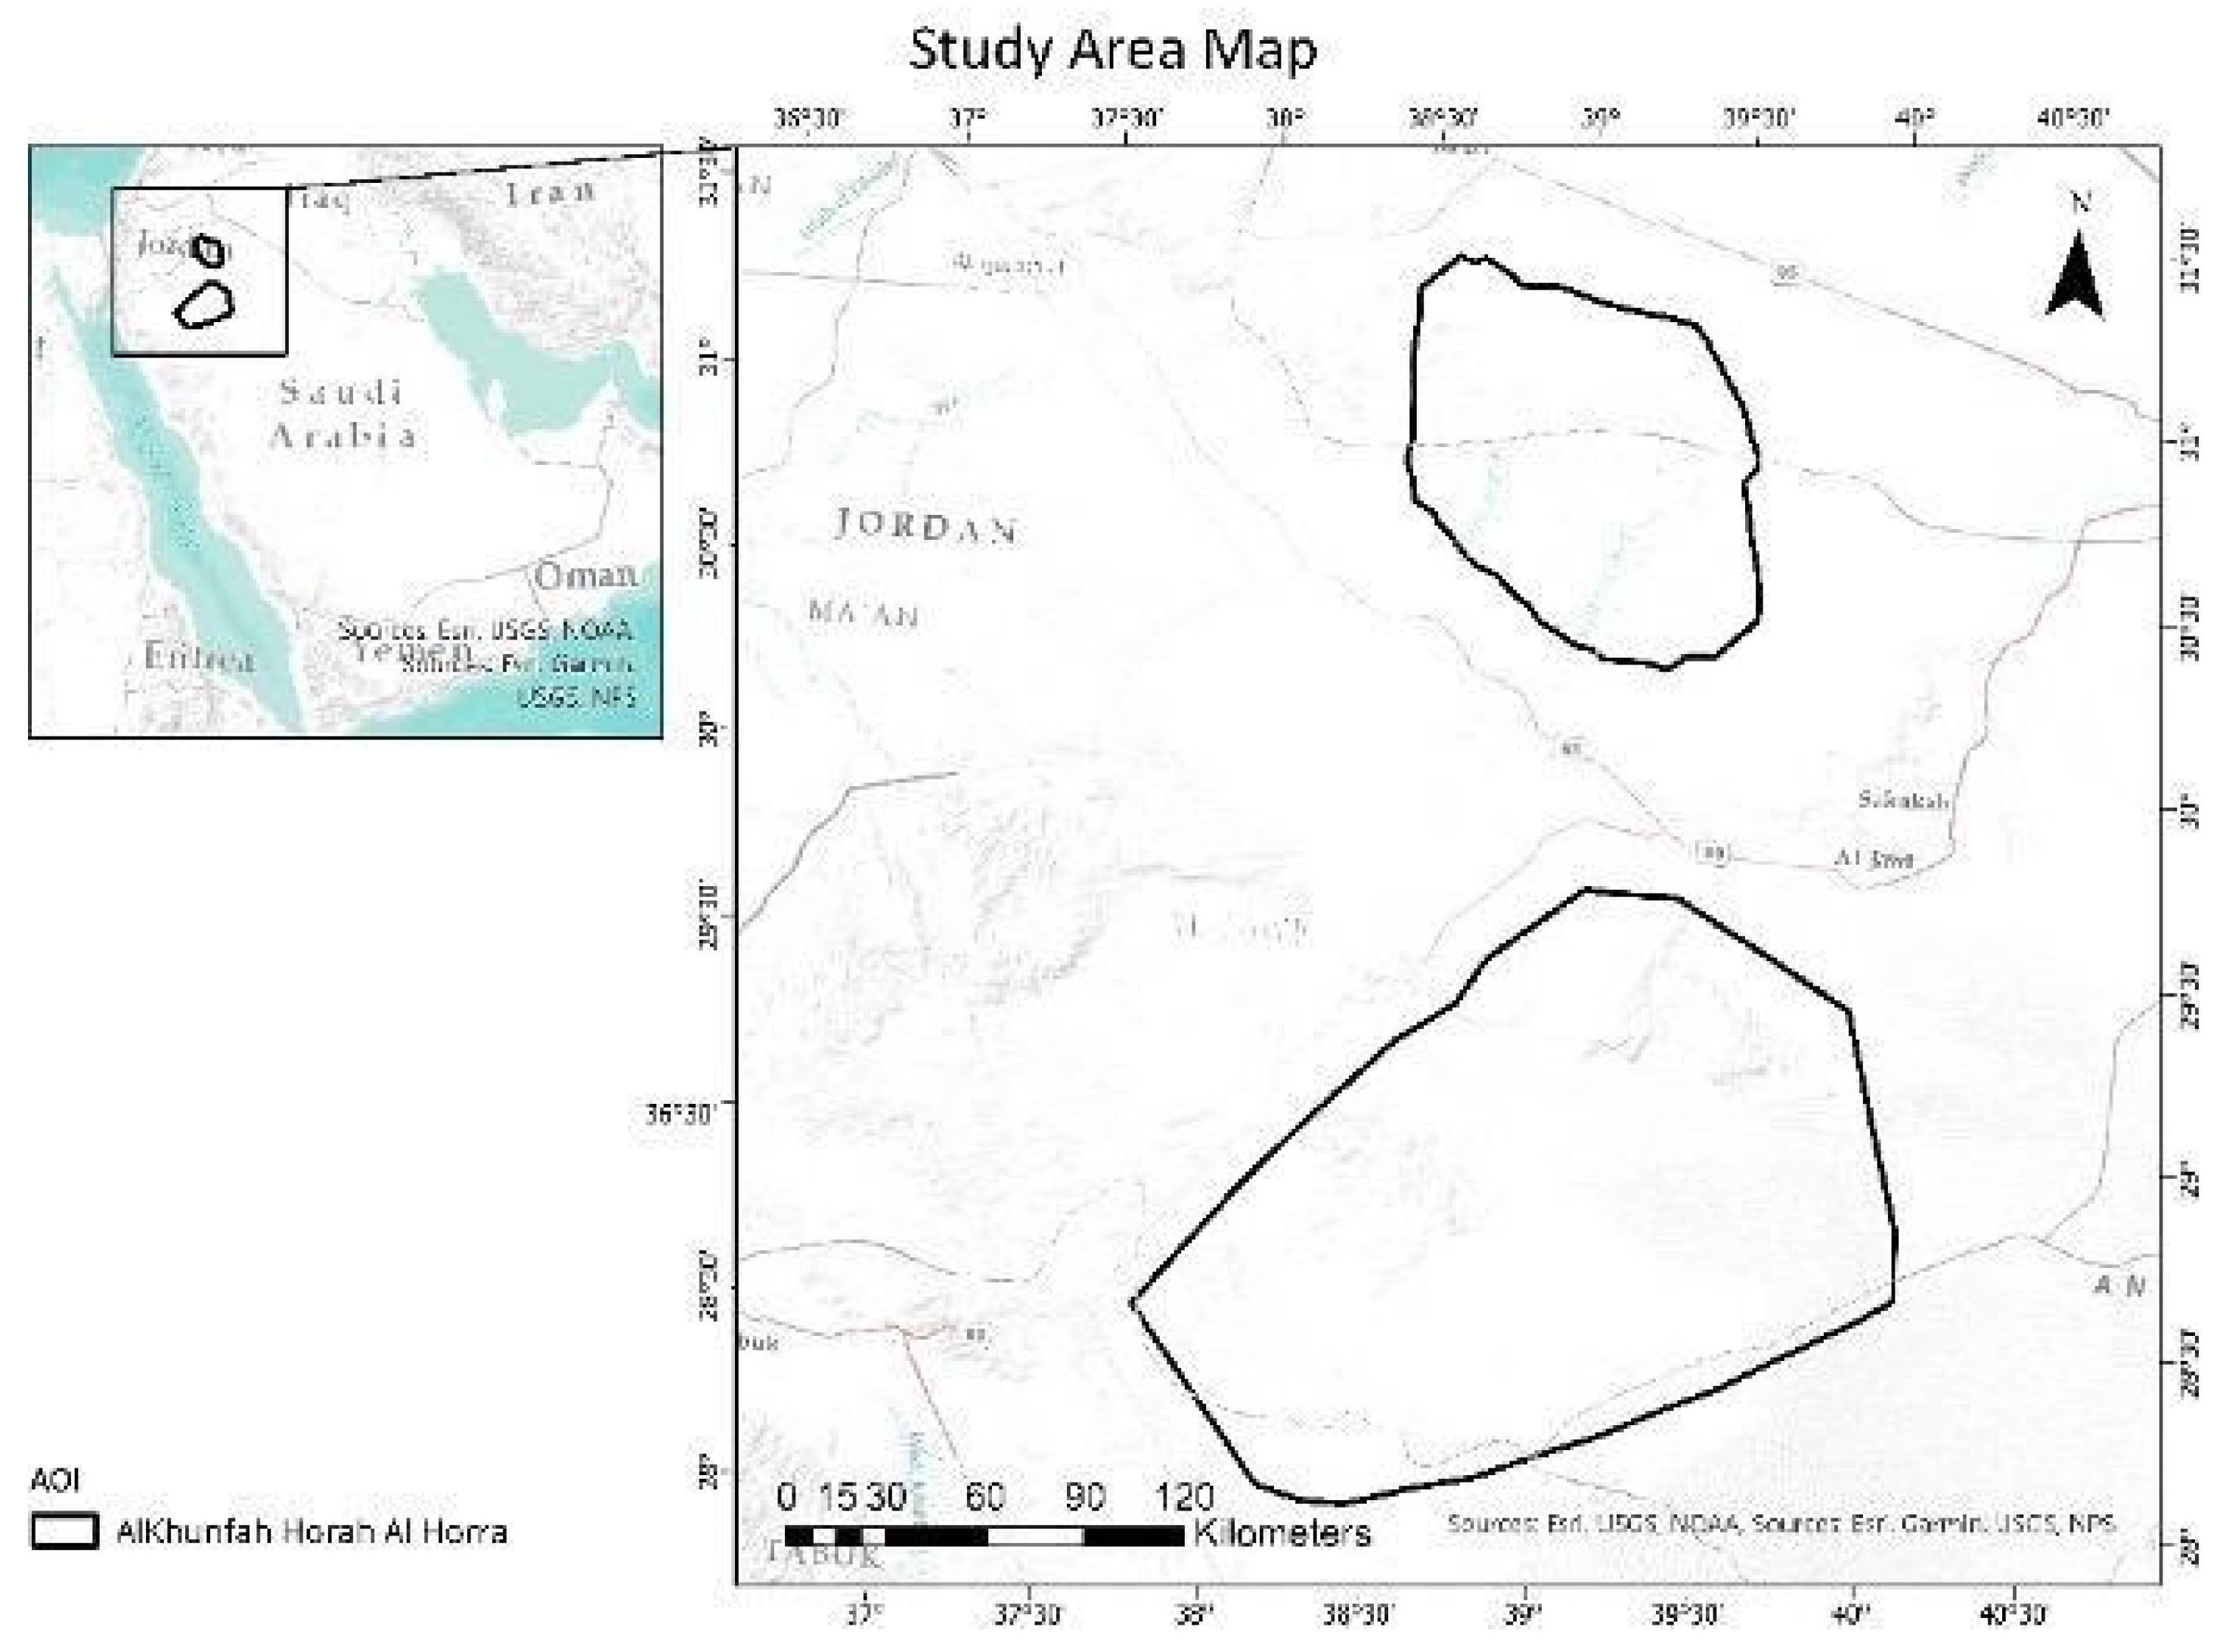
Figure 2.
Methodology for vegetation degradation/desertification suitability mapping, showing the integration of multi-source datasets, thematic-layer reclassification, AHP-based weighting, and weighted-overlay analysis.
Figure 2.
Methodology for vegetation degradation/desertification suitability mapping, showing the integration of multi-source datasets, thematic-layer reclassification, AHP-based weighting, and weighted-overlay analysis.
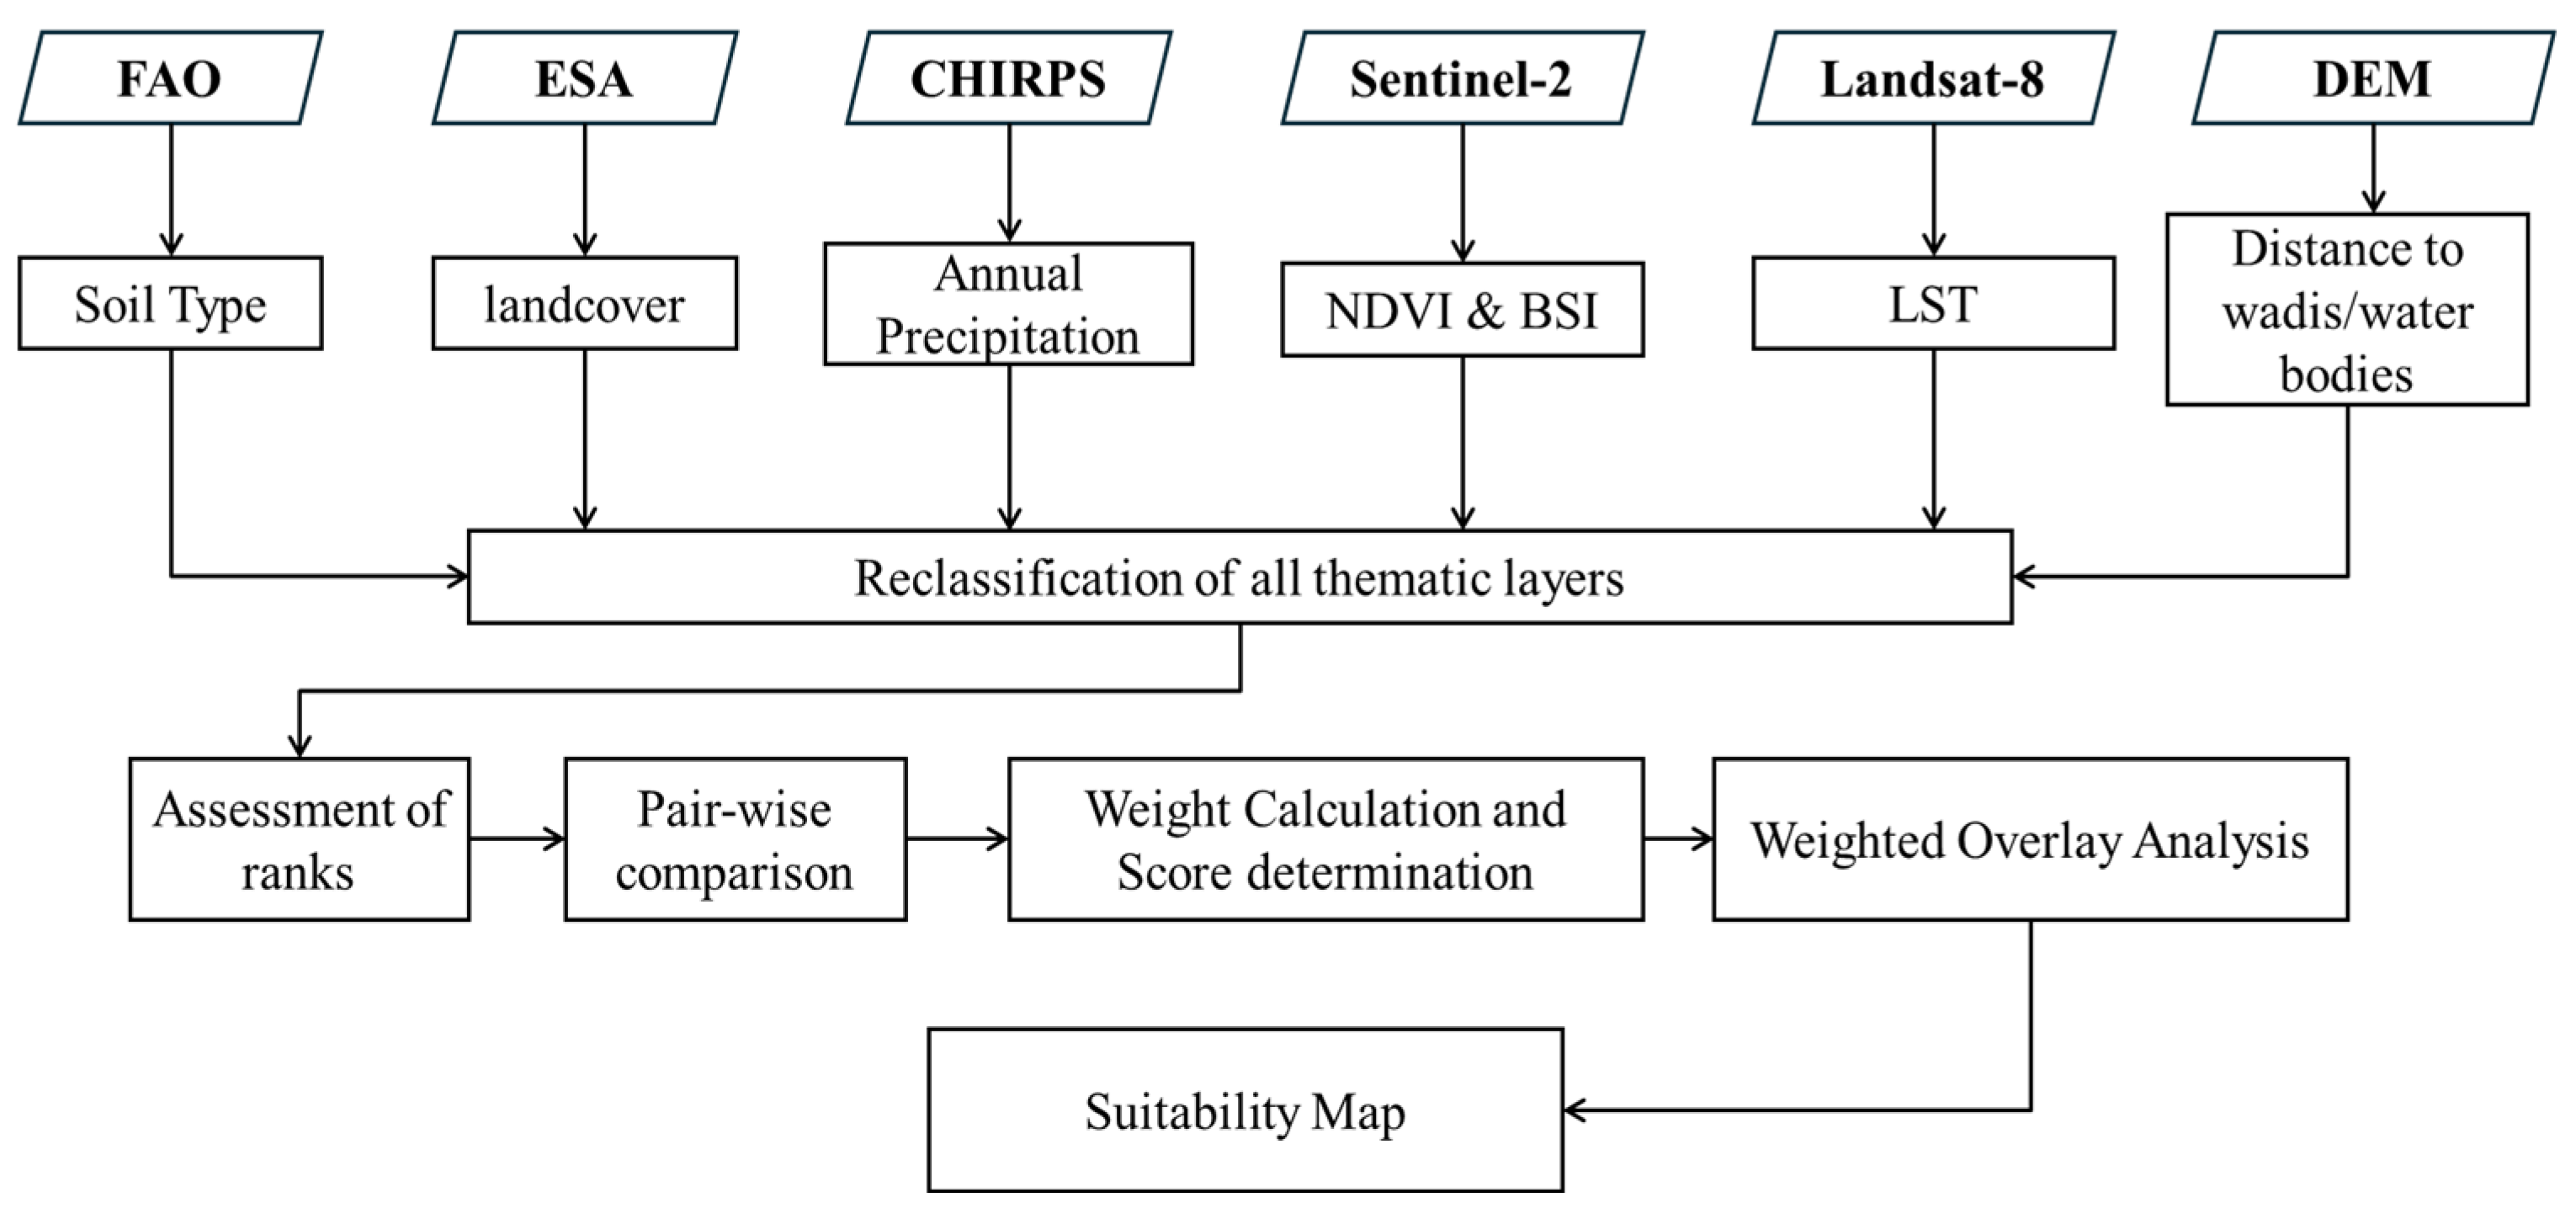
Figure 3.
Computational Sustainability Framework illustrating the four algorithmic phases: (1) Data Acquisition and Processing, (2) Feature Extraction and Normalization, (3) Multi-Criteria Decision Modeling, and (4) Computational Validation and Visualization.
Figure 3.
Computational Sustainability Framework illustrating the four algorithmic phases: (1) Data Acquisition and Processing, (2) Feature Extraction and Normalization, (3) Multi-Criteria Decision Modeling, and (4) Computational Validation and Visualization.
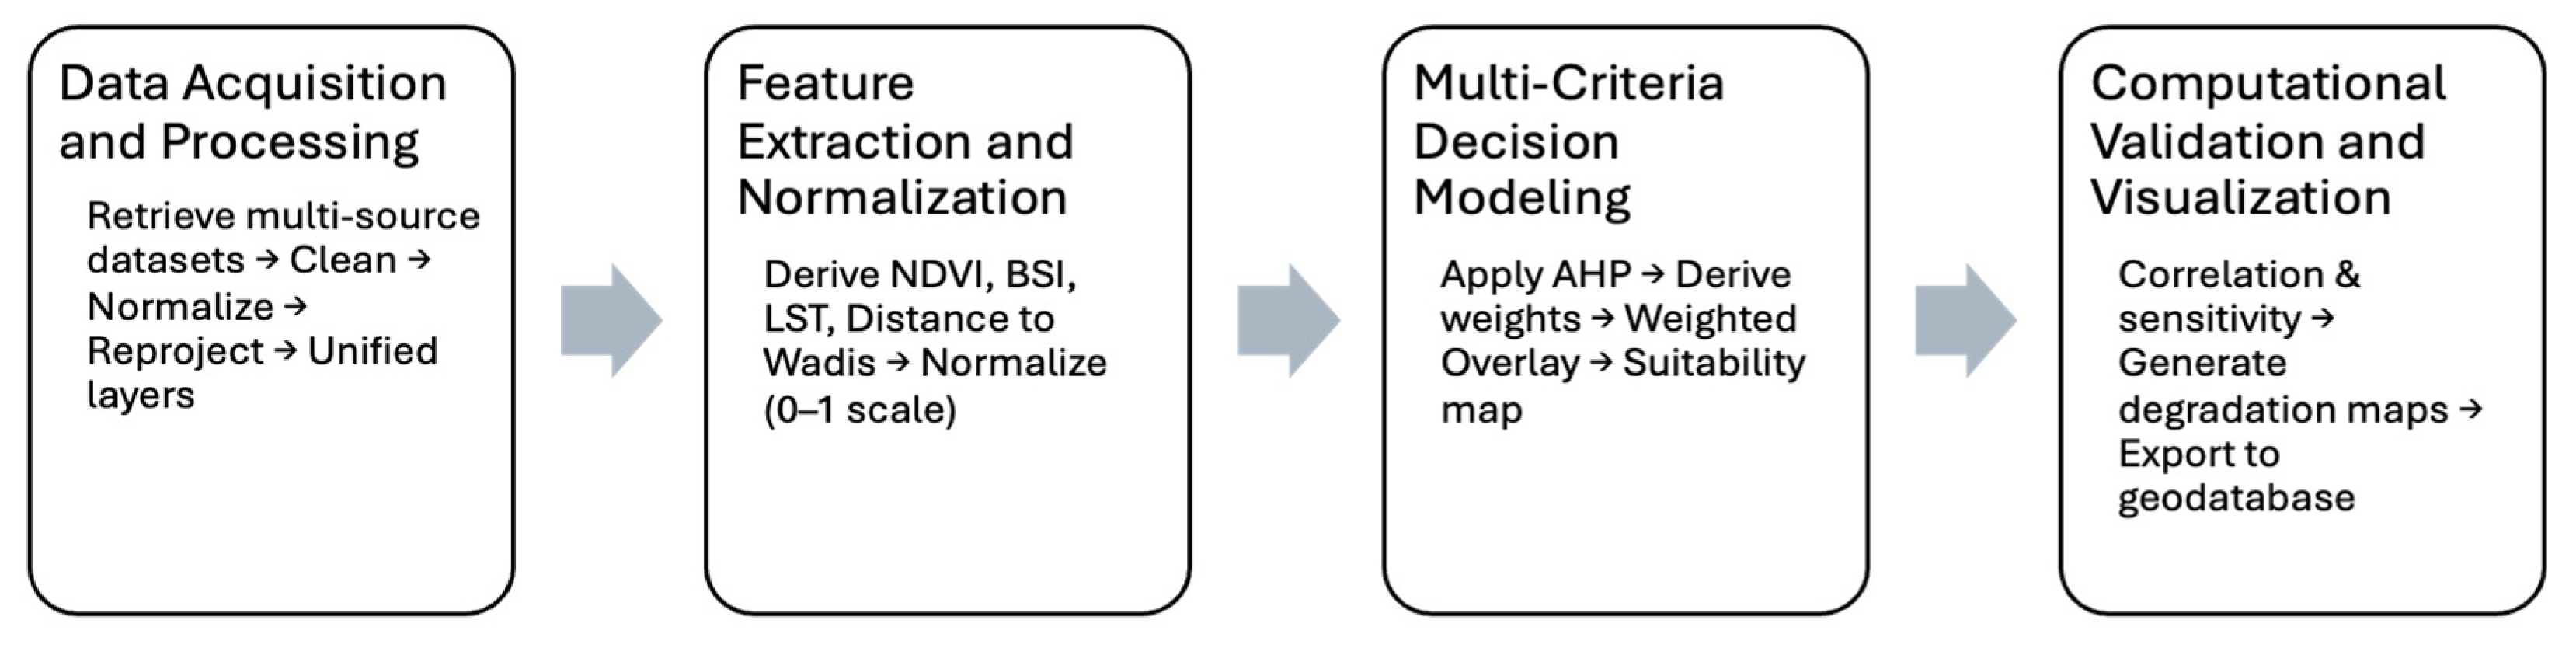
Figure 4.
Vegetation Degradation and Desertification Susceptibility Map.
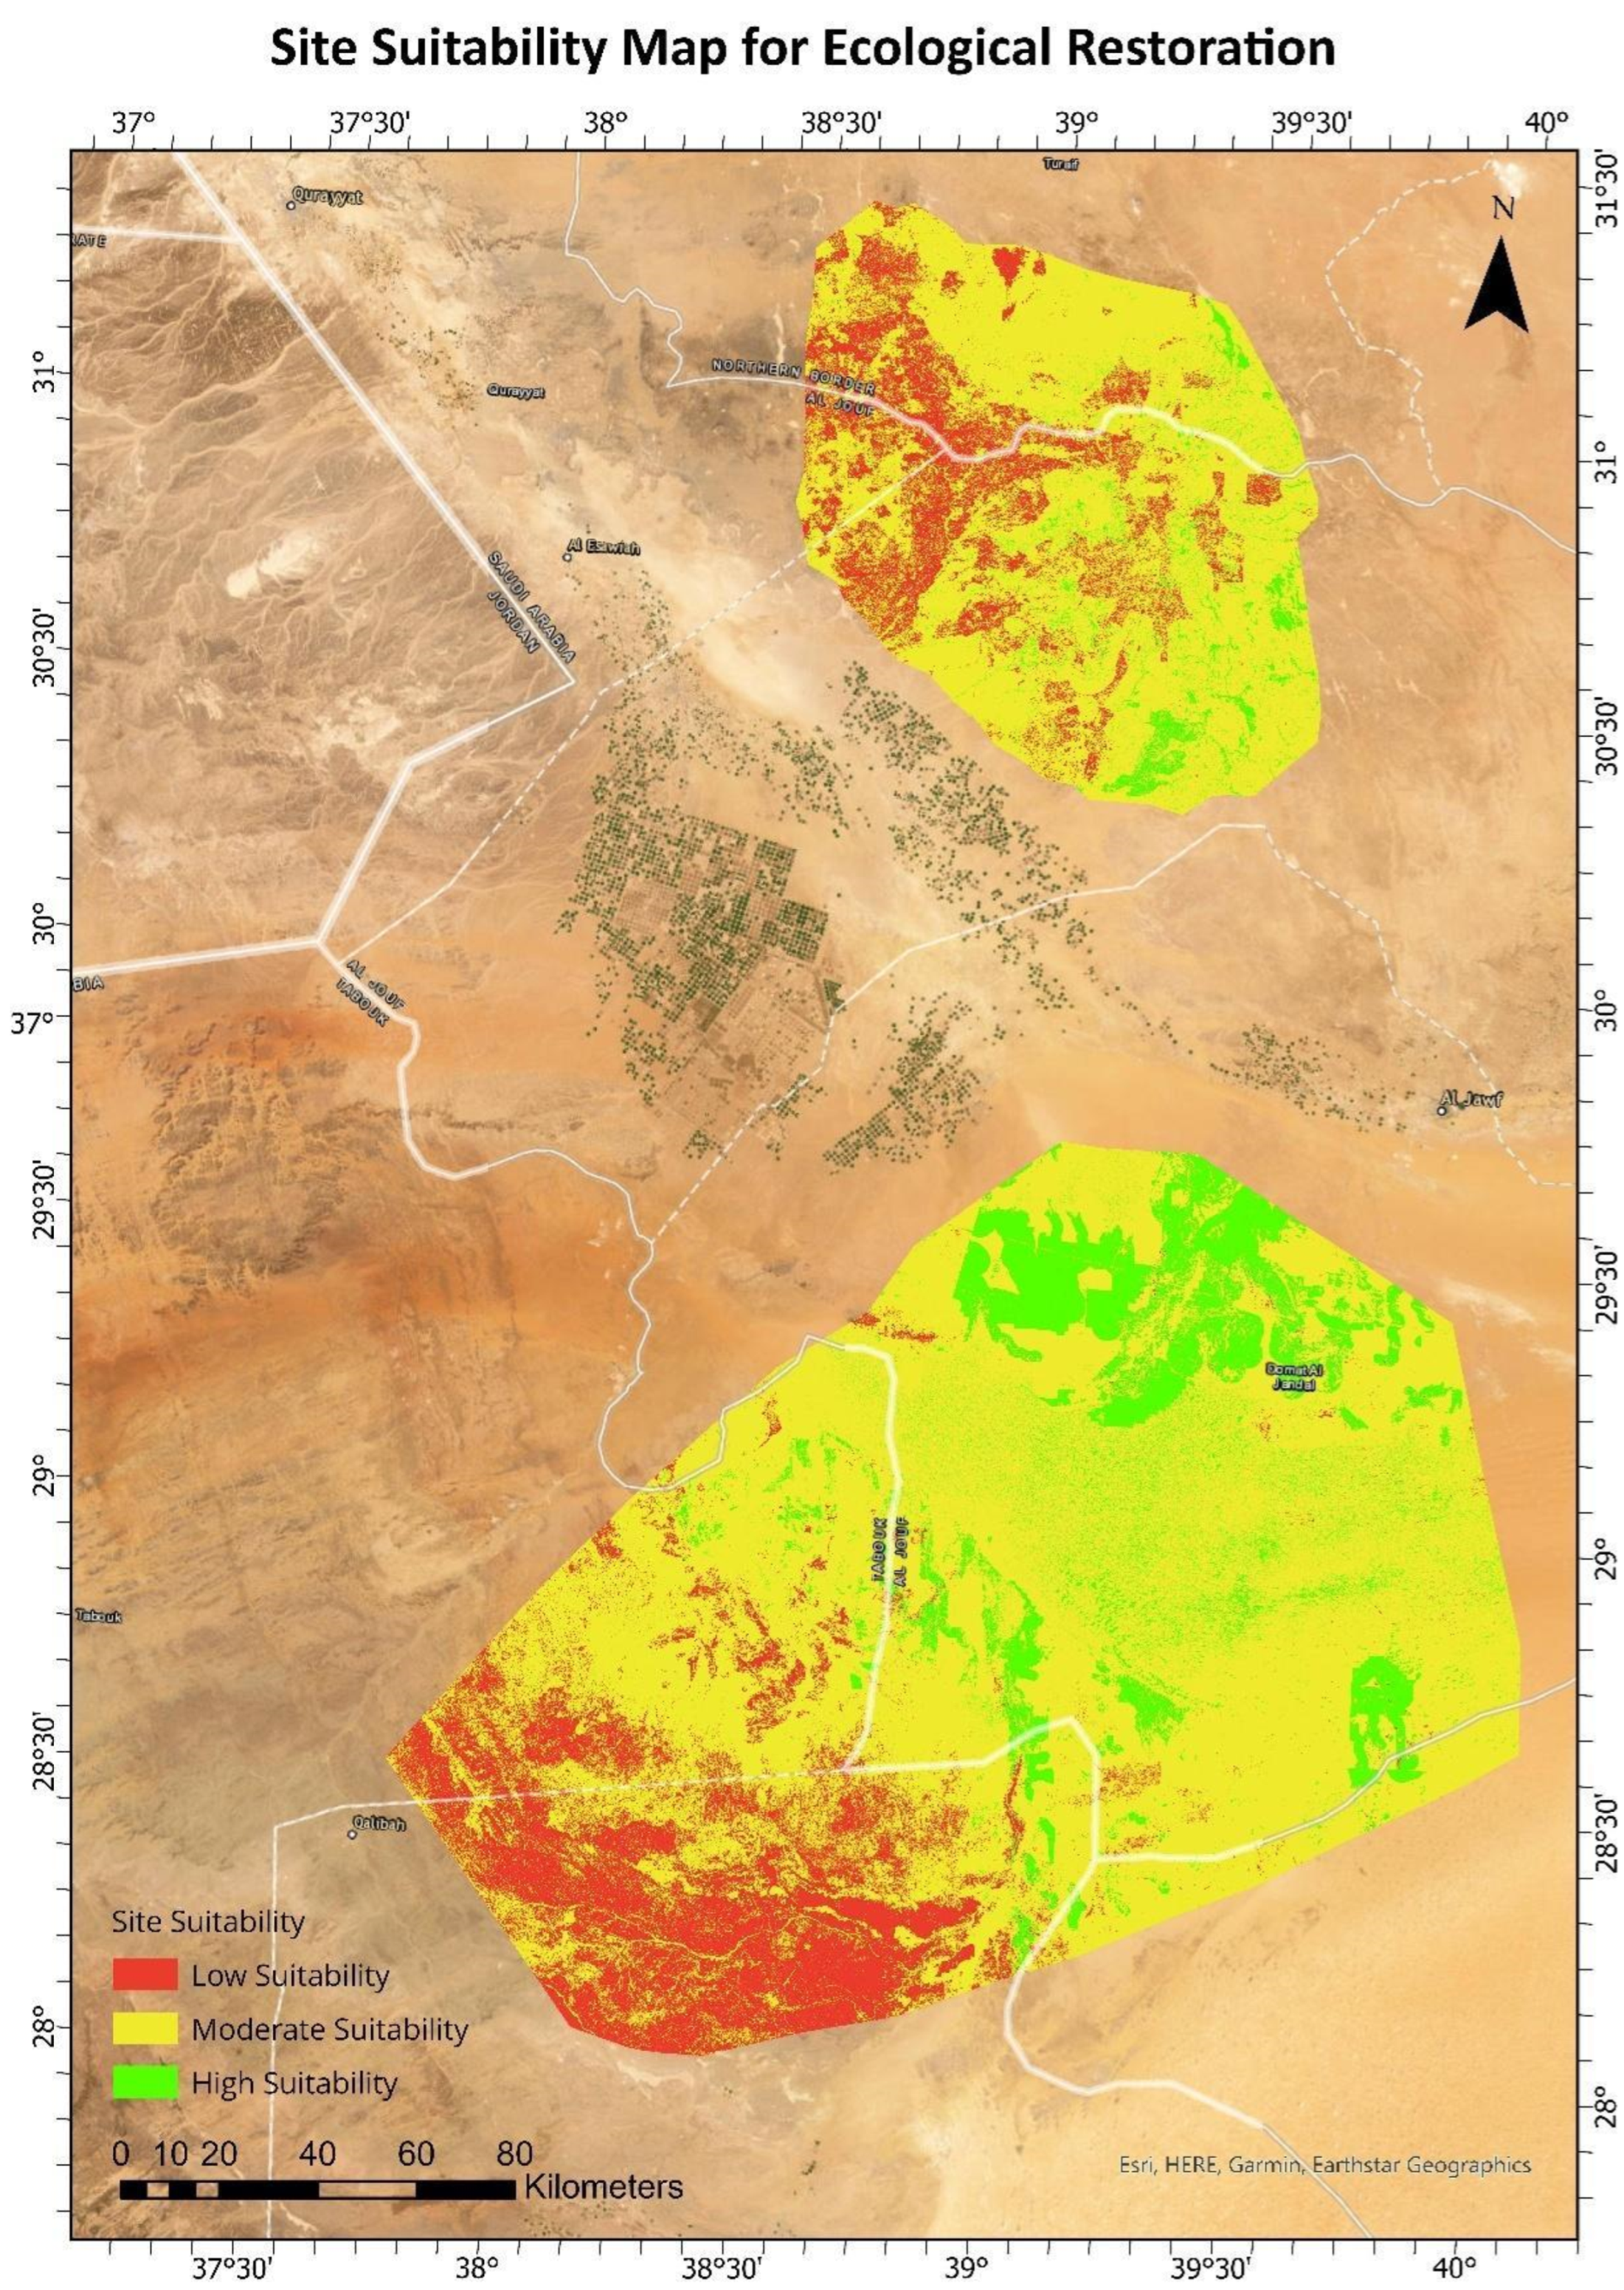
Figure 5.
Thematic layers representing (a) Bare Soil Index (BSI) and (b) Normalized Difference Vegetation Index (NDVI) for Al Khunfah and Ḩorah al-Ḥorah Protected Areas. Higher BSI values (red zones) indicate exposed soil and degraded surfaces, while higher NDVI values (green zones) represent healthy vegetation cover. The southern region of Ḩorah al-Ḥorah exhibits high BSI and low NDVI, confirming severe degradation patterns.
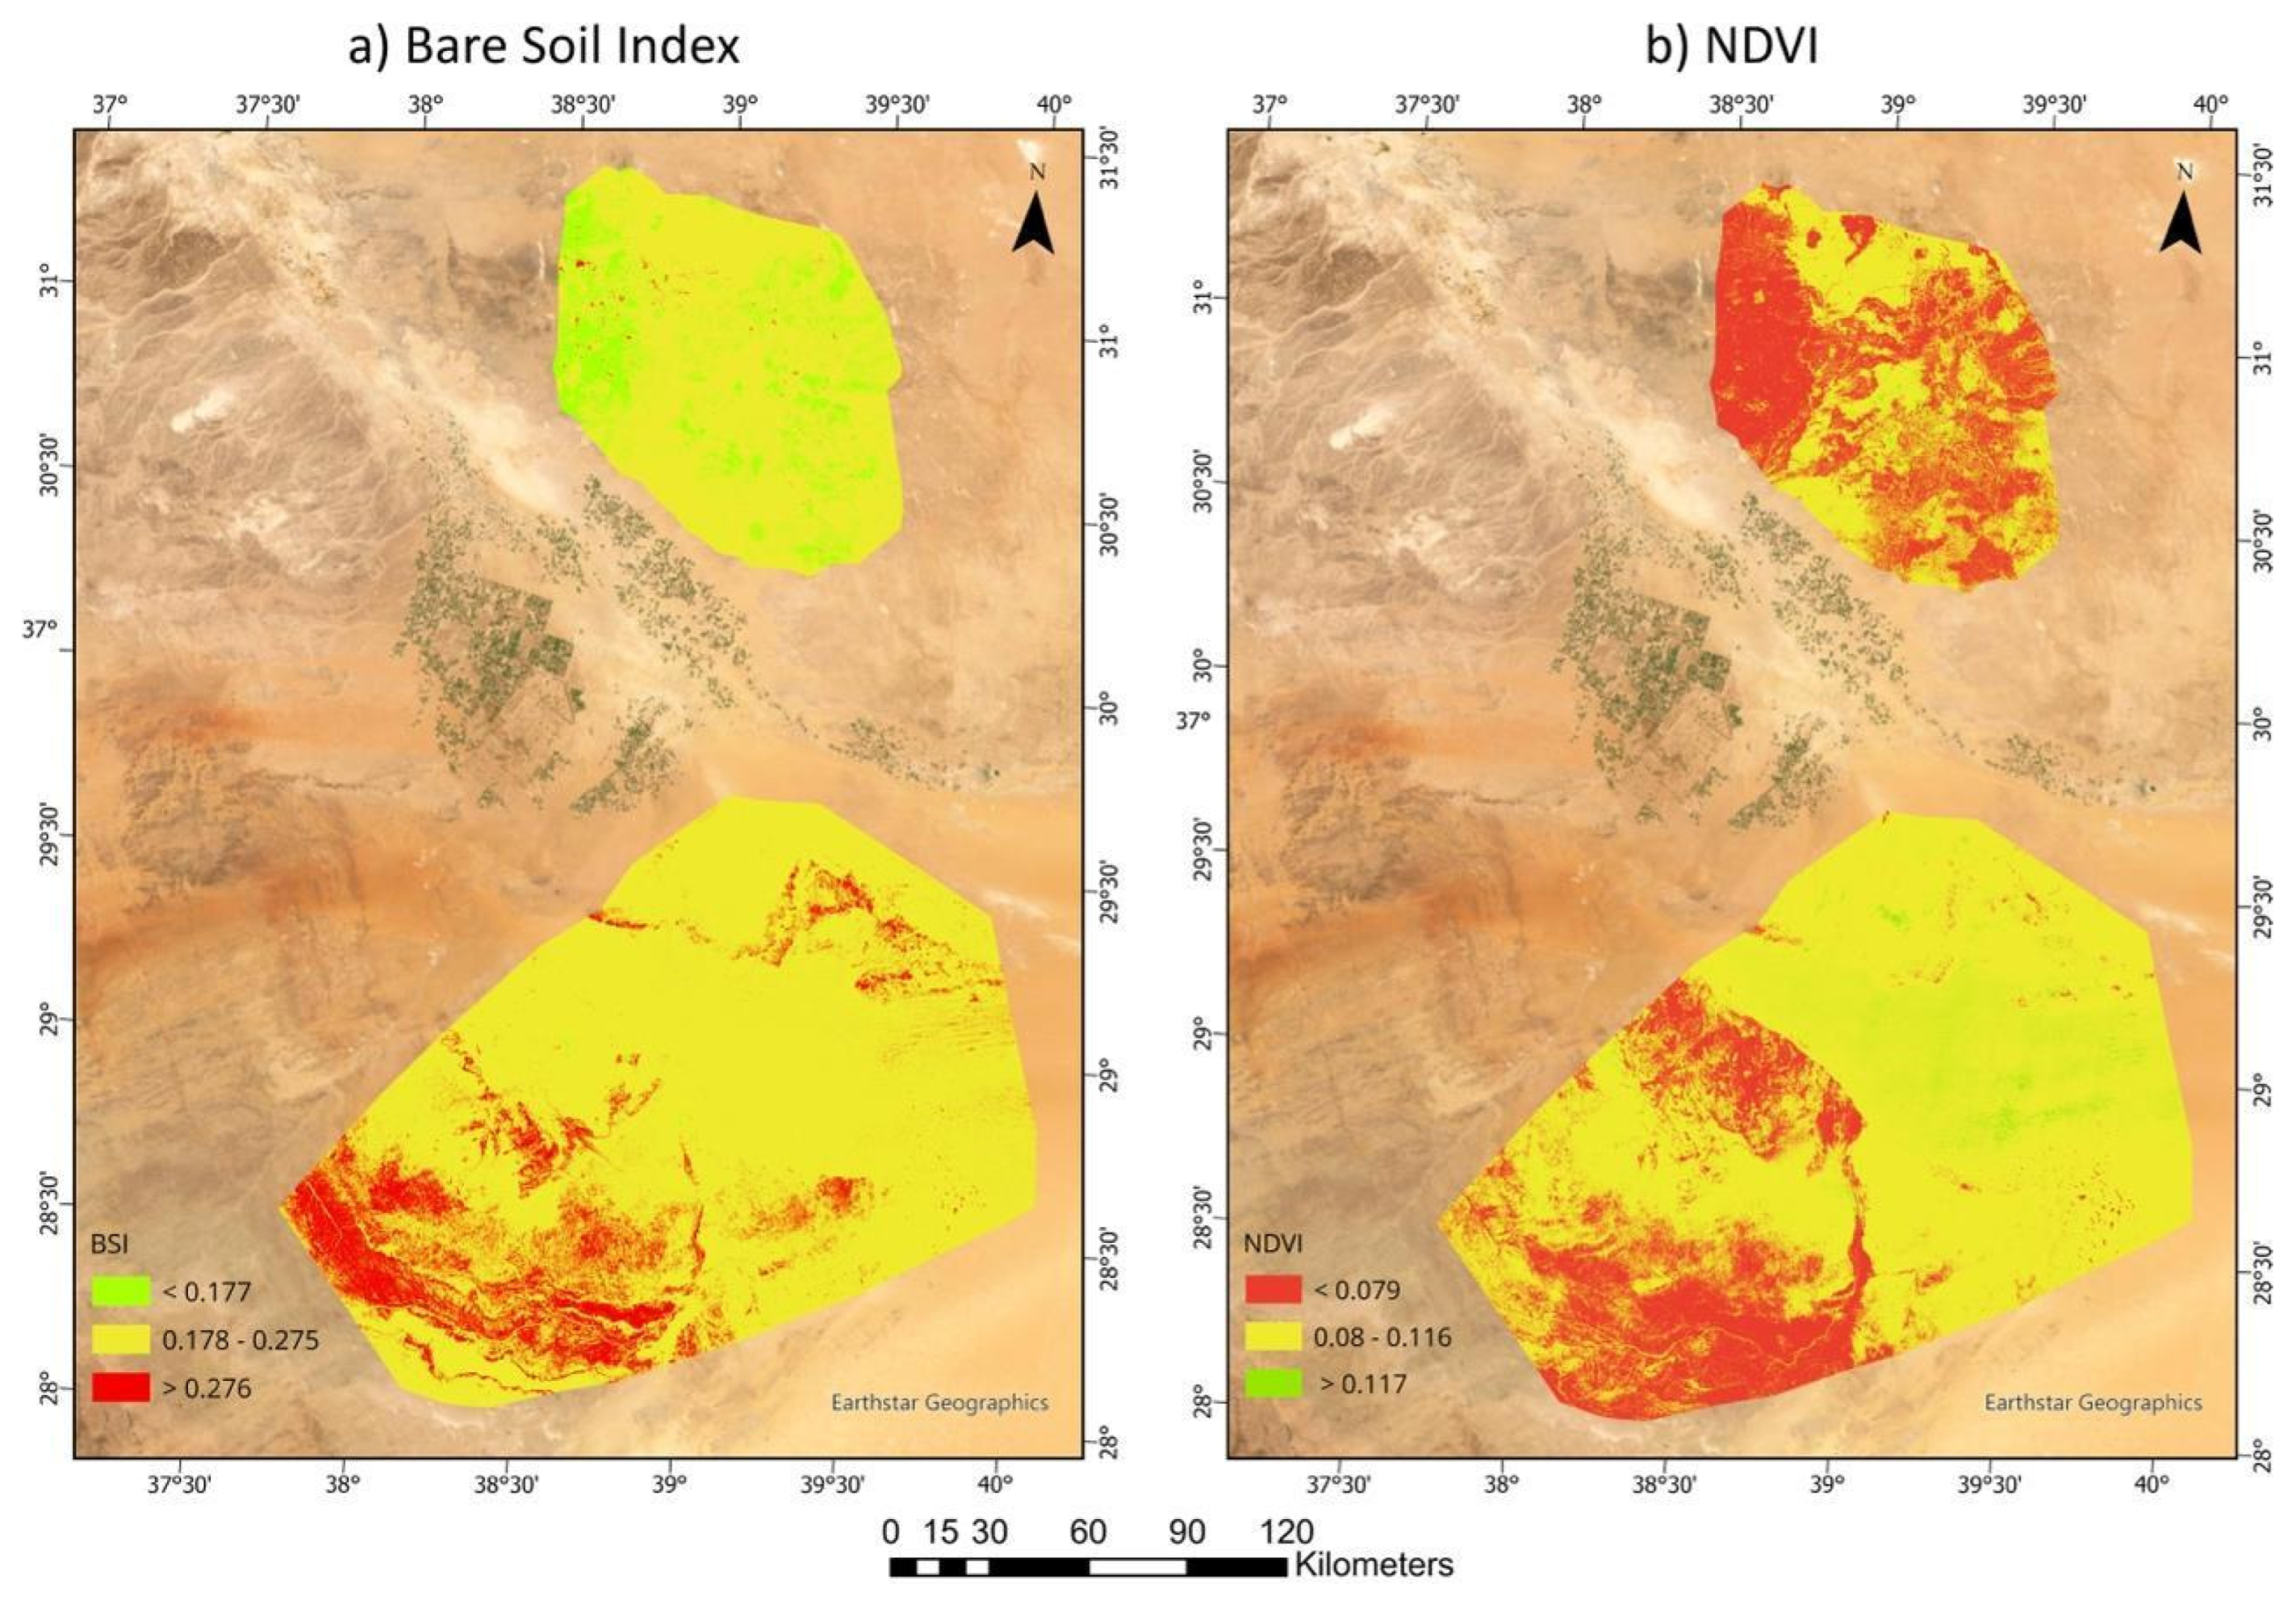
Figure 6.
(c) Landcover; (d) Soil Type.
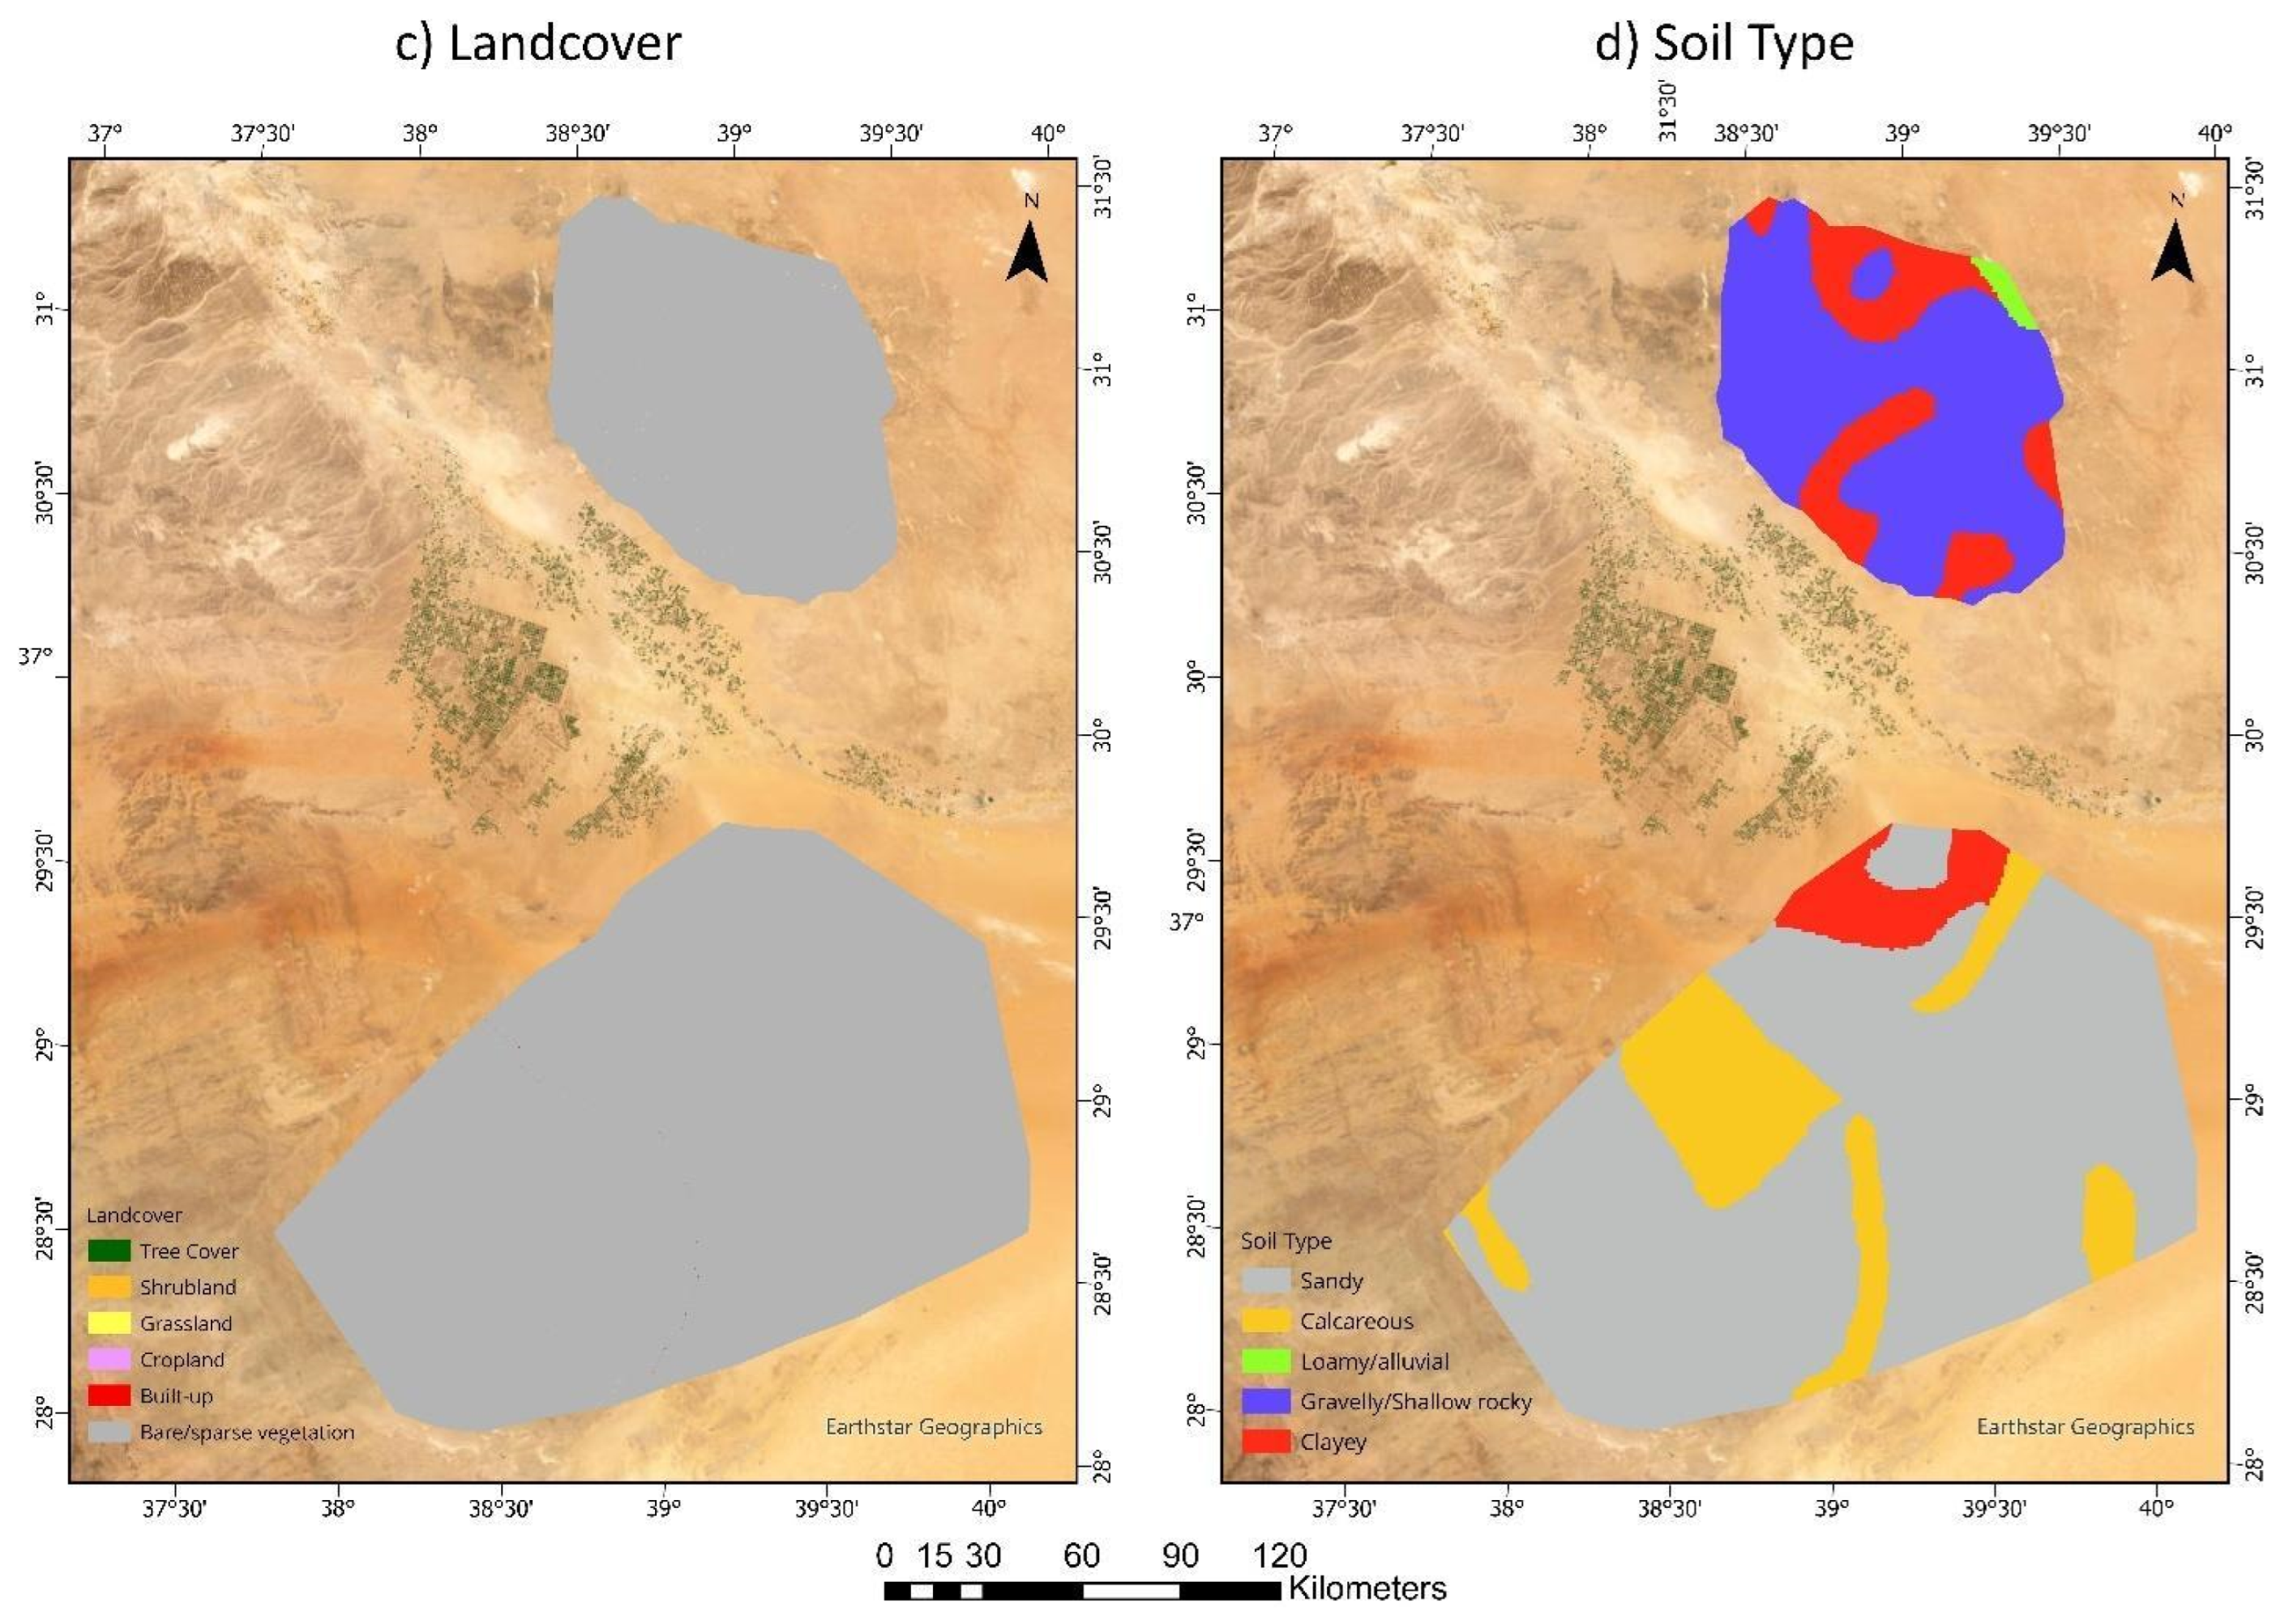
Figure 7.
(e)Climate Observation; (f) Land Surface Temperature.
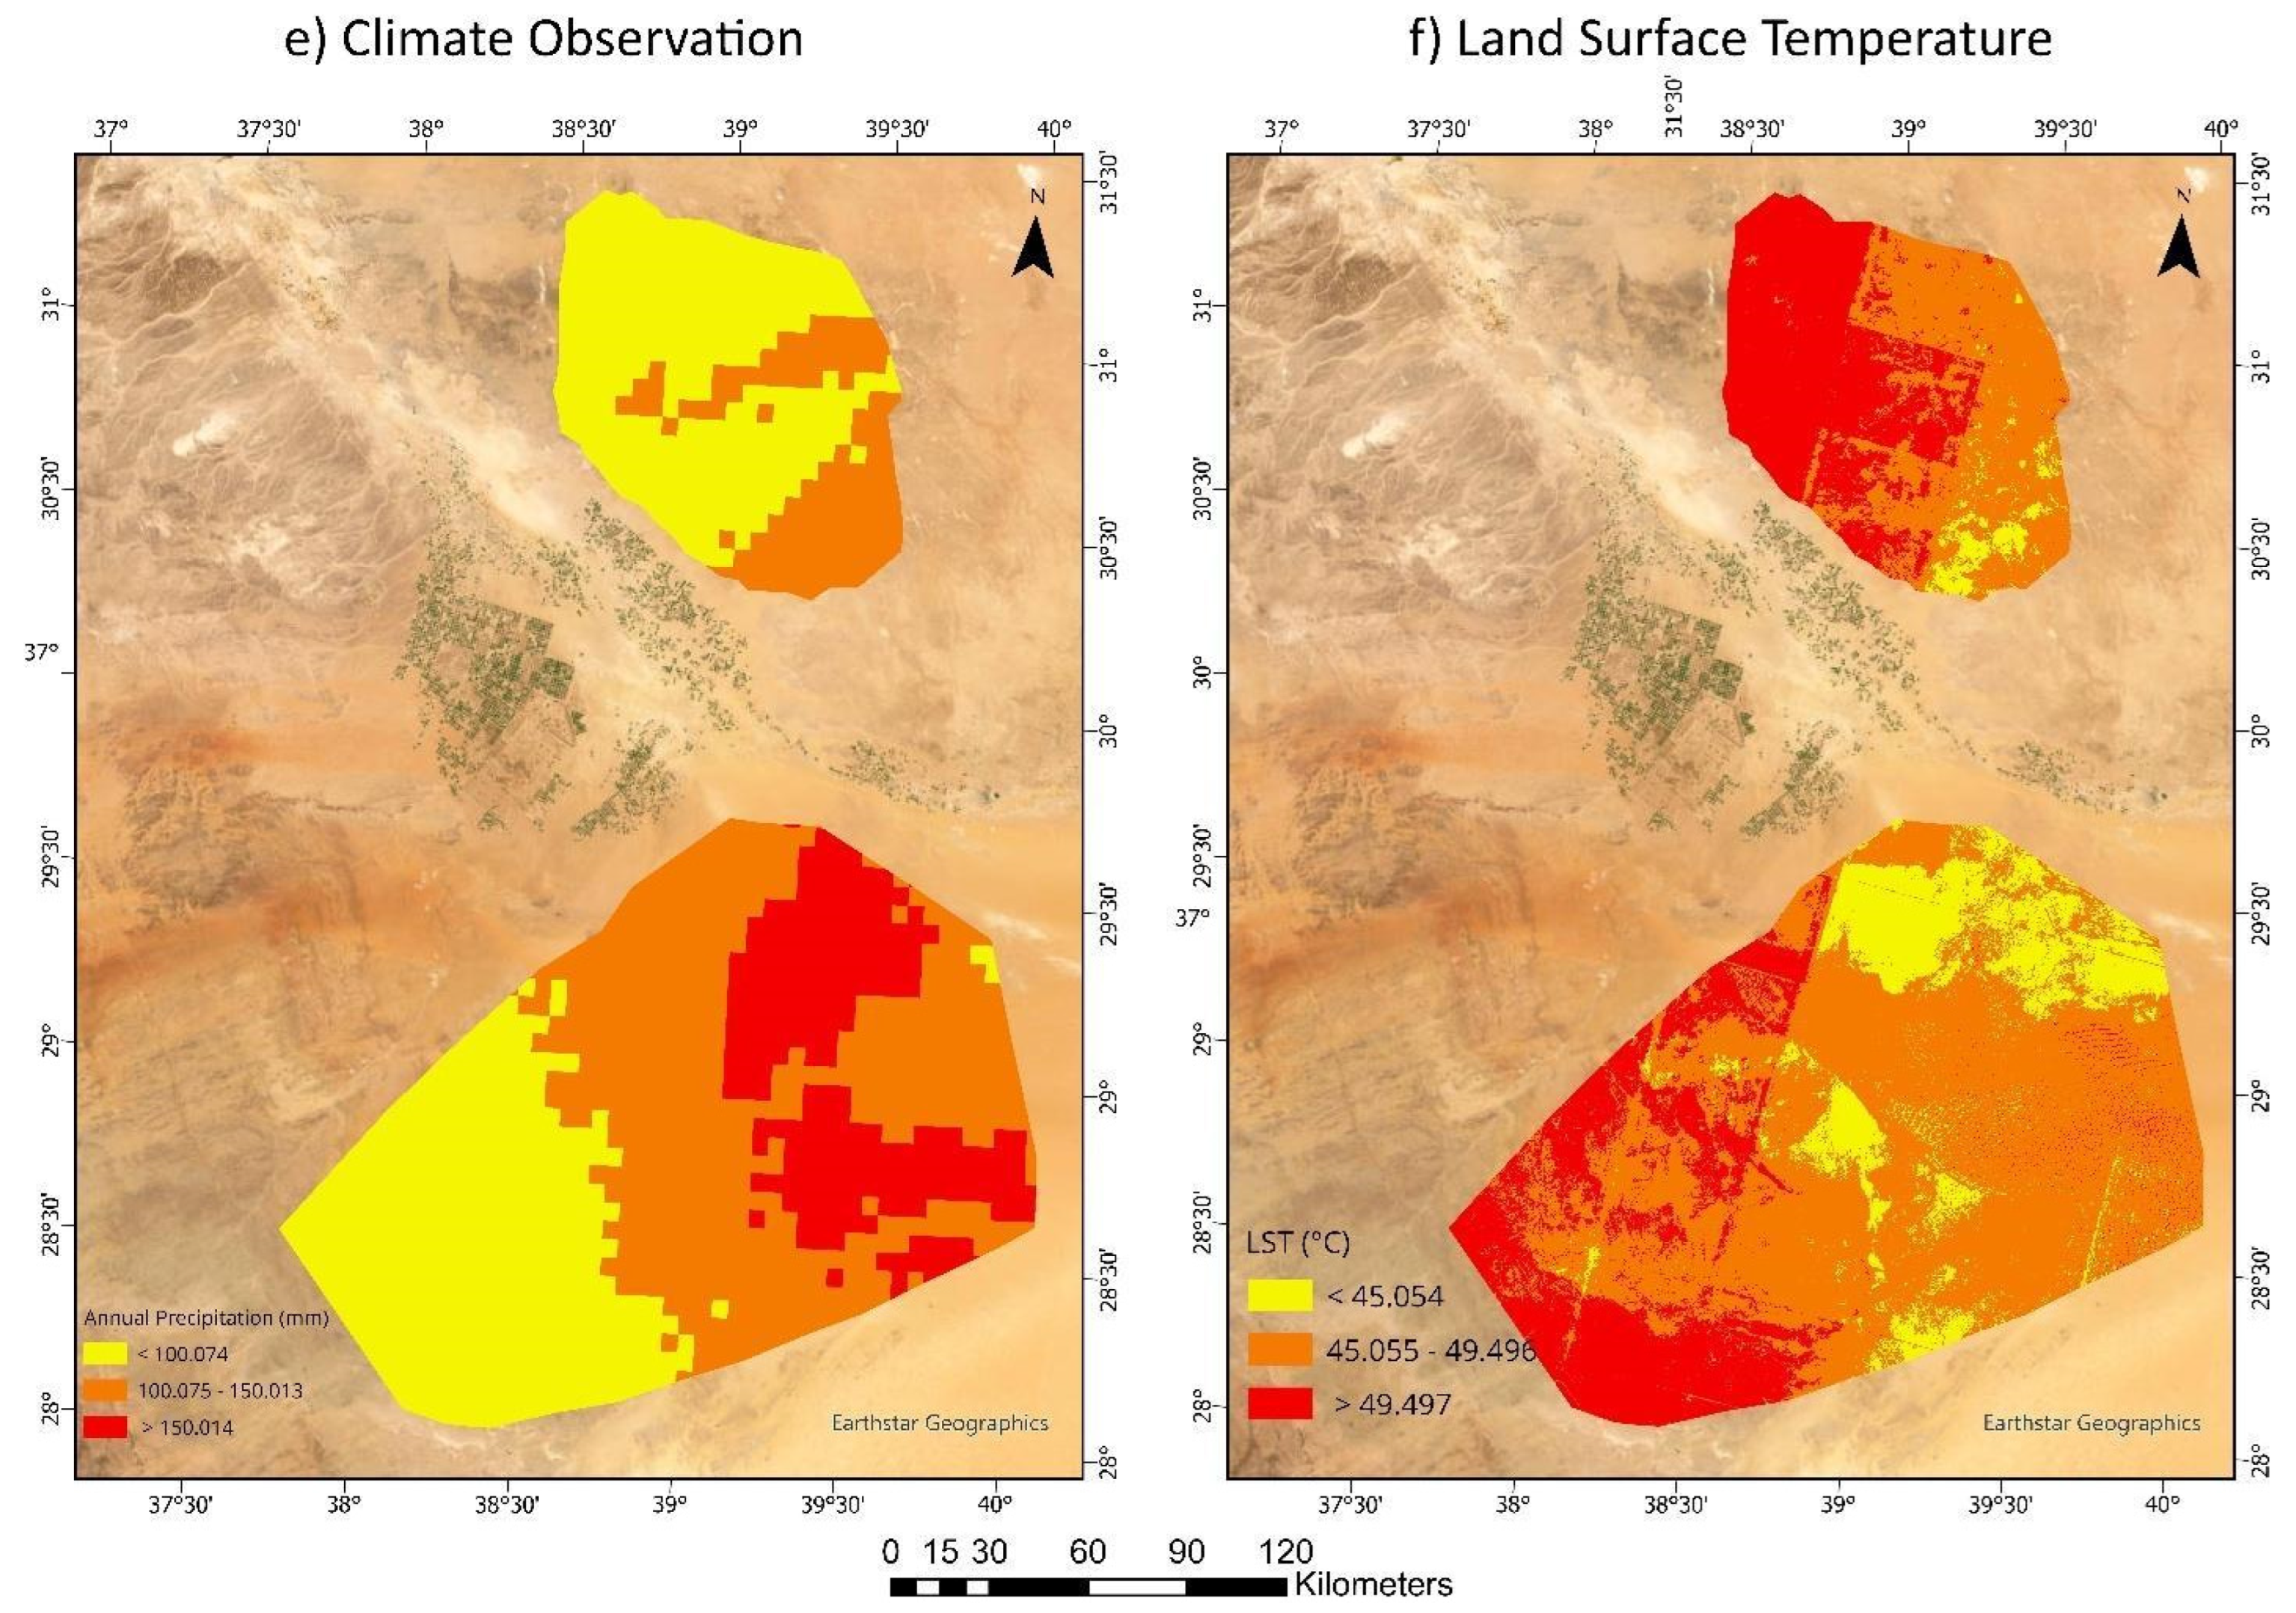
Figure 8.
(g) Distance to Water/wadis.
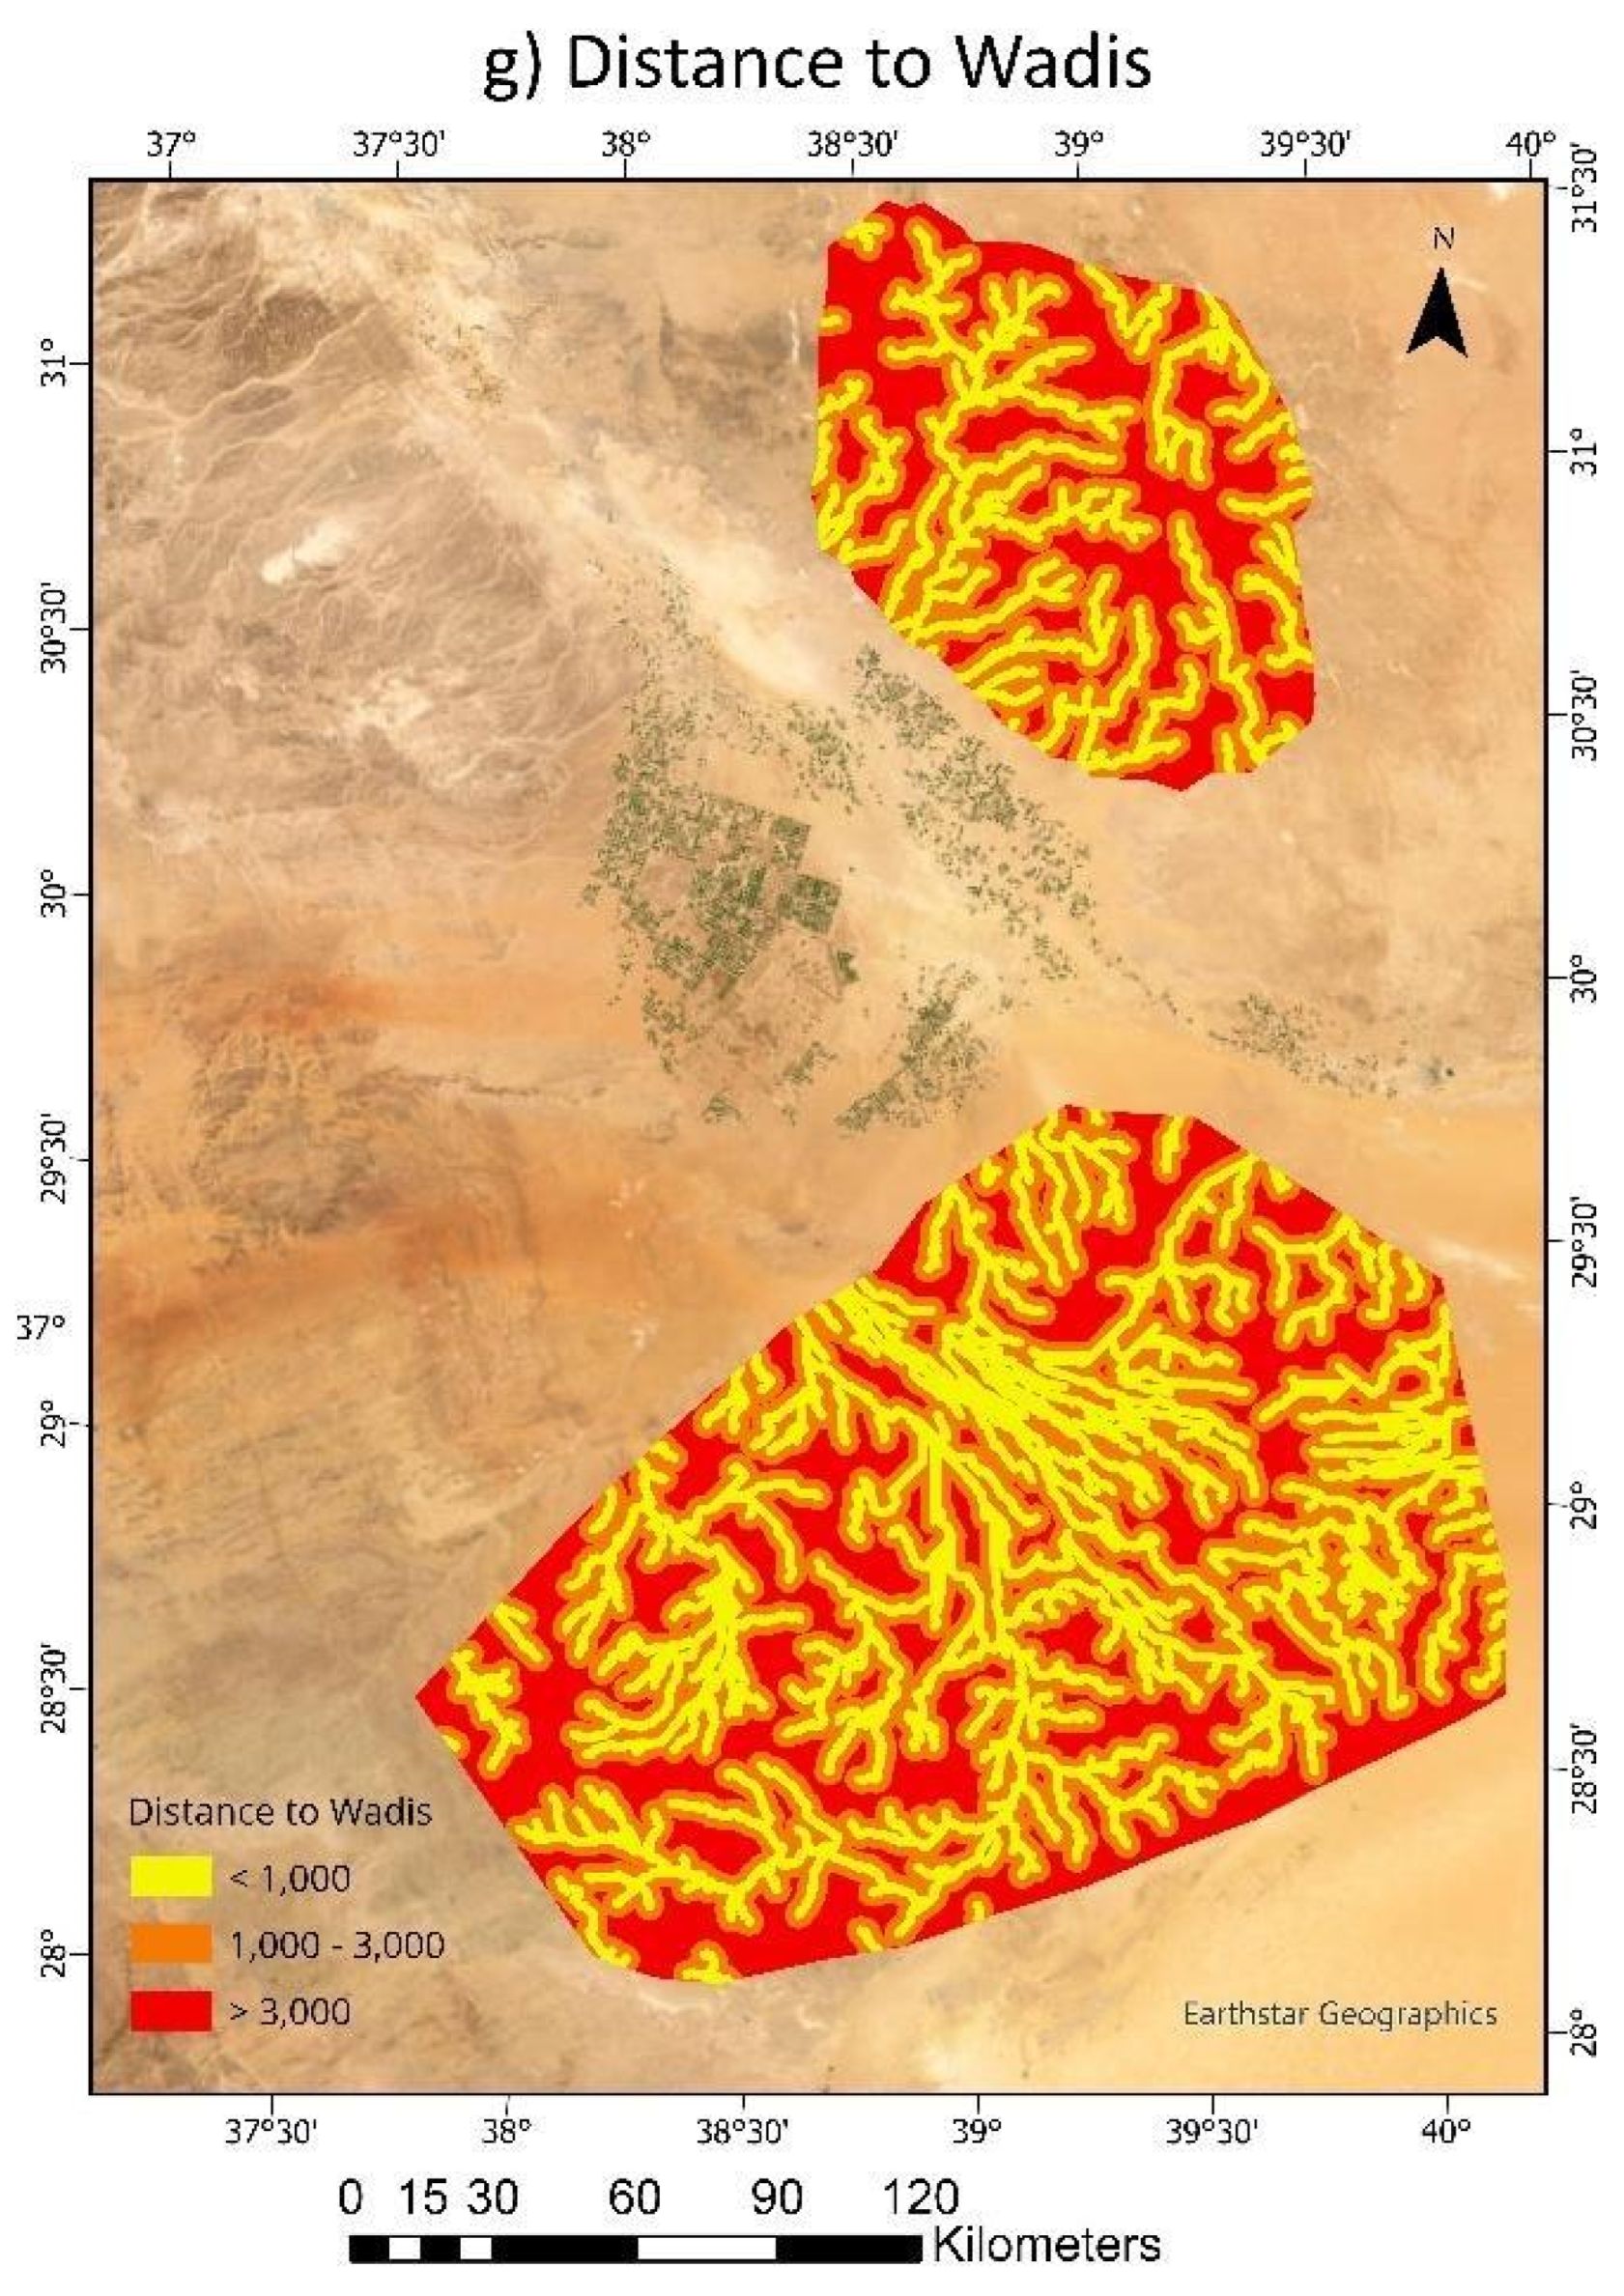
Figure 9.
Area statistics of the suitability classes.
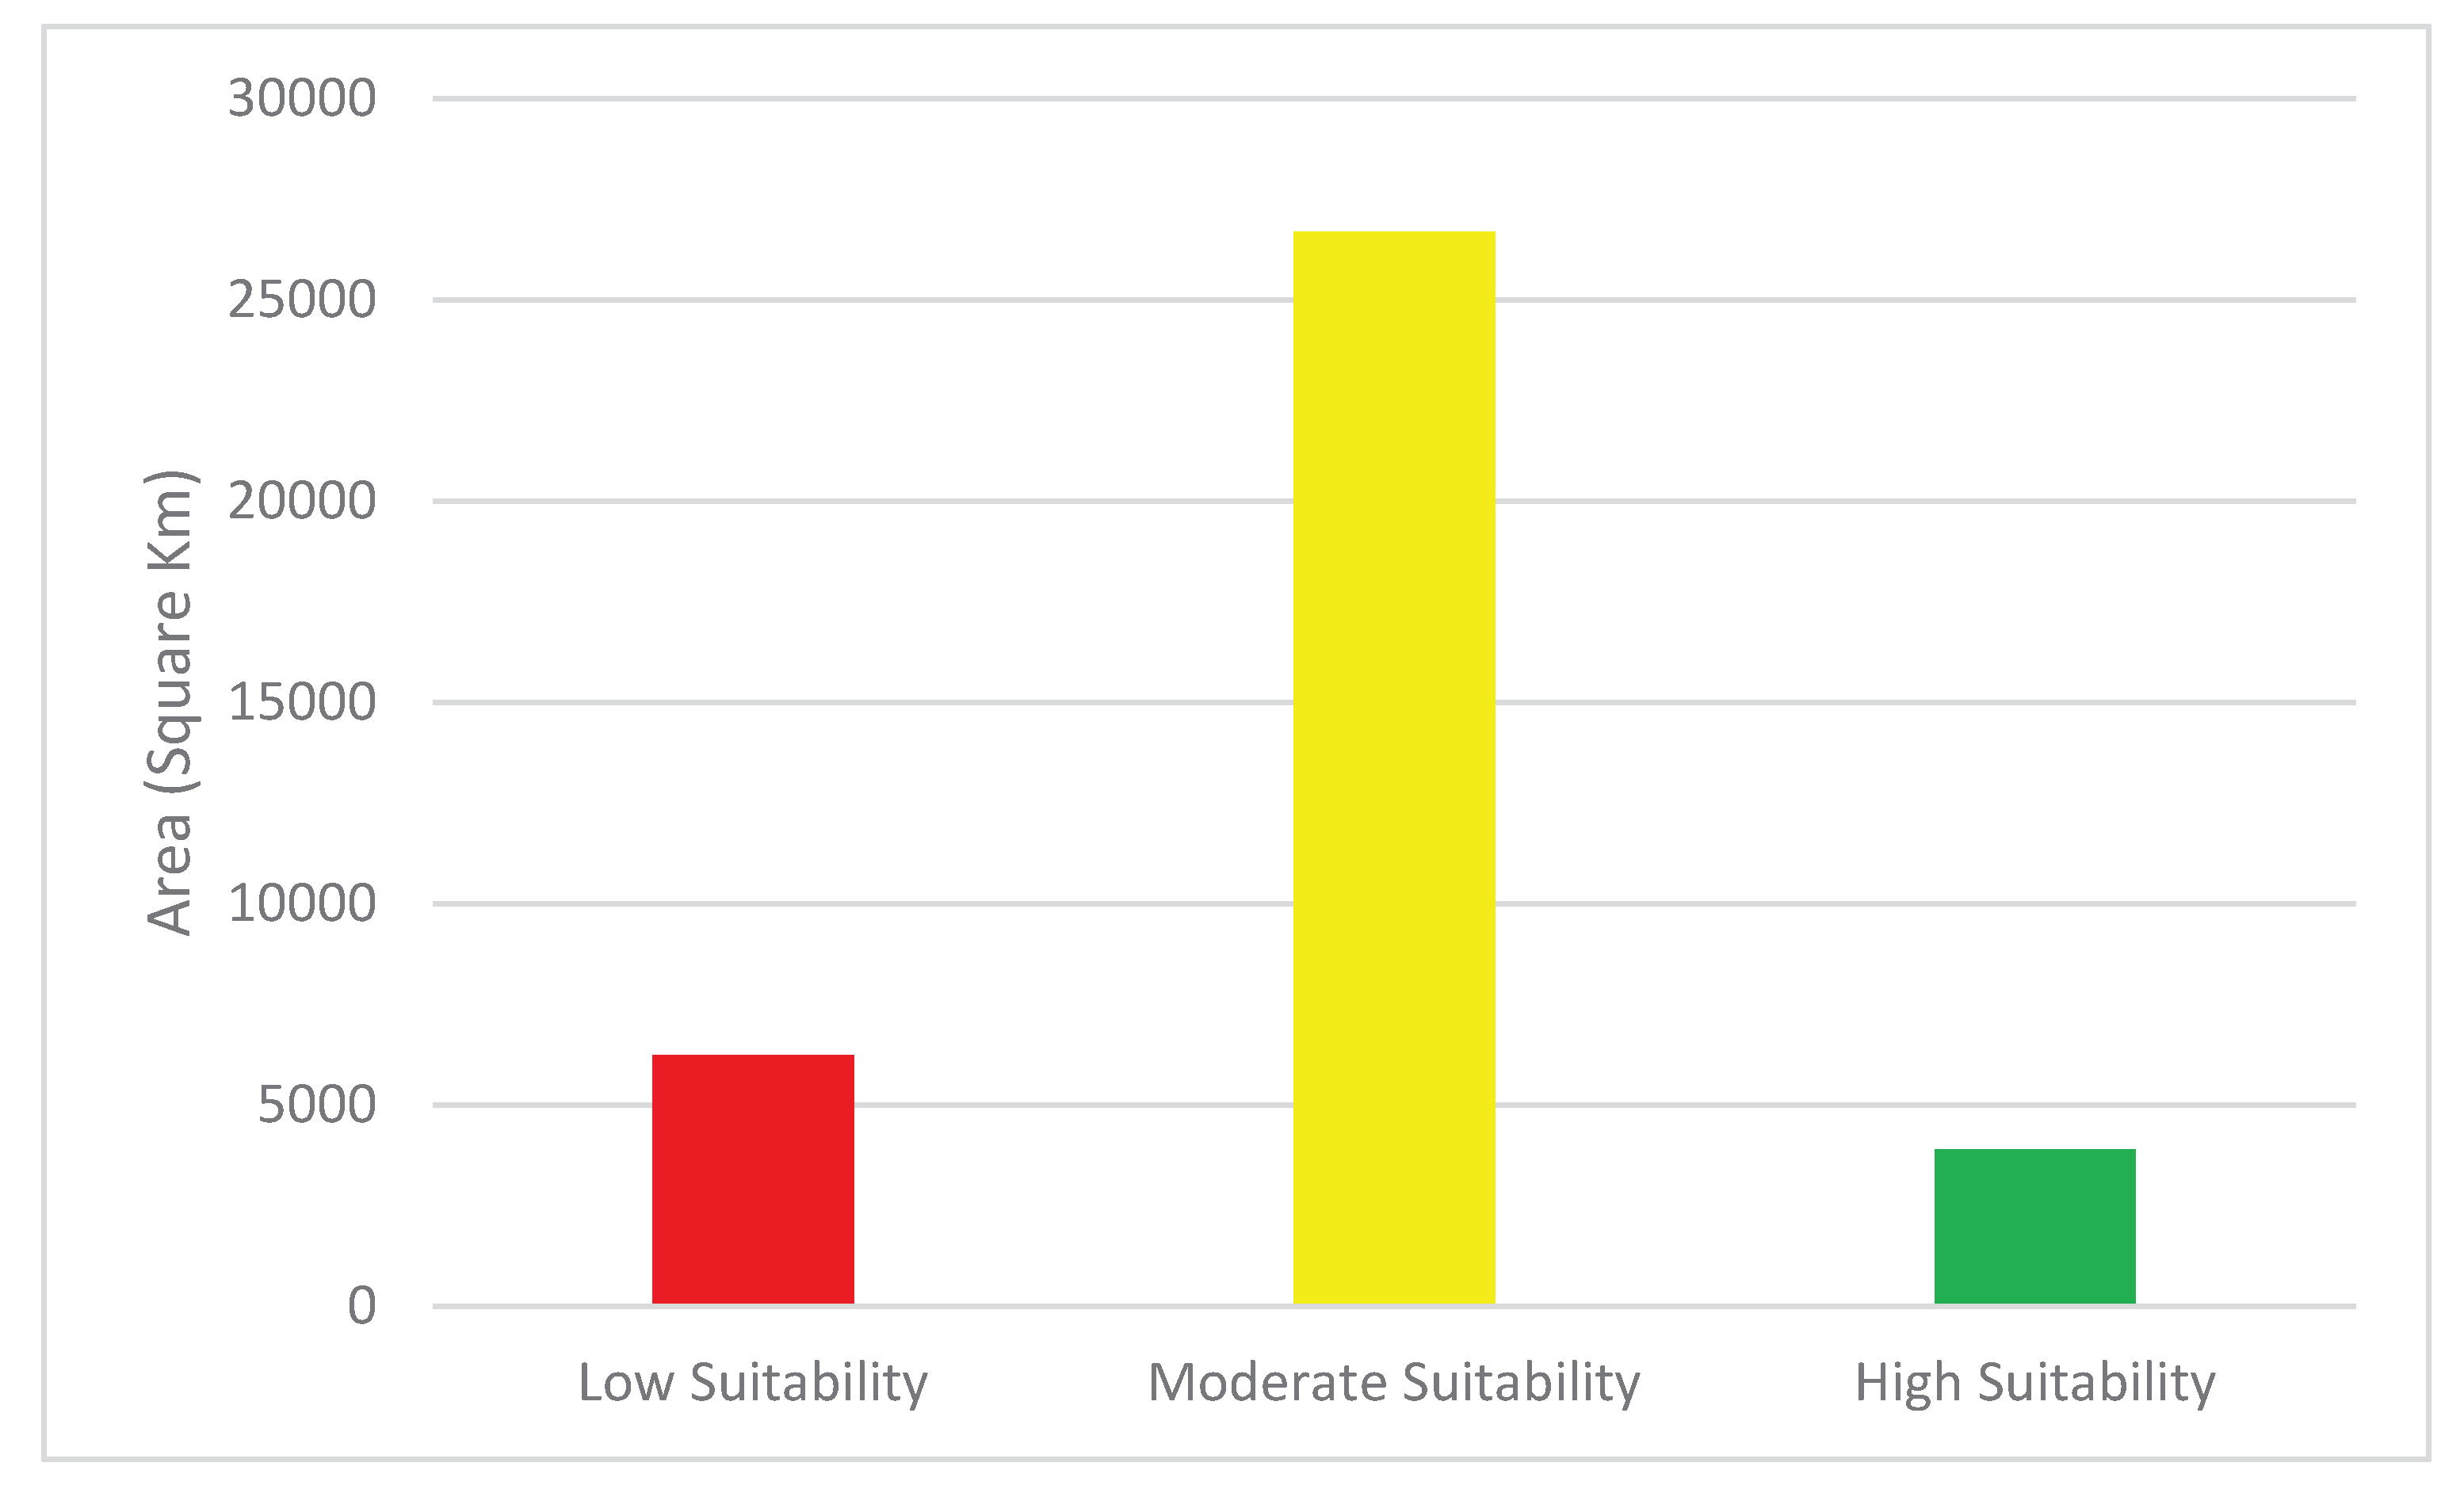
Table 1.
Primary environmental datasets used in the computational framework for assessing vegetation degradation and desertification in Saudi Arabia’s protected areas.
Table 1.
Primary environmental datasets used in the computational framework for assessing vegetation degradation and desertification in Saudi Arabia’s protected areas.
| Parameter | Data Source | Resolution / Purpose |
| Spectral Indices (NDVI, BSI) | Sentinel-2 MSI | 10–20 m; Vegetation greenness and soil exposure analysis |
| Land Surface Temperature (LST) | Landsat-8 OLI/TIRS | 30 m; Surface heat and thermal stress mapping |
| Precipitation | CHIRPS v2.0 | 0.05° (~5 km); Long-term rainfall pattern analysis |
| Soil Type | FAO Soil Map of the World | 1:5,000,000; Soil classification and fertility assessment |
| Land Cover | ESA CCI Land Cover | 300 m; Vegetation and land-use categorization |
| Topography / Distance to Wadis | SRTM DEM (30 m) | Elevation, slope, and hydrological modeling |
Table 2.
Suitability classification for vegetation degradation assessment.
| Suitability Class | Description |
| High Suitability | Areas with dense and healthy vegetation cover, low BSI, moderate LST, and close proximity to water sources. |
| Moderate Suitability | Transitional landscapes where vegetation cover is partially degraded but retains ecological potential. |
| Low Suitability | Areas showing severe vegetation degradation, soil exposure, and high desertification risk. |
Disclaimer/Publisher’s Note: The statements, opinions and data contained in all publications are solely those of the individual author(s) and contributor(s) and not of MDPI and/or the editor(s). MDPI and/or the editor(s) disclaim responsibility for any injury to people or property resulting from any ideas, methods, instructions or products referred to in the content. |
© 2025 by the authors. Licensee MDPI, Basel, Switzerland. This article is an open access article distributed under the terms and conditions of the Creative Commons Attribution (CC BY) license (http://creativecommons.org/licenses/by/4.0/).
Copyright: This open access article is published under a Creative Commons CC BY 4.0 license, which permit the free download, distribution, and reuse, provided that the author and preprint are cited in any reuse.


