
Submitted:
16 October 2025
Posted:
16 October 2025
You are already at the latest version
Abstract
The objective of this research is to investigate land cover changes (LCC) and their key factors that influence their likelihood of occurrence in Al-Ahsa Oasis between 2000 and 2020. A two-stage methodology was employed, first estimating the LCC level using GIS and ENVI on digital data gathered from satellites visualizations (LANDSAT), and then calculating the LCC occurrence variables using a binary logistic model (BLM) based on data from 105 surveyed farmers. The major findings reveal a decline in the vegetation area by 324.35 ha and in the desert area by 1625.81 ha, while the areas of bare ground and the city have increased by 1389.79 ha and 560.37 ha, respectively. According to the BLM findings, climate change, increasing farmers' ages in categories (2), (3), and (4), and small holding size raised the likelihood of LCC occurrence, with odds superior than 1. Whereas, the use of modern method of irrigation, the use of modern technology, and the availability of scavenger manpower in the oasis negatively impacted the LCC occurrence. Their odds ratios are inferior than1. The urban sprawl had a non-significant negative effect. To preserve the Oasis agricultural identity, the researchers advocate for awareness and extension efforts directed at the elderly, traditional production practices, and large-scale producers, and fighting against climate change effects.
Keywords:
land cover change
; GIS
; Binary logistic model
; climate changes
; Saudi Arabia
1. Introduction
Al-Ahsa Oasis is situated in the eastern region of the Kingdom of Saudi Arabia. It is characterized by a mosaic topography in which the texture is formed by vegetation, urban, bare soil, and sand. For instance, the total delimitation of the Al-Ahsa oasis, which occupies 191450 ha, includes an agricultural area of 63467 ha, a residential area of 33000 ha, a government area of 18000 ha, public facilities of 13000 ha, and commercial and mixed land of 8000 ha. The remaining area constitutes the bare land with 28000 ha, while it is surrounded by sand on the periphery [1]. The profile of the land use of the region is detailed as follows:
- Al-Ahsa has emerged as the world’s largest oasis thanks to its affordable water resources. The crop cultivation occupies 56,000 ha and grows more than 2.5 million date palm trees [2].
- The city surrounds the agricultural area. In 1950, the area of the city occupied 360 ha; it expanded to 7650 ha in 1990 and to 28700 ha in 2014. Plans expect the area to account for 41600 ha in 2030 (1450 H).
The bare land is composed of white land that intersperses the city, and the other is created by land rehabilitation issued from the desert. In the city development plan of 2014 (1435), the vacant land was estimated at 35% of the total, of which 20% (5450 ha) was within the existing built form (only 7% of total land available for urbanization within the growth boundary). While inside the 2030 (1450 H) boundary, 45% of land is vacant, which includes the 18,610 hectares of areas planned outside its current footprint.
Furthermore, the report of the [1] noted that some measures have been taken in order to control the moving process of Al-Ahsa land use. For instance, in order to avoid an erratic growth of the city, the municipality (Al-Amanah) has implemented many development plans and updated them when it was necessary to make the architectural city (roads, canalization of water and used water, electricity, connections, governmental services, etc.).
Concerning the underdeveloped land (white land), it has been the major cause of the housing shortage because of the monopolization of private owners, who value it. For that, in order to avoid the extension of the city over the planed boundary while white land is interspersed with the town, the government issued the White Lands Tax Law13, which imposes an annual land tax of 2.5% of the value on 'white land', which is defined as vacant land located in 'populated areas', zoned for residential or dual residential and commercial use. Concerning the agricultural area, it remains over the boundary of the city, which also has a Development Protection Boundary, which is intended to protect it outside the 1450 Urban Growth Boundary from being developed.
Whereas, the land use changes that took place during the previous period seemed to be unregulated. Thus, [3] assessed the land surface cover changes in Al-Ahsa Oasis between 1985 and 2017. The authors pointed out urban sprawl (144.44%) and sand dune expansion (1.68%) in detriment of the shrinkage of vegetation and bare land areas (-6.85% and -20.63%, respectively).
In the same direction, [4] raised the issue of urban growth in Al-Ahsa Oasis, leading to deterioration of the vegetation area. In this context, the Al-Ahsa agricultural land is still facing a significant encroachment of the city, or the bare phenomenon. For that, the current research asks about the risk level of deterioration of the vegetation area in Al-Ahsa. In addition, the land use change process has occurred during the last period. Because there is no explanation of the causes of the land use changes in the region except some general speech about climate change or agricultural practices, the objective of our research is to assess land cover changes and investigate their social, economic, and agricultural key factors in Al-Ahsa Oasis, Saudi Arabia, during the period 2000–2020. The analysis will be done in two stages. First estimating the land use changes, the second will test the effect of socio-economic and agricultural variables on the LCC.
In order to respond to the question of the current research, literature has explained LCC by agricultural practice and farmers' economic behavior, climate change impact is then explained by ecological theories, urbanization expansion and lifestyle changes are explained by the development process, and the utilization of natural resources is explained by environmental theories [5]. Indeed, according to [6], the literature review identified significant drivers of land use and land cover (LULC) change categorized into natural and artificial origins. Using quantitative data among five major land types for twelve states in the south-eastern United States (SEUS) from 1945 to 2012, the authors concluded that forest land accounted for 12% of the change and agricultural land for 20%, attributed to environmental changes in the region.
In addition, [7] investigated the relationship between land use, land cover change, and the alteration of sustainable development and livelihood systems, in addition to other changes in the biogeochemical cycles of the earth, affecting mainly the atmospheric greenhouse. This is confirmed by the work of [8], who have studied the dynamism of land use and its effect on land cover change in a tropical region. They noticed that land use itself depends on changes in cropland, agricultural intensification, deforestation, pasture expansion, urbanization, resource scarcity, changing market behaviors, outside policy intervention, loss of adaptive capacity, social organization and attitudes, and changes in ecosystem goods.
It should be noted that the LULC changes have the same natural and artificial drivers ([6]. In order to evaluate the level of LULC changes in the Kashmir valley between the periods of 1992–2001–2015, [9] used a set of compatible moderate resolution Landsat satellite images. Results showed a consistent increase in area, of which LULC changes have occurred for built-up (198.45%), plantations (87.98%), pasture (−71%), water (−48%), and agriculture (−28.85 %). In the coastal region of Bangladesh, during the period of 1990–2017, the LULC changes areas experienced mainly a net increase in agricultural land (5.44%), built-up area (4.91%), and river area (4.52%). While vegetation cover experienced a net decrease (8.26%) [10]. The LULC may undergo drastic changes, as has happened in Lahore between 1994 and 2024, when the city's built-up area increased by 359.8 km² due to rapid urbanisation, while the amount of vegetation covers and barren lands decreased by 198.7 km² and 158.5 km², respectively [11].
In order to explain the main causes of the LULC several researches have been developed in the topic. For instance, [12] demonstrated that land-use and land-cover changes are influenced by a wide range of biophysical and societal factors working on several spatial and temporal levels. At the level of the individual land unit, which is the subject of this research, the author precisely specified biophysical characteristics such as local climate and weather, terrain, bedrock and soil type, surface water and groundwater. Socioeconomic factors to think about are Capital, regional land-use structure, transportation costs, profits, parcel size, competition, transportation costs, product prices, governmental and private financial support, land-management practices, land tenure, and ownership.
Concerning the question of to what extent climate change affects land cover, some researchers tried to respond, such as [13], who showed that with regional climate and land cover projections by 2080, the potential threat for more than 2500 plant species at high resolution (2.5 × 2.5 km) in the French Alps is expected to vary depending on the species' preferred altitudinal vegetation zone, rarity, and conservation status. This result is confirmed by the conclusion that climate change, notably a warming climate, is expected to strongly impact biodiversity in mountain environments [14]. In addition, Californian state tree cover loss from 1986 to 2019 mainly occurred in 2018 (1901 km2), 2015 (1556 km2), and 2008 (1549 km2), which are apparently driven by climate stress, and wildfires sharply increased during hotter multi-year droughts [15]. Also, for the period of 1999–2007, [16] found a strong correlation between land surface temperature (LST) and LULC classes in Penang Island, Malaysia, with an increase in urban (highly built-up) and grassland areas and a decrease in barren land and forest areas. Concerning the work of [17], it demonstrated that the possible effects of climate change (annual air temperature and precipitation) on LULC suitability in the Southern Brazilian Semiarid Region between 1970 and 2000 might result in croplands losing around 8% of their area, while pastures expanding by up to 30%.
The other important factor, urban development impact on LULC changes, is confirmed in many research studies, such as those conducted in Bangladesh in 1975 and 2003. [18] evaluated land use, cover changes, and urban expansion using satellite images and socio-economic data surveys. The analysis revealed a substantial growth of built-up areas to the detriment of a significant decrease in the area of water bodies, cultivated land, vegetation, and wetlands. The same conclusion: the expansion of urban areas annually by about 12%, 14%, and 5%, respectively, caused a total of 242.2 ha of expropriation of farmland during 2004–2009 in northwest Ethiopia [19]. Furthermore, [20] found that for the city of Hanoi, the LULC change was significant due to urbanization and industrialization. In this context, [21] found that urban sprawl and agricultural abandonment, geography, and ecological factors are the primary causes of landscape degradation in the El Maresme County of the Spanish Mediterranean coast between 1850 and 2005.
Risks of fire, harvesting spoilage, and pests could constitute a significant factor in LULC changes. To demonstrate that, [22] studied land cover change patterns from 2001 to 2016 in the USA using the 2016 National Land Cover Database (NLCD) for land cover, urban imperviousness, tree, shrub, herbaceous, and bare ground fractional percentages. Results revealed that land cover change is significant across most land cover classes and the time period 2001–2016, about 8%. Nearly 50% of that change involves forests, driven by harvest, fire, disease, and pests. Agricultural change represented 15.9% of the change, a substantial decline (-7.94%) in pasture and hay. Grass and shrub change comprise 14.5%, with most change resulting from fire.
It should be noted that human activities such as the utilization of natural resources and pastures represent an important factor influencing the LULC changes. [23] examined the impact of conservation levels on land cover change in Spain between 1987 and 2006. Results showed high land cover persistence (93%) throughout Spain, but with important enthronization processes and internal changes in natural areas, which experienced a slight decrease, while agrarian areas remained almost stable. However, there were significant differences in the occupation, intensity, and direction of change depending on the biome and protection level.
In recent decades, human activities have gained prominence as a major source of LULC changes. Indeed, [24] discovered that individual land cover changes in German Highland districts between 1945 and 1999 were linked to socioeconomic and environmental factors. [25] confirmed this finding, reporting that 73% of LULC changes in Dar es Salaam, Tanzania, from 1995 to 2022 were caused by socioeconomic factors, with the remaining factors being related to population density and proximity to the city core. GDP and distance to roadways have no meaningful effect. In contrast of local factors’ concept, according to the [26] conclusion, global forces become the primary determinants of LU changes because they either amplify or attenuate local factors: population, poverty, and responses to economic opportunities (mediated by institutional factors), as well as opportunities and constraints for new land uses (created by local and national markets and policies).
Focusing their research on socioeconomic factors as determinants of LULC changes, [27] found that relevant variables in Sierra de Albarracín, Spain, between 1984 and 2007 led to increased forestland and pastureland, whereas rainfed farmland was abandoned. Many of them are demographic shifts resulting from a continual process of rural abandonment (large internal migrations to adjacent towns) and economic activity shifting to the tertiary sector, primarily rural tourism. In the same context but from another point of view, [28] studied the effects of socioeconomic characteristics (gender, age, education, wealth status, household size, and residence status) in Zambia using a sample of 372 households that had lived in the region for 5 years. The authors showed that agricultural expansion and population growth were major drivers of forest cover shifts. Social and economic issues confronting local people influenced deforestation. Confirmed by the work of [29], which set out to investigate the dynamics of land use and optimization in East Guangdong Province, China, from 2000 to 2020. The findings revealed considerable changes in farmland and built-up land during the research period. The authors used natural and socioeconomic factors to optimize land usage and construct a future land-use management plan.
In their review of the impacts and dynamics of LULC changes in semi-arid mountainous catchments,[30] discovered that key drivers include agricultural expansion, population growth, urbanization, and infrastructure development, which transform forests and grasslands into built environments, affecting ecosystem services and biodiversity.[31] attribute the LULC changes, on shorter time scales, to disturbances such as storms, floods, fires, volcanic eruptions, insects, landslides, as well as human activities such as population change, industrial and urban development, deforestation or reforestation, water diversion, and road construction. In this context of coupling socioeconomic factors and natural ones, [32] examined how earthquakes affected land use, land cover, and hydrological processes in Japan's Atsuma River Basin from 2015 to 2020. The key findings revealed that the earthquake and landslip had turned roughly 10% of the basin's forest into bare land. The key causes were sediment transport following the earthquake, which was approximately 3.42 times greater than previously, and runoff in 2020 was somewhat higher than in 2015. The authors expected that human activities would diminish sediment movement in the basin.
Agricultural practice effect was approved by [33]. He assessed the effect of agricultural production systems on LULC, which lies in cropping systems and changes in agricultural land use, which are caused by changes in land management practices for analyzing the performance of land activity-related policies, agricultural policies, and agricultural inputs.
The study is set up as follows: The introduction is included in the first section. The methods and materials are included in the second section. The results and discussion are presented in the third and fourth sections, respectively. Finally, the conclusions are designed in the fifth section.
2. Materials and Methods
2.1. Data Description
Data was collected using a digital survey, satellite images (the visuals of Landsat 7 and 8), and a survey on a sample of 105 farmers in Al-Ahsa Oasis. This enabled to assess the land cover changes as well as analyzing its occurrence determinants basing on agricultural, social, and economic factors for both the 2000 and 2020 seasons [34].
2.2. Analysis Methods
The methodology is prepared in two stages. The first stage aligns with the estimation of the LCC by using spatial images, GIS, and ENVI analysis. The second one has the objective of explaining the probability of the LCC event occurring based on a binary logistic model applied to the socio-economic and agricultural variables of farmers and farms.
The first stage concerns the estimation of the LCC level. It uses GIS tool. The GIS represents a coherent set of tools for collecting, storing, and retrieving data and transforming and displaying spatial data from the real world [35], a mapping tool [36,37], a tool of design and implementation of databases (Frank, A.V., 1988), and a tool of spatial analysis with an emphasis on analysis and modelling [38]. Recently, the GIS has been linked to standard statistical packages for exploratory data analysis, statistical analysis, and hypothesis testing [39].
The remote sensing program (ENVI 5.1) and the geographic information systems program (ARC GIS 10.2) were used in this study to detect the change in vegetation cover in the oasis by analyzing the digital data of the LANDSAT8 satellite visuals. To complete the study, two satellite images captured by the sensors (ETM + OLI) belonging to the American satellite (LANDSAT) were used for the years 2000 AD and 2020 AD, and they were obtained from the US Geological Survey (USGS), and the change in vegetation cover was determined through the index (NDVI) and the production of maps showing change over the study period. Normalized Deference Vegetation Index (NDVI) is one of the most widely used natural indicators in the field of analyzing satellite images and studying vegetation cover, desertification, landslides, and other natural phenomena. It is also a means to study changes that occur in vegetation over time.
Data will be collected by surveying a sample of 109 farmers in Al-Ahsa Oasis about agricultural activities, economic and social characteristics of the farmer, relying on spatial data represented by satellite visuals of Al-Ahsa Oasis (satellite visualization in 2000 AD, and a satellite visual for the year 2020 [34].
Data will be collected using a digital survey, satellite images, and a survey on a sample of 109 farmers in Al-Ahsa Oasis. This enabled him to know the most important social and economic factors for the 2000 and 2020 seasons based on the visuals of Landsat 7 and 8 using the ENVI program.
The approach proceeded with successive stages of building satellite visuals as follows:
- Stage of visualization: permit to make visible the zone in 2000 and 2020
- Stage of processing and improvement: allow to make group visualization layers (merge extents), which represent an integration of the bands in the visible space, and determine the appropriate electromagnetic beams to show the change in the vegetation cover.
- Stage of improvement and processing of satellite visuals. The satellite captures this visual, so it is exposed to the influence of atmospheric gases, dust, and others. The influence of the atmosphere was removed through engineering correction, and thus the visual is ready.
- Stage of cutting the study area: The study area was cut from the visual to be ready for analysis.
- Stage of interpretation and analysis: the classification is based on sample selection
- Stage of analysis and linking: it consists of changing detection statistics, positional changes, the image difference map, changing the image detection map, determining the change in vegetation cover through the (NDVI), and producing maps that show the change during the study period. The NDVI is one of the most widely used natural indicators in the fields of analyzing satellite images, studying vegetation cover, desertification, landslides, and other natural phenomena. It is also a means to study the changes that occur on the vegetation cover over time. It also gives us the health status of the plant and the value of the vegetation covers in any area [40].
The second stage consists of explaining the LCC event occurring due to the social, economic, and agricultural characteristics of farms. The logistic regression model will be used to simulate and analyze the effects of independent variables on the probability of land cover change occurring. The form of the binary logistic model [41] is as follows:
p(y) stands for the probability of the dependent variable LCC event occurring, which is a binary variable having values: 0 when there were no changes and 1 when there were land cover changes between the periods of analysis (2000–2020).
β: are the coefficients of the independent variables or predictors.
x: are the independent variables: Predictor variables are: farmer social variables (age, social status, educational level, years of experience, number of family members, total area of possession), Economic variables of the farm (area of possession of khlas, methods of irrigation, the goal of cultivation, type of possession, benefit, lack of productivity, labor nature, labor type, holding size), and agricultural practice specificities (land rent, agricultural machinery, fertilizer (organic or chemical), number of dates trees of khlas, number of other dates trees, unavailability of scavenging manpower, not using modern technology, small holdings, High spoilage rate of dates, abundant water required).
3. Results
3.1. Measuring of LCC Level
The evaluation process of measuring the changes level was done in two stages, as follows: The first one consists of repairing two digital satellite images for the year 2000 (Figure 1) and the year 2020 (Figure 2), and then the superposition of the two pictures permits to show the change in the land cover of the oasis during the period of study (picture 3). Satellite images were analyzed using the ARCGIS ENVI program. The land cover classes in the oasis were vegetation, sand, urban, and soil. These classes have existed in a dynamic way. Each one is related to the other by the fact that when a class of them changes, it induces changes, at least in one of the others.
The satellite image (Figure 1) depicts the diversity of the oasis topography in the year 2000, as it contains sand, soil, urban, and oasis vegetation. For instance, the total analyzed area accounted for 437.1568 square kilometers (Km2), or 43715.68 ha; it included 112.8678 km2 (11286.78 ha) of sand, representing 25.82%. The vegetation area covered 3962.62 ha, occupying 9.06% of the total, whereas the city took 2972.78 ha, or 6.8% of the whole area, and finally the soil had about 254.9358 Km2 (25493.58 ha), or 58.3%.
The satellite image (Figure 2) shows the situation in the year 2020 for the same area identified in the year 2000. It highlights the mixture of sand, soil, urban area, and vegetation in the Al-Ahsa Oasis. The sand area became 96.6097 km2, or about 9660.97 ha, or 22.1%. The vegetation occupied 3638.28 ha, estimated at 8.32%, while the area of the city reached 3533.5 ha, 8.1%. Finally, we note that the soil area accounted for 26883.36 ha, or 61.5%.
The two graphs' analysis demonstrates how the mixtures changed between 2000 and 2020. The findings show that between 2000 and 2020, the land cover in the Al-Ahsa Oasis region changed (Figure 3).
Table 1 shows the evolution of the mixture of sand, soil, vegetation covert, and the city between 2000 and 2020 in the same area of Al-Ahsa Oasis. It should be noted that the columns highlight the mixture component statistics in 2000, while the lines represent the situation of components in 2020. In addition, the table shows the changes in the area of each component, the source of the changes, and their volume in square kilometers. Therefore, it constitutes a cross-table of transformation flows from one topography component to another.
Results showed that vegetation cover area and desert have reduced by 3.2435 km2 (324.35 ha) and -16.2581 km2 (-1625.81 ha) respectively, while bar land (soil and city have increased by 1389.79 ha and 560.37 ha respectively.
3.2. Investigation of LCC Occurring Key Factors
Concerning the identification of key factors of the LCC occurring probability, results are obtained from the running of the binary logistic model show the predictors’ effects on the LCC occurring probability during the period of study.
Running the model, considering all variables of socioeconomic and problematic factors, mainly climate changes and urban sprawl, the results showed a bad fit of the model. For that, we split variables into blocs of social, economic, and problematic variables that happened during the period of the analysis (2000-2020). Then, we obtain three versions; by using the Entry version, they give results presented by the omnibus tests of the model coefficient, indicating a good fit of the model compared to the null model, with significant Chi-square values equal to 53.8, 25.9, and 122.5 (p = 0.000), respectively. The improvement of the model’ fit is confirmed by the [42] show tests, which present an adequate fit to the data with a significant statistic of 3.93 (p=0.788), 1.783 (0.987), and 2.899 (p=0.716), respectively, for the three above versions. The model summary [43] highlights an R-squared equal to 53.5%, 29.2%, and 91.8%, respectively, of the change in the criterion variable that can be accounted for by the predictor variables in each model version.
Finally, the classification tables show that the model versions classified 79%, 73.3%, and 93.3%, respectively, of cases overall, which means the rate of prediction if one farm has undergone a land cover change or not, then it provides an indication of how well the model versions are able to predict the correct category one when the predictions are added to the study. In addition, it provides the sensitivity of the model in terms of predicting group membership on the dependent variables at levels of [78.8 and 79.2], [67.3% and 79.2%], and [96.2 and 90.6], respectively, for 0 and 1. The results of the model versions are presented in Table 2, Table 3 and Table 4 as follows:
4. Discussion
Results show that the vegetation cover in Al-Ahsa Oasis has declined by 3.2435 km² (324.35 ha), accounting for 8.18% of the total area in 2000. This is comparable with the 8% recorded in [17]. It resulted from the difference between its deforestation (cleaning) operation into other topographical forms of sand, soil, and urban areas in return for reforestation of these forms, producing a new vegetation area. These two phenomena of deforestation and reforestation of sand, soil, and cities are estimated at about 1094.68 ha and 770.33 ha, respectively. For that, the balance of vegetation covert indicates a negative evolution during the period 2000–2020 by -324.35 ha. Thus, the process shows that in 2000, the total vegetation area covered about 3962.62 ha, of which, during the period 2000–2020, 0.08 ha had been desertified to constitute a portion of the sand in the region, 135 ha had been exposed to urban sprawl, and 959.6 ha had been cleared for being soil. In return, the forestation process includes 344.22 ha of soil, 294.26 ha due to urban retreat from the oasis, and 131.85 ha due to the activity of resistance to desertification of sand. Statistics demonstrate that an area of 2867.95 ha of vegetation cover remained stable during the analysis period, 72.37%, which is about double the vegetation cover remaining unchanged for almost the same period (1995-2022) in Dar es Salaam, Tanzania, 34.2% [25]. For that reason, the area of vegetation cover occupied in 2020 was only 3638.28 ha, rather than 3962.62 ha in 2000.
The main causes of the negative changes in vegetation cover are deforestation, urban sprawl, and desertification. Thus, the Alahsa Oasis region passes by a period of farms’ absenteeism. The owners of farms employ a worker who guards only their possessions without exploiting them. Farmers explain their behavior on one side by water scarcity due to climate change in the last period, such as sandstorms, droughts, and high temperatures, which destroyed these plants, provoked water scarcity, and enhanced desertification. On the other side, a great part of the oasis has been involved in the Alahsa city and municipality changing their agricultural status to urban. For that reason, the city has been expanded to the detriment of the oasis by the urbanization plans of the municipalities, which targeted the construction of popular housing and agricultural tourism through the private construction of agricultural rest houses. Another economic vocation of the oasis land is that it hosts other industrial and trade activities rather than agricultural ones.
In turn, the agricultural oasis land has benefited through the reversed process of area gain flow, which has increased the vegetation area but had less spread and impact than the losses’ flow. The process involves forestation and land reclamation, the retreat of the urban area, and resistance to desertification. The origins of these additions were multiple. The first is the public and private effort of forestation and dirt reclamation through new plantations of bare soil; the rehabilitation of the bare land has been done by strengthening the soil through fertilizers, especially organic ones. The urbanization of the oasis has been limited by some regulations. Thus, in 2019, a ministerial committee was implemented to prevent encroachments on Al-Ahsa Oasis in all its forms [44]. It is composed of representatives of the ministries of environment, water, and agriculture, municipal and rural affairs (Al-Ahsa Municipality), the general authority for tourism and national heritage, and the general irrigation corporation. Many measures are suggested by this committee, mainly reducing urban encroachments on agricultural lands. In addition, the committee has called for setting architectural standards to consolidate the heritage identity in the cities and villages close to the agricultural oasis, rehabilitating government buildings within the scope of the Oasis, including urban landmarks that reflect the agricultural identity of Al-Ahsa, the establishment of agricultural investment companies in Al-Ahsa, the establishment of a modern agricultural city to be a nucleus for agricultural innovations, and the planning of modern tourist facilities.
Concerning the desert area, the sand covered in 2000 an area estimated at 112.8678 km2, or 11286.78 ha. During the period 2000–2020, the desert area underwent a great operation of rehabilitation of 3685.81 ha, stopping desertification, reforestation of 131.85 ha, and urbanization of 355.81 ha. Through that, in total, the desert lost an area of 4172.925 ha. Whereas, it has gained in total 2547.15 ha due to the desertification process of an area estimated at 2547.07 ha of desert soil bordering and 0.08 ha of vegetation covert. For that, in 2020, the total area of sand was estimated at 9660.97 ha, and the balance of changes was negative at a level of -1625.81 ha, representing 14.4% of area in 2000. It reflected the impact of national, regional, and local public and private efforts in fighting against desertification.
The public program has allocated a great deal of interest and concern to environmental issues, mainly the anti-desertification interventions that change the desert to bare soil in the first stage, which will be used in different ways such as construction and agricultural activities, while the little area that has been planted and oriented to vegetation. The positive balance could be better if efforts were also oriented to protect the existing bordering soil against desertification, which has been exposed to sandstorms, farmer neglect, and non-exploitation of these soils caused by the low yield, irrigation water scarcity, and changing agricultural modes.
As for the urbanization process, results showed an expansion of construction, reflecting a positive change in the city during the 2000–2020 period. For instance, in 2000, the total area of the city was 2972.78 ha. During the period of 2000–2020, the city lost 1582.10 ha due to the dis-urbanization process of a great area of 1287.83 ha for profiting the soil area.
The retreatment of the city has been intense on the south-west side of the city, which is bordering the desert, where the wellbeing is less comfortable than on the other side of the city, which is bordering the Oasis, and vegetation can ameliorate the condition of living, confirming the results found by [4]. The rest of the city has been converted to vegetation cover, estimated at about 294.26 ha. On the other hand, the city has crawled by about 2142.47ha during the period 2000–2020. The expansion of the city has been done to the detriment of the bordering bare land, estimated at about 1651.66 ha. Second, the sprawl of the city has been done to the detriment of the desert at about 355.81 ha, and the vegetation covert is estimated at 135 ha. The balance of the expansion of the city during the period of study was 560.37 ha toward the north-east side, representing an increase of 18.85% of the city area during 2000-2020, which is smaller than the increase witnessed in the Lahore region between 1994-2024, which was around 59.11% [11].
These transformations can be explained by the urban plans of the Municipality of Al-Ahsa and the national strategies designed to regulate urbanization and urban development in general. Concerning the city's sprawl of vegetation and agricultural area in general, this can be explained by the land or farm owners’ behaviors, which look for the value of their land through reusing it for leisure and entertainment in comparison to agricultural activities, specifically within the scarcity of water and soil productivity reduction, which were the main factors of change.
Finally, the most significant shift in soil area appears to have occurred over the last two decades. At 1389.79 ha, it increased by 5.45% of total soil area in 2020 compared to 2000, which differed from what was found by [11], who reported a decline of 66.86% of its area in 1994. Thus, in 2000, the total area of soil occupied 25.9358 km2, or 25493.58 ha, for the studied region. During the period 2000–2020, the area losses flow totaled 4542.94 ha, of which 2547.07 ha have undergone desertification, 1651.66 ha were sprawled by urban expansion, and only 344.22 ha were rehabilitated and reforested to be included in the vegetation covert and have agricultural status. In the reverse flow during the same period of study, the soil area has gained about 5932.73 ha. The gain flow has been issued from a rehabilitation of the desert and protection against desertification processes of 3685.3 ha, a retirement of the city of 1287.83 ha, and a cleaning and deforestation of the oasis vegetation of 959.6 ha. For that, the total area of soil in 2020 occupied 26883.36 ha.
In general, the process of soil augmentation during the last twenty years was the result of several factors, such as climatic changes, droughts, winds, and severe sandstorms. In addition to the phenomenon of afforestation and reforestation of oasis vegetation due to economic activity changes, and finally, the process of urbanization such as the city sprawl or its retreatment to the detriment of bare land that is not wooded and prepared for the spread of desertification, etc.
The estimation of key factors influence shows a meaningful relationship. First, the social variables used in the analysis seem to have no effect on the land cover change, except the variable of age of the farmer. This last has a significant positive global effect (p=0.000). By group membership, the age of group 1 (18–28 years) has a non-significant predicted effect in coefficient value log-odds value equal to 23.759, with probability p= 0.999. Whereas the other age categories: age 2 (29–39 years), age 3 (40–50 years), and age 4 (51–61 years) have a significant positive effect of 4.475, 2.716 and 2.086, with a probability of significance of 0.000, 0.000, and 0.008, respectively. This means that for a change of one unit (year) of the age (2) group, there is an (Odds Ratio) 87.78 change in the probability of land cover change. For the age (3) group, its change by 1 year induces a change of 15.12 in the probability of the land cover change. Finally, for the age predictor, category 4 changes by 1 unit, resulting in a change of 8.05 in the probability of the land cover change (LCC). In the case of these three age categories, the Odds ratio is greater than 1, which means that the probability of falling into the target group of LCC is greater than the probability of failing into the non-target group of no land change cover (NLCC). The event of the LCC is likely to occur. These findings did not fully confirm what researchers had previously hypothesized [28]: that LULC is influenced by a variety of farmer social characteristics, including education, gender, wealth position, household size, and residential status. Only age had an impact on the LCC in this study.
Regarding the economic predictors, only the method of irrigation shows a significant effect with a probability of 0.014. Specifically, category (2) of the use of modern method has a significant negative effect, with a log-odds value of -1.307 and a probability of p = 0.004. It means that a one-unit change in the farm's irrigation method results in a 0.271 change in the probability of LCC. Additionally, the odds ratio is less than 1, indicating that the likelihood of falling into the LCC group is lower than the probability of falling into the non-target group of the NLCC. This suggests that the modern irrigation method helps stabilize LCC by reducing its occurrence.
As for the events happened during the period object of the study, results highlighted four predictors appear in the equation. Thus, the utilization of modern technology has only an effect on group membership (1), which has a significant negative log-odds value equal to (-5.247) with a probability of 0.016. This means that a change in the non-utilization of modern technology (1) by 1 unit introduces a change of 0.005 of LCC. While the probability of the event of LCC occurring is unlikely to occur because the Odds ratio is inferior to 1. Thus, the probability of failing into the LCC group is less than the probability of failing into the non-target group of the NLCC.
The same effect is observed for the availability of scavenger manpower predictor, with a significant and negative log-odds value for the category (1). The results show (-3.378), with a probability equal to 0.016. It indicates that a change of the unavailability of the scavenger manpower (1) by 1 unit (individual) introduces a change of 0.034 of LCC. Hence, the probability of failing into the LCC group is less than the probability of failing into the non-target group of the NLCC because the Odds ratio is inferior to 1.
In contrast to the two last predictors of agricultural practice, the small holding size of the farm (1) has a significant positive effect. The Log-Odds is equal to 5.296 (prob = 0.001). Then, a change in the small holding size by 1 unit makes a change in the probability of the LCC by 199.5, which is superior to 1. By that, it highlights that the probability of falling into an LCC event is greater than the probability of failing into an NLCC event.
Finally, the most important effect which required to be highlighted is the positive effect of the climate change predictor. Indeed, the Log-Odds is equal to 5.483 (prob = 0.026). Then, a change in the climate change by 1 unit makes a change in the probability of the LCC by 240.6 which is not only superior to 1 but also the highest effect of all predictors impacting the LCC. By that, it highlights that the probability of falling into an LCC event is greater than the probability of failing into an NLCC event.
According to the foregoing analysis, events happened during the period of 2000-2020 appears to have a considerable influence on LCC, which confirms what some other studies have noticed [12,26,30]. Concerning the socioeconomic aspects associated with farming, the current study does not indicate that all socioeconomic factors have a substantial effect on LCC. According to [24,25,26,28], all socioeconomic parameters have significant influence, which is not proven in our instance: the study of individual farm levels. This deficiency is the study's limitation, owing to the significant difficulty in obtaining data. The authors then urge that more factors be included in future LCC analyses, as well as researching the LCC at the aggregate level and its temporal dynamics.
5. Conclusions
The current study aimed to measure land cover changes and investigate its impacts on food security and environment in Al-Ahsa Oasis in the Kingdom of Saudi Arabia during 2000-2020 period for that, authors used a double objectives methodology in a first stage on Arc GIS and ENVI tool for estimating changes and in second stage statistics descriptive statistics for analyzing its impacts. Application was done on geographic data collected by remote sensing and satellite delimiting the frontiers of land cover components and a survey on a sample of 105 farms, describing social, economic, and technical information about them. is to find out the most important factors affecting the production and profit of date palm holdings. The main results show that land cover has changed between 2000 and 2020, as follows:
- Vegetation cover has decreased by 3.2435 km2 (324.35 ha).The desert (sand) area has decreased by 16.2581 km2 (1625.81 ha).
- The city area has been increased by 5.6037 km2 (560.37 ha).
- Bare land (soil) area has been increased by 13.8979 km2 (1389.79 ha).
The results of the binary logistic model highlighted that:
- The social variables of farmers have no effect on the occurrence of the LCC event, except that the age of the farmer increases the probability of the LCC occurring.
- Economic variables, such as methods of irrigation, the modern one have a significant negative effect on the probability of an LCC event occurring.
- happened events and agricultural practices, the utilization of modern technology, absence of scavenger manpower decreases the probability of LCC occurring, whereas the small holding size and the climate change increases the probability of LCC occurring. the urban sprawl has a non-significant negative effect.
The current study recommends a public-private partnership in order to control, reorient, and develop the objectives, policies, and strategies that valorize land use in al-Ahsa Oasis and fighting against climate change effects. So, more studies should be conducted in the field.
Author Contributions
Conceptualization, G.F.A and E.B.M.; methodology, G.F.A and E.B.M.; formal analysis, G.F.A, E.B.M. and A.A.E; investigation, G.F.A; writing—original draft preparation, G.F.A and E.B.M.; writing—review and editing, G.F.A, E.B.M. and A.A.E.; visualization, G.F.A, E.B.M. and A.A.E.; supervision, G.F.A, E.B.M. and A.A.E.; project administration, E.B.M.; funding acquisition, G.F.A, E.B.M. and A.A.E. All authors have read and agreed to the published version of the manuscript.
Funding
This research was funded by Deanship of Scientific Research—King Faisal University (KFU)—Saudi Arabia. Annual Funding Project Grant number 250857.
Institutional Review Board Statement
Not applicable.
Informed Consent Statement
Not applicable.
Data Availability Statement
The data presented in this study are available on request from the corresponding author.
Conflicts of Interest
The authors declare no conflicts of interest.
References
- Ministry of Municipal and Rural Affairs. Al-Ahsa City Profile. Ed. Herman Pennard, Salvatore Fondaro, and Costanza La Mantia. Future Saudi Cities Programme City Profiles Series: Al-Ahsa, Saudi, 2019. Available at https://saudiarabia.un.org/sites/default/files/2020-03/AL-HASA.pdf.(Visited 25/04/2024).
- SAGIA. Eastern Region Economic Report, 1434/1435, Review of Regional Planning in Saudi Arabia - The Case of the Eastern Region, FSCP Dammam City Review Report, FSCP National Spatial Strategy Review, UN-Habitat.2014.
- Almadini, A. M.; Hassaballa, A. A. Depicting changes in land surface cover at Al-Hassa oasis of Saudi Arabia using remote sensing and GIS techniques. PloS one 2019, 14(11), e0221115. [CrossRef]
- Mbarek, H.; Hajji, Z. Urban sprawl on agricultural areas and its environmental effects in Al-Ahsa Governorate using remote sensing technology and geographic information systems. Maǧallaẗ Buḥūṯ Kulliyyaẗ Al-Adāb - Ǧamiʿāẗ Al-Munūfiyyaẗ (Researches journal of literary college- university of Munufia) 2019, 30(17), 2213-2240. [CrossRef]
- Turner II, B.L.; Meyfroidt, P.; Kuemmerle, T.; Daniel Müller, D.; Chowdhury, R.R. Framing the search for a theory of land use. Journal of Land Use Science 2020, 15:4, 489-508. [CrossRef]
- Nedd, R.; Anandhi, A. Land Use Changes in the Southeastern United States: Quantitative Changes, Drivers, and Expected Environmental Impacts. Land 2022, 11(12), 2246; [CrossRef]
- Turner, B. L.; Skole, D.; Sanderson, S.; Fischer, G.; Fresco, L.; Leemans, R. Land-use and land-cover change: science/research plan, 1995. https://asu.elsevierpure.com/en/publications/land-use-and-land-cover-change-scienceresearch-plan-2.
- [No source information available].
- Lambing, E. F.; Geist, H. J.; Lepers, E. Dynamics of land-use and land-cover change in tropical regions. Annual review of environment and resources 2003, 28(1), 205-241. [CrossRef]
- Alam, A.; Bhat, M. S.; Maheen, M. Using Landsat satellite data for assessing the land use and land cover change in Kashmir valley. GeoJournal 2020, 85, 1529-1543. [CrossRef]
- Abdullah, A. Y. M.; Masrur, A.; Adnan, M. S. G.; Baky, M. A. A.; Hassan, Q. K.; Dewan, A. Spatio-temporal patterns of land use/land cover change in the heterogeneous coastal region of Bangladesh between 1990 and 2017. Remote Sensing 2019, 11(7), 790. [CrossRef]
- Tahir, Z.; Haseeb, M.; Mahmood, S.A.; Batool, S.; Abdallah-Al-Wadud, M.; Ullah, S.; Tariq, A. Predicting land use and land cover changes for sustainable land management using CA-Markov modelling and GIS techniques. Scientific Reports 2025, 15, 3271. [CrossRef]
- Briassoulis, H. Factors influencing land-use and land-cover change. Land Cover Land Use GlobChange. EOLSS 2009, 1:126–146.
- Thuiller, W.; Guéguen, M.; Georges, D.; Bonet, R.; Chalmandrier, L.; Garraud, L.; ... & Lavergne, S. Are different facets of plant diversity well protected against climate and land cover changes? A test study in the French Alps. Ecography 2014, 37(12), 1254-1266. [CrossRef]
- Pauli, H.; Gottfried, M.; Dullinger, S.; Abdaladze, O.; Akhalkatsi, M.; Alonso, J. L. B.; ... & Grabherr, G. Recent plant diversity changes on Europe’s mountain summits. Science 2012, 336(6079), 353-355. [CrossRef]
- Dwomoh, F. K.; Auch, R. F.; Brown, J. F.; Tollerud, H. J. Trends in tree cover change over three decades related to interannual climate variability and wildfire in California. Environmental Research Letters 2023, 18(2), 024007. [CrossRef]
- Tan, K. C.; Lim, H. S.; MatJafri, M. Z.; Abdullah, K. Landsat data to evaluate urban expansion and determine land use/land cover changes in Penang Island, Malaysia. Environmental Earth Sciences 2010, 60, 1509-1521. [CrossRef]
- Silva, L. A.; Sano, E. E.; Parreiras, T. C.; Bolfe, É. L.; Marcos, M.; Filgueiras, R.; Souza, C. M.; Silva, C. R.; Leite, M. E. Climate Change Effects on Land Use and Land Cover Suitability in the Southern Brazilian Semiarid Region. Land 2024, 13(12), 2008. [CrossRef]
- Dewan, A. M.; Yamaguchi, Y. Land use and land cover change in Greater Dhaka, Bangladesh: Using remote sensing to promote sustainable urbanization. Applied geography 2009, 29(3), 390-401. [CrossRef]
- Haregeweyn, N.; Fikadu, G.; Tsunekawa, A.; Tsubo, M.; Meshesha, D. T. The dynamics of urban expansion and its impacts on land use/land cover change and small-scale farmers living near the urban fringe: A case study of Bahir Dar, Ethiopia. Landscape and urban planning 2012, 106(2), 149-157. [CrossRef]
- Tran, D. X.; Pla, F.; Latorre-Carmona, P.; Myint, S. W.; Caetano, M.; Kieu, H. V. Characterizing the relationship between land use land cover change and land surface temperature. ISPRS Journal of Photogrammetry and Remote Sensing 2017, 124, 119-132. [CrossRef]
- Parcerisas L.; Marull, J.; Pino, J.; Tello, E.; Coll, F.; Basnou, C. Land use changes, landscape ecology and their socioeconomic driving forces in the Spanish Mediterranean coast (El Maresme County, 1850- 2005). Environmental Science & Policy 2012, 23,120-132. [CrossRef]
- Homer, C.; Dewitz, J.; Jin, S.; Xian, G.; Costello, C., Danielson, P., ... & Riitters, K. Conterminous United States land cover change patterns 2001–2016 from the 2016 national land cover database. ISPRS Journal of Photogrammetry and Remote Sensing 2020, 162, 184-199. [CrossRef]
- Martínez-Fernández, J.; Ruiz-Benito, P.; Zavala, M. A. Recent land cover changes in Spain across biogeographical regions and protection levels: Implications for conservation policies. Land Use Policy 2015, 44, 62-75. [CrossRef]
- Hietela, E.; Waldhardtb, R.; Otteb, A. Linking socio-economic factors, environment and land cover in the German Highlands, 1945–1999. Journal of Environmental Management 2004, 1–11. [CrossRef]
- Simon, O.; Lyimo, J.; Yamungu, N. Exploring the impact of socioeconomic factors on land use and cover changes in Dar es Salaam, Tanzania: a remote sensing and GIS approach. Arab J Geosci. 2024, 17, 99. [CrossRef]
- Lambin, E.F.; Turner, B.L.; Geist, H.J.; Agbola, S.B.; Angelsen, A.; Bruce, J.W.; Coomes, O.T.; Dirzo, R.; Fischer, G.; Folke, C.; George, P.S.; Homewood, K.; Imbernon, J.; Leemans, R.; Li, X.; Moran, E.F.; Mortemore, M.; Ramakrishnan, P.S.; Richards, J.F.; Skanes, H.; Xu, J. The causes of land-use and land-cover change: moving beyond the myths. Global Environ Change 2001, 11(4), 261–269. [CrossRef]
- Melendez-Pastor, I.; Hernández, E.I.; Navarro-Pedreño, J.; Gómez, I. Socioeconomic factors influencing land cover changes in rural areas: the case of the Sierra de Albarracín (Spain). Applied Geography 2014, 52, 34–45. [CrossRef]
- Handavu, F.; Chirwa, P.W.C.; Syampungani, S. Socio-economic factors influencing land-use and land-cover changes in the miombo woodlands of the Copperbelt province in Zambia. Forest Policy and Economics 2019, 100, 75–94. [CrossRef]
- Lai, Y.; Huang, G.; Chen, S.; Lin, S.; Lin, W.; Lyu, J. Land Use Dynamics and Optimization from 2000 to 2020 in East Guangdong Province, China. Sustainability 2021, 13, 3473. [CrossRef]
- Yono, A.; Mokua, R.A.; Dube, T. Remote sensing of land cover change dynamics in mountainous catchments and semi-arid environments: a review. Geocarto International 2025, 40(1), 2476602. [CrossRef]
- US-EPA: United states Environmental Protection Agency. Land cover: What are the trends in land cover and their effects on human health and the environment? Available at https://www.epa.gov/report-environment/land-cover. (Visited 08/04/2025).
- Chen, Y.; Nakatsugawa, M. Analysis of Changes in Land Use/Land Cover and Hydrological Processes Caused by Earthquakes in the Atsuma River Basin in Japan. Sustainability 2021, 13, 13041. [CrossRef]
- Xiao, Y.; Mignolet, C.; Mari, J. F.; Benoît, M. Modeling the spatial distribution of crop sequences at a large regional scale using land-cover survey data: A case from France. Computers and Electronics in Agriculture 2014, 102, 51-63. [CrossRef]
- Saudi Irrigation Organisation (SIO) – Kingdom of Saudi Arabia. Available at http://www.sio.gov.sa/ ( visited 10/12/ 2021).
- Burrough, P. A. Principles of geographic information Systems for hand resources assessment. Clarendon. Oxford.1986.
- Maguire, D. J. An overview and definition of GIS. Geographical information systems: Principles and applications 1991, 1(1), 9-20..
- McHarg, I. L. Design sixth nature, Doubleday, New York. 1969, cited in Maguire D.J. (NA): an overview and Definition of GIS.
- Mylopoulos, J.; Borgida, A.; Jarke, M.; Koubarakis, M. Telos: Representing knowledge about information systems. ACM Transactions on Information Systems (TOIS) 1990, 8(4), 325-362. [CrossRef]
- Burrough, P. A. GIS and geostatistics: Essential partners for spatial analysis. Environmental and ecological statistics 2001, 8, 361-377. [CrossRef]
- Jassim, H.; Nisreen, A. H. A course on remote sensing techniques and geographic information systems in detecting changes in the smart cover in Najaf Governorate using the index (NDVI and SAVI). Al-Adab Magazine 2021, 2, (139).
- Todd G. Nick and Kathleen M. Cambell. Methods in Molecular Biology, vol. 404: Topics in Biostatistics. Ed. Walter T. Ambrosius, Humana Press Inc., Totowa, NJ. 2007. Available at https://www.researchgate.net/profile/Douglas-Mahoney/publication/5402488_Linear_Mixed_Effects_Models/links/57e560bf08ae9227da964db4/Linear-Mixed-Effects-Models.pdf#page=278 (Visited 24/02/2025).
- Hosmer Jr, D. W.; Lemeshow, S.; Sturdivant, R. X. Applied logistic regression. John Wiley & Sons. 2013..
- Nagelkerke, N. J. A note on a general definition of the coefficient of determination. biometrika 1991, 78(3), 691-692. http://links.jstor.org/sici?sici=0006-3444%28199109%2978%3A3%3C691%3AANOAGD%3E2.0.CO%3B2-V.
- AlWatan newspaper. Ministerial committee to prevent encroachments on Al-Ahsa Oasis. 14/03/2019. Available at https://www.alwatan.com.sa/article/401982 (Visited 17/04/2024).
Figure 1.
Land cover indicator NDVI in the Al-Ahsa Oasis in 2000: Analysis of space area by program of Arcgis ENVI.
Figure 1.
Land cover indicator NDVI in the Al-Ahsa Oasis in 2000: Analysis of space area by program of Arcgis ENVI.
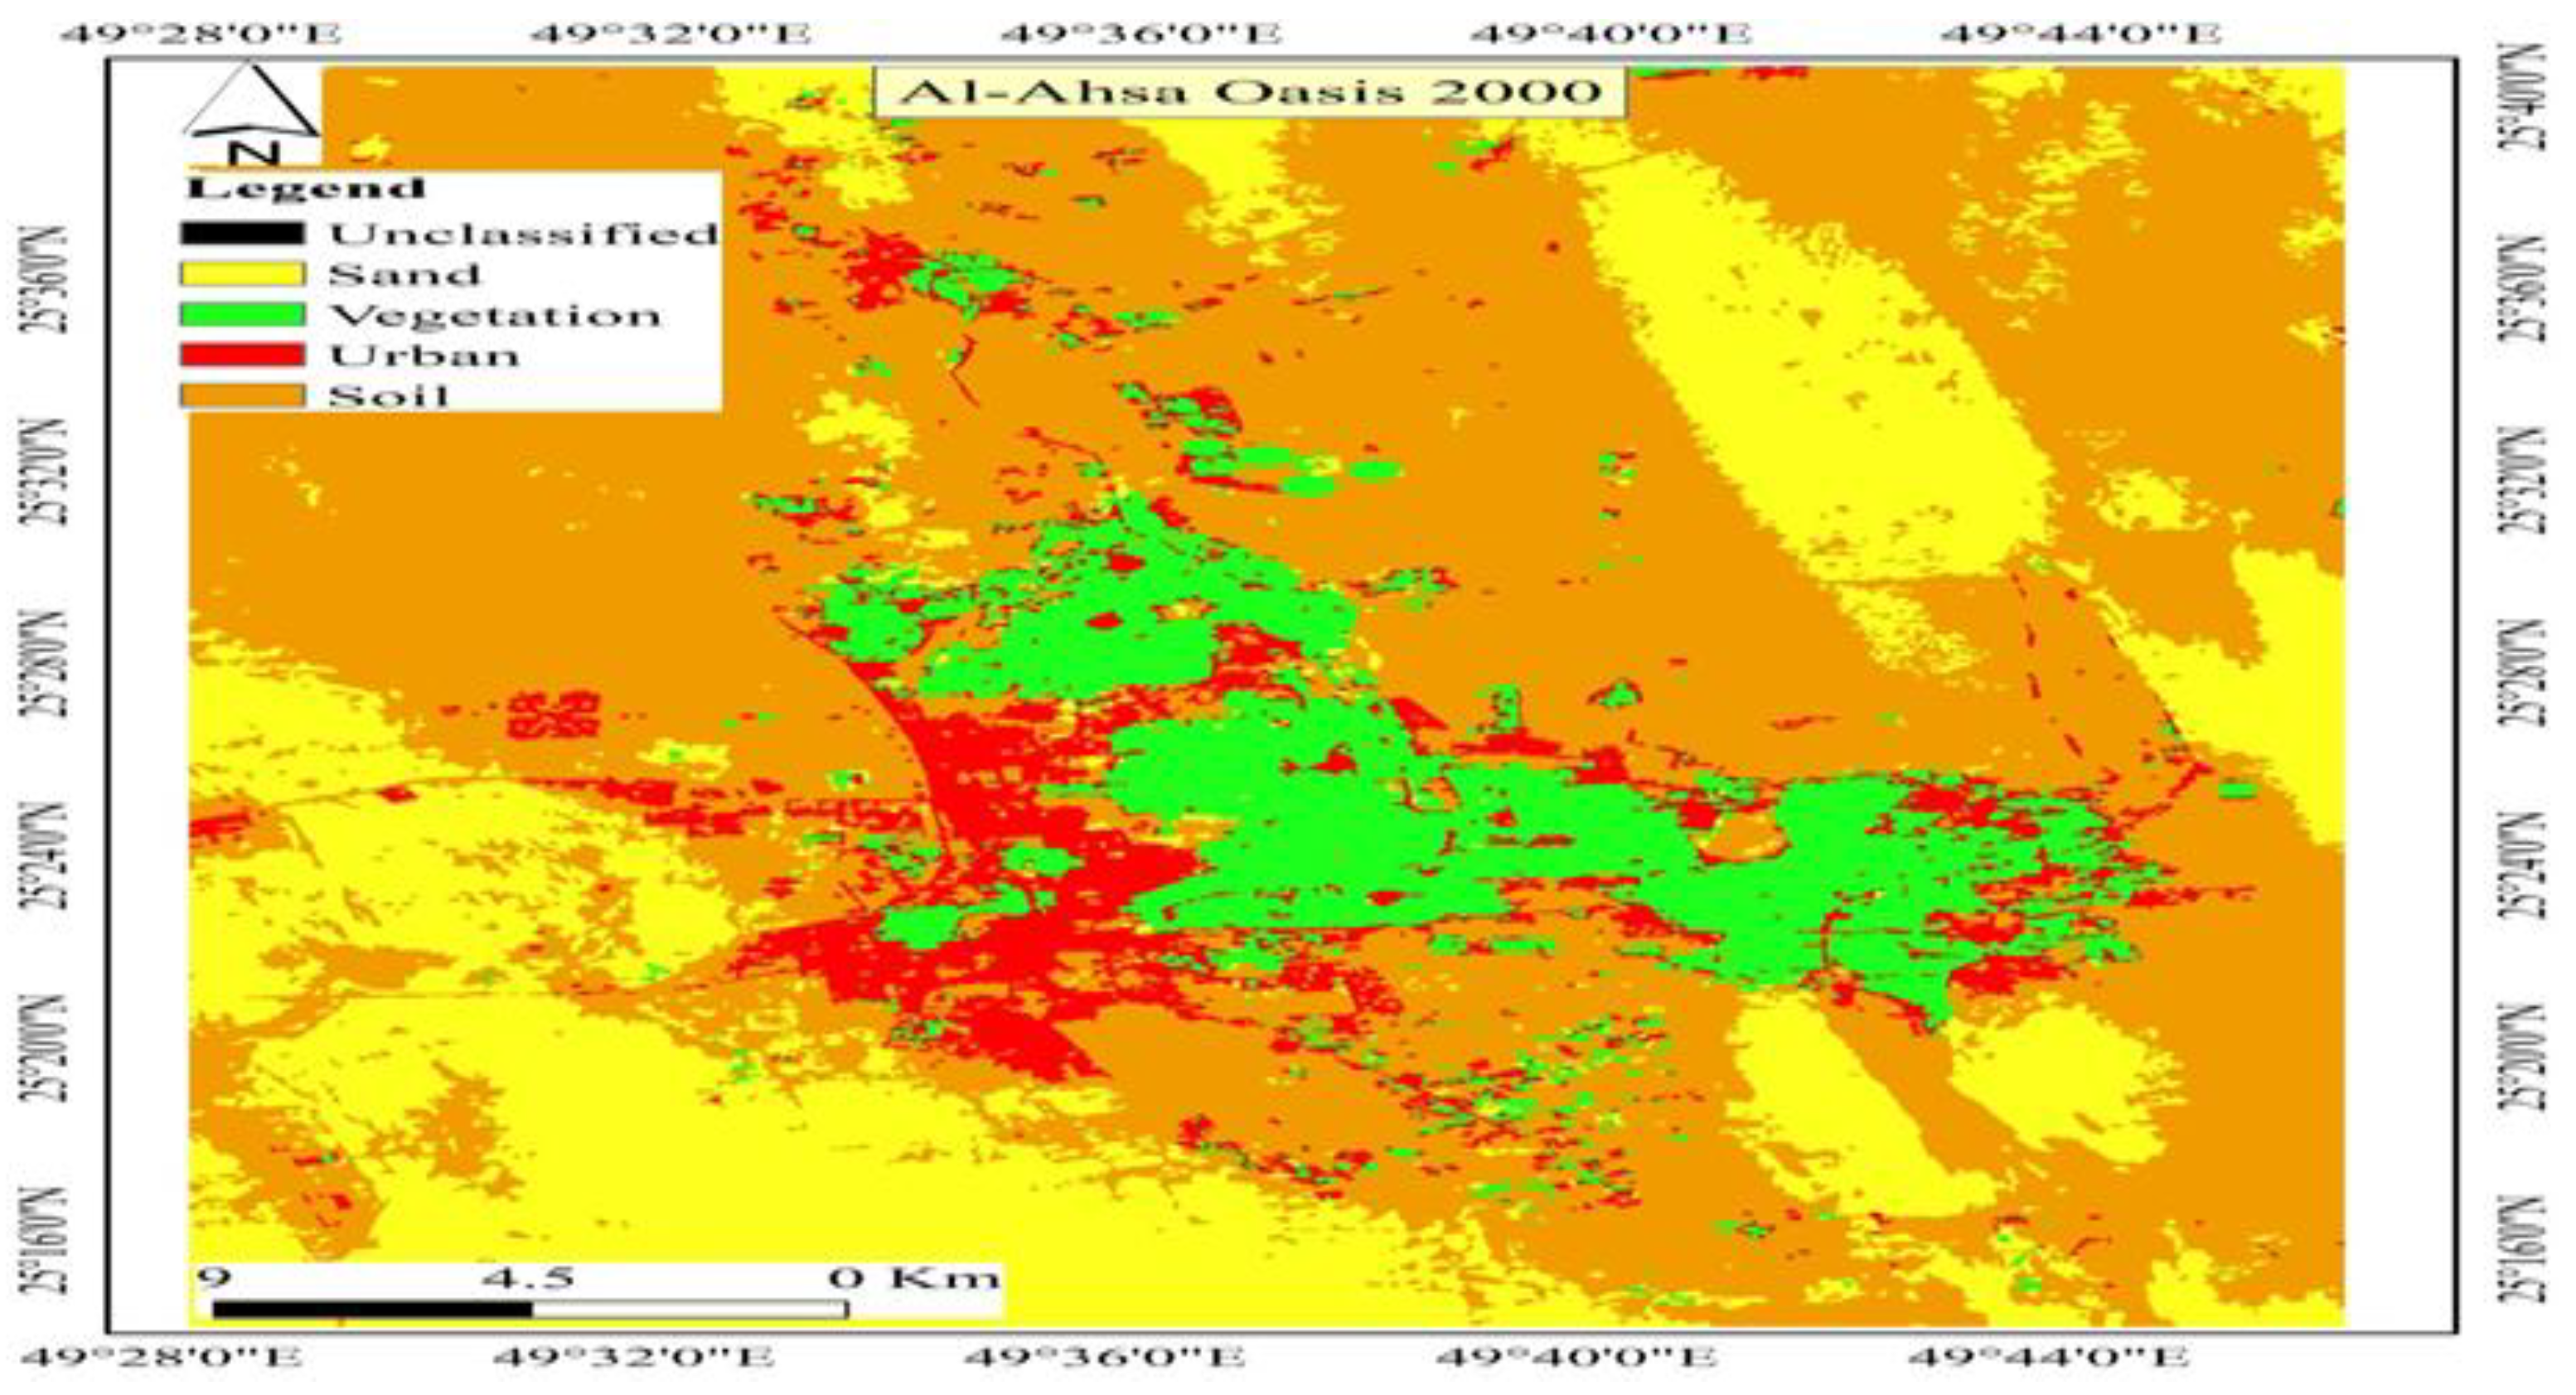
Figure 2.
Land cover indicator NDVI in the Al-Ahsa Oasis at 2020: Analysis of satellite picture by program of ArcGIS-ENVI. .
Figure 2.
Land cover indicator NDVI in the Al-Ahsa Oasis at 2020: Analysis of satellite picture by program of ArcGIS-ENVI. .
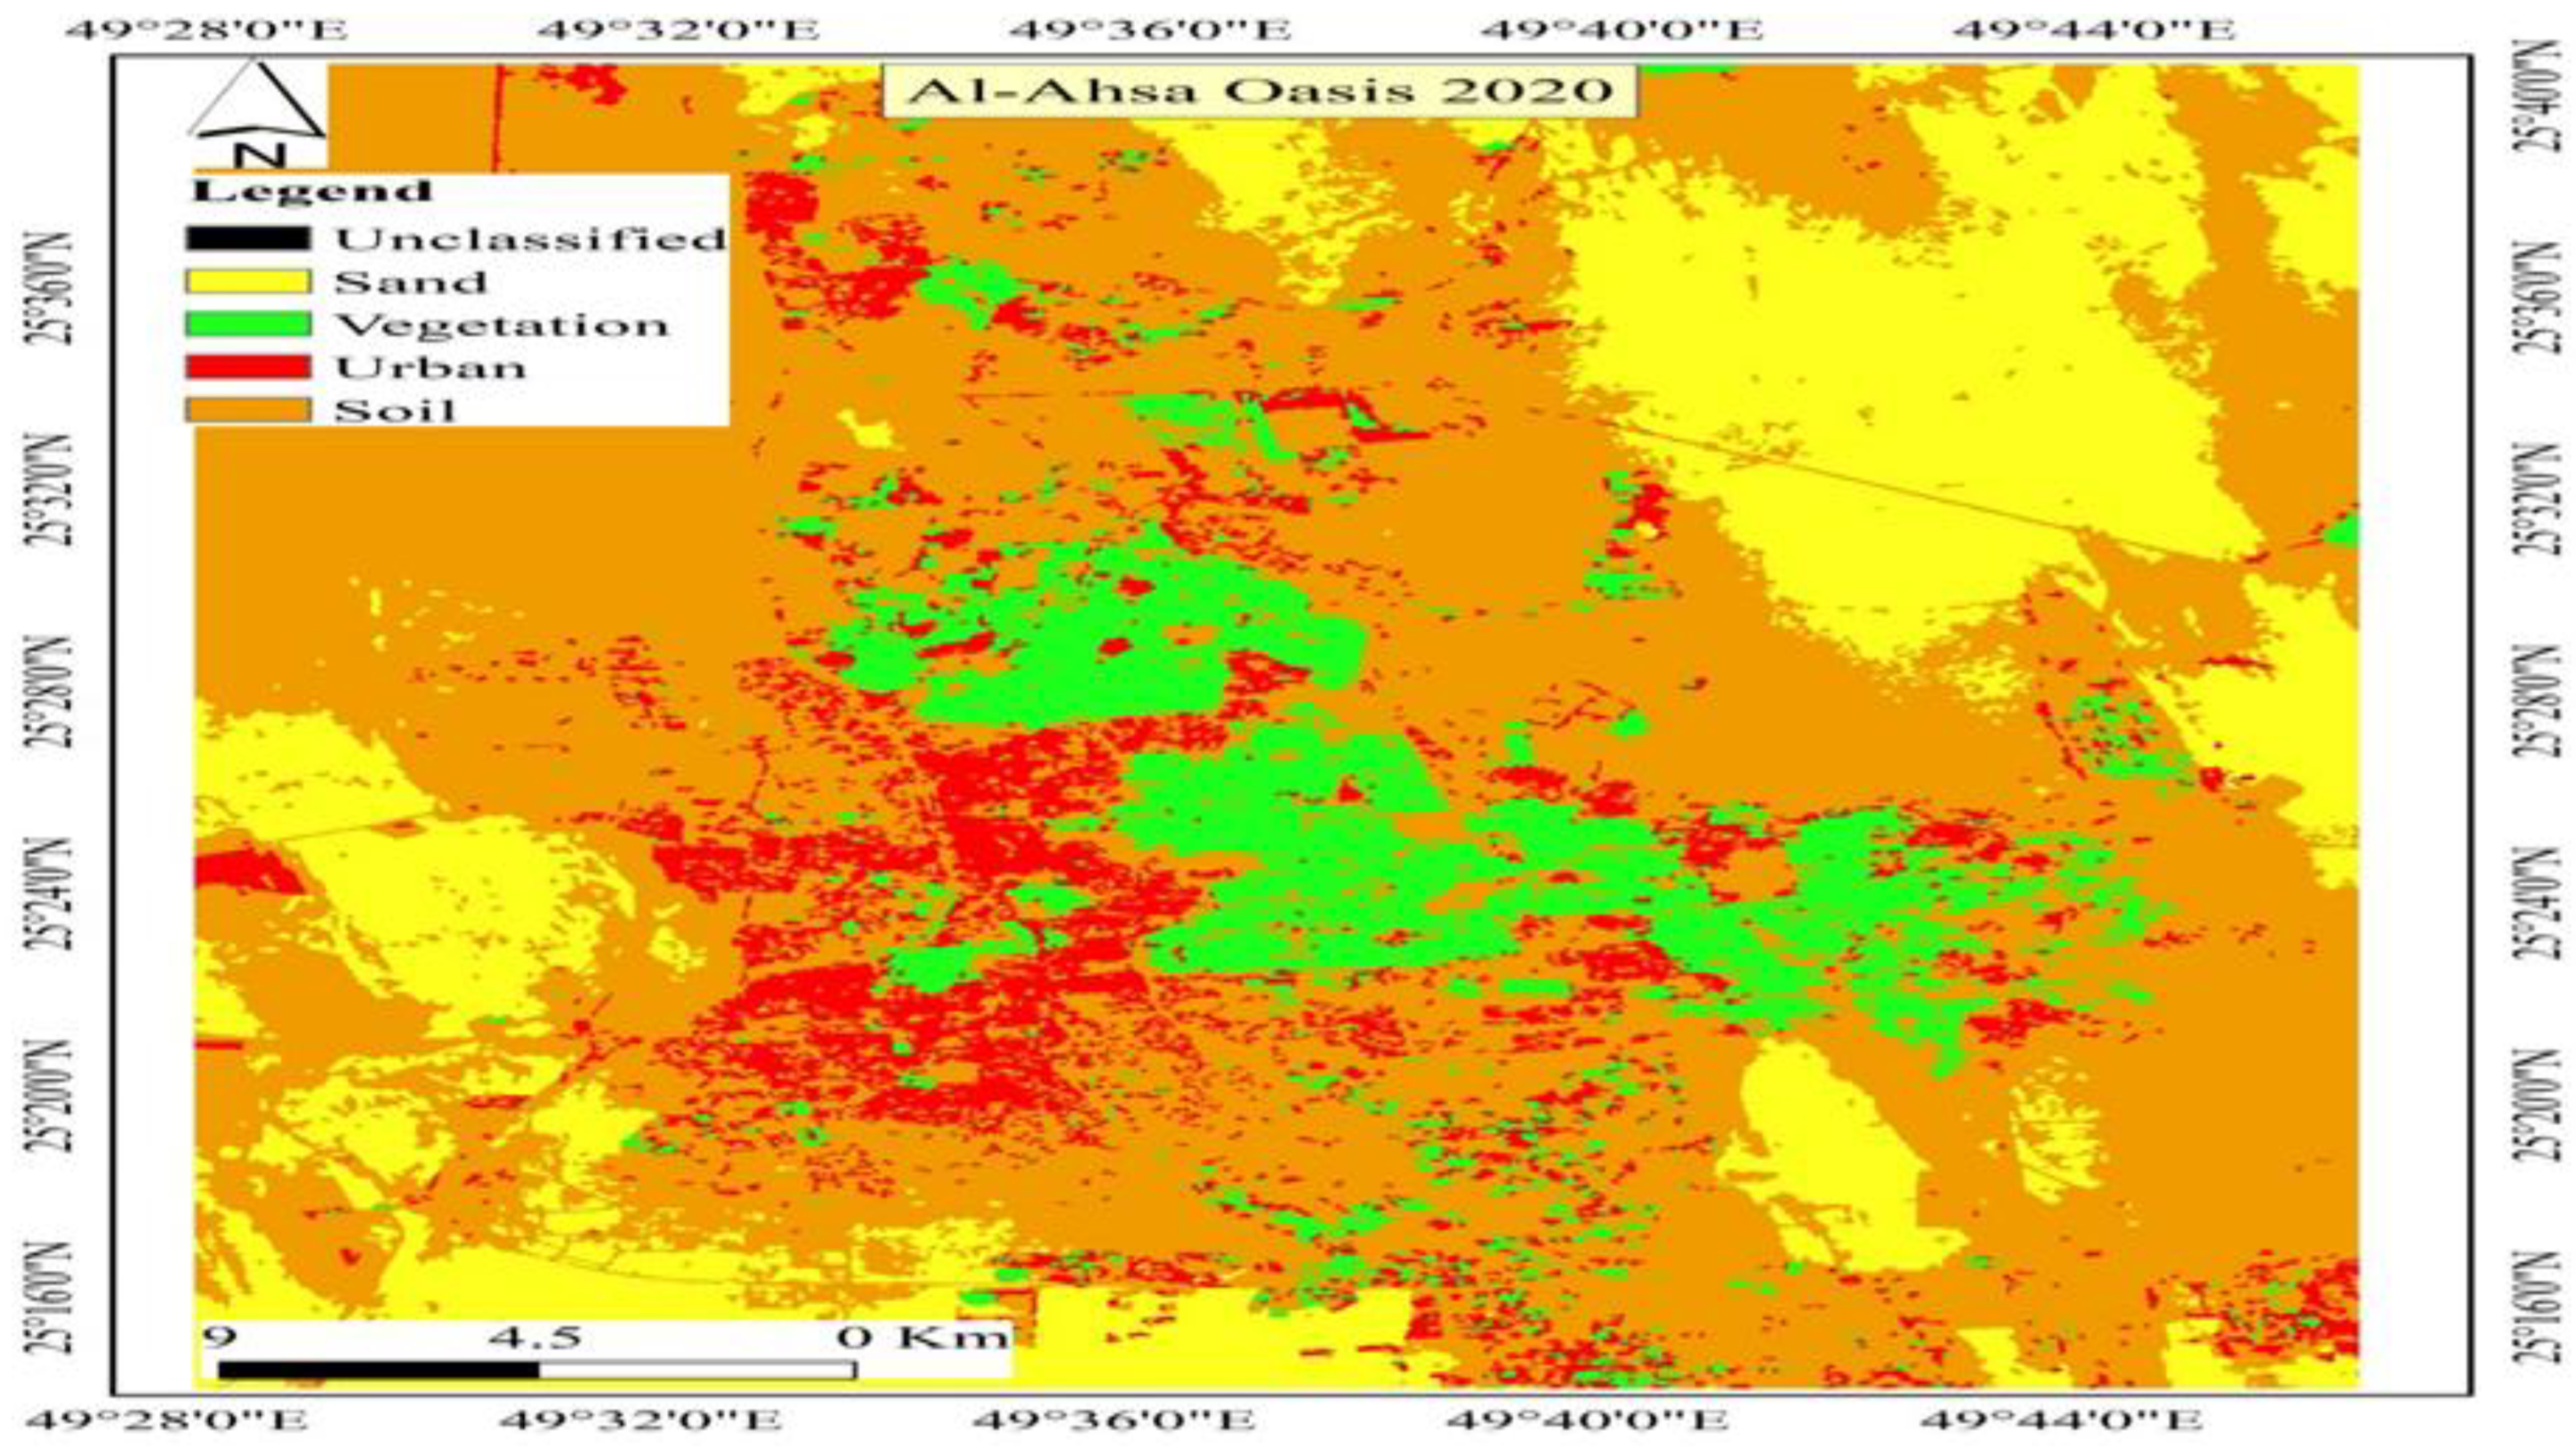
Figure 3.
Land cover indicator NDVI in the Al Ahsa Oasis in 2000: Analysis of satellite picture by program of ArcGIS-ENVI. .
Figure 3.
Land cover indicator NDVI in the Al Ahsa Oasis in 2000: Analysis of satellite picture by program of ArcGIS-ENVI. .
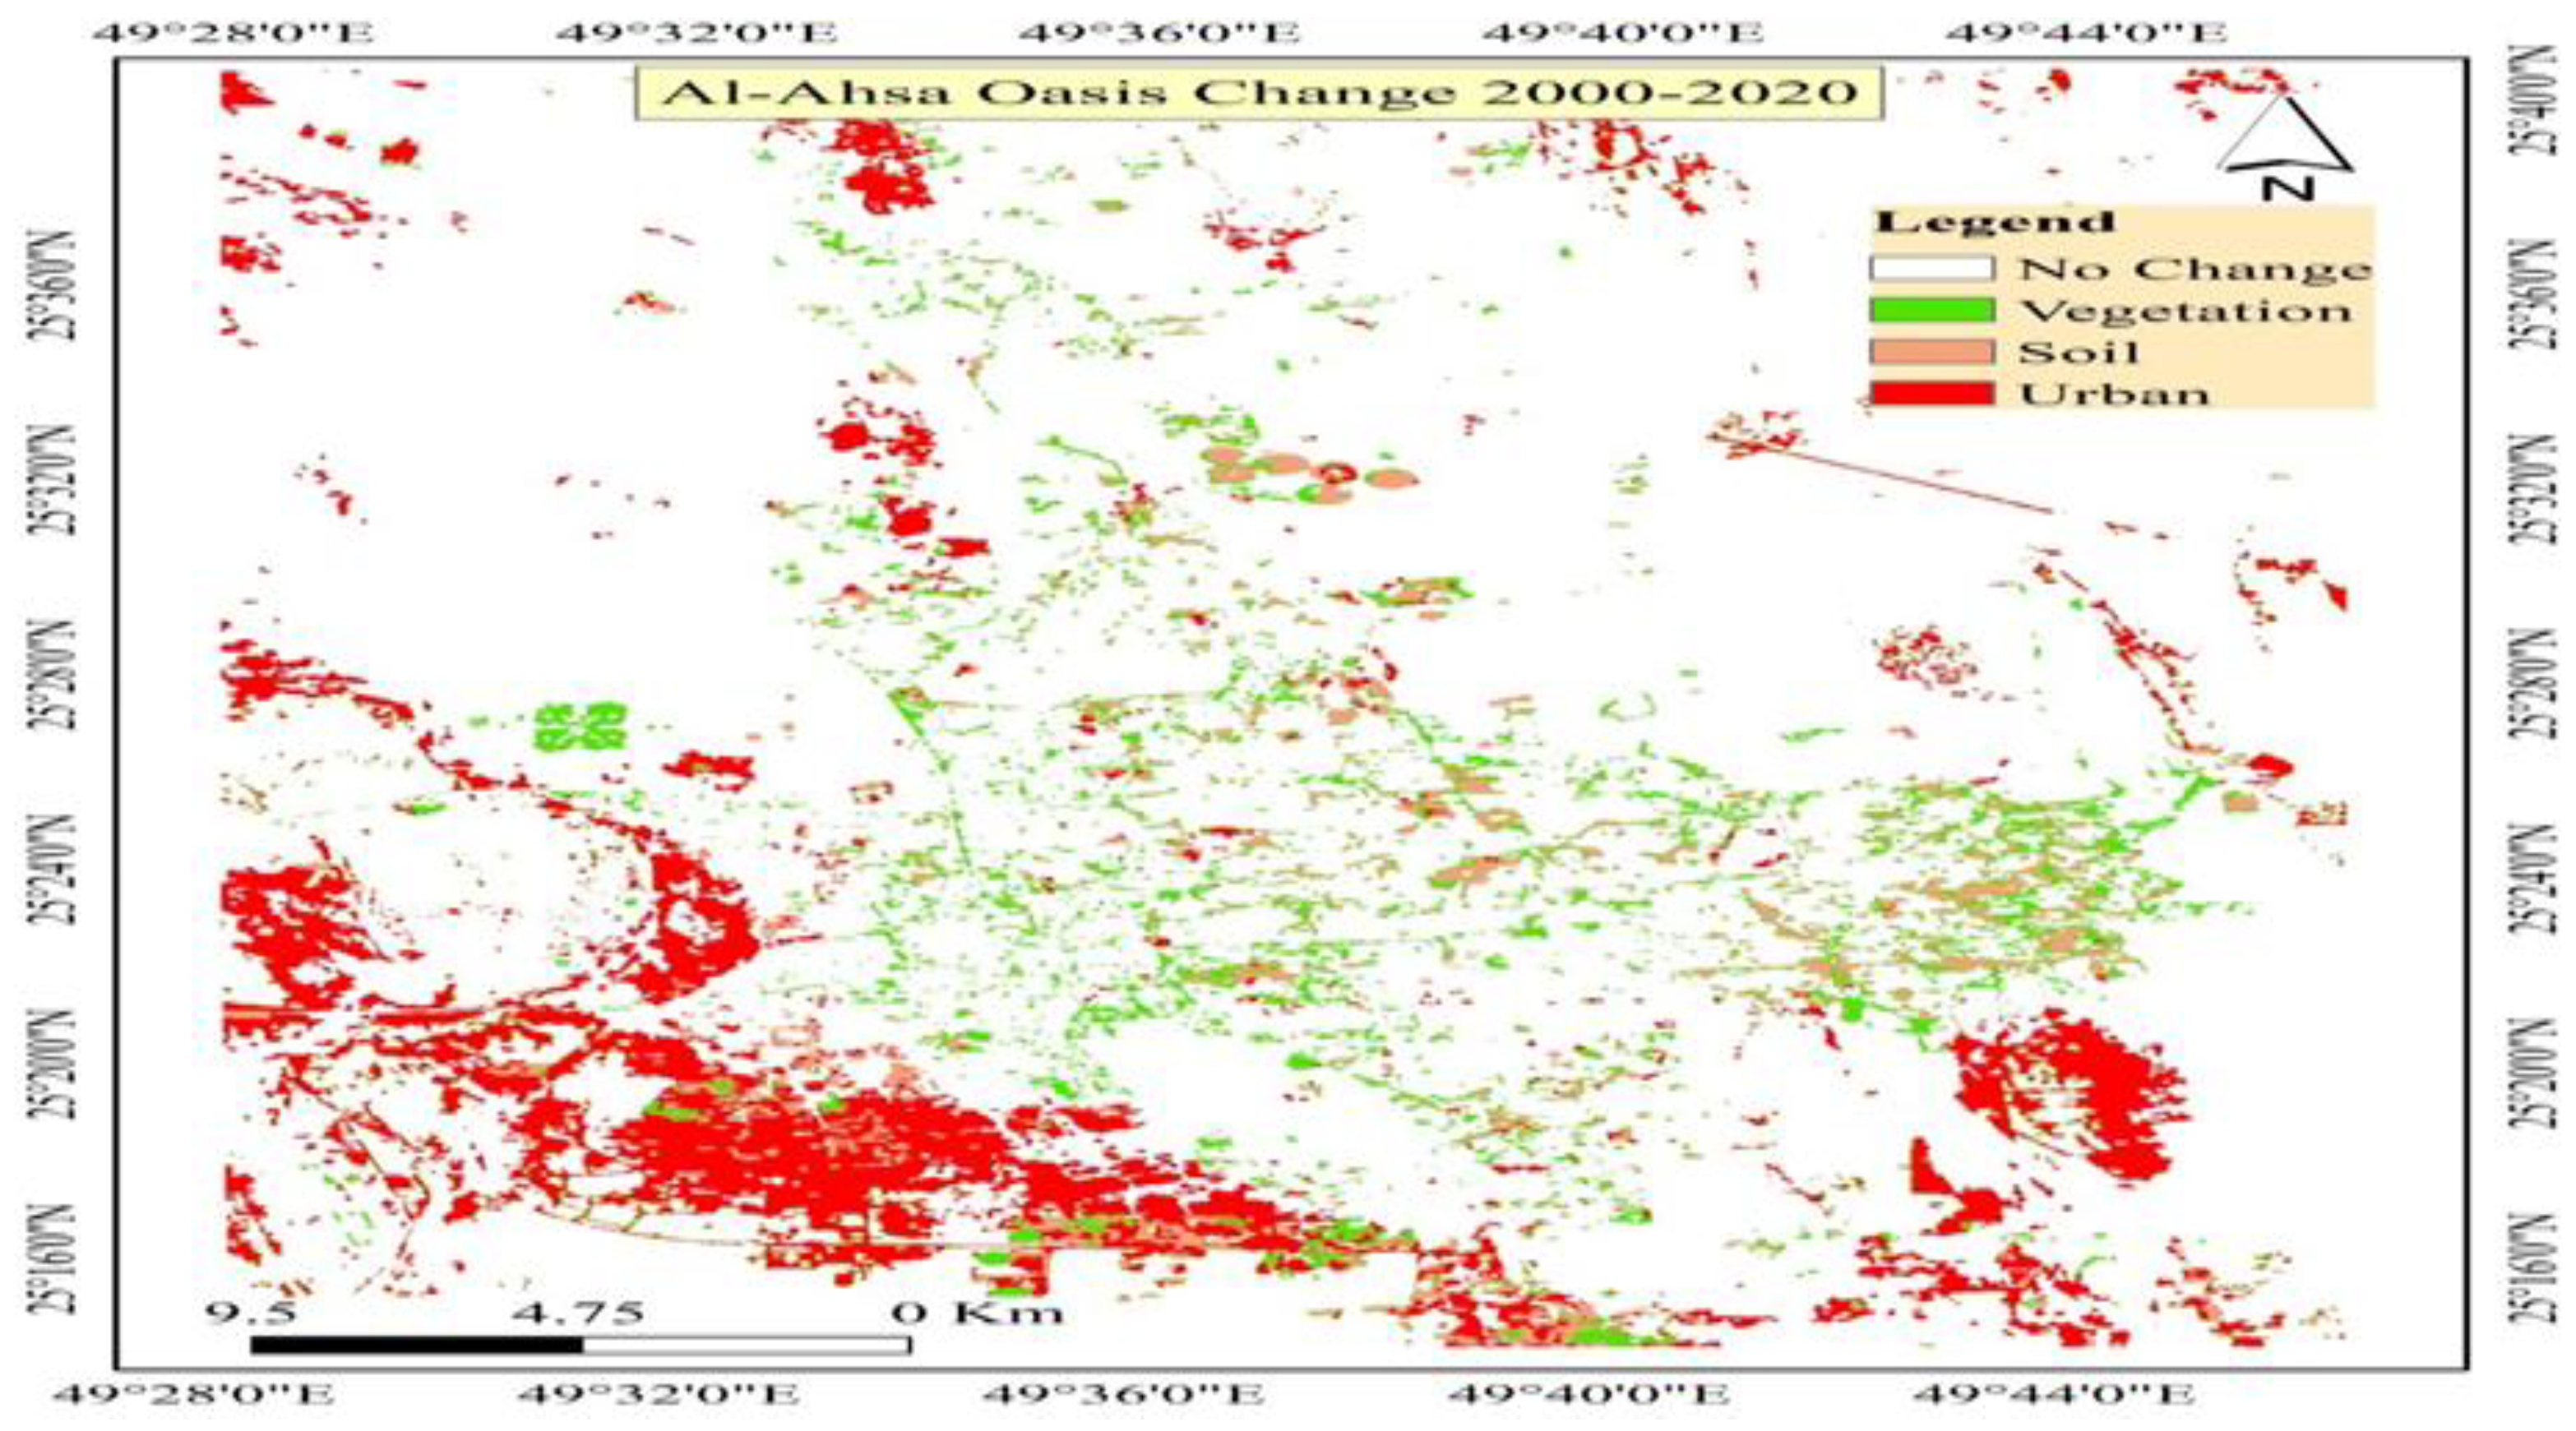

Table 1.
Change in area of different categories of land cover at Al-Ahsa Oasis during the period 2000-2020.
Table 1.
Change in area of different categories of land cover at Al-Ahsa Oasis during the period 2000-2020.
| Classes | Soil | city | vegetation | Sand | Changes (2020) | Total (2020) |
|---|---|---|---|---|---|---|
| Not classified | 0 | 0 | 0 | 0 | 0 | 30 |
| Sand | 25.471 | 0 | 0.001 | 71.138 | 25.471 | 96.61 |
| Vegetation cover | 3.442 | 02.943 | 28.679 | 01.318 | 7.703 | 36.383 |
| city | 16.517 | 13.907 | 01.350 | 03.558 | 21.425 | 35.331 |
| soil | 209.506 | 12.878 | 09.596 | 36.853 | 59.327 | 268.83 |
| Total for the (2000) | 254.936 | 29.728 | 39.626 | 112.87 | 0 | 0 |
| Changes for (2000) | 45.429 | 15.821 | 10.947 | 41.729 | 0 | 0 |
| Difference between 2000 and 2020 | 13.898 | 5.604 | -3.243 | -16.26 | 0 | 0 |
Table 2.
Social Variables in the equation (Step 1) of the Social model version.
| B | S.E. | Wald | df | Sig. | Exp(B) | 95% C.I.for EXP(B) | ||
|---|---|---|---|---|---|---|---|---|
| Lower | Upper | |||||||
| Age | 23.33 | 4 | 0 | 0 | 0 | 0 | ||
| Age(1) | 23.759 | 17907 | 0 | 1 | 0.999 | 2.08* | 0 | . |
| Age(2) | 4.475 | 0.984 | 20.68 | 1 | 0 | 87.78 | 12.76 | 604.03 |
| Age(3) | 2.716 | 0.777 | 12.20 | 1 | 0 | 15.12 | 3.29 | 69.4 |
| Age(4) | 2.086 | 0.784 | 7.07 | 1 | 0.008 | 8.05 | 1.73 | 37.45 |
| Social status | 0 | 0 | 3.64 | 3 | 0.303 | 0 | 0 | 0 |
| Soc. status(1) | -2.701 | 1.616 | 2.79 | 1 | 0.095 | 0.07 | 0.003 | 1.59 |
| Soc. status(2) | -1.631 | 0.989 | 2.72 | 1 | 0.099 | 0.2 | 0.028 | 1.36 |
| Soc. status(3) | 19.754 | 40193 | 0 | 1 | 1 | 379* | 0 | . |
| Edu. level | 0 | 0 | 3.84 | 6 | 0.699 | 0 | 0 | 0 |
| Edu. level (1) | -1.297 | 1.002 | 1.68 | 1 | 0.195 | 0.27 | 0.038 | 1.95 |
| Edu. level (2) | -0.621 | 0.984 | 0.4 | 1 | 0.528 | 0.54 | 0.078 | 3.7 |
| Edu. level (3) | -0.492 | 1.188 | 0.17 | 1 | 0.679 | 0.61 | 0.06 | 6.28 |
| Edu. level (4) | -0.11 | 1.357 | 0.01 | 1 | 0.935 | 0.9 | 0.063 | 12.8 |
| Edu. level (5) | -1.138 | 1.219 | 0.87 | 1 | 0.351 | 0.32 | 0.029 | 3.49 |
| Edu. level (6) | 0.325 | 1.04 | 0.1 | 1 | 0.755 | 1.38 | 0.18 | 10.63 |
| Nb. Fmly mbr | 0 | 0 | 0.06 | 2 | 0.971 | 0 | 0 | 0 |
| Nb_fmly_mb(1) | -0.129 | 0.786 | 0.03 | 1 | 0.87 | 0.88 | 0.188 | 4.10 |
| Nb fmly mb(2) | 0.059 | 0.691 | 0.01 | 1 | 0.932 | 1.06 | 0.274 | 4.11 |
*E+10.
Table 3.
Variables in the equation (Step 1) of the Economic model version.
| B | S.E. | Wald | df | Sig. | Exp(B) | 95% C.I. for EXP(B) | ||
|---|---|---|---|---|---|---|---|---|
| Lower | Upper | |||||||
| Holding size | 0 | 0 | 3.60 | 1 | 0.058 | 1 | 1 | 1 |
| Methods irrig | 10.6 | 3 | 0.014 | 0 | 0 | 0 | ||
| Methods irrig(1) | -0.183 | 0.397 | 0.21 | 1 | 0.645 | 0.833 | 0.382 | 1.814 |
| Methods irrig(2) | -1.307 | 0.454 | 8.28 | 1 | 0.004 | 0.271 | 0.111 | 0.659 |
| Methods irrig(3) | 0.556 | 0.606 | 0.84 | 1 | 0.359 | 1.743 | 0.532 | 5.713 |
| Rented Land | 0 | 0 | 4.03 | 1 | 0.045 | 1 | 1 | 1 |
| Agr. machinery | 0 | 0 | 1.55 | 1 | 0.213 | 1 | 1 | 1 |
Table 4.
Variables in the equation (Step 1) of the Happened problem model version.
| B | S.E. | Wald | df | Sig. | Exp(B) | 95% C.I. for EXP(B) | ||
|---|---|---|---|---|---|---|---|---|
| Lower | Upper | |||||||
| Modern tech. (1) | -5.247 | 2.182 | 5.78 | 1 | 0.016 | 0.005 | 0 | 0.379 |
| Climate change(1) | 5.483 | 2.468 | 4.94 | 1 | 0.026 | 240.6 | 1.909 | 30332 |
| Urban sprawl(1) | -0.395 | 1.766 | 0.05 | 1 | 0.823 | 0.673 | 0.021 | 21.453 |
| Avail. Scav. Manp(1) | -3.378 | 1.398 | 5.84 | 1 | 0.016 | 0.034 | 0.002 | 0.529 |
| Small holdings | 5.296 | 1.543 | 11.8 | 1 | 0.001 | 199.5 | 9.699 | 4103.3 |
| High spoilage (1) | 1.648 | 2.198 | 0.56 | 1 | 0.453 | 5.195 | 0.07 | 385.9 |
| Lack productivity(1) | -2.656 | 1.896 | 1.96 | 1 | 0.161 | 0.07 | 0.002 | 2.888 |
Disclaimer/Publisher’s Note: The statements, opinions and data contained in all publications are solely those of the individual author(s) and contributor(s) and not of MDPI and/or the editor(s). MDPI and/or the editor(s) disclaim responsibility for any injury to people or property resulting from any ideas, methods, instructions or products referred to in the content. |
© 2025 by the authors. Licensee MDPI, Basel, Switzerland. This article is an open access article distributed under the terms and conditions of the Creative Commons Attribution (CC BY) license (http://creativecommons.org/licenses/by/4.0/).
Copyright: This open access article is published under a Creative Commons CC BY 4.0 license, which permit the free download, distribution, and reuse, provided that the author and preprint are cited in any reuse.


