
Submitted:
29 March 2023
Posted:
30 March 2023
You are already at the latest version
Abstract
Land use land cover change analysis is one of the most particular techniques to understand how land was used in the past, what types of changes are to be expected in the future, as well as the forces and processes behind the changes. Thus, the objective of this study was to investigate the land use land cover changes and its driving forces in Mago National Park, southern Ethiopia. Satellite image of Landsat5 TM (1988, 1998 and 2008) and Landsat8 OLI/TIRS (2018) with a time span of 30 years were employed. In addition, field observation, and social survey were conducted to study the drivers of land use land cover changes. QGIS 3.2 and SPSS (for social data analysis) software’s’ were used for satellite image processing, accuracy assessment, map preparation and descriptively analyze the driving forces of LULCC respectively. Supervised classification with maximum likelihood algorithm was conducted for satellite image analysis and generation of information using Quantum GIS 3.2 Post classification change detection method was applied to quantify the land use/land cover change. The result of the study indicated riverine forest, woodland, grassland, water body, degraded land and bare land as a major land use land cover class in the park. The result of land use land cover classification showed that in 1988 most of the study area was covered by woodland and grass land. In the first period (1988-1998), woodland, riverine forest, water body and bare land decreased by 6.76%, 37.98%, 22.37% and 70.14% respectively, while grass land, and degraded land increased by 16.11% and 85.67% respectively. In the second period, (1998 -2008), woodland, riverine forest and degraded land were decreased by 5.44%, 4.61%, and 80.74% respectively, while grass land, water body and bare land is increased by 14.74%, 3.76% and 52.58% respectively. From 2008-2018 riverine forest, grassland, water body and bare land decreased by 1.33%, 15.16% and 4.82% and 25.02% respectively, while woodland increased by 11.84%, and degraded land increased by 85.49% respectively. Riverine forest, water body, grass land and bare land showed decrement and that of woodland, degraded land indicated increment during study period. From 1988-2018, woodland, riverine forest, water body and bare land indicated decrement and the remaining grass land and bare land cover types indicated increment during study period. The result of social survey indicated that expansion of agriculture, human induced fire, overgrazing and hunting are proximate driving forces of the change in Mago National Park. Population pressure from a different area, poverty, decreased farmlands productivity; education, weak law enforcement and cultural factors are the major underlying causes of the observed changes. Therefore, proper land use planning, legal support, and strong law enforcement are the key recommendations to sustain natural resources of the study area.
Keywords:
Social survey
; Mago National Park
; Landsat
; GIS
; Remote sensing
; land use land cover
1. INTRODUCTION
Land is defined as a place on which all human activity is being conducted. It also used to produce wealth, grow economies and used as source of water, food and energy. These services will continue if only the land is not destroyed or degraded by human based actions (Molla, 2014) as cited by Adane, 2016. In reality, there remain only few landscapes and inaccessible location on the earth that are still in their natural state (Gomez et al., 2016).
Land cover refers to physical characteristics of earth’s surface captured in the distribution of vegetation, crops, water, asphalt, desert etc. created by human activities (Burka, 2008). Whereas, land use-refers to man’s activities on land which directly related to land (Ellis, 2007). Land cover change is highly relevant to understand the causes of changes in biodiversity and the rates and cause of LULCC (Pandey, 2002). LULC is important component to understand interactions of human activities with environment (Ellis, 2007).
LULC change occurs due to a natural or anthropogenic phenomenon (Pandian et al., 2014). The driving forces of LULCC are generally subdivided into two groups: proximate and underlying causes. Proximate causes are the activities and actions of local people that directly affect land use in order to fulfill their needs from the use of land. However, underlying causes are often external and beyond the control of local communities and are fundamental socio-economic and political processes that push proximate causes into immediate action on LULC including demographic, economic, technological, institutional and cultural factors (Haile, 2017). Economic factor is one of the major principal causes of LULCC. Economic variables such as low domestic costs, and increase in product price influence land use decision making by impacting land cover (Geist and Lambin, 2002). Proximate causes are immediate actions of local communities directly exerted on land resources due to underlying causes (Efrem et al., 2012.During the last three decades, the availability of remotely sensed data with improved spatial and temporal resolutions have generated more energy to establish a proper relationship amongst various associated LULC (Wright et al., 2009).
In Ethiopia, fast population growth and spatial distribution have been affecting resource use (Tefera, 2011). Assessing the status of LULCC due to rapid growth of population, land degradation and poor resource management is essential. For better environmental analysis and sound decisions, reliable information about LULC is vital (Gebiaw et al., 2017; Tilahun and Teferi, 2015). Ethiopia is characterized by reduction of forest, woodlands, grasslands and shrub lands (Mideksa, 2010). Change detection is a process of identifying changes in the state of an object by observing images at different times. Change detection involves the ability to quantify temporal changes in LULC using multi-temporal data sets (Abd et al., 2016). There are four aspects of change detection which are important when monitoring natural resources. They include; detecting changes that have occurred; identifying nature of change; measuring area extent of change and lastly, assessing spatial pattern of change (Macleod and Congation, 1998). Monitoring 3 of land use/ land cover change is one of the main applications of remote sensing-based change detection (Franklin et al., 2000: Franklin, 2001) cited by Ratnayake, 2004.
The use of remote sensing data provides the most accurate means of measuring the extent and pattern of changes in cover conditions over a period of time (Miller et.al., 1998). Knowledge about LULC dynamics become important as the nation plans to overcome the problems of uncontrolled development and deteriorating of environmental quality as a whole (Alqurashi and Kumar, 2014). Satellite remote sensing data with their repetitive nature have proved to be quite useful in mapping LULC patterns and changes with time. GIS and RS techniques provide effective tools for analyzing land use dynamics (Sarma et al., 2001). Therefore, the aim of this research was, to assess, monitor, characterize and analyze spatio-temporal LULCC, rate and its cause by using GIS and RS technology in case of MNP, southern Ethiopia.
In Mago national park, however, the rate and areal extent of the LULC change is not well studied till date and also there is no full document which shows the clear trend, pattern and status of LULC change in the park. The natural resource management and LULCC status of Mago national park is not clearly stated and document for researchers and other audiences. Therefore, in view of the literature gaps indicated above this research was analyzed the LULCC and driving forces of change in the park from 1988 to 2018. LULCC detection based on remote sensing data has been established as essential tool for providing suitable and wide-ranging information to various decision support.
The specific objectives of this study were (i). to analyze land use/ land cover change in Mago National Park between 1988 and 2018 (ii) to investigate the major driving forces behind the LULC changes in Mago National Park and (iii) to understand the perception and attitude of the local community towards land use/ land cover change in the Mago National Park.
2. METHODOLOGY
2.1. The Study Area
Mago national park is one of the parks in Ethiopia located in SNNPR of Ethiopia. It is about 782 km south of Addis Ababa and north of a large 90° bend in the Omo River. The Mago national park was established in 1979. The Mago Park covers area about 1869.95 km2. Geographically, the park lies between latitude 05°20’-05°50’N and longitude 36°00’-36°30’E. The elevation ranges from 400m.a.s.l on the plains in south, to 1,776 m on top of Mt Mago. The interior section of the park mainly consists of flat plains. However, periphery and boundaries, except to the south, are formed by the Mago and Mursi Mountains, associated ridges and chains of hills.
Figure 1.
Map of the study area.
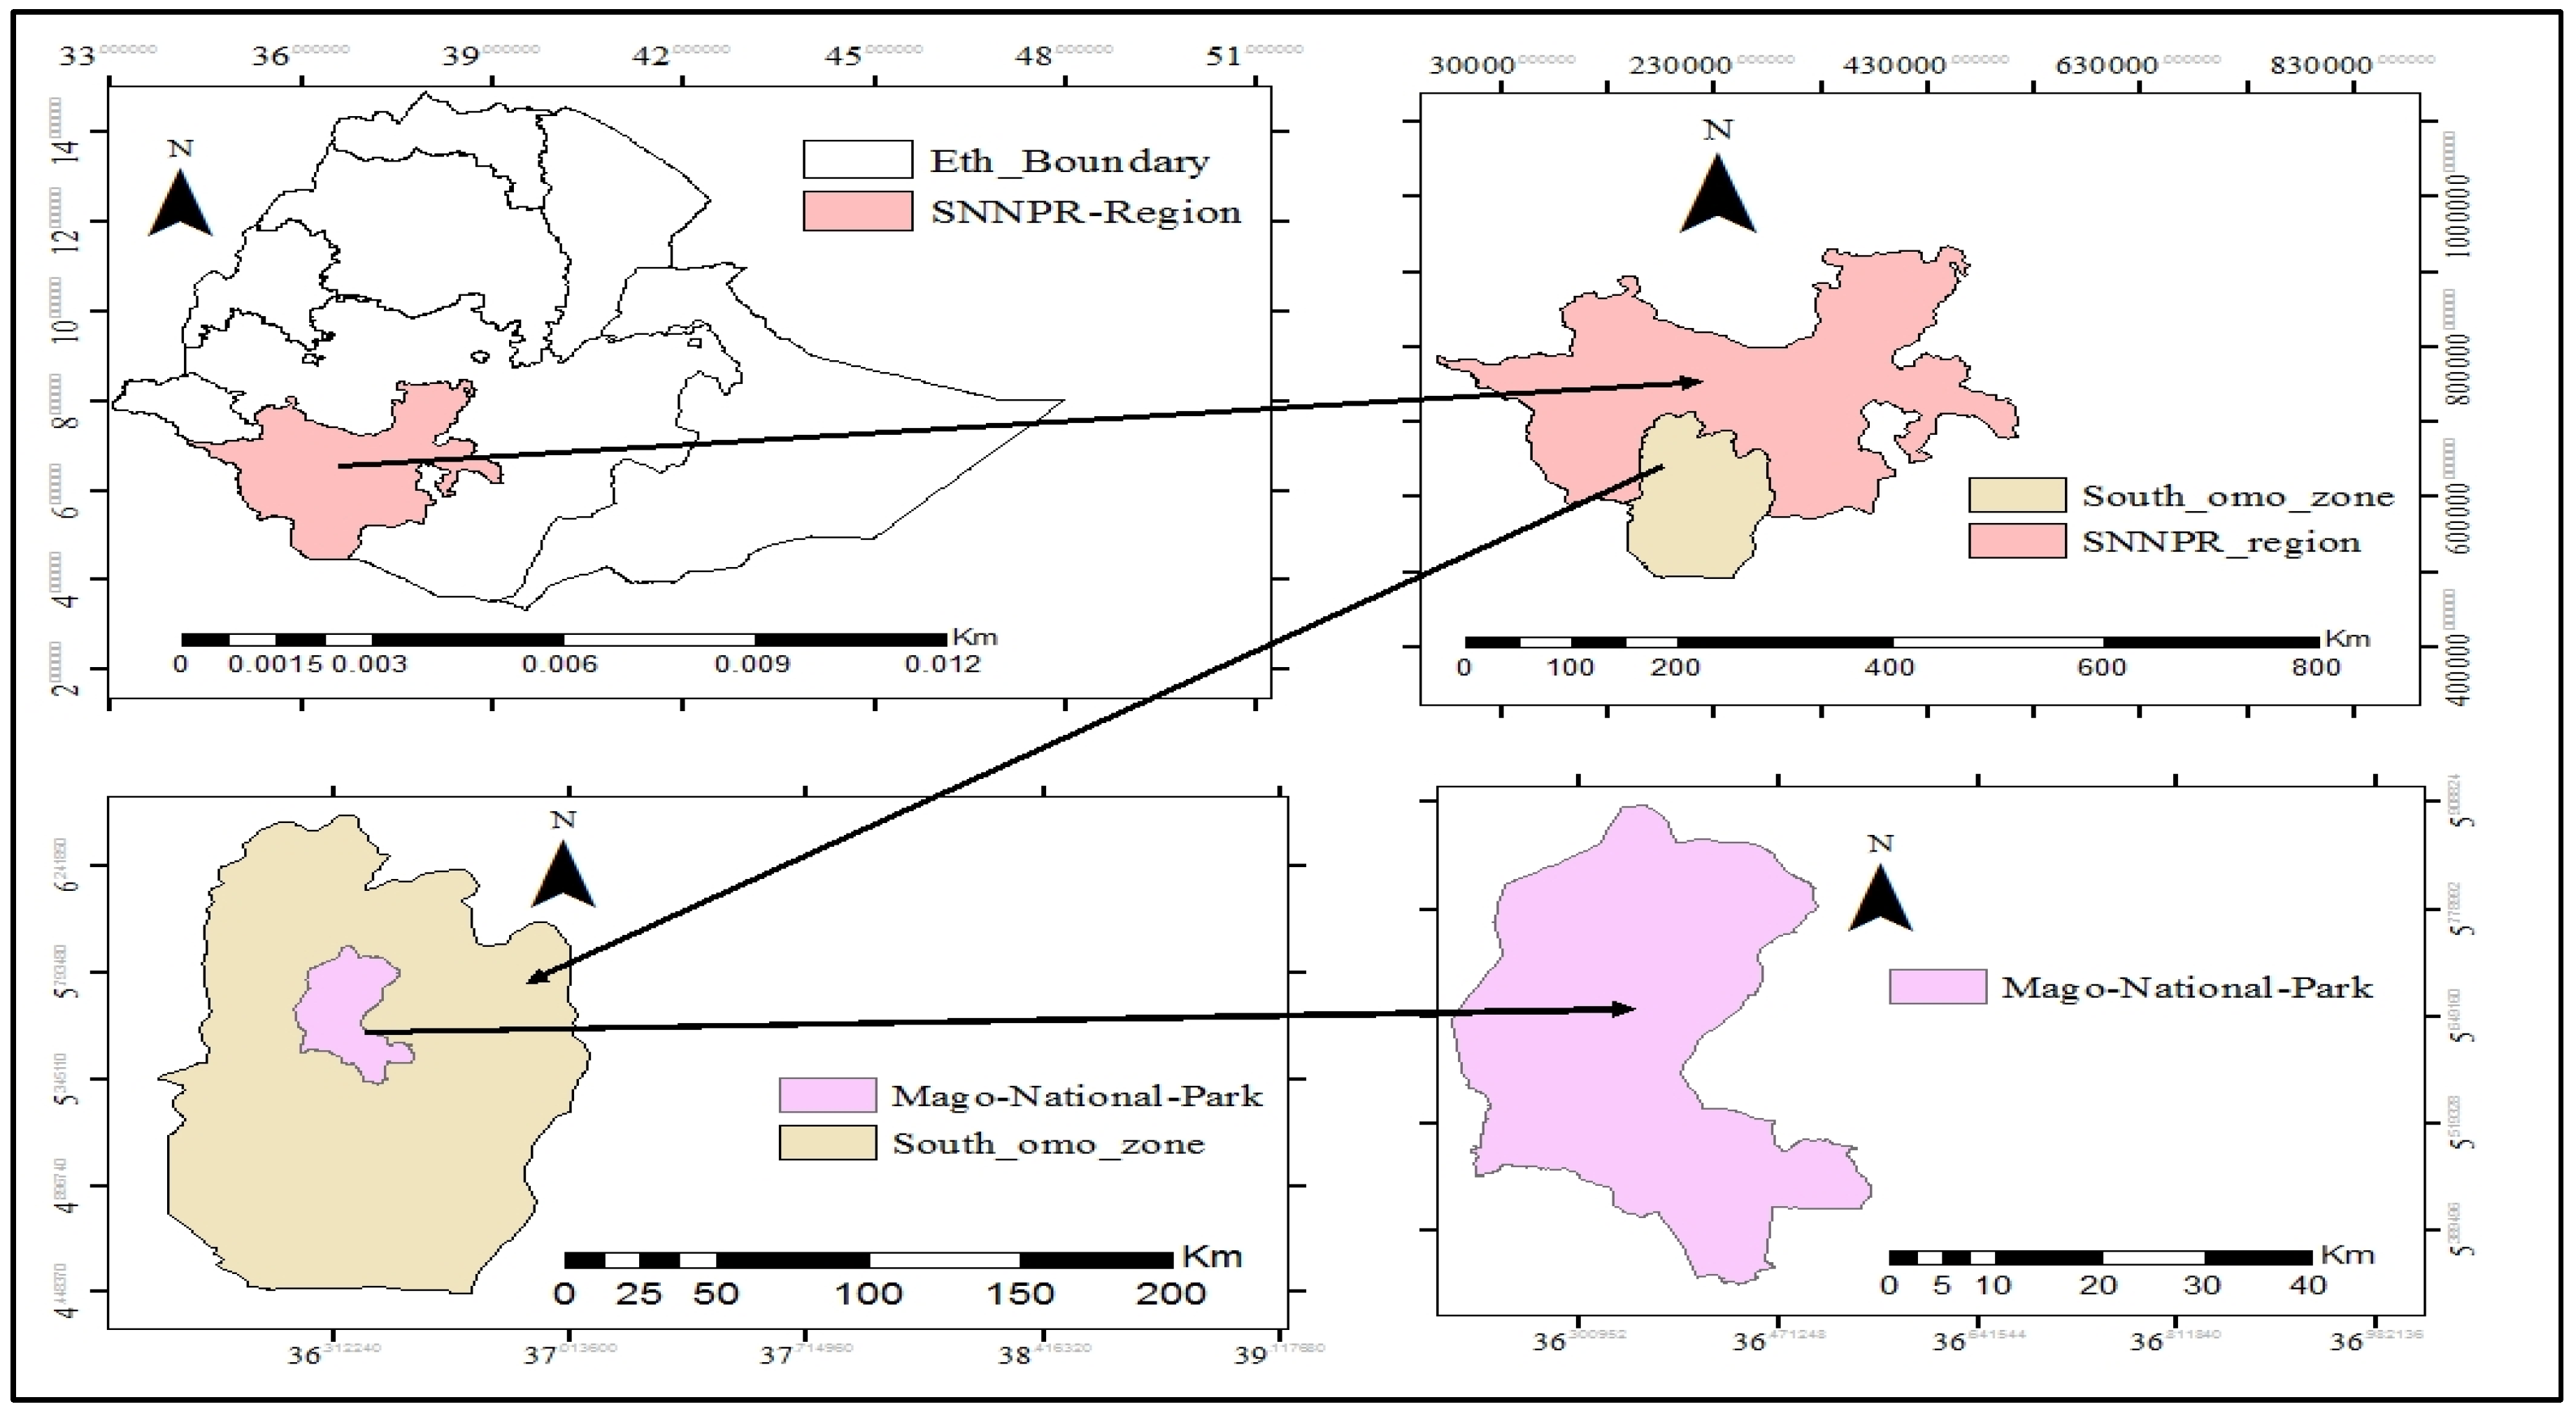
MNP is traversed by the permanently flowing Mago River and two of its tributaries, the Neri and Usno Rivers. The national park is bordered by three conservation areas: Tama Wildlife Reserve to the west, Omo National Park to the southwest and Murle Controlled Hunting Area to the south. MNP is surrounded by settled agriculturists and semi-pastoralists belonging to six tribal groups. The Park office is 115 km north of Omorate and 26 km southwest of Jinka. Its highest point is Mount Mago 2528 meters. All roads to and from the park are unpaved. The Mago River traverses through the middle of the park and goes on to link with the Neri River at Mago Swamp. The river is about 750 kilometers long and comes from Gibe and finishes its journey at Lake Turkana. The park's headquarters is close to the Neri River and it is a dense forest area (Demeke and Bekele, 2000). Mago National Park is described as semi-arid with high mean annual temperature and solar radiation. The mean annual temperature varies from 24 to 38 °C. The annual rainfall recorded was 830 mm.The fauna of MNP is diverse. Some vertebrates are well documented by (Demeke and Bekele 2000). According to the thirty-three years rainfall data of the study area from 1983-2016, the area has a bimodal rain fall distribution characterized by prolonged wet season from May to August (long rains) locally known as Kiremt and short wet season between September and November, locally known as Belg. The mean monthly rainfall of the area varies between 33.44 mm (February) and 168.95 mm (July). In January and February, the study area receive rainfall is less amount of rainfall. The average maximum monthly temperature is 34.79 °C and average minimum monthly temperature is 17.41°C.
In Mago National Park, fifty per cent of the area covers woodland (open and dense) and it consists savanna bushland, savanna grassland and open grassland. Currently, the park covers dense and open woodland, riverine forest grown around the river, rivers (Neri and mago) and ponds, grassland and degraded land. The extent of human disturbances is high in area of all the forest and other riverine vegetation (along the Omo, Mago and Neri Rivers) (Yirsaww and Afework, 2000). There are mountainous areas with great views over the bush savanna. The largest trees found in the riverine forest beside Omo, Mago and Neri River. The riverine forest along the Omo River is important for several different bird groups, including herons and egrets, kingfishers, barbets, chats and thrushes, and flycatchers. One of the major attractions of the park is Hot Springs and areas along the lower Omo within the park are populated with a rich diversity of ethnic groups, including Aari, Male, Banna, Bongoso, Hamar, Kwegu, Karo and Mursi peoples. The park's best-known attraction is the Mursi, known for piercing their lips and inserting disks made of clay. (Demeke and Bekele 2000). Mago National Park is on the route from Arba-Minch via Jinka to Lower Omo valley and it is a fascinating experience because of its isolated location and very few visitors and it gives a real feeling of how most of Africa was 50 years ago. The wildlife including most of the typical east African fauna and offers one of the wildest and most outstanding wildlife panoramas in Ethiopia. Mago National Park is considered an important habitat for animal populations particularly Buffalo, Giraffe, Elephant (approximately 150), warthog, tiang, lewel’s hartebeests, lesser-kudu. Greater-kudu, duiker, Burchell’s Zebra, Swayne’s Hartbeest, Oryx, Grant’s gazelle, gerenuk, giraffe. Cheetah, wild dog, lions, leopards, guereza, common baboon and vervet monkey are common and conspicuous. The Mago National Park is home to some 81 larger mammals and 300 species of bird (Demeke and Bekele, 2000). Hippos are widely distributed in Mago National Park. Leopards/Panthers can survive both hunting pressure and habitat change like in Mago National Park. Although rare, Lions, Elephants, and African Buffalos still roam the plains of MNP. Unfortunately, Giraffes have almost disappeared from the National Park. (Africa-Expert.com).
2.2. Materials and Methods
QGIS version 3.2 for image processing and SPSS IBP version 22 for the analysis of the driving forces of the change, MS Excel for statistical analysis, chart preparation, MS word for word -processing and GPS for field data collection were used. The primary data were collected by HHs, KIIs and FGDs and GPS technology. Whereas, secondary data used include satellite image of selected years, Google earth, both published and unpublished materials, books, articles, reports and different materials from files of relevant institutions and internet websites about Mago National Park.
2.2.1. Data Collection Procedures
The required field data about the LU/LC types, old trends in dominant LU/LCC and possible causes of LU/LCC in the study area were collected using time series Landsat images downloaded for different Landsat groups. Landsat 5 TM (for the years 1988, 1998 and 2008) and Landsat 8 OLI/TIRs (for the year 2018) were used for the months with less cloud cover and fire effects. The satellite imageries from USGS earth explorer were downloaded for the selected years (1988, 1998, 2008 and 2018). The satellites selected for this study were Landsat 5(TM) and 8 (OLI/TIRs). Landsat satellite images acquired from USGS for four periods; 1988, 1998, 2008 and 2018.The images were acquired from period February month, as it is a clear sky season in the region, reducing atmospheric problems. To avoid the adverse effect of cloud cover on LULC classification, satellite image with less than 5% cloud cover images taken during the dry season depended on their availability.
Furthermore, during data collection in the field, household survey (HHS), focus group discussions (FGD) and key informant interview (KII) accepted human activities around MNP started increasingly in 1988 and population grows fast from 1998 forward. Therefore, 1988 was taken as a base year before population growth occurred at a higher rate and 1998, 2008 and 2018 being years of higher population growth around the park.
Field observation, Household Survey, Focus Group Discussion (FGD) and KII
Before the fieldwork, a reconnaissance survey and informal interviews were conducted with different authorized bodies inside the park. Information such as current land use practices and its status, population and livelihood strategies in terms of their pressure on resources in the park were obtained during the reconnaissance survey. During field observation photos of current LULC types were collected by using camera to support different steps of image processing. The use of random sampling method for accuracy assessment is by means of error matrix based on stratified and randomly selected points across the classified image. Instead of purely random method, stratified random sampling is usually recommended, so that the sampling points are fairly distributed in each LULC change class (Das, 2009). This Stratified Sampling method works by separating the whole study area/population into groups based on a factor that may influence the variable being measured. With stratified sampling, it is possible to: partition the population into groups (strata), obtain a simple random sample from each stratum and collect data on each sampling unit that is randomly sampled from each stratum. Stratified sampling works best when a heterogeneous population is split into fairly homogeneous groups. Therefore, LULC classes in MNP were grouped based on homogeneous classes and from individual classes samples were taken randomly using GPS. GPS data includes X, Y coordinate and other attribute data. A stratified random sampling method was employed to collect total of 465 points for classification accuracy assessment.
Face-to-face interviews in the form of HHS, KIIs, and FGDs which guided by a checklist, and structured questionnaires were used in this study. Data about the causes force of LULCC collected via HHS, FGD and KII were analyzed qualitatively. The questionnaires were comprised open-ended questions to gather information about the opinions of local communities on LULCC, and the causes of these changes in MNP during the studied period (1988 to 2018).
Totally, 153 sample households were selected by using simple random sampling techniques from the total household (1905) of the sampled kebeles based on the formula below. The sample size of the study area was determined by using Kothari formula shown in below (Kothari, 2004). Kothari sample size formula for determining sample size was become;
n = sample size, Z = 95% confidence limit (interval) that is 1.96 given or constant, P = 0.1 (population proportion to be included in the sample that is 10%) =it depends, q = None occurrence of event = 1-p = 1-0.1 that is (0.9), N = total number of (household) found in the study area e= level of accuracy or sampling error (Where, α = 0.05). The sample size is proportional to total member of household size of each Kebele.
As the Mago National Park covers large area, only kebeles which are neighboring to the park were chosen. Based on the interest of researchers and theme of study, the number of participants in FGD can range from 4 to 10 (Jayasekara, 2012). For FGD and KII three kebeles (Goldiya, Kure and Baytsimal kebele) were selected purposely. Those kebeles were selected by considering agro-pastoral areas, their higher dependency on the park, security issues and accessibility for researchers. The groups were formed based on the size of total household from each Kebeles. The participants of FGDs were selected purposively. Two purposive criteria were used to select participants in FGD. The first criteria are the age of participants i.e., elder peoples (household heads) who have lived long time in the study area and had detail information about the past and present situations of the study sites. A second criterion is capability to understand the topics, express their feelings and opinions. The selected participants were assumed to have good knowledge and capacity to describe the historical LULCC in the study area. Accordingly, each focus groups contain 5-6 participants including elders, experts, park managers and others who have knowledge about the park. Totally, 12 groups and from this, 4 groups for Baytsemal, 5 groups for Kure and 3 groups for Goldiya formed from three Kebeles 24 which are at the border and closest to the park were selected.
To gain detailed and additional information and cross-check the data collected from FGDs, few KIIs also conducted. In this, sample elder person from each sampled Kebeles, one Natural Resource Conservation and Management Expert from sampled districts, one Land Administration Office Coordinator and one Kebele administrator from each sample Kebeles, one expert from the park and one manager of the park were involved. Totally, 14 key informants were selected. The selection of elder key informants executed using snowball sampling method with the help of FGD participants. In Snowball sampling method, investigator selects a person who matches the criteria and it is also called as chain sampling (Alvi, 2016).
2.2.2. Satellite Image processing and Analysis
Pre-processing refers to those operations preliminary to the main analysis. In the acquisition of data by remote sensing systems, instruments are used to record the intensity of electromagnetic energy reflected from the Earth's surface (Mather, 1999). Before data processing, in geographic information system the required bands of the images were pre-processed. The boundary of MNP falls between two image scenes. Therefore, mosaicking process was done to have full image which cover the whole area of the park. Then Image stacking, defining specific study area, band setting, and image enhancement are the major image pre-processing techniques were employed. Multi pre-processing tasks were taken in QGIS 3.2. Remote sensing data in a raw format generally contains flaws such as noise, haze effect etc. Therefore, following correction operations were performed on the data during the pre-processing stage: atmospheric and radiometric correction.
In order to aid visual interpretation, the visual appearance of the objects in the image can be improved by image enhancement techniques. Therefore, Image enhancement involved mathematical operations that are applied to remote sensing input data to improve the visual appearance of an image for better interpretation following digital image analysis (Lillesand et al., 2004). However, Band 4, 3 and 2 (False color composite) were used for classification of LULC. All images processing was carried out using QGIS 3.2 software.
Visual interpretation and identification of digital imagery performed manually or visually with the help of both software and analyzer. Spatial data was examined and displayed as colored image by combining different channels or bands that represent different wavelengths. The band combinations for the image classification process considered as Landsat TM (1988, 1998 and 2008) were 432 and in Landsat OLI (2018) were 543 in false color combination which band 4 and 5 correspond to NIR, and bands 2 and 3 correspond to visible green and red band respectively.
2.2.3. Supervised Classification Method
The main objective of image classification is to classify all the pixels in an image into different categories by users (Lillesand et al., 2004). The aim of this procedure was to generate spatially explicit generalizations that show individual classes selected to represent different scales of land classes. These areas are commonly referred to as training sites (Jensen, 1996). Thus, each pixel in this step in the image is classified into different class it most closely resembles. Supervised classification involved with the human cognition and experience (Lillesand et al., 2004). Supervised classification with Maximum likelihood classifier was utilized for image Classification and for the preparation of base maps for change detection. Maximum likelihood classifier is one of the most common parametric algorithms for image classification (Lillesand et al., 2004). Pixel-based classification methods automatically categorize all pixels in an image into land cover classes fundamentally based on spectral similarities (Qianet et al., 2007; Weng, 2012). Supervised classification is chosen because, it classifies land uses based on training sites which are assigned by Classifier.
2.3. Accuracy Assessment
To confirm to what extent the produced classification is compatible with what actually exists on the ground it is important to evaluate the accuracy of classification results (Owojori and Xie, 2005). The overall accuracy is the proportion of the total correctly classified pixels on the total number of pixels in the map. The best way for checking the result of classification is to check everything in each class which can be realized in QGIS 3.2 by the function of accuracy assessment (Bakr et al., 2010). Evaluation of accuracy of classified image can be done using error matrix.
The Kappa coefficient result values are between 0 and 1, where the latter shows complete agreement, and is often multiplied by 100 to give a percentage measure of classification accuracy. Kappa values are grouped into three: value of kappa coefficient greater than 0.8 (80%) represent strong agreement, value of kappa coefficient between 0.4 and 0.8 (40-80%) represents moderate agreement, and value of kappa coefficient below 0.4 (40%) represents poor agreement (Rahman et al., 2006). The user’s (correctly classified sample units divided by the sum of reference data sample points in the error matrix) and producer’s accuracy (correctly classified sample units divided by the sum of classified data sample points in the error matrix) as well as elements of the error matrix was calculated to assess error patterns of the respective classification. The reference data used for accuracy assessment were obtained from GPS points during field work and google earth. GPS points used in accuracy assessment were independent of ground truths used in the classification. Confusion matrix was generated by crossing the two maps generated using the training sets and the independent data. The diagonal values of accuracy assessment table define correctly classified percent of each LULC classes and the other non-diagonal values are those which are incorrectly classified classes. The producer accuracy, user accuracy, overall accuracy, and Kappa coefficient were calculated for of 1988, 1998, 2008 and 2018 based on the formula given by Congalton and Green (2009).
2.4. Change Detection
Effective use of remote sensing for LULC change detection largely depends on an adequate understanding of the study area, the satellite imaging system and the various information extraction methods for change detection in order to achieve the aim of the present study (Yang and Lo, 2002). After the image classification, the post classification change detection was performed and evaluated with “from-to” change information (Macleod and Congalton, 1998). Essentially, digital nature of most satellite data makes it easily amenable for computer aided analysis, to automatically correlate and compare two sets of imagery taken of the same area at different time (Ratnayake, 2004). Based on images from different periods, the change detection function in QGIS 3.2 was used to detect the changed areas. Therefore, change detection was done to see which land use is changed to which one. Finally, the table generated with overall information about change matrix between study periods. According to Abate (2011), to compute the rate of LULCC; the following equation was performed for computing rate and percentage of LULC change.
R=rate of LULC change %R = Percentage of LULCC Q2=recent year of LULC in sq. km Q1= Initial year of LULC in sq.km, T = Interval year between initial and recent year.
2.5. Driving forces of Land use/land cover Change in the Study Area
Understanding factors that drives LULCC and its impacts in general is important for modeling, predicting environmental change and help respond to the change in most positive way to benefit the people (Tilahun and Teferi, 2015; Rawat and Kumar, 2015). Lastly, the causes of LULCC were identified based on interviewing park managers, workers, elders in nearby who have knowhow about the park based on above discussed methods. This helps to identify the driving forces of LULCC on the Mago national park and to set different mitigation methods to minimize and control their impact on the park and to appreciate and continue if they have positive impact.
3. Results and Discussion.
3.1. Land use/ land cover change trend and magnitude in the study area.
The LULC classification for 1988 from TM satellite image showed that woodland (which include both dense and open) holds 50.85 %, riverine forest covers 7.59%, grass land holds 35.67%, water body (river and ponds) holds 0.14%, degraded land holds about 1.42% and that of bare land holds 4.33% of the park in 1988. In 1988, the woodland and grass land are dominant cover types in the park, while water body holds very small percent in 1988. In the 1998, the land cover classes were the same with that of 1988 but the percent of existence and area coverage is different (Table 1). From the table and image, the amount of grassland, and degraded land increased in the year 1998 as compared to 1988. Riverine forest, woodland and water body indicated decrement between 1988 and 1998. From the (Table 1 below), some of the land cover types showed increment and some of them indicated decrement within 10 years gaps. In the year 2008, the figure or table below shows that, both woodland and grass land is dominant cover types in the park. From the result of supervised classification, even in the year of 2018; there are still six land use land cover classes in Mago Nation Park. Contrarily, bare land and degraded land also showed increment in this year than selected study periods. The classification report of Mago national park land use land cover in 2018 showed that there is change of both increment and decrement in area coverage (Table 1). The overall classification accuracy report of 95.33, 95.92, 94.25 and 96.06% were showed for the 1988, 1998, 2008 and 2018 classified images, respectively. A kappa coefficient result was found to be 0.9, 0.91, 0.90, and 0.93, for years 1988, 1998, 2008 and 2018 respectively. These results suggest that my land cover classification has acceptable level of accuracy; thus, valid conclusions could be made
3.2. Land Use and Land Cover Changes for three periods.
The following Table 2 above indicates the rate of change in different land cover types in Mago national park. The result shows increment and decrement of cover types between periods.
Mago National Park practiced different LULC changes between 1988 and 2018. The area of woodland, riverine forest, grass land, water body, degraded land and bare land indicated a changing trend between the study periods from 1988 to 2018 (Figure 2a-d above).
In the Table 2 above, period between 1988 and 1998, woodland decreased by 642.679 ha/yr. (-6.76%), riverine forest decreased by 535.779 ha/yr. (-37.98%) grassland increased by 1077.651 ha/yr. (16.11%), water body decreased by 62.38 ha/yr. (-22.37%), degraded land increased by 667.494ha/yr. (85.67%) and bare land decreased by 560.449 ha/yr. (-70.14%) respectively.
The result for the second period (1998-2008) showed that woodland, riverine forest and degraded land decreased by 482.292 ha/year (-5.44%), 40.36 ha/year (-4.61%), and 748.955 ha/year (-80.74%) respectively, whereas grass land, water body and bare land increased by 1145.34 ha/year (14.74%), 8.14 ha/year (3.76%) and 125.45 ha/year (52.58%) respectively. The rate of change between three decades which is between 1988 and 2018 indicated that woodland, riverine forest, water body and bare land decreased by -131.7 ha/yr. (-1.385%), -587.25 ha/yr. (-41.63%), -65.07 ha/yr. (-23.34%) and -526.079 ha/yr. (-65.838%) respectively. The remaining grassland and degraded land increased by 13.02% and 95.01% respectively (Table 2 above).
Table 3 below of land use and land cover change matrix shows distinguished transformations found during the three periods. The results of change between 1988 and 2018 indicated that there is conversion between land cover types. As shown by Table 3 below, all of the LULC types indicated conversion from one type to another. According to this, woodland keep 69.22%, riverine forest covers 53.35%, grass land continues 63.85%, water body keeps 68.85%, degraded land continues 11.7% and that of bare land keeps 23.14% of their coverage in stated decade. But from woodland 20.23% was converted to grass land, from riverine forest 41.65% converted to woodland, 33.04% of grass land converted to woodland, from water body 25.68% converted to woodland, from degraded land 79.54% was converted to woodland and that of 70.93% of bare land converted to grass land between 1988 and 2018. The conversion amount is indicated in Table 3 below as follows.
3.3. Drivers of Land Use/Land Cover Changes and Local Community Perception
The main drivers of LULCC in Ethiopia were growing demand for house hold energy, expansion of agricultural farmland and overgrazing. Massive loss of forest cover at the expense of cultivated land, pasture land and settlements, the rate at which farmland increase over time had declined mainly due to shortage of available suitable land for cultivation (Bewket and Abebe 2013).
LULCC in the Mago national park is a result of several proximate/direct and underlying/indirect causes. The result of discussions and interviews conducted with HH heads, FGD participants and KII in the study area indicated that there are a number of driving forces which lead to LULCC in the Mago national park. Based on the results of the FGDs and other secondary data sources, agricultural and grazing land expansion, forest fire and wood extractions were among major proximate factors that have caused LULC change in the study area. Livestock and population increase, climate variability and decrease in farmland productivity were among the major underlying factors driving proximate causes of the LULC changes in MNP. The findings of this research based on the household surveys, FGDs, and KIIs pointed-out to local communities perceiving firewood collection, agricultural expansion, over-grazing, and fire raised by community, cutting tree for house construction, farm implementing material collection and hunting as the important proximate drivers of LULCC in MNP. These proximate drivers were caused by high poverty levels, population growth, rainfall and temperature variability, lack of law enforcement, poor access to an alternative-energy supply, and high cost of agricultural input.
In Baytsemal kebele around 65% are hunters, 20% pastoralist and 15% farmers and in case of Goldiya kebele 60% hunting, 30% pastoralist and 10% farmers. But in Kure kebele most of the community are farmers and in percentage around 75% are farmers, 20% pastoralists and 5% hunters. From the survey, most of the peoples are hunters and pastoralists, directly or indirectly the communities put pressure on the park. The residents deforest or clear trees for fuel wood/energy, hunting, for building houses, to have farm land and for grazing. In addition to the above-mentioned direct reasons of change, there are also different underlying causes of LULC changes. Livestock rearing is an essential player of the livelihood of the communities in the study area. They were sources of cash income, milk and meat. As indicated by respondents, the park is not respected by large proportion of the community. This is because of the involvement of government management and restriction to use the resources freely. Due to this sometimes there is war between scouts (park rangers) and residents who close the park for hunting, grazing, cutting trees for fire wood and etc. another basic cause is that of lack knowledge. The community lacks knowledge about the use of resources in the park without damaging its existence. From the analysis, from selected kebeles approximately around 20% have positive attitude towards park meaning they know how the existence of resources helps them and the environment but the remaining 80% have negative attitude and they also oppose involvement of government and they want to freely access by hunting, grazing, cutting firewood and other access. To stop and reduce change of cover types, it is better to teach and work with the local community by creating awareness. Unless creating awareness, it is impossible to stop the conversion between land cover types as local community thought that, they have right to use and access every resource in the park as the park is located on their land. The interviewers also presented that, the local community is suffering from problems due to change in the park including variability in amount of rainfall and temperature, low product, drought, soil fertility loss, loss of animal and plant life, etc. Finally, they recommended government to involve and work with local community by being close and involving them.
The social survey done to identify the drivers of land use land cover changes in Mago National Park the results were as follows; majority quantified 28.5 % population pressure, 22 % livestock and overgrazing, 17.5 % agricultural expansion,16.5% wood for fire and house construction,6.5% poverty,6% weak law enforcement,3% education and socio-cultural factors. Interaction of human activities on the natural resources has caused great modification of land use land cover in Mago National Park. Respondents perceived that bare land and riverine forest significantly declined in the MNP. In contrast, woodland, degraded land and grass land indicated an increment between the study periods. Key informants and FGDs also correctly perceived that bare land and riverine forest cover declined from 1988 to 2018.
4. CONCLUSION AND RECOMMNEDATIONS
Mago national park has been suffering different Land use land cover changes through time. Over the last three decades, the study area has shown amazing level of land use land cover change. Supervised classification with Maximum-likelihood algorithm was employed to monitor LULCC. Land cover post-classification change detection techniques were applied to determine the LULCC. From 1988 to 1998, 1998-2008, from 2008 to 2018 and 1988 to 2018 comparison had been made to understand LULCC. Generally, the land use/ land covers of the study area were classified into six classes, namely woodland, riverine forest, grassland, water body, degraded land and bare land. The results indicated that the decrement in woodland, riverine forest, water body and bare land, in contrast grass land and degraded land indicated increment between the year 1988 and 2018. Similar trends have been observed in rangelands of southeast Ethiopia, and we are losing the most important woody species from time to time (Abate et al., 2010). The proximate driving forces of LULCC in Mago National Park are expansion of agricultural land, human made fire, overgrazing and hunting, whereas population and livestock pressure from a different area, unsustainable exploitation of forest, decreased farmlands productivity, lack of law enforcement and cultural factors are the major underlying causes of the observed changes. The results of this study quantify dynamics of land cover change and point towards appropriate action to implement sustainable use of the ecosystem. Rather than keeping the park, it is better to work with community, create awareness as indicated by social survey analysis. From this research, most of the communities have negative attitude and want to access the park as they want, and also, they think that for all the changes happening on the park government should take the responsibility. Therefore, proper and integrated approach in implementing policies and strategies related to land resources management should be considered. Enhancing productivity using proper technologies needs to be induced to minimize expansion of agriculture into forest lands and it is better to teach, work with and create awareness of the communities rather than working alone.
References
- Abd El hay Aly Farrag, El Sayed Ahmed El Sayed and Hanaa Ahmed Megahed, 2016: Land Use/LandCover Change Detection and Classification using Remote Sensing and GIS Techniques: A Case Study at Siwa Oasis, Northwestern Desert of Egypt: International Journal of Advanced Remote Sensing and GIS.
- Adane Mezgebu Nigussie, 2016: Land Use/Land Cover Changes and Associated Driving Forces in Bale Eco-Region, Ethiopia; MSc Thesis Wondo Genet Ethiopia.
- Alqurashi AF, Kumar L., 2014: Land Use and Land Cover Change Detection in the Saudi Arabian Desert Cities of Makkah and Al-Taif Using Satellite Data; Journal of RS.
- Alvi (2016): A Manual for Selecting Sampling Techniques in Research.
- Bakr N., Weindorf D. C., Bahnassy M. H., Marei S. M and EI-Badawi, M. M., 2010: Monitoring land cover changes in a newly reclaimed area of Egypt using multi-temporal Landsat data: Journal of Applied Geography.
- Bewket Woldeamlak, Abebe S., 2013: Land-use and land-cover change and its environmental implications in a tropical highland watershed, Ethiopia. International Journal of Environmental Studies.
- Burka Ashenafi, 2008: Land Use /Land Cover Dynamics in Prosopis Juliflora invaded area of Metehara and the Surrounding Districts Using Remote Sensing and GIS Techniques. MSc. thesis, Addis Ababa University, Ethiopia.
- Congalton, R.G. and Green, K. 2009. Assessing Accuracy of Remotely Sensed Data: Principles and Practices, 2nd Edition. Taylor and Francis Group, London New York.
- Das Tanmoy, 2009: Land Use/Land Cover Change Detection: Object Oriented Approach, Munster, Germany.
- Efrem Garedew, Mats Sandewall, Ulf Söderberg and Bruce Campbell, 2012: Land-Use and Land-Cover Dynamics in the Central Rift Valley of Ethiopia; Journal of RS.
- Ellis Erle, 2007: Land use and land cover change; Encyclopedia of Earth.
- Gebiaw T Ayele, Aschalew K Tebeje, Solomon S Demissie, Mulugeta A Belete, Mengistu A Jemberrie, Wondie M, Teshome, Dereje T Mengistu and Engidasew Z Teshale, 2017: Time Series Land Cover Mapping and Change Detection Analysis Using GIS and Remote Sensing, Northern Ethiopia; Journal of Remote Sensing.
- Geist, H. J. and Lambin, E. F. 2002. Proximate Causes and Underlying Driving Forces of Tropical Deforestation; Journal of Bioscience.
- Gomez C, White JC, Wulder MA, 2016: Optical remotely sensed time series data for land cover Classification: A review.
- Haile Belay, 2017: Drivers of Land Use/Land Cover Change in the Guraferda District of Bench-Maji Zone, Southwestern Ethiopia; J. of Ecology and Env’tal Sciences.
- Jayasekara, R. S. 2012: Focus groups in nursing research: Methodological perspective; Nursing Outlook.
- Jensen, J. 1996: Introduction digital image processing: A remote sensing perspective (2nd edition): New York.
- Kothari, C. R., 2004. Research methodology: Methods and techniques. Second edition.
- Lillesand, T. M., Kiefer, R. W. and Chipman, J. W., 2004): Remote sensing and image interpretation (5th edition).
- Macleod, R. D. and Congalton, R. G. 1998: A Quantitative Comparison of Change Detection Algorithms for Monitoring Eelgrass from Remotely Sensed Data. International Journal of Photogrammetric Engineering & Remote Sensing.
- Mideksa, T.K., 2010: Economic and distributional impacts of climate change: The case of Ethiopia; Journal of Global Environmental Change.
- Miller, A. B.; Bryant, E. S., and Birnie, R. W, 1998: An Analysis of Land Cover Changes in the Northern Forest of New England Using Multi-temporal LANDSAT MSS Data. International Journal Remote Sensing.
- Molla, M. B. 2014. Land Use/ land cover dynamics in the Central Rift Valley Region of Ethiopia: The Case of Arsi Negele District. Academia Journal of Environmental Sciences 2(5): 074-088.
- Owojori, A. and H. Xie, 2005: Landsat Image-Based Land use/ land cover Changes of San Antonio, Texas Using Advanced Atmospheric Correction and Object-Oriented Image Analysis Approaches. 5th International Symposium on Remote Sensing of Urban Areas, Tempe, AZ.
- Pandey, D.N., 2002. Sustainability science for tropical forests. International Journal of Conservation Ecology.
- Pandian M., Rajagopal N., Sakthivel G. and Amrutha. D.E, 2014: Land Use and Land Cover Change Detection Using RS and GIS In Parts of Coimbatore and Tiruppur Districts, Tamil Nadu, India: International Journal of Remote Sensing and Geoscience.
- Rahman M., Csaolovics, E., Koch, B., and Kohl, M., 2006: Interpretation of Tropical Vegetation Using Landsat ETM+ Imagery.
- Ratnayake Ranitha, 2004: Remote sensing and GIS application for monitoring forest management operations. PhD Dissertation TUD Germany,.
- Sarma, V.V.L.N., Murali Krishna, G., HemaMalini, B. and NageswaraRao, K., 2001: Land use/ Land cover Change Detection through Remote Sensing and its Climatic Implications in the Godavari Delta Region: Journal of the Indian Society of Remote Sensing.
- Steven E. and Franklin, 2001. Remote Sensing for Sustainable Forest Management; Review.
- Tefera M., 2011. Land-use/land-cover Dynamics in Nonno District, Central Ethiopia. Journal of Sustainable Development in Africa.
- Tilahun A, Teferi B., 2015: Accuracy Assessment of land use land cover classification using Google Earth; American Journal of Environmental Protection.
- Wright, D.J., 2009: Social power and GIS technology: a review and assessment of approaches for natural resource management. Annals of the Association of American Geographers,.
- Y. Demeke and A. Bekele, 2000: Population estimates and threats to elephants Loxodonta Africana in the Mago National Park, Ethiopia,.
- Yang, X. and C. Lo, 2002: Using a time series of satellite imagery to detect LU/LC changes in the Atlanta, Georgia metropolitan area. International Journal of Remote Sensing.
Figure 2.
(a). LULC Map of MNP in 1988.
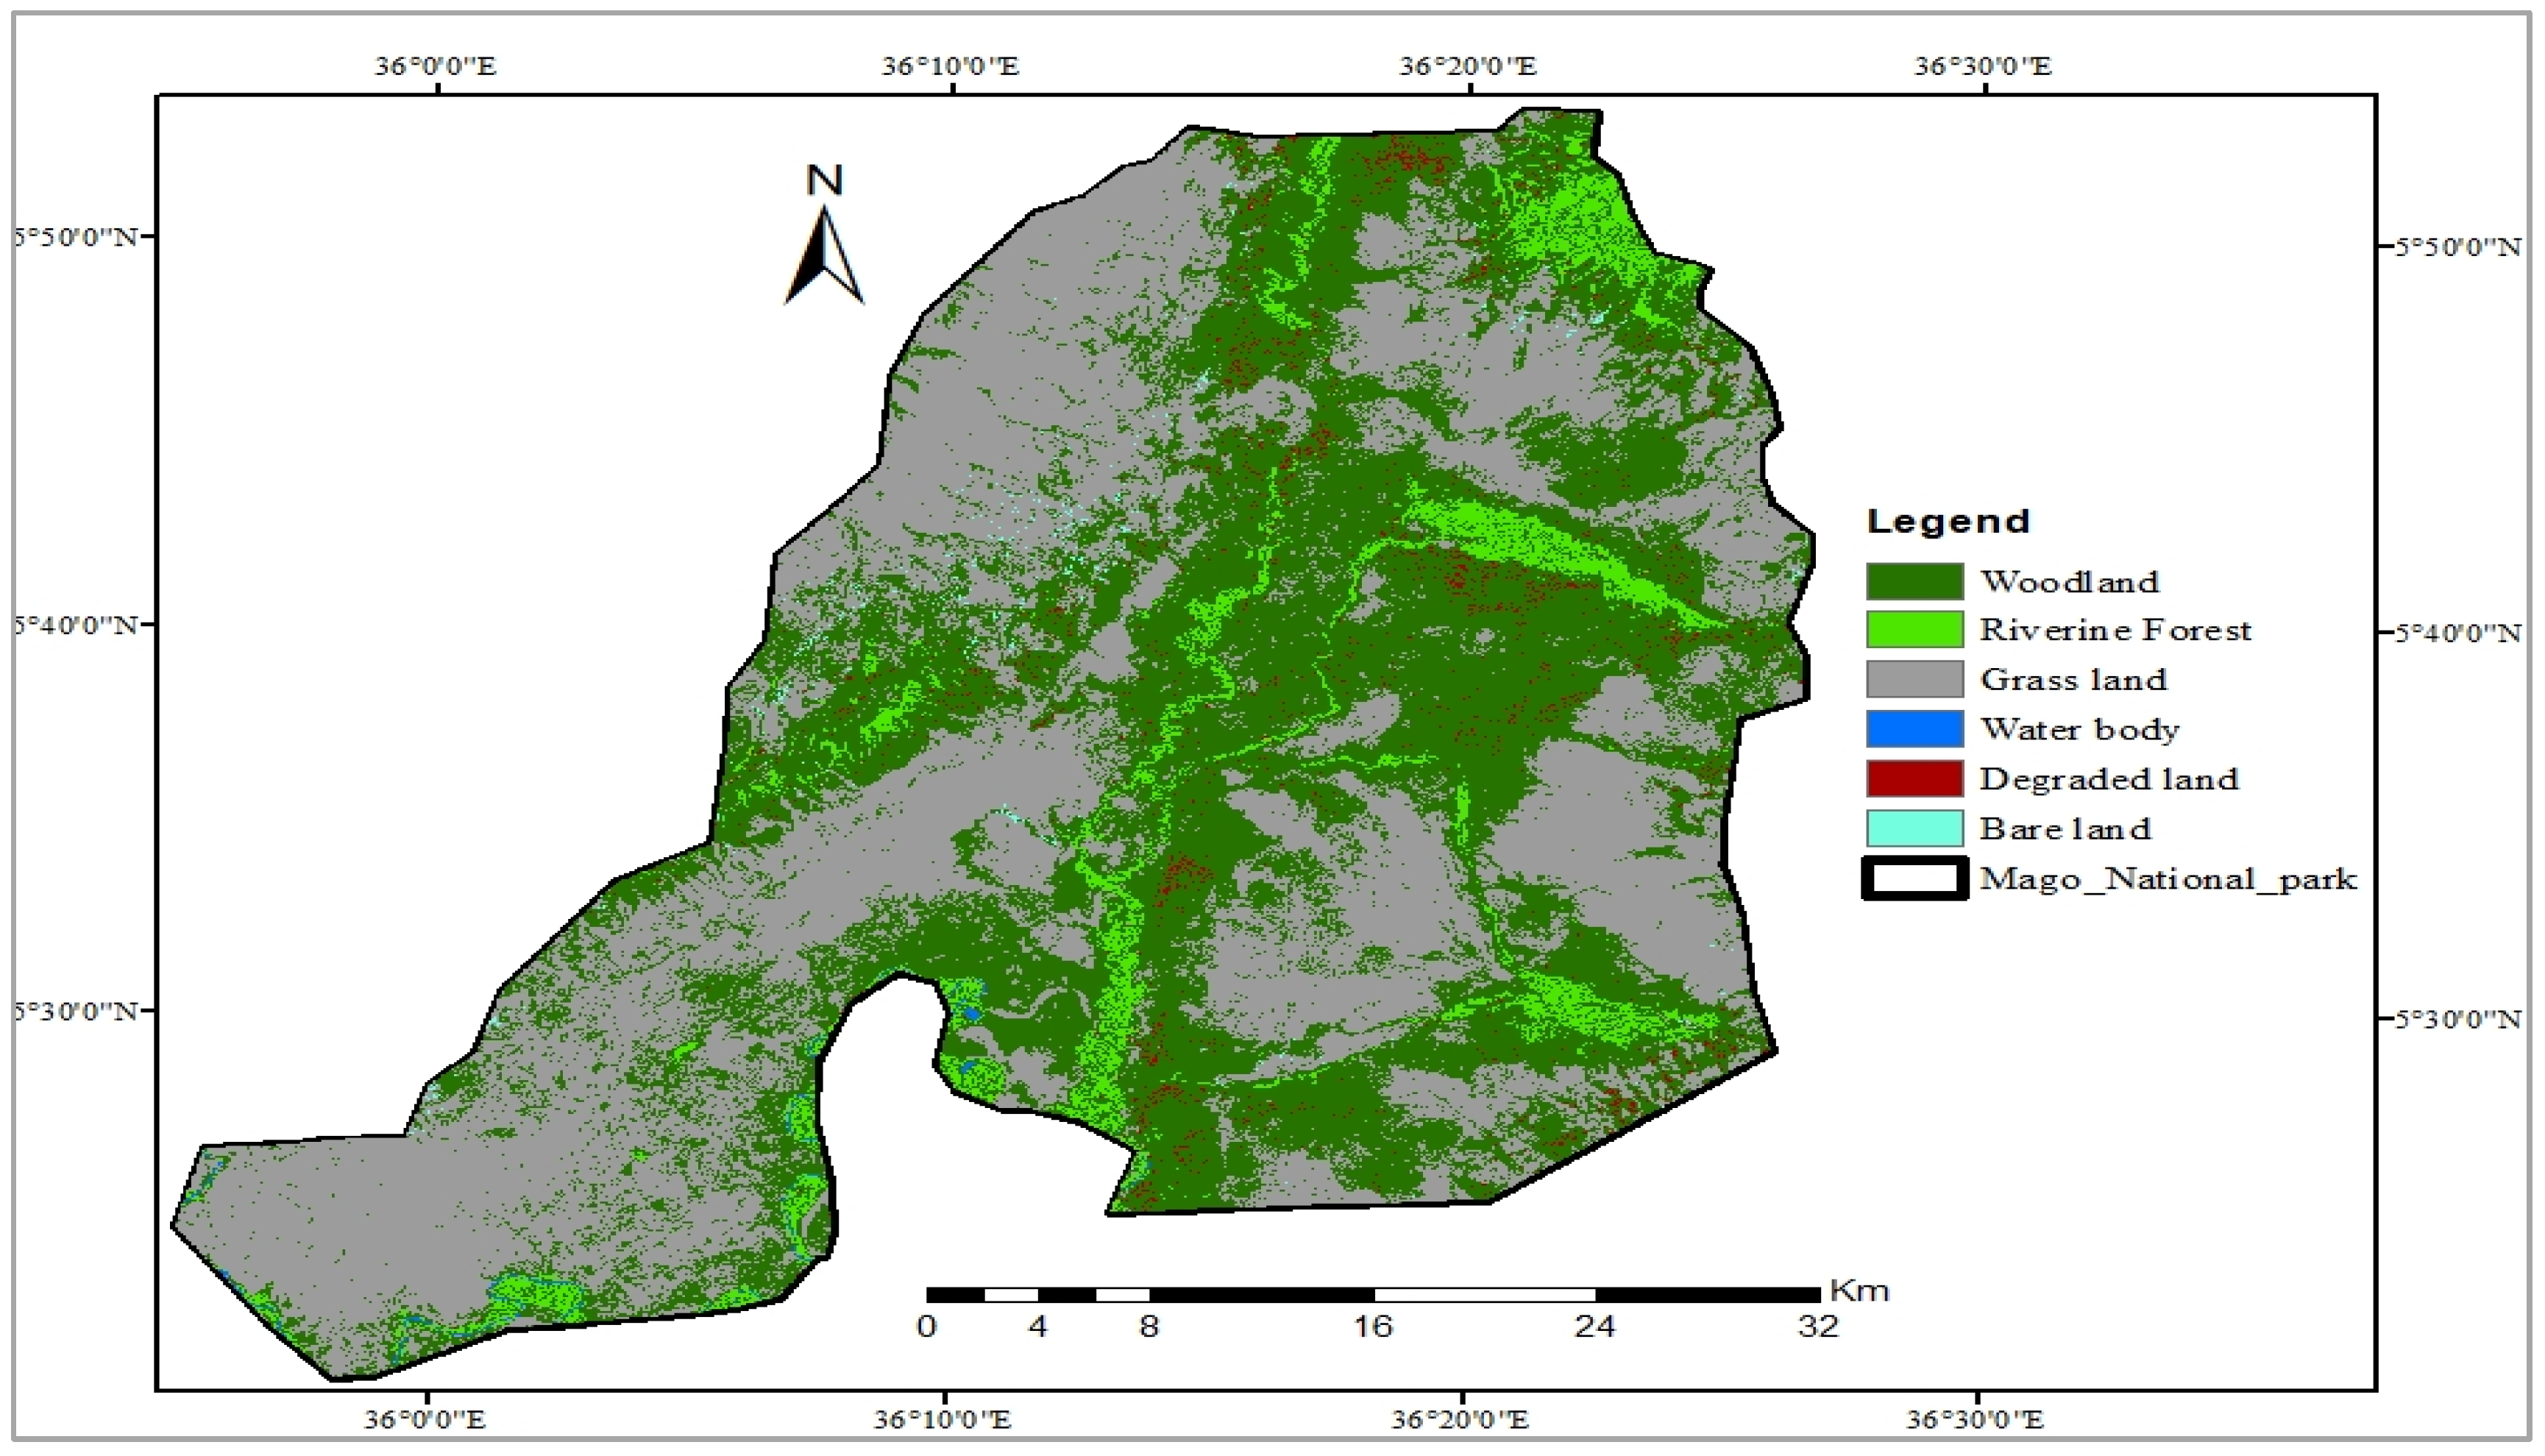
Figure 2.
(b) LULC Map of MNP in 1998.
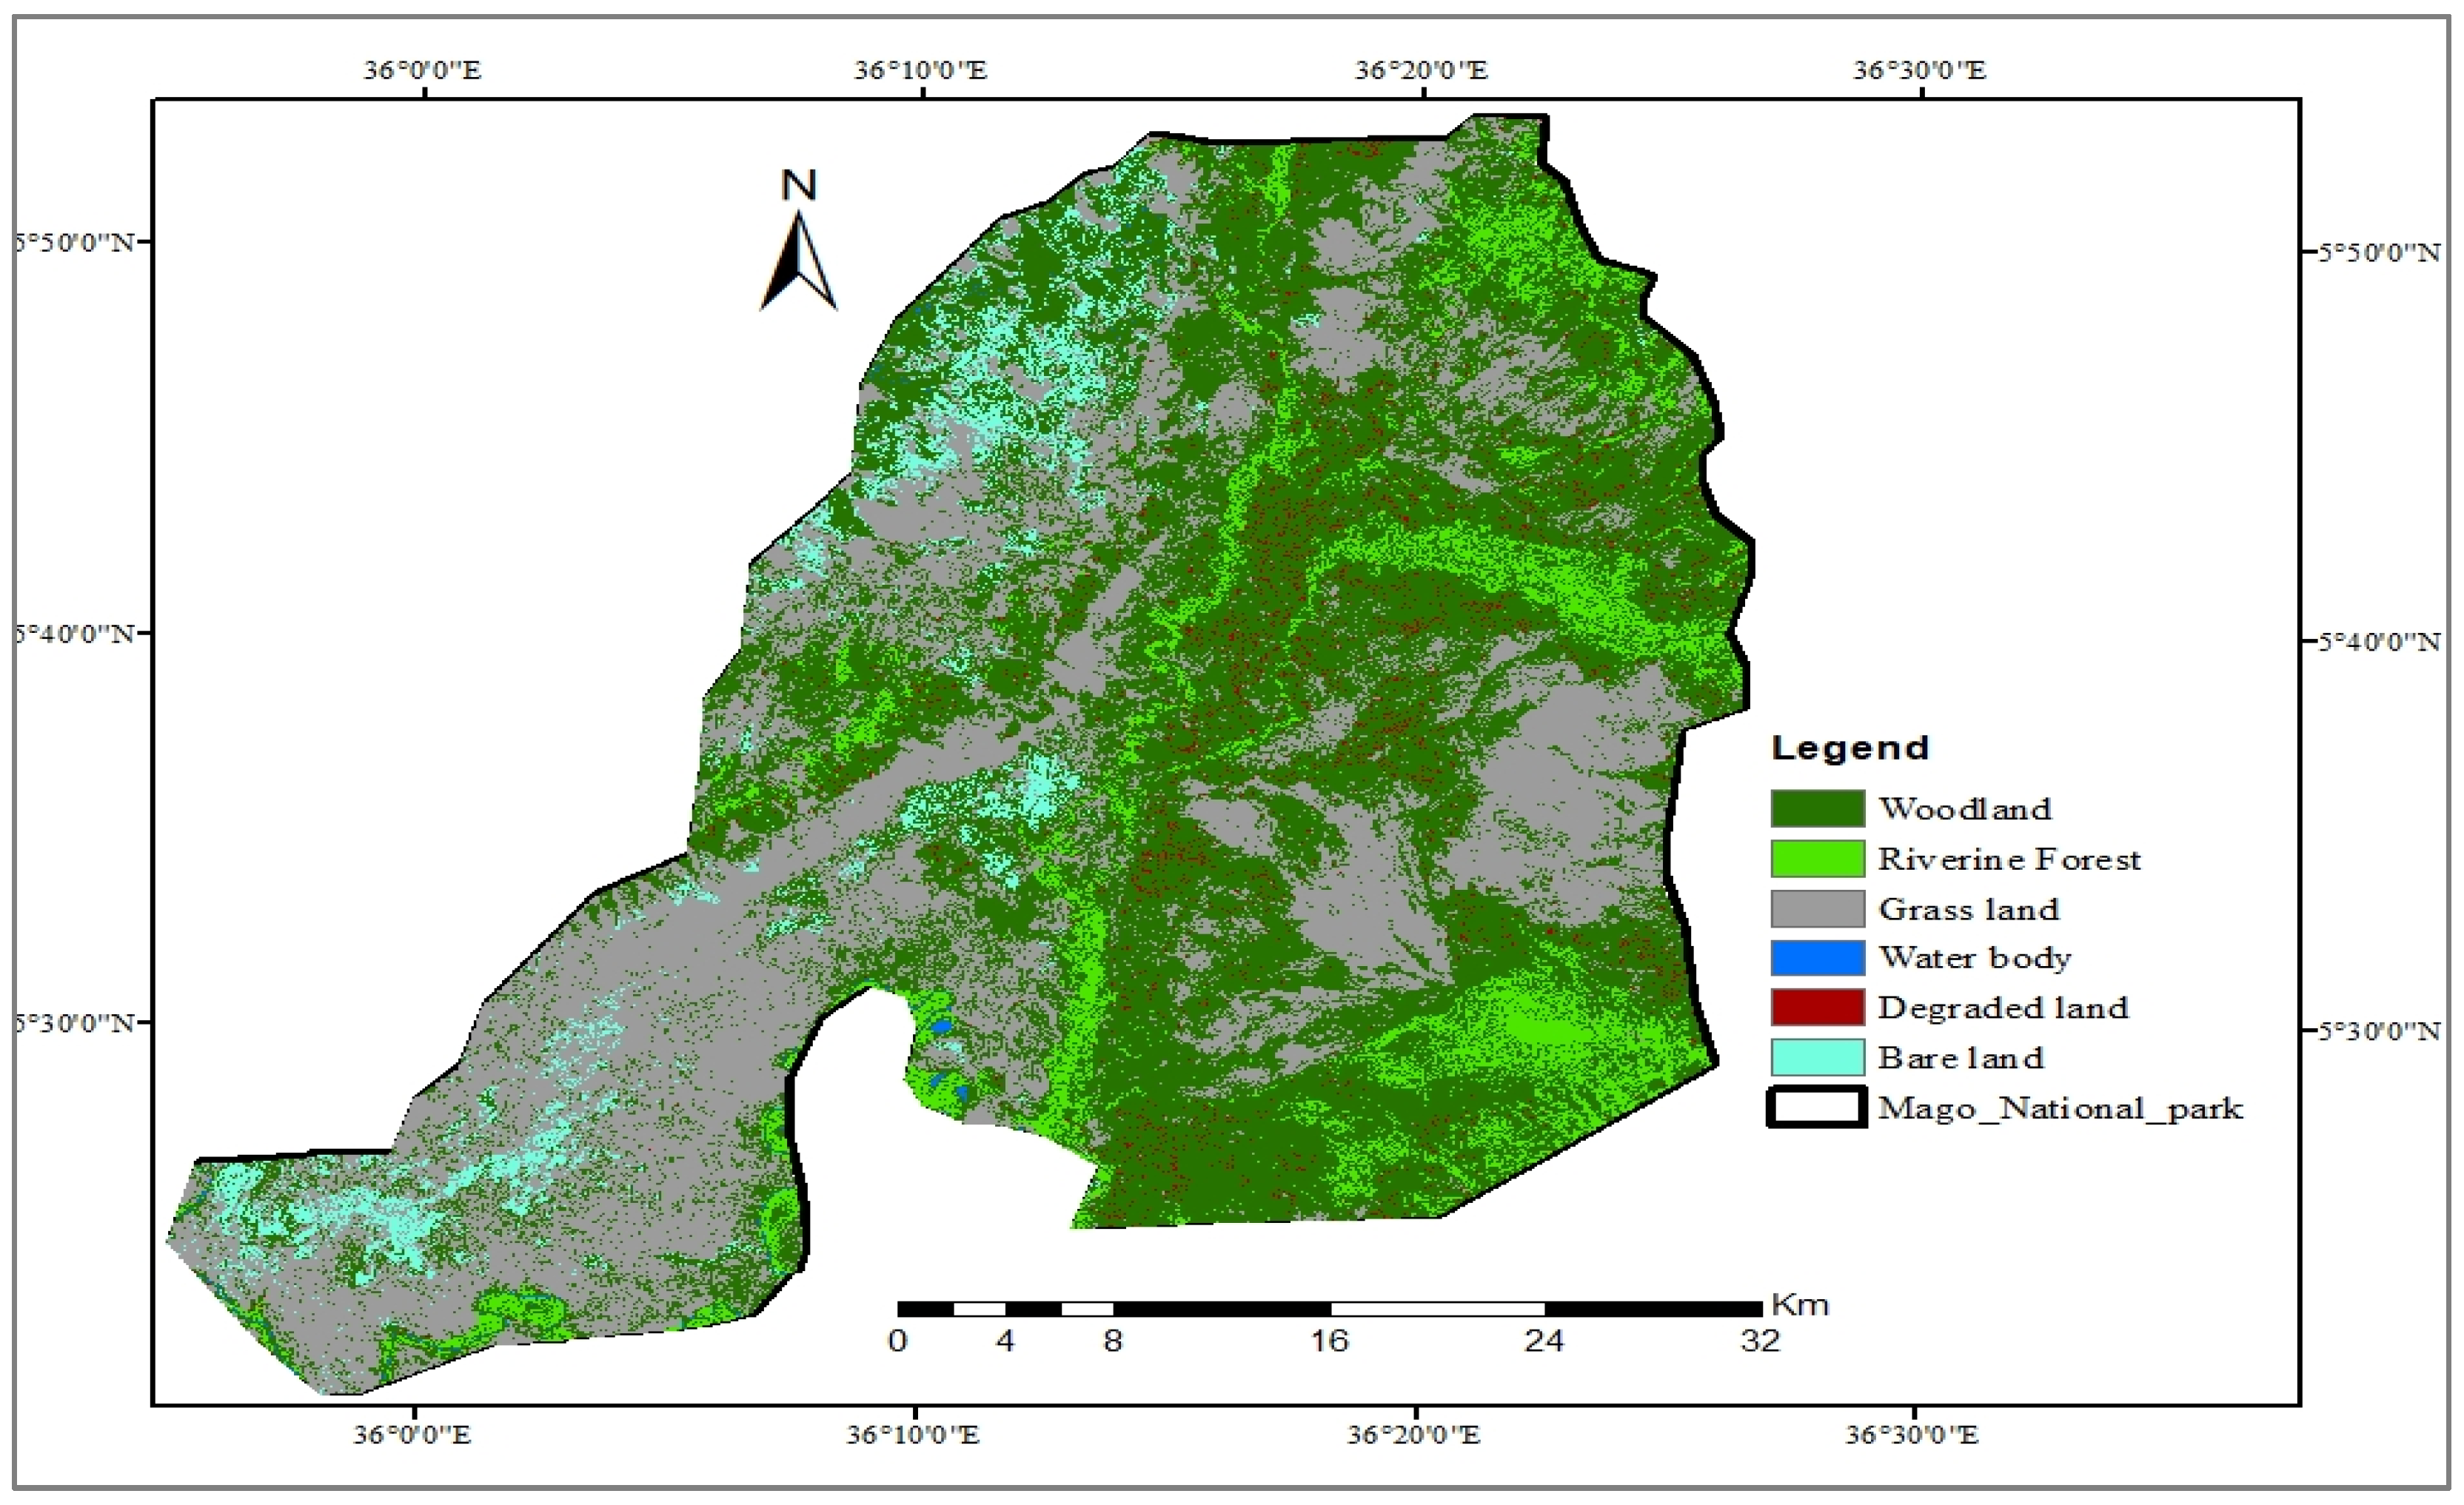
Figure 2.
(c) LULC Map of MNP in 2008 .
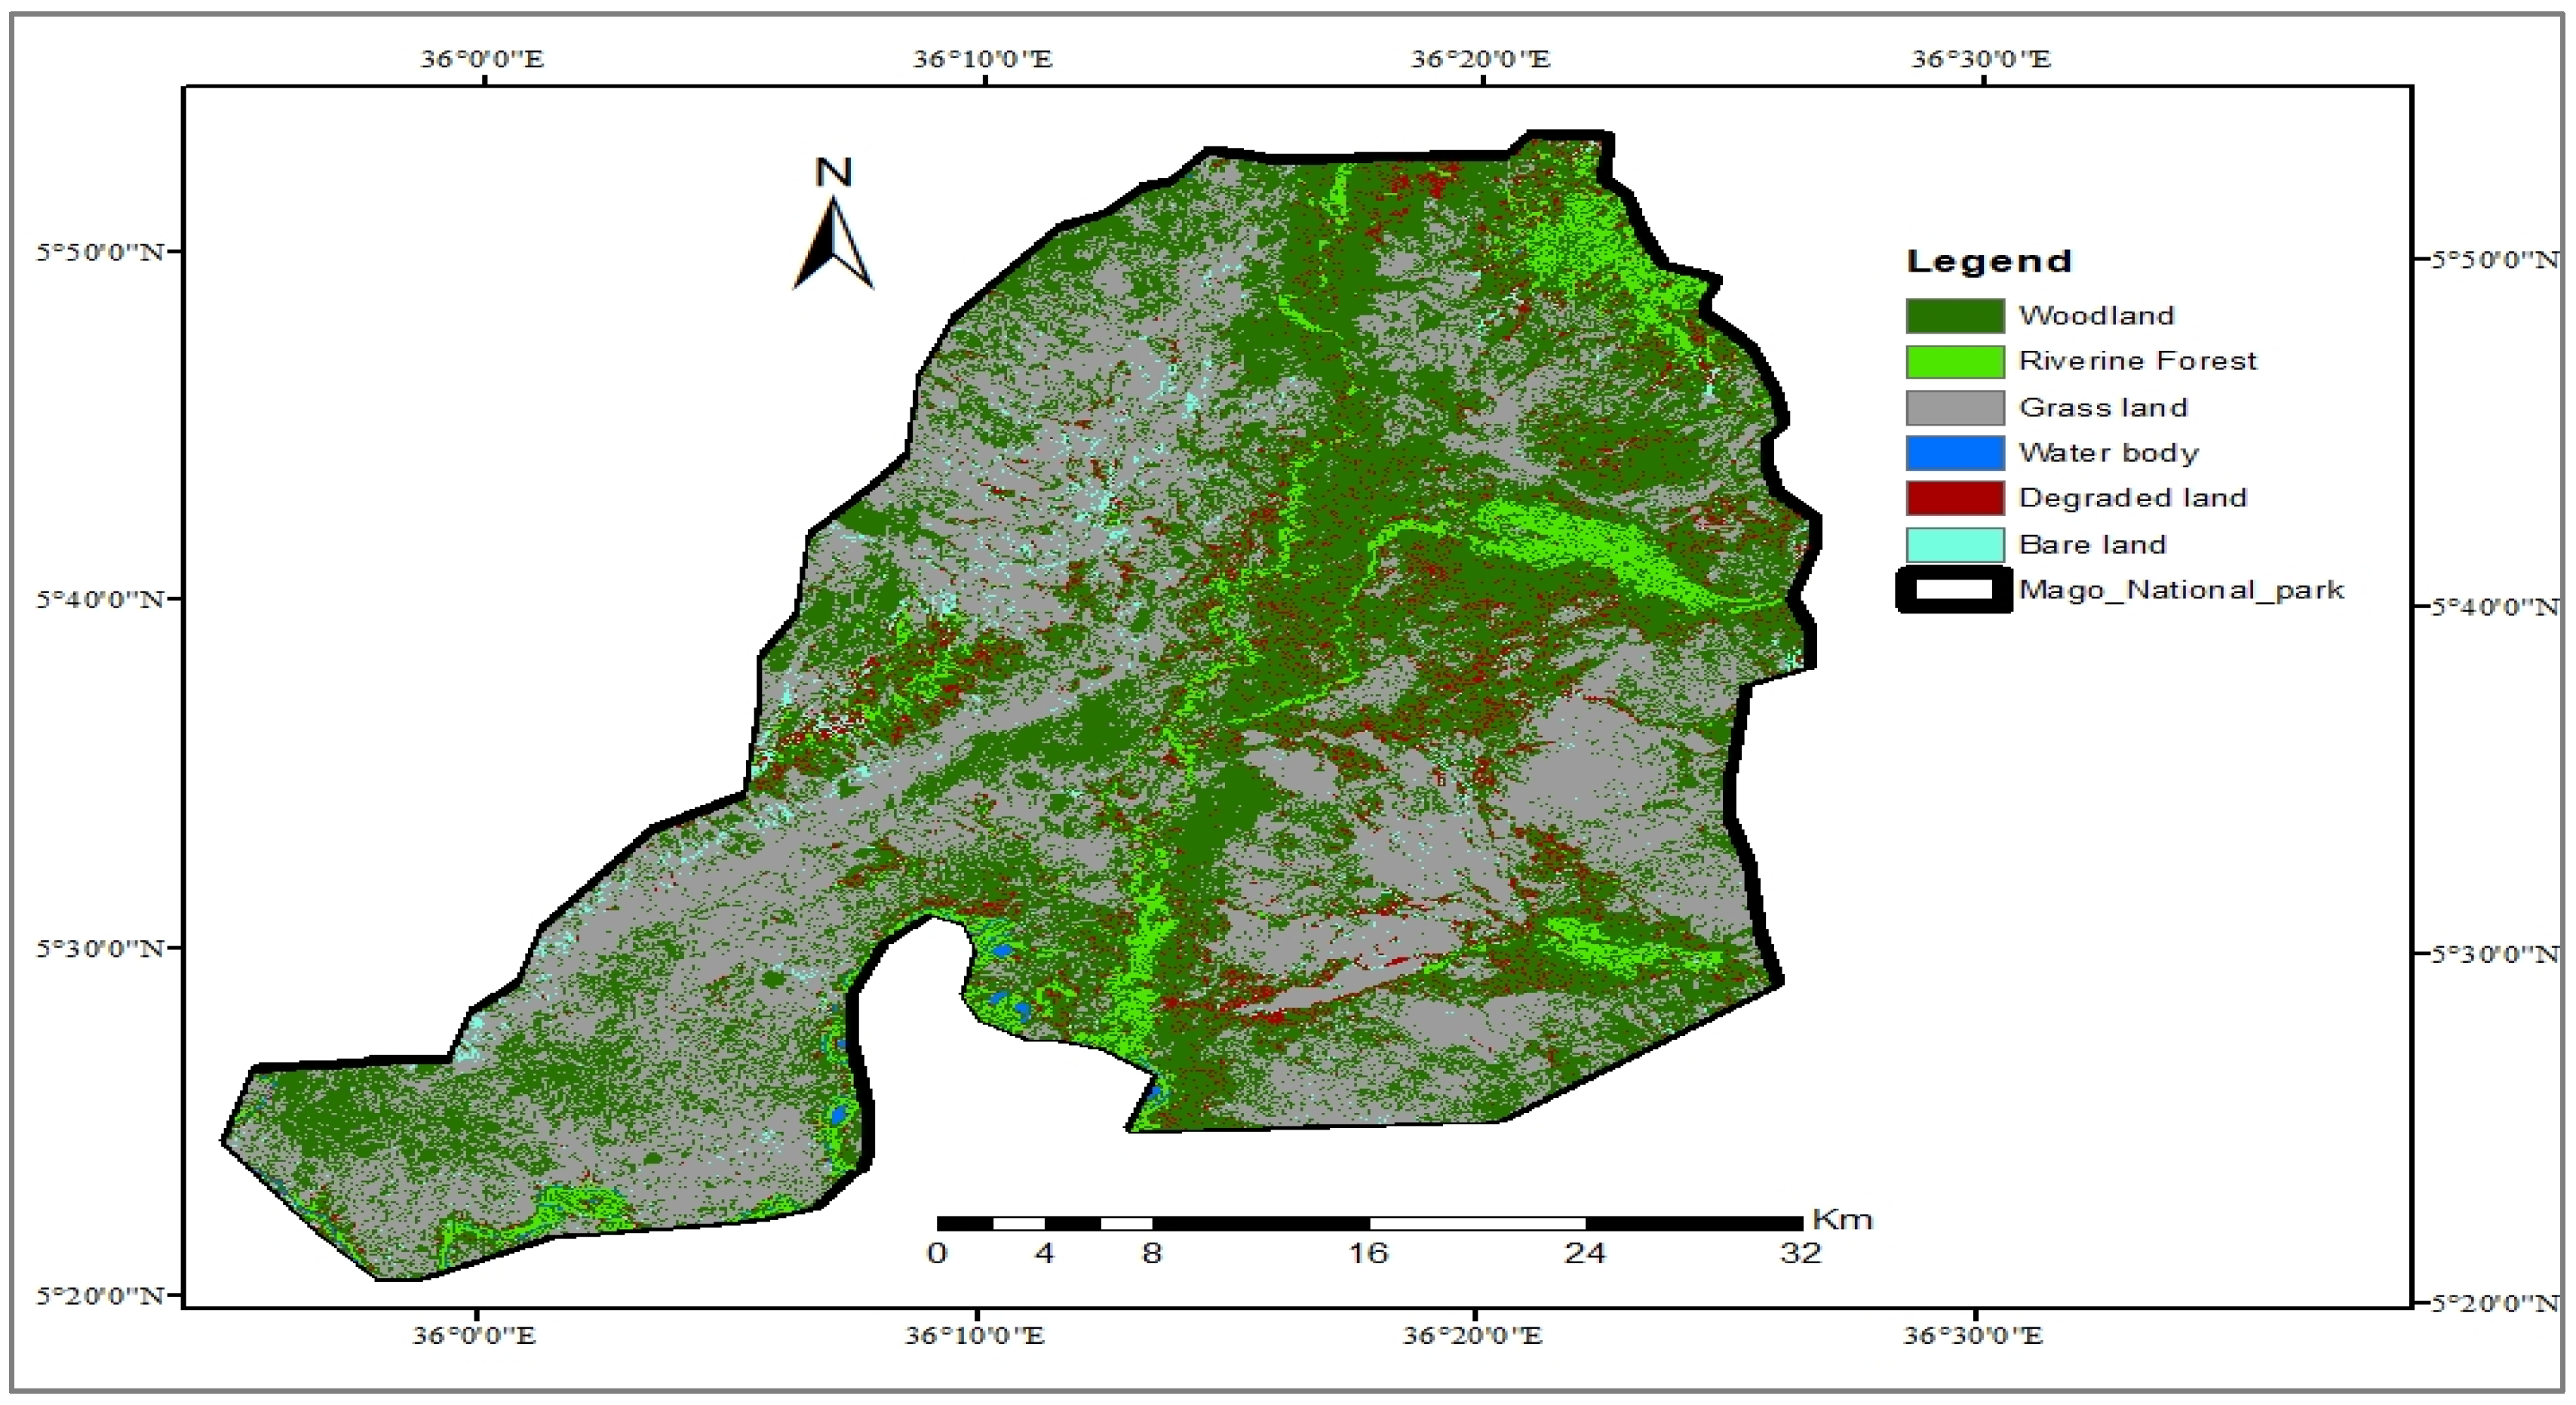
Figure 2.
(d) LULC Map of MNP in 2018.
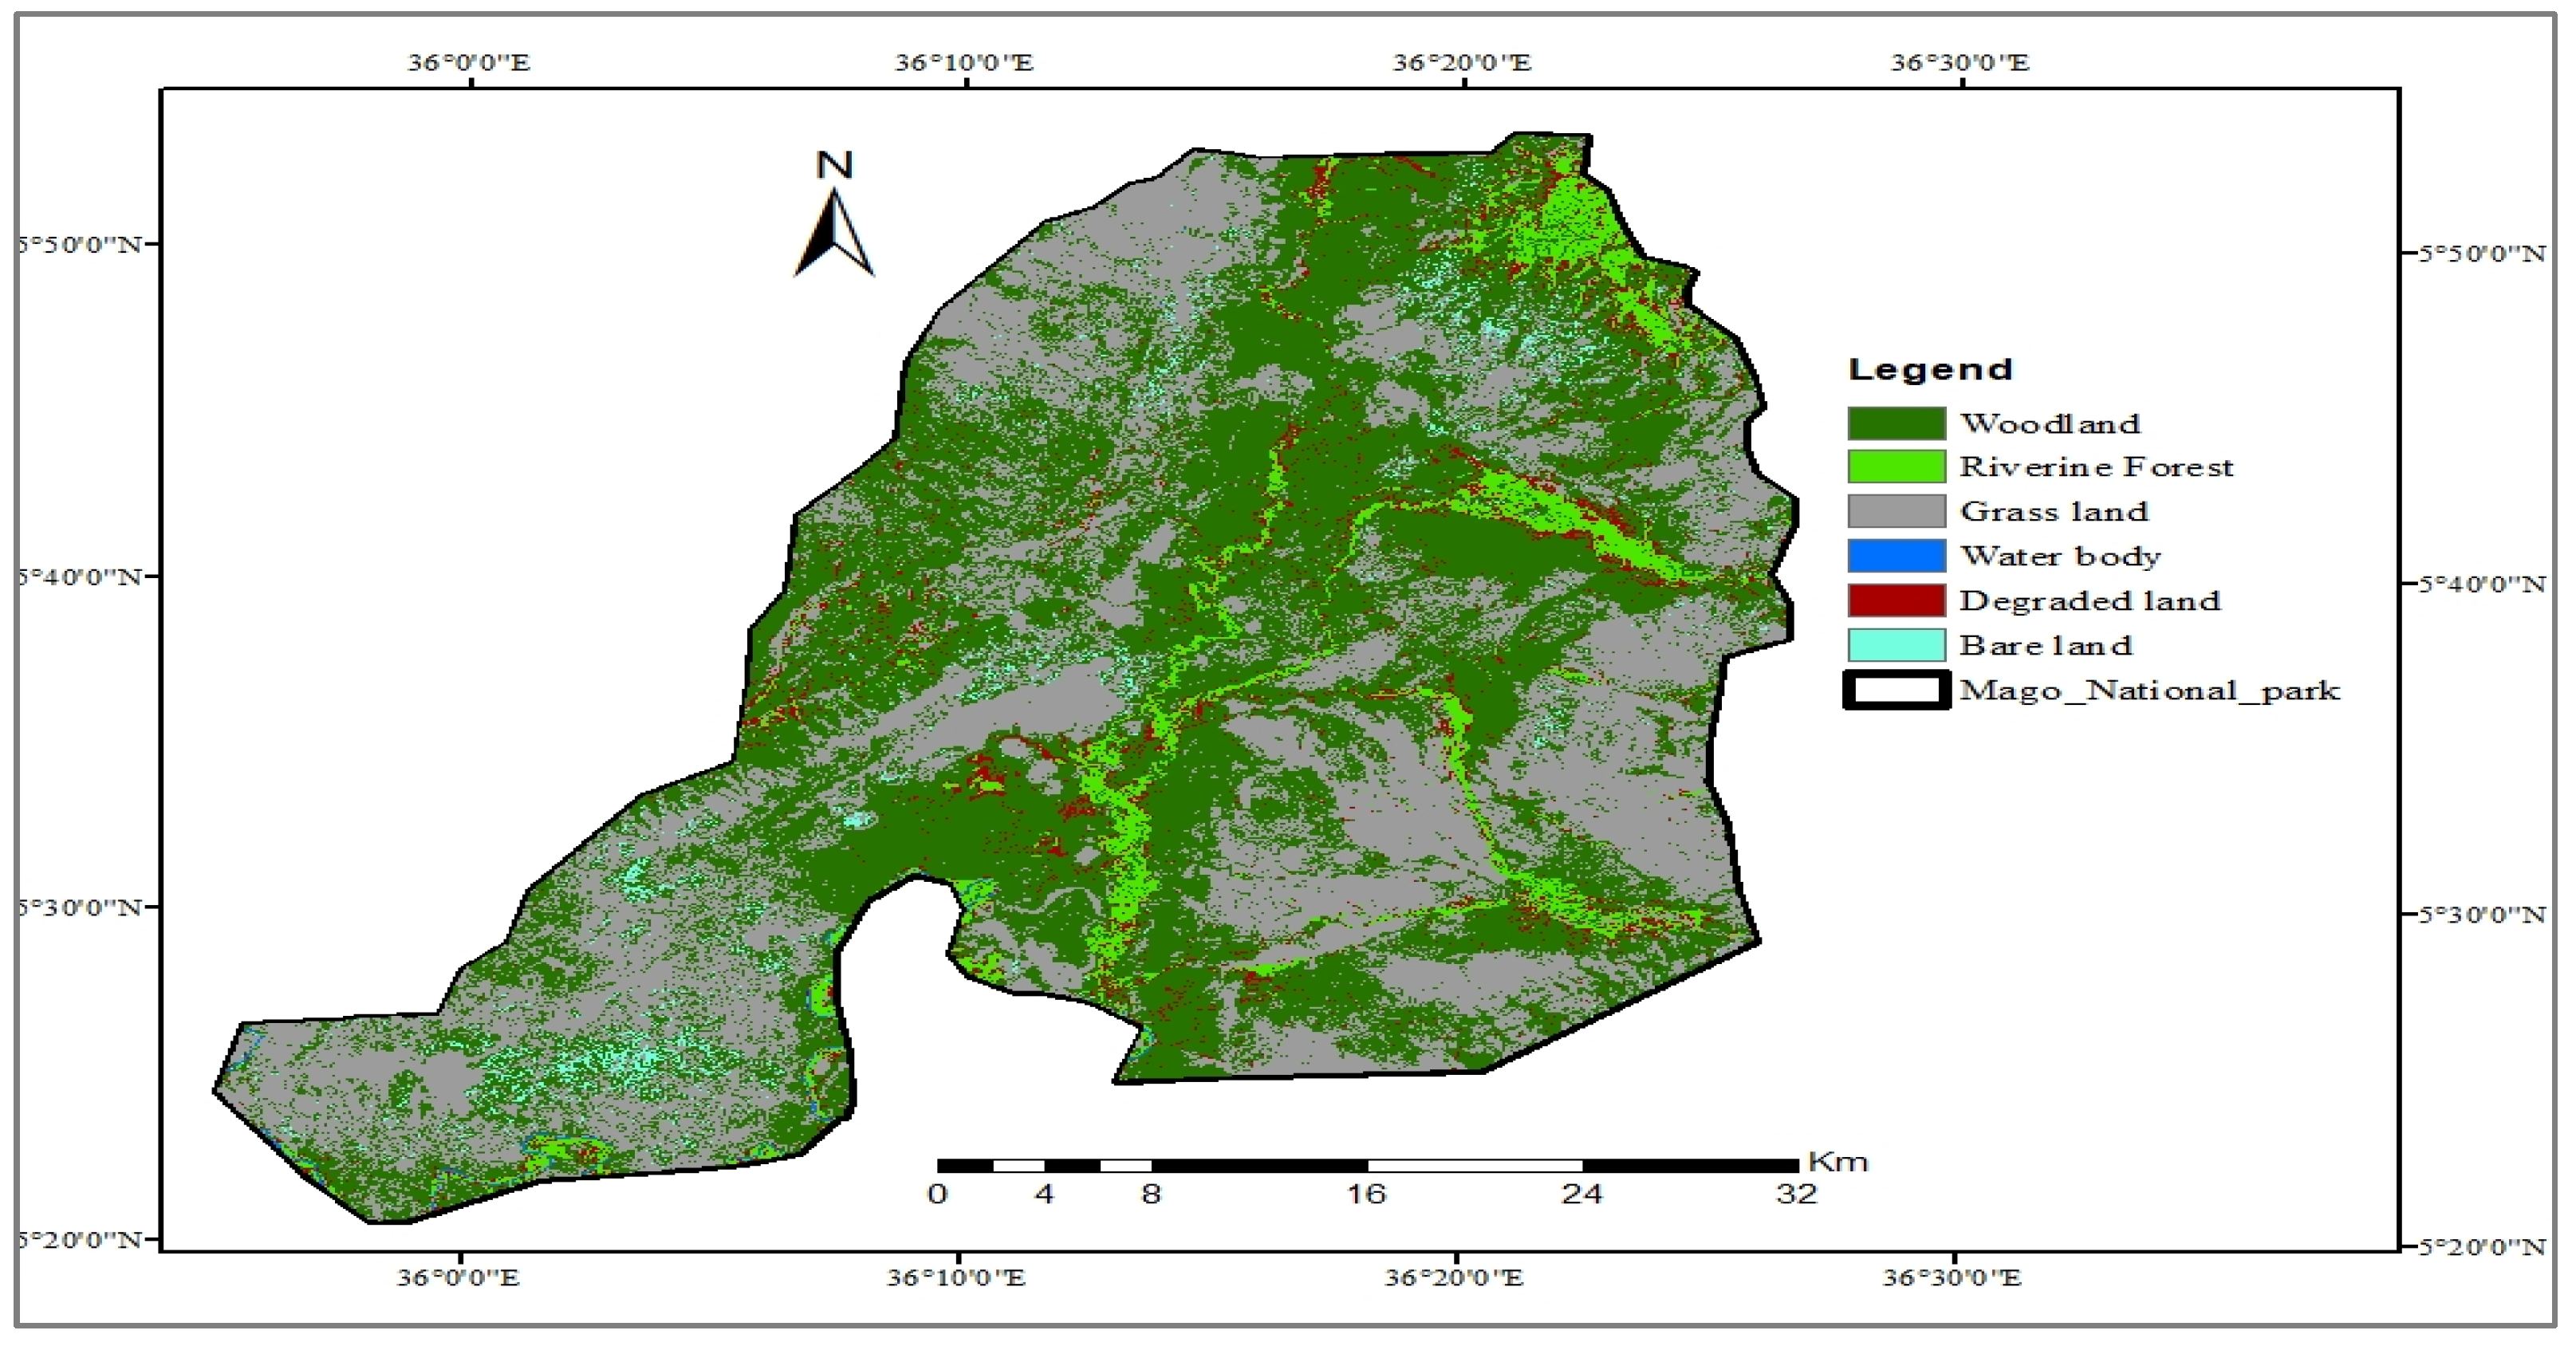

Table 1.
Areas of LULC types in Mago National Park for the years from 1988 to 2018.
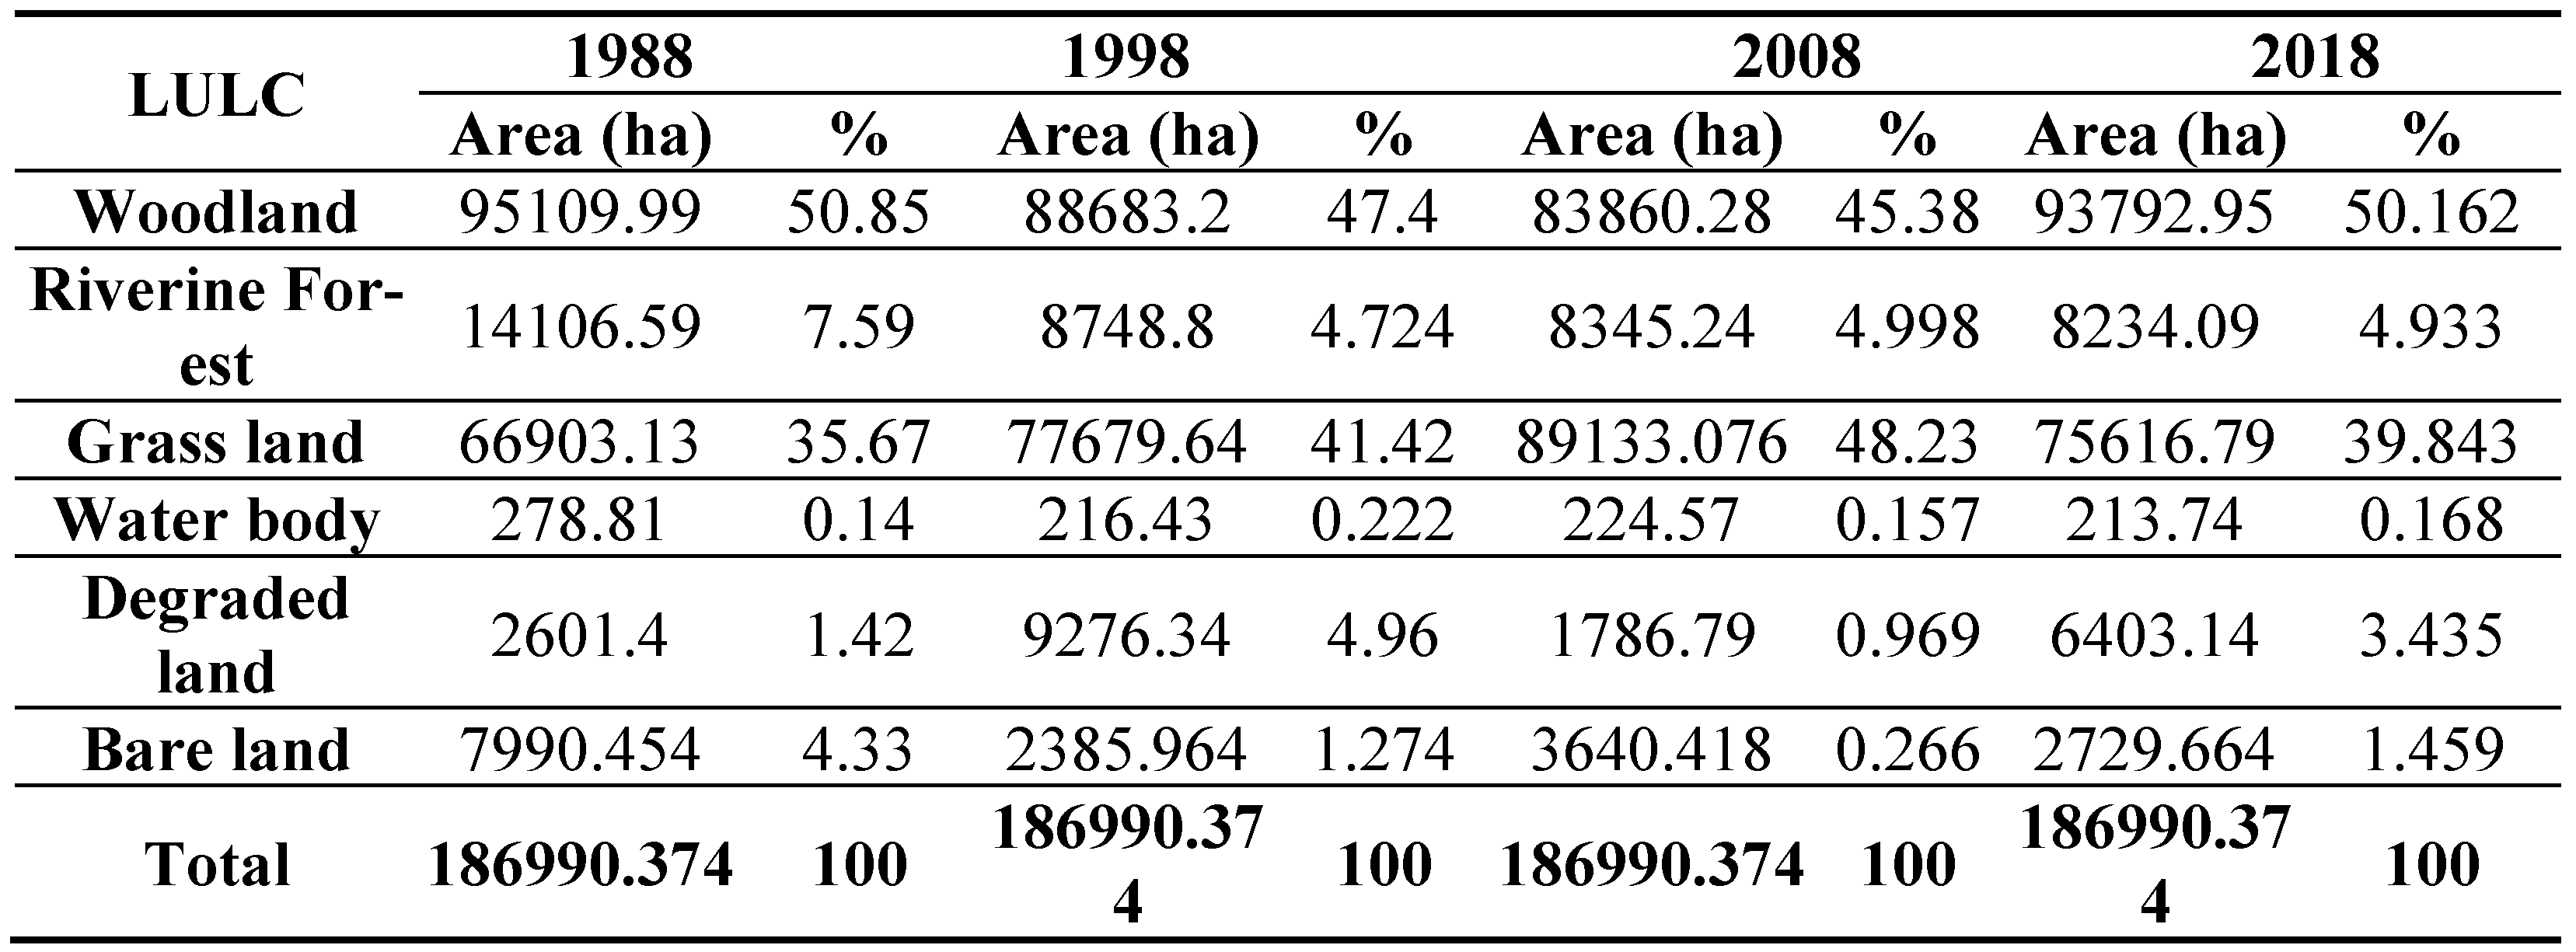 |
Table 2.
Change in Land Cover between Periods .
| LULC 1988-1998 1998-2008 2008-2018 1988-2018 | ||||||||
| Rate (ha/yr.) | % | Rate (ha/yr.) | % | Rate (ha/yr.) | % | Rate (ha/yr.) | % | |
| Woodland | -642.679 | -6.76 | -482.292 | -5.44 | 993.27 | 11.84 | -131.7 | -1.385 |
| Riverine forest | -535.779 | -37.98 | -40.36 | -4.61 | -11.115 | -1.33 | -587.25 | -41.63 |
| Grass land | 1077.651 | 16.11 | 1145.34 | 14.74 | -1351.63 | -15.16 | 871.366 | 13.02 |
| Water body | -62.38 | -22.37 | 8.14 | 3.76 | -10.83 | -4.82 | -65.07 | -23.34 |
| Degraded land | 667.494 | 85.67 | -748.955 | -80.74 | 461.635 | 85.49 | 380.174 | 95.01 |
| Bare land | -560.449 | -70.14 | 125.45 | 52.58 | -91.75 | -25.02 | -526.079 | -65.838 |
Table 3.
LULC Change detection matrix of 1988 and 2018.
| 2018 | |||||||||||||
| 1988 | Woodland | Riverine forest | Grass land | Water body | Degraded land | Bare land | |||||||
| Area(ha) | % | Area(ha) | % | Area(ha) | % | Area(ha) | % | Area (ha) | % | Area (ha) | % | Total | |
| Woodland | 58387.99 | 69.22 | 3034.34 | 3.6 | 17061.06 | 20.23 | 12.89 | 0.02 | 5036.5 | 5.97 | 811.22 | 0.96 | 84344 |
| Riverine forest | 3829.41 | 41.65 | 4905.33 | 53.35 | 127.26 | 1.38 | 6.44 | 0.07 | 313.32 | 3.41 | 12.15 | 0.13 | 9193.91 |
| Grass land | 30055.33 | 33.04 | 186.2 | 0.2 | 58073.37 | 63.85 | 12.22 | 0.01 | 831.95 | 0.91 | 1796.9 | 1.98 | 90955.97 |
| Water body | 67.68 | 25.68 | 3.06 | 1.16 | 10.47 | 3.97 | 180.86 | 68.63 | 1.44 | 0.55 | 0 | 0 | 263.51 |
| Degraded land | 1436.97 | 79.54 | 104.13 | 5.76 | 42.21 | 2.34 | 1.15 | 0.06 | 211.45 | 11.7 | 10.72 | 0.59 | 1806.63 |
| Bare land | 15.57 | 3.65 | 1.03 | 0.24 | 302.42 | 70.93 | 0.18 | 0.04 | 8.48 | 1.99 | 98.67 | 23.14 | 426.35 |
Disclaimer/Publisher’s Note: The statements, opinions and data contained in all publications are solely those of the individual author(s) and contributor(s) and not of MDPI and/or the editor(s). MDPI and/or the editor(s) disclaim responsibility for any injury to people or property resulting from any ideas, methods, instructions or products referred to in the content. |
© 2023 by the authors. Licensee MDPI, Basel, Switzerland. This article is an open access article distributed under the terms and conditions of the Creative Commons Attribution (CC BY) license (http://creativecommons.org/licenses/by/4.0/).
Copyright: This open access article is published under a Creative Commons CC BY 4.0 license, which permit the free download, distribution, and reuse, provided that the author and preprint are cited in any reuse.


