Submitted:
28 October 2025
Posted:
30 October 2025
You are already at the latest version
Abstract
Optical encoders are high-precision positioning sensors based on the principle of grating diffraction. However, harmonic distortion remains a critical factor limiting the further improvement of measurement accuracy. In response to this challenge, this paper proposes a strategy to suppress harmonic components in the output signals of optical encoders. In this work, a general expression for the light intensity distribution of the grating image is derived. Then, orthogonal sine-cosine signals are generated using a grid photoelectric sensor array, which replaces the conventional slit grating. Furthermore, a method for the co-optimization of the photosensitive unit width and offset is proposed, which effectively suppresses the third and fifth harmonic components. The results demonstrate that the proposed structure significantly reduces the proportion of higher-order harmonics, with both the third and fifth harmonic distortions below 0.01%, leading to a substantial improvement in output signal quality. This work provides an effective approach for developing high-precision optical encoder systems with low harmonic distortion.
Keywords:
optical encoder
; generalized grating imaging
; harmonic suppression
1. Introduction
As the core sensing component for precision displacement and angle measurement, the performance of encoders directly determines the positioning accuracy and dynamic response of motion control systems. The increasingly stringent performance requirements of high-end equipment, such as high-precision Computer Numerical Control (CNC) machine tools and industrial robots, are driving the continuous evolution of encoders toward high resolution, enhanced accuracy, and real-time responsiveness [1].
Traditional optical encoders typically operate based on the principle of Moiré fringe effect. The underlying physical process involves a collimated beam that passes through a first grating and undergoes diffraction [2]. The resulting diffracted light is then modulated by a second grating, thereby generating the Moiré fringes used for measurement. The performance of this encoder type is highly sensitive to the alignment tolerance of the gap between the two gratings. Even minor relative displacements can alter the interference field distribution, degrade output signal contrast, and introduce waveform distortion, ultimately increasing measurement errors [3]. In contrast, optical encoders based on the Talbot effect have attracted significant attention due to their greater tolerance to installation misalignments [4,5]. The operating principle is as follows: when a collimated beam illuminates a periodic grating, diffraction produces a periodic self-imaging of the grating at specific distances. High-precision displacement or angle measurement is realized by detecting variations in the light intensity distribution of the self-imaging.
Optical encoders are classified into transmissive and reflective types according to their optical path configuration and the physical characteristics of the code disc [6]. A transmissive encoder typically uses a two-grating structure consisting of a code disc grating and a slit grating. The code disc is a transparent grating etched with hollowed lines, and the light source and the photoelectric sensor are positioned on opposite sides of the code disc, as shown in Figure 1. Reflective encoders, on the other hand, usually adopt a three-grating structure incorporating an index grating to mitigate measurement errors caused by non-collimated light. In this case, the code disc surface contains alternating reflective and non-reflective regions, and both the light source and sensor are placed on the same side of the code disc, as illustrated in Figure 2. The relative displacement between the code disc grating and the slit grating causes periodic variations in the light intensity distribution. Currently, the primary approaches for detecting the intensity signal are the four-field scanning method and the single-field scanning method. The four-field method uses a slit grating with the same period as the code disc grating. This slit grating comprises four sets of slit arrays, each spatially offset by one-quarter of the grating pitch [7,8,9]. In contrast, the single-field method employs a code disc grating and a slit grating with slightly different periods. Their superposition produces Vernier fringes with a spatial period much larger than that of the individual gratings, within which four detection regions are uniformly distributed [10,11].
As the code disc and slit gratings undergo relative displacement, the photoelectric signal produced by the sensor, after pre-amplification, can ideally be transformed into four quadrature sinusoidal signals with 90° phase differences. In practice, however, factors such as LED aging, assembly inaccuracies, and grating fabrication errors introduce signal imperfections, including amplitude imbalance error, direct current offset (DC offset) error, quadrature phase error, and higher-order harmonic distortions. These imperfections introduce deviations in angle estimation, thereby significantly limiting the high-precision measurement capability of optical encoders. Online compensation technique can effectively suppress amplitude imbalance error, DC offset error, and quadrature phase error [12,13]. The method operates by continuously monitoring the maximum, minimum, and average values of the signals to dynamically compute compensation values, driving the two channels toward an ideal state with equal amplitude, zero DC offset and quadrature phase. The treatment of harmonic errors depends on their order. Even-order harmonics (e.g., 2nd, 4th), owing to their half-wave symmetry, can be effectively suppressed through differential amplification. Odd-order harmonics (e.g., 3rd, 5th) are mitigated using either active or passive approaches. Active approaches suppress harmonic generation at its origin, for example, by optimizing the duty cycle of the slit grating or introducing specific etching offsets during fabrication [14,15,16,17]. Passive approaches, in contrast, focus on correcting the signal in subsequent circuitry or through algorithmic processing. For example, works in [18,19,20,21,22] exploit phase-locked loop (PLL) technology to automatically track and correct harmonic errors, whereas works in [23,24,25,26] focus on constructing a compensation model through precise parameter identification of the harmonic signals.
In current harmonic suppression schemes for optical encoders, active compensation methods typically require the combination of multiple-tracks slit grating with different widths and spatial offsets to suppress specific harmonics. This approach results in complex structural layouts and high fabrication difficulty. Passive compensation methods, in contrast, rely on backend circuitry or digital algorithms, leading to considerable implementation complexity. To overcome these shortcomings, this paper introduces an arrangement of the photoelectric sensor array that suppresses harmonics directly by optimizing the structure and spatial configuration of the photosensitive unit. Section 2.1 establishes a mathematical model for describing the intensity distribution of grating self-imaging. Section 2.2 analyzes the principles of the four-field scanning method and the single-field scanning method for photoelectric encoders, respectively. Section 2.3 evaluates the experimental results of replacing the slit grating with a grid photoelectric sensor array and discusses the impact of higher-order beams on output signal quality. Section 3.1 explores the effect of photosensitive unit width on output signal harmonic distortion. Section 3.2 discusses the role of photosensitive unit spatial offset in suppressing harmonic distortion. Based on the aforementioned theoretical analysis, Section 3.3 introduces a scanning structure design for the optical encoder, supported by simulation results. Finally, Chapter 4 summarizes the research content and conclusions of the paper.
2. Theoretical Analysis and Experimental Results
2.1. Theoretical Analysis of Grating Self-Imaging
When a grating is illuminated by a monochromatic plane wave at normal incidence, distinct self-imaging appears at specific periodic distances behind the grating, as shown in Figure 3. This phenomenon is known as the Talbot effect [27].
The transmission function of the grating can be represented by the following Fourier series:
where is the spatial position, is the grating period, is the order of the Fourier series, and is the -th order Fourier coefficient.
When a plane wave of unit amplitude is normally incident on the grating, the complex amplitude of the optical wave at the distance z = 0 is given by:
The spatial spectrum of the complex amplitude distribution can be obtained by performing a Fourier transform as follows:
where is the spatial frequency and is the Dirac function.
According to the angular spectrum diffraction theory, the spatial spectrum of the diffracted wave at a distance of z from the grating can be expressed as:
where is the wave number and is the wavelength of the light wave.
Under the Fresnel approximation, can be given by:
When the propagation distance satisfies for the complex amplitude distribution at the distance of z from the grating can be obtained as:
The result demonstrates that the complex amplitude of the light wave differs only by a constant phase factor between the initial position and a specific propagation distance, and therefore, their intensity distributions remain the same:
Clear grating self-imaging patterns can be observed. This phenomenon is called the Talbot effect.
2.2. Four- Field and Single-Field Scanning Methods for Gathering Grating Self-Imaging
The configuration of the four-field scanning method for the optical encoder is illustrated in Figure 4. This method employs a code disc grating and a slit grating with identical periods. The slit grating is divided into four regions, each spatially offset by one-quarter of a period relative to the next.
The combined light intensity at the observation point can be expressed as a superposition of various harmonic components. To preliminarily elucidate the fundamental principle of angular displacement measurement, the analysis focuses on the dominant fundamental frequency component. Accordingly, the self-imaging light field of the code disc is simulated using a sinusoidal function I (x):
where A is the signal amplitude, d is the period of grating self-imaging, I0 is the DC offset, and ϕ is the initial phase of the signal.
With the opening ratio of both the code disc grating and the slit grating set to 50%, the width of each scanning region is defined as W, which contains m complete periods of the self-imaging fringe. Four photoelectric signals are obtained by integrating the light intensity over the transmissive portions of the slit grating in each region, expressed as:
where i denotes the four scanning regions (i=1, 2, 3, 4), Si is the photoelectric signal obtained from the i-th scanning region, and n (n≥0) is an integer representing the fringe index within the scanning region.
When the code disc grating and the slit grating undergo relative displacement, the four photoelectric signals vary periodically, with their variations synchronized to the displacement. The amplitudes of the four signals can be expressed as:
where Δx represents the relative displacement between the code disc grating and the slit grating.
The single-field scanning method for photoelectric encoders employs a slight mismatch between the periods of the code disc grating and the slit grating. When overlaid, this period difference creates a Vernier structure with a period much larger than the original gratings. A schematic diagram of the configuration with a disc grating period of d and a slit grating period of 0.9d is shown in Figure 5, wherein both gratings have a 50% opening ratio. By uniformly arranging four groups of photodetectors within one period of the resulting Vernier structure to collect the light intensity distribution, four photoelectric signals with sequential 90° phase differences can be acquired.
Simulation experiments for both scanning methods were conducted using MATLAB based on Equation (8), with the parameters configured as A=1, B=1, φ=0, and d=20 μm. For the four-field scanning method, the region width was set to W=100 μm, while for the single-field method, the slit grating period was set to 19 μm. The relative displacement Δx was varied from 0 to 40 μm in steps of 0.005 μm. The resulting quadrature signals S1-S4 from the four-field and single-field methods are shown in Figures 6(a) and 6(b), respectively. The Lissajous figures for (S1, S2) and (S3, S4) are presented in Figures 6(c) and 6(d). The results demonstrate that both scanning methods generate sinusoidal signals with excellent orthogonality and amplitude consistency.
2.3. Results and Discussion
It has been demonstrated that replacing the mechanical slit grating with a photoelectric sensor array is a viable technical approach for the direct acquisition of grating self-imaging [28,29,30,31]. While these demonstrations have primarily utilized the four-field scanning method, this work further explores the feasibility of integrating the photoelectric sensor array with the single-field scanning method. The experimental system configuration and the corresponding Lissajous figures of the output signals are presented in Figure 7. The system employs a code disc grating with a period of 20 μm and an opening ratio of 50%, alongside a photoelectric sensor array with a period of 38 μm and a 1:1 width ratio between its photosensitive and non-photosensitive regions. The grating self-imaging signal was acquired under illumination by a collimated light source with a central wavelength of 650 nm. The experimental results indicate that the method successfully retrieves quadrature sinusoidal signals. However, the Lissajous figure exhibits a measurable deviation from a standard circle, suggesting the presence of harmonic distortion in the output signals.
Under ideal conditions, the light intensity at any point in the grating self-imaging varies periodically with displacement. When only the ±1st order diffracted beams are considered, this variation follows a standard sinusoidal curve. In practice, however, higher-order diffraction components such as ±2nd order and ±3rd order beams are also generated in addition to the ±1st-order beams used for imaging. The interference of these higher-order diffracted beams causes the intensity distribution on the imaging plane to deviate from the ideal sinusoidal waveform, resulting in distortion. This distortion can be regarded as the superposition of the ideal sinusoidal signal and a series of higher-order harmonics:
where A1 and ϕ1 respectively denote the amplitude and initial phase of the fundamental component, and An and ϕn (n≥2) respectively denote the amplitude and initial phase of the n-th harmonic.
Due to the effective suppression of even order harmonic components by differential amplification, this study focuses on analyzing the influence mechanism of higher-order odd harmonics on the signal quality of optical encoders. The third and fifth harmonics, which exert the most significant impact on signal distortion, are selected as the primary subjects of investigation. In the grating self-imaging simulations based on both the four-field scanning method and the single-field scanning method, the amplitude of the third harmonic is set to 0.04 with an initial phase of π/5, while the amplitude of the fifth harmonic is set to 0.015 with an initial phase of π/7, thereby emulating typical harmonic interference scenarios encountered in practical systems:
Using the parameters from Section 2.2, simulation experiments were conducted to capture the aforementioned light intensity distribution based on the four-field and single-field scanning methods. Their spectral analysis results are shown in Figure 8. A comparison reveals that the single-field method demonstrates superior harmonic suppression compared to the four-field method, although both still exhibit notable harmonic distortion. This difference fundamentally originates from their distinct scanning unit architectures. The four-field method employs a code disc and a sensor array with identical periods, thereby defining fixed values for the photosensitive unit width and offset. Conversely, the single-field method utilizes a slight period mismatch between the code disc and the sensor array, which is equivalent to altering the effective width and spatial offset of the sensing region, thereby imparting an inherent filtering capability for harmonics. Based on this mechanism, Chapter 3 will systematically investigate the impact of the photosensitive unit width and offset on harmonic components, aiming to achieve more effective harmonic suppression directly at the signal acquisition source.
3. Improved Method
3.1. Influence of the Width of the Photosensitive Unit
The proportion of each harmonic component in the output signals is influenced by the width of the photosensitive unit. The principle can be described as follows:
where w denotes the width of the photosensitive portion of the sensor array.
The n-th harmonic can be suppressed by designing the photosensitive unit width w to be an integer multiple of the corresponding harmonic period. For example, setting the width to an integer multiple of d/3 and d/5 can suppress the third and fifth harmonic components, respectively, as shown below:
The simulation results, based on the light intensity distribution in Equation (12), are presented in Figure 9, which shows the output Lissajous figures and harmonic ratios. Compared to the conventional four-field scanning method, the third harmonic component was reduced from 1.33% to 0.02%, and the fifth harmonic from 0.30% to 0.01%. These results confirm that optimizing the width of the photosensitive area in the sensor array effectively suppresses the corresponding higher-order harmonic components.
3.2. Influence of the Photosensitive Unit Offset
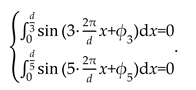
By exploiting the periodicity of higher-order harmonics, the combination of photosensitive units with specific offsets enables harmonic suppression by ensuring that these components cancel each other out due to phase symmetry over the integration domain. The principle of the method is expressed as a linear combination of integration intervals:
where Δt is the offset.
For the fundamental component, the integration results can be expressed as follows:
The sum of and remains a sinusoidal function with displacement Δx as the variable.
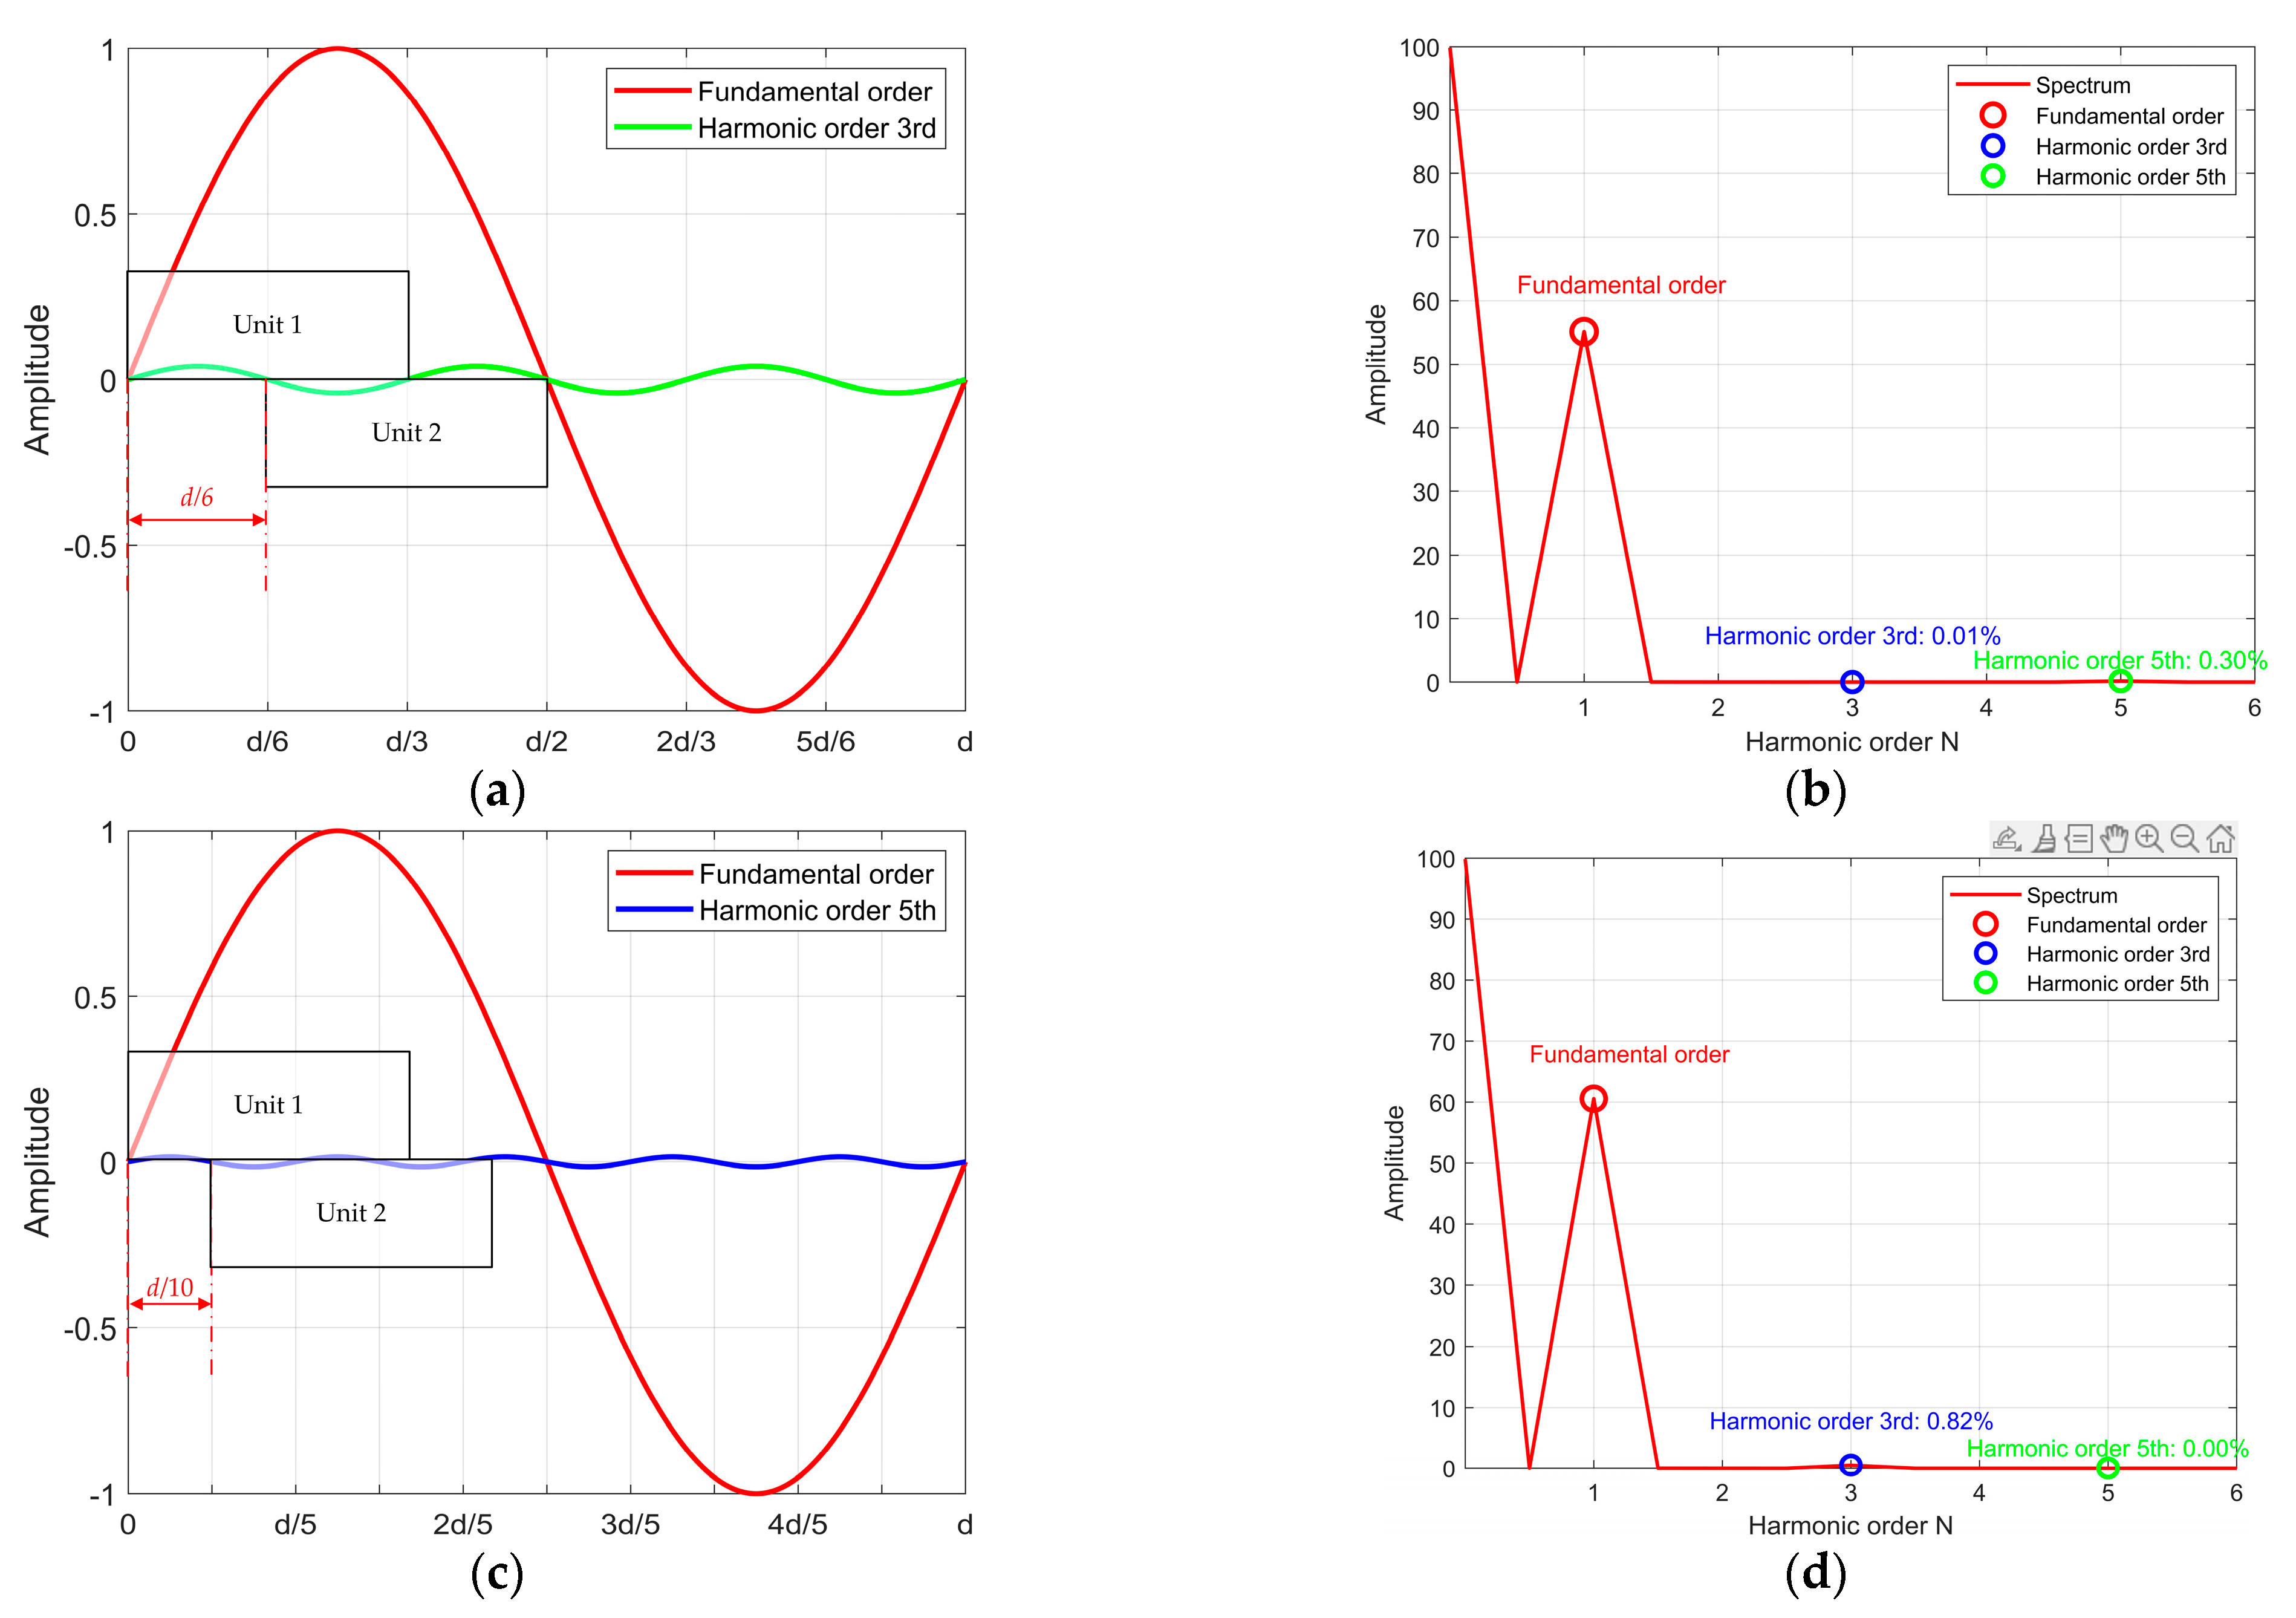
For the higher-order harmonic components, by setting the offsets to d/6 and d/10, respectively, the regions can exactly encompass integer multiples of the third and fifth harmonic periods. Under this condition, the harmonic components are coherently canceled due to phase symmetry, thereby achieving harmonic suppression. Simulation results in Figure 10 verify this approach: compared to the conventional four-field method, the 3rd harmonic is reduced from 1.33% to 0.01%, and the 5th harmonic is reduced from 0.06% to 0.00%. These results confirm that designing photosensitive unit with specific offset can effectively eliminate target harmonic components.
Figure 10.
Scanning unit offset and harmonic spectrum: (a) scanning unit offset with Δt=d/6; (b) output signal harmonic spectrum with Δt=d/6; (c) scanning unit offset with Δt=d/10; (d) output signal harmonic spectrum with Δt=d/10.
Figure 10.
Scanning unit offset and harmonic spectrum: (a) scanning unit offset with Δt=d/6; (b) output signal harmonic spectrum with Δt=d/6; (c) scanning unit offset with Δt=d/10; (d) output signal harmonic spectrum with Δt=d/10.
3.3. Optimization Design Based on Photosensitive Unit Width and Offset
This paper proposes a method for suppressing harmonics directly at the signal acquisition source. The core idea is to precisely design the effective width and spatial offset of the photosensitive unit in the scanning head, so that specific high-order harmonic components are directly canceled out during the physical integration process of photoelectric conversion, thereby achieving effective harmonic suppression.
For the four-field scanning method, the width of the photosensitive unit within each scanning region are set to one-third of the code disc grating period to eliminate the third harmonic. Additionally, each unit is divided into two sub-cells with a spatial offset of Δt = d/10 to cancel the fifth harmonic. Figure 11(a) shows the layout of the photoelectric sensor array, where the composite scanning regions replace the slit-grating configuration while implementing the above optimizations. Simulation results based on Equation (12), presented in Figure 11(b), indicate that the third and fifth harmonic components in the output signal are 0.01% and 0.00%, respectively. The content of the third and fifth harmonics in the output signal is significantly reduced. These results demonstrate that the proposed scanning unit design can be effectively integrated into the four-field scanning method to achieve efficient suppression of the target harmonic components.
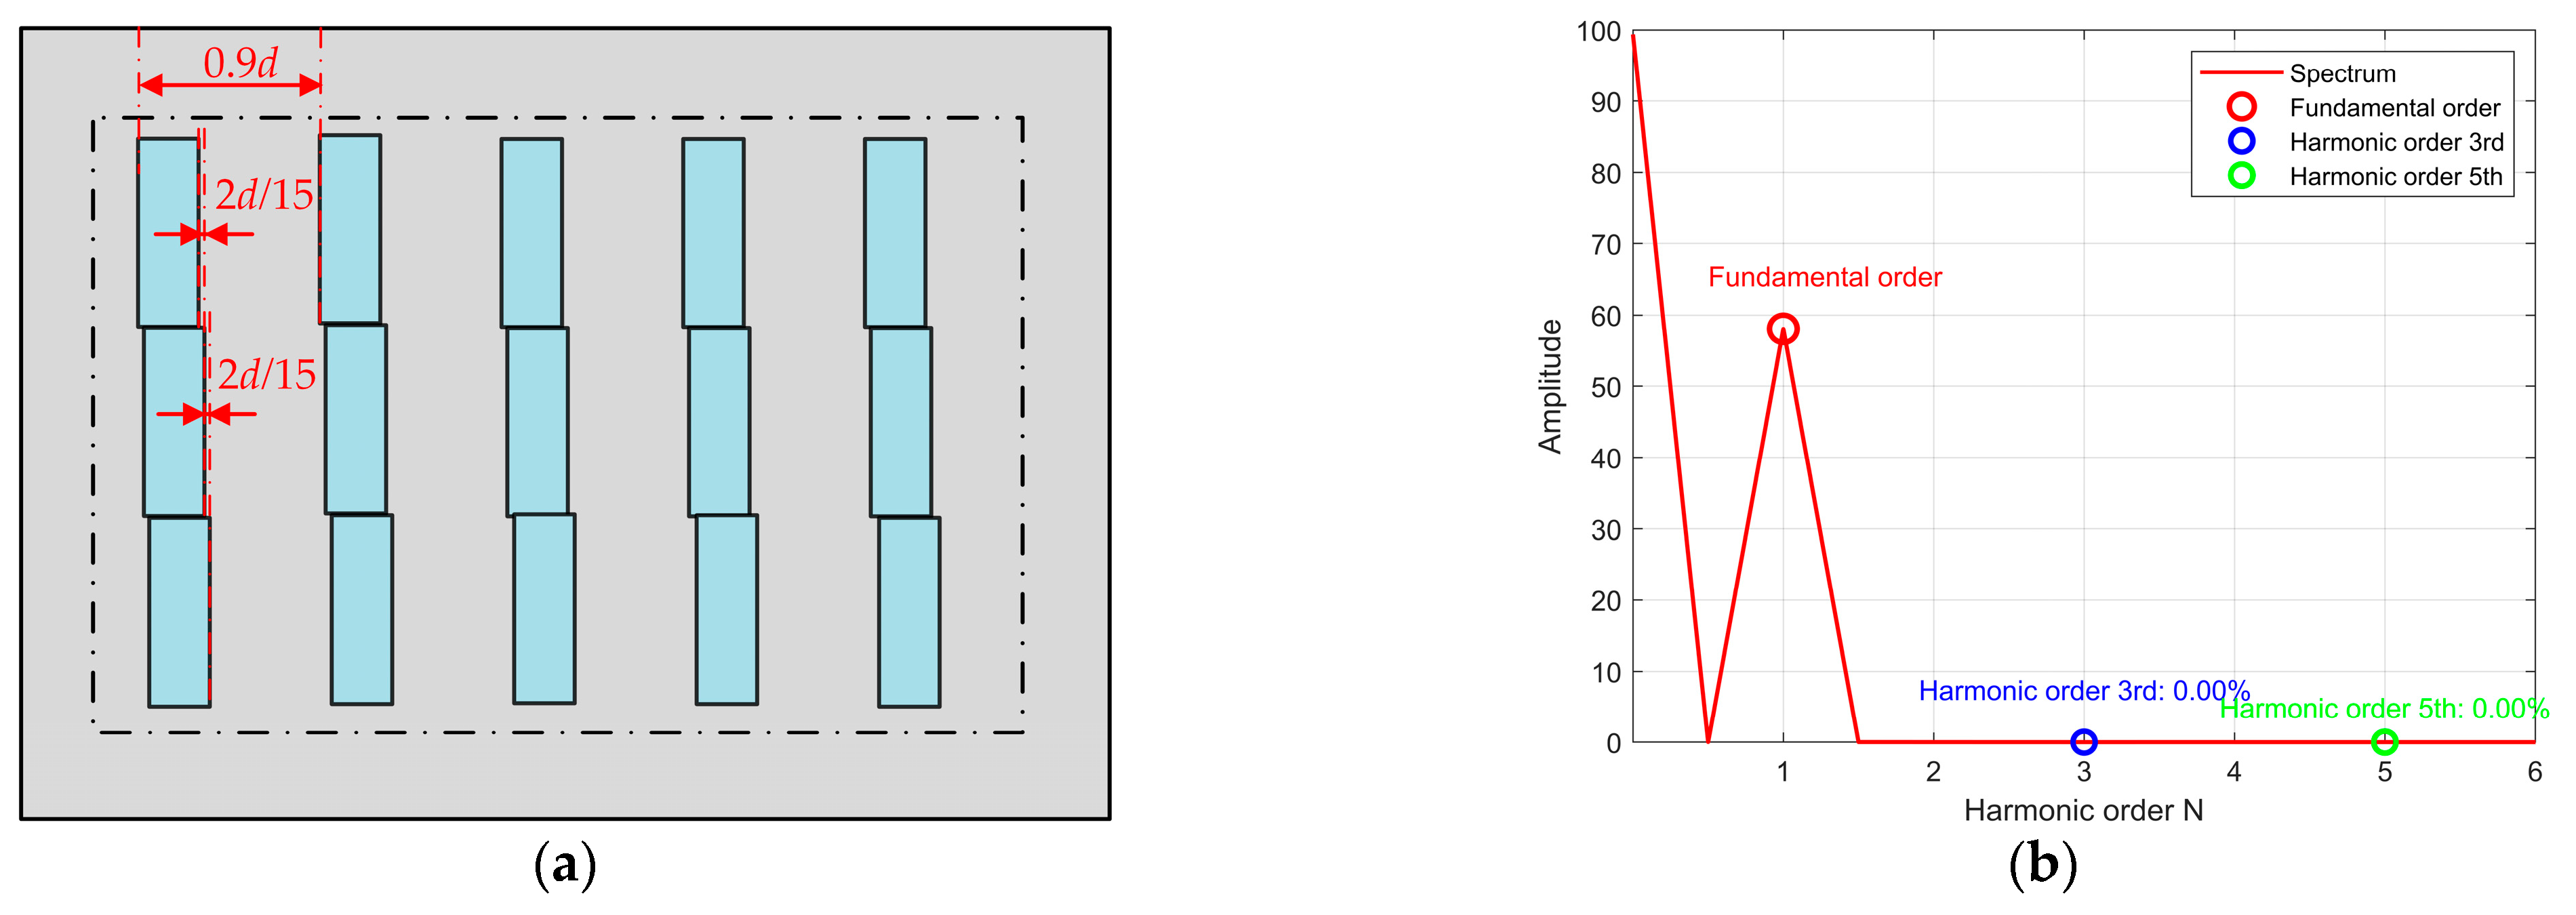
For the single-field scanning method, to eliminate the third harmonic component, the width of each photosensitive unit is also set to one-third of the code disc grating period. To suppress the fifth harmonic component, the photosensitive unit is divided into three sub-cells with a spatial offset of Δt =2d/15. The layout of these photosensitive unit is illustrated in Figure 12 (a). The resulting output photoelectric signals can be expressed as follows:
The initial phases of the fifth harmonic signals across the three integration intervals differ sequentially by 4π/3. For the fifth harmonic component, these three integration results can be considered as vectors of equal amplitude but with phases lagging by 4π/3 in sequence. Consequently, the sum of their integral outputs over the three subintervals is zero. Simulation results based on Equation (12) are presented in Figure 12 (b). The output signal shows both the third and fifth harmonic components in the output signal are effectively eliminated from the output signal. This validates that the scanning unit design proposed in this work, when applied to the single-field scanning method, also effectively suppresses the target harmonic components.
This section presents a design methodology for the scanning unit in optical encoders. The method replaces the conventional slit grating with a photoelectric sensor array. By leveraging the periodic characteristics of higher-order harmonics, it enables simultaneous suppression of the third and fifth harmonic components, thereby improving the output signal quality. Furthermore, the method of co-optimizing the width and spatial offset of the photosensitive area is suitable for application in both four-field and single-field scanning techniques.
4. Conclusions
This study aims to enhance the measurement accuracy of optical encoders. To address the limitation imposed by the third and fifth harmonics in the output signals, a method is proposed based on the periodic nature of these higher-order harmonics. By selecting appropriate photosensitive unit width and offset, the contributions of the targeted harmonics cancel each other out during the photoelectric integration process, thereby effectively filtering them out.
This study bridges the gap between theoretical framework and physical implementation. The proposed method aims to eliminate harmonic components in both four-field and single-field scanning configurations. This is achieved by co-optimizing the photosensitive unit width and the spatial offset between regions. The results show that the proposed method effectively preserves the fundamental wave component while achieving deep suppression of higher-order harmonics. Moreover, by flexibly selecting different unit width and offset, the scheme can be readily extended to suppress other specific harmonics, demonstrating strong adaptability and significant potential for engineering applications.
Author Contributions
Conceptualization, J.L., B.L.; S.L.; methodology, B.L.; S.L.; validation J.L., B.L.; investigation, J.L., B.L.; S.L.; resources, S.L., J.L. data curation, B.L.; setup arrangement, experiment, data processing, and coding, B.L.; writing—original draft preparation, B.L.; writing—review and editing J.L., B.L.; S.L.; visualization, B.L. All authors have read and agreed to the published version of the manuscript.
Funding
This research received no external funding.
Data Availability Statement
The original contributions presented in the study are included in the article. The code and processed data generated during this study are publicly available in the GitHub repository at: https://github.com/JLUlvbw/optical-encoder. Further inquiries can be directed to the corresponding author.
Conflicts of Interest
The authors declare no conflicts of interest.
References
- S. Anil Kumar, Boby George, Subhas Chandra Mukhopadhyay. Technologies and Applications of Angle Sensors: A Review[J]. IEEE Sensors Journal, 2021, Vol.21(6): 7195-7206. https://ieeexplore.ieee.org/abstract/document/9296794.
- Gurauskis, Donatas, Przystupa, et al. Development and Experimental Research of Different Mechanical Designs of an Optical Linear Encoder’s Reading Head[J]. Sensors, 2022, Vol.22(8): 2977. https://www.mdpi.com/1424-8220/22/8/2977.
- Ching-Fen Kao, Hung-Lin Huang, Sheng-Hua Lu. Optical encoder based on Fractional-Talbot effect using two-dimensional phase grating[J]. Optics Communications, 2010, Vol.283(9): 1950-1955. https://www.sciencedirect.com/science/article/pii/S003040180901342X.
- Crespo, D.*, Alonso, et al. Generalized grating imaging using an extended monochromatic light source[J]. Journal of the Optical Society of America A (Optics, Image Science and Vision), 2000, Vol.17(7): 1231-1240. https://opg.optica.org/josaa/abstract.cfm?uri=JOSAA-17-7-1231.
- Koichi Iwata. Interpretation of generalized grating imaging[J]. Journal of the Optical Society of America. A, Optics, image science, and vision, 2008, Vol.25(9): 2244-2250. https://opg.optica.org/josaa/abstract.cfm?uri=josaa-25-9-2244.
- Yu, Haoyu, Chen, et al. A survey on the grating based optical position encoder[J]. Optics & Laser Technology, 2021, Vol.143: 107352. https://www.sciencedirect.com/science/article/pii/S0030399221004400.
- Luis Miguel Sanchez-Brea, Tomas Morlanes. Metrological errors in optical encoders[J]. Measurement Science and Technology, 2009, Vol.19(11): 115104(1-8). https://iopscience.iop.org/article/10.1088/0957-0233/19/11/115104/meta.
- Kao, Ching-Fen, Lu, et al. Optical encoder based on the fractional Talbot effect[J]. Optics Communications, 2005, Vol.250: 16-23. https://www.sciencedirect.com/science/article/pii/S0030401805001069.
- Yuji Matsuzoe, Nobuhiko Tsuji, Toru Yoshizawa. Error dispersion algorithms to improve angle precision for an encoder[J]. Opt. Eng, 2002, Vol.41(9): 2282-2289. https://www.spiedigitallibrary.org/journals/optical-engineering/volume-41/issue-9/0000/Error-dispersion-algorithms-to-improve-angle-precision-for-and-encoder/10.1117/1.1496788.short.
- Rozman, J., Pletersek, et al. Linear Optical Encoder System with Sinusoidal Signal Distortion Below 60 dB[J]. IEEE Transactions on Instrumentation and Measurement, 2010, Vol.59(6): 1544-1549. https://ieeexplore.ieee.org/abstract/document/5280221.
- Ye, GY (Ye, Guoyong), et al. Design and development of an optical encoder with sub-micron accuracy using a multiple-tracks analyser grating[J]. Review of Scientific Instruments, 2017, Vol.88(1): 015003. https://pubs.aip.org/aip/rsi/article-abstract/88/1/015003/367426/Design-and-development-of-an-optical-encoder-with?redirectedFrom=fulltext].
- Hung Van Hoang, Hieu Tue Le, Jae Wook Jeon. A new approach based-on advanced adaptive digital PLL for improving the resolution and accuracy of magnetic encoders[C]//2008 IEEE/RSJ International Conference on Intelligent Robots and Systems, Pages 3133-3660. 2008. https://ieeexplore.ieee.org/abstract/document/4651111.
- Ye, Guoyong, Xing, et al. Total error compensation of non-ideal signal parameters for Moiré encoders[J]. Sensors and Actuators, A: Physical, 2019, Vol.298: 111539. https://www.sciencedirect.com/science/article/pii/S0924424719309306.
- Ieki, A., Hane, et al. Optical encoder using a slit-width-modulated grating[J]. Journal of Modern Optics, 1999, Vol.46(1): 1-14. https://www.tandfonline.com/doi/abs/10.1080/09500349908231251.
- Ieki, Atsushi, Matsui, et al. Pitch-modulated phase grating and its application to displacement encoder[J]. Journal of Modern Optics, 2000, Vol.47(7): 1213-1225. https://www.tandfonline.com/doi/abs/10.1080/09500340008232168.
- Ye, GY (Ye, Guoyong), et al. A theoretical investigation of generalized grating imaging and its application to optical encoders (Article)[J]. Optics Communications, 2015, Vol.354: 21-27. https://www.sciencedirect.com/science/article/pii/S0030401815003983.
- Ye, GY (Ye, Guoyong), et al. Development of a reflective optical encoder with submicron accuracy (Article)[J]. Optics Communications, 2018, Vol.411: 126-132. https://www.sciencedirect.com/science/article/pii/S0030401817309392.
- Hung Van Hoang, Jae Wook Jeon. An efficient approach to correct the signals and generate high-resolution quadrature pulses for magnetic encoders (Article)[J]. IEEE Transactions on Industrial Electronics, 2011, Vol.58(8): 3634-3646. https://ieeexplore.ieee.org/abstract/document/5639048.
- Jung, S.-Y., Nam, et al. PMSM control based on edge-field hall sensor signals through ANF-PLL processing (Article)[J]. IEEE Transactions on Industrial Electronics, 2011, Vol.58(11): 5121-5129. https://ieeexplore.ieee.org/abstract/document/5715872.
- Zhang, GQ (Zhang, Guoqiang), et al. ADALINE-Network-Based PLL for Position Sensorless Interior Permanent Magnet Synchronous Motor Drives[J]. IEEE Transactions on Power Electronics, 2016, Vol.31(2): 1450-1460. https://ieeexplore.ieee.org/abstract/document/7088658.
- Nguyen, Ton Hoang, Nguyen, et al. An Effective Method to Improve the Accuracy of a Vernier-Type Absolute Magnetic Encoder[J]. IEEE Transactions on Industrial Electronics, 2021, Vol.68(8): 7330-7340. https://ieeexplore.ieee.org/abstract/document/9115877.
- Jae Wan Park, Ha Xuan Nguyen, Thuong Ngoc-Cong Tran, et al. A Linear Compensation Method for Improving the Accuracy of an Absolute Multipolar Magnetic Encoder[J]. IEEE Access, 2021, Vol.9: 19127-19138. https://ieeexplore.ieee.org/abstract/document/9335571.
- P.L.M. Heydemann, Determination and correction of quadrature fringe measurement errors in interferometers, Appl. Opt. 20 (1981) 3382–3384. https://opg.optica.org/ao/abstract.cfm?uri=ao-20-19-3382.
- WEIBIN ZHU, YU LIN, YAO HUANG. Research on Sinusoidal Error Compensation of Moire Signal Using Particle Swarm Optimization[J]. IEEE Access, 2020, Vol.8. https://ieeexplore.ieee.org/abstract/document/8957141.
- Jiang, Jiaqi, Dai, et al. Improving the subdivision accuracy of photoelectric encoder using particle swarm optimization algorithm[J]. Optical and Quantum Electronics, 2022, Vol.54(2): 1-21. https://link.springer.com/article/10.1007/s11082-022-03512-2.
- Hou, Han, Cao, et al. Research on Particle Swarm Compensation Method for Subdivision Error Optimization of Photoelectric Encoder Based on Parallel Iteration [J]. Sensors, 2022, Vol.22(12): 4456. https://www.mdpi.com/1424-8220/22/12/4456.
- A.W. Lohmann, D.E. Silva. An interferometer based on the Talbot effect[J]. Optics Communications, 1971, Vol.2(9): 413-415. https://www.sciencedirect.com/science/article/pii/0030401871900551.
- Jun Hane, Iwao Komazaki, Takeshi Ito, et al. Ultra-compact encoder using Talbot interference[C]//Technical Digest. MEMS 2001. 14th IEEE International Conference on Micro Electro Mechanical Systems (Cat. No.01CH37090). 2001. https://ieeexplore.ieee.org/abstract/document/906546.
- Hane, K., Endo, et al. Integration of grating-image-type encoder using Si micromachining[J]. Sensors and Actuators. A, 2002, Vol.97-98: 139-146. https://www.sciencedirect.com/science/article/pii/S0924424701008007.
- Mitchell, DK. A radiation-hardened, high-resolution optical encoder for use in aerospace applications—art. no. 69580O[C]//Conference on Sensors and Systems for Space Applications II. 2008. https://ieeexplore.ieee.org/abstract/document/4526343.
- Wu, Jian; Yuan, Bo; Wang, Liqiang. New displacement measurement method based on digital Moiré fringes formed by a single grating[J]. Hongwai yu Jiguang Gongcheng/Infrared and Laser Engineering, 2014, Vol.43(10): 3404-3409. https://en.cnki.com.cn/Article_en/CJFDTOTAL-HWYJ201410042.htm.
Figure 1.
Two-grating configuration scheme of transmission optical encoder.
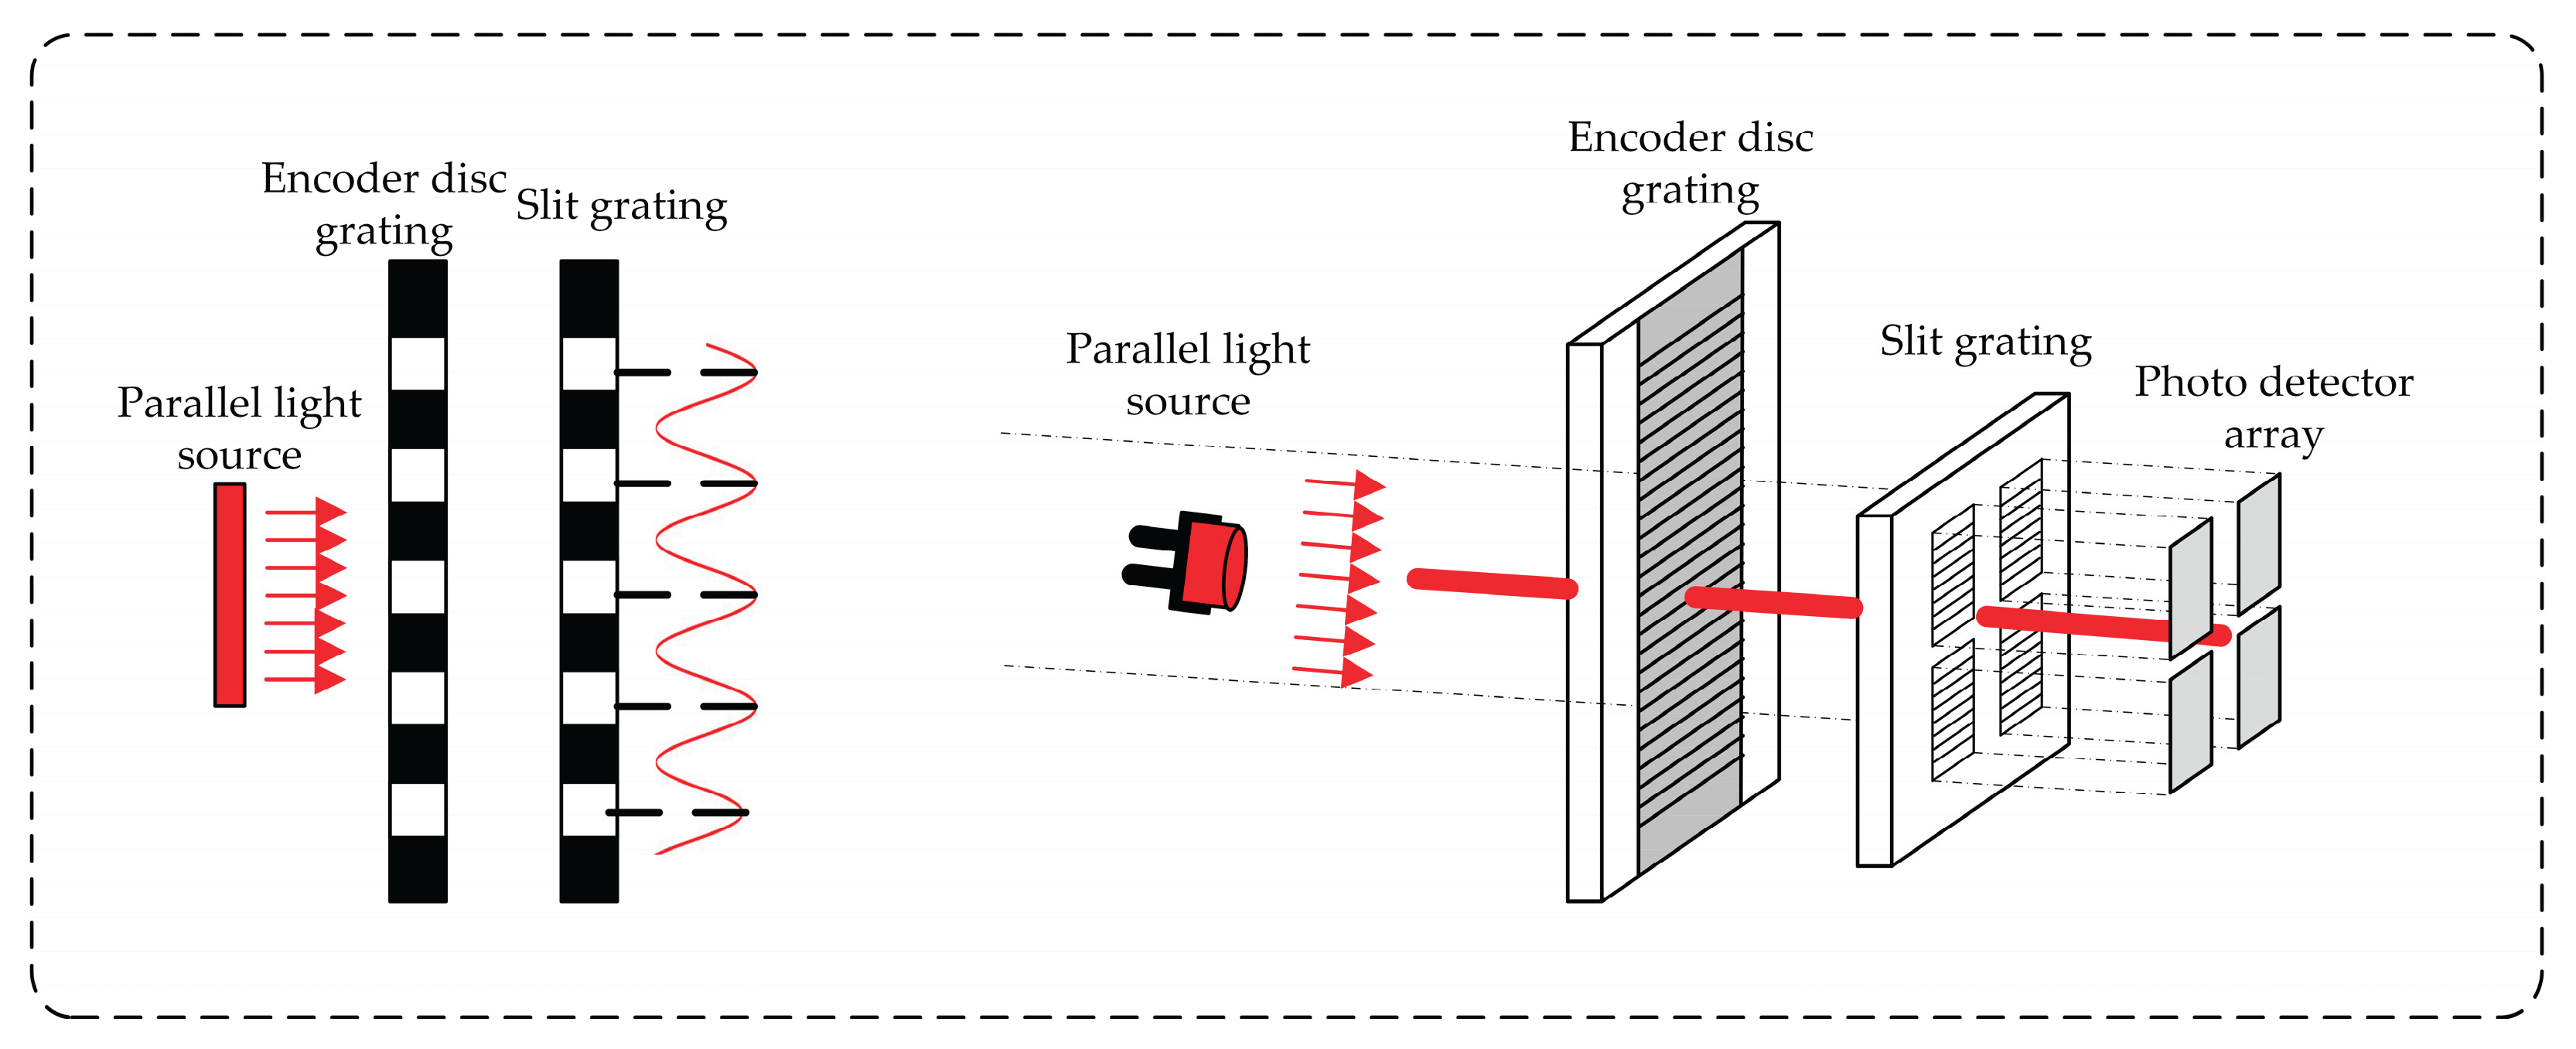
Figure 2.
Three-grating configuration scheme of reflective optical encoder.
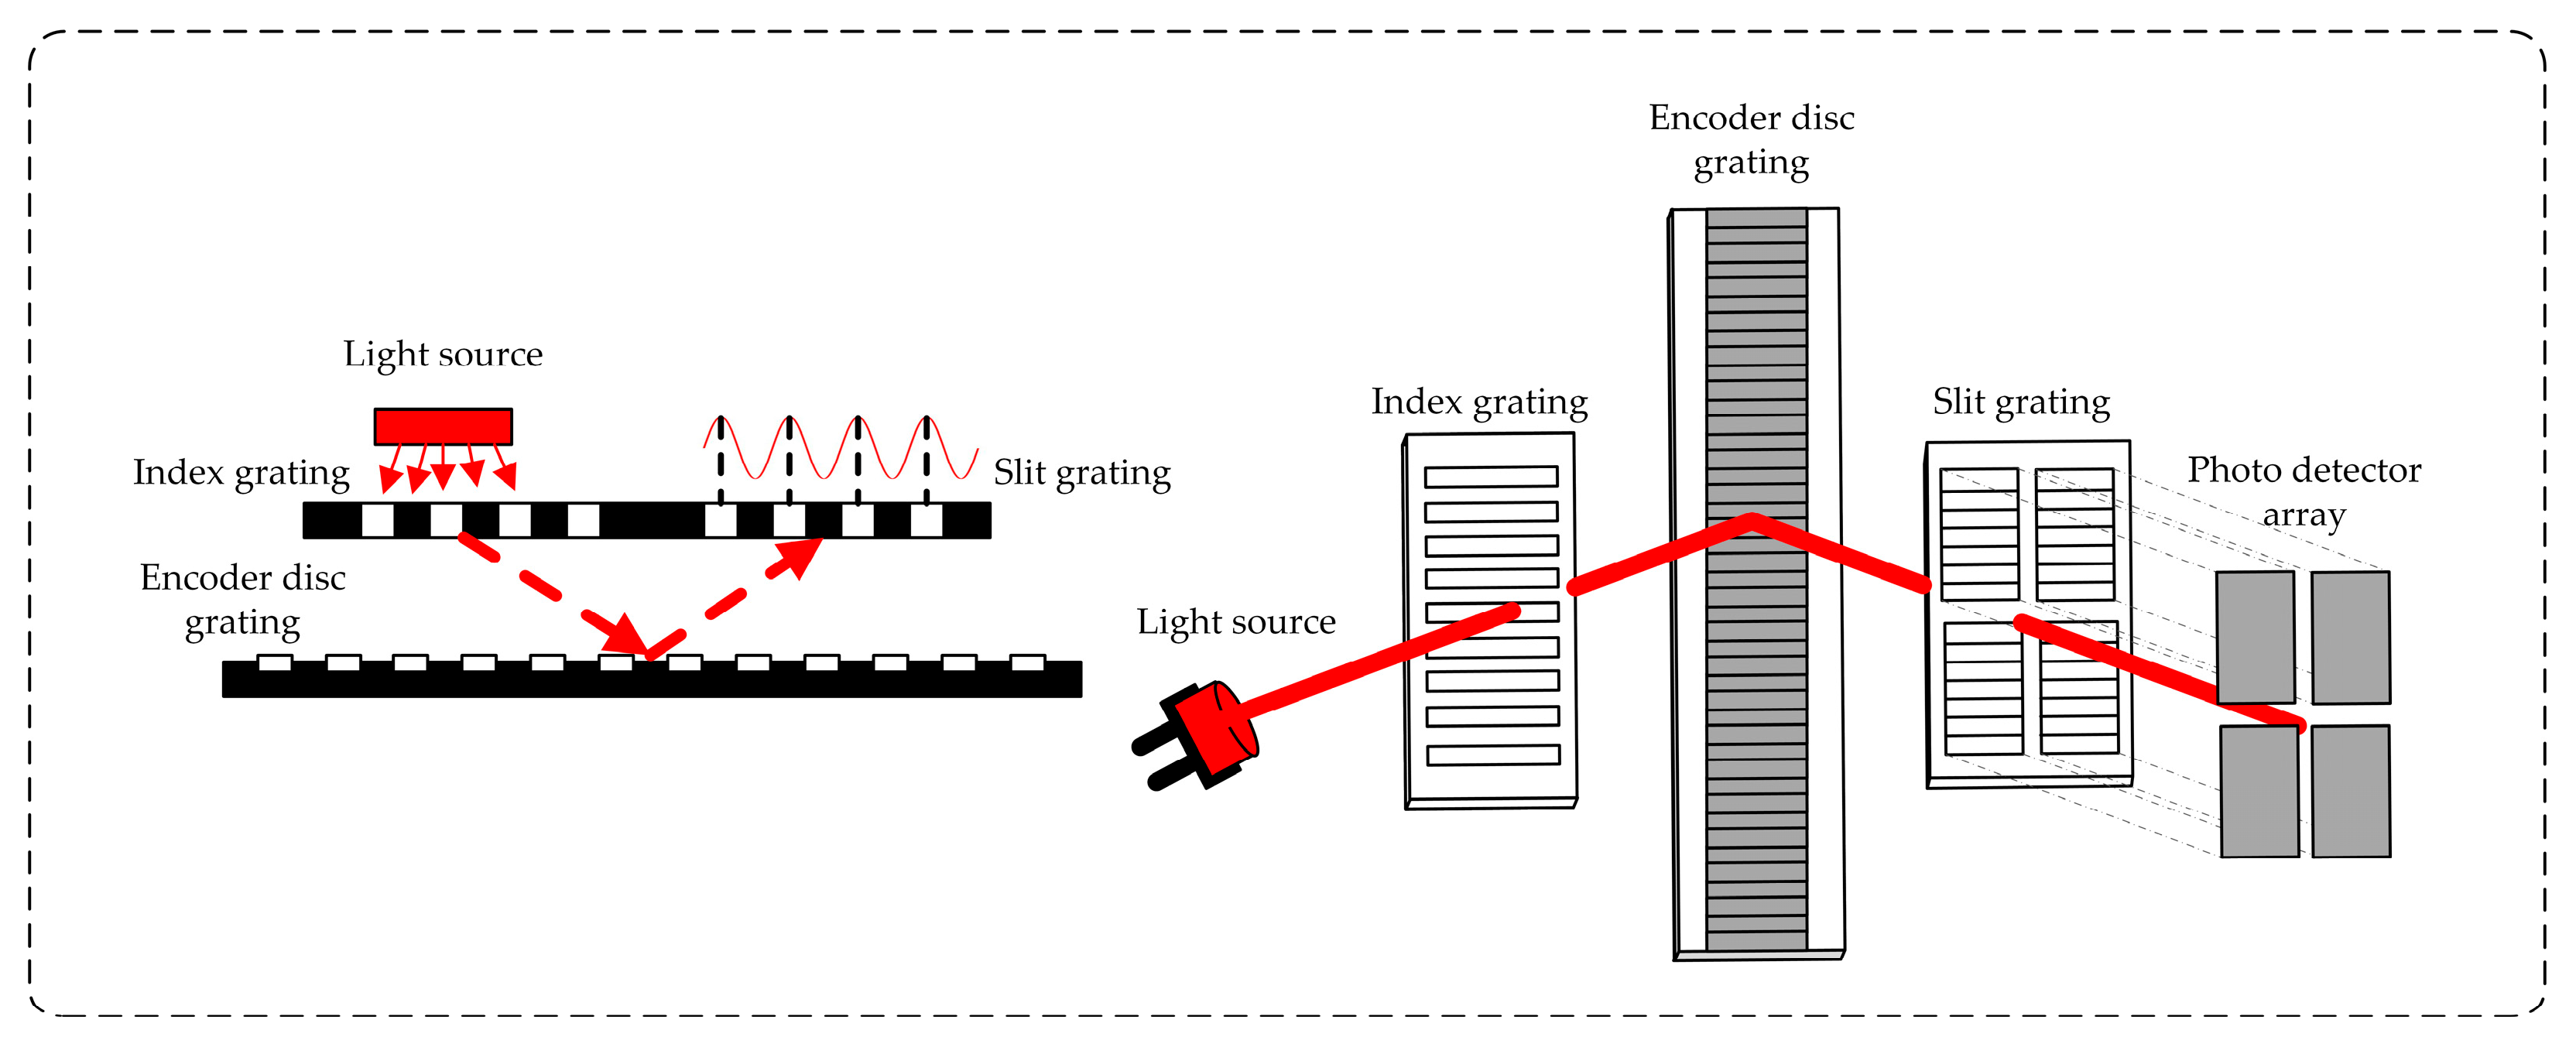
Figure 3.
Grating self-imaging effect.
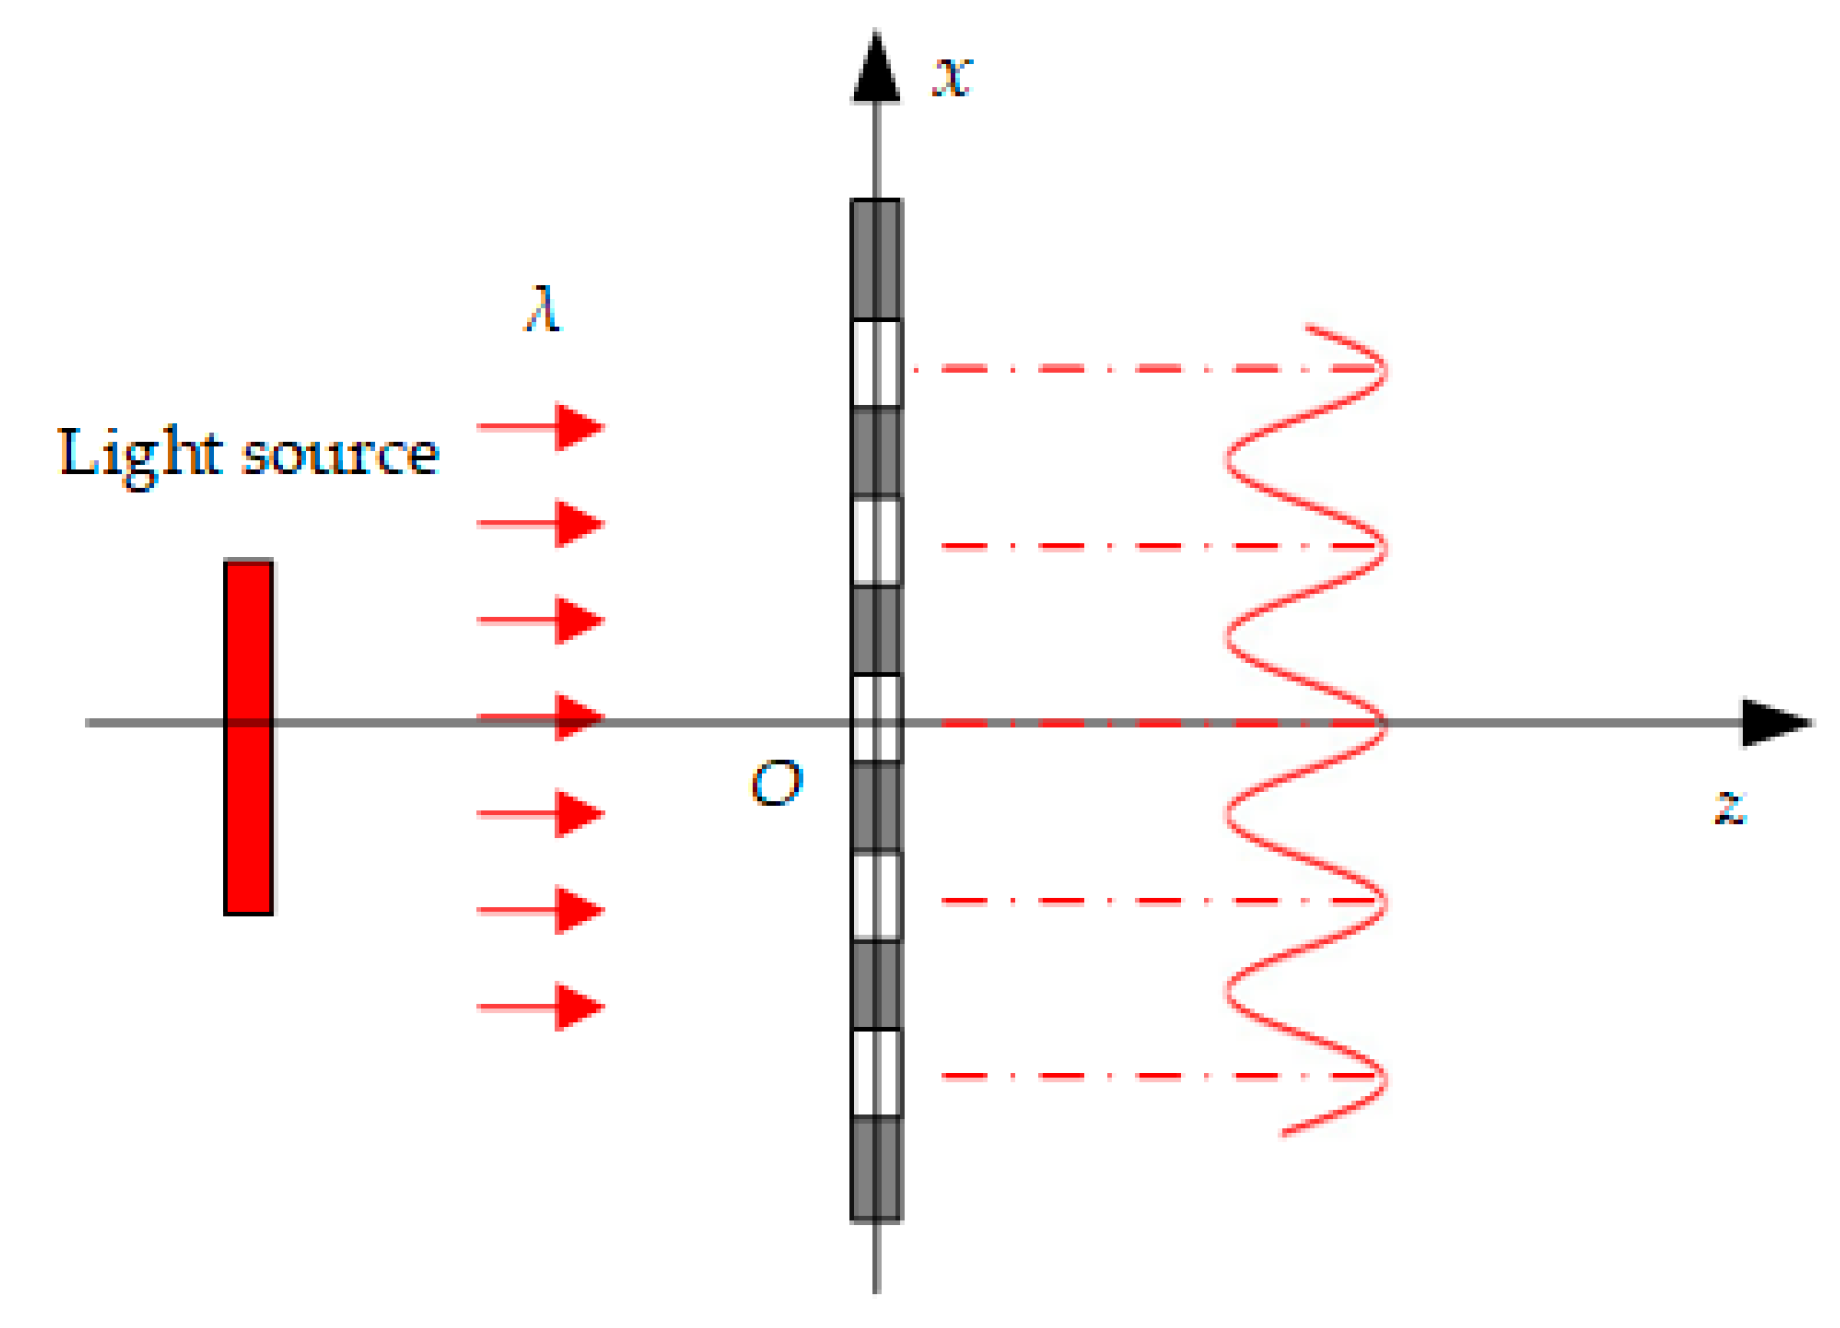
Figure 4.
Four-field scanning scheme.
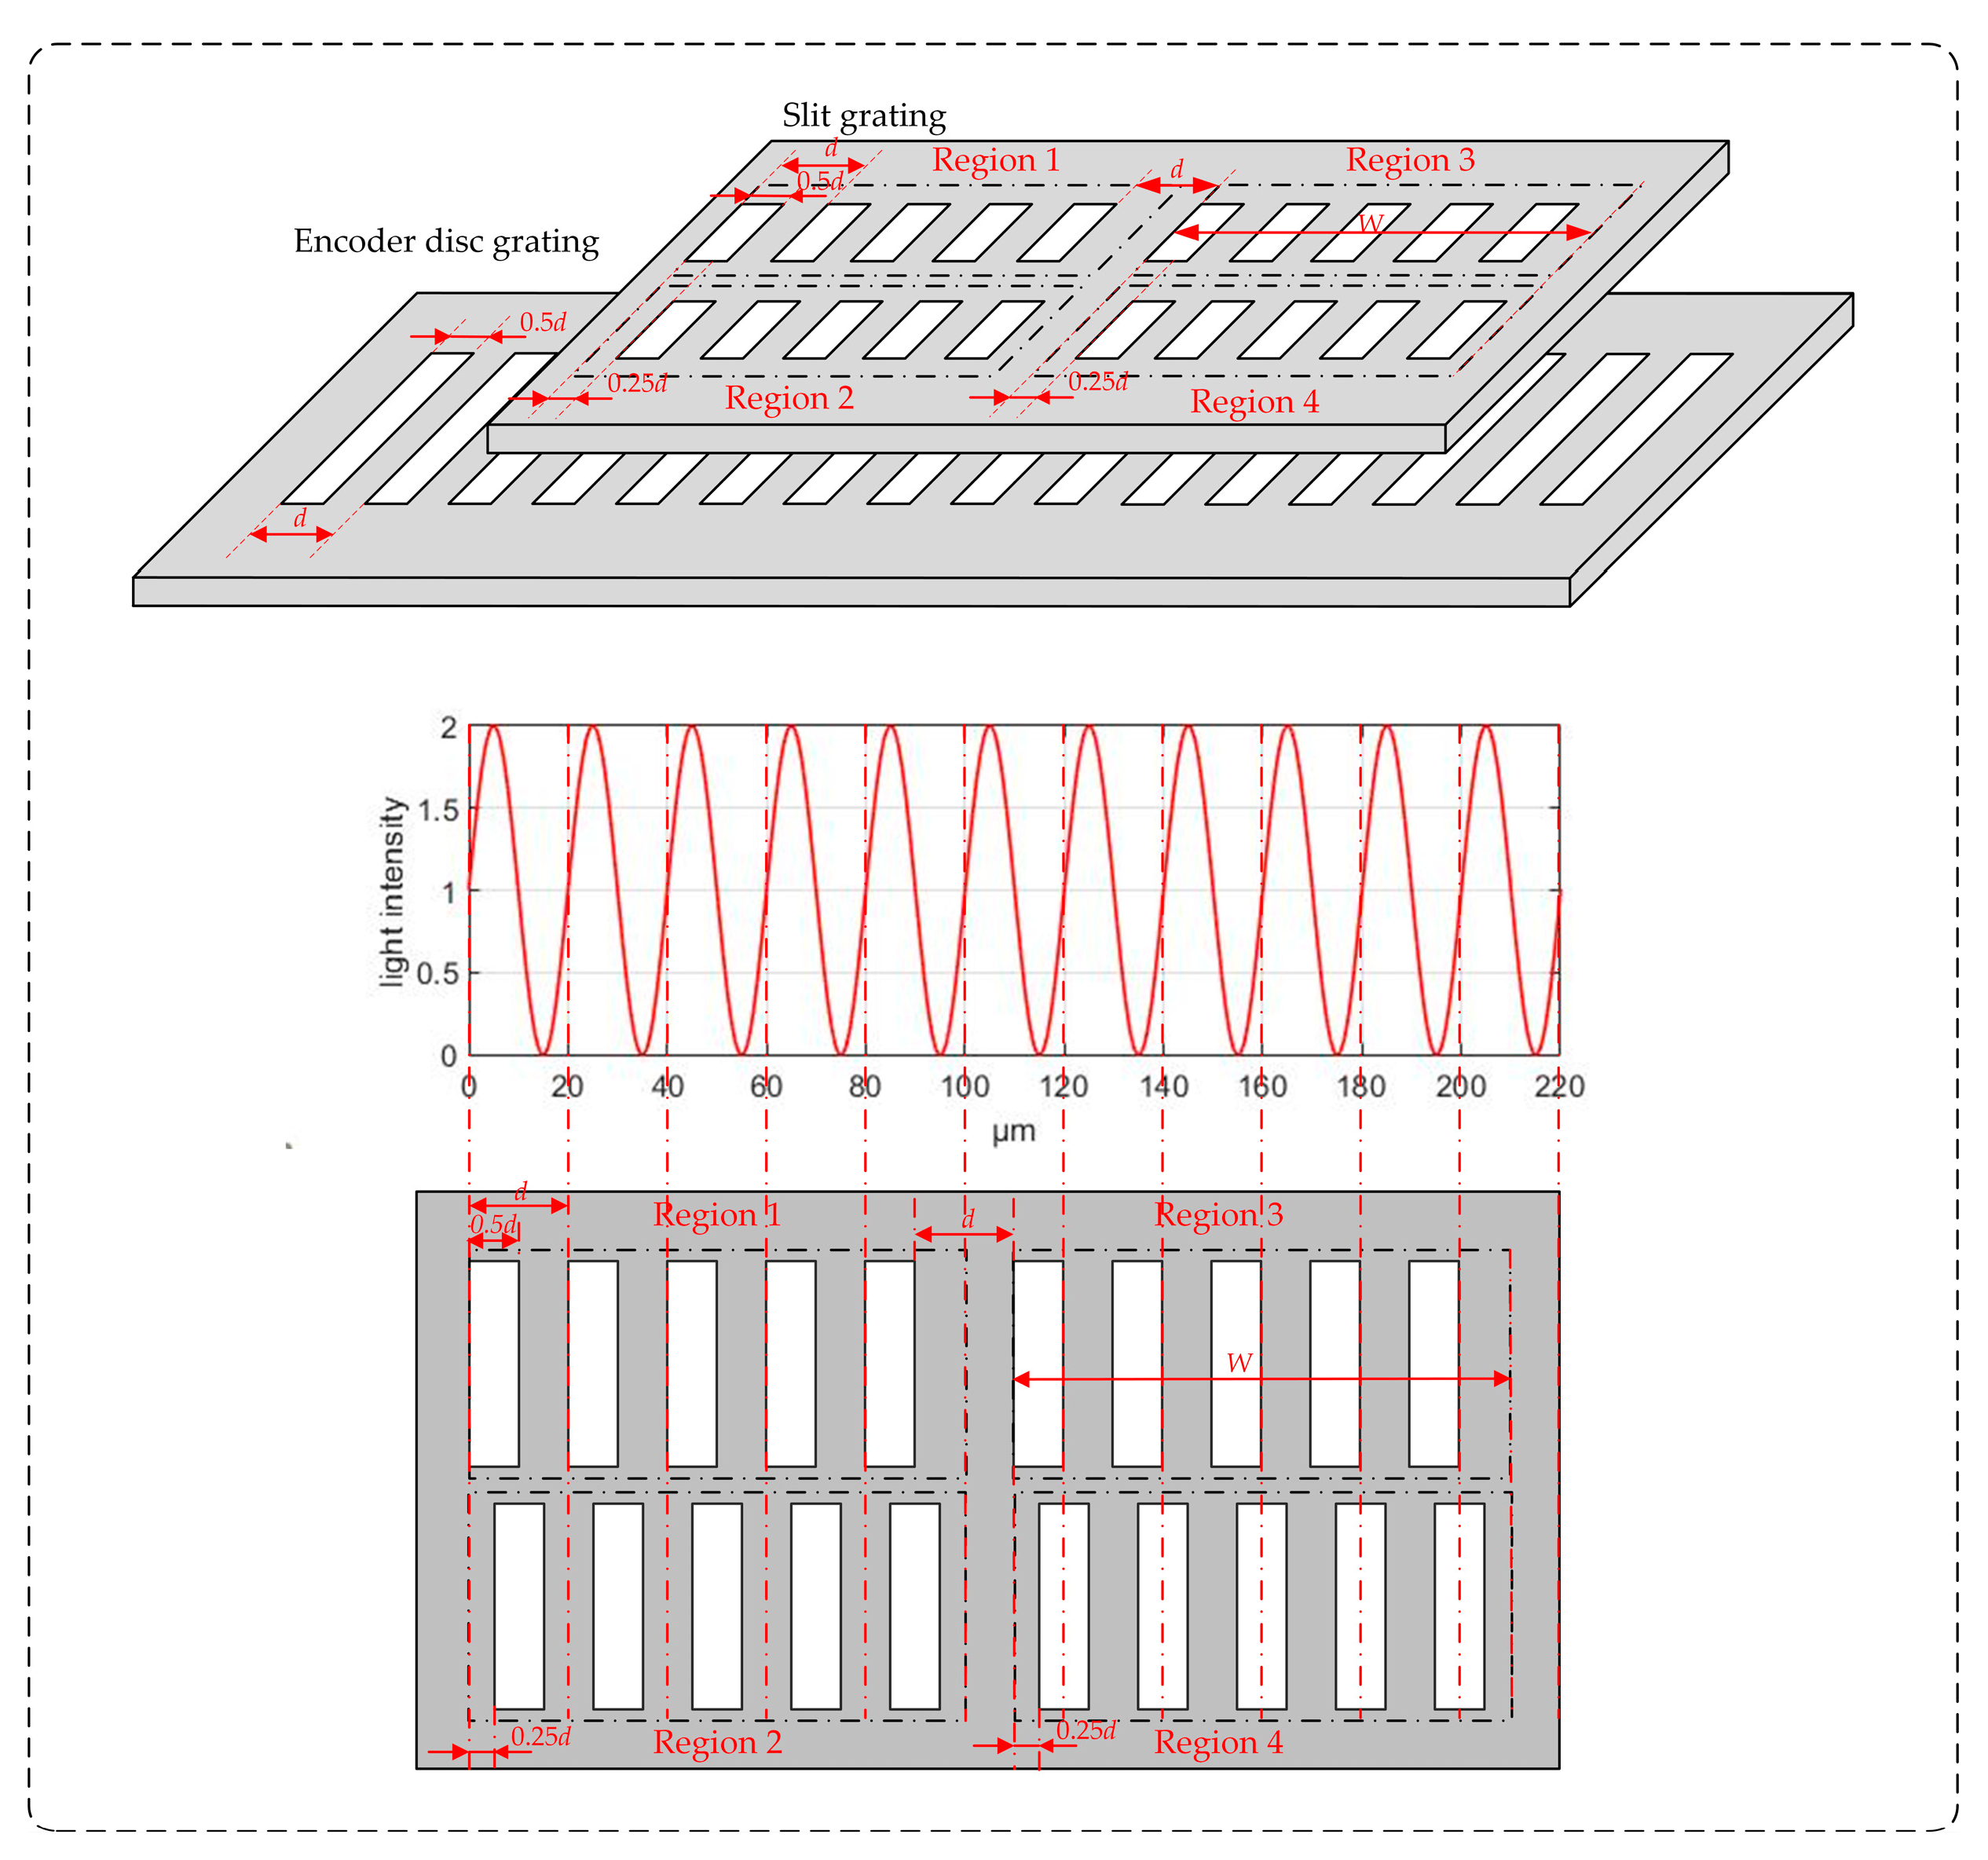
Figure 5.
Single-field scanning scheme.
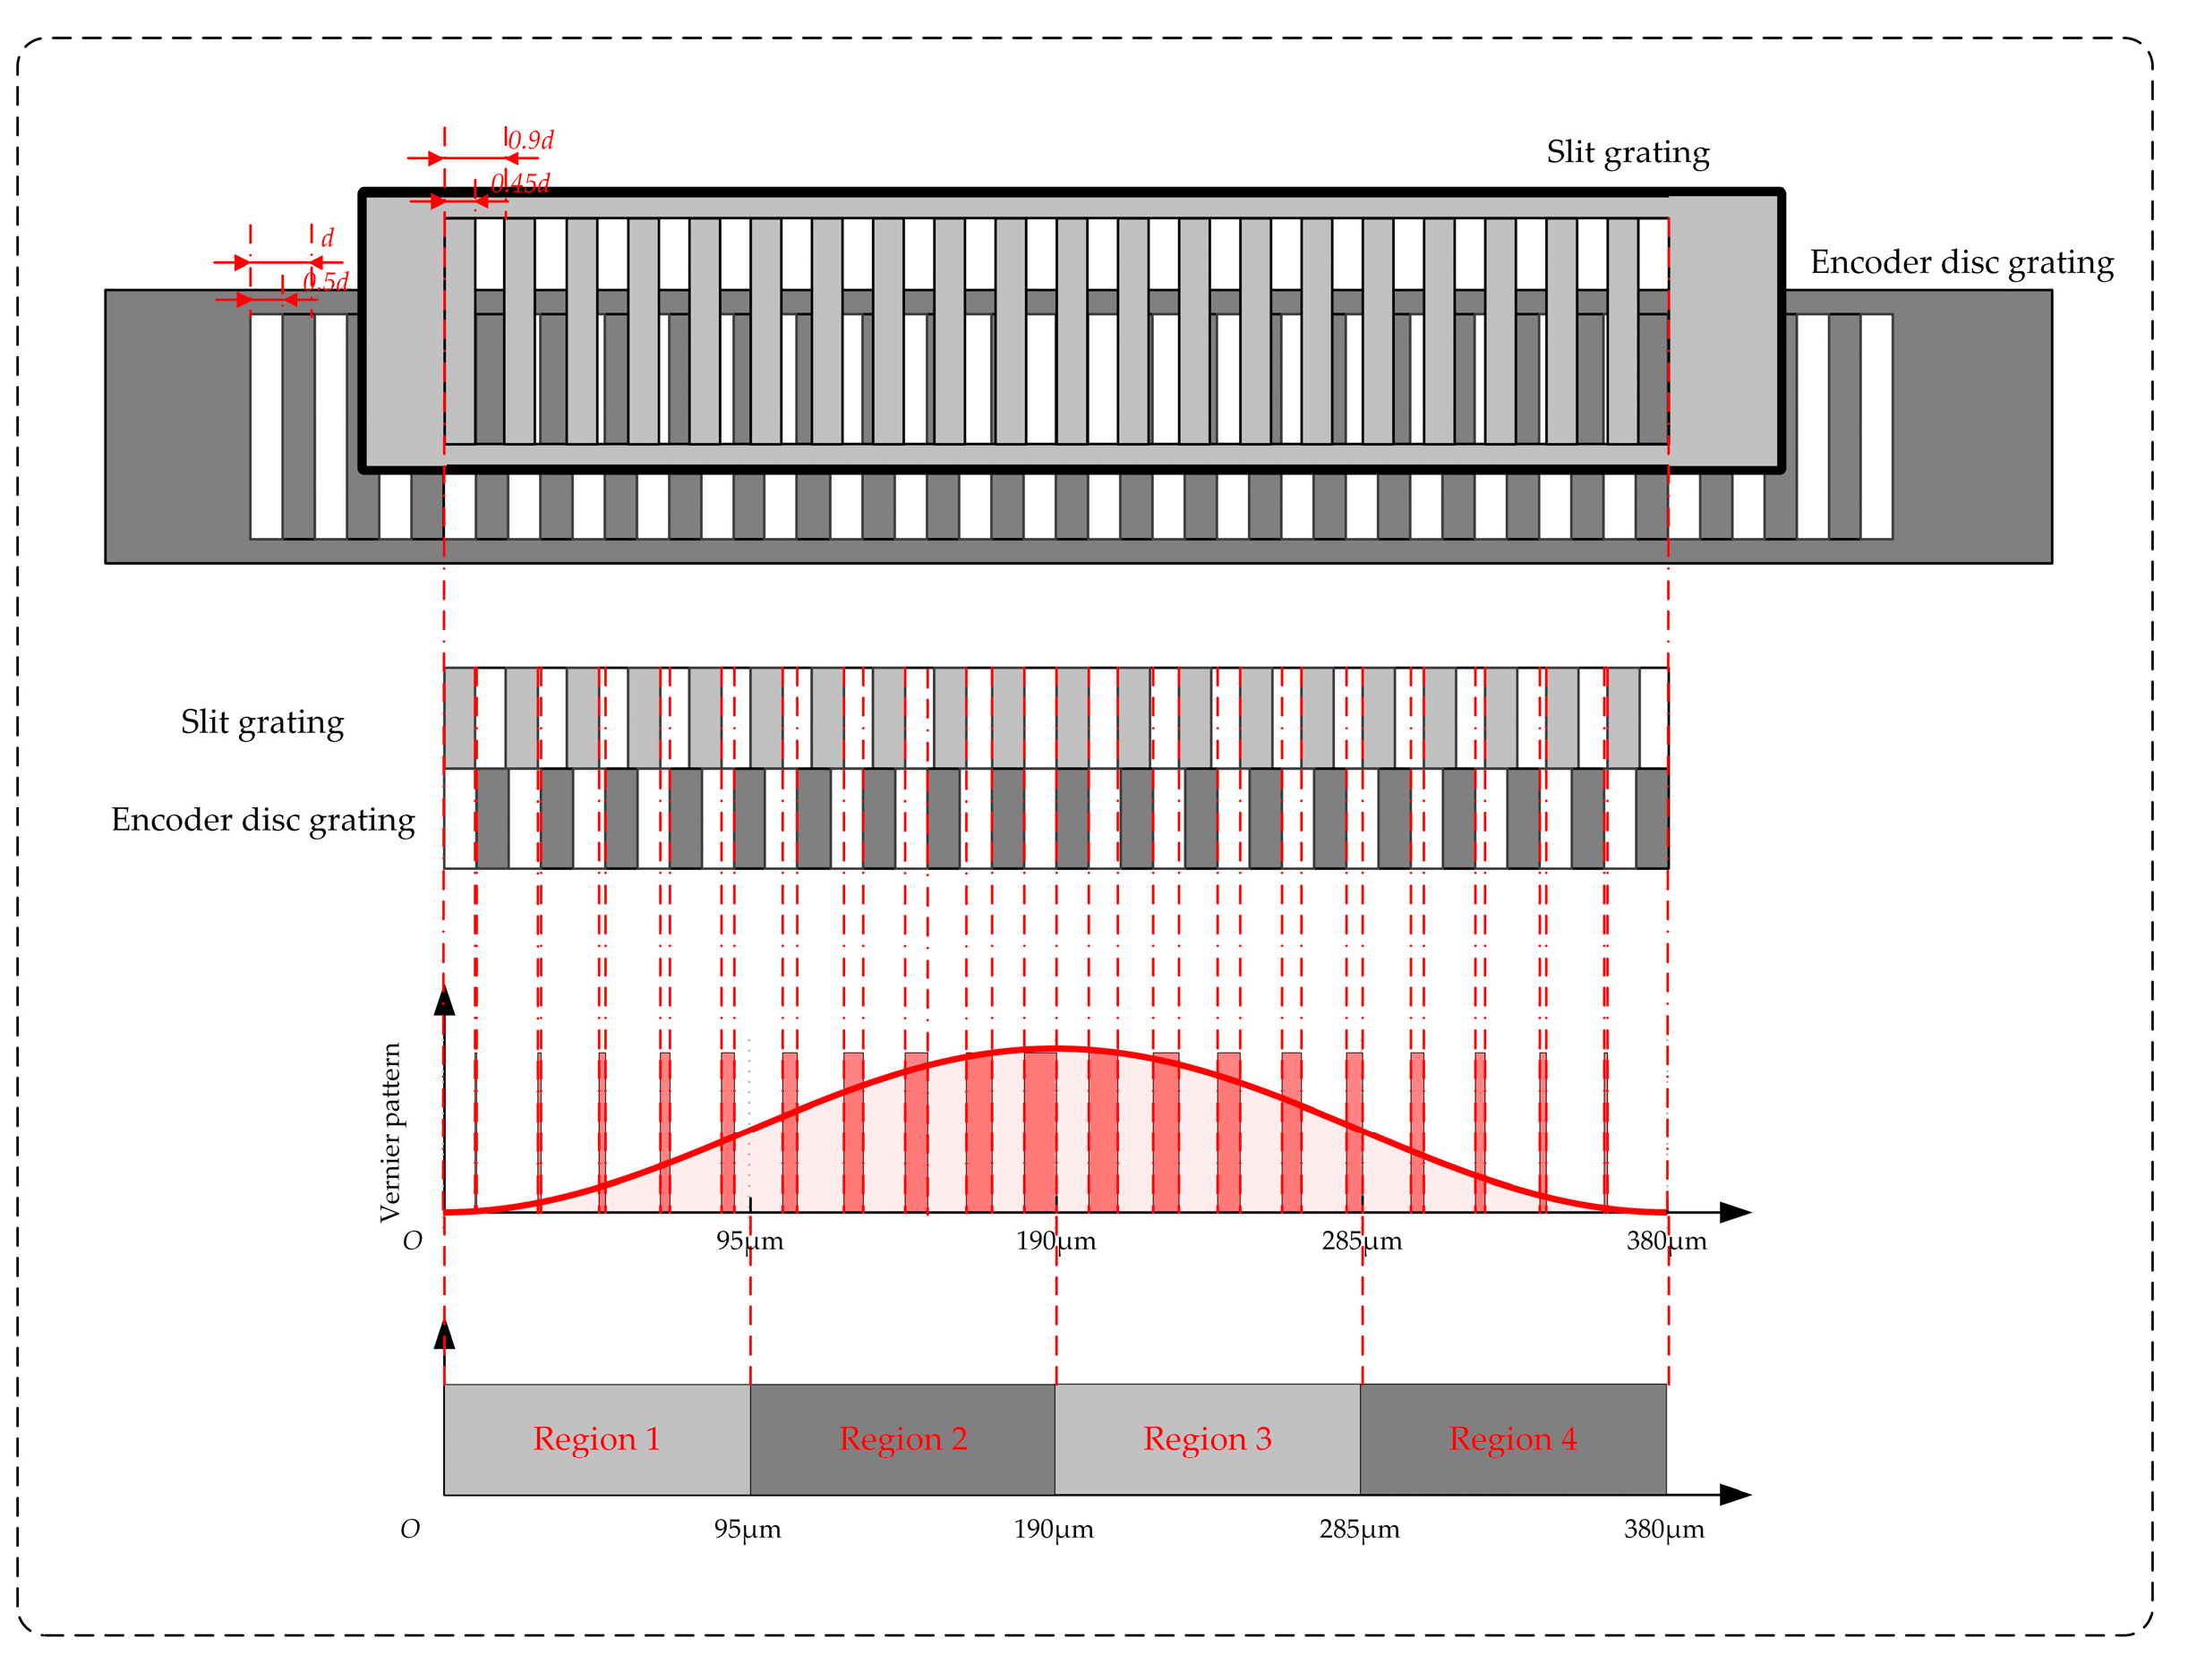
Figure 6.
Four-channel signals with displacement: (a) signals with four-field scanning method; (b) signals with single-field scanning method; (c) Lissajous figures with four-field Scanning Method; (d) Lissajous figures with single-field scanning method.
Figure 6.
Four-channel signals with displacement: (a) signals with four-field scanning method; (b) signals with single-field scanning method; (c) Lissajous figures with four-field Scanning Method; (d) Lissajous figures with single-field scanning method.
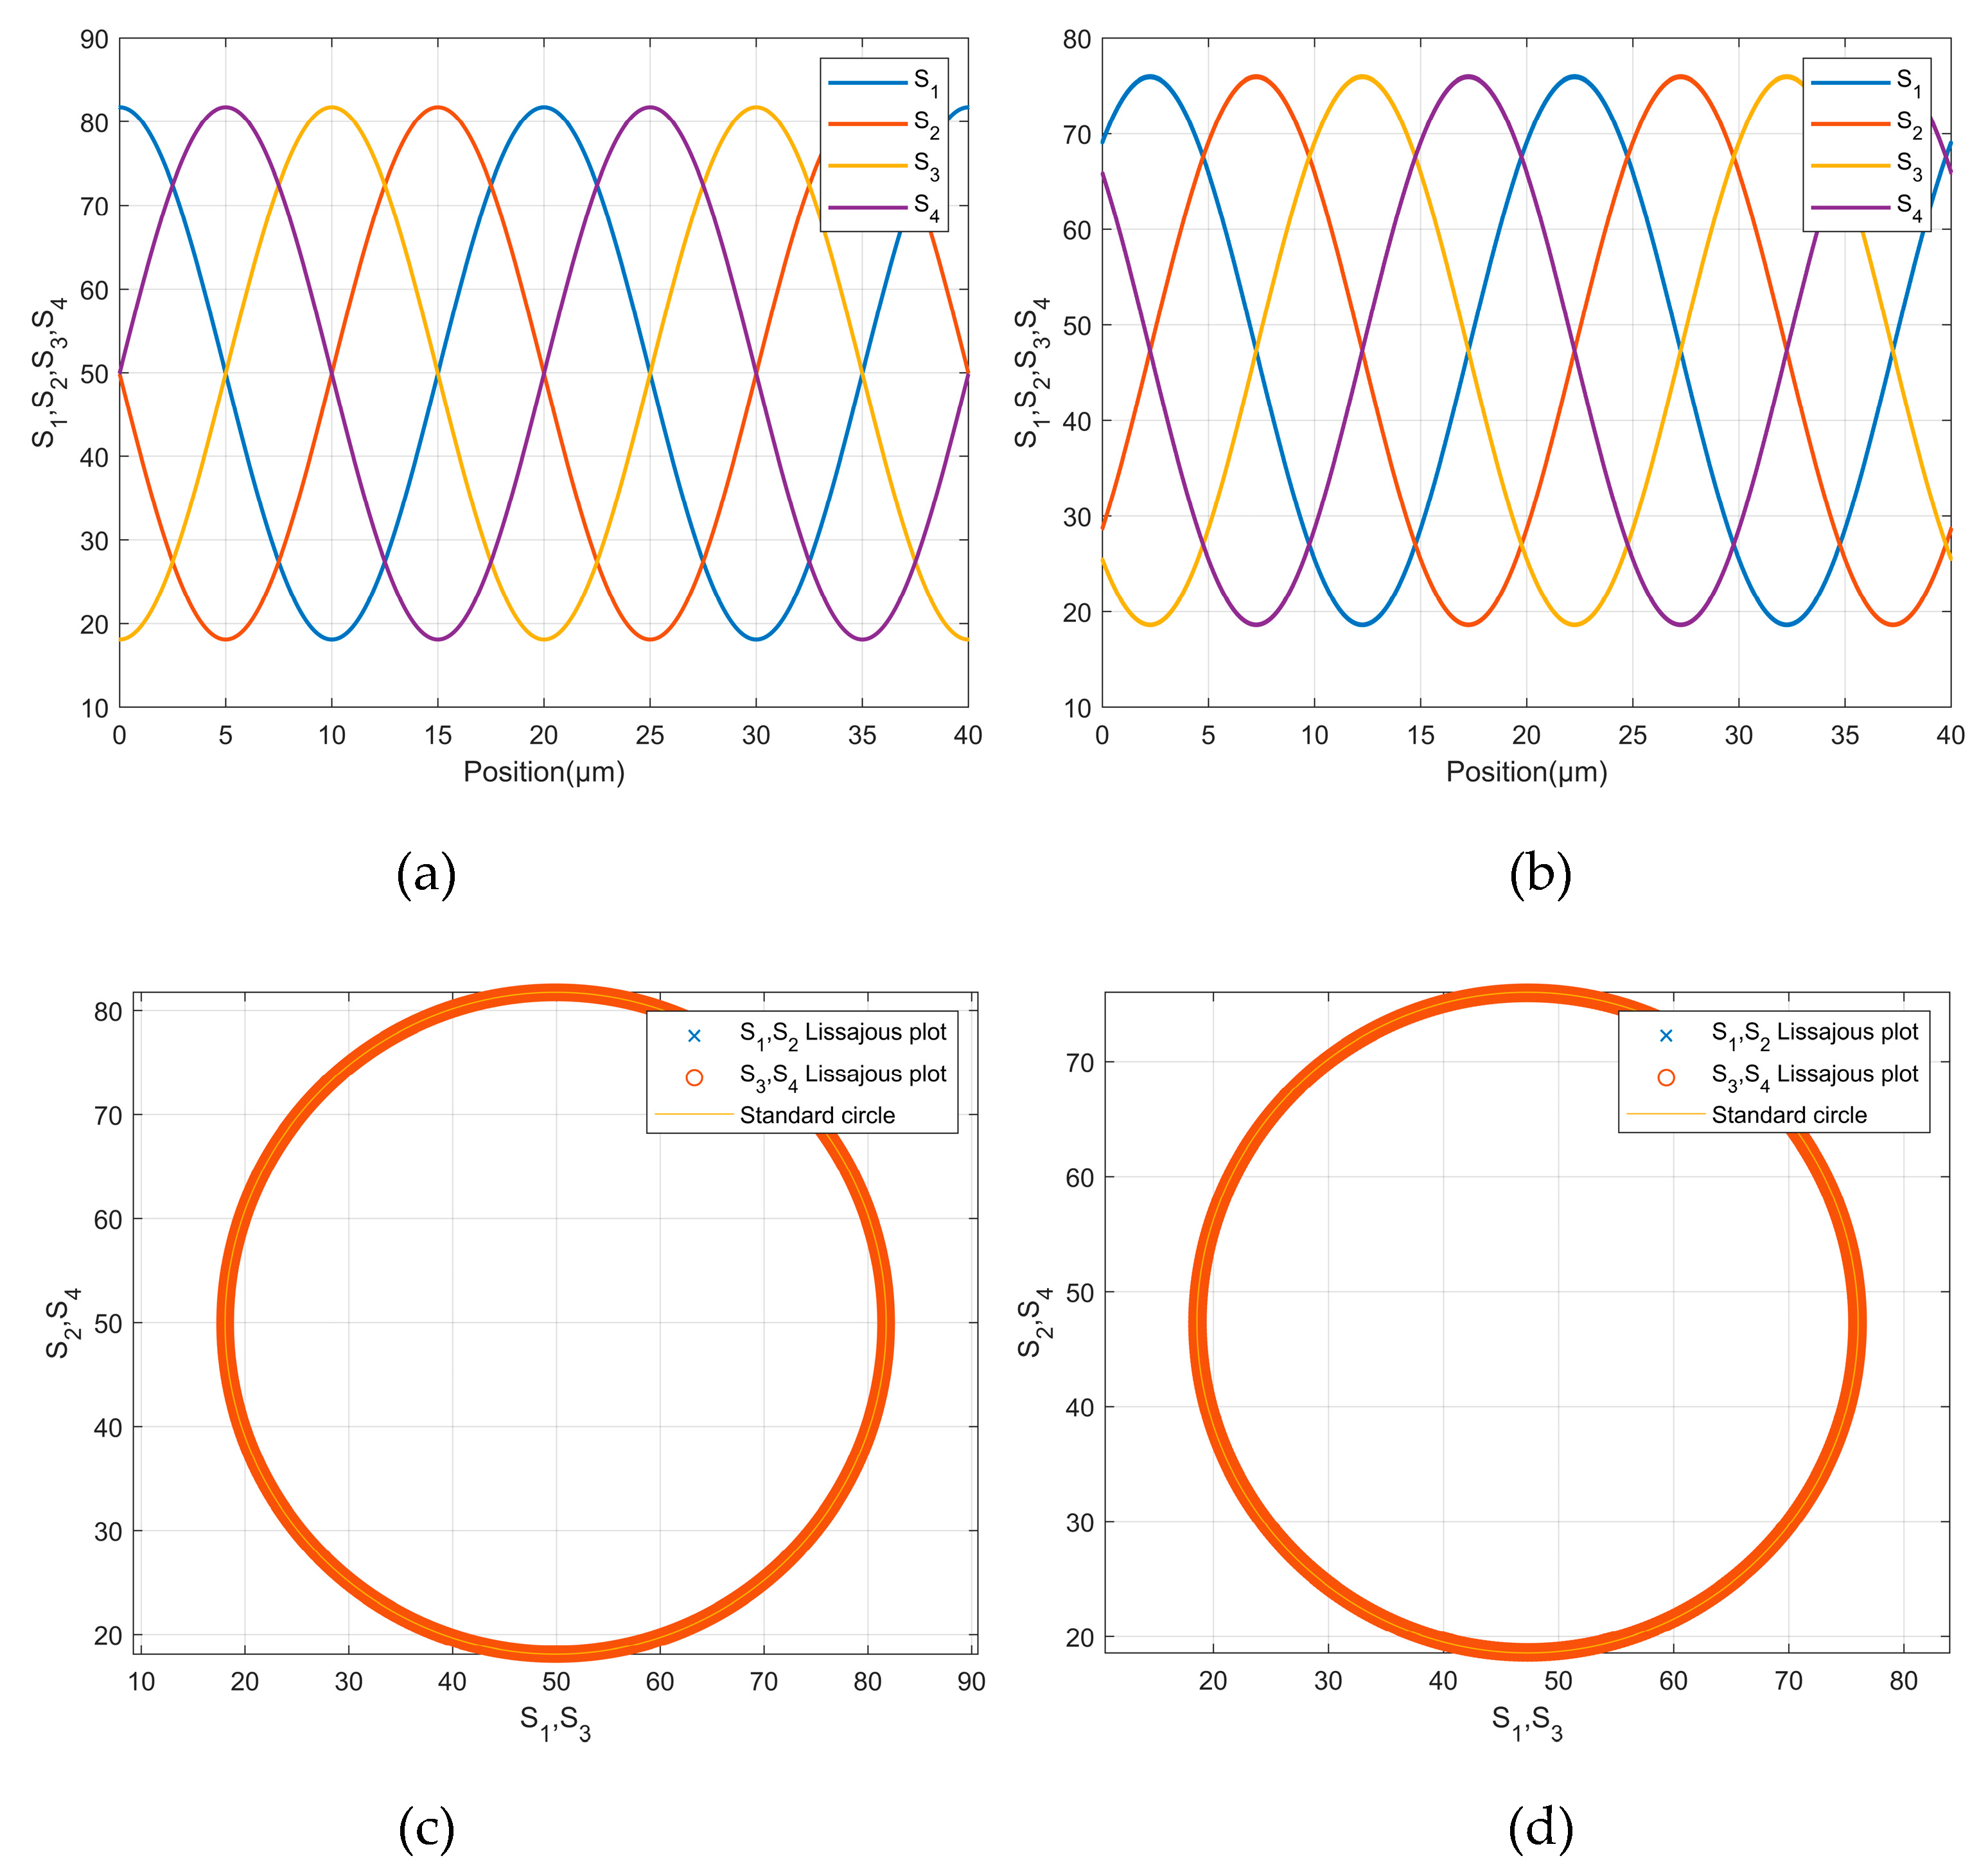
Figure 7.
Optical layout and the output signals with a photoelectric sensor array.
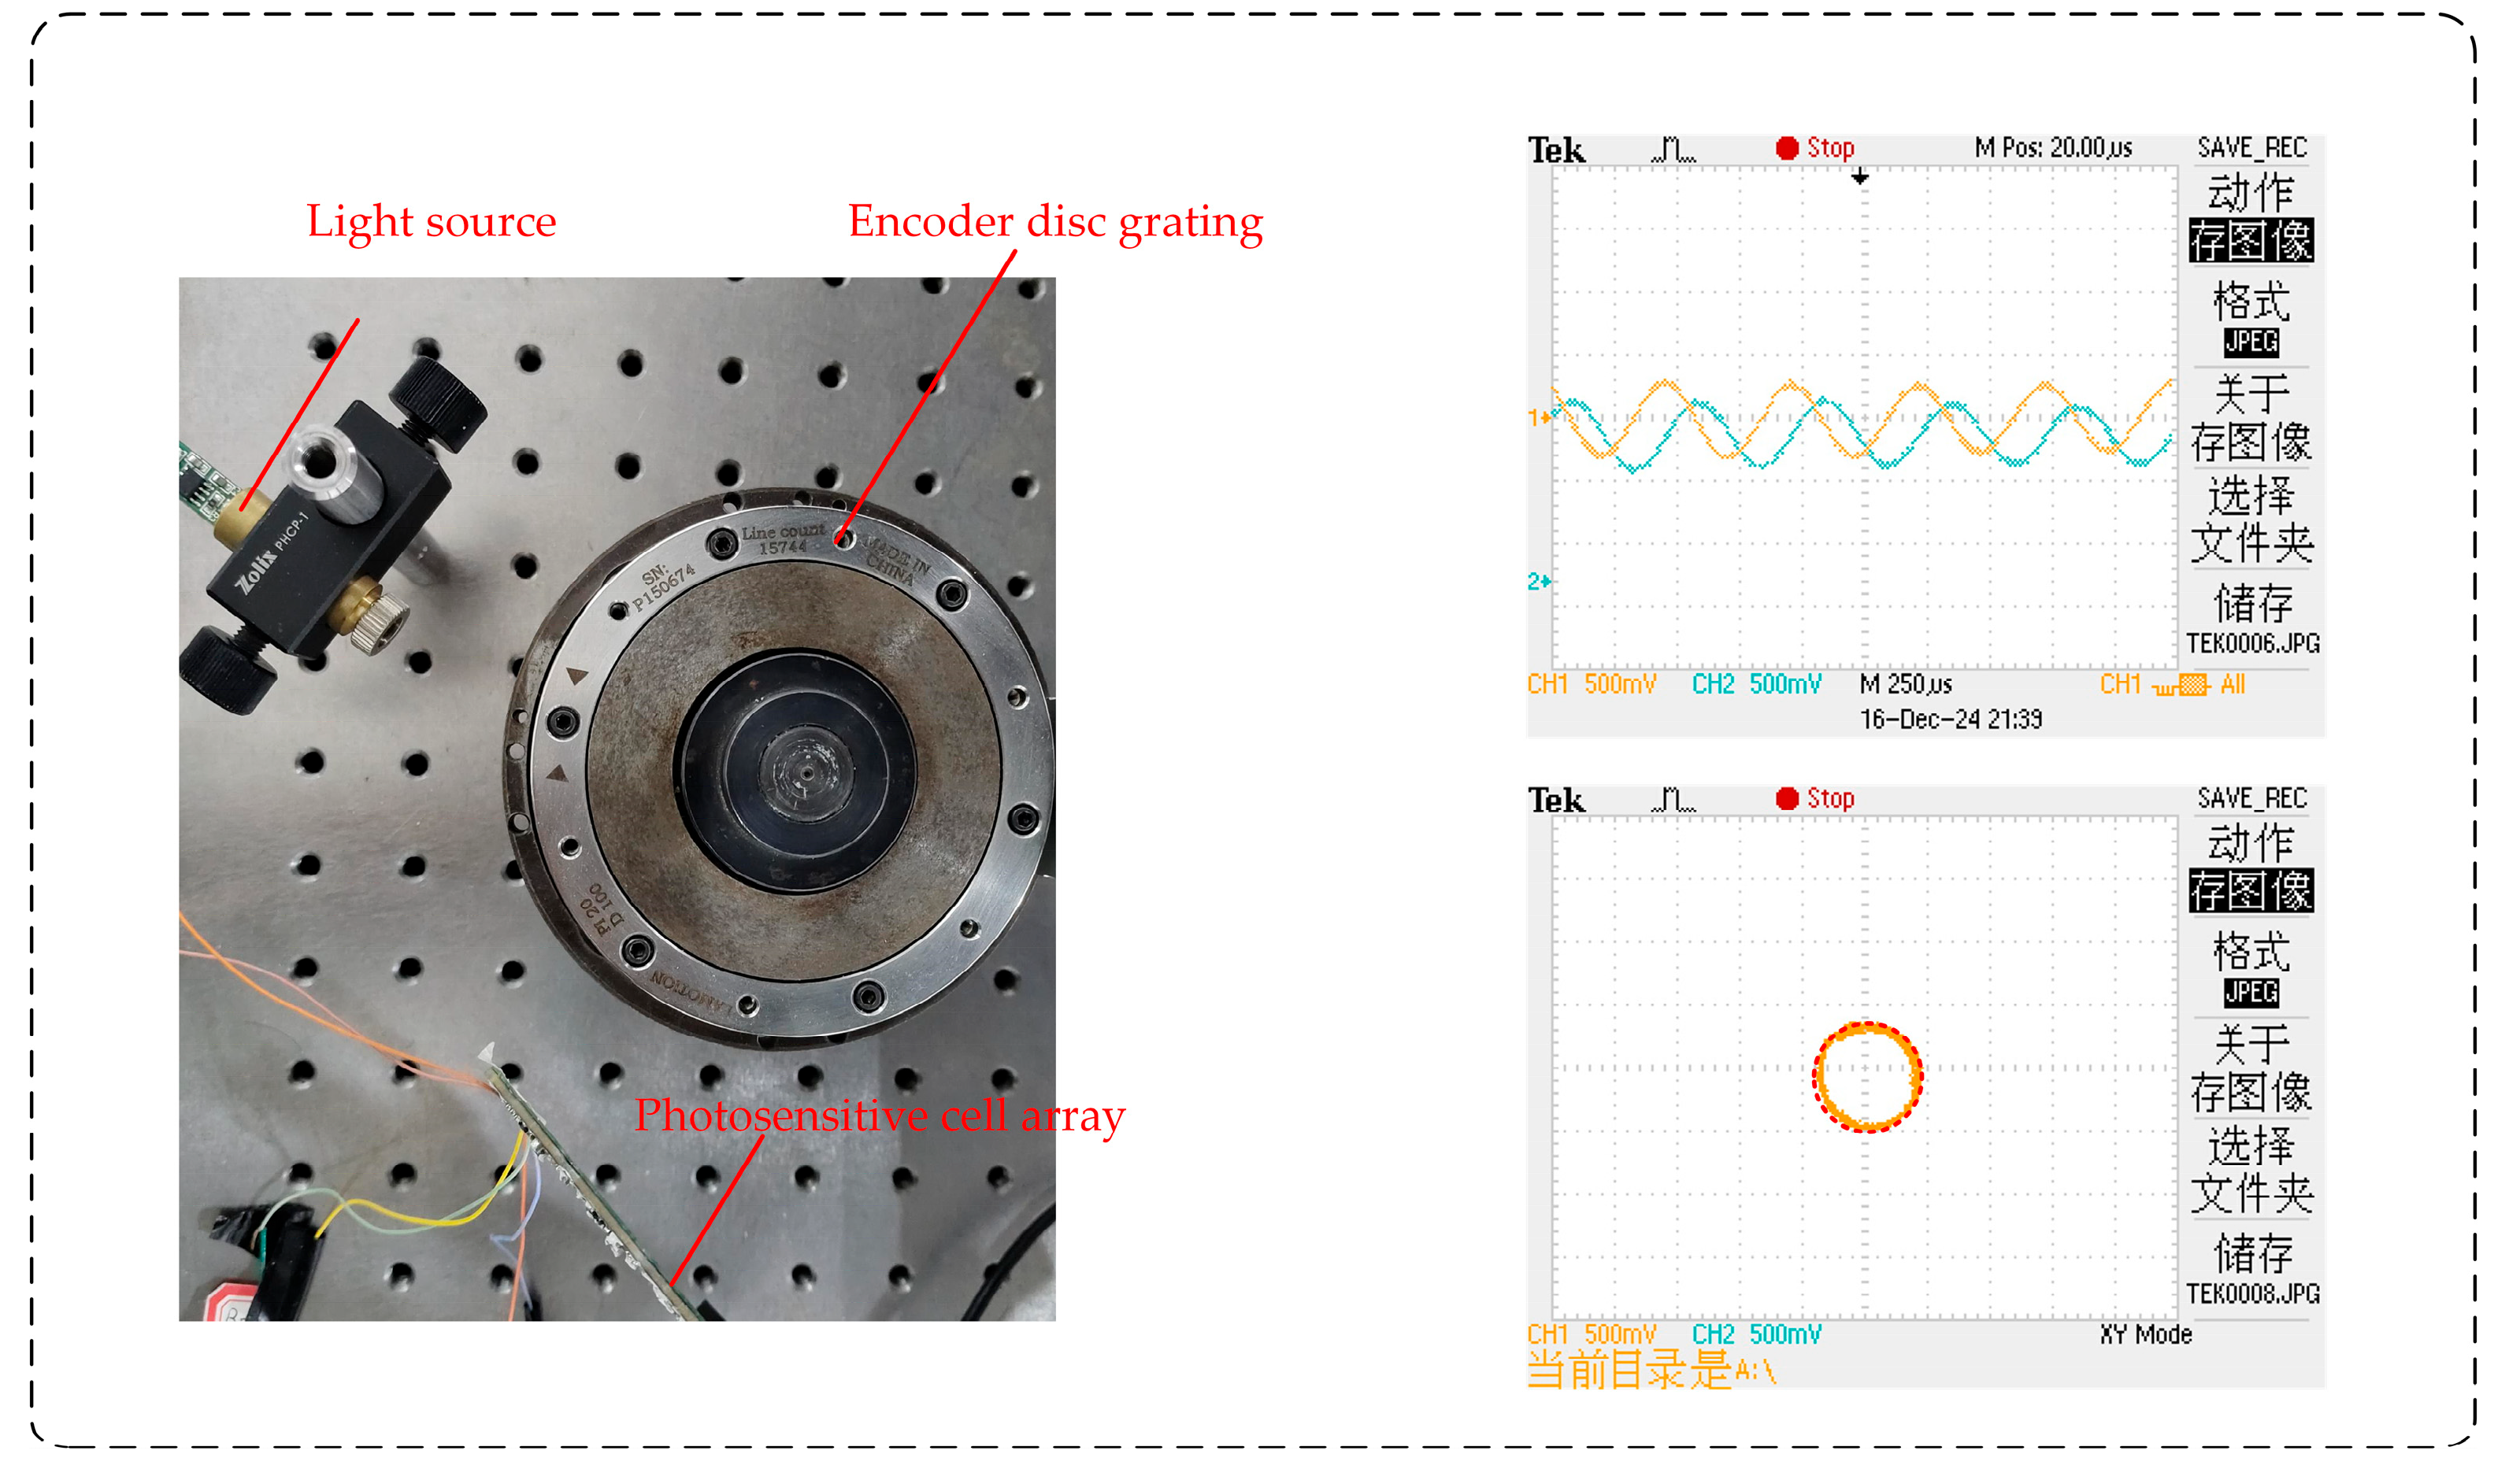
Figure 8.
Harmonic components in the output signals: (a) harmonic components with four-field scanning method; (b) harmonic components with single-field scanning method.
Figure 8.
Harmonic components in the output signals: (a) harmonic components with four-field scanning method; (b) harmonic components with single-field scanning method.
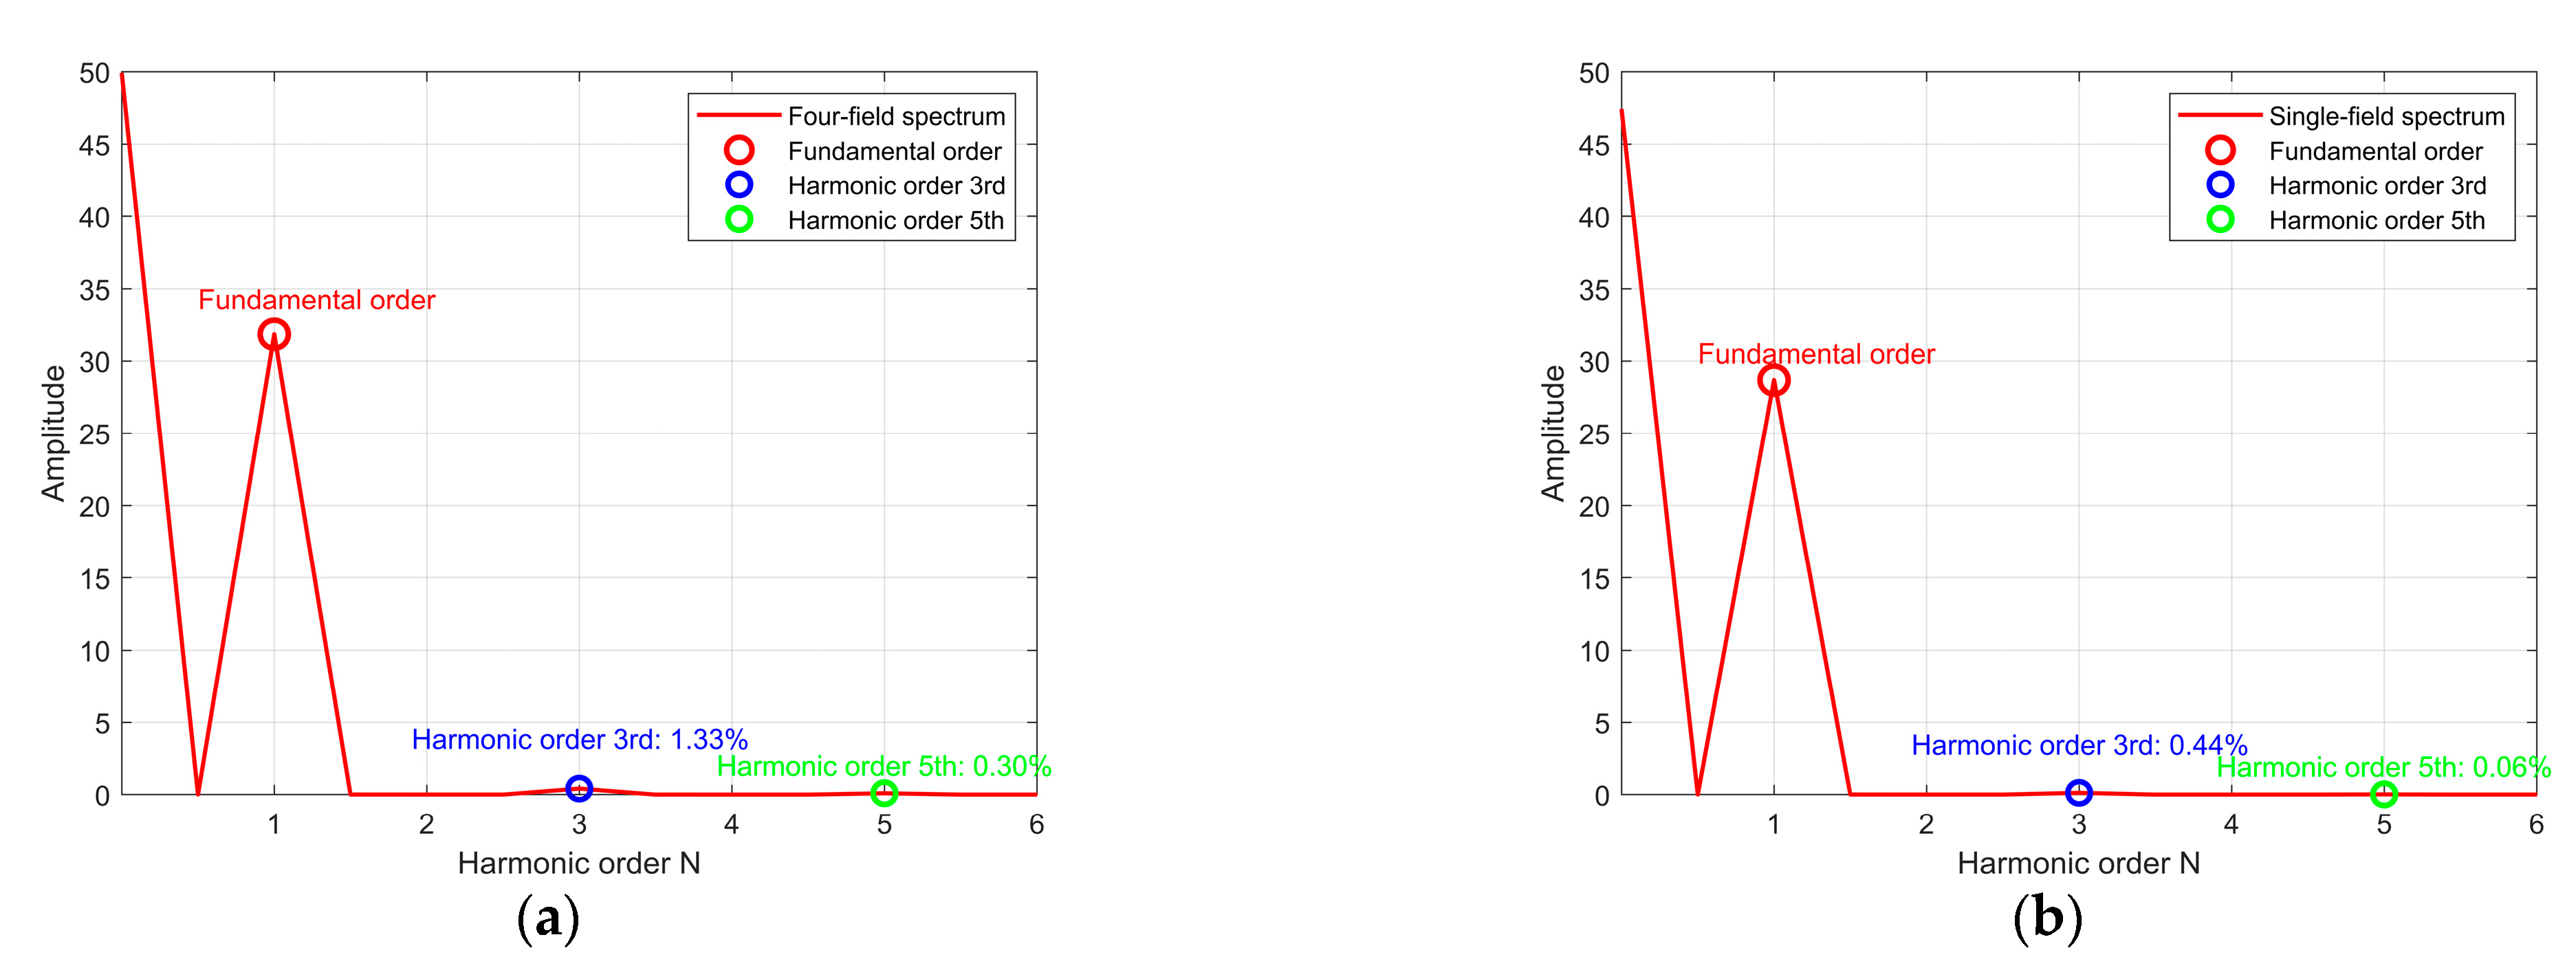
Figure 9.
Output signal Lissajous figure and harmonic spectrum: (a) Lissajous figure of the output signal with w=d/3; (b) harmonic spectrum with w=d/3; (c) Lissajous figure of the output signal with w=d/5; (d) harmonic spectrum with w=d/5.
Figure 9.
Output signal Lissajous figure and harmonic spectrum: (a) Lissajous figure of the output signal with w=d/3; (b) harmonic spectrum with w=d/3; (c) Lissajous figure of the output signal with w=d/5; (d) harmonic spectrum with w=d/5.
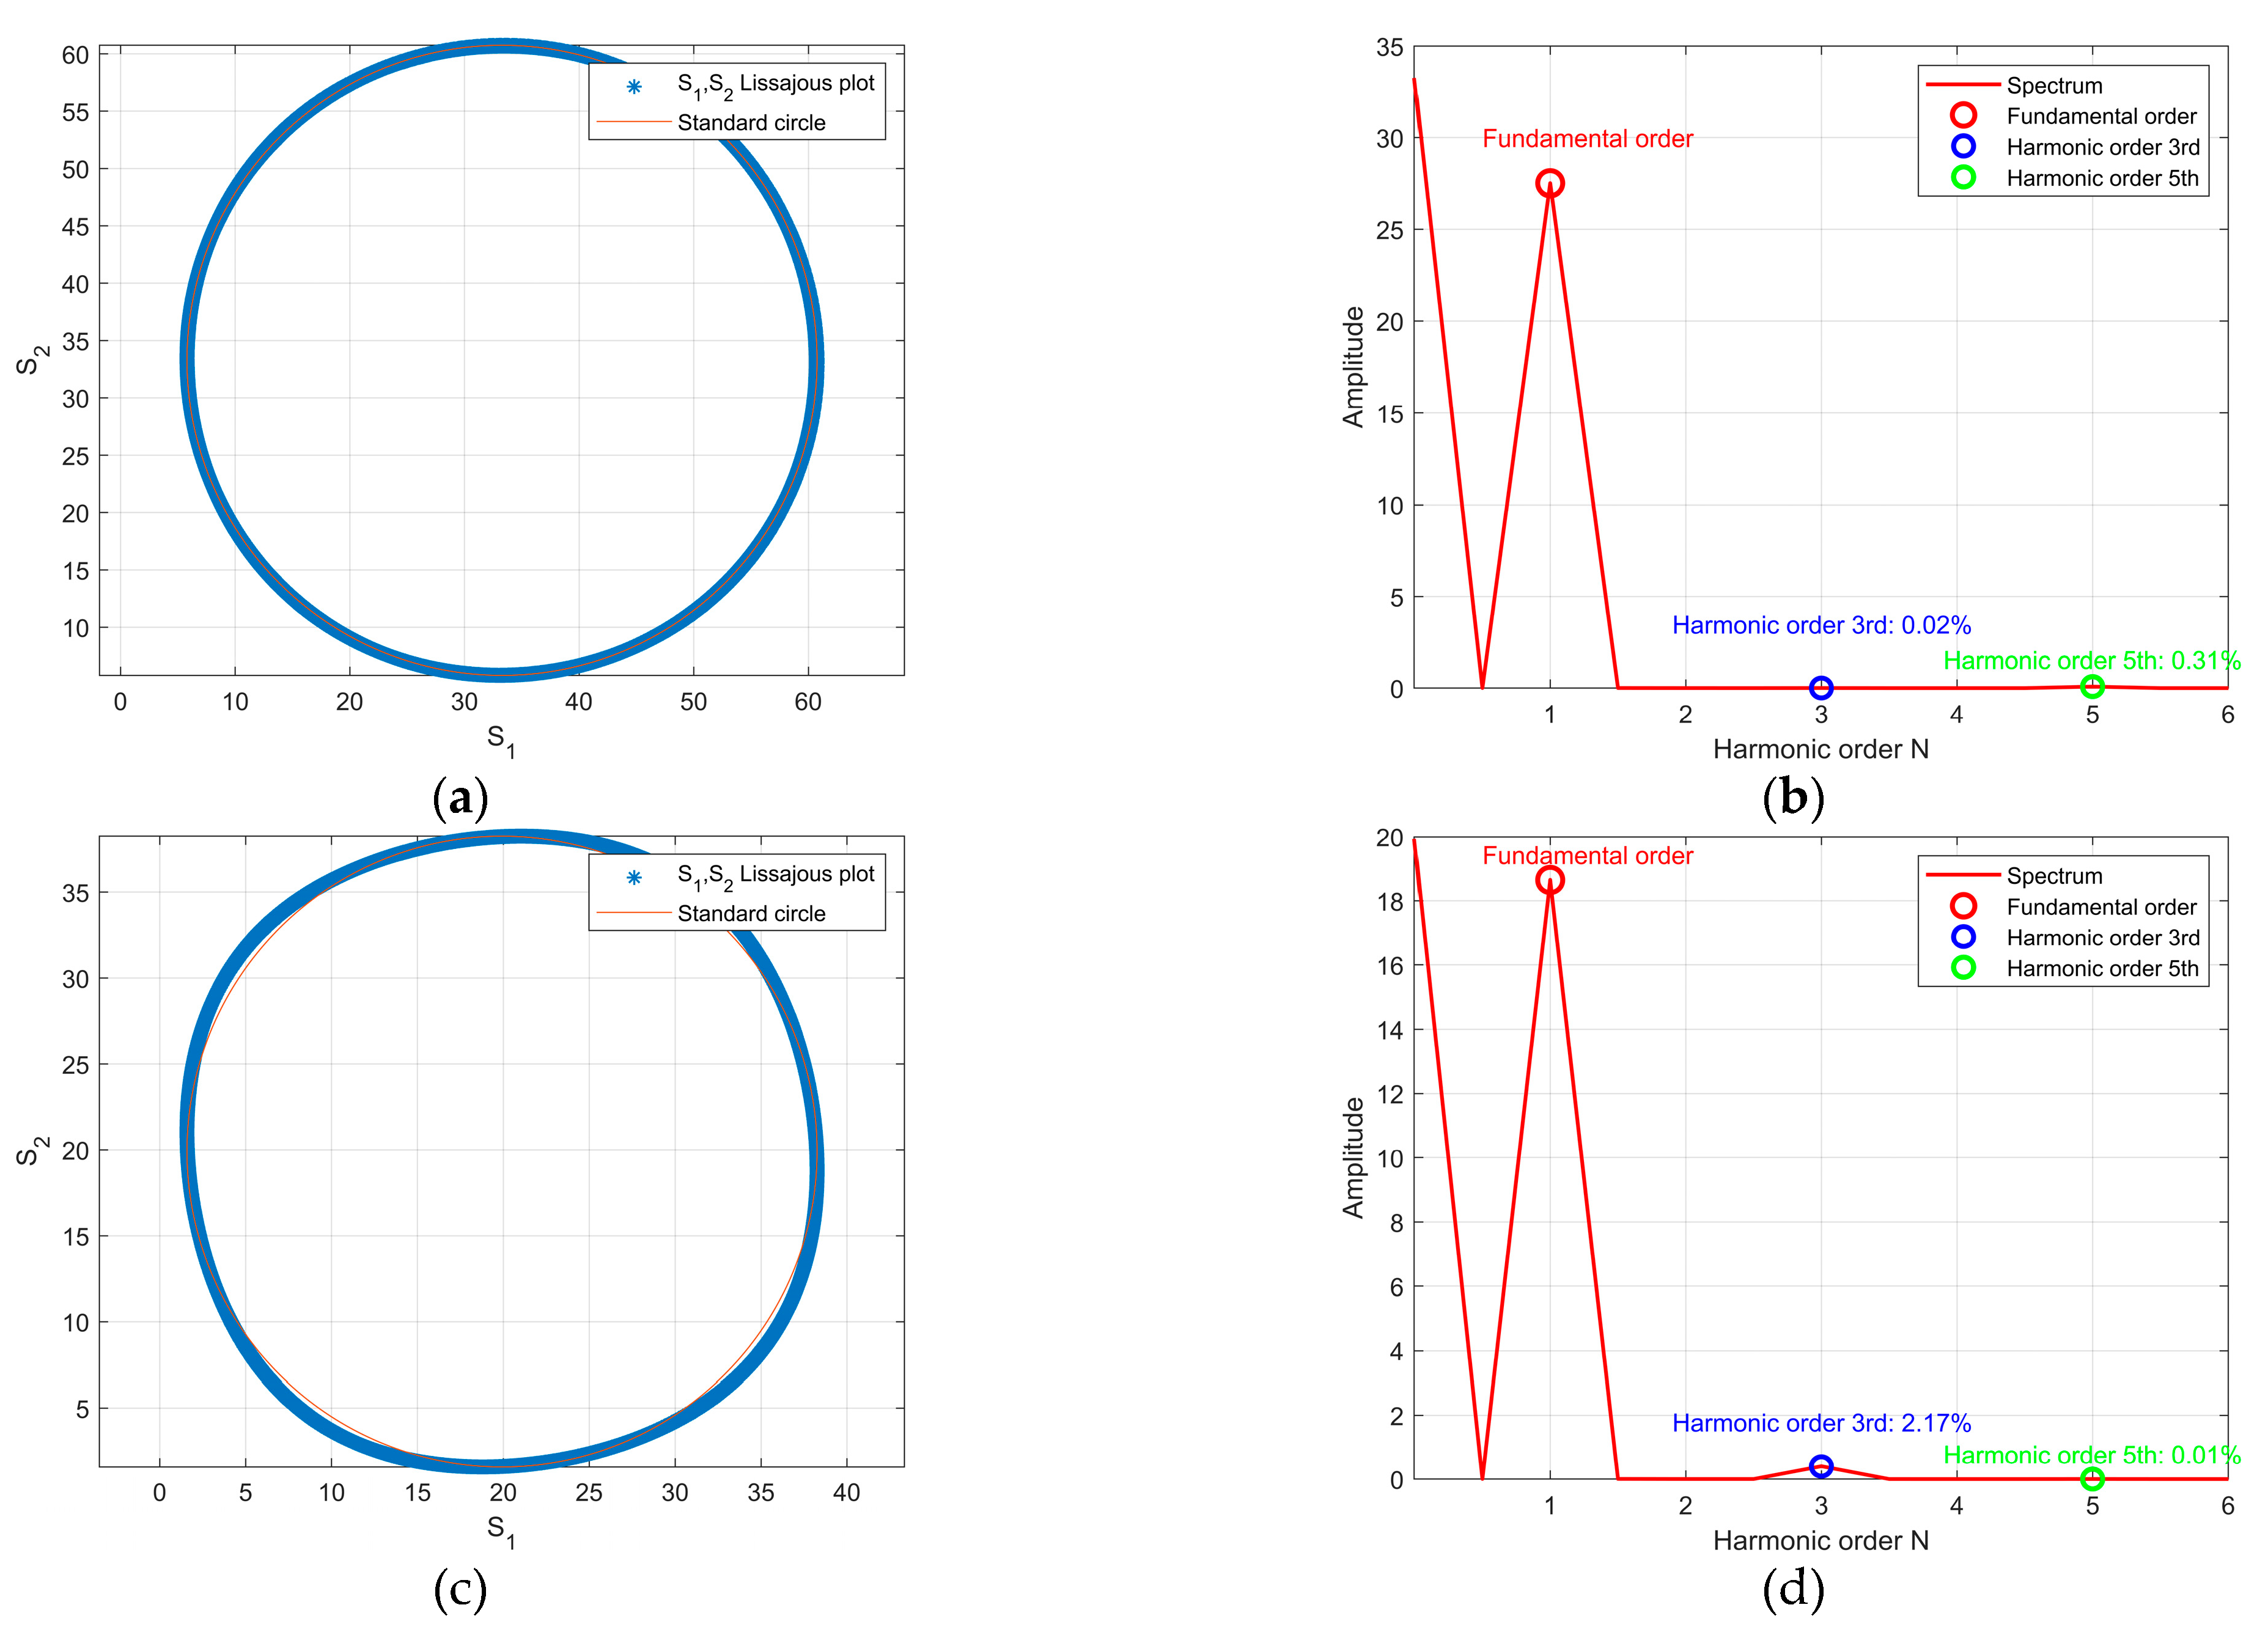
Figure 11.
Composite scanning unit design based on four-field scanning method: (a) composite scanning unit; (b) output signal harmonic spectrum.
Figure 11.
Composite scanning unit design based on four-field scanning method: (a) composite scanning unit; (b) output signal harmonic spectrum.
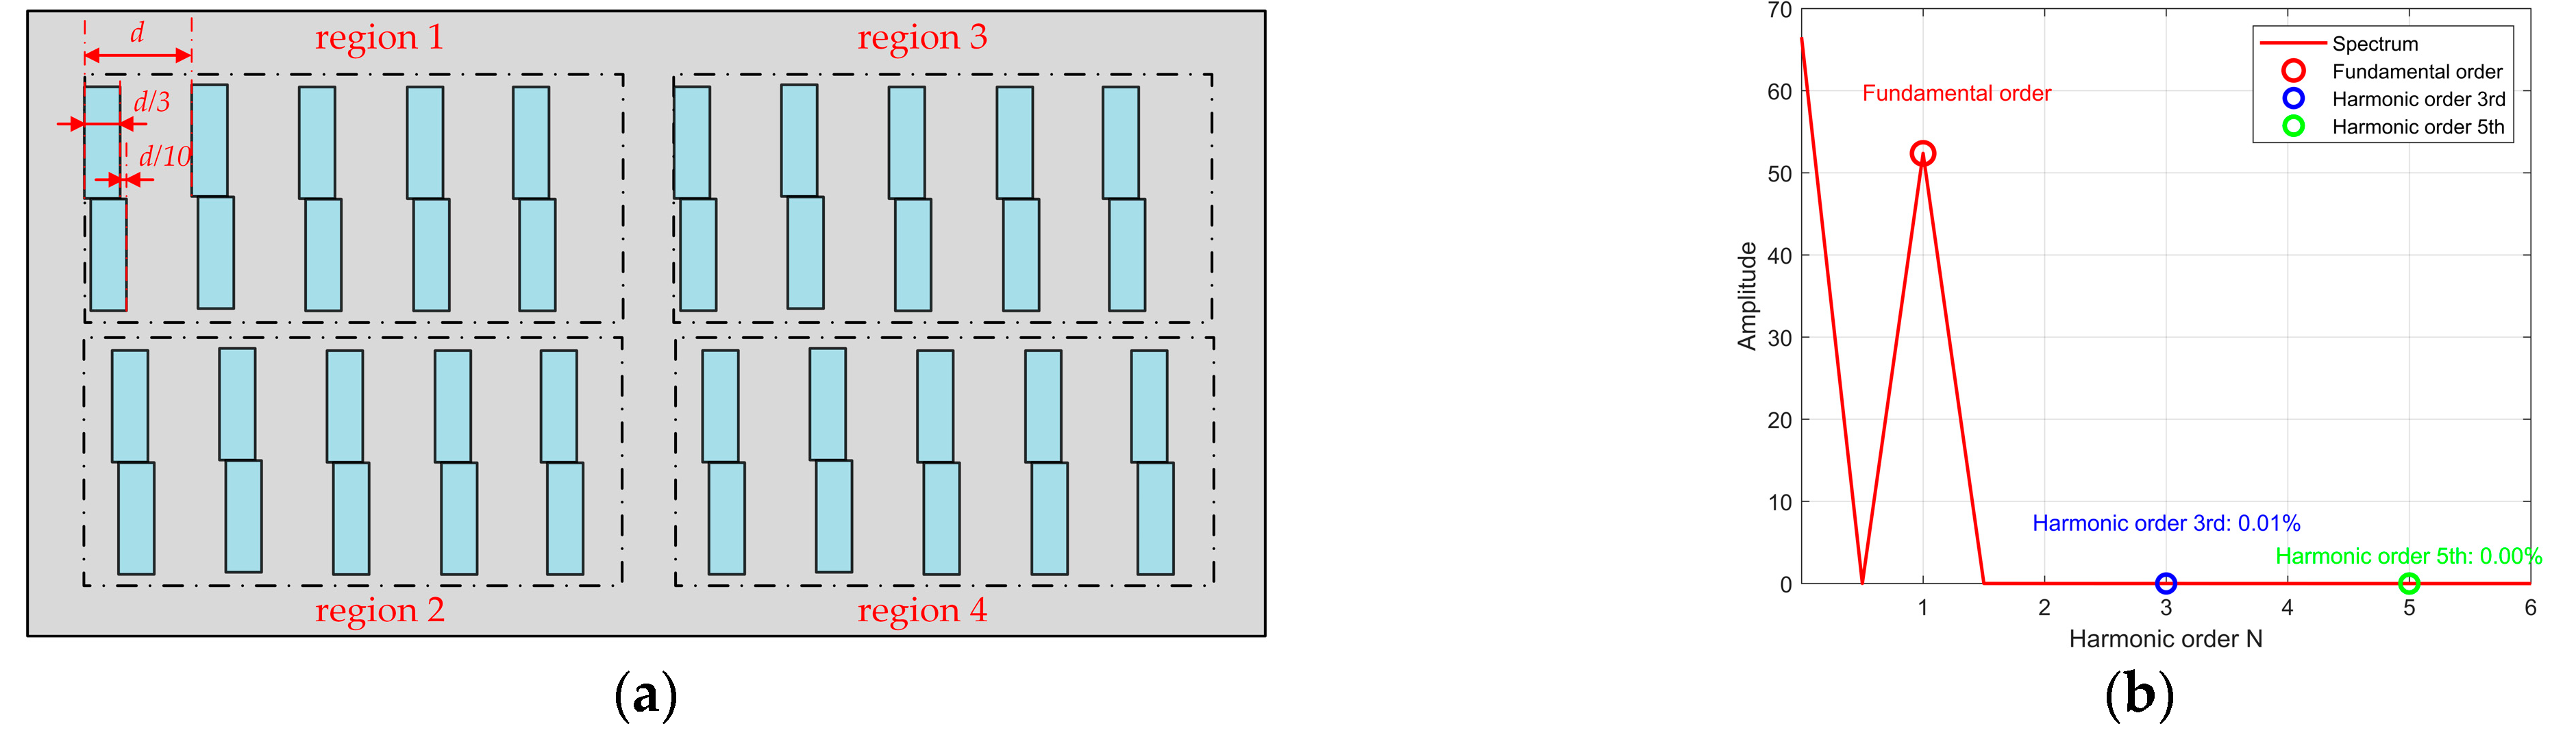
Figure 12.
Composite scanning unit design based on single-field scanning method: (a) composite scanning unit; (b) output signal harmonic spectrum.
Figure 12.
Composite scanning unit design based on single-field scanning method: (a) composite scanning unit; (b) output signal harmonic spectrum.
Disclaimer/Publisher’s Note: The statements, opinions and data contained in all publications are solely those of the individual author(s) and contributor(s) and not of MDPI and/or the editor(s). MDPI and/or the editor(s) disclaim responsibility for any injury to people or property resulting from any ideas, methods, instructions or products referred to in the content. |
© 2025 by the authors. Licensee MDPI, Basel, Switzerland. This article is an open access article distributed under the terms and conditions of the Creative Commons Attribution (CC BY) license (http://creativecommons.org/licenses/by/4.0/).
Copyright: This open access article is published under a Creative Commons CC BY 4.0 license, which permit the free download, distribution, and reuse, provided that the author and preprint are cited in any reuse.


