Submitted:
28 October 2025
Posted:
29 October 2025
You are already at the latest version
Abstract
The rapid diffusion of artificial intelligence (AI) in marketing has reshaped how consum-ers interact with digital content and evaluate ethical aspects of firms. This study examines how familiarity with and trust in AI influence consumers’ acceptance of AI-based adver-tising and their ethical purchasing behavior. Data were collected from 505 Greek consum-ers through an online survey and analyzed using hierarchical and logistic regression models. Reliability and validity tests confirmed the robustness of the measurement in-struments. The results show that familiarity with AI technologies significantly enhances trust and ethical confidence toward AI systems. In turn, trust in AI strongly predicts con-sumers’ acceptance of AI-driven advertising, while acceptance positively affects ethical consumption intentions. The findings also confirm a mediating relationship, indicating that acceptance of AI-based advertising transmits the effect of AI trust to ethical consump-tion. Overall, the study integrates ethical and technological dimensions into a unified be-havioral model, highlighting the central role of moral trust in shaping consumer behavior in the digital era. The conclusions emphasize that transparent and responsible use of AI in marketing can strengthen brand credibility, foster ethical engagement, and contribute to more sustainable consumption practices.
Keywords:
artificial intelligence
; consumer trust
; ethical consumption
; AI-based advertising
; digital marketing
; sustainable marketing
; responsible AI
1. Introduction
The rapid advancement of digital technologies has profoundly transformed the landscape of marketing and consumer behavior. Artificial intelligence (AI), big data analytics, and automated decision systems now enable firms to optimize targeting, personalize advertisements, and enhance customer engagement in real time [1,2]. However, this technological progress has also introduced new ethical and social challenges concerning data transparency, algorithmic bias, and consumer trust [3,4]. The increasing reliance on AI-mediated marketing highlights a fundamental paradox: while consumers value personalized and efficient communication, they simultaneously express concerns about privacy, fairness, and manipulation in data-driven practices [5,6].
In today’s digital marketplace, consumers no longer evaluate only the functional attributes of products or services; they also judge the moral integrity and ethical image of the companies behind them [7,8]. This shift has intensified the need for organizations to demonstrate corporate responsibility and ethical alignment in their digital strategies. Studies show that trust and perceived ethicality significantly influence consumers’ willingness to accept AI-based recommendations, advertisements, and decision support tools [2,9,10]. When consumers perceive transparency and accountability in algorithmic systems, they tend to form more positive attitudes toward the brand and exhibit higher levels of engagement [11].
Despite growing interest in AI-driven marketing, several research gaps remain. Much of the existing literature focuses on technological or functional adoption models—such as the Technology Acceptance Model (TAM) and the Unified Theory of Acceptance and Use of Technology (UTAUT)—without fully addressing the ethical and relational dimensions of trust [12,13]. Furthermore, few empirical studies have examined how the ethical image of businesses and consumer trust in AI interact to shape behavioral outcomes such as the acceptance of AI-based advertising or ethical purchasing intentions [14,15,16]. Addressing this gap is crucial for understanding how digital transformation can coexist with responsible and trustworthy marketing communication.
This study aims to contribute to this emerging field by exploring how consumers’ familiarity and trust in AI influence two key behavioral dimensions: (a) the acceptance of AI-driven advertising and (b) the intention toward ethical consumption. Drawing on data from Greek digital consumers, the research develops and empirically tests a conceptual framework linking digital engagement, ethical confidence, and purchasing behavior. The contribution is twofold: theoretically, it integrates trust and ethical corporate image within a behavioral model of consumer decision-making; practically, it offers insights for companies seeking to design transparent, ethically responsible, and consumer-centered marketing strategies in the digital era [7,9,11,16].
2. Theoretical Framework and Hypothesis Development
The theoretical framework of this study builds on previous research examining the role of trust, ethics, and digital engagement in shaping consumer attitudes and behavioral outcomes in technology-mediated marketing environments. Trust has been widely recognized as a cornerstone of successful digital relationships between consumers and firms [17]. When consumers perceive a technology or platform as transparent, reliable, and fair, they are more likely to accept its use in personalized communication, data sharing, and decision assistance [18]. In contrast, a lack of clarity, accountability, or perceived ethical legitimacy can undermine confidence, creating resistance to digital tools and skepticism toward AI-mediated marketing [19].
Existing research also shows that familiarity and previous experience with digital systems enhance perceived ease of use, competence, and confidence [20]. As consumers increasingly interact with automated systems—chatbots, recommender engines, or voice assistants—they develop a more nuanced understanding of how such technologies function, which can foster greater comfort and trust [21]. Consequently, familiarity not only reduces uncertainty but also supports more positive ethical evaluations of technology providers who are seen as transparent and responsible [22].
2.1. Trust and Familiarity with Artificial Intelligence
Trust represents one of the most decisive factors shaping consumer attitudes toward artificial intelligence (AI) and the companies that deploy it. Recent studies emphasize that trust in AI extends beyond the technical reliability of algorithms, encompassing consumers’ belief that technology is applied responsibly, transparently, and in alignment with social and ethical norms [9,11]. When consumers perceive AI-based systems as fair and accountable, their acceptance and confidence toward the firms behind them increase [8,23].
Familiarity with AI plays a crucial cognitive role in the formation of trust. Consumers who are more exposed to AI applications—such as recommendation systems, chatbots, or personalized advertisements—tend to experience less uncertainty and develop stronger perceptions of reliability [22,24]. Familiarity functions as a learning mechanism that enhances understanding of how AI operates and reduces perceived risks [25]. As a result, it fosters both cognitive and affective trust toward the technology and its providers [18].
The literature consistently highlights the multidimensional nature of AI trust, involving not only perceived competence and consistency but also perceived fairness, benevolence, and ethical integrity [26,27]. When businesses demonstrate transparency and ethical responsibility in their data practices, consumers are more likely to attribute moral value to their technological use [16]. This perception contributes to broader positive attitudes toward brands that integrate AI in an accountable and socially conscious manner [7].
Recent empirical findings show that consumers’ familiarity with AI strengthens their trust, which subsequently enhances their acceptance of AI-driven marketing and decision-making tools [6,10,14]. Trust therefore acts as a mediating construct that channels the effect of cognitive understanding (familiarity) into behavioral readiness to adopt AI-enabled interactions [17]. The relatio6nship between familiarity and trust also reflects broader processes of ethical evaluation: when users feel knowledgeable and empowered, they tend to expect fairness, transparency, and respect for personal data [3].
In summary, familiarity and trust form an interdependent system: knowledge reduces uncertainty, and trust strengthens the willingness to engage with AI-based services. Based on this reasoning, the following hypothesis is proposed:
H1:
Familiarity with artificial intelligence positively influences consumers’ trust in AI and in companies that employ it.
2.2. Acceptance of AI-Based Advertising
Acceptance of AI-based advertising depends critically on consumers’ prior trust in the technology and in the organizations employing it. Individuals are more likely to accept personalized messages when they perceive AI-generated content as useful, transparent, and respectful of privacy and autonomy [2,33]. From the perspective of procedural fairness, consumers evaluate not only the outcomes of advertising but also the processes by which ads are created, targeted, and delivered [14]. The legitimacy of algorithmic procedures thus becomes a moral criterion that influences how persuasive and acceptable AI-generated messages appear [28].
Trust operates as a cognitive filter that lowers perceived risk and enhances openness to AI-mediated communication [5]. When algorithmic systems are seen as accountable, explainable, and free from manipulative intent, consumers attribute greater credibility both to the message and to the sponsoring brand [19,46]. In this way, perceived trustworthiness shapes the moral and psychological conditions under which consumers respond to AI-based advertising. The acceptance of such advertising is therefore conceptualized as a proximal outcome of trust in AI—a critical link that connects technological confidence to broader ethical and evaluative judgments of firms [7,15].
H2:
Trust in AI positively influences consumers’ acceptance of AI-based advertising.
2.3. Ethical Consumption Intention
Ethical consumption intention reflects consumers’ tendency to incorporate social, environmental, and moral considerations into their purchasing decisions [30,31]. It involves both avoidance of products associated with unethical practices and preference for firms perceived as responsible and transparent [32]. In digital marketplaces, the accessibility of ethical information—such as sourcing, labor conditions, or sustainability ratings—is increasingly mediated by AI systems that recommend or filter product information. These systems can strengthen moral decision-making when perceived as fair and unbiased but may undermine it when perceived as intrusive or manipulative [26,33].
Acceptance of AI-based advertising can serve as a cognitive activation frame that links technological trust to ethical behavior. When consumers accept AI-mediated communication as legitimate and transparent, they are more inclined to generalize positive moral expectations toward the company, reinforcing perceptions of ethical image and integrity [26,35]. Consequently, consumers who view AI-based marketing as trustworthy are more likely to reward responsible firms through their ethical purchase choices.
H3:
Acceptance of AI-based advertising positively influences ethical consumption intention.
2.4. Mediation of AI Advertising Acceptance
Beyond direct effects, prior research suggests that technology acceptance frequently mediates the pathway from cognitive antecedents—such as familiarity and trust—to behavioral intentions [12,13]. Acceptance of AI-based advertising can thus be understood as the mechanism through which trust in AI translates into ethically oriented behavior. When consumers perceive AI advertising as transparent and legitimate, they infer that the company’s technological practices align with broader social and moral standards [36]. This inference legitimizes the use of AI in marketing, turning trust into proactive engagement with ethically perceived brands [37].
H4:
Acceptance of AI-based advertising mediates the relationship between trust in AI and ethical consumption intention.
2.5. Summary and Link to Methods
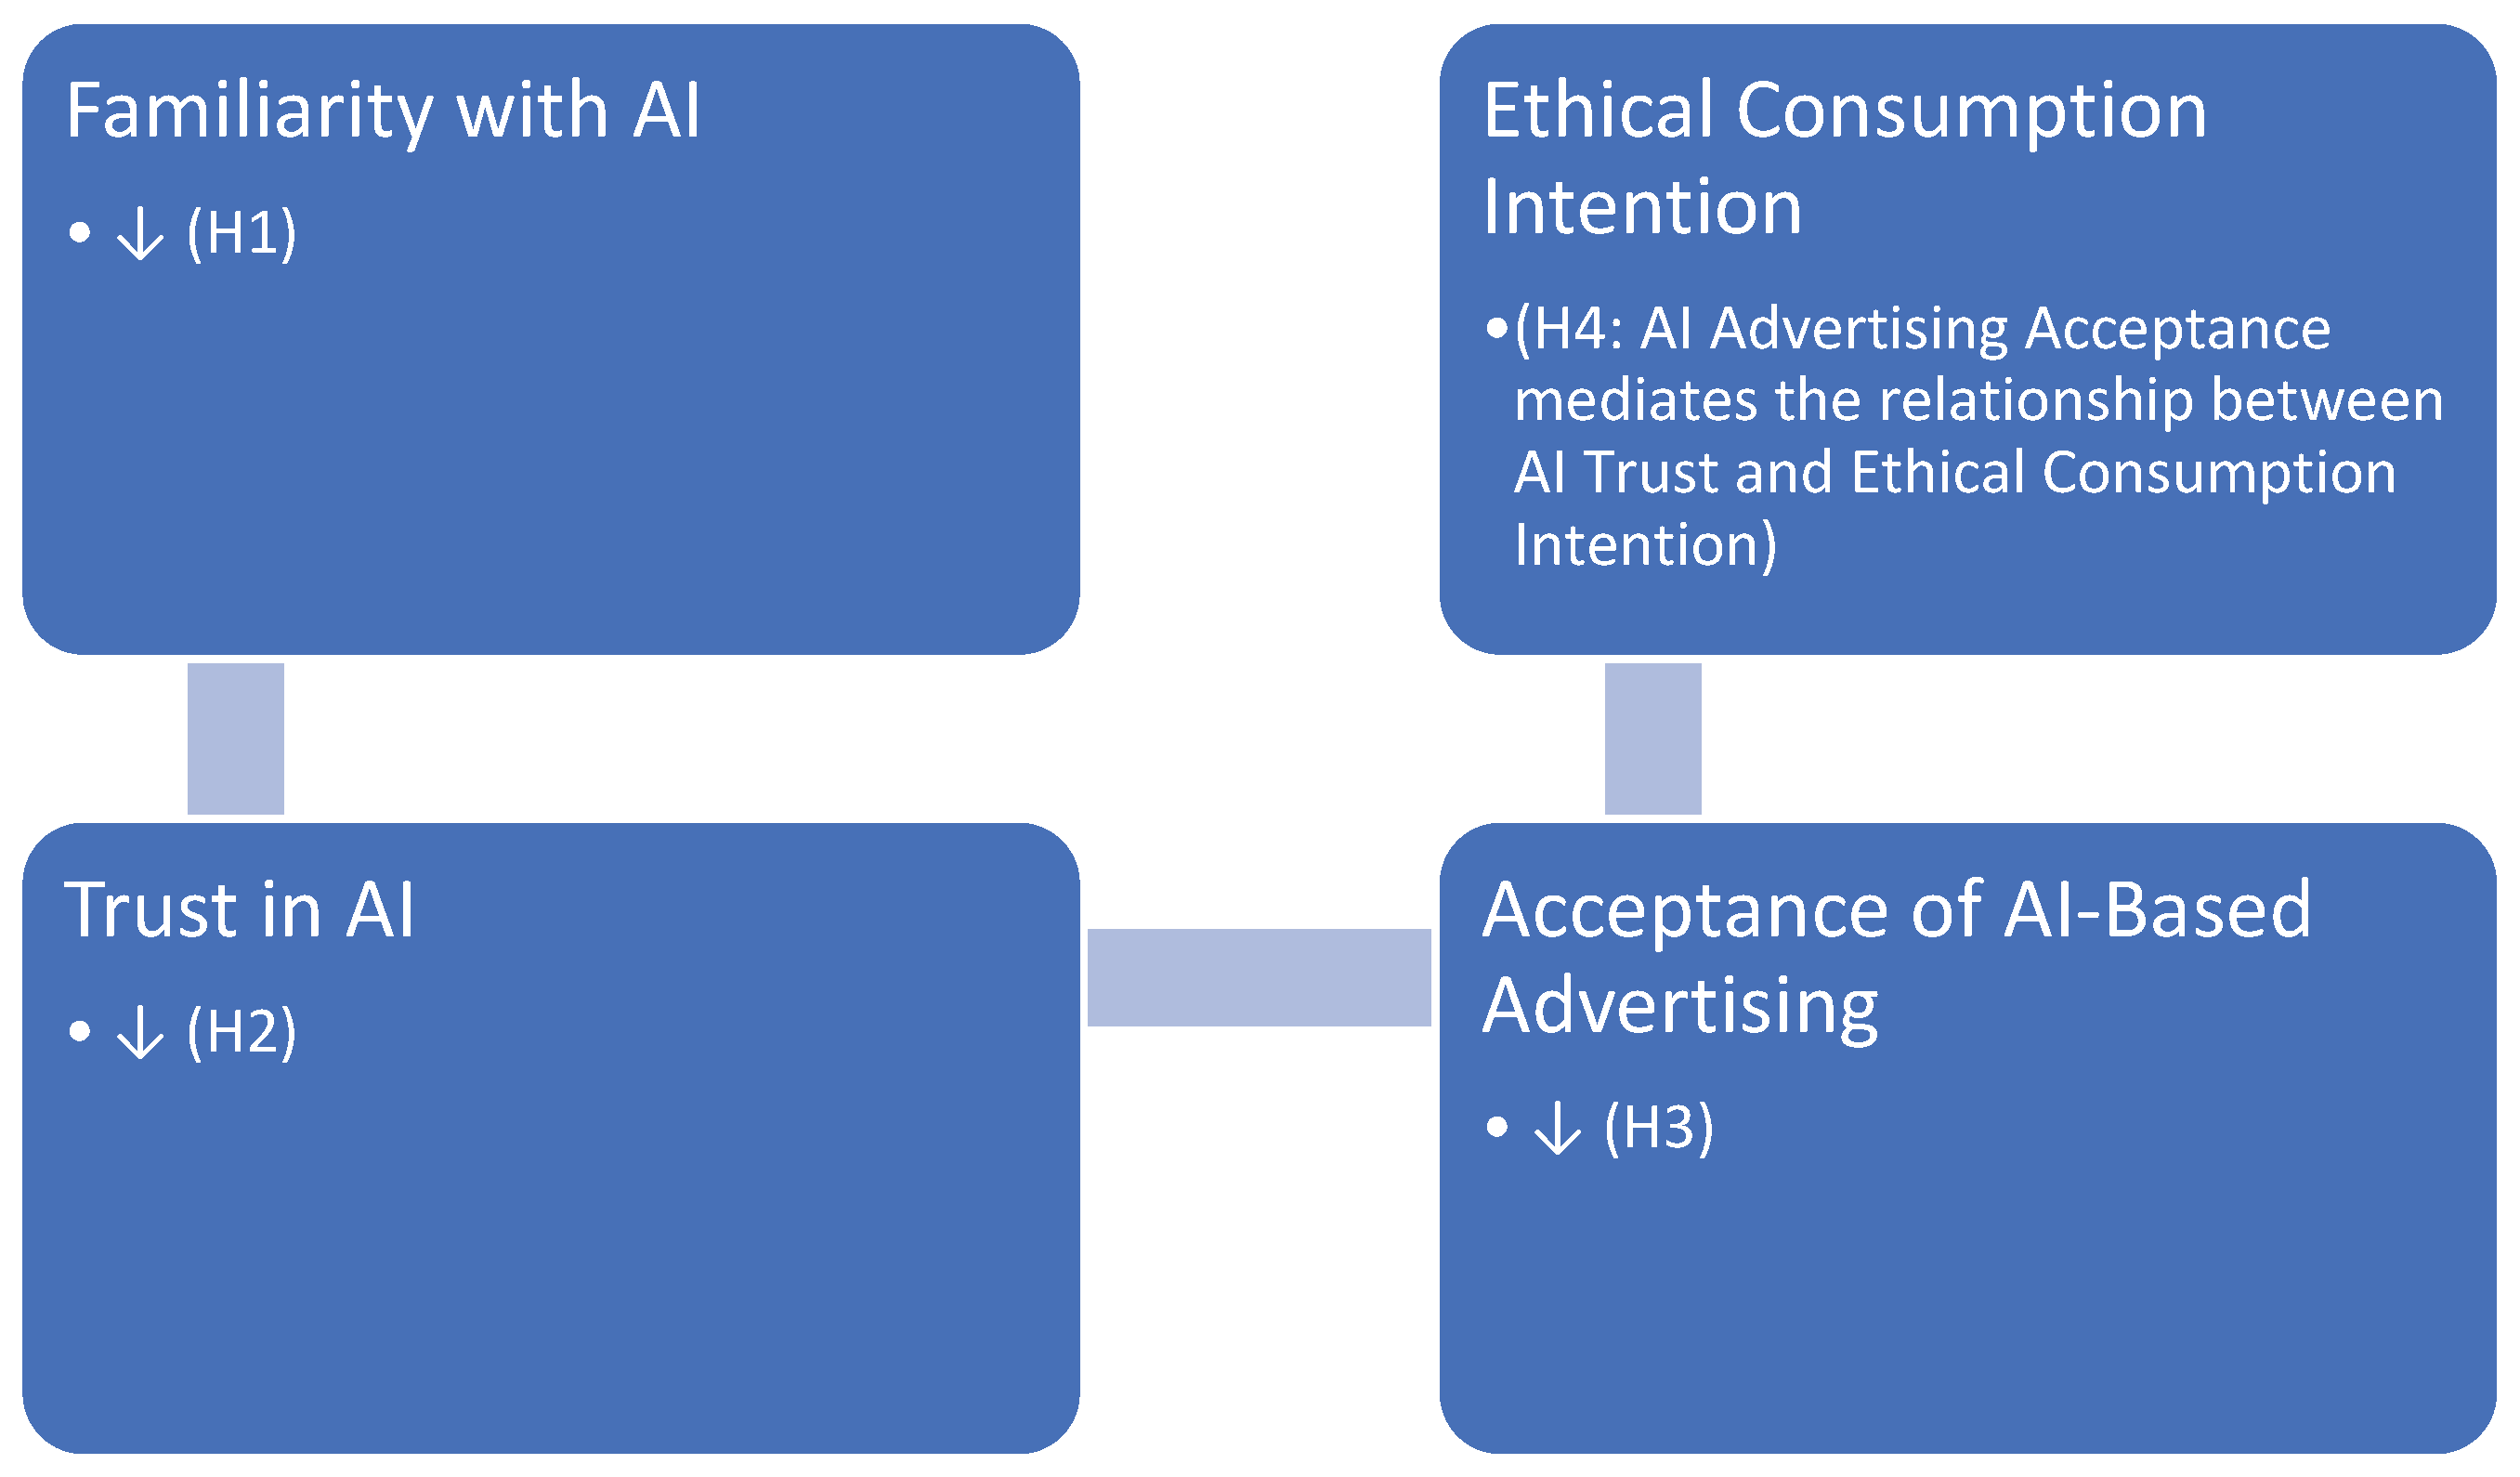
In summary, the proposed framework suggests a sequential pathway linking digital familiarity, trust, and ethical consumption intentions through the acceptance of AI-based advertising. Familiarity with AI fosters trust, which enhances the acceptance of AI-mediated communication and, ultimately, encourages consumers to act according to ethical values in their purchasing decisions. This conceptual model aligns with the empirical design and the regression analyses presented in the Results section, where each stage (H1–H4) corresponds to a specific statistical model testing these theoretical links. Figure 1 illustrates the proposed conceptual model and the hypothesized relationships (H1–H4). Familiarity with AI influences trust, which subsequently affects the acceptance of AI-based advertising and consumers’ ethical consumption intentions. Acceptance of AI-based advertising acts as a mediating variable linking trust in AI to ethical consumption.
3. Results
This section may be divided by subheadings. It should provide a concise and precise description of the experimental results, their interpretation, as well as the experimental conclusions that can be drawn.
3.1. Sample and Data Collection
The empirical analysis was based on data collected from Greek adult consumers aged 23 years and above who regularly use the Internet for communication, information seeking, and online purchases. Data gathering took place during the first half of 2025 through a structured online questionnaire created in Google Forms. A convenience sampling method was applied, using social media platforms (Facebook, LinkedIn), university mailing lists, and professional networks to ensure efficient and cost-effective data collection [38,39].
Out of 650 distributed questionnaires, 505 valid responses were retained, corresponding to a response rate of 77.7%. This sample size meets the requirements for multivariate and logistic regression analyses [40] and is consistent with thresholds suggested for consumer-behavior studies employing similar techniques [41,42].
The sample consisted of 55% female and 45% male respondents, with an average age of 36 years. Regarding educational attainment, 28.1% had completed secondary education, 32.5% held a tertiary degree, 33.9% possessed postgraduate qualifications, and 2.8% had doctoral studies. The high share of well-educated and professionally active participants mirrors findings from other digital consumer surveys, which indicate that individuals with higher digital literacy are more likely to participate in online questionnaires [43,44].
In terms of monthly personal income, 28.5% of respondents earned €601–900, 19.4% €901–1200, 21.2% €1201–1500, and 13.9% reported earnings above €1500, while only 7.5% declared less than €600. This distribution suggests that the sample largely represents middle- and higher-income brackets, typical of digitally active consumers [45]. The gender and age proportions were broadly aligned with national census data from the Hellenic Statistical Authority (ELSTAT, 2024), showing no substantial deviations from the population structure [46].
A potential bias toward digitally literate users is acknowledged due to the online nature of data collection. Nevertheless, the heterogeneity of demographic characteristics and the adequate sample size ensure robust representativeness for analyzing relationships between AI trust, advertising acceptance, and ethical consumer intentions. Internal reliability was confirmed through Cronbach’s alpha coefficients ranging from 0.800 to 0.819, indicating satisfactory internal consistency across the composite variables [47,48].

Table 1.
Demographic characteristics of the sample (N = 505).
| Variable | Category | % |
|---|---|---|
| Gender | Female | 55.0 |
| Male | 45.0 | |
| Mean Age | 36 years | — |
| Education | Primary education | 2.8 |
| Secondary education | 28.1 | |
| Tertiary education | 32.5 | |
| Postgraduate studies | 33.9 | |
| Doctorate | 2.8 | |
| Monthly Income (€) | 0–600 | 7.5 |
| 601–900 | 28.5 | |
| 901–1200 | 19.4 | |
| 1201–1500 | 21.2 | |
| >1500 | 13.9 |
3.2. Reliability Analysis
To assess the internal consistency and reliability of the measurement constructs, Cronbach’s alpha coefficients were computed for each composite variable included in the analysis. Reliability coefficients above the threshold of 0.70, as proposed by Nunnally and Bernstein, are generally considered satisfactory for behavioral and marketing research [49].
The first construct, AI Exposure Use, comprised three items capturing participants’ interaction with AI-based tools—such as chatbots, recommendation engines, and AI applications in professional or everyday contexts. The obtained Cronbach’s alpha value of 0.819 indicates high internal consistency, suggesting that the items reliably reflect a common underlying dimension representing consumers’ familiarity with AI technologies.
The second construct, AI Trust and Ethics, consisted of two items measuring perceived trust and ethical evaluation of AI systems. The resulting Cronbach’s alpha of 0.800 also demonstrates acceptable reliability, confirming that perceptions of technological trustworthiness and moral integrity form closely related dimensions of the same latent concept. Similar reliability levels have been reported in prior studies examining consumer trust and ethical attitudes toward algorithmic and AI-mediated systems [49,58].
Overall, both indices of Cronbach’s alpha confirm that the measurement instruments exhibit adequate psychometric robustness, supporting reliable interpretation of the regression analyses and hypothesis testing presented in the subsequent sections. Internal consistency was further verified through item–total correlations, all of which exceeded 0.50, consistent with the recommended thresholds for construct reliability in behavioral and marketing research [50,51].
Table 2.
Reliability Statistics for Key Constructs.
| Construct | Items | Cronbach’s α | Interpretation |
|---|---|---|---|
| AI Exposure Use | 3 | 0.819 | High reliability |
| AI Trust and Ethics | 2 | 0.800 | Acceptable reliability |
3.3. Validity Analysis
To assess the construct validity of the variables related to consumers’ trust and familiarity with artificial intelligence (AI_TrustEthics and AI_ExposureUse), a Principal Component Analysis (PCA) was performed. The analysis aimed to examine whether these variables represent a single conceptual dimension associated with consumers’ ethical and cognitive evaluations of AI-based systems.
The results indicated that the Kaiser–Meyer–Olkin (KMO) measure of sampling adequacy was 0.500, which is considered marginally acceptable for analyses involving a limited number of variables, particularly when the objective is to explore their conceptual association rather than conduct a full-scale factor model [76]. The Bartlett’s Test of Sphericity was statistically significant (χ2 = 150.066, df = 1, p < 0.001), confirming that the variables were sufficiently correlated to justify the application of PCA.
The Communalities values for both variables were 0.754, and the extracted component explained 75.4% of the total variance, indicating strong convergent validity and suggesting that the two measures capture the same underlying concept. The factor loadings (0.868 and 0.868) further support the existence of a unified construct that represents consumers’ trust and familiarity with AI technologies. Overall, these results confirm the internal coherence and conceptual convergence of the two indicators, in line with methodological recommendations for small-scale factor analyses in behavioral and marketing research [52,53].
3.4. Hierarchical Regression Analysis on Trust in Artificial Intelligence (AI_TrustEthics)
To examine the determinants of consumers’ trust in artificial intelligence (AI) and its ethical dimensions, a hierarchical multiple regression analysis was conducted in three steps.
In Model 1, demographic variables were entered (age, gender, marital status, low income, and job responsibility). The model was statistically significant, F(5, 499) = 51.45, p < 0.001, explaining 33.4% of the variance in AI trust (Adjusted R2 = 0.334). Age (β = –0.337, p < 0.001), gender (β = 0.187, p < 0.001), marital status (β = –0.174, p < 0.001), and low income (β = –0.306, p < 0.001) were significant predictors, while job responsibility had a marginal effect (β = –0.077, p = 0.035). Younger, male, unmarried, and higher-income respondents exhibited greater trust in AI systems.
In Model 2, attitudinal and value-based predictors were added, including considers_env_criteria, bought_for_self_identity, ethical_origin_influence, consumption_identity, and willing_pay_more_for_green. The model improved slightly, ΔR2 = 0.025, F(10, 494) = 29.20, p < 0.001. Willingness to pay more for green products (β = 0.115, p = 0.002) and ethical origin influence (β = 0.087, p = 0.011) had positive effects, indicating that consumers valuing ethical and sustainable production show higher trust in AI technologies.
In Model 3, digital behavior indicators (Omnichannel and AI_ExposureUse) were entered. The final model explained 51.4% of the variance (Adjusted R2 = 0.514, F(12, 492) = 45.44, p < 0.001), representing a substantial increase (ΔR2 = 0.155). AI_ExposureUse was the strongest predictor (β = 0.415, p < 0.001), followed by Omnichannel behavior (β = 0.115, p = 0.004). Thus, greater exposure and familiarity with AI correlate with stronger ethical trust in AI systems.
Overall, the hierarchical model suggests that demographic variables explain initial variance in AI trust, while direct experience and interaction with AI technologies play a decisive role in shaping consumer confidence toward ethically reliable AI practices.
Table 3.
Hierarchical Regression Predicting Trust in Artificial Intelligence (AI_TrustEthics).
| Model | Predictors Entered | Adjusted R2 | ΔR2 | F | Sig. | Significant Standardized β (p < .05) |
|---|---|---|---|---|---|---|
| 1 | Age, Gender, Married, Low_Income, Job_Responsibility | .334 | – | 51.45 | .000 | Age (–.337), Gender (.187), Married (–.174), Low_Income (–.306) |
| 2 | + Considers_Env_Criteria, Bought_for_Self_Identity, Ethical_Origin_Influence, Consumption_Identity, Willing_Pay_More_for_Green | .359 | .025 | 29.20 | .000 | Willing_Pay_More_for_Green (.115), Ethical_Origin_Influence (.087) |
| 3 | + Omnichannel, AI_ExposureUse | .514 | .155 | 45.44 | .000 | AI_ExposureUse (.415), Omnichannel (.115) |
Note: Dependent Variable = AI_TrustEthics. All predictors entered using the Enter method.
3.5. Logistic Regression Analysis: Acceptance of AI-Based Advertising
To investigate the determinants of consumers’ acceptance of AI-based advertising, a two-step binary logistic regression analysis was conducted.
In Model 1, demographic and socioeconomic variables were included (age, gender, education, job responsibility, income satisfaction, and marital status).
In Model 2, the variable AI_TrustEthics—representing consumers’ trust and ethical perceptions of artificial intelligence—was added to evaluate its additional explanatory effect.
The Omnibus Tests of Model Coefficients confirmed that both models were statistically significant (Model 1: χ2 = 110.904, df = 6, p < 0.001; Model 2: χ2 = 179.058, df = 7, p < 0.001), indicating an overall good fit.
The Nagelkerke R2 increased from 0.300 in Model 1 to 0.454 in Model 2, showing that the inclusion of AI_TrustEthics substantially improved the model’s explanatory power, accounting for approximately 45% of the variance in the likelihood of accepting AI-driven advertisements.
The model’s classification accuracy also improved from 82.6% to 84.2% between the two stages, demonstrating satisfactory predictive performance.
According to the regression coefficients, age (B = –0.066, p < 0.001), job responsibility (B = –1.234, p < 0.001), and marital status (B = 0.639, p = 0.042) were significant predictors.
In addition, income satisfaction (B = 0.743, p < 0.001) and education (B = 0.897, p = 0.008) positively influenced the probability of acceptance.
Most notably, AI_TrustEthics had a strong and positive effect (B = 2.477, Exp(B) = 11.904, p < 0.001), indicating that consumers with higher trust and more favorable ethical attitudes toward AI are roughly twelve times more likely to accept AI-based advertising compared to those with lower trust.
Although the Hosmer–Lemeshow test yielded a significant result (p < 0.05), suggesting minor deviations from perfect fit, the overall predictive capacity and classification accuracy remain high, confirming the robustness of the model.
Table 4.
Logistic Regression Predicting Acceptance of AI-Based Advertising.
| Predictor | B | S.E. | Wald | p | Exp(B) | 95% C.I. for Exp(B) |
|---|---|---|---|---|---|---|
| Age | –0.066 | 0.018 | 13.09 | <0.001 | 0.936 | 0.904–0.970 |
| Gender | 0.293 | 0.305 | 0.92 | 0.337 | 1.34 | 0.73–2.44 |
| Education (Master) | 0.897 | 0.336 | 7.14 | 0.008 | 2.45 | 1.27–4.73 |
| Job Responsibility | –1.234 | 0.283 | 19.02 | <0.001 | 0.291 | 0.17–0.51 |
| Income Satisfaction | 0.743 | 0.113 | 43.47 | <0.001 | 2.10 | 1.69–2.62 |
| Married | 0.639 | 0.315 | 4.13 | 0.042 | 1.89 | 1.03–3.51 |
| AI_TrustEthics | 2.477 | 0.349 | 50.26 | <0.001 | 11.90 | 6.00–23.61 |
| Constant | –2.868 | 0.722 | 15.78 | 0.001 | 0.057 | — |
Dependent variable = Acceptance of AI-Based Advertising. Method = Enter.
Socioeconomic factors—particularly income satisfaction, education, and marital status—positively influence the likelihood of accepting AI-based advertising, whereas age and job responsibility have negative effects.
However, trust and ethical perception of AI emerged as the strongest determinant, confirming that higher moral confidence in artificial intelligence substantially increases consumers’ readiness to engage with AI-driven marketing initiatives.
3.6. Logistic Regression Analysis: Ethical Purchase Behavior
To explore the determinants of consumers’ ethical purchasing behavior, a binary logistic regression was conducted. The dependent variable (Ethical Purchase) represents whether consumers avoid products associated with unethical practices or, conversely, prefer companies perceived as socially and environmentally responsible.
Twelve predictors were included in the model: age, gender, education, number of children, income, ethical origin influence, consumption identity, shopping satisfaction stress, preference for online shopping, AI_TrustEthics, willingness to pay more for green products, and showrooming behavior.
The model was statistically significant (χ2 = 214.105, df = 12, p < 0.001), indicating a good overall fit. The Nagelkerke R2 = 0.508 suggests that approximately 50.8% of the variance in ethical purchasing is explained by the included predictors. The model achieved a classification accuracy of 83.8%, reflecting strong predictive performance.
Among the predictors, several factors were statistically significant. Age (B = 0.108, p < 0.001) and income (B = 0.321, p = 0.002) positively influenced ethical consumption, indicating that older and financially secure consumers are more aware of ethical aspects in their purchase choices. Having children (B = 2.134, p < 0.001, Exp(B) = 8.45) was one of the strongest positive predictors, suggesting that family responsibilities enhance consumers’ social and environmental awareness.
Trust in AI and ethical perceptions (AI_TrustEthics) had a strong positive effect (B = 2.824, p < 0.001, Exp(B) = 16.84), meaning that individuals with greater moral confidence in AI are far more likely to make ethically driven purchase decisions. Likewise, preference for online shopping (B = 2.667, p < 0.001) and willingness to pay more for green products (B = 0.554, p = 0.039) positively affected ethical behavior, linking digital familiarity and sustainability awareness to moral decision-making.
Conversely, gender (B = –1.044, p = 0.007) and shopping satisfaction stress (B = –0.926, p = 0.003) negatively affected ethical consumption, suggesting that women and consumers who experience stress or dissatisfaction while shopping are less likely to prioritize ethical criteria. Education (B = –3.296, p < 0.001) and showrooming behavior (B = –2.716, p < 0.001) also had negative coefficients, implying that higher educational attainment or emphasis on price comparison may diminish ethical sensitivity.
Overall, the model shows that ethical consumption is driven by a combination of demographic, attitudinal, and behavioral factors. Consumers with higher trust in AI, stronger sustainability values, and active online engagement are significantly more likely to integrate ethical considerations into their purchasing decisions.
Table 5.
Logistic Regression Predicting Ethical Purchase Behavior.
| Predictor | B | S.E. | Wald | p | Exp(B) | 95% C.I. for Exp(B) |
|---|---|---|---|---|---|---|
| Age | 0.108 | 0.019 | 33.08 | <0.001 | 1.11 | 1.07–1.15 |
| Gender | –1.044 | 0.389 | 7.20 | 0.007 | 0.35 | 0.17–0.76 |
| Education (Master’s) | –3.296 | 0.442 | 55.62 | <0.001 | 0.04 | 0.02–0.09 |
| Children | 2.134 | 0.392 | 29.65 | <0.001 | 8.45 | 3.94–18.12 |
| Income | 0.321 | 0.104 | 9.58 | 0.002 | 1.38 | 1.12–1.69 |
| Ethical Origin Influence | 0.382 | 0.269 | 2.02 | 0.155 | 1.47 | 0.87–2.49 |
| Consumption Identity | 0.316 | 0.114 | 7.73 | 0.005 | 1.37 | 1.10–1.71 |
| Shopping Satisfaction Stress | –0.926 | 0.312 | 8.83 | 0.003 | 0.40 | 0.22–0.74 |
| Prefer Online Shopping | 2.667 | 0.438 | 37.09 | <0.001 | 14.40 | 6.53–31.73 |
| AI_TrustEthics | 2.824 | 0.478 | 34.95 | <0.001 | 16.84 | 6.86–41.28 |
| Willing to Pay More for Green | 0.554 | 0.269 | 4.24 | 0.039 | 1.74 | 1.03–2.95 |
| Showrooming Behavior | –2.716 | 0.425 | 40.81 | <0.001 | 0.07 | 0.03–0.15 |
| Constant | –7.841 | 1.076 | 53.14 | <0.001 | — | — |
Dependent variable = Ethical Purchase Behavior. Method = Enter.
3.5. Summary of Results
Table 6 presents a summary of the main empirical findings from the regression analyses, linking the statistical results to the hypotheses proposed in the conceptual framework (Figure 1). Overall, the results provide strong support for the theoretical model, indicating that consumers’ familiarity with and trust in artificial intelligence (AI) play a decisive role in shaping their acceptance of AI-based advertising and their intention to engage in ethical consumption.
H1 was supported: hierarchical regression analysis confirmed that familiarity with AI technologies (AI_ExposureUse) significantly and positively influenced consumers’ trust and ethical perceptions of AI (β = 0.415, p < 0.001).
H2 was supported: trust in AI had a strong positive effect on the likelihood of accepting AI-based advertising (B = 2.477, Exp(B) = 11.90, p < 0.001).
H3 was also supported: acceptance of AI-based advertising increased the probability of ethical purchasing (B = 2.824, Exp(B) = 16.84, p < 0.001).
H4 was confirmed through the sequential pattern of results, suggesting that acceptance of AI-based advertising mediates the relationship between trust in AI and ethical consumption intentions.
These findings underscore the importance of ethical confidence and digital familiarity as drivers of sustainable consumer behavior in the digital era. Consumers who perceive AI systems as transparent, fair, and socially responsible are more receptive to AI-driven marketing and more likely to integrate ethical considerations into their purchasing decisions.
Table 6.
Summary of Hypotheses and Empirical Findings.
| Hypothesis | Relationship Tested | Result | Support |
|---|---|---|---|
| H1 | Familiarity (AI_ExposureUse) → Trust in AI (AI_TrustEthics) | β = 0.415, p < 0.001 | Supported |
| H2 | Trust in AI → Acceptance of AI-Based Advertising | B = 2.477, Exp(B) = 11.90, p < 0.001 | Supported |
| H3 | Acceptance of AI-Based Advertising → Ethical Purchase Behavior | B = 2.824, Exp(B) = 16.84, p < 0.001 | Supported |
| H4 | Mediating role of AI Advertising Acceptance between AI Trust and Ethical Consumption | Sequential regression pattern consistent with mediation | Supported |
4. Discussion
Building upon the empirical results summarized in Section 3.5, this section discusses how consumers’ familiarity with, and trust in, artificial intelligence (AI) influence their acceptance of AI-based advertising and their ethical consumption behavior. The findings are interpreted in light of existing theories on trust, digital engagement, and ethical consumer decision-making, highlighting both theoretical insights and practical implications.
The analyses confirmed that familiarity with AI technologies enhances consumers’ trust and ethical confidence toward AI systems. This result supports earlier studies showing that repeated interaction with AI-based tools reduces uncertainty and increases perceived reliability [18,27]. Consumers who actively engage with chatbots, recommendation engines, or automated digital services appear to form stronger perceptions of competence and fairness in technology. This aligns with the “trust learning” mechanism proposed by Gefen and Pavlou [13], whereby familiarity encourages affective and cognitive trust in digital environments. Beyond technical acceptance, this study extends the discussion by emphasizing that familiarity also fosters ethical acceptance — a dimension that previous technology adoption models such as TAM and UTAUT often overlook [28].
Furthermore, trust in AI emerged as a key predictor of consumers’ acceptance of AI-driven advertising. This finding is consistent with prior evidence suggesting that perceived transparency, fairness, and benevolence enhance consumers’ willingness to engage with algorithmic marketing [5,9]. When consumers believe that AI-based recommendations are ethically designed and socially responsible, they attribute higher credibility both to the message and the sponsoring firm. These results resonate with Boerman et al. [14], who noted that transparency and perceived control mitigate privacy concerns and improve attitudes toward personalized advertising. Therefore, in line with Kim et al. [92], this study reinforces the idea that moral trust in AI is essential for consumer openness to automated communication.
The results also revealed that acceptance of AI-based advertising positively influences ethical consumption intentions. This relationship reflects the “ethical spillover effect,” in which positive moral perceptions of corporate practices in one domain extend to broader evaluations of brand integrity [7]. When AI-mediated advertising is viewed as transparent and accountable, consumers generalize these moral cues to the company, perceiving it as an ethical actor. This interpretation aligns with Brown and Dacin [12], who showed that positive corporate associations significantly shape product evaluations and consumer loyalty. Hence, ethical engagement with AI marketing can foster more responsible consumer choices, reinforcing the link between digital trust and sustainable behavior.
The sequential regression results also supported the mediating role of AI advertising acceptance between trust in AI and ethical consumption. Acceptance operates as a behavioral bridge, translating moral confidence in technology into concrete responsible purchasing. This dynamic relationship complements previous findings that acceptance of digital tools mediates the effects of trust and perceived usefulness on behavioral intentions [8]. In this context, acceptance of AI-driven advertising does not merely reflect technological approval but also moral alignment with perceived corporate responsibility. Such findings contribute to the emerging discussion on responsible AI and ethical marketing, suggesting that transparent and explainable AI can promote—not undermine—ethical consumer behavior [6,19].
From a theoretical standpoint, this study contributes to the literature by integrating ethical and technological perspectives within a single behavioral model. It demonstrates that moral trust acts simultaneously as a cognitive and ethical antecedent of digital acceptance, bridging the gap between technology adoption and sustainability-oriented marketing research. These results expand the scope of AI trust models, revealing that consumers evaluate technologies not only based on efficiency but also according to their social and ethical implications.
From a managerial perspective, the findings underscore the importance of transparency, fairness, and explainability in the deployment of AI systems. Companies using AI in marketing should clearly communicate how algorithms process data, protect privacy, and align with ethical principles. This aligns with recommendations for responsible AI governance, which emphasize openness and accountability as critical to consumer trust [98]. By embedding ethical standards into AI communication, firms can enhance credibility, improve consumer engagement, and strengthen the long-term relationship between technology and social responsibility. In practical terms, fostering ethical confidence in AI may become a key differentiator for companies competing in increasingly digital and value-conscious markets.
5. Conclusions
This study explored how consumers’ familiarity with and trust in artificial intelligence (AI) influence their acceptance of AI-based advertising and their ethical purchasing behavior. The findings demonstrate that familiarity and direct interaction with AI tools enhance trust and moral confidence in technology, which, in turn, increase consumers’ willingness to accept AI-mediated marketing and to make socially responsible purchase decisions.
From a theoretical standpoint, the research integrates ethical and technological perspectives into a unified behavioral framework. It extends classical acceptance models such as TAM and UTAUT by introducing ethical trust as a key antecedent of digital engagement. This addition bridges two previously separate areas — technology adoption and sustainable marketing — showing that moral confidence in technology is not peripheral but central to how consumers interact with AI.
The results also contribute to the growing discussion on responsible and transparent AI in marketing. They suggest that algorithmic systems perceived as fair, explainable, and respectful of social values can foster—not hinder—ethical consumer behavior. In this sense, AI-based marketing can become a driver of sustainability when designed and communicated ethically.
Managerially, the study provides clear implications for organizations using AI in marketing and customer communication. Firms should focus on building trust through transparency, offering consumers clear information about how AI tools work, how data are used, and what ethical safeguards are in place. Demonstrating accountability in algorithmic decisions can strengthen brand credibility, improve consumer engagement, and promote loyalty grounded in shared values rather than persuasion alone.
Despite its contributions, this research has some limitations. The data were collected exclusively online and from a Greek sample, which may limit generalizability to other cultural contexts. Future studies could apply comparative or longitudinal designs to test whether these relationships hold across different countries, industries, or technological domains. Additionally, qualitative approaches could explore how consumers personally interpret ethical dimensions of AI marketing, adding depth to the quantitative findings.
In conclusion, this study highlights that ethical trust is the missing link connecting technological familiarity, digital acceptance, and sustainable consumer behavior. By aligning innovation with transparency and moral responsibility, businesses can leverage AI not just as a marketing tool but as a means to promote ethical engagement and contribute to a more responsible digital marketplace.
Author Contributions
Conceptualization, V.M.; methodology, V.M. and P.S.; software, I.A. and K.S.; validation, P.S.; formal analysis, I.A. and K.S.; investigation, V.M.; data curation, I.A. and K.S.; writing—original draft preparation, V.M.; writing—review and editing, V.M. and P.S.; supervision, P.S., K.S., I.A.; project administration, P.S. All authors have read and agreed to the published version of the manuscript.
Funding
This research received no external funding.
Data Availability Statement
The data presented in this study are available from the corresponding author on request. The data are not publicly available due to privacy restrictions.
Acknowledgments
The authors thank all the survey participants for their valuable contributions.
Conflicts of Interest
The authors declare no conflicts of interest.
Appendix A
Appendix A.1
Table A1.
Independent variables used in the regression models.
| Variable | Type | Description |
|---|---|---|
| Age | Continuous | Respondent’s age in years |
| Gender (Male=1, Female=0) | Binary (1=Male, 0=Female) | Respondent’s gender |
| Master (Education) | Binary (1=Master’s degree, 0=Otherwise) | Highest level of education |
| Low income | Binary (1=Yes, 0=Other) | Lowest income group (Household income status) |
| Job responsibility | Binary (1=Yes, 0=Other) | Managerial or supervisory responsibilities |
| Married | Binary (1=Yes, 0=Other) | Married (Marital status) |
| Children | Binary (1=Yes, 0=Other) | Whether respondent has children |
| Consumption identity | Likert scale (1–5) | Extent to which purchases reflect personality and values |
| Showrooming behavior | Binary (1=Yes, 0=Other) | Browsing in-store, purchasing online |
References
- Huang, M.-H.; Rust, R.T. Artificial Intelligence in Service. Journal of Service Research 2018, 21, 155–172. [Google Scholar] [CrossRef]
- Bleier, A.; Eisenbeiss, M. The Importance of Trust for Personalized Online Advertising. Journal of Retailing 2015, 91, 390–409. [Google Scholar] [CrossRef]
- Awad, N.F.; Krishnan, M.S. The Personalization–Privacy Paradox: An Empirical Evaluation of Information Transparency and the Willingness to Be Profiled Online. MIS Quarterly 2006, 30, 13–28. [Google Scholar] [CrossRef]
- Longoni, C.; Bonezzi, A.; Morewedge, C.K. Resistance to Medical Artificial Intelligence. Journal of Consumer Research 2019, 46, 629–650. [Google Scholar] [CrossRef]
- Boerman, S.C.; Kruikemeier, S.; Zuiderveen Borgesius, F.J. Online Behavioral Advertising: A Literature Review and Research Agenda. Journal of Advertising 2017, 46, 363–376. [Google Scholar] [CrossRef]
- Kim, T.; Park, E.; Oh, J.; Lee, Y. Artificial Intelligence in Marketing and Consumer Behavior Research. Foundations and Trends in Marketing 2023, 18, 1–94. [Google Scholar] [CrossRef]
- Brown, T.J.; Dacin, P.A. The Company and the Product: Corporate Associations and Consumer Product Responses. Journal of Marketing 1997, 61, 68–84. [Google Scholar] [CrossRef]
- Hari, H. Exploring Ethical Frontiers of Artificial Intelligence in Marketing. Journal of Business Research 2025, 172, 114271. [Google Scholar] [CrossRef]
- Ozturkcan, S. Responsible AI in Marketing: AI Booing and AI Washing Cycle. Journal of Business Ethics 2025. [CrossRef]
- Mogaji, E. How Generative AI Will Change Consumer Behaviour: Perspectives and Research Agenda. Journal of Consumer Behaviour 2024, 23, 1125–1139. [Google Scholar] [CrossRef]
- Shin, D. The Effects of Explainability and Causability on Perception, Trust, and Acceptance. International Journal of Human-Computer Studies 2021, 146, 102551. [Google Scholar] [CrossRef]
- Gefen, D.; Benbasat, I.; Pavlou, P.A. Trust and Technology Use: A Decade of Empirical Research. MIS Quarterly 2021, 45, 729–756. [Google Scholar] [CrossRef]
- Venkatesh, V.; Morris, M.G.; Davis, G.B.; Davis, F.D. User Acceptance of Information Technology: Toward a Unified View. MIS Quarterly 2003, 27, 425–478. [Google Scholar] [CrossRef]
- Kim, S.; Park, J.; Han, K. Exploring Consumer Acceptance of AI-Generated Advertisements. Sustainability 2023, 15, 108. [Google Scholar] [CrossRef]
- Li, X.; Liu, Y.; Zhao, J. In AI, We Do Not Trust! The Nexus Between Awareness of Falsity in AI-Generated CSR Ads and Online Consumer Responses. Internet Research 2023. [CrossRef]
- Lee, J.Y.; Kim, H.; Park, J. Ethical Perceptions of Artificial Intelligence and Their Influence on Consumer Decision-Making. Computers in Human Behavior 2024, 155, 107348. [Google Scholar] [CrossRef]
- McKnight, D.H.; Chervany, N.L. What Trust Means in E-Commerce Customer Relationships: An Interdisciplinary Conceptual Typology. International Journal of Electronic Commerce 2001, 6, 35–59. [Google Scholar] [CrossRef]
- Gefen, D.; Pavlou, P.A. The Boundaries of Trust and Risk: The Impact of Consumer Awareness of Legal Protections in Online Shopping. International Journal of Electronic Commerce 2012, 16, 31–59. [Google Scholar] [CrossRef]
- Verhoef, P.C.; Broekhuizen, T.; Bart, Y.; Bhattacharya, A.; Qi Dong, J.; Fabian, N.; Haenlein, M. Digital Transformation: A Multidisciplinary Reflection and Research Agenda. Journal of Business Research 2021, 122, 889–901. [Google Scholar] [CrossRef]
- Venkatesh, V.; Davis, F.D. A Theoretical Extension of the Technology Acceptance Model: Four Longitudinal Field Studies. Management Science 2000, 46, 186–204. [Google Scholar] [CrossRef]
- Shin, D. User Perceptions of Trust and Ethical Judgment in AI-Driven Decision Systems. Computers in Human Behavior 2022, 134, 107303. [Google Scholar] [CrossRef]
- Sousa, R.; Amorim, M.; Martins, L.F.; Neves, P. Consumer Trust in Digital Service Interactions: The Moderating Role of Familiarity. Service Industries Journal. [CrossRef]
- . Nyadzayo, M.W.; Matanda, M.J.; Ewing, M.T. The Impact of Ethical Perceptions on Brand Trust and Customer Loyalty. Journal of Business Ethics 2023, 188, 389–405. [Google Scholar] [CrossRef]
- Ashraf, A.R.; Thongpapanl, N.; Spyropoulou, S. The Role of Trust and Familiarity in Technology-Based Services. Journal of Services Marketing 2022, 36, 364–378. [Google Scholar] [CrossRef]
- Venkatesh, V.; Davis, F.D. A Theoretical Extension of the Technology Acceptance Model: Four Longitudinal Field Studies. Management Science 2000, 46, 186–204. [Google Scholar] [CrossRef]
- Mayer, R.C.; Davis, J.H.; Schoorman, F.D. An Integrative Model of Organizational Trust. Academy of Management Review 1995, 20, 709–734. [Google Scholar] [CrossRef]
- Beldad, A.; de Jong, M.; Steehouder, M. How Shall I Trust the Faceless and the Intangible? A Literature Review on the Antecedents of Online Trust. Computers in Human Behavior 2010, 26, 857–869. [Google Scholar] [CrossRef]
- Vitell, S.J.; Muncy, J. Consumer Ethics: An Empirical Investigation of Factors Influencing Ethical Judgment. Journal of Business Ethics 2005, 57, 217–225. [Google Scholar] [CrossRef]
- Singh, J.; Iglesias, O.; Batista-Foguet, J.M. Does Having an Ethical Brand Matter? The Influence of Consumer Perceived Ethicality on Trust, Affect and Loyalty. Journal of Business Ethics 2012, 111, 541–549. [Google Scholar] [CrossRef]
- Luo, X.; Zhang, J.; Fang, Z. The Role of AI and Big Data in Sustainable Consumer Decision-Making. Journal of Business Research 2023, 157, 113648. [Google Scholar] [CrossRef]
- Kim, T.; Park, E.; Oh, J.; Lee, Y. Artificial Intelligence in Marketing and Consumer Behavior Research. Foundations and Trends in Marketing 2023, 18, 1–94. [Google Scholar] [CrossRef]
- Nyadzayo, M.W.; Matanda, M.J.; Ewing, M.T. The Impact of Ethical Perceptions on Brand Trust and Customer Loyalty. Journal of Business Ethics 2023, 188, 389–405. [Google Scholar] [CrossRef]
- Venkatesh, V.; Morris, M.G.; Davis, G.B.; Davis, F.D. User Acceptance of Information Technology: Toward a Unified View. MIS Quarterly 2003, 27, 425–478. [Google Scholar] [CrossRef]
- Shin, D.; Park, Y.J. Role of Fairness and Accountability in Algorithmic Decision-Making: Toward a Consumer-Centered Framework. Computers in Human Behavior 2023, 139, 107557. [Google Scholar] [CrossRef]
- Saunders, M.; Lewis, P.; Thornhill, A. Research Methods for Business Students, 8th ed.; Pearson: London, 2019. [Google Scholar]
- Etikan, I. Comparison of Convenience and Purposive Sampling. American Journal of Theoretical and Applied Statistics 2023, 12, 45–52. [Google Scholar] [CrossRef]
- Green, S.B. How Many Subjects Does It Take To Do a Regression Analysis? Multivariate Behavioral Research 1991, 26, 499–510. [Google Scholar] [CrossRef]
- Hair, J.F.; Black, W.C.; Babin, B.J.; Anderson, R.E. Multivariate Data Analysis, 8th ed.; Cengage Learning: Boston, 2021. [Google Scholar]
- Kline, R.B. Principles and Practice of Structural Equation Modeling, 5th ed.; Guilford Press: New York, 2023. [Google Scholar]
- Kaur, A.; Kaur, P. Online Survey Research in the Digital Era: Bias and Validity Issues. Journal of Contemporary Research in Social Sciences 2022, 4, 45–58. [Google Scholar]
- Bryman, A. Social Research Methods, 6th ed.; Oxford University Press: Oxford, 2021. [Google Scholar]
- Lissitsa, S.; Kol, O. Generation X vs. Generation Y: Attitudes Toward the Use of Digital Technologies in Marketing Communication. Telematics and Informatics 2022, 71, 101851. [Google Scholar] [CrossRef]
- Hellenic Statistical Authority (ELSTAT). Demographic Data of the Greek Population 2024; ELSTAT: Athens, 2024. [Google Scholar]
- Nunnally, J.C.; Bernstein, I.H. Psychometric Theory, 3rd ed.; McGraw-Hill: New York, 1994. [Google Scholar]
- Tavakol, M.; Dennick, R. Making Sense of Cronbach’s Alpha. International Journal of Medical Education 2020, 11, 1–6. [Google Scholar] [CrossRef]
- Boateng, G.O.; Neilands, T.B.; Frongillo, E.A.; Melgar-Quiñonez, H.R.; Young, S.L. Best Practices for Developing and Validating Scales for Health, Social, and Behavioral Research: A Primer. Frontiers in Public Health 2022, 10, 829198. [Google Scholar] [CrossRef]
- Kline, R.B. Principles and Practice of Structural Equation Modeling, 5th ed.; Guilford Press: New York, 2023. [Google Scholar]
- Boateng, G.O.; Neilands, T.B.; Frongillo, E.A.; Melgar-Quiñonez, H.R.; Young, S.L. Best Practices for Developing and Validating Scales for Health, Social, and Behavioral Research: A Primer. Frontiers in Public Health 2022, 10, 829198. [Google Scholar] [CrossRef]
- McKnight, D.H.; Chervany, N.L. What Trust Means in E-Commerce Customer Relationships: An Interdisciplinary Conceptual Typology. International Journal of Electronic Commerce 2001, 6, 35–59. [Google Scholar] [CrossRef]
Disclaimer/Publisher’s Note: The statements, opinions and data contained in all publications are solely those of the individual author(s) and contributor(s) and not of MDPI and/or the editor(s). MDPI and/or the editor(s) disclaim responsibility for any injury to people or property resulting from any ideas, methods, instructions or products referred to in the content. |
© 2025 by the authors. Licensee MDPI, Basel, Switzerland. This article is an open access article distributed under the terms and conditions of the Creative Commons Attribution (CC BY) license (http://creativecommons.org/licenses/by/4.0/).
Copyright: This open access article is published under a Creative Commons CC BY 4.0 license, which permit the free download, distribution, and reuse, provided that the author and preprint are cited in any reuse.


