
Submitted:
28 October 2025
Posted:
29 October 2025
You are already at the latest version
Abstract
Capsicum (Capsicum spp.), commonly known as pepper, is highly sensitive to climate change. It is an important vegetable and spice crop cultivated worldwide for its di-verse uses, including fresh consumption. In Senegal, it plays a crucial role in both household nutrition and income generation. This study aimed to enhance hot pepper agronomic performance through adaptable, high-yielding technologies in the Tambacounda and Sedhiou regions of eastern and southern Senegal. Five treatments were tested: Absolute Control (T1), Farmer Practice (T2), Microdose fertilizer (T3), Micro-dose + Compost (T4), and Microdose + Compost + Mulching (T5). Trials were conduct-ed in 2025 at the Tambacounda Agriculture Research Center (CRAT) and Ziguinchor Agriculture Research Center, Djibelor, under both rainfed and supplemental irrigation systems, using a randomized complete block design with three replications. Results revealed significant treatment and site differences. At CRAT, T5 (Microdose + Compost + Mulching) achieved the highest yield of 31.6 t/ha, while the lowest was 10.1 t/ha. In Djibelor, overall yields were lower, not exceeding 2 t/ha across treatments. The findings demonstrate that integrated fertilization with compost and mulching substantially improves hot pepper productivity, with outcomes strongly dependent on site-specific ecological conditions. Promoting this practice as a bundled package in Tambacounda and similar agroecological zones could enhance yields and strengthen smallholder farmers’ socio-economic resilience amid changing weather.
Keywords:
hot pepper (Capsicum spp.)
; organo-mineral fertilization
; microdosing technology
; rainfed agriculture
; soil fertility management
; smallholder farmers
1. Introduction
Capsicum (Capsicum sp) is a key horticultural crop that plays an important role in the economies of tropical countries. It is one of the most important spice crops widely cultivated around the world for its pungent flavor and aroma[1,2]. Globally, Africa is the third largest hot pepper-producing continent, accounting for approximately 7% of production, after Asia (75%) and the Americas (15%) [3]. Beyond its economic value, pepper is cultivated for diverse uses including food, medicine, cosmetics, and biological pest control [3,4]. In Senegal, pepper is one of the important vegetable and spice crops contributing significantly to farmers’ livelihoods. It is ranked as the most cultivated vegetable during the warm off-season (36.7%) and the second most cultivated during the cold off-season (41.5%) within national horticultural production [5]. Pepper fruits are widely appreciated for their high nutritional value, as they are known as a source of alkaloids, holding various pharmacological properties, and for possessing polyphenols, especially phenolic acids and flavonoids, which reduce the risk of some cancer types and cardiovascular diseases [6,7].
Despite its economic and nutritional importance, pepper production in Senegal faces significant challenges from both natural (abiotic) and biological (biotic) stresses, which are exacerbated by climate change. Abiotic factors include reduced rainfall, rising temperatures, and soil degradation, while biotic factors encompass increased pest and disease outbreaks are among the most critical challenges [3,8,9]. These combined stresses negatively impact pepper plant growth, yield, and quality, threatening the crop’s economic and nutritional importance [10].
Water stress is particularly detrimental during two growth phases: seedling establishment and the pre-flowering stage, both of which can lead to smaller fruits and thus reduced yields [4,11]. High temperatures further increase yield losses by promoting weed infestation and other infestations [3,8]. Irregular rainfall during fruits development enhances the incidence of blossom end rot, while water deficits often lead to flower and fruits abortion [12]. In addition, shifting rainfall patterns contributes to poor harvests in the short term and gradually reduce productivity over time (Bamba Ndiaye et al., 2021). These climatic stresses are further compounded by declining soil fertility and nutrient deficiencies, which remain persistent barrier to achieving high vegetable yields [14].
Climate smart agriculture (CSA) technologies such as drip irrigation and balanced fertilization have been recognized as sustainable solutions for boosting crop productivity, improving farmers’ resilience, and mitigating the impact of climate change. Zewid et al. [14], underscore that effective irrigation is critical for maximizing pepper yields and fruits quality during seasons of rainfall variability. Similarly, other studies [2,13,15,16,17,18]have demonstrated that good agronomic practices (GAPs), particularly proper targeting of the rate and type of fertilizer applied substantially improves pepper production [15]. Nevertheless, adoption of these technologies in Senegal remains limited i.e., in the country the average quantity of fertilizer used has been estimated at 16,4 kg/ha [16], 7% of farming households use irrigation, while only 3.5% practice flood-recession farming [11].
In this context, coupling efficient use of supplemental irrigation and improved fertilizer practices is essential for enhancing crop productivity and strengthening farmers resilience. Trials, demonstration plots, and training sessions on integrated soil fertility and water resources management (ISFM and IWRM) have been implemented to optimize pepper cropping systems. Therefore, this study aims at evaluating the effects of rainfall, supplemental irrigation, and organo-mineral fertilization on the agronomic performance of hot pepper in the southern and eastern semi-arid regions of Senegal.
2. Materials and Methods
2.1. Site Description
The experiment was conducted during the 2023/2024 rainy season (June to October) at two sites in Senegal: Tambacounda and Sedhiou regions. In the 2023/2024 period, the rainy season in both regions, generally began in June and continued through October [19]. Specifically, 2023 had a timely onset for the rainy season in the region, which supported cereal crops, despite some areas experiencing initial dryness. However, in some parts of these regions, early-season dryness affected planting, and a rainfall deficit from mid-August to early September also had an impact before abundant rains helped development later in the season [19] Sedhiou, located in southern part of Senegal, borders the Gambia to the north and Guinea-Bissau to the south. The region covers an area of 7,340 km2 and has a population of approximately 572,101 inhabitants [20]. The climate is characterized by the west African monsoon, with annual rainfall exceeding 800 mm. The region is rich in forests and fruits plantations, and farming is predominantly rainfed, carried out mainly on the highlands.
Tambacounda, the largest region of Senegal, covers 42,364 km2 with a population of about 872,155 people [20,21,22]. The region is situated in the eastern part of the country and shares border with the Gambia and Mali. The region is semi-arid, with an average annual rainfall of 762 mm and traversed by the Gambia and Faleme Rivers which constitute the major sources of irrigation water (Figure 1).
2.2. Experimental Design and Management
Field trials were conducted at two established research stations: Tambacounda Agriculture Research Center (CRAT) in Tambacounda, and Ziguinchor Agriculture Research Center (Djibelor) in Sedhiou (see Figure 1) and in each area, the trial covers 2, 500 m2.
The experimental cultivar was Capsicum Annum L., a locally called yellow hot pepper also known as “jaunefort” valued for its nutritional and aromatic qualities [4,9]. The pepper species was selected due to its local importance and diverse uses in food and income generation [23,24,25]. The experiment was laid in a Randomized Complete Block Design (RCBD) with three replications (blocks). Five treatments were randomly assigned within each block: T1 (AC) Absolute Control (no input applied); T2 (FP) Farmer Practice, involving rigorous application of standard local farming methods (depending on local crop cultivation culture); fertilization was carried out in accordance with the Center of Horticulture (CDH) which belongs to Senegalese Agriculture Research Institute (ISRA) technical recommendations in terms of quantity and operation. The microdose was applied 15 days after transplanting at a rate of 300 kg/ha, or 10.9 g/pocket of NPK (10-10-20) as a base fertilizer on T3: M (microdose); T4: MC (microdose, compost) and T5: MCM (microdose, compost and mulch). compost was applied at 35 days, 55 days and 75 days after transplanting at a rate of 150 kg/ha, or 5.45 g/pocket of NPK. Inter-plot and inter-block spacing were maintained at 1.5 m to minimize edge effects and ensure accessibility for field operations and data collection (Appendix 1).
2.3. Data Collection
To assess climatic impacts, daily weather data were collected from two on-site meteorological station, allowing for accurate measurements of daily rainfall, average day/night temperatures.
The height of capsicum was recorded at 60 days after transplanting (DAT) using a graduated meter ruler. Measurements were taken from ground level to the apex of the last leaf.
The diameter of the capsicum collar was recorded between 30 and 60 DAT using Vanier caliper.
The fruit’s number per plant was computed as the ratio of total harvested fruits and cumulative plants per net plot.
Fruits harvesting was done from commercial maturity at 50% of fruits becoming yellow or reach maturity. Hand picking of mature marketable (healthy) and non-marketable (pest/disease, deformed) infested grades was done for each net plot (4mx3m = 12 m2 ), fruits counted, and fresh weight recorded for the two categories using an electronic scale. The counted fruits were averaged against the harvested plants and yield computed on a per hectare basis. Boundary plants were not assessed to avoid edge-effects.
2.4. Data Analysis
All statistical analyses on weather (rainfall and temperature) and field data were performed Assumptions of normality (Shapiro-Wilk test) and homogeneity of variances (Levene’s test) were checked for all datasets before analysis. A two-way analysis of variance (ANOVA) was used to determine the individual and interactive effects of the two main factors (site and treatment) on all agronomic parameters (height, collar diameter, number of fruit per plant and yield).
The statistical model is: Yijk=μ+αi+βj+(αβ)ij+εijk
Where: Yijk is the observed value; μ is the overall mean; αi is the effect of level i of Factor A (treatments); βj is the effect of level j of Factor B (sites), (αβ)ij is the interaction effect between A and B (treatments and sites) and εijk is the random error term.
When significant differences were detected, Tukey’s Honest Significant Difference (HSD) post-hoc test was applied for mean separation to clearly understand the specific pairwise significance beyond the overall significance. Pearson correlation coefficients among yield component and phenological variables were computed and visualized to quantify the strength and direction of a linear relationship between variables of interest.
3. Results
3.1. Climate Data
Distinct climatic differences were observed between the two study sites. In Djibelor, rainfall peaked in July (381.8 mm) and August (330.4 mm), with no precipitation in October and minimal rain in December (3.6 mm). CRAT exhibited more evenly distributed rainfall from July to October, peaking in September (314 mm) and declining to 157.9 mm in October, with no rainfall in November and December. In contrast to Djibelor, CRAT had completely dry conditions in November and December. Mean monthly temperatures were consistently higher in CRAT (35.6 °C in May, 27.2 °C in December) compared to Djibelor, with a maximum temperature of 31.4 °C in May and a minimum temperature 23.7 °C in December (Table 1 and Figure 2).
3.2. Correlation of Different Phenological Traits
In CRAT, Pearson’s correlation analysis revealed a strong positive association between yield, collars diameters at 30 and 60 days after transplanting, plant height at 60 days after transplanting and number of fruit per plant with respectively r= 0.71, 0.80, 0.70 and 0.93, see Figure 3b. The strongest correlation is noted between number of fruits per plant (NFPP) and the hot pepper yield which are related, NFPP is a yield component parameter. The number of fruits per plant (NFPP) showed a positive correlation with the hot pepper yield (r = 0.93), indicating that NFPP is the most important variable which can drive yield differences Figure 3b.
In Djibelor, the NFPP recorded the lowest correlation with the hot pepper yield with a correlation’s coefficient of r = 0.77, Figure 3a. However, collars diameters at 30 and 60 days after transplanting (CD30DAT and CD60DAT), plant height at 60 days after transplanting (PH60DAT) had the best correlation coefficients with the hot pepper yield of respectively r = 0.83 (CD30DAT and CD60DAT) for both and r = 0.85 (PH60DAT).
3.3. Morphological Parameters Analysis
3.3.1. Plant Height 60 Days After Transplanting (PH60DAT)
Capsicum height varied significantly across the two sites (F-test, p<0.0001; 1.72E-6) and not by treatments (Table 2 and Table 3 and Figure 4). At 60 DAT seedlings gained greater height in CRAT (48.4 cm) than in Djibelor (28 cm; Table 3 and Figure 4). Treatments responses were more consistent in Tambacounda than in Sedhiou, with taller plants under the T5: MCM (Microdose + compost + mulching) treatment and short plants under the absolute control (Table 3 and Figure 4).
3.3.2. Collar Diameter 30 and 60 Days After Transplanting
Collar diameter was significantly affected by site (F-test, p< 0.05; 5.42E-11) and not by treatments or treatment x block interactions (Table 4).
Quantile ranking for CD30DAT between the two sites indicated a clear difference, with Djibelor recording a mean of 4.25 compared to only 0.36 at CRAT (Table 5 and Figure 5). Within Djibelor site, the T5: MCM (Microdose+Compost+Mulching) treatment produced the highest mean collar diameter, exceeding 5 cm, whereas the lowest value was observed under the T1 (AC: Absolute Control) treatment.
The collar diameter at 60 days after transplanting (CD60DAT) followed a similar trend to CD30DAT. No significant differences were observed for other factors; however, the site factor showed a highly significant effect (Table 4). The Turkey’s mean comparison revealed clear variation between the two sites, with Djibelor recording a quantile ranking of 7.1 cm, while CRAT registered only 0.77 cm (Table 5 and Figure 5).
3.4. Yield Components Analysis
3.4.1. Number of Fruits per Plant (NFPP)
The NFPP differed significantly between sites (p = 2.72 × 10⁻⁴) (Table 6), with Djibelor recording a higher mean (19.7 cm) compared to CRAT (10.3; cm Table 7 and Figure 6). At Djibelor, treatments with T3: M (Microdose) and T4: MC (Microdose + Compost) produced the highest NFPP, followed by T5: MCM (Microdose + Compost + Mulching). On the contrary, Farmer Practice and Absolute Control treatment had the lowest yields (See Figure 6). A similar ranking was observed at CRAT, though overall NFPP values were lower.
3.4.2. Hot Pepper Yield (t/ha)
Overall, both factors, treatments (p = 0.028) and sites (p = 8.66 × 10⁻⁷) significantly affected hot pepper yield (Table 8).
Turkey means classifications by sites showed that mean yields was higher at CRAT, 17.8 t/ha than at Djibelor, 1.04 t/ha (See Table 9).
The turkey analysis exhibited that T5: MCM (Microdose + Compost + Mulching) produced the highest mean yield (Table 10 and Figure 7), and Absolute Control had the lowest whatever the location.
At CRAT, mean yields ranged from 31.6 t/ha to 10.1 t/ha, with T4 (18.5 t/ha), T3 (16.3 t/ha), and T2 (12.7t/ha) showing moderate but statistically similar values. At Djibelor, mean yields were uniformly low ranged from 1.67 t/ha to 0.316 t/ha, though T5 still outperformed the other treatments (Table 10 and Figure 7).
4. Discussion
Results showed that environmental and soil health conditions during hot pepper production have a strong influence on the crop’s phenological traits and production potential. The significantly taller plants, the yield observed at Tambacounda (CRAT) compared to Sedhiou (Djibelor) likely reflect more favorable soil fertility and environmental conditions at Tambacounda, which enhanced crop response to nutrient and organic amendments. This result was confirmed by Tesfaw et al.; 2013 [26] who stipulated that hot pepper (Capsicum annum) varieties performance is influenced by nitrogen, phosphorus fertilizer and the nutrient status of the growing environment [26,27].
The consistent superiority of integrated treatments, particularly Microdose + Compost + Mulching, supports evidence that combining mineral and organic inputs improves soil structure, nutrient availability, and moisture retention, thereby promoting vegetative growth of crops. The greater variability and overall lower performance at Sedhiou suggest site-specific limitations, such as poor soil fertility or water-holding capacity, which constrained treatment effectiveness. Different other studies [14,28] have also highlighted the influence of both climatic and soil fertility factors on plant height, fruits number per plant, and yield outcomes in hot pepper cultivation. These findings emphasize the importance of site-specific management and highlight the potential of integrated fertility practices to optimize crop growth under varying conditions. Fruits production and vegetative traits collectively demonstrate the strong influence of site-specific factors on hot pepper performance.
The correlation analysis indicated that all the studied variables are very important for hot pepper yield inducing. However, the number of fruits per plant (NFPP) which is a component parameter of the yield is the most important variable which can drive yield difference during hot pepper cultivation. Sedhiou recorded a higher number of fruits per plant than Tambacounda, suggesting that its microclimatic and soil conditions were more conducive to reproductive development and fruit retention.
Moreover, under our experimental conditions, the primary risk factor leading to disease incidence and yield losses was identified as the climatic and microclimatic conditions mostly in Djibelor with heavy rainfall during flowering times which could explain the low hot pepper yield. However, in CRAT, the regularity of the rainfall could explain the hot pepper yield gain. These results were consistence with the findings of [29,30].
Treatments combining microdosing with compost were particularly effective, reinforcing evidence that targeted nutrient delivery enhances reproductive allocation, while mulching improved soil moisture conservation but did not proportionally increase fruits number, likely due to rainfall variability suppressing flowering and fruits initiation [29,30,31,32].
The consistently poor outcomes under farmer practice selected as control treatments highlight the limitations of low-input systems in nutrient-depleted soils and the critical role of integrated soil fertility management (ISFM ) in sustaining productivity. Collar diameter, a proxy for stem robustness and resource allocation, was greater at Sedhiou despite shorter plants, indicating altered biomass partitioning under wetter conditions where investment in stem thickening may act as a stress adaptation strategy. Together, these findings underscore the complex interactions between environment, soil fertility, and management in shaping plant architecture and yield components, and highlight the need to evaluate multiple phenological traits rather than single metrics such as height or yield alone when assessing crop performance across contrasting environments.
Ultimately, yield outcomes integrated the effects of both vegetative and reproductive responses, with Microdose + Compost + Mulching producing the highest yields irrespective of site. Yields were markedly higher at Tambacounda, where favorable soil and climatic conditions, coupled with lower pest pressure, supported more efficient conversion of nutrient inputs into fruits. In contrast, yields in Sedhiou were constrained by unevenly distributed rainfall [14], pest incidence, and rainfall deficits during flowering and fruit development, which are well-documented yield-limiting stresses in pepper cultivation [26,29,30]. These findings emphasize the complex interaction between improved soil fertility practices and adaptive site-specific management in mitigating environmental and biotic constraints. Moreover, this aligns with broader evidence that genotype × environment × management (G×E×M) interactions are decisive in shaping capsicum productivity.
5. Conclusion
This research demonstrates the effectiveness of climate-smart agricultural practices, particularly fertilizer management, in enhancing hot pepper productivity under both rainfall and supplemental irrigation. Across the AVENIR project sites in Tambacounda and Sedhiou, the integrated application of microdose fertilizer, compost, and mulching (T5: MCM) consistently outperformed other treatments, with yields reaching a mean of 31.6 t/ha in Tambacounda compared to 12.7 t/ha under farmer practice (T2), representing a 148.8% increase. Notably, Tambacounda agroecological conditions favored substantially higher yields than Djibelor (17.8 t/ha vs. 1.04 t/ha, irrespective of treatment). In environments where straw availability is limited, T4 (Microdose + Compost) provides a practical alternative, maintaining yield gains while ensuring soil fertility improvement. These findings underscore the potential of integrated soil fertility management (ISFM) in improving both household income and soil health, thereby contributing to sustainable agricultural intensification. To maximize impact, scaling up T5 (Microdose + Compost + Mulching) and T4 (Microdose + Compost) technologies requires coordinated efforts by extensionists, development agencies, including ANCAR, SDDRs, DRDRs, partners and OLPs, to facilitate widespread adoption among smallholder farmers.
Author Contributions
Conceived and designed the experiments: Latyr Diouf, Michael Kinya, Wilson Nguru, Mwangi Obadiah, P. Kante Nouwodjro, Siagbe Golli, Sophie Thiam, Mbaye Diop and Baboucar Bamba. Performed the experiments: Sophie Thiam, Ndeye Aïda Ndiaye and Baboucar Bamba. Analyzed the data and drafted the manuscript: Latyr Diouf; Richard Magwanga, Michael Kinya, Cyrus Muriithi and Issa Ouedraogo reviewed the manuscript.
Data Availability Statement
The original contributions presented in this study are included in the article. Further inquiries can be directed to the corresponding author.
Acknowledgments
This paper is part of the AVENIR project’s activities (Adaptation and Valori-zation of Entrepreneurship in Irrigated Agriculture) in Tambacounda and Sedhiou Regions of Senegal, funded by Global Affairs Canada (GAC), Project No. P005390 and implemented by International Center for Tropical Agriculture (CIAT) in collaboration with Mennonite Economic Development Associates (MEDA).
Conflicts of Interest
The authors declare no conflicts of interest.
Abbreviations
The following abbreviations are used in this manuscript:
| Acronyms | Descriptions |
| ANCAR | National Agency for Agricultural and Rural Consulting |
| ANOVA | Analysis of Variance |
| ANSD | National Agency for Statistics and Demography |
| AVENIR | Adaptation and Valorization of Entrepreneurship in Irrigated Agriculture |
| CD30DAT | Collar diameter at 30 days after transplanting in centimeter |
| CD60DAT | Collar diameter at 60 days after transplanting in centimeter |
| CIAT | International Center of Tropical Agriculture |
| CRAT | Tambacounda Agriculture Research Center |
| Djibelor | Ziguinchor Agriculture Research Center |
| DRDR | Regional Directorate for Rural Development |
| FAO | Food Agriculture Organization |
| GAC | Global Affairs Canada |
| ISFM | Integrated Soil Fertility Management |
| JOOUST | Jaramogi Oginga Odinga University of Science and Technology |
| MEDA | Mennonite Economic Development Associates |
| NFPP | Number of fruit per plant |
| OLP | Local Producers’ Organization |
| PH60DAT | Plant height at 60 days after transplanting in centimeter |
| RDT | Yield in t/ha |
| SDDR | Departmental Service for Rural Development |
Appendix A
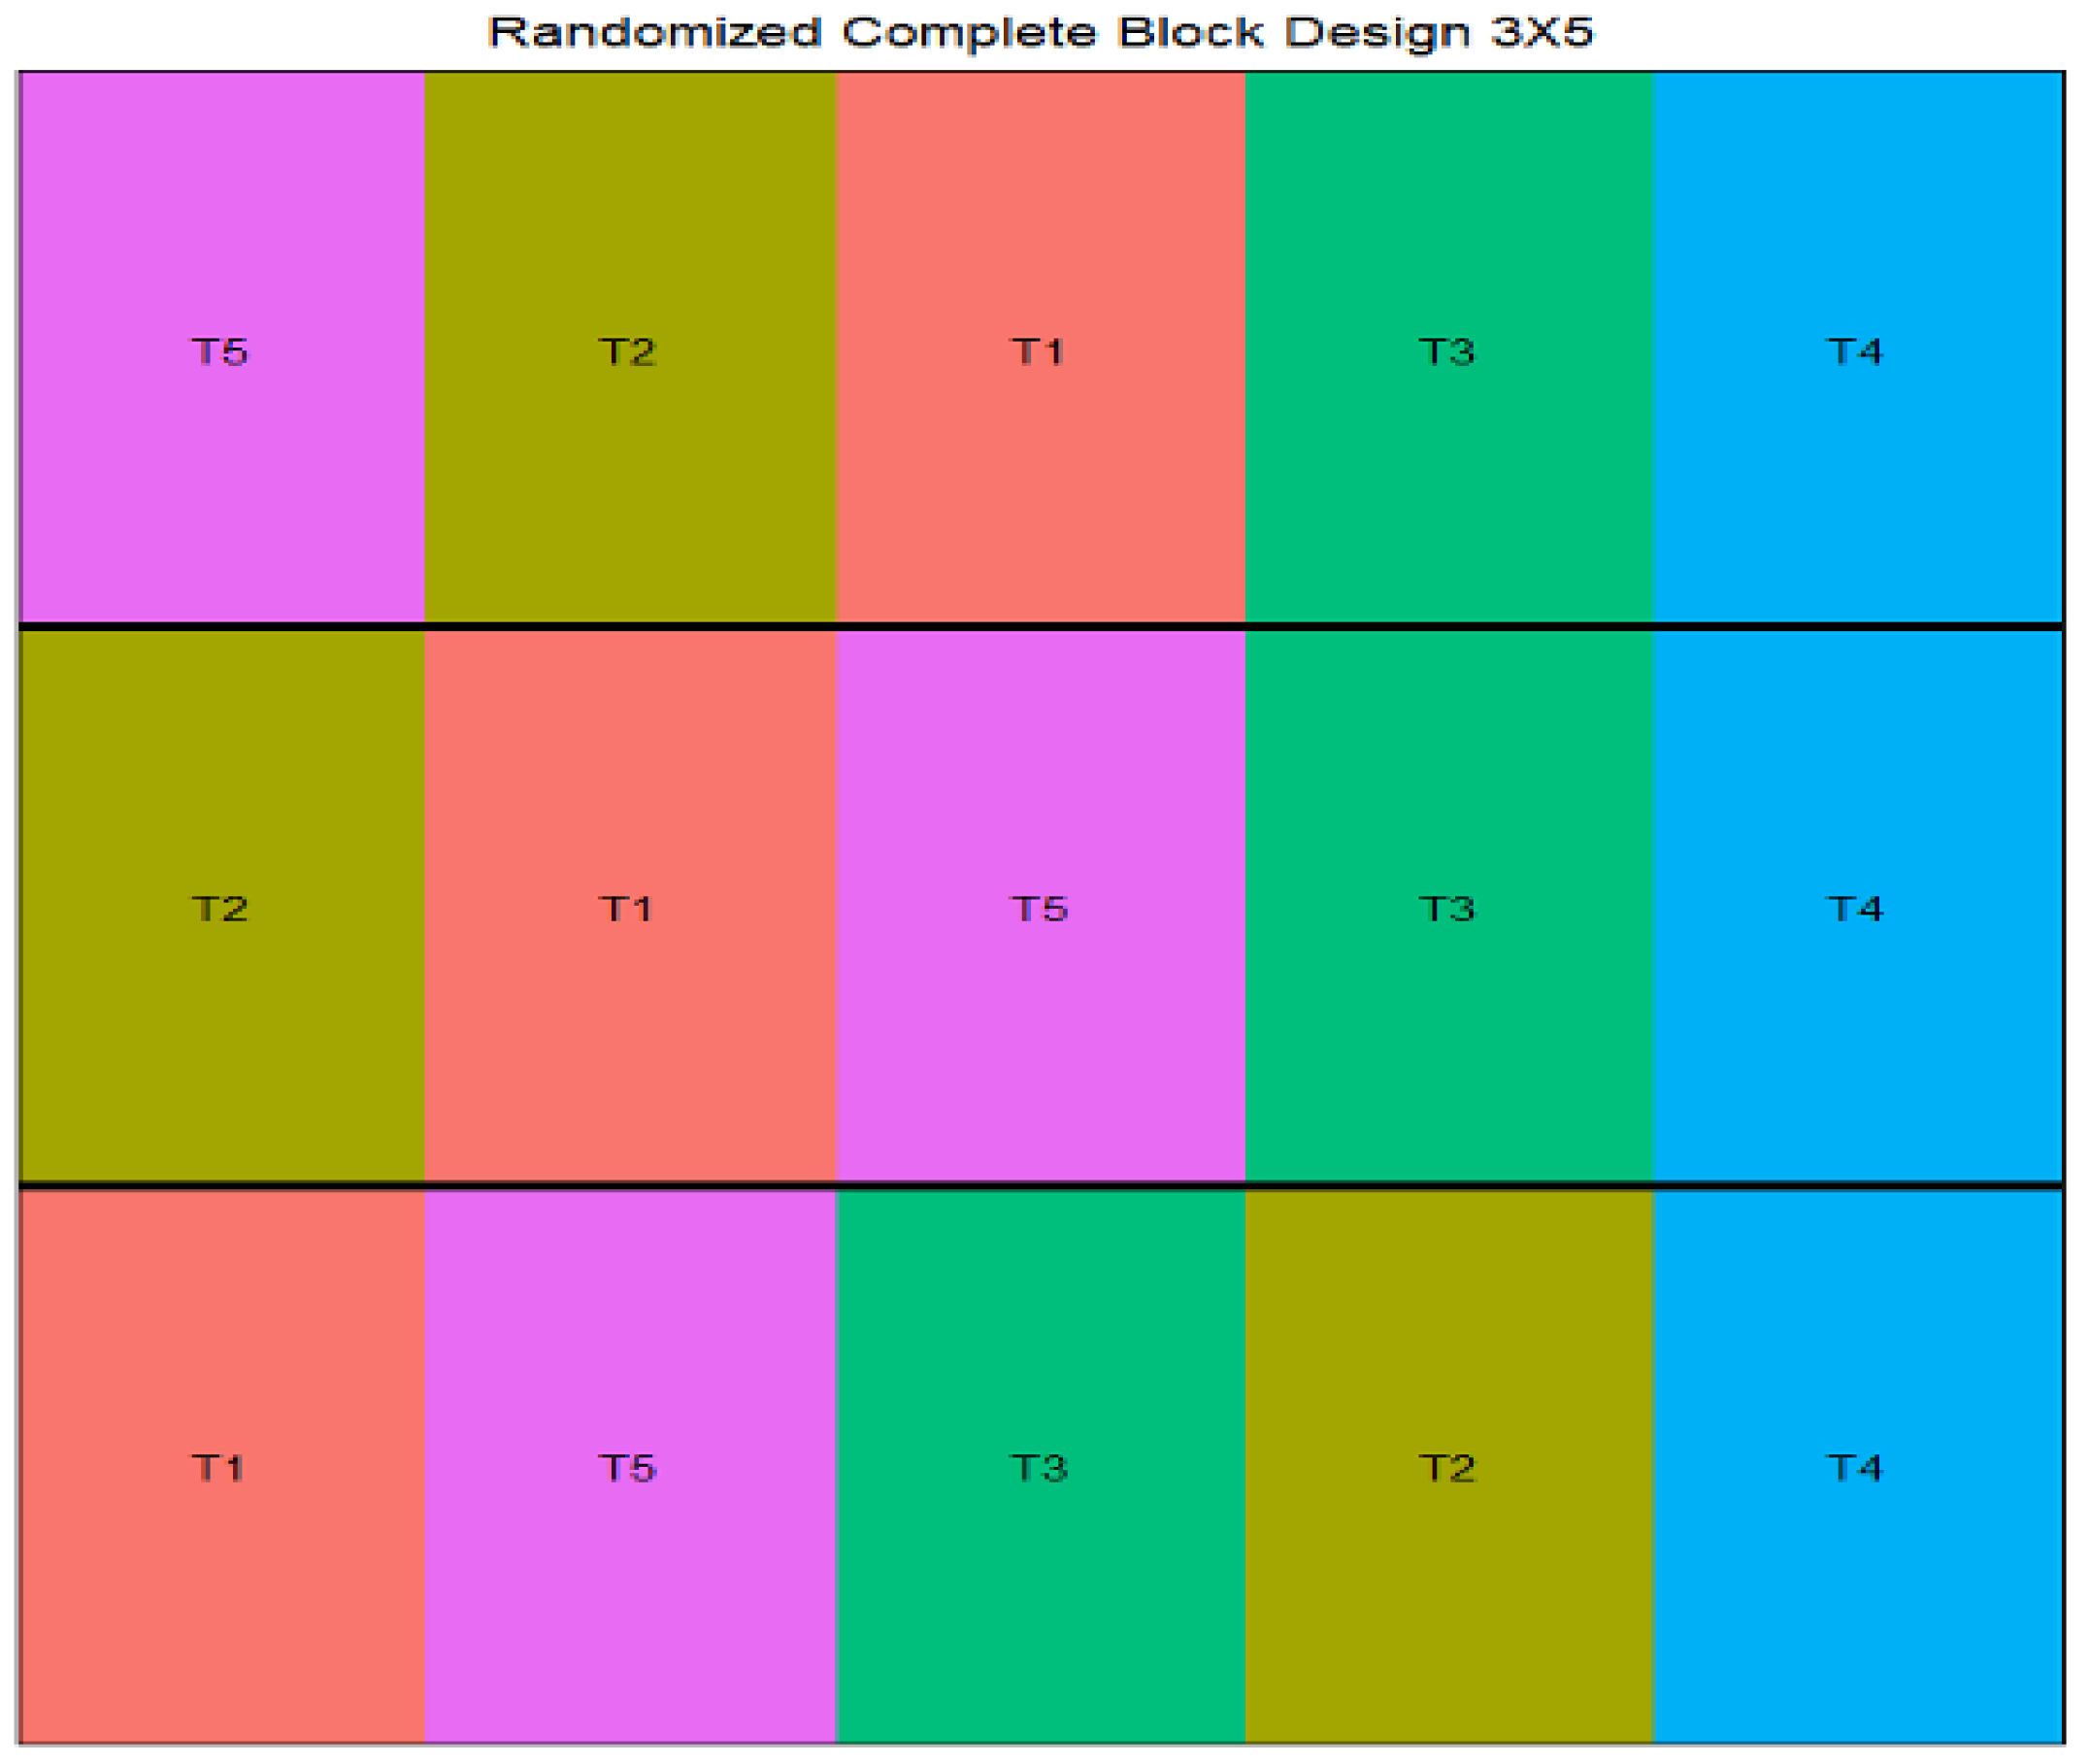
Appendix A.1. Experimental Design (Randomized Complete Block Design: RCBD)
References
- Nwose, EU. Pepper soup as an antioxidant nutrition therapy. Med Hypotheses 2009;73:860–1. [CrossRef]
- Hunde, NF. Yield response and nutrient use efficiencies of hot pepper (Capsicum annuum L.) to inorganic fertilizers in Ethiopia: A review article. International Journal of Research in Agronomy 2020;3:25–32. [CrossRef]
- Zohoungbogbo HPF, Ganta JSO, Ambali M, Barchenger D. Recent trends in pepper (Capsicum spp.) production and consumption in Sub-Saharan Africa. Acta Hortic, vol. 1, International Society for Horticultural Science; 2025, p. 89–98. [CrossRef]
- Pathirana, R. Peppers: Vegetable and Spice Capsicums, 2nd edition, by Paul W. Bosland and Eric J. Votava. N Z J Crop Hortic Sci 2013;41:102–3. [CrossRef]
- Amy Faye; Emanuele Zucchini; Yacine Ngom; Patrizio Vignaroli; Vieri Tarchiani DD. Assessing the Sustainability of Horticultural Farms in Central Senegal: An Adaptation of the IDEA Method. Journal of Agriculture and Sustainability 2020. [CrossRef]
- Chuah AM, Lee YC, Yamaguchi T, Takamura H, Yin LJ, Matoba T. Effect of cooking on the antioxidant properties of coloured peppers. Food Chem 2008;111:20–8. [CrossRef]
- Chandrasekara A, Shahidi F. Determination of antioxidant activity in free and hydrolyzed fractions of millet grains and characterization of their phenolic profiles by HPLC-DAD-ESI-MSn. J Funct Foods 2011;3:144–58. [CrossRef]
- Pathirana, R. Peppers: Vegetable and Spice Capsicums, 2nd edition, by Paul W. Bosland and Eric J. Votava. N Z J Crop Hortic Sci 2013;41:102–3. [CrossRef]
- Lahbib K, Dabbou S, Bnejdi F, Pandino G, Lombardo S, El Gazzah M, et al. Agro-morphological, biochemical and antioxidant characterization of a Tunisian chili pepper germplasm collection. Agriculture (Switzerland) 2021;11. [CrossRef]
- Pandey P, Irulappan V, Bagavathiannan M V., Senthil-Kumar M. Impact of combined abiotic and biotic stresses on plant growth and avenues for crop improvement by exploiting physio-morphological traits. Front Plant Sci 2017;8. [CrossRef]
- Beese F, Horton R, Wierenga PJ. Growth and Yield Response of Chile Pepper to Trickle Irrigation1. Agron J 1982;74:556–61. [CrossRef]
- Dida, K. Citation: Dida K (2020) Management Methods of Hot Pepper (Capsicum annuum L) Viruses. vol. 4. 2020.
- Bamba, Ndiaye; et al. ; PP AT&RD PAPSEN PAIS Assistance technique et recherche pour le développement. 2021.
- Zewid I, Haroun A, Adam M, Nigussie G, Zewdia I. Citation: Gebresilassie Nigussie, Israel Zewdia (2023) Research Achievements of Hot Pepper (Capsicum Species) and It Agro-Ecological Requirements in Ethiopia a. vol. 1. 2023.
- Fufa N, Abera G, Etissa E. Agronomic and Economic Performance of Hot Pepper (Capsicum annuum L.) in Response to Blended Fertilizer Supply at Asossa, Western Ethiopia. Int J Plant Soil Sci 2019;26:1–11. [CrossRef]
- Ngom Cheikh A., B.; et al. (2023). Analysis of the determinants of fertilizer use decision by farmers in Senegal using a logit model. 2023.
- Cheikh, N. AFRIMED AJ-Al Awamia (139). 2023.
- Zewid I, Haroun A, Adam M, Nigussie G, Zewdia I. Research Achievements of Hot Pepper (Capsicum Species) and It Agro-Ecological Requirements in Ethiopia a Review. vol. 1. 2023.
- Le Roux AA, Midgley SJE, Strauss JA, Lombard PJA, Swanepoel PA. Evaluating climate-driven yield responses in Canola: Insights from 12 years of data from South Africa. Field Crops Res 2025;334. [CrossRef]
- ANSD. 5e Recensement general de la population et de l’habitat, 2023 (RGPH-5, 2023) 2024.
- Tappan GG, Sall M, Wood EC, Cushing M. Ecoregions and land cover trends in Senegal. J Arid Environ 2004;59:427–62. [CrossRef]
- Astou Sambou MH, Albergel J, Vissin EW, Liersch S, Koch H, Szantoi Z, et al. Prediction of land use and land cover change in two watersheds in the Senegal River basin (West Africa) using the Multilayer Perceptron and Markov chain model. Eur J Remote Sens 2023;56. [CrossRef]
- Sclavo, D. Flavour, culture and food security: The spicy entanglements of chile pepper conservation in 21st century Mexico. Plants People Planet 2024;6:1111–20. [CrossRef]
- Nwonu PC, Nwobodo CE, Onwubuya EA, Obazi SA. Farmers’ use of sustainable production practices for yellow pepper crop in the Nsukka agricultural zone, Enugu State, Nigeria. Acta Universitatis Sapientiae, Agriculture and Environment 2022;14:13–28. [CrossRef]
- Olutumise, AI. Determinants of market participation and preference for production of pepper (Capsicum spp.) among farmers in southwest, Nigeria. Heliyon 2022;8. [CrossRef]
- a R, Detorio A, Lovino B. Growth and yield performance of hot pepper (capsicum frutescens) fertilized with fermented plant materials. Int J Adv Res (Indore) 2017;5:25–30. [CrossRef]
- Tesfaw et al.; Performance of hot pepper (Capsicum annuum L.) varieties as influenced by nitrogen and phosphorus fertilizer at Bure, Upper Wastershed of the Blue Nile in Northwestern Ethipia 2013. https://www.researchgate.net/publication/314439968_Performance_of_hot_pepper_Capsicum_annuum_L_varieties_as_influenced_by_nitrogen_and_phosphorus_fertilizer_at_Bure_Upper_Wastershed_of_the_Blue_Nile_in_Northwestern_Ethipia (accessed October 20, 2025).
- Seo-Young Oh and Seok Chan Koh. Fruit development and quality of hot pepper (Capsicum annuum L.) under various temperature regimes. Horticultural Science and Technology 2019;37:313–21. [CrossRef]
- Fermaud M, V-GH, CA, RJ, GC. A multivariate analysis of combined effects of (micro)climate, vegetative and reproductive growth on grey mould incidence in grapevine n.d. https://www.researchgate.net/publication/266853921_A_multivariate_analysis_of_combined_effects_of_microclimate_vegetative_and_reproductive_growth_on_grey_mould_incidence_in_grapevine (accessed October 20, 2025).
- Shivandu S, K; et al. ; Climatic influences on flowering dynamics, reproductive development and fruit set in litchi cv. Dehradun. Curr Sci 2025;128:368–72. [CrossRef]
- Woldegebriel, AM. Climatic and soil impacts on avocado (Persea americana L.) yield and quality in Southern Ethiopia: a comparative study. Discover Applied Sciences 2025;7:1164. [CrossRef]
- Osorio-Marín J, FE; et al. ; Climate change impacts on temperate fruit and nut production: a systematic review. Front Plant Sci 2024;15. [CrossRef]
Figure 1.
Area of study.
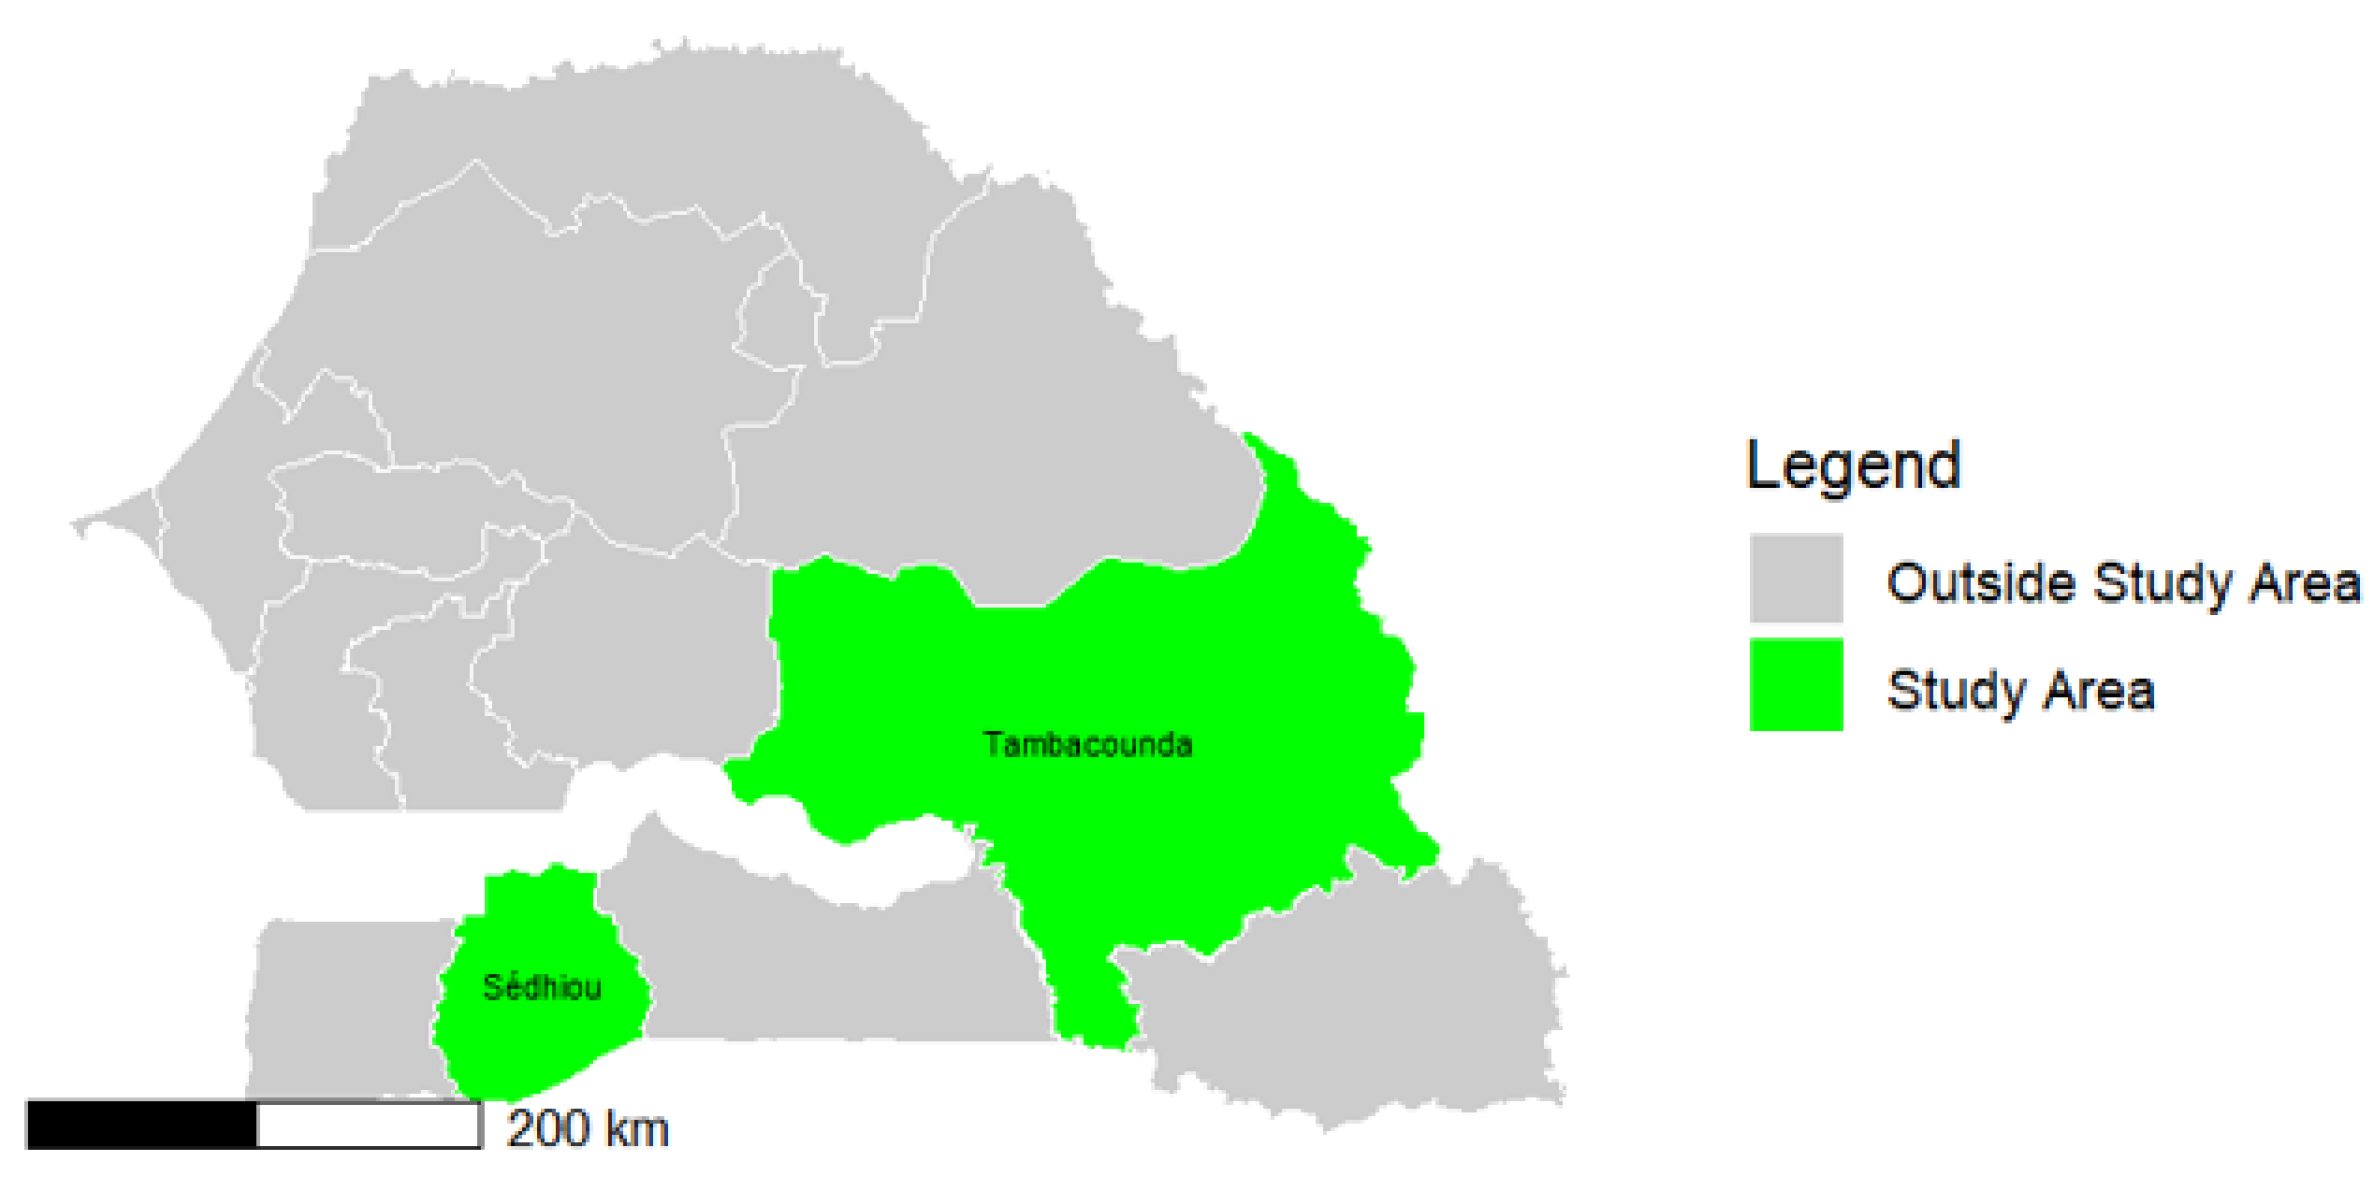
Figure 2.
Temperature and rainfall patterns at Djibelor (A) and CRAT(B).
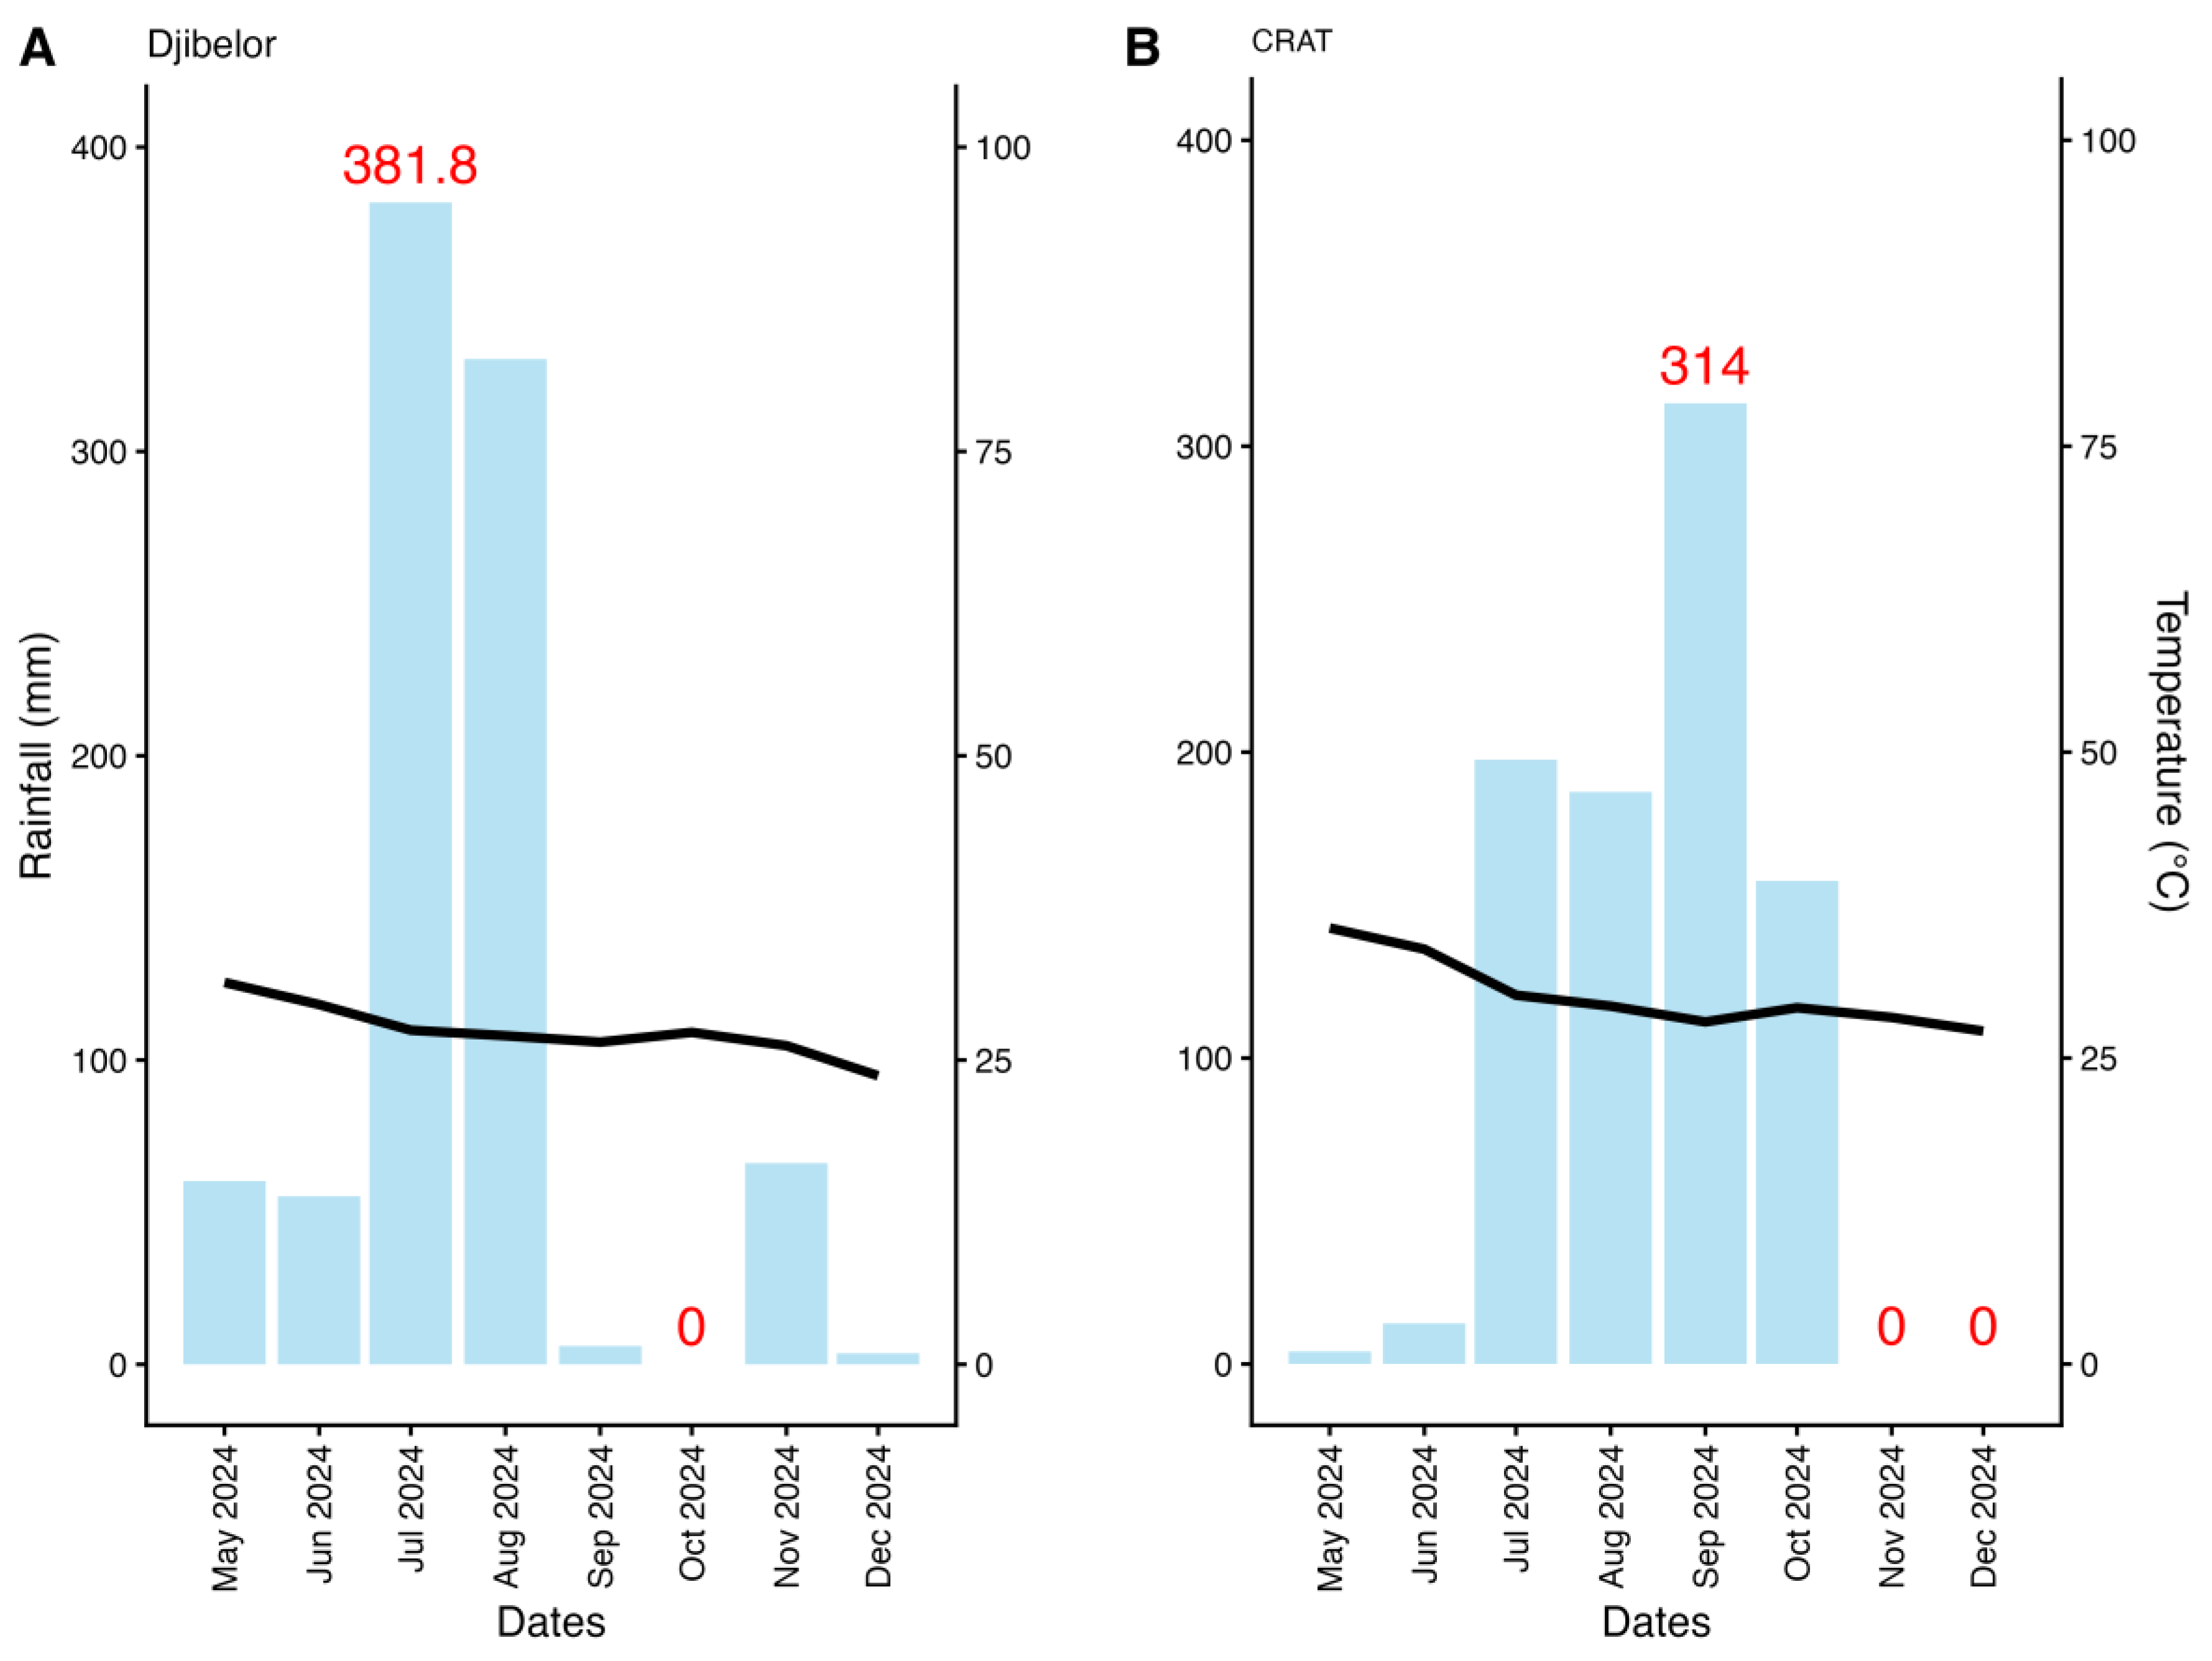
Figure 3.
Pearson’s correlation among hot pepper traits at (upper) CRAT and (bottom) Djibelor. Asterisks denote the level of statistical significance (p ≤ 0.05 *, *p ≤ 0.01 **, **p ≤ 0.001).
Figure 3.
Pearson’s correlation among hot pepper traits at (upper) CRAT and (bottom) Djibelor. Asterisks denote the level of statistical significance (p ≤ 0.05 *, *p ≤ 0.01 **, **p ≤ 0.001).
Figure 4.
Effect of treatments on hot pepper plant height at 60 days after transplanting (DAT). Bars represent mean plant height (± SE) under five treatments: T1 (Absolute Control), T2 (Farmer Practice), T3 (Microdose Fertilizer), T4 (Microdose + Compost), and T5 (Microdose + Compost + Mulching). Different letters above bars (a, ab, b) indicate statistically significant differences among treatments according to Tukey’s HSD test at p ≤ 0.05. Treatments sharing the same letter are not significantly different.
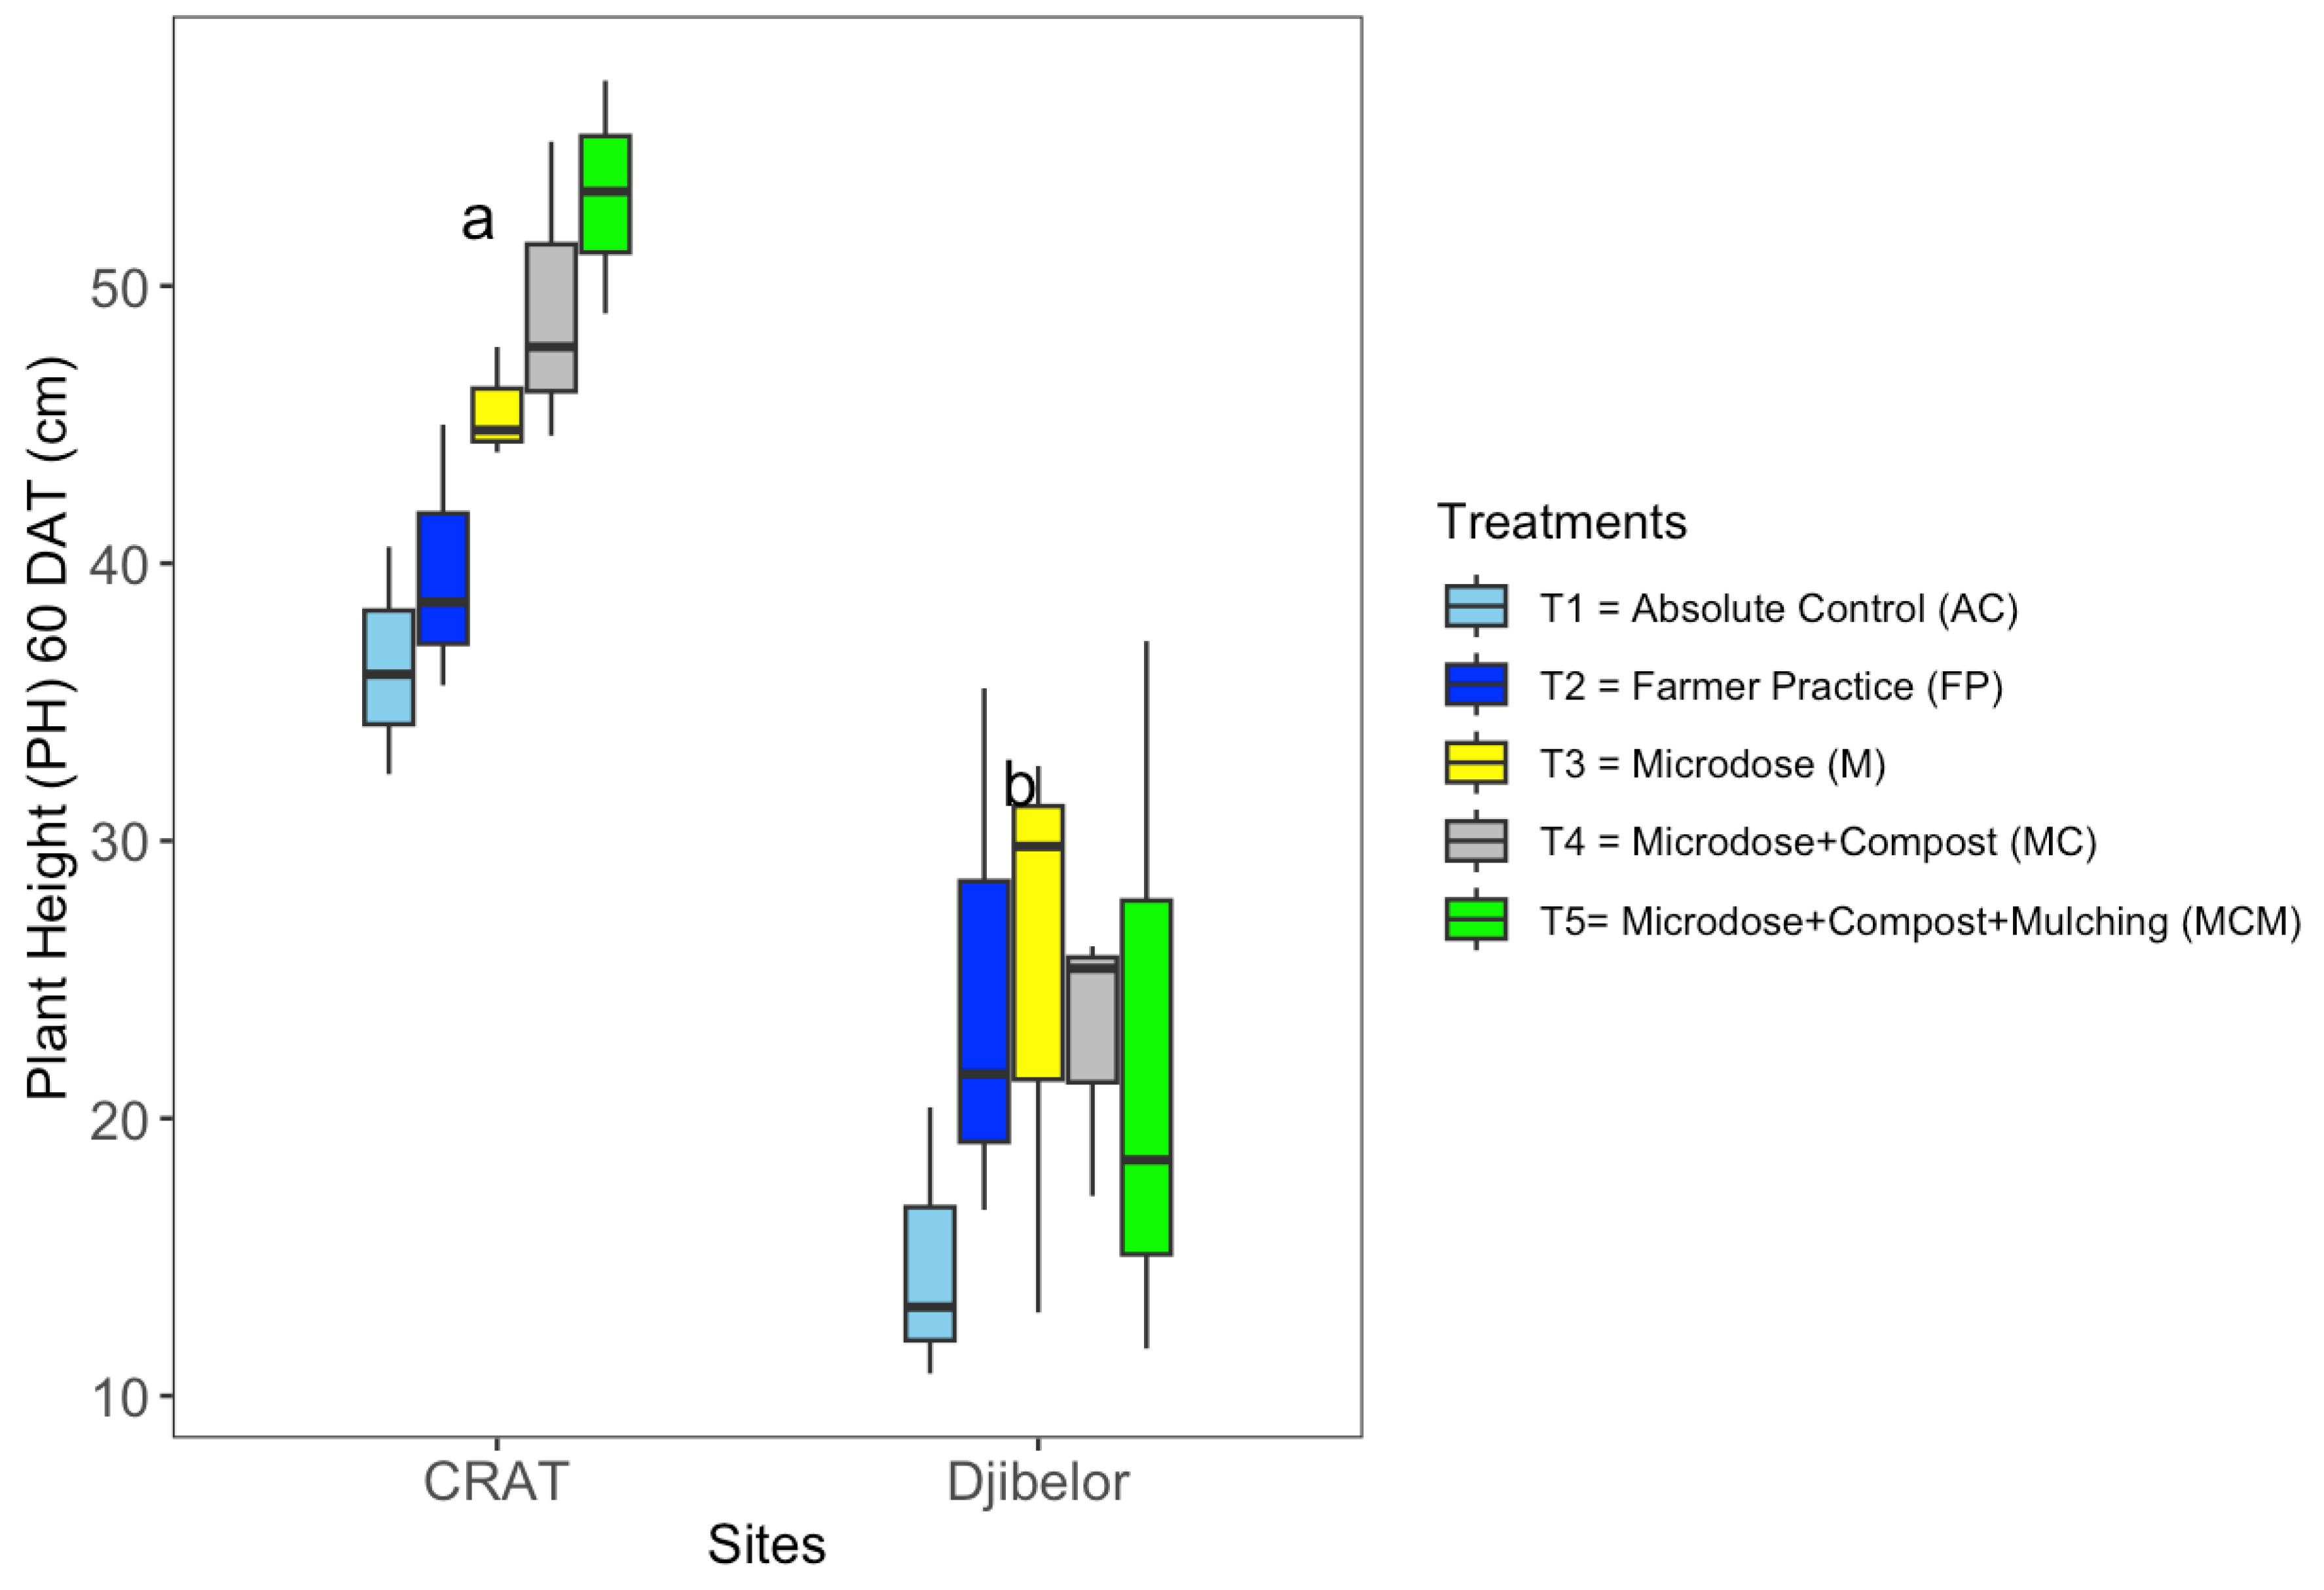
Figure 5.
Effect of treatments on hot pepper collar diameter at 30 and 60 days after transplanting (DAT) by site. Bars represent mean collar diameter (± SE) measured at 30 and 60 DAT under five treatments: T1 (Absolute Control), T2 (Farmer Practice), T3 (Microdose Fertilizer), T4 (Microdose + Compost), and T5 (Microdose + Compost + Mulching). Different letters above bars (a, ab, b) indicate statistically significant differences among treatments according to Tukey’s HSD test at p ≤ 0.05. Treatments sharing the same letter are not significantly different.
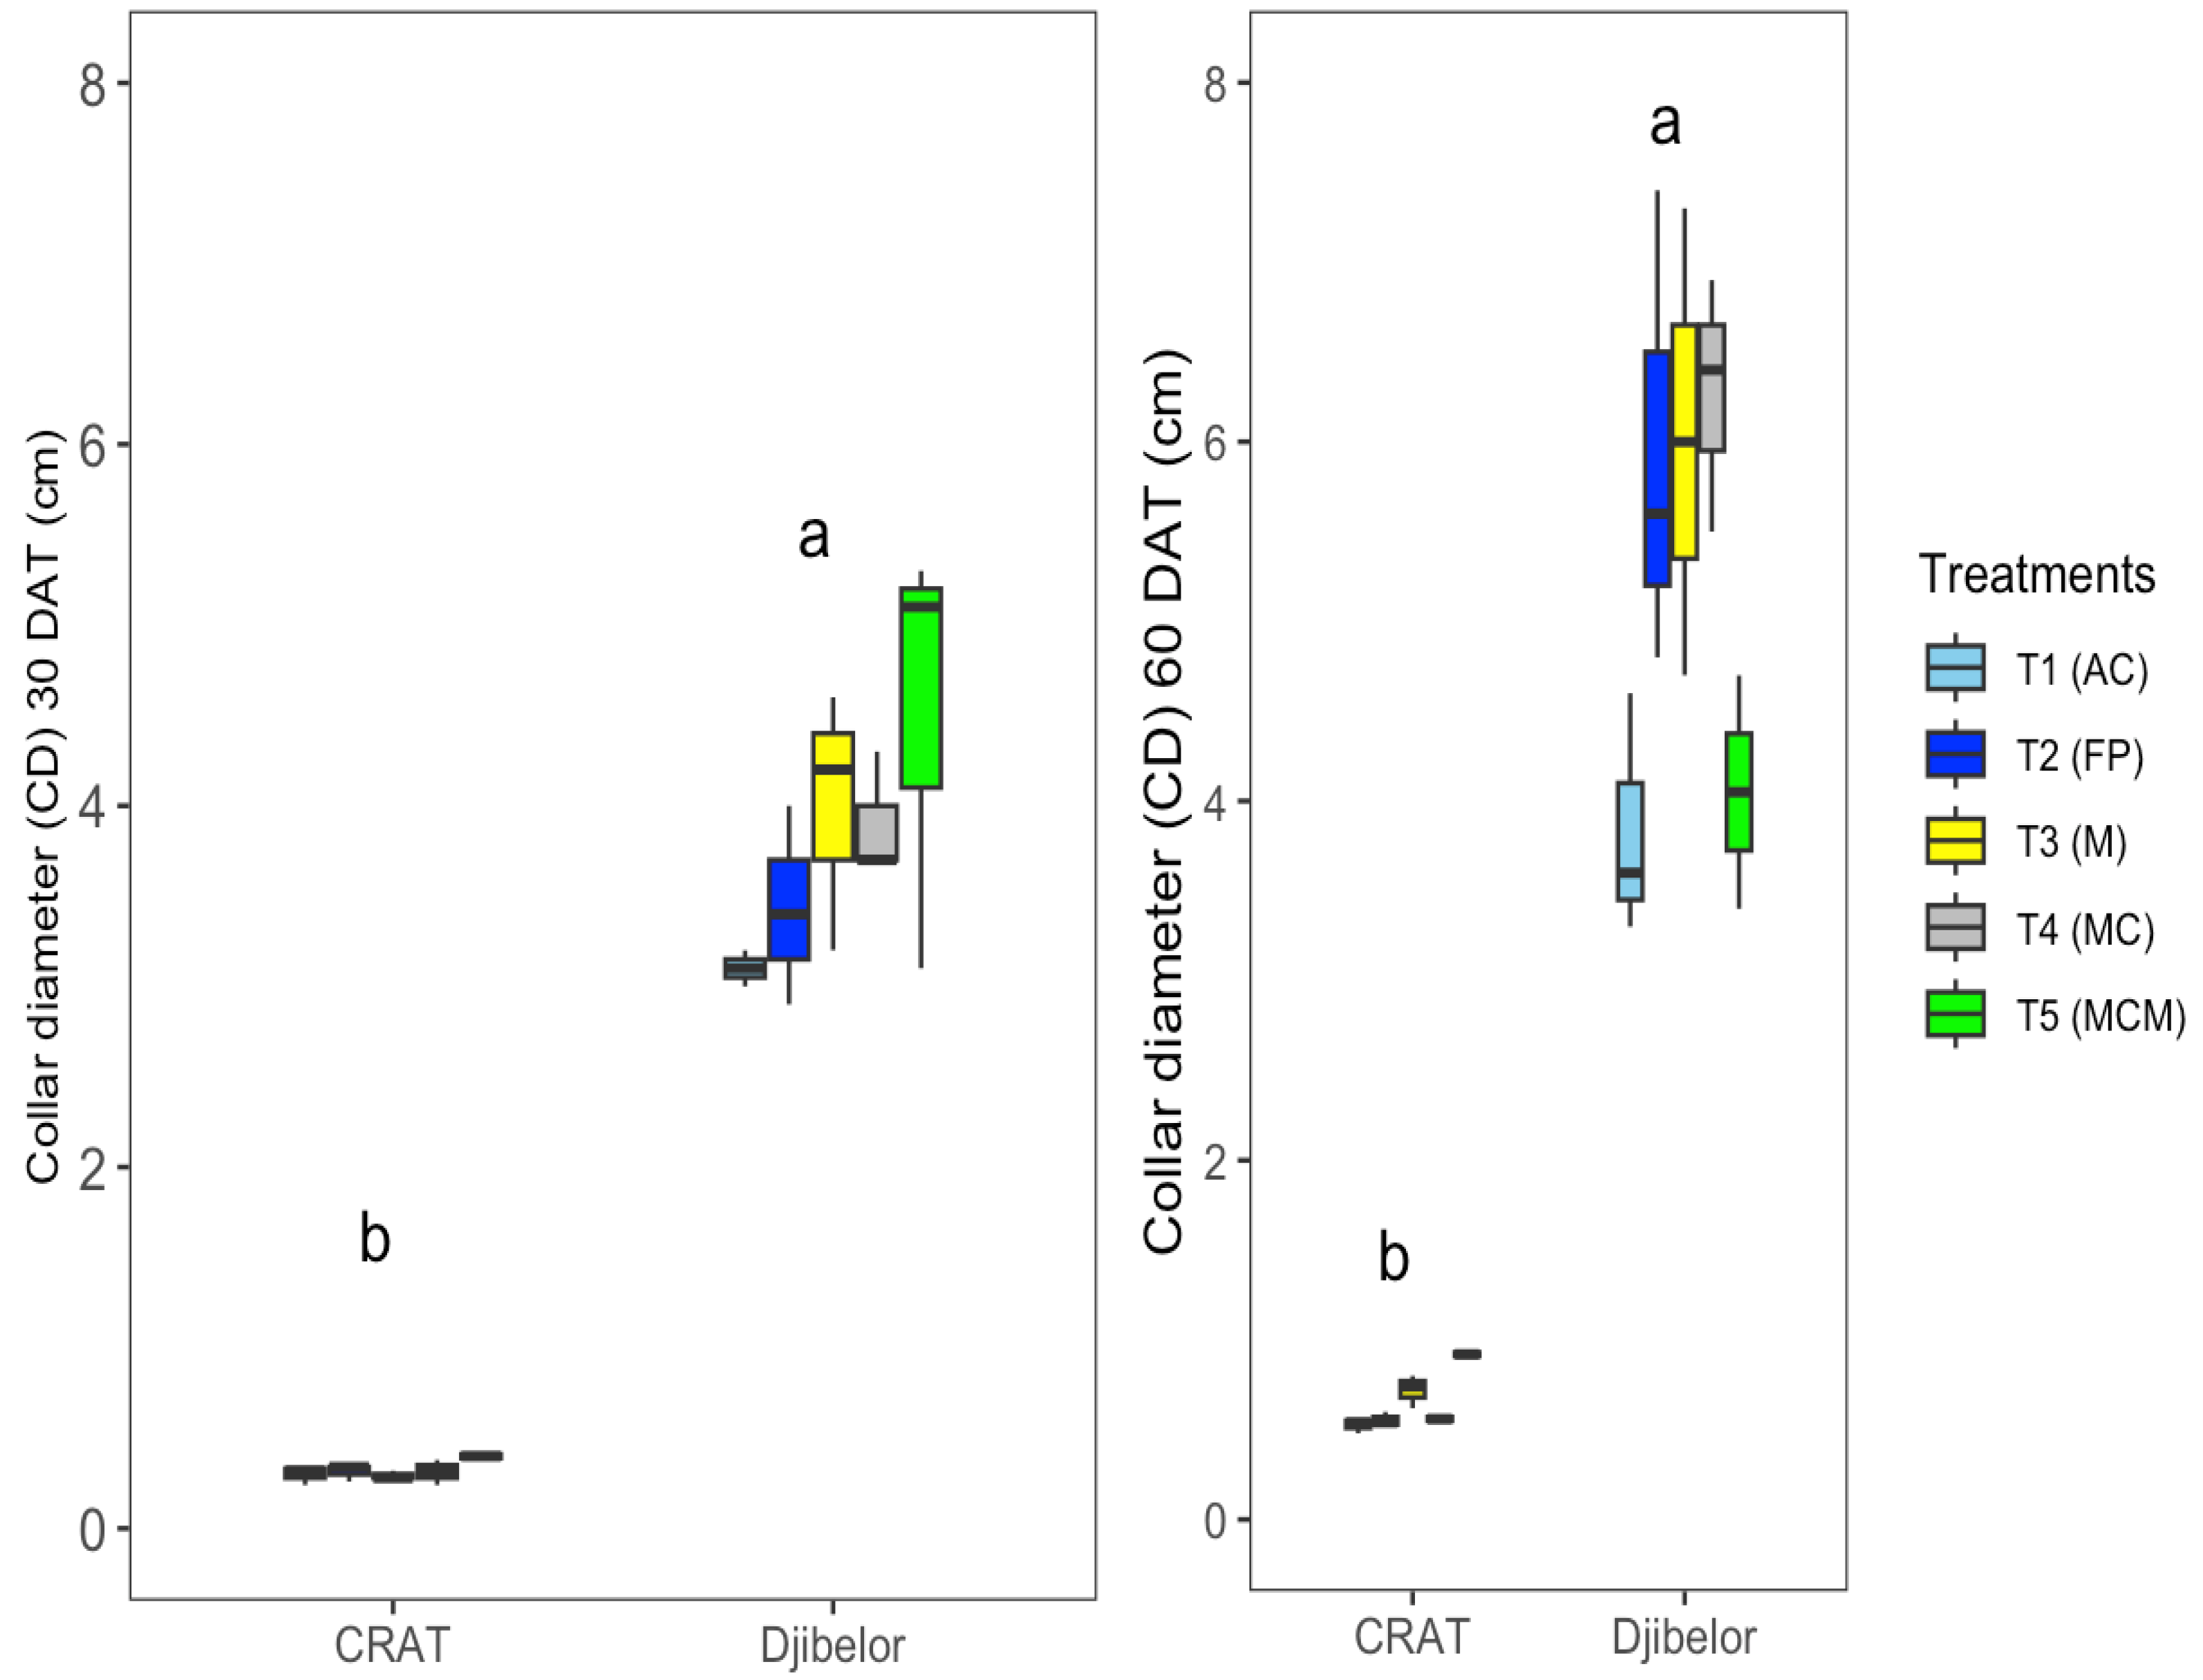
Figure 6.
Effect of treatments on the number of fruits per hot pepper plant at (a) CRAT and (b) Djibelor sites. Bars represent mean fruit numbers per plant (± SE) under five treatments: T1 (Absolute Control), T2 (Farmer Practice), T3 (Microdose Fertilizer), T4 (Microdose + Compost), and T5 (Microdose + Compost + Mulching). Different letters above bars (a, b) indicate statistically significant differences among treatments according to Tukey’s HSD test at p ≤ 0.05. Treatments sharing the same letter are not significantly different.
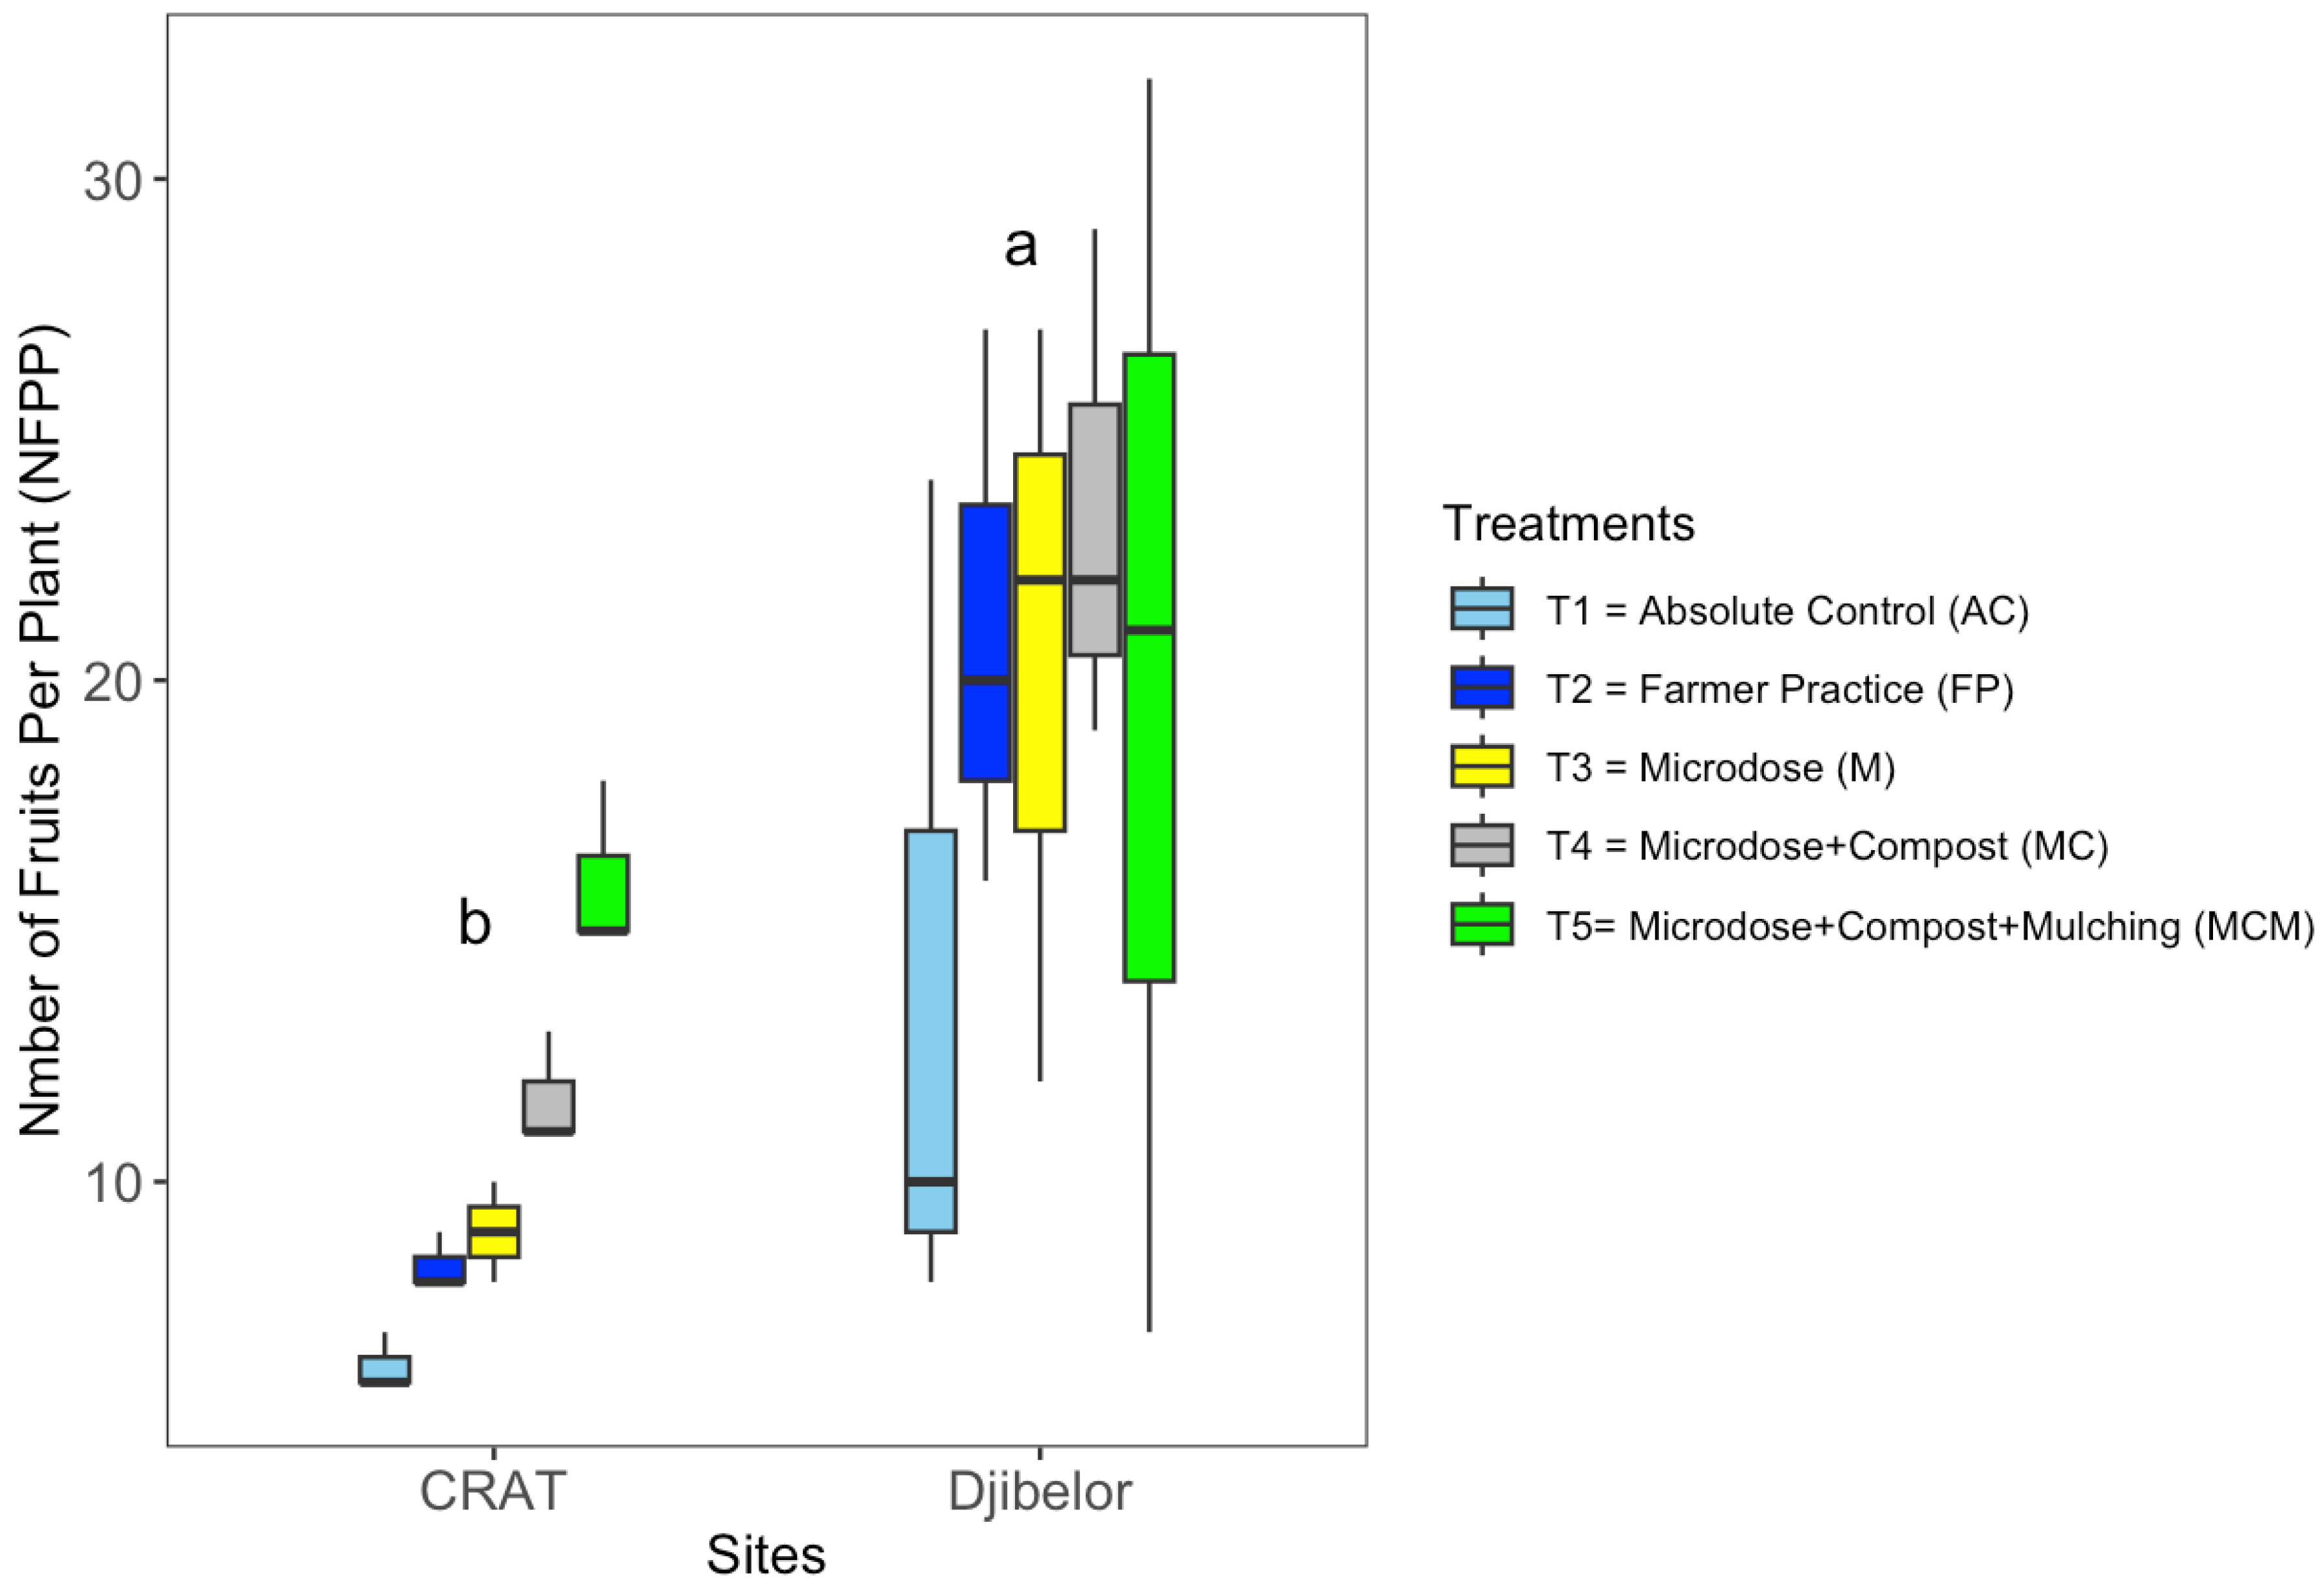
Figure 7.
Effect of treatments on hot pepper yield (t/ha) at (a) CRAT and (b) Djibelor sites. Bars show mean yields (± SE) under T1 (Control), T2 (Farmer Practice), T3 (Microdose), T4 (Microdose + Compost), and T5 (Microdose + Compost + Mulching). Different letters (a, ab, b) indicate significant differences among treatments (Tukey’s HSD, p ≤ 0.05).
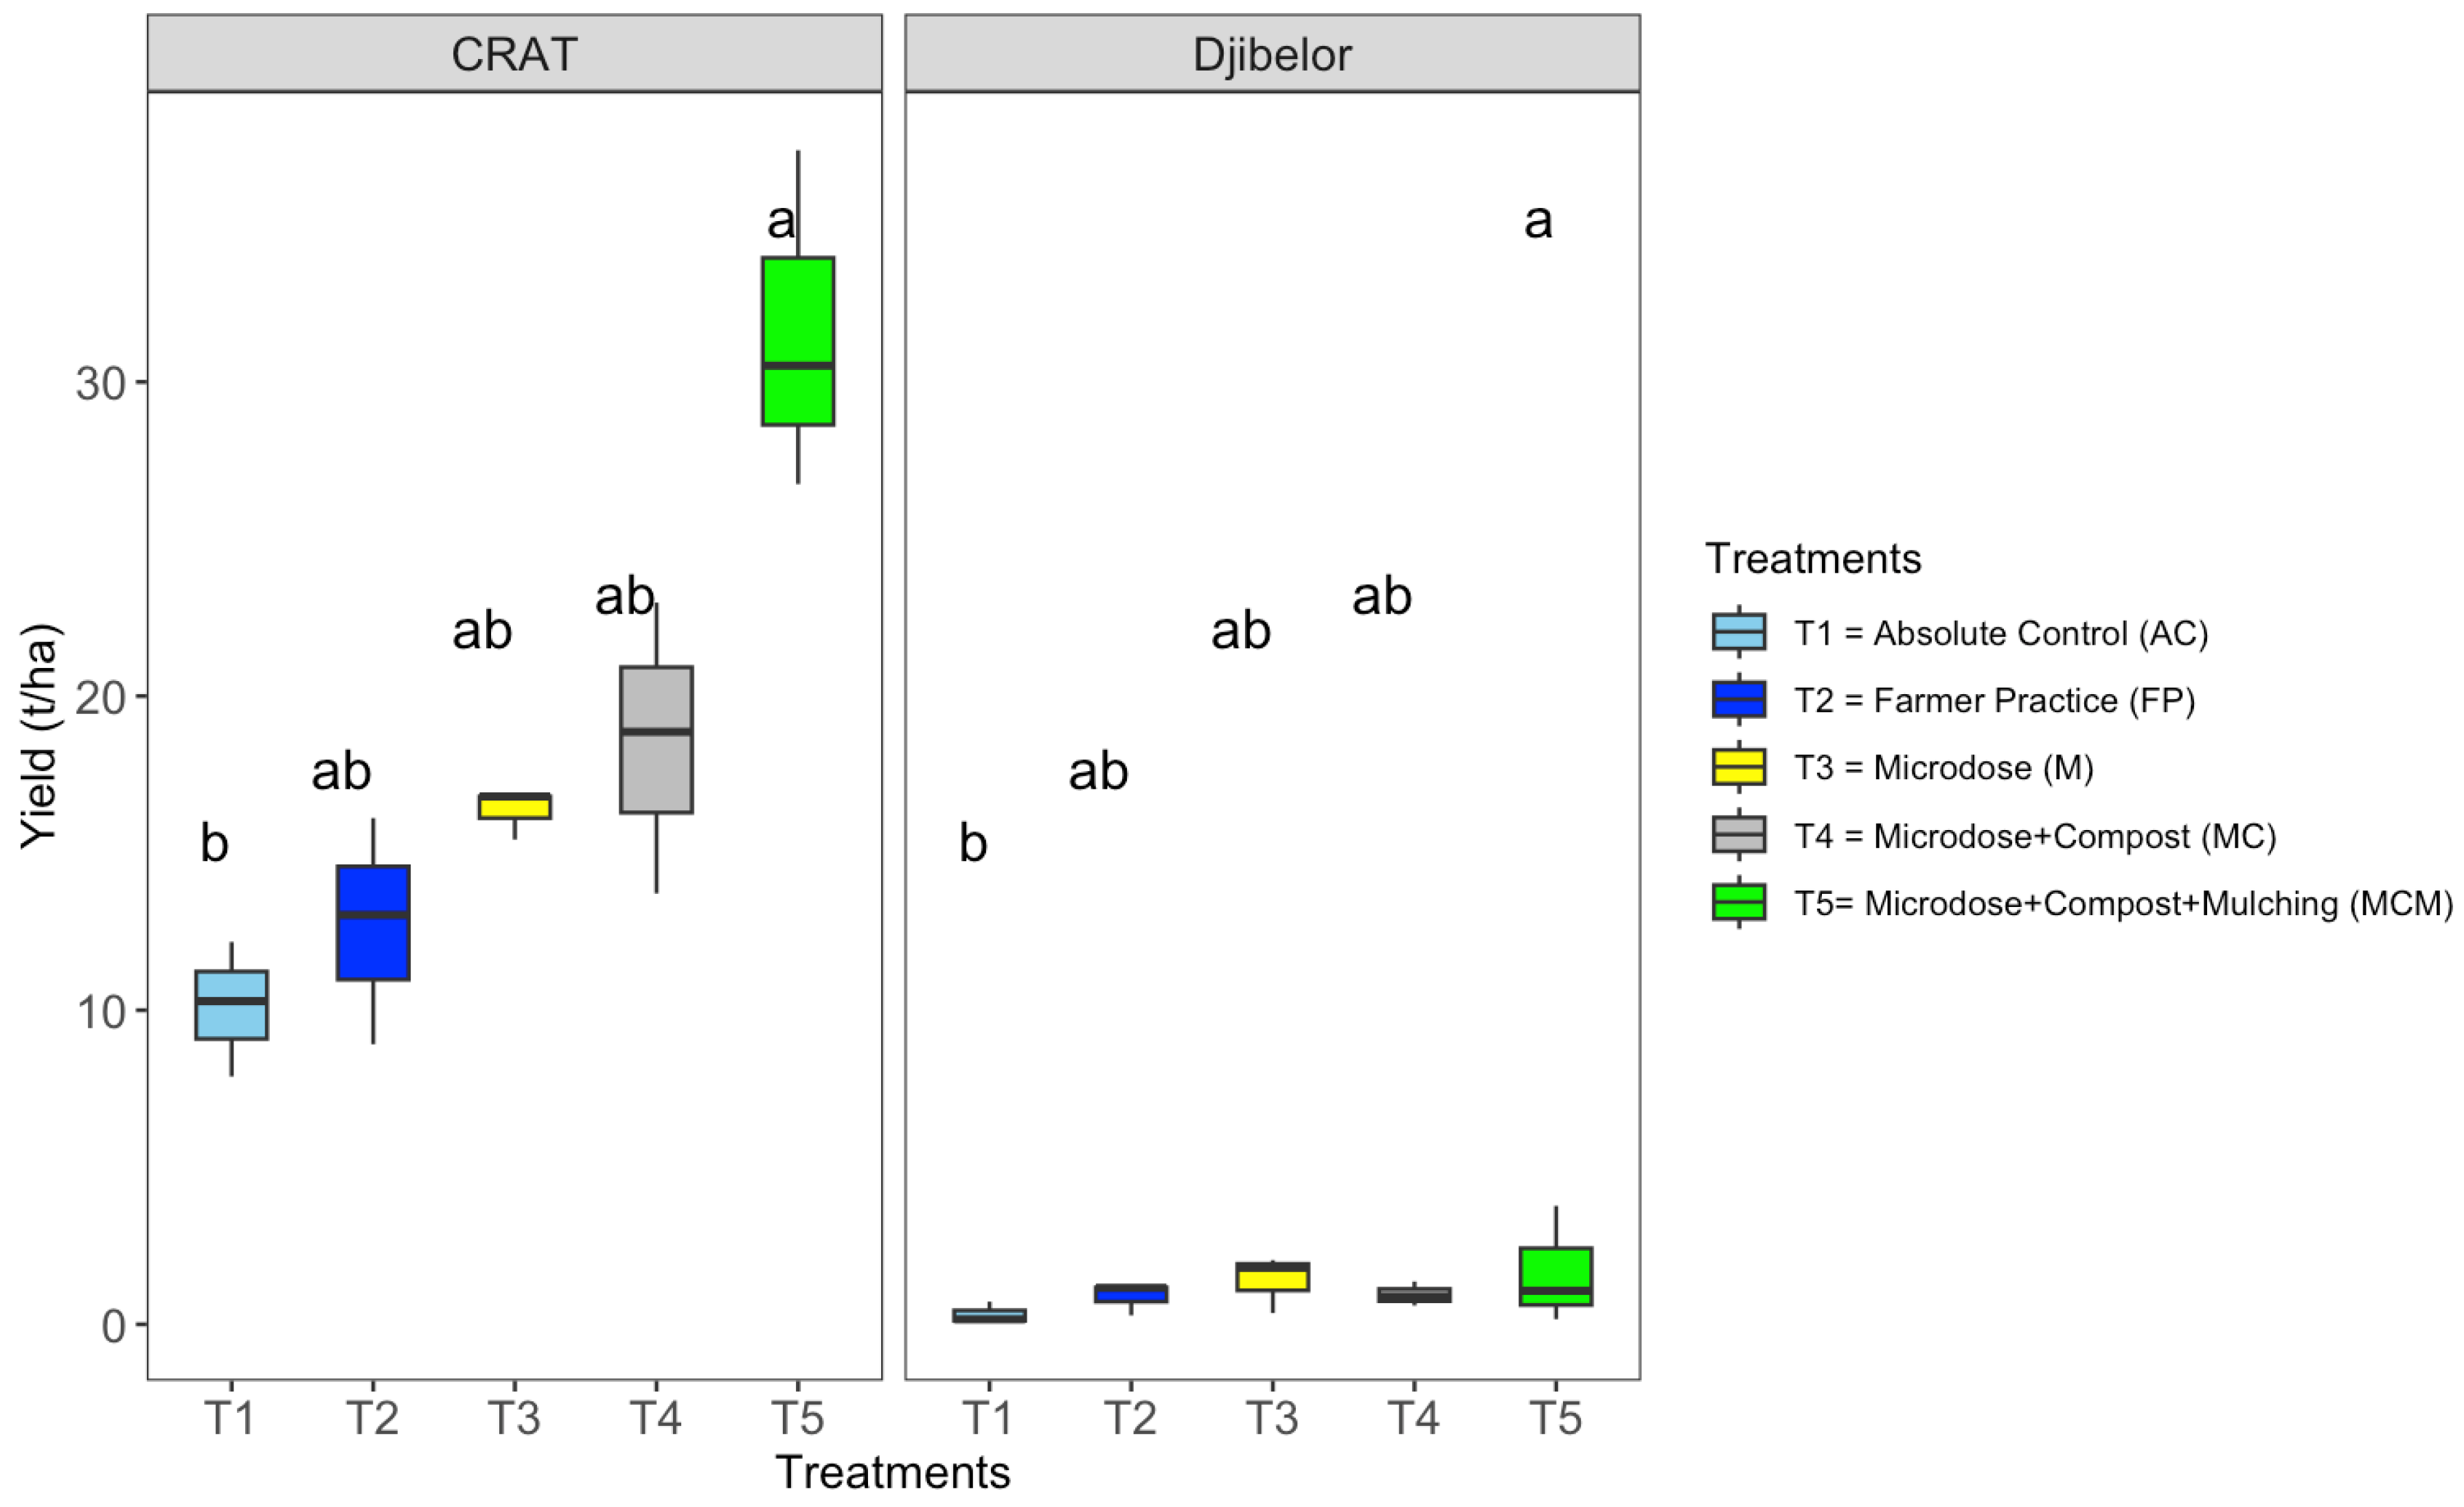

Table 1.
Temperature and rainfall patterns in Sedhiou and Tambacounda.
| Tambacounda (Sinthiou Maleme station) | Sedhiou (Sefa station) | |||
| Months | Rainfall | Temperature | Temperature | Rainfall |
| (mm) | average (oC) | average (oC) | (mm) | |
| 01/05/2024 | 4.1 | 35.63 | 31.37 | 60.2 |
| 01/06/2024 | 13.3 | 33.9 | 29.55 | 55.2 |
| 01/07/2024 | 197.5 | 30.14 | 27.45 | 381.8 |
| 01/08/2024 | 187 | 29.25 | 26.99 | 330.4 |
| 01/09/2024 | 314 | 27.96 | 26.47 | 6 |
| 01/10/2024 | 157.9 | 29.12 | 27.27 | 0 |
| 01/11/2024 | 0 | 28.32 | 26.1 | 66.2 |
| 01/12/2024 | 0 | 27.2 | 23.71 | 3.6 |
Table 2.
Treatment effects on hot pepper height analysis of variance.
| Df | SumSq | MeanSq | F value | Pr (>F) | |
| Treatments | 4 | 562 | 141 | 2.215 | 0.12 |
| Blocs | 2 | 63 | 31 | 0.496 | 0.619 |
| Sites | 1 | 3906 | 3906 | 61.51 | 1.72E-6*** |
| Treatments: blocs | 8 | 309 | 39 | 0.608 | 0.758 |
| Residuals | 14 | 889 | 63 |
Signif. codes: 0 ‘***’ 0.001 ‘**’ 0.01 ‘*’ 0.05 ‘.’ 0.1 ‘ ’ 1.
Table 3.
Tukey mean’s classifications (PH60DAT).
| Sites | Mean | Quantile | Clustering |
| CRAT | 44.8 | 48.4 | a |
| Djibelor | 22 | 28 | b |
Table 4.
Collar diameter 30 and 60 days after transplanting analysis of variance.
| CD30DAT | |||||
| Df | SumSq | MeanSq | Fvalue | Pr (>F) | |
| Treatments | 4 | 1.96 | 0.49 | 1.712 | 0.203 |
| Blocs | 2 | 1.36 | 0.68 | 2.374 | 0.13 |
| Sites | 1 | 89.93 | 89.93 | 314.743 | 5.42E-11*** |
| Treatments: blocs | 8 | 1.09 | 0.14 | 0.476 | 0.853 |
| Residuals | 14 | 4 | 0.29 | ||
| CD60DAT | |||||
| Treatments | 4 | 7.99 | 2 | 1.472 | 0.263 |
| Blocs | 2 | 4.05 | 2.02 | 1.492 | 0.259 |
| Sites | 1 | 185.31 | 185.31 | 136.533 | 1.32E-08*** |
| Treatments: blocs | 8 | 7.66 | 0.96 | 0.706 | 0.683 |
| Residuals | 14 | 19 | 1.36 | ||
Signif. codes: 0 ‘***’ 0.001 ‘**’ 0.01 ‘*’ 0.05 ‘.’ 0.1 ‘’ 1.
Table 5.
Tukey mean’s classifications (CD30DAT & CD60DAT).
| CD30DAT | |||
| Sites | Mean | Quantile | Clusteringg |
| Djibelor | 3.79 | 4.25 | a |
| CRAT | 0.324 | 0.36 | b |
| CD60DAT | |||
| Site | Mean | Quantile | Clustering |
| Djibelor | 5.63 | 7.1 | a |
| CRAT | 0.656 | 0.77 | b |
Table 6.
Number of fruits per plant (NFPP) analysis of variance.
| Df | SumSq | MeanSq | Fvalue | Pr(>F) | |
| Treatments | 4 | 233 | 58.3 | 2.014 | 0.148 |
| Blocs | 2 | 32.6 | 16.3 | 0.564 | 0.581 |
| Sites | 1 | 672.1 | 672.1 | 23.242 | 2.72E-4*** |
| Treatments: blocs | 8 | 349.4 | 43.7 | 1.51 | 0.238 |
| Residuals | 14 | 404.9 | 28.9 |
Signif. codes: 0 ‘***’ 0.001 ‘**’ 0.01 ‘*’ 0.05 ‘.’ 0.1 ‘ ’ 1.
Table 7.
Tukey mean’s classifications (NFPP).
| Site | Mean | Quantile | Clustering |
| Djibelor | 19.7 | 25.5 | a |
| CRAT | 10.3 | 12 | b |
Table 8.
Hot pepper yield (t/ha) analysis of variance.
| Df | SumSq | MeanSq | Fvalue | Pr(>F) | |
| Treatments | 4 | 460.2 | 115.1 | 3.761 | 0.028* |
| Blocs | 2 | 37.4 | 18.7 | 0.612 | 0.556 |
| Sites | 1 | 2117.4 | 2117.4 | 69.204 | 8.66E-7*** |
| Treatments: blocs | 8 | 55.3 | 6.9 | 0.226 | 0.98 |
| Residuals | 14 | 428.3 | 30.6 |
Signif. codes: 0 ‘***’ 0.001 ‘**’ 0.01 ‘*’ 0.05 ‘.’ 0.1 ‘ ’ 1.
Table 9.
Tukey means classifications by site.
| Site | Mean | Quantile | Clustering |
| CRAT | 17.8 | 20.9 | a |
| Djibelor | 1.04 | 1.27 | b |
Table 10.
Tukey mean’s classifications of hot pepper yield (t/ha) by treatments and sites.
| Treatments | Sites | Mean (t/ha) | Quantile | Clustering |
| T5 | CRAT | 31.6 | 34 | a |
| T4 | CRAT | 18.5 | 20.9 | ab |
| T3 | CRAT | 16.3 | 16.8 | ab |
| T2 | CRAT | 12.7 | 14.6 | ab |
| T1 | CRAT | 10.1 | 11.2 | b |
| T5 | Djibelor | 1.67 | 2.42 | a |
| T3 | Djibelor | 1.4 | 1.92 | ab |
| T4 | Djibelor | 0.948 | 1.12 | ab |
| T2 | Djibelor | 0.875 | 1.17 | ab |
| T1 | Djibelor | 0.316 | 0.441 | b |
Disclaimer/Publisher’s Note: The statements, opinions and data contained in all publications are solely those of the individual author(s) and contributor(s) and not of MDPI and/or the editor(s). MDPI and/or the editor(s) disclaim responsibility for any injury to people or property resulting from any ideas, methods, instructions or products referred to in the content. |
© 2025 by the authors. Licensee MDPI, Basel, Switzerland. This article is an open access article distributed under the terms and conditions of the Creative Commons Attribution (CC BY) license (http://creativecommons.org/licenses/by/4.0/).
Copyright: This open access article is published under a Creative Commons CC BY 4.0 license, which permit the free download, distribution, and reuse, provided that the author and preprint are cited in any reuse.


