Preprint
Article

This version is not peer-reviewed.

Nutrient Management Practices in Coffee (Coffea Arabica L.) Influences: Nitrogen Uses Efficiency, Carbon Footprint and Soil Health

Submitted:

27 October 2025

Posted:

29 October 2025

You are already at the latest version

Abstract

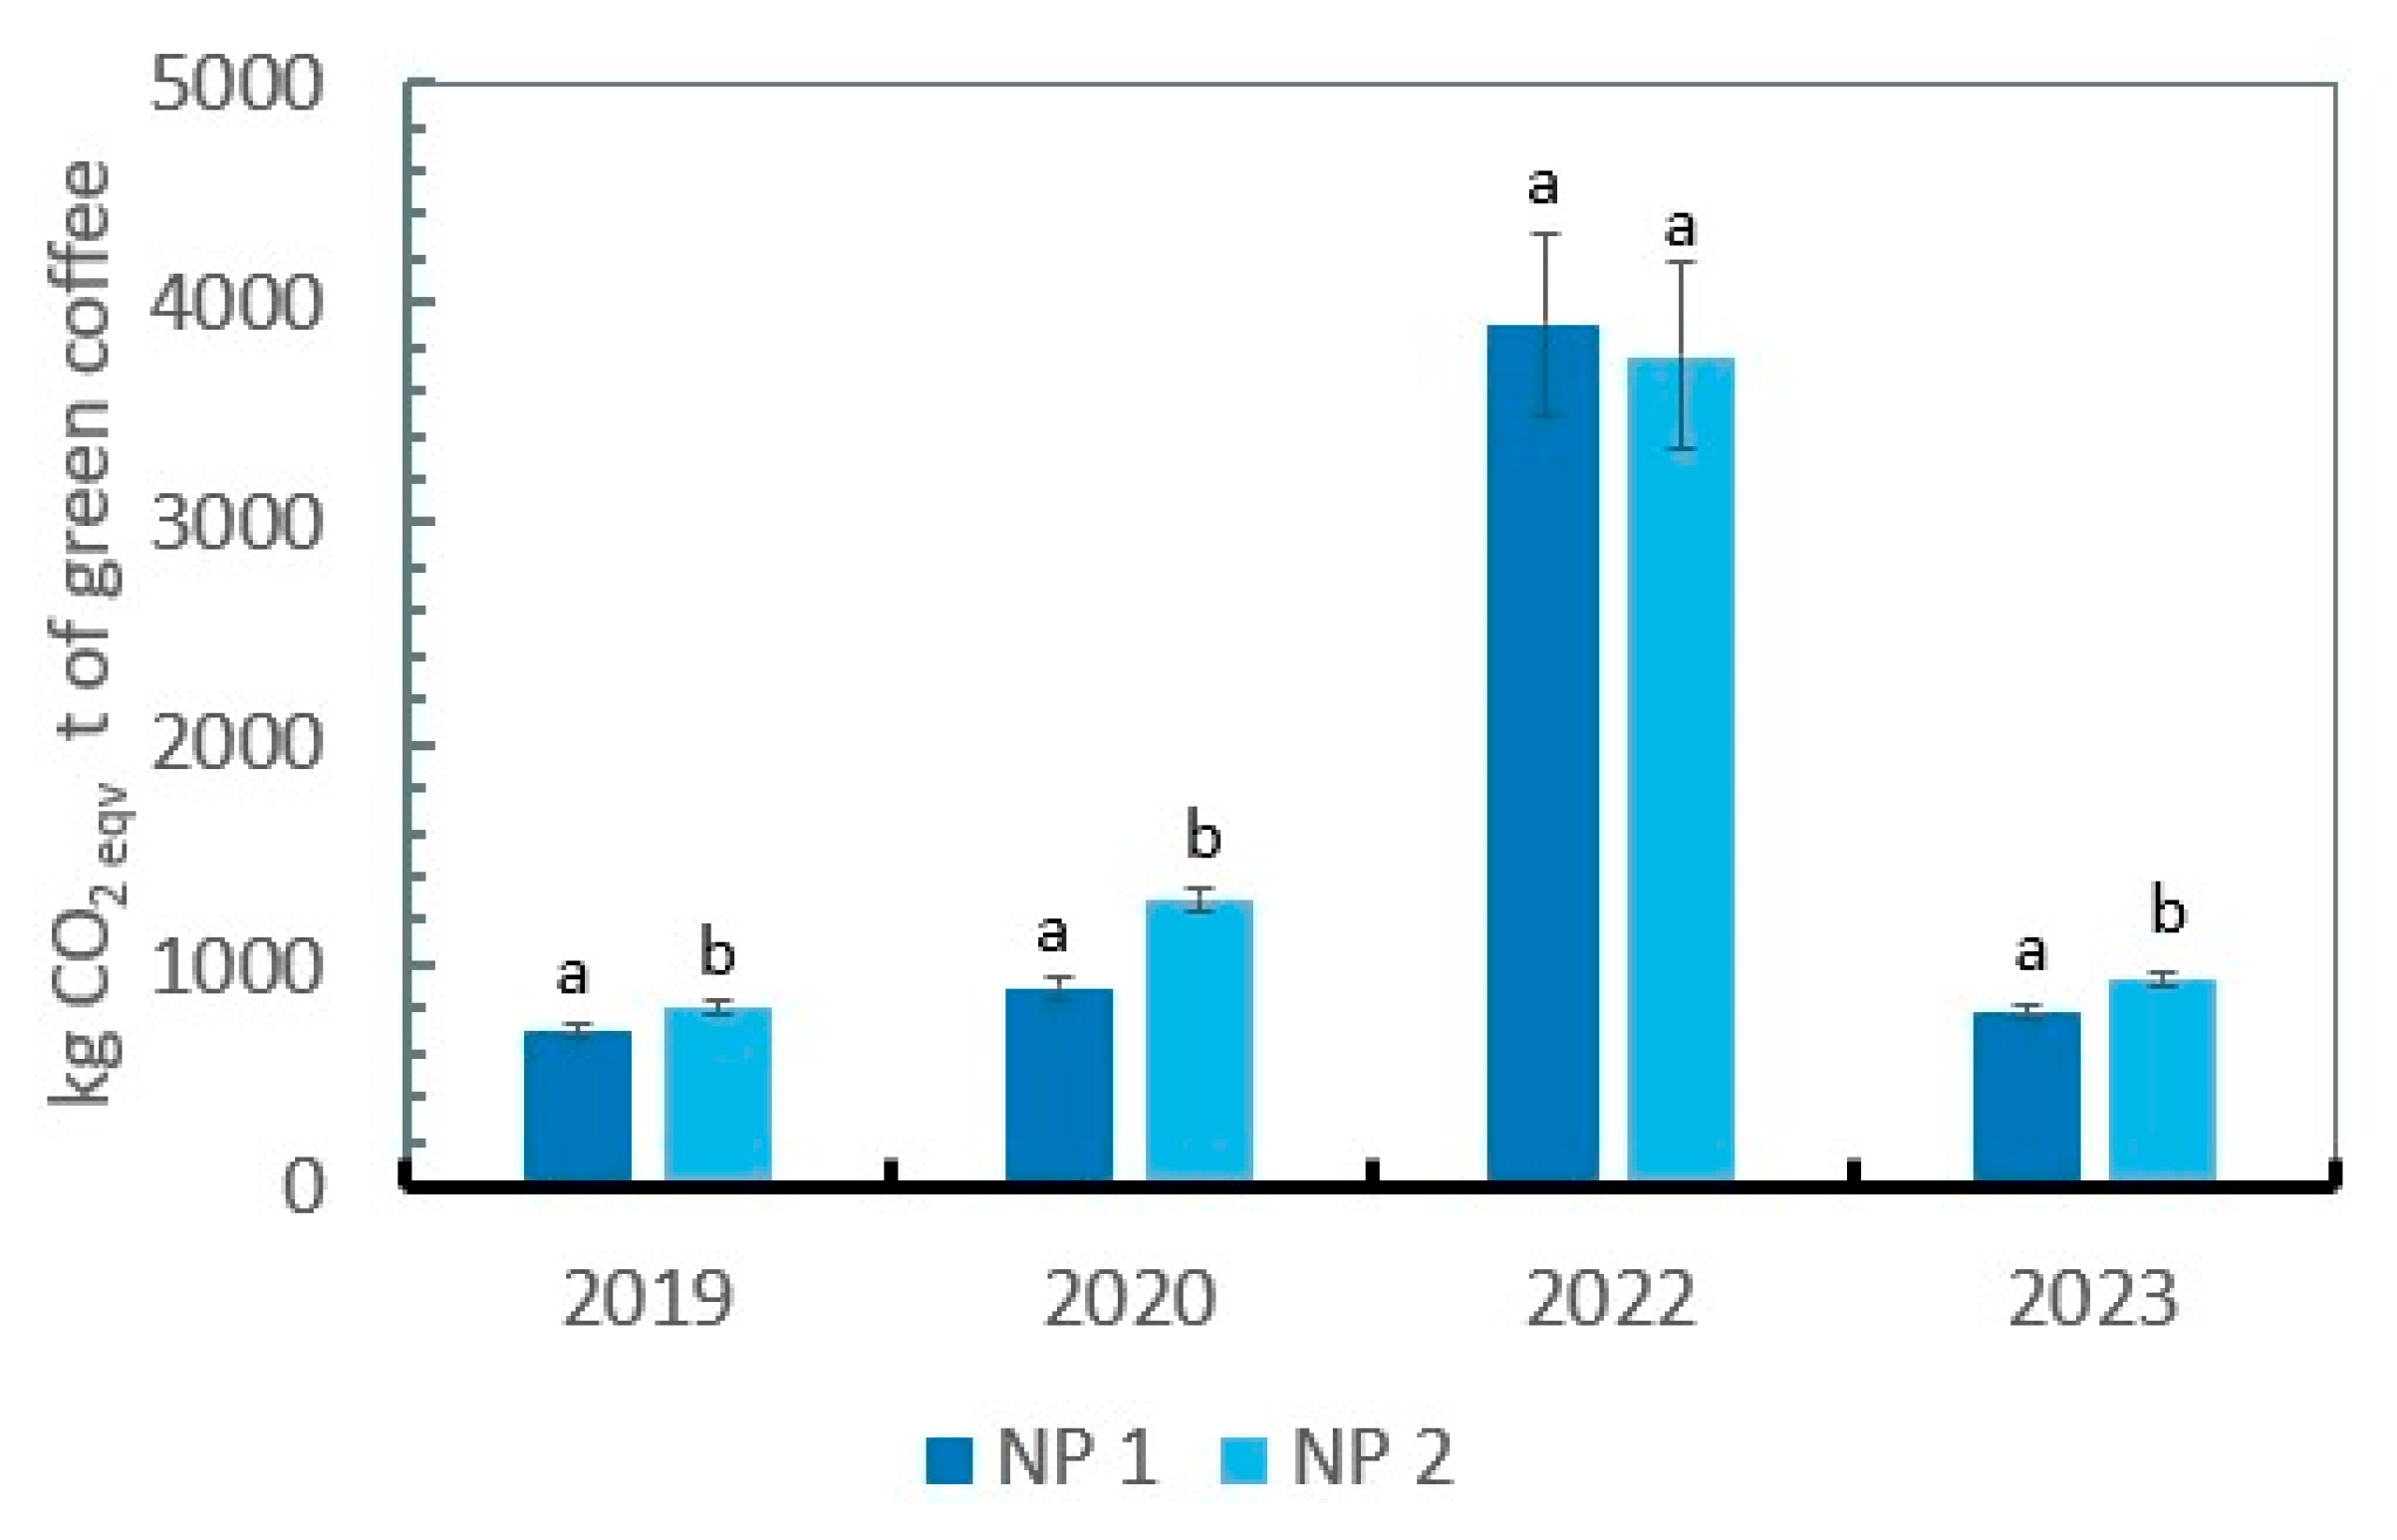
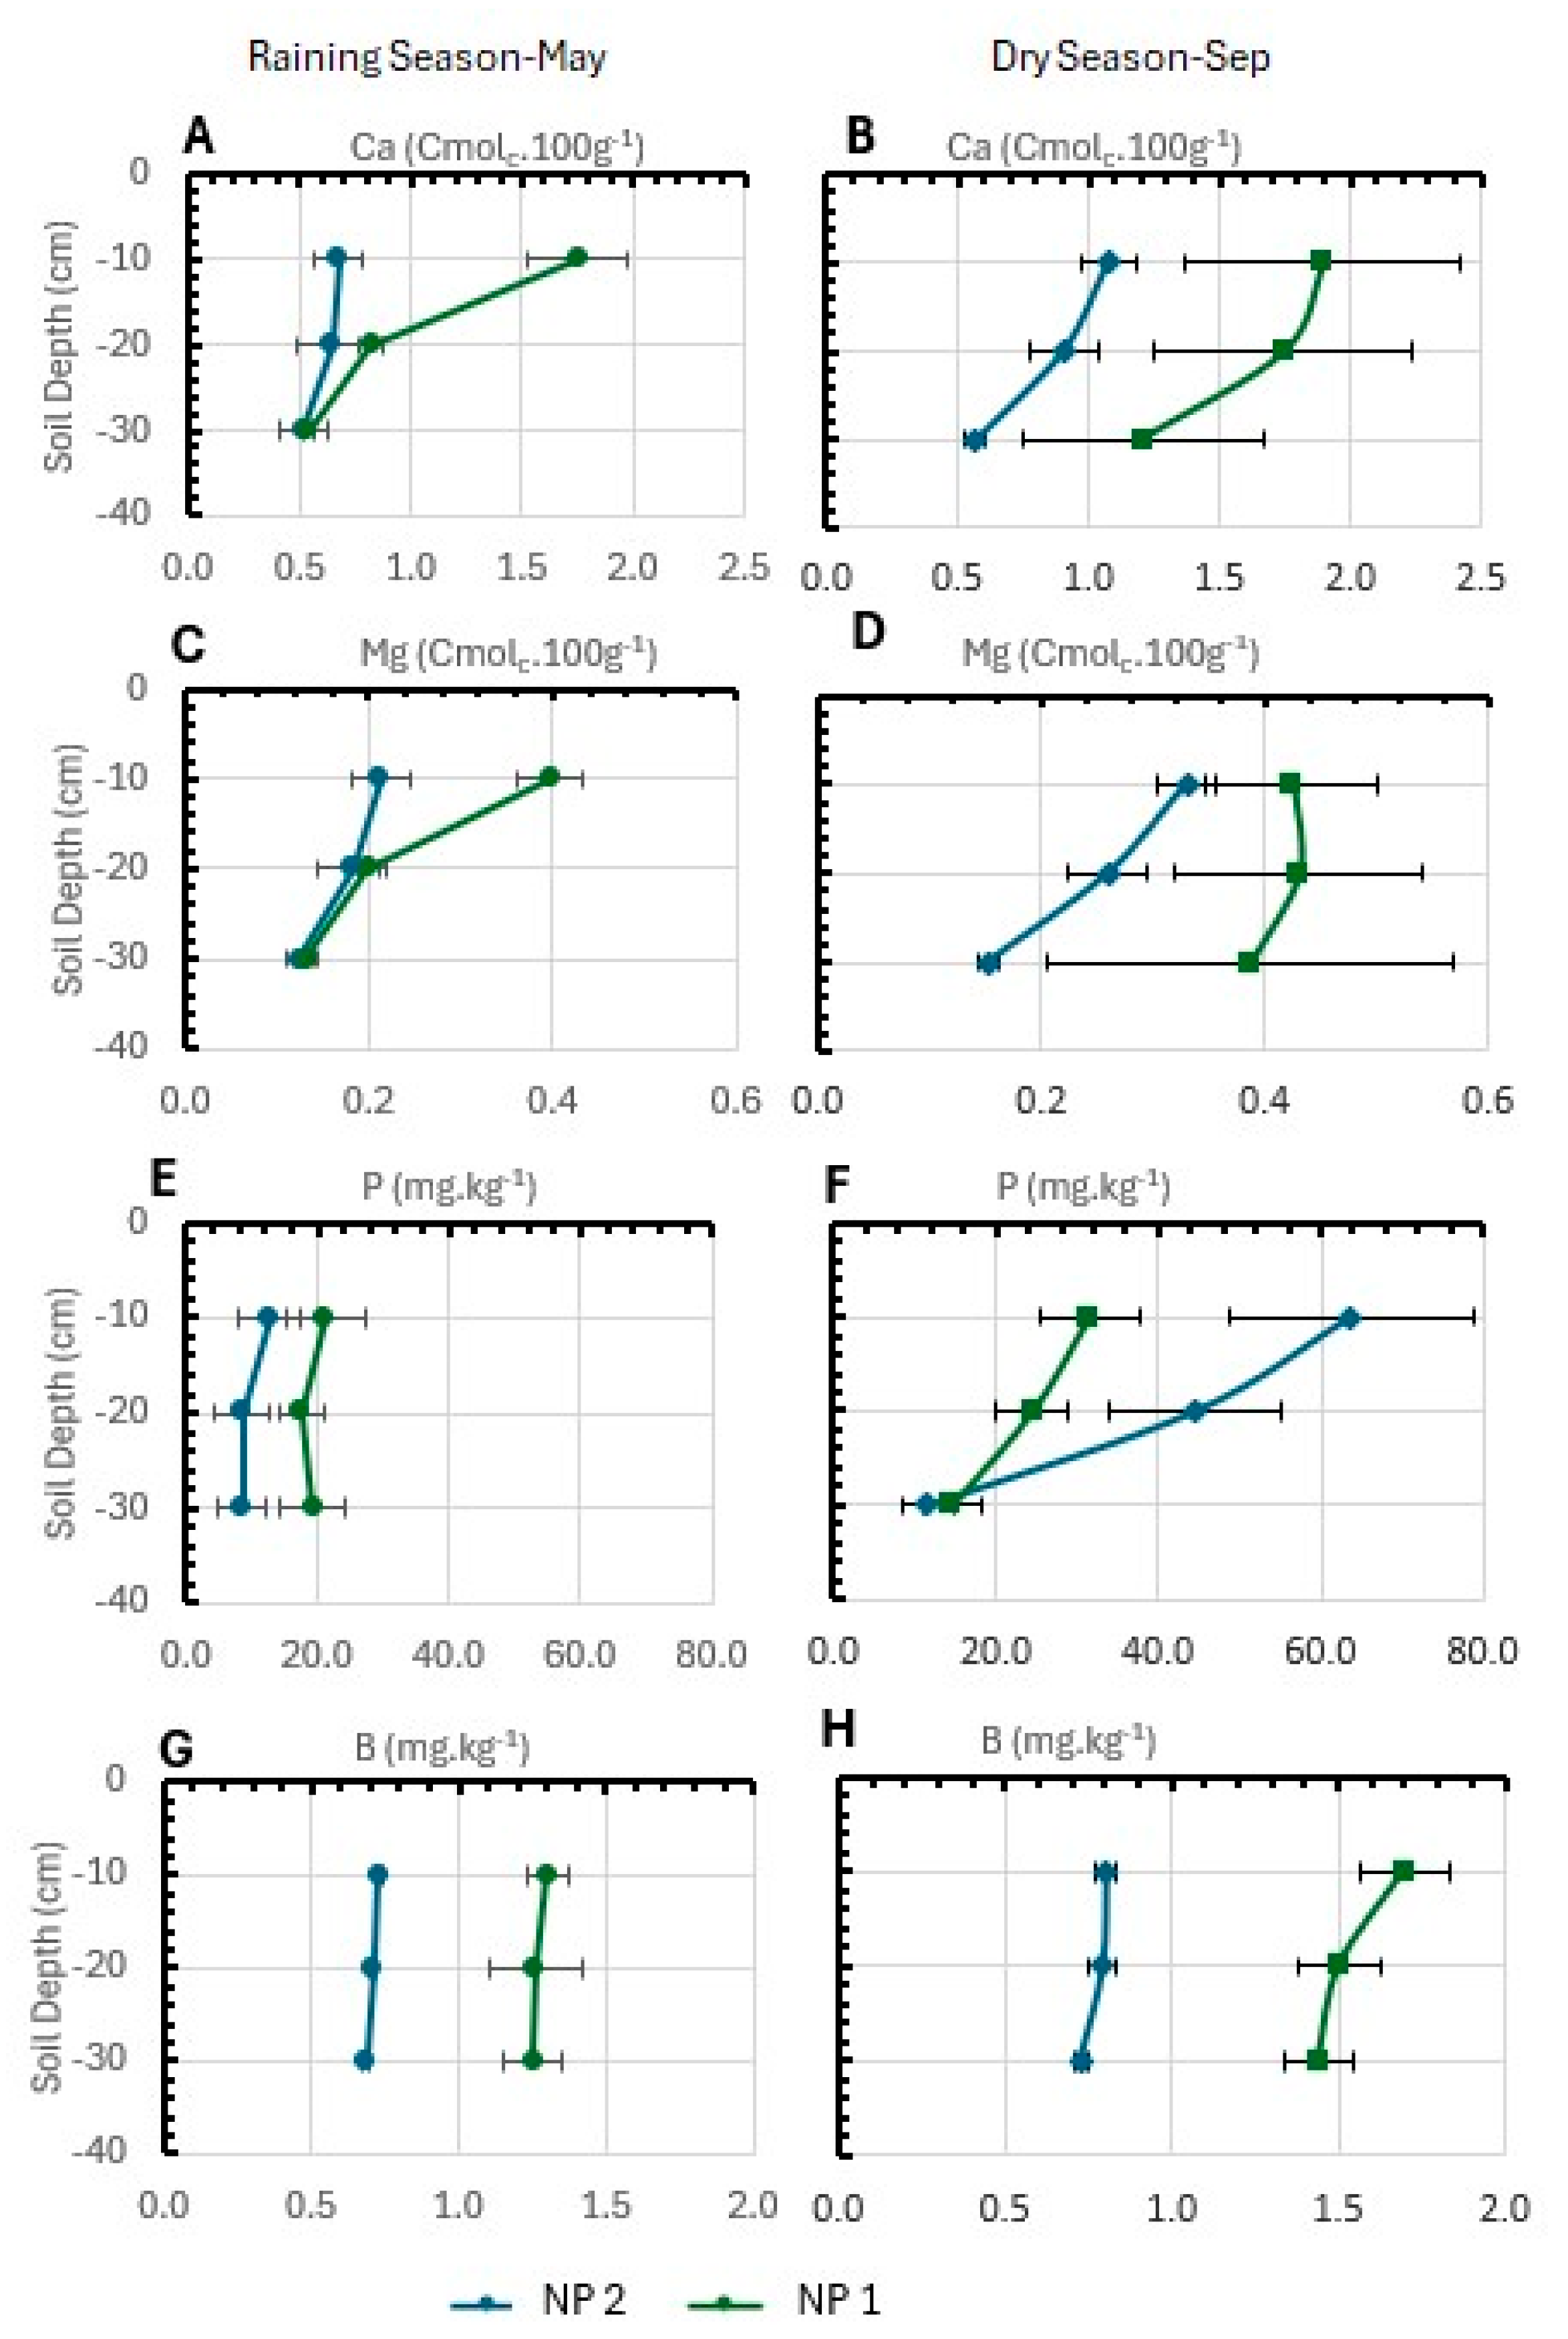
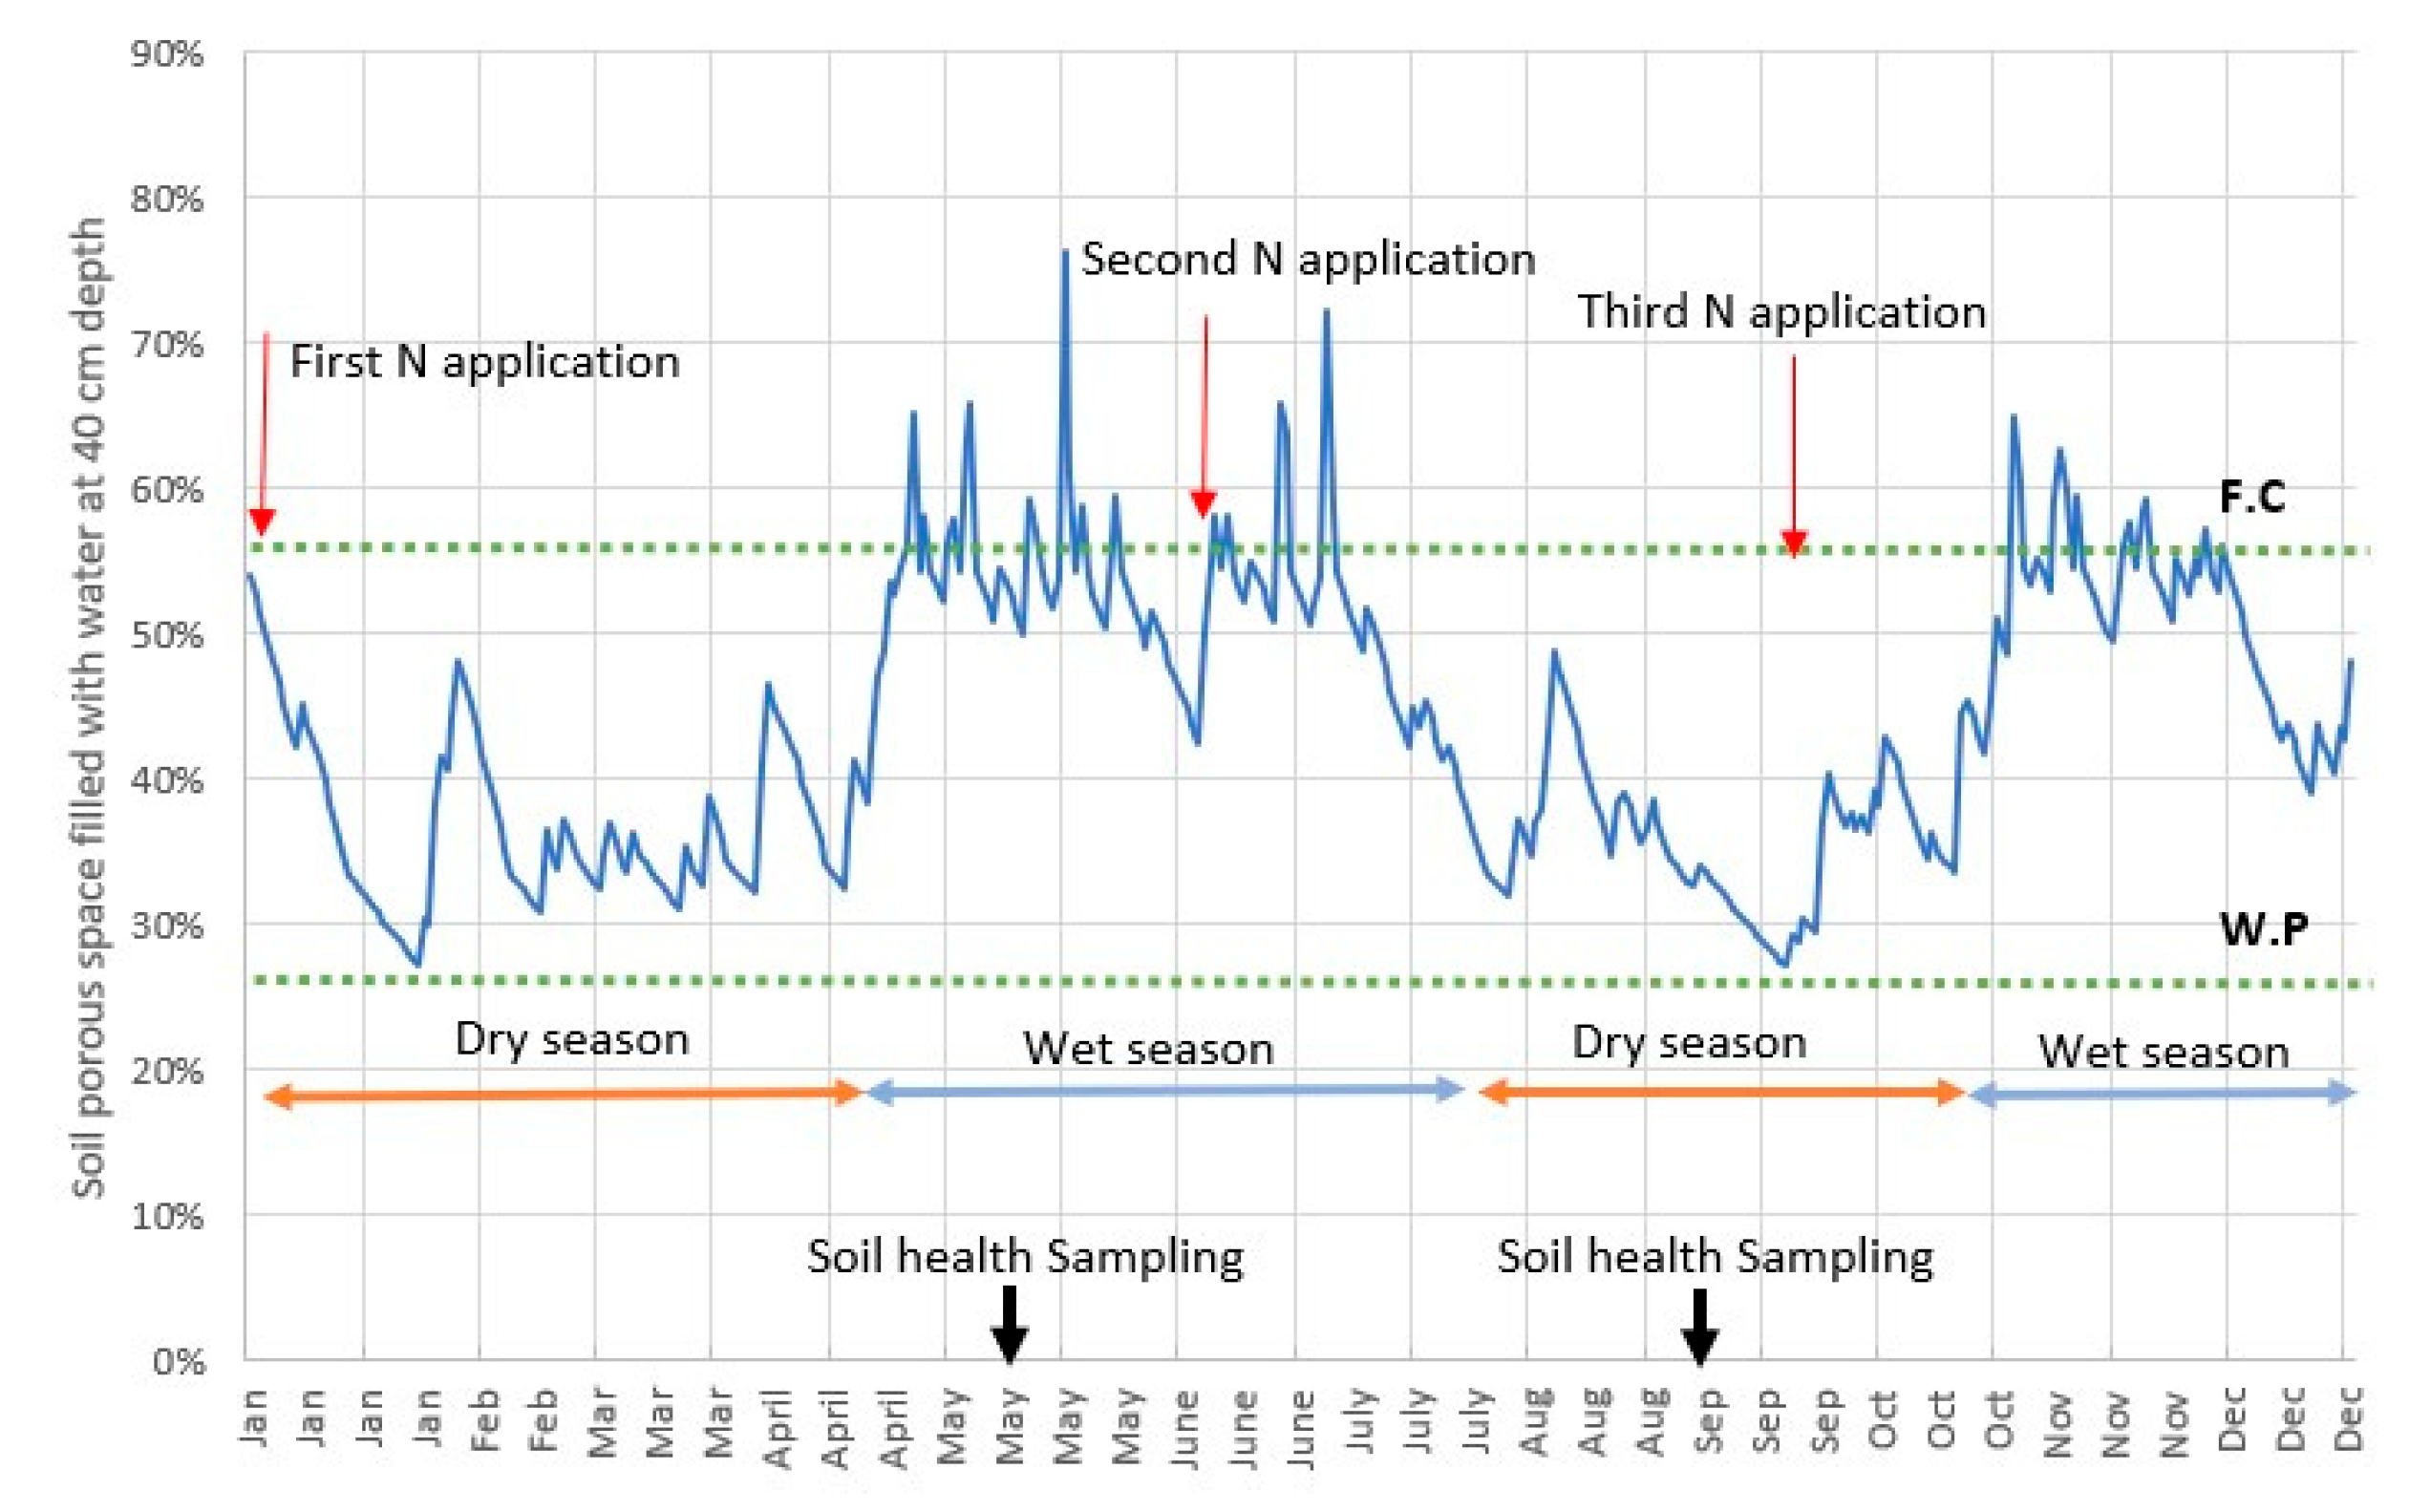
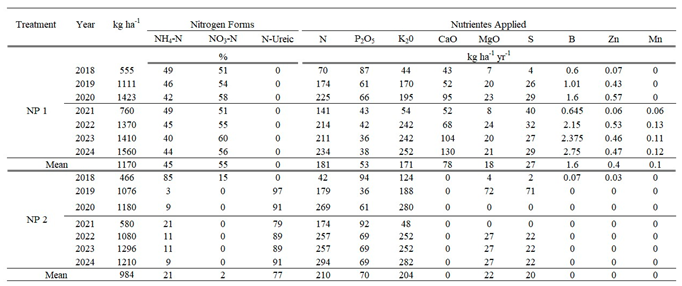
Nitrogen (N) is the most applied nutrient by the coffee farmers, followed by potassium (K), and phosphorous (P), without application of other important macronutrients like calcium (Ca), boron (B) and zinc (Zn). The study conducted in Colombia, in the Central-west coffee region during 2018 to 2024, evaluated the response of coffee (cv. Castillo®) with two different nutritional management practices (NPs) on productivity, nitrogen use efficiency (NUE), carbon footprint (CFP) and soil health. The NPs evaluated were NP1: Ammonium-nitrate based NPK with 15% less nitrogen containing the most important nutrients to produce coffee in acid soils (181 kg N, 53 kg P2O5, 171 kg K2O, 78 kg CaO, 18 kg MgO, 27 kg S-1.6 kg B,0.4 kg Zn, 0.1 kg Mn), and NP 2: Urea based NPK blend, representing common farmer practice (210 kg N, 70 kg P2O5, 204 kg K2O; 22 kg MgO and 22 kg S, without CaO). Both treatments were amended with dolomitic lime to increase base saturation (˃60%) and soil pH (˃5.0). After six years trial no significant differences on coffee yield were observed (2.55 and 2.50 t ha-1 of green coffee beans for NP 1 and 2, respectively), but significant differences occurred on NUE with 45% and 35% for NP 1 and 2, respectively, as well as for CFP, with significant differences during 2019, 2020 and 2023. Soil health indicators estimated by Solvita ® test including soil respiration and microbial biomass were significantly influenced by NP, soil depth and sampling time (wet season- May and dry season- September ), but other soil fertility parameters were less affected by soil moisture variation, with higher contents of Ca, Mg, S, B in the soil profile and lower soil acidity for NP 1 as compared to NP 2.

Keywords: 
;  ;  ;  

1. Introduction

Colombia, as the world’s third largest coffee producer, stands out for the high quality of its mild Arabicas, which constitute a fundamental economic basis for about 550,000 rural families [1]. However, in recent years there has been a decline in the productivity of the coffee sector, mainly due to climate variability and change; as well as various agronomic limitations, including the aging of coffee plantations, pressure and rust diseases caused by the fungus Hemileia vastatrix Berk & Broome, low levels of fertilization, and soil acidity [1,2]. In response to these challenges, the adoption of efficient nutrient management practices, particularly those related to the use of nitrogen (N), emerge as a key strategy to increase yields and reduce negative environmental impacts [3]. N plays a vital role in coffee tree nutrition and is considered one of the main limiting factors for growth and productivity [4,5]. However, inefficient management of N poses significant risks, such as losses from ammonia volatilization (NH3) and nitrate leaching (NO3-), as well as the emission of greenhouse gases such as nitrous oxide (N₂O) that compromise both environmental sustainability and economic viability [6,7].
Intensification of coffee production systems has been characterized by high planting densities and minimal shade coverage, followed by an increase in nutrient demand [8,9]. To meet this demand and optimize productivity, it is required to apply high volumes of fertilizers per hectare ranging between 1.100 and 1.300 kg ha-1 yr-1, to meet N needs between 250 and 300 kg N ha-1. Conventional fertilization practices in Colombia are based on single nutrient fertilizers or physical blends of urea, ammonium-diphosphate (DAP) and muriate of potash (MOP), and in some cases magnesium sulfate (MgSO4). These fertilizer blends usually have N-P2O5-K2O concentrations that vary between 26-4-22 to 23-4-20-3(MgO)-4(S). Although these sources are promoted for their economic accessibility and effectiveness in meeting the basic nutritional requirement of crops, high doses of ammonium from these sources are associated with significant drawbacks such as soil acidification [5,10], the inadequate provision of essential micronutrients [11], and substantial losses due to NH3 volatilization resulting from urea hydrolysis, which can range from 15% to 40% of N applied in the coffee-growing regions of Colombia [10,12].
Ammonia volatilization losses are significantly increased when urea is applied, due to the localized increase in soil pH in the application area during urea hydrolysis. This process consumes H⁺ ions, raising the pH even in acidic soils to levels favoring the conversion of NH₄⁺ to gaseous NH₃ [13]. In contrast, ammonium nitrate is not hydrolyzed and does not generate similar abrupt pH changes and, therefore, its application results in lower volatilization losses, usually less than 5% of applied N [14,15,16]. Fenilli et al. [16], showed that the volatilization of ammonia from urea can be up to seven times greater than that observed with ammonium-based fertilizers, and that under common field conditions it can exceed 40% of total mineral N applied.
Ammonium nitrate-based fertilizer is positioned as a superior alternative to traditional sources such as urea, not only because of its agronomic efficiency, but also because of its environmental advantages [13,17,18]. Ammonium nitrate-based nitrogen fertilizers provide an ideal balance between the nitric and ammoniacal forms of N, thus improving growth and nutrient absorption and physiological responses like higher photosynthesis rates, nitrogen assimilation, and maintenance of the cation-anion balance [5,19,20]. In addition, ammonium nitrate prevents the accumulation of potentially phytotoxic NH4+ and mitigates imbalances in essential nutrients such as K+, Ca2+, and Mg2+ [5] since NH4+ competes for absorption with other cations and additionally displaces the bases from the exchange sites on soil particles, increasing the risk of leaching [21] and soil and rhizosphere acidification [5,22]. A crucial consideration in fertilizer management is the incorporation of potassium chloride (KCl) from MOP into NPK blends. This practice introduces high Cl-1 rates at macro nutrient level which interferes with the absorption of nitrates and other anions (SO42-, HPO42-, HBO3-), harming the quality of coffee [23]. The anionic competition between chloride and NO3- reduces absorption and assimilation of NO3- by the plant and markedly decreases NUE [24].
Another contrasting aspect in coffee production in Colombia is that the average application of fertilizers at the country level is less than 500 kg ha-1year-1, equivalent to one third of the recommended levels [3,25]. This deficiency not only limits the productive potential of coffee plantations but also leads to the deterioration of natural soil fertility, such as a reduction in available nitrogen, reduction of exchangeable bases and micronutrients, as well as increasing soil acidity [18,22], which at the end means reduction of soil health.
The greenhouse emissions (GHG) due to human activities have led to an 1.1 °C increase in the global average temperature between 2011 and 2020 compared to the pre-industrial era from 1850 to 1900 [26]. In the Colombian coffee zone an increase in mean air temperature of 1.2 °C, approx. 0.3 °C/decade has been reported from 1970 to 2017 [27], as well as significant changes in minimum and maximum air temperatures from 1960 to 2012 [28], increasing the risk of diseases like coffee leaf rust generated by the fungi Hemileia vastatrix that reduced the coffee production in Colombia by 31% during 2008-2011 epidemic and in Central America by 16% in 2013 compared with 2011-12 [29].
At global scale, approximately 75% of GHG emissions are attributed to the energy, industry, transport and construction sectors, while 25% originated from agriculture and land use change, underscoring the urgency of addressing agricultural emissions [30]. Coffee production has been challenged by climate change, Bunn et al. [31] warns that the area suitable for coffee cultivation will be reduced by 50% in 2050 climate change scenarios. This could lead to the reduction of coffee cultivation or the exploration of new areas for planting, potentially affecting conservation areas, which in turn could manifest itself in environmental conflicts. To counteract this impact, various practices are proposed that include the use of improved varieties adapted to variable climate conditions, use of conservation strategies for native forests and agricultural soils as well as appropriate resource management, including crop nutrition and management strategies that promote soil health [32,33,34,35]. The production and use of mineral fertilizers, especially nitrogenous fertilizers, contributes by approximately 5% of greenhouse gas (GHG) emissions of the agricultural sector, due to fossil fuel consumption and the release of nitrous oxide and carbon dioxide in manufacturing processes, as well as direct emissions through the formation of N2O during nitrification and denitrification and indirect field emissions from ammonia volatilization and leaching losses [36,37].
Regenerative Agriculture (RA) has emerged as a new approach that attempts to support more sustainable crop production systems. In this direction and based on a scientific publications review, Shreefel et al. [35] defined RA as: “an a approach to farming that uses soil conservation as the entry point to regenerate and contribute to multiple provisioning, regulating ecosystems and supporting ecosystem services, with the objective that this will enhance not only the environment, but also the social and economic dimensions of sustainable food production”. The objective of this research was evaluation of the influence of two nutrient management practices in coffee on several indicators associated with the RA approach including nitrogen use efficiency (NUE), carbon footprint (CFP), and soil health.

2. Results

2.1. Influence of Two Nutrient Management Practices on Productivity and NUE

Coffee productivity was influenced by the type of pruning and the productive years after pruning, so in January 2018 a pruning known as skeletonization was carried out, which consisted of cutting the tree to a height of 1.8 m and all the lateral branches to 20 cm length. The first and second harvests (2019 and 2020) presented yields higher than 2.0 t of green coffee beans ha-1 yr-1 without being statistically different between treatments (Table 1). In January 2020, pruning of the trees was carried out again, using a stem trimming at a height of 0.3 m. This pruning, being more drastic, had a different productive behavior than pruning by skeletonization. The first harvest after stem trimming in 2022 was very low for both treatments, with less than 1.0 t of green coffee beans ha-1 yr-1 (Table 1). Productivity increased to levels above 2.0 t of green coffee beans ha-1 yr-1 in subsequent years, reaching average values throughout the production cycle of 2.50 and 2.55 t of green coffee beans ha-1 yr-1 in NP 2 and NP 1 respectively, without significant differences between NPs, indicating that reduced N application rate with NP 1 did not reduce productivity (Table 1).
NUE calculations resulted in significant differences between years after pruning and between treatments, NP 1 with 15% less N applied resulted in the highest NUE values with a mean NUE of 45% compared to NP 2 with an average value of 35% (Table 1). The NUE showed a direct relationship with productivity in both treatments. The N content of coffee leaves during the observation period was within the normal level for coffee which ranges from 2.4% to 3.0% [4], indicating that N rate in both treatments was not a limiting factor for productivity.
Between both treatments, no significant differences could be detected in the nitrogen content of coffee cherries as well as in the absorption of N per ton of coffee (Table 2). Therefore, differences in NUE between the treatments are attributable to differences in the doses of mineral N applied, and not to differences in N uptake or productivity, indicating higher efficiency of N uptake by NP 1.

2.2. Influence of Two Nutrient Management Practices on the Carbon Footprint

The calculated farmgate product carbon footprint (PCF) of green coffee showed significant differences between the NPs (Figure 1). In three out of four years the PCF differed between treatments with statistically lower PCF for NP 1 than for NP 2 with average values of 700, 900 and 780 kg CO2 eqv. t-1 of green coffee in NP 1 and 800, 1300 and 930 kg CO2 eqv. t-1 of green coffee in NP 2 for the years 2019, 2020 and 2023, respectively.
In 2022, the PCF was the highest across the years of observation with values of 3900 and 3760 kg CO2 eqv. t-1 green coffee for the NP 1 and NP 2, respectively, due to low yield of the first harvest after stem trimming.

2.3. Influence of Nutrient Management Practices on Soil Health Indicators

Six years after starting the trial, the nutritional programs showed differences in soil health parameters, such as organic carbon, soil respiration, microbial biomass, potentially mineralizable nitrogen and total nitrogen. Soil sampling was carried out during the rainy season in May 2024. NP 1 results in higher values for all five variables as compared to NP 2 (Table 3). Significant differences between NPs were also detected along the soil profile at three different sampling depths shown in Table 3 with significant decrease at deeper layers throughout the soil profile, with mean values for C.org of 5.33% and 4.49%; for soil respiration of 55.00 and 33.17 mg.kg-1, and potentially mineralizable N of 34.3 and 20.5 kg. ha-1 for NP 1 and NP 2, respectively.
The analysis of selected soil health indicators from the second soil sampling period during the dry season in September 2024 showed no statistical differences between treatments (Table 4). Sampling during the dry season resulted in higher average values of each of the five soil health parameters compared to the results from the rainy season for both treatments. However, similar tendency along the soil profile with decreasing values at deeper layers was found. No difference was shown between NPs on C.org, soil respiration, microbial biomass, nitrogen potentially mineralizable and total N, but significant differences between soil depths were shown in all those variables (Table 4).
Treatments application in 2024 were done: first on January 9 (dry season-Figure 4), second June 5 (wet season-Figure 4) after first soil-health sampling and third on September 4 (dry season-Figure 4) before second soil-health sampling. Also, the treatments applications during 2018 to 2023 were split into 3 applications during the year.
Nutrient management practices also influenced soil nutrient concentrations significantly after six years of treatment within soil depth at both sampling dates (Table 5, Figure 2 and Figure 3). Nutrients like K, Ca, P and B show significant differences between NPs at both sampling dates. K was significantly higher in NP 2 as compared to NP 1 during both sampling dates in wet and dry season (Figure 2E,F), mainly because NP 2 does not include soluble calcium, therefore K was the dominant exchangeable cation in the soil in NP2, while Ca concentration was significantly higher in NP 1 because this treatment included a soluble Ca application (Figure 3B), equilibrating the exchange cations in the soil. A similar observation was made for B in NP 1 as compared to NP 2 during both sampling periods (Figure 3G,H).
The higher concentration of nutrients on the soil profile in the second sampling period (dry season) as compared to the first one (wet season) can be explained with a fertilizer application between the sampling dates, which has contributed to significant increases of soil nutrient concentrations mainly in the first 0-20 cm (Figure 2 and Figure 3).
Soil acidity parameters expressed by pH and exchangeable Al were not significantly different between treatments in the first sampling during raining season but were significantly different between treatments in the second sampling during the dry season (Figure 2, Table 5). Soil pH significantly increases through the soil profile in NP 1 versus NP 2 after treatment application, while the Al exc, significantly increases in NP 2 across the soil profile in respect to NP 1 (Figure 2D) and respect to the values measured in May during the wet season (Figure 2C).
Soil porous space filled with water (WFP) at 40 cm, during 2024, shows the soil water content variation during the year and defines well two dry seasons between January to April and August to October and two wet seasons between April to July and October-November (Figure 4). During the dry seasons, soil moisture level ranges between wilting point and field capacity, whereas it is at or above field capacity during wet seasons.

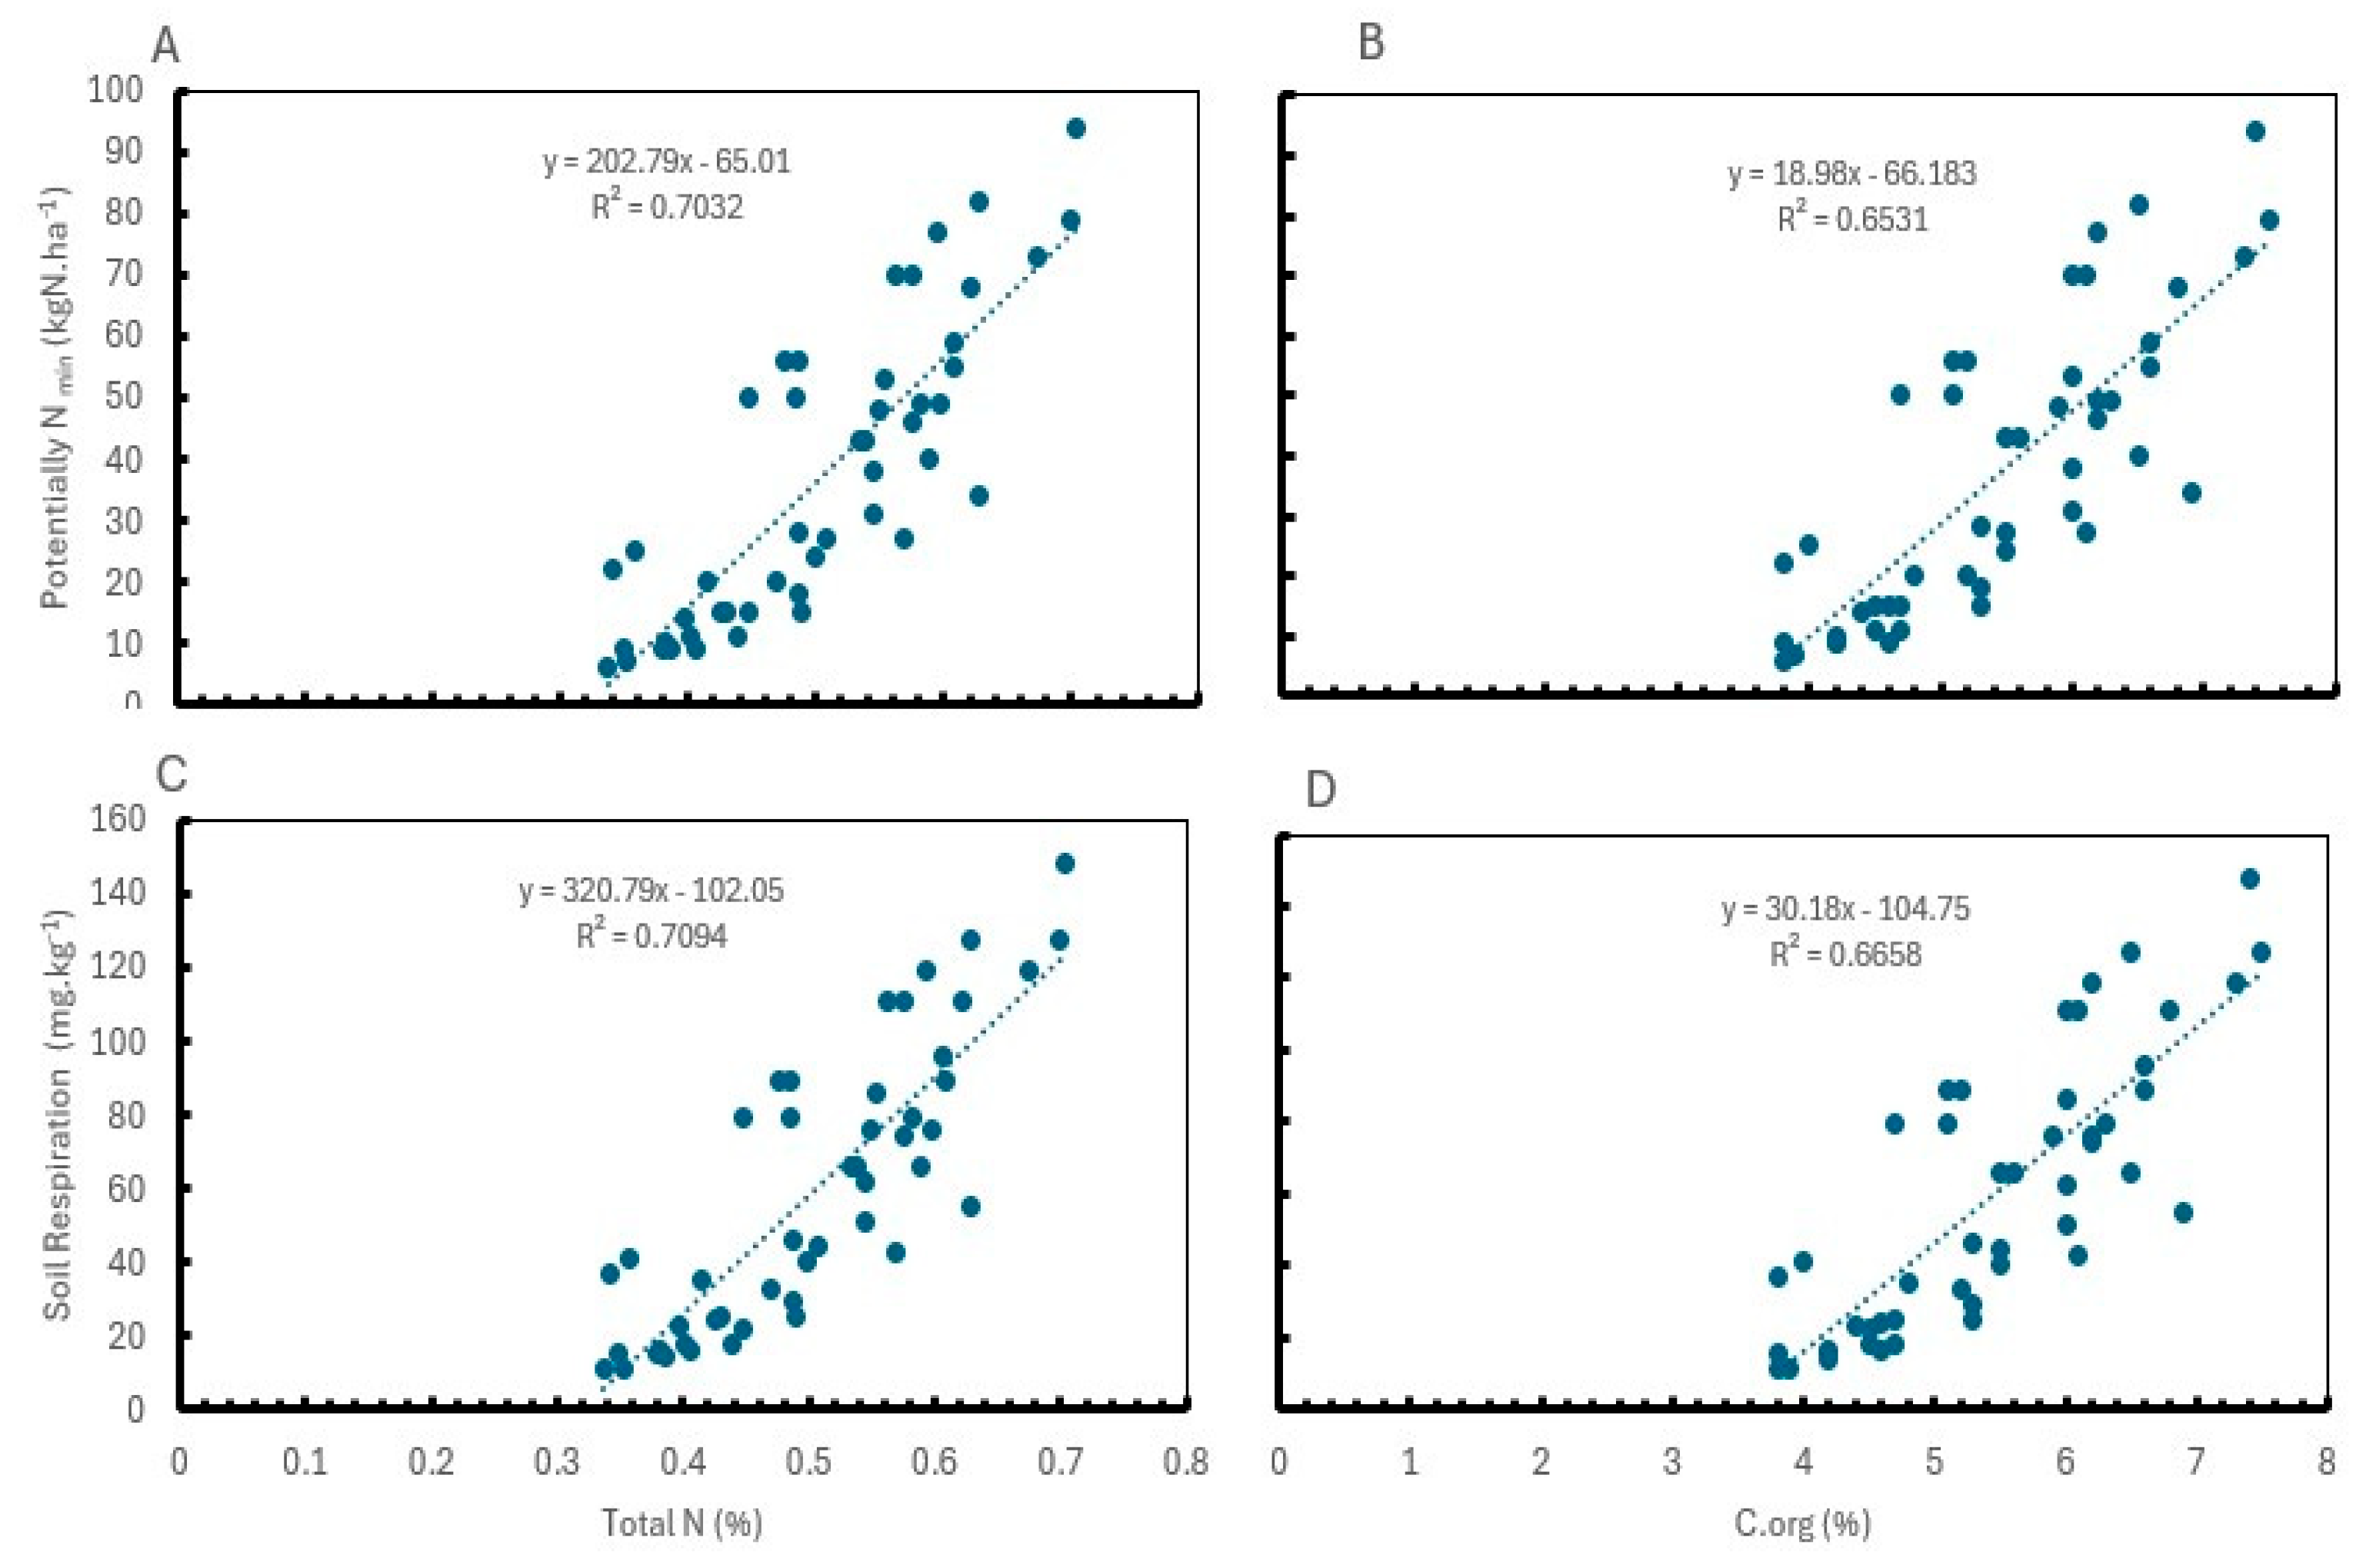
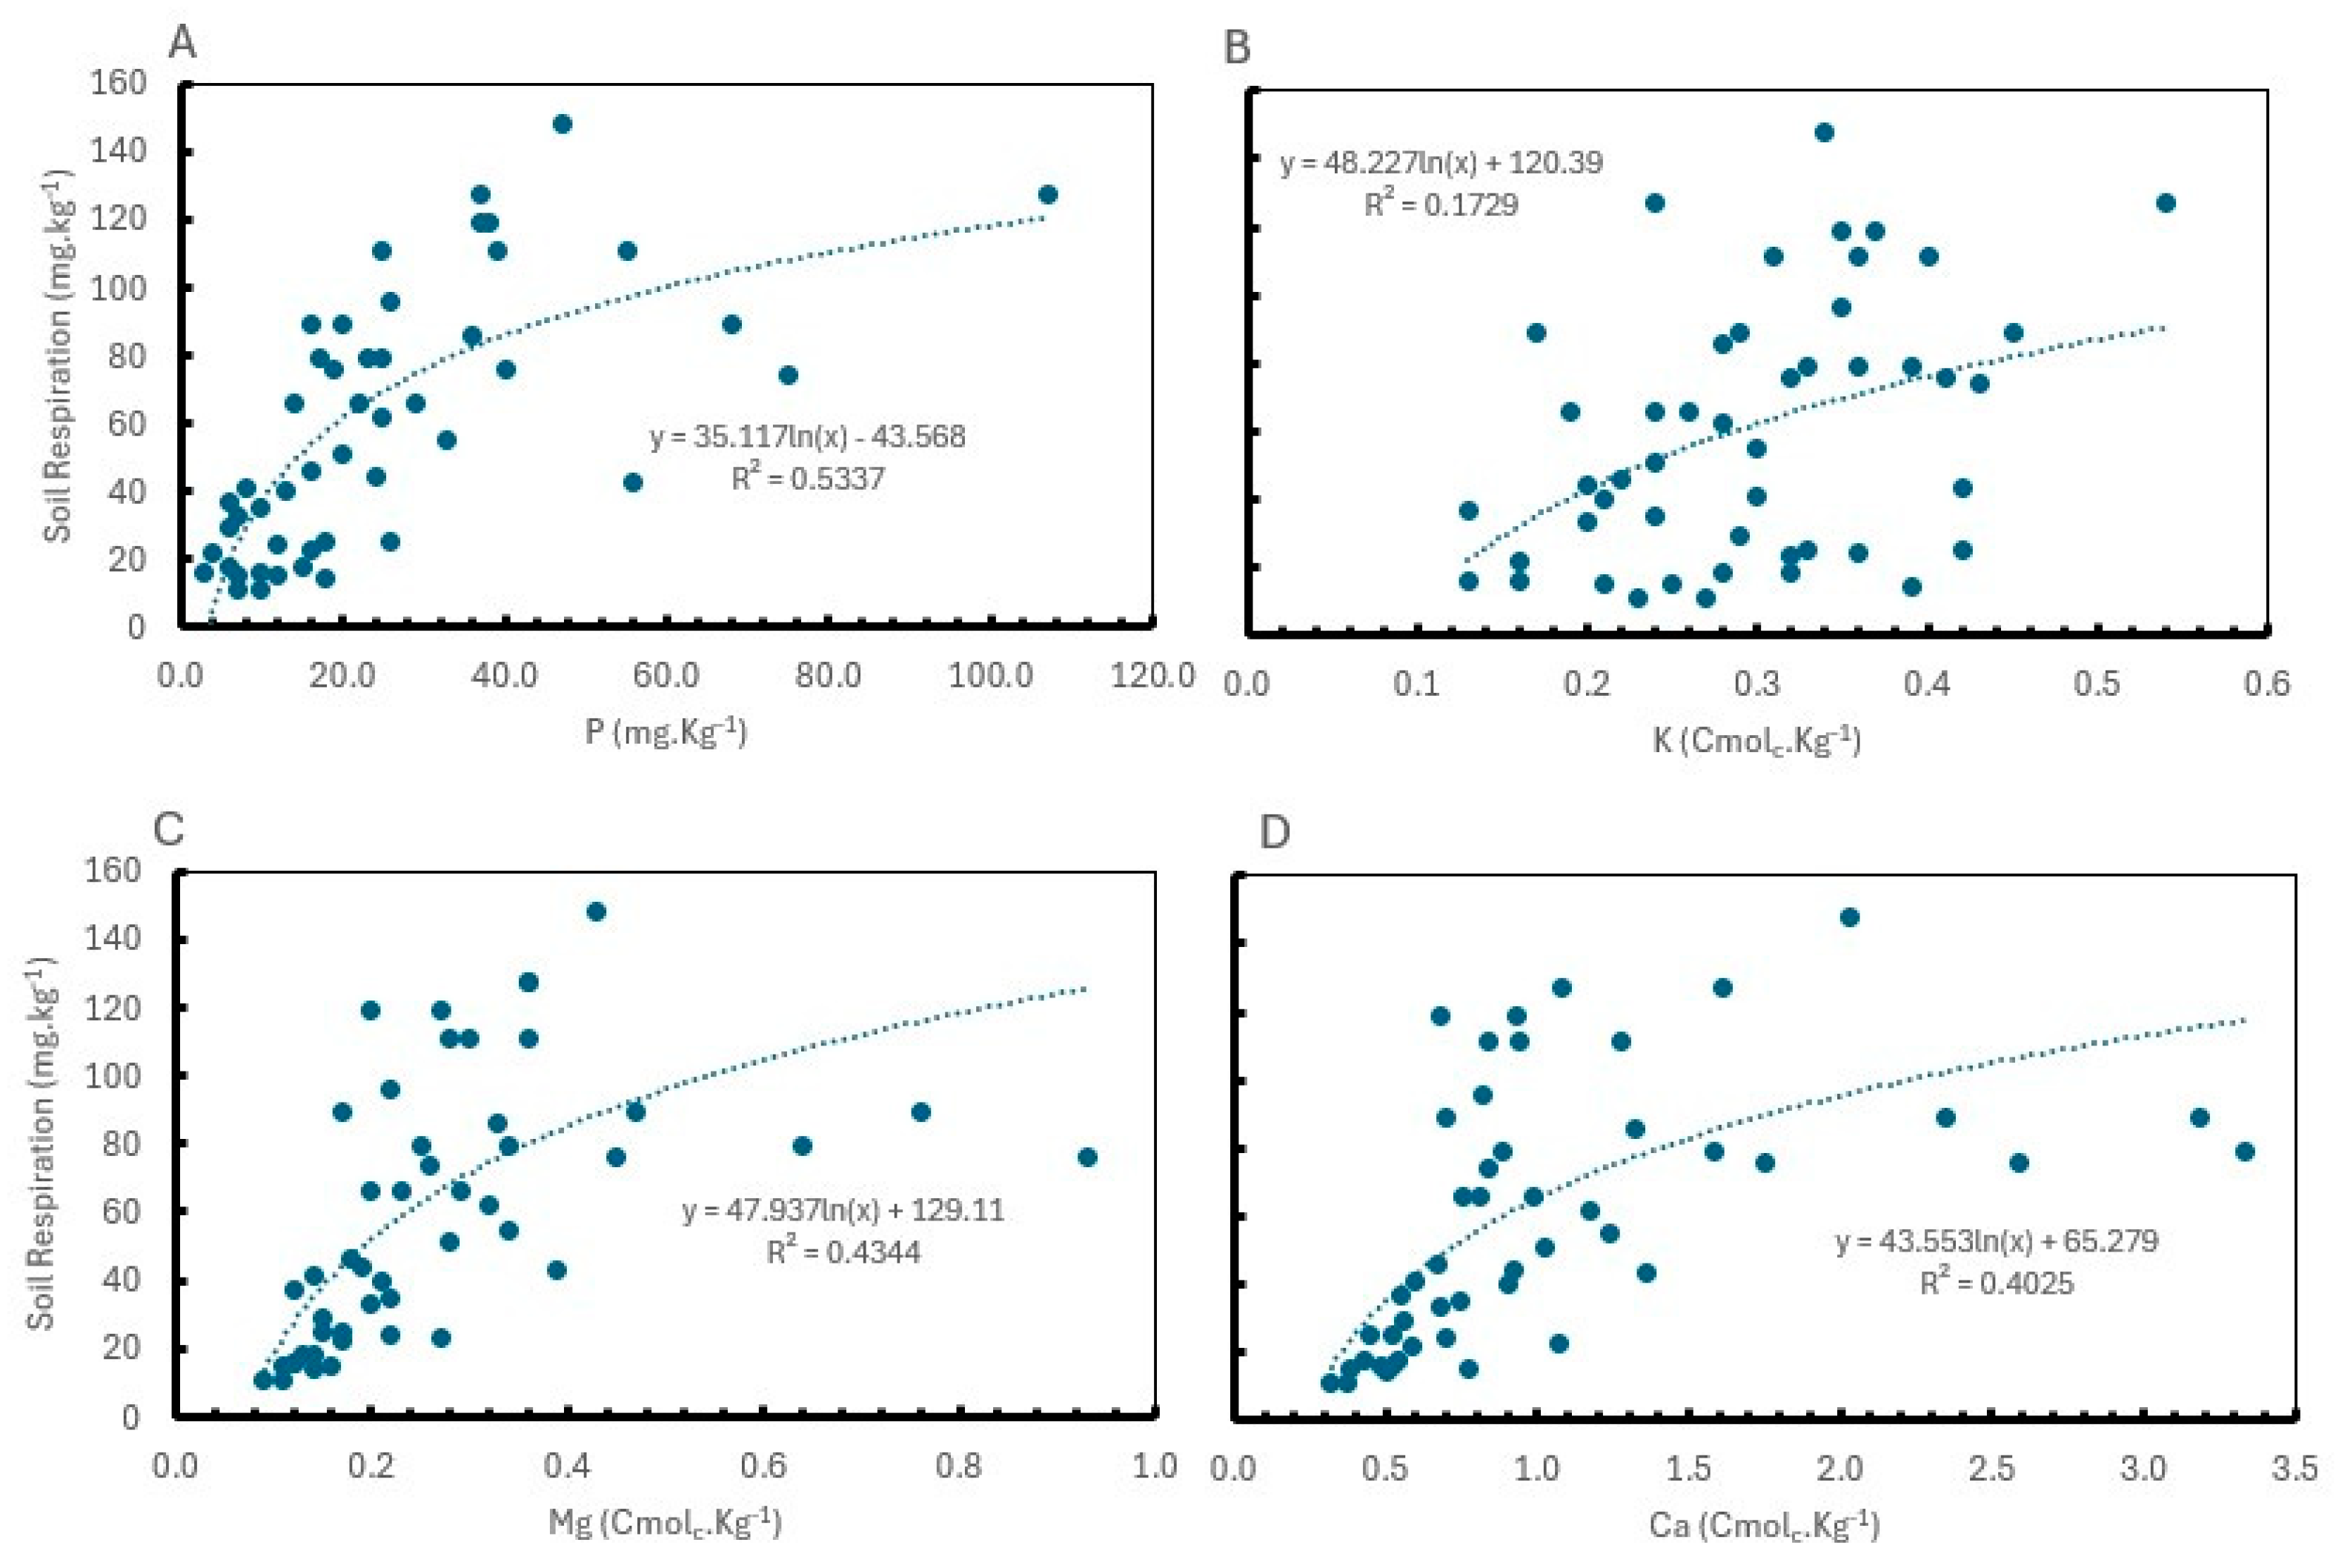
2.4. Correlation Between Soil Health Indicators

For the soil conditions of the current research project (Andisols -Typic Melanudands), total nitrogen content and C.org were positively correlated (p˂0.001) with soil respiration and potentially mineralizable nitrogen (Figure 5), with Pearson correlation coefficients ( r ) of 0.84 for the total N with potentially mineralizable nitrogen and soil respiration (Figure 5A,C) and, 0.81 and 0.82 for the C.org with potentially mineralizable nitrogen and soil respiration respectively (Figure 5B,D).
In the case of soil nutrient concentrations, significant (p˂0.001) and positive correlation were observed between soil respiration with P (r=0.65), Mg (r=0.52), and Ca (r=0.51) in the soil (Figure 6A,C,D), whereas potassium showed lower correlation with soil respiration with r= 0.42 (Figure 6B).

3. Discussion

Different factors can influence NUE of cropping systems including genotype, physiological as well as soil fertility factors [38]. From the fertilizer perspective, NUE is also affected by several factors such as soil fertility factors, metabolic pathway of the crop, climate, chemical form of the fertilizer used (e.g. urea, NH4+, NO3-), mycorrhiza availability, N rates, crop yield and others. Fertilizer management practices such as selection of fertilizer source, rate, method and timing of application of nutrients should be optimized based on soil, plant, and climatic factors to reduce nutrient losses due to leaching, denitrification, ammonia volatilization, runoff and fixation [38]. In this research it was possible to demonstrate that NUE in coffee changes across years because yield levels are influenced mainly by pruning practice, and also by nutrient management practices. With a nutritional program based on N sources with low potential for ammonia volatilization, balanced with other macronutrients such as K+, Ca2+ and Mg2+ and micronutrients, combined with a reduced N rate of 15% (NP 1) it was possible to achieve the same yield as in the conventional management system alongside a significant increase in NUE of green coffee (Table 1).
Nitrogen Use Efficiency (NUE) is not exclusively a function of nitrogen dose and source, but also of the synchronization between nitrogen availability and plant demand, which varies throughout the crop’s life cycle (in coffee, from year to year). This synchronization becomes effective only when nitrogen is supplied in adequate balance with other essential nutrients. The yield potential of high-performing crops is largely determined by the efficiency of nitrogen interactions with other nutrients [39]. Furthermore, efficient nitrogen uptake, translocation, and assimilation into productive biomass depends on a sufficient and balanced supply of both macro and micronutrients [40].
The interpretation of NUE is crop-specific, different crops have different NUE optimum ranges. For example, in cereals NUE is calculated based on grain N removal which contributes by about 75% to total N uptake into the plant. Thus, the target NUE as an indicator for good fertilizer management is between 75 and 90% of applied N. In coffee, NUE is calculated based on N removal by coffee cherries, which contributes by a much lower percentage to total N uptake into the crop. This is typical for perennials which store a huge part of nutrients in leaves and branches. Important amounts of N in coffee plantation are stored in the shoot biomass with 59% of the total N applied, followed by the roots with 12.4% [42]. Nitrogen uptake by the shoot biomass was not considered in the NUE calculation, because one of the aims of this research was to use an NUE indicator that could be easily scalable at famer level, without involvement of highly heterogenic information associated to the variation between coffee production systems and environmental conditions.
The carbon footprint, known as the amount of greenhouse gas (GHG) emissions generated throughout the life cycle of a product from production to final disposal, is a key indicator in the assessment of environmental sustainability. In the case of coffee production to farm gate, Van et al. [44] estimated an average product carbon footprint (PCF) of 8.3 kg CO₂-eq·kg⁻¹ of parchment coffee, with values across individual farms ranging from 3.3 to 18.8 kg CO₂-eq·kg⁻¹. The average PCF values in different production systems ranged from 6.2 kg CO₂-eq·kg⁻¹ in commercial polycultures to 10.8 kg CO₂-eq·kg⁻¹ in shaded monocultures. Published PCF estimates for coffee show a large variation globally, ranging from 0.4 to 20.1 kg CO₂-eq·kg⁻¹, depending on the methodology used, system boundaries, and production practices [25,45]. Some studies calculate the PCF choosing as a functional unit green coffee, while others use parchment coffee or coffee cherries [45]. In all cases fertilizer production and applications are considered as the highest contributor in coffee production with the system boundary set to farmgate. In the current research the PCF was significantly different between the two nutrient management practices under investigation as well as between years. In this research PCF was highly dependent of the crop productivity. In 2022, PCF for both NPs was almost four times higher compared to 2019, 2020 and 2023, due to low yield in the year after severe pruning. In that year, the NPs showed no significant effect on PCF, while for the other three years in this study, PCF of NP 1 was significantly lower than that of NP 2 due to higher yield and lower N input (Figure 1). Not all types of fertilizers used globally produce the same GHG emissions per unit of N. Gao and Cabrera [37] did a global analysis and revealed that urea and urea ammonium nitrate have some of the worst emissions performance because their decomposition in soil releases CO2 in addition to N2O.
Gao and Cabrera [37] indicate that a global emission reduction from factory to farm-gate can be achieved by replacing urea, and urea-based fertilizers with AN, with a maximum mitigation potential of this fertilizer substitution combined with other interventions (258 Mt CO2eqv yr-1 in 2050, 95% confidence interval 210-360 Mt CO2eqv yr-1). In this study, an N input reduction of 15% combined with a balanced nutritional program in long term coffee trial the farm gate PCF was reduced by a 6-year average of 8.3%. PCF reduction associated with N form is also dependent on the impact of N form on the crop yield. Vargas et al [46], reports that after 8 years trial and a mean N application rate of 400 kg. ha-1 resulted in an average coffee yield of 2.93 t. ha-1 for AN and 2.66 t. ha-1 for urea with a PCF reduction of 16% for AN compared to the urea.
Soil respiration methods based on lab incubation like Solvita CO2-Burst test, are an indirect measure for microbial activity by quantifying the CO2 produced from re-wetted soil during the incubation period [47,48]. This is an indicator of soil microbial activity that can be used as a rapid biological soil quality indicator and it is highly related to soil fertility [49,50]. The estimated microbial activity is related to microbes that are presumed to mineralize the labile C fraction first, followed by more stable fractions [51]. Labile C measurements are sensitive to changes in management practices (e.g. tillage, cover crops, rotation), environmental conditions (e.g. soil texture, landscape), and crop productivity (e.g. above ground biomass) [52,53,54,55]. Fontaine et al [54], demonstrates that the addition of fresh organic materials stimulates microbial respiration, and that fresh C deposits protect bury recalcitrant soil organic carbon below the deposits of fresh C, making important the short-term storage of carbon in vulnerable compartments (plant biomass, surfaces soil organic carbon). Coffee production systems have the capacity to produce an important amount of fresh biomass and accumulate it in upper soil layers that maintain a high level of soil respiration. Hergoualc’h et al [56] found in a 7 years old coffee plantations in Costa Rica under full sunshine growing conditions in Andosols 30.3 t.ha-1 of dry biomass representing 14.1 t of C.ha-1, partitioned in 18.0 t.ha-1 (8.5 t C.ha-1) in aboveground biomass, and 12 t ha-1 (5.6 t C.ha-1) in coarse roots, total fine roots and litter.
In this research, soil microbial activity based on availability of labile C sensitivity was influenced by soil moisture and long-term nutritional programs. Soil respiration and related variables were lower from soil samples taken during the rainy season and significantly different between nutritional practices (Table 3). In the dry season soil respiration and related variables were higher and not different between nutrient management practices. In the rainy season (April-June) the volumetric moisture content was above field capacity during several consecutive days, with a water-filled pore space (WFPS) up to 60% (Figure 4), while during the dry season (July – September), the volumetric moisture was below field capacity without reaching the wilting point with a WFPS between 50% to 28% (Figure 4). This indicates that soil respiration and other related parameters were affected by the reduction of available soil oxygen during the rainy season. Under such conditions NP 1 was able to keep the soil respiration at a higher level compared to NP 2. In this study, increased soil respiration is directly linked to significantly higher N content in NP 1 compared to NP 2, which is also explained by the direct correlation between total N and C.org (Figure 5). In this direction Zou et al. [57], analyzed various biotic and abiotic factors influencing soil respiration, and found that clay content, soluble nitrogen and the abundance and a-diversity of bacteria were the primary contributors to soil respiration.
During dry season, the balance between soil moisture and oxygen sufficient to motivate microbial activity in the soil independent of the nutritional programs. Additionally, total N content was higher and not significantly different between NPs, motivating higher soil respiration for both treatments. Soil respiration is highly influenced by soil moisture and tends to increase when the soil moisture increases to certain limit defined by WFPS. The ideal soil moisture content is near field capacity or approximately 60% of WFPS [58]. When WFPS is higher than 80%, soil respiration reduces to a minimum level, and most micro-organisms begin to use nitrate (NO-3) as alternative oxygen source for respiration [59].
Mac Bean et al. [51] analyzing several response trials in maize across eight Corn Belt states in the United States, found soil respiration decrease in four of the five trials that showed response to N fertilization. While added N fertilizer increases the labile pool of N, changes in soil pH and other soil and plant growth factors likely altered the soil microbial environment [57,60]. During the dry season soil pH decreased and Al3+exch increased in our study throughout the soil profile in NP 2, probably linked with the higher NH4+ content supplied in the nutritional program and lack of soluble Ca2+ application of this program. This increase in soil acidification did not reduce soil respiration or other biological parameters compared to NP 1. A positive correlation between exchangeable bases, mainly Ca2+ and Mg+2 as well as P indicated that soil fertility is an important contributor to soil respiration and that these fertility parameters are key indicators of soil health in highly organic and acid tropical soils like the Andosols. Hu et al. [55], found positive correlation between soil pH with microbial biomass carbon and b-glucosidase activity analyzing soils from eight sites in Northeastern Colorado.
Six years after treatment application, during both sampling times in wet and dry season, NP 1 consistently increased some soil fertility parameters like S, Ca, Mg, P and B throughout the soil profile. (Table 5, Figure 2 and Figure 3). This indicates that proper nutrient management practices including macro and micronutrient application in low fertility soils significantly increase soil fertility. Nutrients including NO-3, Ca, and B are directly linked with root growth activation and stress resistance in coffee [5,11,61]. De Castro-Lopes et al [62], working in the Cerrado soils of Brazil (Typic Dystrophic Red), demonstrated that P fertilization in tropical acid soils is an important practice to improve crop yield and to maintain or even increase the soil organic carbon, reporting a positive correlation between P content and soil respiration.

4. Materials and Methods

4.1. Location

A six years trial (2018-2024) was conducted in a coffee farm located in the Central-West region of Colombia in Chinchiná, Caldas, located at 4°56’43.0 “N 75°36’49.0 “W and 1.400 m of elevation, with a 2014 to 2024 average of 19.9 °C of mean air temperature, 16.0 °C and 26.6 °C min and max mean air temperature 77.3% of relative humidity and 2.290 mm rainfall (National Coffee Research Center-Meteorological Network, El Jazmin weather station).
The dominant soil type in the study has been classified as Andisols -Typic Melanudands order in accordance with the USDA-Soil Taxonomy [63]. The soil is characterized by good physical conditions and low natural fertility, i.e. soil pH of 4.67, 10.56% of soil organic matter, 8.44 mg.kg-1 of P, with 0.24, 0.93 and 0.24 Cmolc.kg-1 of K, Ca and Mg respectively, and soil particle distribution of 54% sand, 29% silt and 17% clay. The pH was determined in water (1:1), organic matter by Walkley–Black, P by Bray-II, and the exchangeable fraction of K, Mg, and Ca with 1 N ammonium acetate extraction (1 N NH4C2H3O2, pH 7.0). The cations in the extracts were detected using an ICP (Perkin Elmer, Optima 8000, Shelton, CT, USA), and soil texture analysis was performed using the Sedimentation-Bouyoucos method.
The trial was established in a coffee plantation (C. arabica L. var. Castillo®) planted in 2012, with an initial plant density of 6666 plants per hectare (1.0 m x 1.5 m planting distance). In January 2018, prior to treatment application, the plantation was renewed through structural pruning, consisting of cutting lateral branches at 20 cm from the main stem and topping the plant at 1.8 m height. Following three years of regrowth and two productive harvests, a second renewal pruning was carried out in January 2021 by cutting the stem at 30 cm above the ground. At that time, the planting density was adjusted to 10,000 plants per hectare.

4.2. Treatment Description

Previous studies have reported that balanced supply of NO₃⁻ and NH₄⁺ enhances nutrient uptake, crop productivity, and tolerance to abiotic stress [5]. Calcium is considered the third most important macronutrient in coffee, following nitrogen and potassium [58], and its combined application with boron has shown to improve both coffee productivity and soil fertility [11]. Synergistic interaction between calcium and potassium has also been associated with increased yields and enhanced water use efficiency in coffee cultivation [64]. Finally, ammonium nitrate-based nitrogen fertilizers have shown to produce significantly lower NH₃ volatilization losses compared to urea or ammonium-only fertilizers [10,12,13,15,18].
Based on previous scientific evidence, the trial set-up of this research project had the aim to test the hypothesis that a balanced nutritional program with on average 15% less nitrogen applied throughout the years of the study compared to a conventional program will increase coffee sustainability indicators (CFP, NUE and soil health parameters) without compromising the productivity. Based on this hypothesis, two mineral fertilization practices (NPs) were evaluated: NP 1, the ammonium nitrate-based compound NPK based on chemical NPK blends using ammonium nitrate and calcium nitrate with micronutrients (B, Zn and Mn) supplying less nitrogen than NP 2 and, NP 2 representing the conventional fertilizer recommendation which is a physical urea NPK blend described in this research as a urea based NPK blend with DAP, MOP and MgSO4 (Table 6). This research project was set up using a completely randomized experimental design with four replications, with a total area of 1880 m2 and plot area of 67 m2 with 67 plants per experimental unit.
Three years after trial initiation, after the second rejuvenation (stem trimming) in 2021, the soil acidity was corrected according to Favarin et al. [4] to achieve a base saturation of 70% in each individual plot. The soil conditions before liming were pHwater 4.8 and Al3+exc 1.8 Cmolc.kg-1, and base saturation 54%. The mean applied rate of dolomite lime (34.5% CaO, 16.4% MgO and 90% of neutralization capacity) was 0.70 t ha-1 for the NP 2 plots and 0.76 t. ha-1 for the NP 1, those lime requirements were not significantly different between treatments.
A water balance was estimated daily using the methodology described by Ramirez et al. [65] for coffee. Undisturbed soil samples were collected to measure required soil physical parameters required: Volumetric moisture content at field capacity and at wilting point was at 0.385 and 0.1940 cm3 cm-3, respectively, bulk density was 0.79 g cm-3, and porosity 69.5%.

4.3. Variables Evaluated

Productivity for each of the treatments was yearly evaluated as the sum of all the coffee harvests during the respective year. The distribution of the coffee harvest in the study area is distributed by 70% to 80% in the second half of the year, mainly between September to November, and the remaining 20% to 30% between April and June.
To calculate the extraction of N by the harvested coffee cherries, a representative sample of 500 g of coffee cherries per treatment was taken when the coffee cherries reached maturity - BBCH 88 [66]. The samples were oven dried at 60 °C for 24 h and sent to the laboratory for total N analysis using the Dumas elemental analysis method. Subsequently, the amount of N required per ton of green coffee was calculated, using a conversion factor of 4.8 kg of cherry coffee to produce 1 kg of dry parchment coffee, and a yield of 80% in threshing [67]. Nitrogen use efficiency (NUE) was calculated as the ratio between total N uptake by the coffee cherries divided by the total mineral N applied expressed in percentage [68]. Leaves samples per treatment and replications were collected during 2020, 2022 and 2023, and soil samples in 2020 and 2023, with the aim to monitor the influence of nutritional programs on N status in the plant and soil.
The carbon footprint (CFP) from factory to farm gate was calculated using Cool Farm Tool -CFT (Cool Farm Alliance). This tool is widely used by food chain companies to calculate a CFP of a product (https://app.coolfarmtool.org/), which calculates annual greenhouse gas emissions in CO2 equivalents (CO2-eqv) considering: 1) crop yield; 2) the form of production, origin and sources of fertilizers that contribute to CO2 and N2O emissions; 3) soil texture, carbon, and pH; (4) pesticide production; 5) use of energy sources; 6) methane emissions from wastewater generated during coffee pulping and fermentation and 7) soil based emissions following the protocol suggested by the IPPC intergovernmental panel [44]. The CFP for this trial was estimated yearly per replication during the harvest years of 2019, 2020, 2022 and 2023. During 2018 and 2021 no harvest was registered because these were years of vegetative growth after pruning.
In 2024, six years after treatment implementation, soil samples were collected during raining season (May) and dry season (September). Samples were collected per treatment and replication, sampling seven randomly selected points per treatment in three different depths 0-10, 10-20 and 20-30 cm. 500 g of soil per treatment, replication and depth were analyzed for soil fertility parameters using methods described above. For soil respiration analysis, 40 g of soil dried at 35 °C was sieved to 2 mmparticle size and placed into 50-mL plastic beakers containing a Whatman No 2 filter paper covering four 6.35 mm holes in the base, and wetted to 50% water-filled pore space. The wetted samples were placed into 8-oz jars with lids accompanied by a Solvita gel paddle (Solvita, Mount, ME, USA). The samples were placed in the incubator at 25 °C for 24 h. After incubation time the paddles were removed and placed in the Solvita ® digital reader for analysis of CO2 concentration [48]. Microbial biomass and potential N min were determined from the results of soil incubation by functions adjusted by Yara UK laboratory following the approaches proposed by Haney at al [69,70].

4.4. Data Analysis

Statistical analysis was performed using the Statgraphics Centurion version 14 V (Statgraphics Technologies, Inc., The Plains, VA, USA), and InfoStat version 2012 software packages [71]. An analysis of variance ANOVA was calculated in accordance with the trial design. To ensure the validity of the results, the data were subjected to evaluations of normality and homogeneity of variance and the comparison between means was performance using Fisher’s LSD test with 5% significance.

5. Conclusions

After six years field trial, a balanced nutritional program based on 55%NO3-N and 45%NH4-N, in balance with P, S, K, with soluble Ca and Mg, and micronutrients, supplying 15% less N input compared to the most common program used by coffee farmers based on urea-based NPK blend without soluble Ca and micronutrients was able to increase significantly NUE and soil health indicators and to reduce CFP from factory to farm gate without any reduction on productivity, N content in plant tissues and reduction in the total soil N.
Soil moisture changes during dry-wet season influenced soil respiration, and microbial biomass, as well as soil nutrient contents when the WFPS moves between FC and WP. Total nitrogen and soil organic carbon correlated positively with soil respiration and potentially mineralizable nitrogen, and soil respiration was positively correlated with some soil fertility parameters, mainly P, Mg and Ca concentration.

Author Contributions

For research articles with several authors, a short paragraph specifying their individual contributions must be provided. ANRJ, EOH Field trial implementation and data acquisition; JGG data analysis carbon footprint calculation, UL, MSM, PJ Paper preparation and review, VHRB trial conceptualization, implementation, data analysis, paper preparation.

Funding

This research was funded by Yara International.

Data Availability Statement

All data are included in the article.

Conflicts of Interest

The authors declare no conflicts of interest.

Abbreviations

The following abbreviations are used in this manuscript:
FC Soil volumetric moisture at field capacity
WP Soil volumetric moisture at wilting point
P.Nmin Potentially mineralizable nitrogen
NUE Nitrogen use efficiency
PCF Product carbon footprint

References

  1. Federación Nacional de Cafeteros Colombia-FNC. Informe del gerente 2023 al 92 congreso nacional de cafeteros 2023. 58p.
  2. Sadeghian, S. Soil acidity, a common limitation for coffee production (in Spanish). Avances técnicos, 2016; No 466, pp.1-8 www.cenicafe.org.
  3. Duque, H., Salazar, H., Rojas, L., & Gaitán, Á. (2021). Economic Analysis of Technologies for Coffee Production in Colombia (in Spanish). In Análisis económico de tecnologías para la producción de café en Colombia. 2021, Cenicafé. [CrossRef]
  4. Favarin, J.L.; de Souza, L.T.; Mazzafera, P.; Dimenstein, L. Soil correction and fertilization of irrigated coffee plants in production (In Portuguese). 2021, In Cafeicultura do Cerrado/Editores Técnicos Gladyston Rodrigues/Carvalho et al-Belo Horizonte; EPAMIG: Belo Horizonte, Brazil, 564p.
  5. Ramírez, B.V.H., Küsters, J., Thiele, E., & Lopez, J. Physiological and Agronomical Response of Coffee to Different Nitrogen Forms with and without Water Stress. Plants. 2024, Vol. 13, Page 1387, 13(10), 1387. [CrossRef]
  6. Cannavo, P., Harmand, J.-M., Zeller, B., Vaast, P., Ramírez, J.E., and Dambrine, E. Low nitrogen uses efficiency and high nitrate leaching in a highly fertilized Coffea arabica–Inga densiflora agroforestry system: a 15N labeled fertilizer study. Nutr. Cycl, Agroecosyst. 2013,95, 377–394. [CrossRef]
  7. Snyder, C. Enhanced nitrogen fertiliser technologies support the ’4R’concept to optimize crop production and minimize environmental losses. Soil Research. 2017, 55:463-472. [CrossRef]
  8. Wilson, K.C. Coffee, Cocoa and tea. Crop production science in horticulture series, 1999, 8 CABI, (UK). ISBN 0-85198-919-5.300p.
  9. Favarin, L, J.; Bernades, M.D.; de Souza, T.L.; Corte, B.J.L. Roads to improve productivity of arabica coffee (in Portuguese). Informaciones Agronomicas, 2018, 164. 6p.
  10. Sadeghian, S., & González-Osorio, H.Fertilizantes nitrogenados. Implicaciones agronómicas para el cultivo del café en Colombia. Avances Técnicos Cenicafé. 2022, 544, 1–8. [CrossRef]
  11. Ramírez, B.V.H., Küsters, J., Thiele, E., & Leal, L. Boron Nutrition in Coffee Improves Drought Stress Resistance and, Together with Calcium, Improves Long-Term Productivity and Seed Composition. Agronomy. 2024, Vol. 14, Page 474, 14(3), 474. [CrossRef]
  12. Leal, L., Salamanca, A., & Sadeghian, S. Urea Volatilization Losses from Coffee Plantations. Better Crops. 2010, 94. https://www.researchgate.net/publication/265233941.
  13. Cantarella, H., Mattos, Jr. D., Quaggio, J.A., and Rigolin, A.T. New trends in sugarcane fertilization: Implications for NH₃ volatilization, N₂O emissions and crop yields. Journal of Environmental Management. 2003, 342, 118233. [CrossRef]
  14. Freitas, T.; Bartelega, L.; Santos, C.; Dutra, M.P.; Sarkis, L.F.; Guimarães, R.J.; Dominghetti, A.W.; Zito, P.C.; Fernandes, T.J.; Guelfi, D. Technologies for Fertilizers and Management Strategies of N-Fertilization in Coffee Cropping Systems to Reduce Ammonia Losses by Volatilization. Plants. 2022 11, 3323. [CrossRef]
  15. de Souza, L.T., de Oliveira, P.D., Ferreira, S.C., Pereira, R.T.H., Campos, C.J.P., da Silva, R.E.R., Fernandes, J.T., de Souza, R.T., Ramirez, B.V., and Guelfi, D. Nitrogen fertilizer technologies: Opportunities to improve nutrient use efficiency towards sustainable coffee production systems. Agric. Ecosyst. Environ. 2023 345, 108317. [CrossRef]
  16. Fenelli, B. T.A.; Reichardt, K.; Favarin, J.L.; Bacchi, S.O.O.; Silva, L.A.; Timm, L.C. Fertilizer 15N balance in a coffee cropping system: A case study in Brazil. R. Bras.Ci.Solo. 2008 32:1459-1469.
  17. Cantarella, H., Mattos Jr., D., Quaggio, J. A., & Rigolin, A. T. Fruit yield of Valencia sweet orange fertilized with different nitrogen sources and the loss of applied N. Nutrient Cycling in Agroecosystems. 2003, 67(3), 215–223. [CrossRef]
  18. Sarkis, L., Dutra, M., dos Santos, C., Rodrigues, B., Urquiaga, S., & Guelfi, D. Nitrogen fertilizers technologies as a smart strategy to mitigate nitrous oxide emissions and preserve carbon and nitrogen soil stocks in a coffee crop system. Atmospheric Environment: X. 2023, 20, 100224. [CrossRef]
  19. Vaast, P., Zasoski, R. J., & Bledsoe, C. S. Effects of solution pH, temperature, nitrate/ammonium ratios, and inhibitors on ammonium and nitrate uptake by Arabica coffee in short-term solution culture. Journal of Plant Nutrition. 1998, 21(7), 1551–1564. [CrossRef]
  20. Carr, N. F., Boaretto, R. M., & Mattos, D. Coffee seedlings growth under varied NO3−:NH4+ ratio: Consequences for nitrogen metabolism, amino acids profile, and regulation of plasma membrane H+-ATPase. Plant Physiology and Biochemistry. 2020, 154, 11–20. [CrossRef]
  21. Arias S., E., Sadeghian K., S., Mejía M., B., & Morales L., C. S. Nitrogen leaching in some soils of the coffee zone and its relationship with texture (in Spanish). Cenicafé. 2009, 60(3), 239–252. Recuperado de https://biblioteca.cenicafe.org/handle/10778/154.
  22. Sadeghian, K.S.; Gonzalez, O.H. Response of coffee (Coffea arabica L.) to nitrogen sources and doses in the seedling stage (in Spanish).Cenicafé. 2014, 65,1:34-43.
  23. Santos, C., Malta, M. R., Gonçalves, M. G. M., Borém, F. M., Pozza, A. A. A., Martinez, H. E. P., de Souza, T. L., Chagas, W. F. T., de Melo, M. E. A., Oliveira, D. P., Lima, A. D. C., de Abreu, L. B., Reis, T. H. P., de Souza, T. R., Builes, V. R., & Guelfi, D. Chloride Applied via Fertilizer Affects Plant Nutrition and Coffee Quality. Plants. 2023, 12(4), 885. [CrossRef]
  24. Ramirez, V. H., Küsters, J., Thiele, E., Leal-Varon, L. A., & Arteta-Vizcaino, J. (2023). Influence of Variable Chloride/Sulfur Doses as Part of Potassium Fertilization on Nitrogen Use Efficiency by Coffee. Plants. 2023, 12(10). [CrossRef]
  25. Gmünder, S.; Toro, C.;Rojas, A.M.; Rodriguez, V.N. Enviromental Footprint of coffee in Colombia: Guide Document: 2020, 88p. Swiss cooperation Agency/FNC/Centro Nacional de Producción Mas Limpia/Insitu/Quantis. Available in: ENVIRONMENTAL-COFFEE-IN-COLOMBIA-1-comprimido.pdf.
  26. Pirani, A., Fuglestvedt, J. S., Byers, E., O’Neill, B., Riahi, K., Lee, J.-Y., Marotzke, J., Rose, S. K., Schaeffer, R., & Tebaldi, C. Scenarios in IPCC assessments: lessons from AR6 and opportunities for AR7. Npj Climate Action, 2024, 3:1, 3(1), 1–7. [CrossRef]
  27. Baker, P.; Alden, J.; Baranowski, P. The changing climate of the Colombia Coffee. Coffee and Cocoa International 2019, 46,2:1-5.
  28. Perez, R.E.P.; Ramirez, B.V.H.; Peña, Q.A.J. Spatial and temporal variability of the air temperature in the Colombian coffee zone (in Spanish). Investigaciones Geográficas, Boletín del Instituto de Geografía. 2016, UNAM, 89:23-40. [CrossRef]
  29. Avelino, J.; Cristancho, M.; Georgion, S.; Imbach, P.; Aguilar, L.; Bornemann, G.; Läderach, P.; Anzueto, F.; Hruska, J.A.; Morales, C. (2015). The coffee rust crisis in Colombia and Central America (2008-2013): impacts, plausible causes and proposed solutions. Food Security, 7:303-321. [CrossRef]
  30. Poore, J., Nemecek, T. Reducing food’s environmental impacts through producers and consumers. Science. 2018 360, 987–992. [CrossRef]
  31. Bunn, C., Läderach, P., Ovalle Rivera, O., & Kirschke, D. A bitter cup: climate change profile of global production of Arabica and Robusta coffee. Climate Change. 2015, 129(1–2), 89–101. [CrossRef]
  32. Lin, B.N.; Perfecto, I.; Vandermeer, J. Synergies between agricultural intensification and climate change could create surprising vulnerabilities for crops. BioScience. 2008, 58,9: 847-854. [CrossRef]
  33. Noponen, R.A.M.; Haggar, P.J.; Jones E.G.; Healey, R.J. Intensification of coffee systems can increase the effectiveness of REDD mechanisms. Agricultural Systems. 2013, 119:1-9. [CrossRef]
  34. Hijbeek R, van Loon MP, van Ittersum MK. Fertiliser use and soil carbon sequestration: opportunities and trade-offs. CCAFS Working. 2019, Paper no. 264. Wageningen, the Netherlands: CGIAR Research Program on Climate Change, Agriculture and Food Security (CCAFS). Available online at: www.ccafs.cgiar.org.
  35. Schreefel, L.; Shulte, R.P.O.; de Boer, I.J.M.; Pas Schrijver, A.; van Zaten, H.H.E. Regenerative agriculture- the soil is the base. Global Food Security. 2020, 26, 100404. [CrossRef]
  36. Brentrup, F., Lammel, J., Stephani, T., & Christensen, B. Updated carbon footprint values for mineral fertilizer from different world regions. 2018. LCA Food 2018 and LCA AgriFood Asia 2, 1. https://www.researchgate.net/publication/329774170.
  37. Gao, Y., & Cabrera, A. Greenhouse gas emissions from nitrogen fertilizers could be reduced by up to one-fifth of current levels by 2050 with combined interventions. Nature Food. 2023, 4:2, 4(2), 170–178. [CrossRef]
  38. Baligar, V.C.; Fragaria, N.K.; He, L. Nutrient uses efficiency in plants. Communications in Soil Science and Plant Analysis. 2001, 32:7-8, 921-950. [CrossRef]
  39. Grzebisz, W.; Diatta, J.; Barłóg, P.; Biber, M.; Potarzycki, J.; Łukowiak, R.; Przygocka-Cyna, K.; Szczepaniak, W.Soil Fertility Clock—Crop Rotation as a Paradigm in Nitrogen Fertilizer Productivity Control. Plants. 2022, 11, 2841. [CrossRef]
  40. Barłóg, P. Improving Fertilizer Use Efficiency—Methods and Strategies for the Future. Plants. 2023, 12, 3658. [CrossRef]
  41. Brentrup, F.; Lammel, J. Nitrogen Uses Efficiency, Nitrogen balance and Nitrogen productivity- a combined indicator system to evaluate Nitrogen use in crop production systems. Procedings of the International Nitrogen Initiative Conference, “ Solutions to improve nitrogen use efficiency for the world”. 2016, 4-8, Melbourne, Australia.
  42. Fenelli, B. T.A.; Reichardt, K.; Favarin, J.L.; Bacchi, S.O.O.; Silva, L.A.; Timm, L.C. Fertilizer 15N balance in a coffee cropping system: A case study in Brazil. R. Bras.Ci.Solo. 2008, 32:1459-1469.
  43. Salamanca, J.A.; Doane, A.T.; Horwalth, R.W. Nitrogen use efficiency in Coffee at the vegetative stage as influenced by fertilizer application method. Frontiers in Plan Science. 2017, 8, 223.11p. [CrossRef]
  44. Van, H., Schroth, G., Läderach, P., & Rodríguez, B. Carbon footprints and carbon stocks reveal climate-friendly coffee production. Agronomy for Sustainable Development. 2014, 34(4), 887–897. [CrossRef]
  45. Acharya, U.; Lal, R. Carbon accounting for coffee-base farming systems. 2021. World Coffee Research/Center for Carbon Management and Sequestration, Ohio State University, Columbus, OH. 43210, USA, 26p.
  46. Vargas, V.; Coser, T.; de Souza, T.R.; Brentrup, F.; Hesan, M.; Neves, C.; Bungener, S.; Otto, R.; Santana-Carvalho, M.C.;Guelfi, D.; Cantarella, H. Carbon Footprint in Agriculture: Insights towards neutral crop production and industry integration. Informaciones Agronomicas Nutricion de Plantas. 2023, 20:1-18. informacoes-agronomicas-2023.pdf.
  47. Alvarez, R., & Alvarez, C. R. Soil organic matter pools and their associations with carbon mineralization kinetics. Soil Science Society America Journal. 2000, 64, 184–189. [CrossRef]
  48. Haney, R.L.; Brinton, H.W., Evans, E. Estimating soil carbon, nitrogen and phosphorus mineralization from short-term carbon dioxide respiration. Communication in Soil Science and Plant Analysis. 2008, 39:2206-2720. [CrossRef]
  49. Franzluebbers, A.J.; Haney, R.L.; Honey, C.W.; Schomberg, H.H.; Hons, M.F. Flush of carbon dioxide following rewetting of dried soil relates to active organic pools. Soil Sci.Soc.Am.J. 2000,64:613-623. [CrossRef]
  50. Haney, R.L; Franzluebbers, A.J. Soil CO2 evolution: Response from arginine additions. Applied Soil Ecology, 2009,42,3:324-327. [CrossRef]
  51. Mac Bean, G.; Kitchen, R.N.; Veum, S.K.;Camberato, J.J.; Ferguson, B.R.; Fernandez, G.F.; Franzen, W.D.; Laboski, A.M.S.; Nafziger, D.E.; Sawyer, E.J.; Yost, M. Relating four-day soil respiration to corn fertilizer need across 49 U.S Midwest fields. Soil Sci.Soc.Am.J. 2020,84:1195-1208. [CrossRef]
  52. Culman, S. W., Snapp, S. S., Freeman, M. A., Schipanski, M. E., Beniston, J., Lal, R., Wander, M. M. Permanganate oxidizable carbon reflects a processed soil fraction that is sensitive to management. Soil Science Society of America Journal. 2012, 76, 494–504. [CrossRef]
  53. Hurisso, T. T., Culman, S. W., Horwath, W. R., Wade, J., Cass, D., Beniston, J. W., Ugarte, C. M. Comparison of permanganate-oxidizable carbon and mineralizable carbon for assessment of organic matter stabilization and mineralization. Soil Sci. Soc. of Am. J. 2016, 8,5: 1352–1364. [CrossRef]
  54. Fontaine, S.; Barot, S.; Barré, P.; Bdioui, N.; Rumpel, C. Stability of organic carbon in deep soil layers controlled by fresh carbon supply. Nature-Letters. 2007, 450,8:277-280. [CrossRef]
  55. Hu, X.; Machmuller, B.M.; Blecker, W.S.; Buchanan, M.C.; A.B.I.; Firth, G.A.; Ippolito, A.J. Comparising the soil management assessment framework to the Haney Soil Health test across managed agroecosystems. agronomy.2025,15,643. [CrossRef]
  56. Hergoualc’h, K.; Blachart, E.; Skiba, U.; Hénault, C.; Harmad, J.M. Changes in carbon stock and greenhouse gas balance in a coffee (Coffea arabica) monoculture versus and agroforestry system with Inga densiflora, in Costa Rica. Agriculture, Ecosystems and Environment. 2012, 148:102-110. [CrossRef]
  57. Zou, Y.; Shan, Y.; Yue, Z.; Giacchini, P.; Montechio, D.; Gaggia, F.; Alberoni, D.;Baffoni, L.; Zhang, Q.; Xiong, P.; Marzadori, C.; Gioia, D.D. Factors Driving Soil Respiration Rate After Different Fertilizer Sources Addition. Agronomy 2024, 14, 2468. [CrossRef]
  58. Linn, D.M.; Doran, J.W. Effect of Water-Filled Pore Space on Carbon Dioxide and Nitrous Oxide Production in Tilled and Non tilled Soils. Soil Sci. Soc. of Am. J. 1984, 48, 6:1267-1272. [CrossRef]
  59. US-Department of Agriculture & Natural Resources Conservation Service. Soil Respiration, Soil Health-Guides or Educators. 2022, 10p. https://www.nrcs.usda.gov/sites/default/files/2022-10/Soil%20Respiration.pd.
  60. Jones, D. L., & Shannon, D. Mineralization of amino acids applied to soils impact of soil sieving, storage, and inorganic nitrogen additions. Soil Sci. Soc. of Am. J. 1999, 63, 1199– 1206. [CrossRef]
  61. Ramírez, B.V.H., Küsters, J., de Souza, T., & Simmes, C. Calcium Nutrition in Coffee and Its Influence on Growth, Stress Tolerance, Cations Uptake, and Productivity. Frontiers in Agronomy. 2020, 2, 590892. [CrossRef]
  62. de Castro-Lopes, A.A.; Gomes de Sousa, D.M.; Montandon, C.G; dos Reis Junior, F.B.; Goedert, J.W.; Mendes, C.I. Interpretation of Microbial Soil Indicators as a Funtion of Crop Yeld and Organic Carbon. Soil Sci. Soc. of Am. J. 2013, 77, 461-472. [CrossRef]
  63. González, O.H. Identification of the main soil units in the coffee area. In Manual del Cafetero Colombiano: Investigación y Tecnología Para la Sostenibilidad de la Caficultura. 2013 Cenicafé; Federación Nacional de Cafeteros de Colombia: Bogotá, Colombia, Volume 1, pp. 269–283, (In Spanish).
  64. Ramirez, B. V.H.; Küsters, J. Calcium and Potassium Nutrition Increases the Water Use Efficiency in Coffee: A Promising Strategy to Adapt to Climate Change. Hydrology. 2021, 8, 75. [CrossRef]
  65. Ramírez, V., Jaramillo, A., Arcila, J., & Montoya, E. Estimación de la humedad del suelo en cafetales a libre exposición solar. Cenicafé. 2010, 61(3), 251–259.
  66. Arcila, J., Buhr, L., Bleiholder, H., Hack, H., Meier, U., & Wicke, H. Application of the extended BBCH scale for the description of the growth stages of coffee (Coffea spp.). Annals of Applied Biology. 2002, 141(1), 19–27. [CrossRef]
  67. Montilla, J., Arcila, J., Aristizábal, M., Montoya, E., Puerta, G., Oliveros, E., & Cadena, G. Characterization of some physical properties and conversion factors of coffee during the traditional wet milling process (in Spanish). Cenicafé. 2008, 59(2), 120–142.
  68. Dobermann, A. Nutrient use efficiency – measurement and management. Department of Agronomy and Horticulture: Faculty Publications. 2007. https://digitalcommons.unl.edu/agronomyfacpub/1442.
  69. Haney, R.L.; Haney, E.B. Simple and Rapid Laboratory Method for Rewetting Dry Soil for Incubations. Commun. Soil Sci. Plant Anal. 2010, 41, 1493–1501. [CrossRef]
  70. Haney, L.R.; Haney, B.E.; Smith, R.D.; Harmel, D. R.; White, J.M. The soil health tool- Theory and initial broad-scale application. Applied Soil Ecology. 2018,125:162-168. [CrossRef]
  71. Di Rienzo, J. A., Casanoves, F., Balzarini, M. G., Gonzalez, L., Tablada, M., & Robledo, C. W. Grupo InfoStat, FCA, Universidad Nacional de Córdoba, Argentina. 2016 InfoStat software estadístico versión 2012. Manual de usuario. InfoStat versión 2016. Acceso, 30(09).
Figure 1. Product carbon footprint for two mineral nutrition programs from factory to farm gate for four years (NP 1: Ammonium-Nitrate based compound NPK; NP 2: Urea based NPK blend). Different letters denote statistical differences between treatments LSD-Fisher (α 0.05). Statistical Analysis was done per year independently.
Preprints 182590 g001
Figure 2. Changes in soil fertility parameters after six years of application of two different nutrient management practices in coffee in three depths along the soil profile. A. Soil pH during raining season, B. Soil pH during the dry season, C. Exchangeable aluminum during rainy season, D. Exchangeable aluminum during dry season, E. Potassium during rainy season, F. Potassium during dry season, G. Sulfur during rainy season, H. Sulfur during dry season. ++NP 1: Ammonium-Nitrate based compound NPK; NP 2: Urea based NPK blend.
Preprints 182590 g002
Figure 3. Changes in soil fertility parameters after six years of application of two different nutrient management practices in coffee in three depths along the soil profile. A. Calcium during rainy season, B. Calcium during the dry season, C. Magnesium during rainy season, D. Magnesium during dry season, E. Phosphorus during rainy season, F. Phosphorus during dry season, G. Boron during rainy season, H. Boron during dry season. ++NP 1: Ammonium-Nitrate based compound NPK; NP 2: Urea based NPK blend.
Preprints 182590 g003
Figure 4. Soil porous space filled with water (WFP) at 40 cm depth changes during 2024. Rainy season May and dry season September. Dotted lines: Water content at field capacity (F.C) of the soil 55% and at wilting point (W.P) 28% at 40 cm depth.
Preprints 182590 g004
Figure 5. Correlation between: A. Total nitrogen with potentially mineralizable nitrogen, B. Soil organic carbon with potentially mineralizable nitrogen, C. Total nitrogen with soil respiration, and D. Soil organic carbon with soil respiration.
Preprints 182590 g005
Figure 6. Correlation between: A. Soil phosphorous content with soil respiration, B. soil exchangeable potassium content with soil respiration, C. soil exchangeable magnesium with soil respiration and, D. soil exchangeable calcium with soil respiration.
Preprints 182590 g006
Table 1. Yield, NUE and N content in leaves and soil for two nutrient management practices in coffee during 6 years of trial.
Year Yield (t ha-1) NUE (%) N content in leaves (%) Total N content in soil (%)
NP 1 NP 2 NP 1 NP 2 NP 1 NP 2 NP 1 NP 2
2019
2020
2021
2022
2023
2024
2.65
2.38
--
0.47
2.27
5.17
2.40
2.06
--
0.63
2.31
5.12
47.0b
49.0b
--
7.0a
44.0b
86.0b
37.0a
27.0a
--
8.0a
36.0a
68.0a
--
2.79
--
2.56
2.67
--
--
2.95
--
2.43
2.73
--
--
0.45
--
--
0.48
--
--
0.44
--
--
0.45
--
Mean 2.55 2.50 45.0B 35.0A 2.68 2.70 0.46 0.44
Years
Treatments
**
ns
**
**
**
ns
**
ns
+NP 1: Ammonium-Nitrate based compound NPK; NP 2: Urea based NPK blend. Different letters indicate significant differences, using Fischer test, ** α <0.01, * α <0.05, ns: no significant difference. Small letters indicate differences during the years, and capitol letter indicate between six years averages.
Table 2. Nitrogen content and uptake in coffee cherries and beans for two nutrient management practices for 2023 harvest year.
Treatment N content in the coffee cherries
(%)
N uptake per t of green coffee bean
kg t-1
NP 1
NP 2
1.85
1.77
38.3
36.7
Mean 1.81 37.5
p-value 0.2615ns 0.2574ns
+NP 1: Ammonium-Nitrate base NPK; NP 2: Urea base blend NPK. ns: no significant difference according to Fischer test, ** α <0.01, * α <0.05.
Table 3. Soil health indicators measured six years after treatment application, soil sampling during the rainy season (May 2024).
Treatment Soil depth C.org Soil respiration Microbial biomass P.Nmin¥ Total N
cm % mg kg-1 kg ha-1 %
NP 1 0-10 6.28c 82.50cd 1845.0cd 51.50cd 0.59d
NP 2 5.18a 60.00bc 1350.0bc 37.50bcd 0.48b
Mean 5.73C 71.25C 1.597.5C 50.50C 0.54C
NP 1 10-20 5.43b 59.75bc 1344.5bc 37.50bcd 0.51bc
NP 2 4.43a 20.00a 470.0a 12.25ab 0.40a
Mean 4.93B 39.90B 907.0B 24.9B 0.45B
NP 1 20-30 4.28b 22.75ab 530.5ab 14.0ab 0.39a
NP 2 3.88a 19.50a 459.0a 11.75a 0.35a
Mean 4.08A 21.10A 494.0A 12.9A 0.37A
NP 1 Mean 5.33B 55.00B 1240.0B 34.33B 0.49B
NP 2 4.49A 33.17A 759.67A 20.50A 0.41A
+Different letters denote statistically significant differences according to Tukey’s test with α= 0.05; *p-value < 0.05; **p-value < 0.01; p-value < 0.001. ++NP 1: Ammonium-Nitrate based compound NPK; NP 2: Urea base NPK blend. ¥ Potentially mineralizable nitrogen. Small letters indicate differences between treatments in each soil layer and capitol letter indicate between soil depth layers.
Table 4. Soil health indicators six years after treatment application, results from soil sampling during the dry season (September 2024).
Treatment Depth C.org Soil respiration Microbial biomass P. Nmin¥ Total N
cm % mg kg-1 %
NP 1 0-10 6.48cd 87.0bc 1944.0bc 54.5bc 0.60cd
NP 2 6.93d 100.0c 2230.0c 61.75c 0.64d
Mean 6.70C 93.5B 2087.0B 58.12B 0.62C
NP 1 10-20 5.93bc 82.25bc 1839.5bc 51.7bc 0.55bc
NP 2 6.28cd 100.0c 2230.0c 63.0c 0.59cd
Mean 6.10B 91.25B 2034.7B 57.3B 0.57B
NP 1 20-30 5.35ab 52.50ab 1185.0ab 32.75ab 0.49ab
NP 2 4.88a 26.75a 618.8a 16.5a 0.45a
Mean 5.11A 39.62A 901.9A 24.6A 0.47A
NP 1 Mean 5.92 A 73.92 A 1656.1A 46.33 A 0.55 A
NP 2 6.03 A 75.28 A 1692.8 A 47.08 A 0.56 A
+Different letters denote statistically significant differences according to Tukey’s test with an α = 0.05; *p-value < 0.05; **p-value < 0.01; p-value < 0.001. ++NPs 1: Ammonium-Nitrate base NPK; NPs 2: Urea base blend NPK. ¥ Potential mineralizable nitrogen. Small letters indicate differences between treatments in each soil layer and capitol letter indicate between soil depth layers.
Table 5. Pr ˃F-values from the statistical output (ANOVA 5%) for influence of two nutrient management practices in coffee on soil fertility parameters in the soil profile six years after treatment application.
Season/Soil parameter pH Al K Ca Mg P B S
Cmolc.kg-1 mg.kg-1
Wet season- May 2024
NPs 0.2087 0.8855 ˂0.0001* 0.0053* 0.054 0.0049* ˂0.0001** 0.2516
Soil depths ˂0.0001** ˂0.0001** ˂0.0001** ˂0.0001** ˂0.0001** ˂0.0001** 0.9337 0.0050*
Dry season-Sep 2024
NPs 0.0018* 0.0024* ˂0.0001*** 0.0127* 0.0623 0.0029* ˂0.0001* 0.1407
Soil depths 0.1942 0.0646 0.0029* 0.0812 0.2250 0.0001** 0.2267 0.0582
+NPs: Nutrient management practices. Tukey’s test with an alpha = 0.05; *p-value < 0.05; **p-value < 0.01; p-value < 0.001.
Table 6. Nutrients balance and rates during the study period.
Preprints 182590 i001
Disclaimer/Publisher’s Note: The statements, opinions and data contained in all publications are solely those of the individual author(s) and contributor(s) and not of MDPI and/or the editor(s). MDPI and/or the editor(s) disclaim responsibility for any injury to people or property resulting from any ideas, methods, instructions or products referred to in the content.
Copyright: This open access article is published under a Creative Commons CC BY 4.0 license, which permit the free download, distribution, and reuse, provided that the author and preprint are cited in any reuse.
Prerpints.org logo

Preprints.org is a free preprint server supported by MDPI in Basel, Switzerland.

Subscribe

Disclaimer

Terms of Use

Privacy Policy

Privacy Settings

© 2025 MDPI (Basel, Switzerland) unless otherwise stated