Submitted:
28 October 2025
Posted:
29 October 2025
You are already at the latest version
Abstract
Paper-based printing materials originate from the wood-based value chain–wood–pulp–paper–printing—and their yield reflects the utilization efficiency of pulp and paper resources. In roll-to-roll printing production, small printing defects (e.g., missing prints, smudges, cracks) often cause rework and scrap, thereby increasing the con-sumption of wood-derived materials. To improve resource efficiency, this study pro-poses a lightweight, improved YOLOv8n model for real-time small-defect detection. The Efficient IoU (EIoU) loss is introduced in the bounding box regression stage to im-prove localization accuracy, and a Squeeze-and-Excitation (SE) channel attention mechanism is embedded in the feature fusion stage to strengthen feature representation for small printing defects. Evaluations conducted on datasets collected from real pro-duction lines demonstrate that, with 3.02 M parameters and 8.1 GFLOPs, the model achieves mAP@0.5 = 94.1%, Precision = 95.1%, Recall = 94.3%, and an inference speed of 100.2 FPS, outperforming the baseline model. The proposed method contributes to re-ducing rework and material waste, supporting the efficient utilization of wood re-sources and the sustainable development of the paper-based packaging industry.
Keywords:
wood-derived paper products
; printing defect detection
; YOLOv8n
; EIoU loss
; SE attention mechanism
; real-time
; small-defect detection
1. Introduction
Paper-based printing materials are renewable and recyclable, making them an integral component of the circular bioeconomy and green manufacturing [1,2]. In roll-to-roll production, defects such as missing prints, smudges, and cracks—if not addressed promptly—can escalate into rework and scrap, resulting in additional material input and increased energy consumption. From a value-chain perspective, these losses manifest as greater pulp and paper-based material use and elevated carbon emissions across the entire forest–wood–pulp–paper–printing chain [3,4]. Therefore, enhancing the online recognition and rapid handling of small printing defects has become critical to improving the efficient utilization of wood-derived materials and advancing the sustainable development of green printing and packaging [5].
Traditional methods, such as morphological analysis and gray-level co-occurrence matrix (GLCM)–based approaches, rely on handcrafted features and typically employ classifiers such as support vector machines (SVMs) for defect discrimination. Although these methods are relatively stable in structured texture scenarios, their adaptability is limited when dealing with complex backgrounds, weak contrast, or small printing defects [6,7,8]. With the advancement of deep learning, detection performance has improved substantially. One group of studies focuses on mitigating small-target omission through graph learning and multi-scale feature fusion [9,10], while another leverages template matching and geometric alignment to enhance robustness under scale variation and text-like defect scenarios [11,12]. In wood-based applications, improved YOLOv8 models have achieved outstanding performance in multi-scale small defect identification on timber surfaces [13]. The SSD and YOLO families have also demonstrated a balance between accuracy and real-time performance in the quality inspection of wood and board materials, establishing a reusable technical framework [14,15]. Meanwhile, Siamese-YOLOv4 enhances the discriminability of multiple defect categories through a twin-branch structure combined with the Mish activation function [16]. Furthermore, incorporating various attention mechanisms into the YOLOv5 framework significantly strengthens feature representation and noise suppression [17,18,19]. The joint design of deformable convolution and large-kernel attention has also improved small-target detection accuracy while maintaining real-time inference [20].
Nevertheless, two major bottlenecks remain in current research. (1) It is difficult to construct high-quality datasets, as small-defect samples are scarce and unevenly distributed, which limits the generalization capability of models [21,22]. (2) The models often involve a large number of parameters and high inference complexity, making it challenging to meet the dual requirements of low latency and high stability in roll-to-roll high-speed production lines [23].
This study proposes an improved YOLOv8n algorithm that combines the Efficient IoU (EIoU) loss function with the Squeeze-and-Excitation (SE) attention mechanism. The EIoU loss is introduced to enhance the precision of bounding box regression, while the SE module is embedded in the Neck structure of YOLOv8n to strengthen the model’s responsiveness to key channel features. A defect dataset with industrial application value is constructed for printed materials, and comprehensive evaluations, including ablation studies and comparisons with mainstream models, are conducted to verify the advantages of the proposed method in both accuracy and efficiency. The results demonstrate that the model effectively improves the detection capability for small printing defects. From a wood-based production perspective, the enhancement of online detection capability is expected to reduce the waste sheet and rework rates, decrease paper and wood pulp consumption, and contribute to optimizing the material flow and lowering the energy consumption and carbon intensity across the forest–wood–pulp–paper–printing value chain.
2. Materials and Methods
2.1. YOLOv8 Object Detection Algorithm
Classical object detection algorithms are generally divided into two-stage and single-stage approaches. Two-stage methods, such as Faster R-CNN [24], first generate region proposals and then perform classification and regression for each region. Although these methods achieve high accuracy, repeated feature extraction and redundant computation lead to significant latency. In contrast, single-stage methods, such as SSD [25] and the YOLO series [26,27], directly map detection tasks to a single forward pass, thereby reducing computational complexity and enabling high-speed, end-to-end inference. In the context of printing defect detection, where stringent requirements exist for real-time performance and small-object recognition, YOLOv8n leverages its lightweight backbone network, an anchor-free detection head, and an improved IoU loss function to provide enhanced responsiveness to small printing defects such as missing prints, spots, and cracks. Furthermore, YOLOv8n maintains the efficiency of single-stage detection while flexibly scaling model size to adapt to different hardware conditions. Its built-in feature pyramid and multi-scale fusion strategies reduce false positives and missed detection in complex textured backgrounds of printed products.
2.2. SE Attention Mechanism
Printing defects are often associated with complex background noise and uneven multi-scale feature distribution. To strengthen the model’s focus on critical features, this study integrates the Squeeze-and-Excitation (SE) attention module [28] into the Neck of YOLOv8n. The SE module first performs a “squeeze” operation to obtain channel-wise feature responses from global information, followed by an “excitation” mechanism that adaptively assigns weights to each channel. This process emphasizes defect-relevant details while suppressing background noise.
Given an input feature map F∈R^{C×H×W }, global average pooling is applied along the spatial dimensions to compress it into a channel descriptor vector z∈R^{C}, representing the global response of each channel:
The channel descriptor z is then passed through two fully connected layers to generate the channel-wise weights s∈R^{C}:
where δ(·) denotes the ReLU activation function, σ(.) represents the Sigmoid activation function, and the reduction ratio r controls the bottleneck dimension. The dimensionality reduction–expansion structure in Equation (2) enables the model to capture high-order inter-channel dependencies and to generate channel importance weights suitable for defect detection.
To achieve ordered enhancement and suppression of channel responses in the feature map, the SE module applies the channel weights s=[s1, s2,…,sC] to the original feature map. By performing channel-wise weighting, it emphasizes informative channels while suppressing redundant ones. The weighted formulation is expressed as follows:
The SE module adaptively recalibrates channel weights, thereby enhancing the model’s responsiveness to subtle defect features.
In its practical implementation, the SE module first employs a Squeeze operation to perform global pooling across the spatial dimensions, thereby capturing the global receptive field of each channel. Next, the Excitation mechanism introduces non-linear activation and weight learning to model channel importance. Finally, the Scale operation applies weighted adjustment, enabling selective enhancement and suppression of channel responses. The overall structure is illustrated in Figure 1. This “squeeze–excitation–recalibration” mechanism strengthens the model’s ability to perceive critical defect regions.Embedding the SE module into the Neck of YOLOv8n not only improves the model’s capability in detecting small targets but also enhances its discrimination of fine features within complex backgrounds, thereby providing more discriminative feature inputs for the subsequent Detect layer.
2.3. EIoU Loss Function
In the conventional YOLOv8n framework, the CIoU loss considers the overlap ratio, center-point distance, and aspect ratio of the bounding box. However, it still suffers from limitations in terms of convergence speed and regression accuracy, particularly for elongated or irregularly shaped objects. To address this issue, the CIoU loss is replaced with the EIoU (Efficient-IoU) loss in this study. EIoU introduces a direct optimization of width and height errors, in addition to the IoU and center distance terms, thereby further improving regression performance.
The EIoU loss is designed to alleviate the gradient vanishing problem that often arises when the IoU is small during regression [29].It achieves this by decomposing the bounding box offset error into two independent components—center-point distance error and width-height error—thus making the regression process more stable and reliable.
As the primary loss function for localization regression, CIoU (Complete-IoU) integrates three factors—IoU, center-point distance, and aspect ratio—into a normalized formulation:
where ρ(.) denotes the Euclidean distance between the centers of the predicted and ground-truth boxes, c represents the diagonal length of the smallest enclosing box covering both, v measures the aspect ratio consistency, and α is the weighting factor.
In defect detection tasks, the target objects are often small in size and exhibit large variations in shape. Under such conditions, the regression capability of CIoU shows certain limitations, particularly for small-scale targets and objects with non-standard aspect ratios, where its performance declines.
To address this issue, EIoU further refines the regression formulation on the basis of CIoU. Specifically, EIoU explicitly models three components between the predicted and ground-truth boxes: center-point distance, width error, and height error. The loss function is formulated as follows:
where ρ denotes the Euclidean distance; b, w, and h represent the center coordinates, width, and height of the predicted box, respectively; bgt, wgt, hgt denote the corresponding parameters of the ground-truth box; while, c, cw, ch correspond to the diagonal length, width, and height of the minimum enclosing rectangle.
Compared with the aspect ratio penalty in CIoU, EIoU introduces a linear width–height error term, which provides more stable gradients across the entire IoU range. Notably, even under low IoU conditions (i.e., when the boxes barely overlap), EIoU ensures reliable width–height regression accuracy and stable localization. This effectively alleviates the error propagation caused by size deviations in small-target detection.
2.4. Improved YOLOv8n Overall Architecture
In this study, the YOLOv8n architecture was optimized for localization accuracy and feature enhancement by adopting EIoU and integrating SE into the Neck. Specifically, the EIoU loss function was adopted in the bounding box regression stage to improve localization accuracy, while the SE attention mechanism was integrated into the Neck to enhance the model’s responsiveness to small targets and critical defect regions.
These improvements not only maintain low parameter count and computational complexity but also significantly enhance detection accuracy and generalization capability. As illustrated in Figure 2, the improved architecture strengthens sensitivity to small printing defects while preserving lightweight efficiency.
3. Experimental Setup
3.1. Dataset and Augmentation
The dataset was collected in a real production environment, with images captured from the normal operation of the printing production line at Shanxi Xinlongteng Advertising Media Co., Ltd. Images were captured using a Hikvision industrial camera CU060-10GC. To enhance the quality and consistency of defect images, a combination of ring LED illumination and vertically-mounted industrial camera imaging was employed, as shown in Figure 3. This lighting setup provides uniform, shadow-free illumination, reducing ambient light interference and improving image contrast and detail visibility, which is useful for highlighting subtle defects such as missing prints, spots, and cracks. In addition, the vertical imaging configuration prevents image distortion, ensuring spatial localization accuracy. Each captured image has a size of 4.2 MB, a resolution of 3072 × 2048 pixels, and is stored in JPEG format. The sample sheets used in this study were derived from two types of self-adhesive media: indoor water-based adhesive paper (photo paper adhesive and polypropylene adhesive, PP) and outdoor white adhesive film. Both media utilized paper-based release liners, establishing a stable linkage with the wood-based value chain. Among them, the surface layer of the photo paper adhesive is composed of wood pulp–based paper, which is classified as a wood-derived material.
A total of 1,200 valid images were collected for this study. To improve the robustness and generalization of complex printing-defect detection, diverse image-augmentation strategies were applied during training. Considering the high variability of printing defects in shape, scale, and background texture, the augmentation pipeline was designed to simulate real production-line printing conditions, including geometric transformations, illumination perturbations, blur degradation, affine transformations, and local occlusion. These strategies increased the diversity of training samples and reduced the risk of overfitting to specific feature distributions. The dataset was expanded to 4,500 images and annotated using LabelImg. Defect categories included spots, missing prints, and cracks (see Figure 4). The dataset was split into training, validation, and test subsets in a 7:2:1 ratio.
3.2. Experimental Environment and Training Parameters
To ensure the stability and convergence efficiency of the improved model in printing defect detection tasks, the following hyperparameter configuration was adopted during the training phase, as summarized in the table. The number of epochs was set to 150, providing sufficient iterations for the model to adequately fit the sample features, while employing an early stopping strategy to effectively prevent overfitting. A batch size of 16 was chosen as a compromise between maintaining training stability, GPU memory constraints, and computational efficiency.

Table 1.
Test environment.
| Component | Specification |
|---|---|
| Operating system | Windows 11 |
| CPU | AMD Ryzen 7 7745HX with Radeon Graphics |
| GPU | NVIDIA GeForce RTX 4070 |
| Python | 3.8.20 |
| CUDA | 12.1 |
| Deep learning framework | PyTorch 2.1.2 |
Table 2.
Training parameters.
| Parameters | Value |
|---|---|
| Epochs | 150 |
| Batch size | 16 |
| Image size | 640×640 |
| Workers | 8 |
| Learning rate | 0.001 |
| Optimizer | AdamW |
| Weight decay | 0.0005 |
Images were resized to 640 × 640 pixels to ensure compatibility with mainstream detection models, while achieving an optimal balance between small-target detection performance and computational resource consumption. The number of data loader workers was set to 8 to fully leverage multithreading capabilities, accelerate data loading and augmentation, and consequently improve overall training speed.
AdamW was chosen as the optimizer instead of SGD or Adam. With a weight decay term (0.0005), AdamW provides stronger regularization during gradient updates, preventing parameter overgrowth and enhancing generalization. The learning rate was set to 0.001, allowing for rapid convergence during the initial training phase while facilitating stable fine-tuning in later stages, thus accommodating defect detection tasks under complex backgrounds.
3.3. Evaluation Metrics
Precision, Recall, mAP@0.5, mAP@[0.5:0.95], and Frames Per Second (FPS) are adopted as the primary evaluation metrics. Together, these metrics provide a comprehensive view of model performance: Precision and Recall characterize false-positive and false-negative rates; mAP@0.5 measures detection accuracy at a fixed IoU threshold, whereas mAP@[0.5:0.95] reflects robustness across IoU thresholds and object scales; and FPS quantifies throughput and real-time capability on the target hardware. Using these five metrics mitigates single-metric bias and enables an objective assessment of the accuracy–speed trade-off as well as the generalization capability of printing-defect detection under real production-line conditions.
True Positives (TP) denote the number of defect boxes correctly detected, while False Positives (FP) denote the number of boxes incorrectly identified as defects from background or non-defective regions. A higher precision indicates fewer false alarms generated by the model.
Recall measures the model’s ability to detect all true defects and is defined as follows:
where False Negatives (FN) denote the number of true defect boxes that the model failed to detect. A higher recall indicates fewer missed detections.
Average Precision (AP) represents the area under the Precision–Recall curve and is used to evaluate the overall detection performance of the model across different confidence thresholds.
Mean Average Precision (mAP) is the arithmetic mean of AP values across multiple classes or different IoU thresholds, reflecting the overall detection performance of the model. In this study, the following two commonly used forms are reported:
mAP@0.5: Calculated by averaging the AP of each class at a fixed IoU of 0.5.
mAP@[0.5:0.95]: Computed as the average of AP values across IoU thresholds ranging from 0.5 to 0.95 with a step size of 0.05.
where N denotes the number of classes or the number of selected IoU thresholds.
FPS represents the number of image frames the model can process per unit time and is a key metric for evaluating detection speed and real-time performance.
It is calculated as follows:
where preprocessing denotes the image preprocessing time; inference refers to the time from feeding a preprocessed image into the model to obtaining the output results; and NMS represents the post-processing time of the image.
4. Results and Discussion
4.1. Comparison of Attention Mechanisms
To investigate the impact of different attention mechanisms on detection performance, four mainstream attention modules—SE, CBAM, CA, and Shuffle—were integrated into the YOLOv8n model separately, while keeping the rest of the network architecture unchanged. The detection performance of these variants was then compared using the same dataset.
As shown in Table 3, the introduction of all attention mechanisms improved model performance, particularly evident in the mean average precision metrics mAP@0.5 and mAP@[0.5:0.95]. Among them, the SE module exhibited the best performance, with both precision (P) and recall (R) increasing to 94.3%, mAP@0.5 rising to 93.5%, and mAP@[0.5:0.95] reaching 39.6%, ranking first among the four modules. This indicates that its channel recalibration mechanism is effective in enhancing attention to small defect targets in printed materials.
CBAM and Shuffle modules also demonstrated good performance in terms of precision and recall, with mAP values comparable to SE, indicating that the incorporation of spatial attention or feature shuffling structures can also enhance detection capability. In contrast, the CA module showed limited improvements, particularly with no significant advantage observed in mAP@[0.5:0.95].
Overall, incorporating attention mechanisms enhances the model’s ability to recognize small defects under complex backgrounds. Notably, the SE module achieved the best performance across multiple metrics, confirming its effectiveness in channel feature enhancement.
4.2. Comparison of Loss Functions
To evaluate the performance improvement introduced by the EIoU loss function, the original CIoU loss in YOLOv8n was replaced with WIoU-V3, GIoU, and EIoU. Model performance metrics were then compared under a consistent experimental setup. As shown in Table 4:
As shown in Table 4, for the Precision (P) metric, all three improvements showed enhancements over the baseline model, with EIoU exhibiting the most significant increase, reaching 94.1%. In terms of Recall (R), EIoU also achieved the highest value of 95.0%, representing a 0.8-percentage-point improvement over the original model, indicating stronger robustness in object completeness regression.
Regarding detection accuracy, WIoU-V3 and GIoU showed slight improvements in mAP@0.5 to 93.1% and 93.2%, respectively, whereas EIoU further increased it to 93.8%. For mAP@[0.5:0.95], EIoU achieved 39.6%, marking a 0.5-percentage-point improvement over the baseline.
Overall, although WIoU-V3 and GIoU showed improvements in certain metrics, EIoU outperformed them across precision, recall, and both mAP metrics. This confirms its superior capability in fitting bounding box positions and scales, making it particularly suitable for high-precision detection of small defect targets in printed materials. Therefore, EIoU was ultimately adopted as the regression loss function for YOLOv8n.
4.3. Detection Results by Defect Type: Before vs. After Optimization
To further validate the detection capability of the proposed optimization strategy across different types of printed defects, three representative defect categories—cracks, missing prints, and spots—were selected. Precision and recall were compared between the original YOLOv8n model and the optimized YOLOv8n model, with the results presented in Table 5.
As shown in Table 5, the optimized YOLOv8n model achieved consistent improvements in detection performance across all defect categories:
For Cracks, the optimized model achieved a precision of 98.5% and a recall of 96.8%, representing a 2.6-percentage-point improvement in precision over the original model (95.9%, 96.5%). This indicates that the optimized model possesses stronger discriminative capability in modeling boundary details.
For missing print defects, the optimized model achieved a precision of 97.9% and a recall of 96.4%, showing higher consistency and detection stability compared to the original YOLOv8n model (95.0%, 96.3%). This demonstrates improved robustness when handling low-contrast targets.
For Spot defects, which are relatively more challenging, the optimized model still achieved a slight precision increase from 89.4% to 89.5% and an improvement in recall from 89.7% to 90.5%, indicating that the optimization strategy also has potential to enhance detection of small targets with low-texture contrast.
4.4. Ablation Study
To evaluate the specific performance improvements contributed by the EIoU loss function and SE attention mechanism in the proposed optimization strategy, an ablation study was conducted. Based on the YOLOv8n model, three configurations were tested: incorporation of EIoU loss, integration of SE attention, and the combination of both. The impact of each configuration on detection accuracy was assessed. The experimental results are presented in Table 6.
As shown in Table 6, the original YOLOv8n model achieved a precision (P) of 93.2%, recall (R) of 94.2%, and a mean Average Precision at IoU 0.5 (mAP@0.5) of 92.8%. After incorporating the EIoU loss function, the model’s bounding box regression capability was enhanced, with precision increasing to 94.1%, recall to 95.0%, and mAP@0.5 to 93.8%, indicating that EIoU positively optimizes object localization performance. Furthermore, introducing the SE attention mechanism also improved model performance, particularly in the comprehensive metric mAP@[0.5:0.95], which increased from 39.1% to 39.6%, demonstrating the effectiveness of the SE mechanism in enhancing channel feature representation.
When EIoU and the SE mechanism were combined, the model achieved optimal overall performance, with precision reaching 95.1%, mAP@0.5 at 94.1%, and mAP@[0.5:0.95] at 39.6%. This confirms the synergistic effect of EIoU loss and SE attention, as they respectively enhance model performance in bounding box regression accuracy and channel feature responsiveness, exhibiting complementary benefits. Therefore, both the proposed EIoU and SE modules independently improved object detection performance, and their combined use produced more stable and significant enhancements, providing an effective pathway for subsequent model optimization. As shown in Figure 5, the proposed method can detect various defects such as missing prints, cracks, and spots in printed materials, intuitively demonstrating the detection performance of the improved model on real samples.
4.5. Comparison with Other Models
To further evaluate the effectiveness of the proposed optimization strategy in printing defect detection, this study conducted a comparative analysis with current mainstream object detection models, including YOLOv3-tiny, YOLOv5s, YOLOv6s, YOLOv8s, and YOLOv8m. The analysis focused on comprehensive performance in terms of accuracy and efficiency, with the optimized YOLOv8n model included for evaluation. The experimental results are presented in Table 7.
As shown in Table 7, YOLOv3-tiny has an advantage in lightweight design (model size 23.2 MB, 18.9 GFLOPs), but its accuracy remains relatively low (mAP@0.5 = 92.4%), which is insufficient for high-precision industrial inspection requirements. YOLOv5s and YOLOv6s achieved a balance between model complexity and inference speed. Notably, YOLOv6s reached a maximum inference speed of 145.6 FPS with relatively low computation (11.8 GFLOPs), demonstrating strong real-time capability. However, its detection accuracy (mAP@0.5 = 92.1%) remained suboptimal.
Overall, the YOLOv8 series outperformed previous models in accuracy. YOLOv8m achieved an mAP@0.5 of 93.4%, but its computational cost and model size increased substantially (78.7 GFLOPs, 49.6 MB), limiting practical deployment. YOLOv8s reduced model size and computation to some extent, yet its inference speed offered no significant advantage.
In contrast, the proposed optimized YOLOv8n model achieved the best overall performance while remaining lightweight. The model contains only 3.02M parameters, requires 8.1 GFLOPs, and has a size of 6 MB, yet exhibits significant accuracy improvements, achieving an mAP@0.5 of 94.1% and precision of 95.1%. Its inference speed reaches 100.2 FPS, meeting the dual requirements of real-time processing and high accuracy for high-speed printing production lines. In summary, the optimized YOLOv8n demonstrates advantages in detection accuracy, inference speed, and lightweight design, highlighting its strong potential for practical engineering applications.
To visually illustrate the comprehensive advantages of the optimized YOLOv8n model in terms of accuracy, computational cost, and model size, Figure 6 compares key detection metrics—precision (P), recall (R), and mAP@0.5—across mainstream models, overlaid with GFLOPs to depict computational complexity. As shown, the optimized YOLOv8n achieves excellent performance with only 8.1 GFLOPs and a 6 MB model size, reaching 95.1% precision, 94.3% recall, and 94.1% mAP@0.5, outperforming YOLOv3-tiny, YOLOv5s, YOLOv6s, and YOLOv8s. These results confirm the effectiveness of the proposed optimization strategy and its strong potential for industrial deployment.
As shown in Figure 6, the improved YOLOv8n outperforms the comparison models in Precision, Recall, and mAP@0.5. Despite requiring only 8.1 GFLOPs of computation and 6 MB of storage, it still achieves an inference speed of 100.2 FPS, demonstrating an outstanding balance between accuracy and computational complexity. Based on these results, the following section discusses the engineering and industrial implications of the proposed method from the downstream production perspective of the “forest–wood–pulp–paper–printing” value chain, with a particular focus on wood-based manufacturing processes.
4.6. Results Discussion and Industrial Implications
(1) Material efficiency: The improved YOLOv8n enhances the detection rate and localization accuracy of small defects, enabling timely identification and handling during production and reducing scrap and rework. Under equal production output, the consumption of pulp, paper materials, and release liners per qualified product decreases. Without increasing model complexity, the proposed method achieves material efficiency improvement in the printing stage, aligning with the resource-saving goals of the wood-based value chain.
(2) Energy consumption and carbon intensity: The energy use and emissions across the forest–wood–pulp–paper–printing chain exhibit a cumulative effect. With the improvement in yield brought by online quality inspection, the energy consumption and carbon intensity per unit of output are reduced accordingly. This outcome is consistent with the decarbonization pathways of the wood-derived circular bioeconomy.
(3) Cross-category transferability: The proposed strategies for small-target enhancement and channel attention can be extended to defect recognition tasks on wood and board surfaces. Related studies have already verified the effectiveness of improved YOLO models in wood-based scenarios, indicating strong potential for cross-domain applicability and technical reuse.
5. Conclusions
This study focuses on defect detection in roll-to-roll paper-based printing and proposes an improved YOLOv8n model. The Efficient IoU (EIoU) is introduced in the bounding box regression stage, and a SE channel-attention module is embedded in the feature fusion (Neck) stage to effectively enhance localization precision and feature responsiveness for subtle printing defects. Validation using datasets collected from real production lines shows that, while maintaining a lightweight architecture (3.02M parameters and 8.1 GFLOPs), the model achieves mAP@0.5 = 94.1%, Precision = 95.1%, Recall = 94.3%, and a real-time inference speed of 100.2 FPS—approximately 1.3 percentage points higher than the baseline. This research provides an efficient and reliable technical solution for print quality control, contributing to reduced rework and material waste, improved utilization of wood-derived paper products, and technical support for material efficiency and green manufacturing across the “forest–wood–pulp–paper–printing” value chain
Funding
This research was funded by the Beijing Institute of Graphic Communication School-Level Project, “Research and Development of Working Pressure Direct Monitoring for Flat Die Cutting Machine” (Grant No. Ea202406); the Project of Construction and Support for High-Level Innovative Teams of Beijing Municipal Institutions, “Key Technologies and Equipment for MLCC Roll-to-Roll Precision Coated Printing” (Grant No. BPHR20220107); and the School-Level Project of Beijing Institute of Graphic Communication, “Beijing Key Laboratory of Digital Printing Equipment Construction Project” (Grant No. KYCPT202508). The APC was funded by the Beijing Institute of Graphic Communication.
Data Availability Statement
The data supporting the reported results are not publicly available due to corporate privacy and laboratory confidentiality agreements.
Acknowledgments
The authors express their sincere gratitude to Shanxi Xinlongteng Advertising Media Co., Ltd. for kindly providing access to the production dataset used in this study under the company’s data-privacy and confidentiality requirements. We also gratefully acknowledge the School of Mechanical and Electrical Engineering, Beijing Institute of Graphic Communication, for administrative and technical support, including assistance with data annotation, equipment maintenance, and experimental scheduling. No generative AI tools were used for text generation, data analysis, figure creation, study design, data collection, analysis, or interpretation; the authors take full responsibility for the content of this publication.
Conflicts of Interest
The authors declare no conflict of interest. The funders had no role in the design of the study; in the collection, analyses, or interpretation of data; in the writing of the manuscript; or in the decision to publish the results.
Abbreviations
The following abbreviations are used in this manuscript:
| AP | Average Precision |
| CBAM | Convolutional Block Attention Module |
| CA | Coordinate Attention |
| CIoU | Complete Intersection over Union |
| CUDA | Compute Unified Device Architecture |
| CPU | Central Processing Unit |
| EIoU | Efficient IoU |
| FPS | Frames Per Second |
| GFLOPs | Giga Floating-Point Operations |
| GPU | Graphics Processing Unit |
| IoU | Intersection over Union |
| JPEG | Joint Photographic Experts Group |
| mAP | mean Average Precision |
| SE | Squeeze-and-Excitation |
| SGD | Stochastic Gradient Descent |
| YOLO | You Only Look Once |
References
- Yann Emmanuel Miassi; Kossivi Fabrice Dossa Circular Economy Initiatives for Wood-derived Bioeconomy: Harnessing the Potential of Non-Wood Biomaterials. Waste Management Bulletin 2024, 2, 270–278. [CrossRef]
- Khan, M.T.; Pettenella, D.; Masiero, M. Material Flow Analysis of the Wood-Based Value Chains in a Rapidly Changing Bioeconomy: A Literature Review. Forests 2024, 15, 2112. [Google Scholar] [CrossRef]
- Zhao, Q.; Ding, S.; Wen, Z.; Toppinen, A. Energy Flows and Carbon Footprint in the Forestry-Pulp and Paper Industry. Forests 2019, 10, 725. [Google Scholar] [CrossRef]
- Lazaridou, D.C.; Michailidis, A.; Trigkas, M. Exploring Environmental and Economic Costs and Benefits of a Wood-derived Circular Economy: A Literature Review. Forests 2021, 12, 436. [Google Scholar] [CrossRef]
- Van Schoubroeck, S.; Chacon, L.; Reynolds, A.M.; Lavoine, N.; Hakovirta, M.; Gonzalez, R.; Van Passel, S.; Venditti, R.A. Environmental Sustainability Perception toward Obvious Recovered Waste Content in Paper-Based Packaging: An Online and in-Person Survey Best-Worst Scaling Experiment. Resources, Conservation and Recycling 2023, 188, 106682. [Google Scholar] [CrossRef]
- Wang, H.-B.; Xie, Y.-F. Printing Surface Defect Detection Method Based on Improved GLCM. Packag. Eng. 2020, 41, 272–278. (In Chinese) [Google Scholar] [CrossRef]
- Zuo, C.; Zhang, Y.-B.; Qi, Y.-S.; Li, X.-Y.; Wang, Y.-C. Detection of Surface Scratch Defects of Printing Products Based on Machine Vision. Print. Digit. Media Technol. Study 2023, 5, 42–48. (In Chinese) [Google Scholar] [CrossRef]
- Ru, X.; Yao, Y.; Li, J.; Peng, L.; Sun, Z. Defect Detection in Hot Stamping Process Printed Matter by Beluga Optimized Support Vector Machine with Opposition-Based Learning. SIViP 2024, 19, 93. [Google Scholar] [CrossRef]
- Zhu, Z.; Zhang, J.; Wang, J.; Zhang, P.; Li, J. Puzzle Mode Graph Learning with Pattern Composition Relationships Reasoning for Defect Detection of Printed Products. Journal of Manufacturing Systems 2025, 81, 34–48. [Google Scholar] [CrossRef]
- Chen, W.; Zheng, Y.; Liao, K.; Liu, H.; Miao, Y.; Sun, B. Small Target Detection Algorithm for Printing Defects Detection Based on Context Structure Perception and Multi-Scale Feature Fusion. SIViP 2024, 18, 657–667. [Google Scholar] [CrossRef]
- Liu, X.; Li, Y.; Guo, Y.; Zhou, L. Printing Defect Detection Based on Scale-Adaptive Template Matching and Image Alignment. Sensors (Basel) 2023, 23, 4414. [Google Scholar] [CrossRef]
- Versino, F.; Ortega, F.; Monroy, Y.; Rivero, S.; López, O.V.; García, M.A. Sustainable and Bio-Based Food Packaging: A Review on Past and Current Design Innovations. Foods 2023, 12, 1057. [Google Scholar] [CrossRef]
- Wang, R.; Liang, F.; Wang, B.; Zhang, G.; Chen, Y.; Mou, X. An Efficient and Accurate Surface Defect Detection Method for Wood Based on Improved YOLOv8. Forests 2024, 15, 1176. [Google Scholar] [CrossRef]
- Yang, Y.; Wang, H.; Jiang, D.; Hu, Z. Surface Detection of Solid Wood Defects Based on SSD Improved with ResNet. Forests 2021, 12, 1419. [Google Scholar] [CrossRef]
- Wang, X. Recent Advances in Nondestructive Evaluation of Wood: In-Forest Wood Quality Assessments. Forests 2021, 12, 949. [Google Scholar] [CrossRef]
- Lou, H.-J.; Zheng, Y.-L.; Liao, K.-Y.; Lei, H.; Li, J. Defect Target Detection for Printed Matter Based on Siamese-YOLOv4. J. Comput. Appl. 2021, 41, 3206–3212. (In Chinese) [Google Scholar] [CrossRef]
- Liu, H.-W.; Zheng, Y.-L.; Zhong, C.-J.; Liao, K.-Y.; Sun, B.-Y.; Zhao, H.-X.; Lin, J.; Wang, H.-Q.; Han, S.-X.; Xie, B. Defect Detection of Printed Matter Based on Improved YOLOv5l. Prog. Laser Optoelectron. 2024, 61, 228–235. (In Chinese) [Google Scholar] [CrossRef]
- Zhang, K.-S.; Guan, K.-K. Paper Defect Detection Method Based on Improved YOLOv5. China Pulp Pap. 2022, 41, 79–86. (In Chinese) [Google Scholar] [CrossRef]
- Xu, Y.; Du, W.; Deng, L.; Zhang, Y.; Wen, W. Ship Target Detection in SAR Images Based on SimAM Attention YOLOv8. IET Communications 2024, 18, 1428–1436. [Google Scholar] [CrossRef]
- Jie Liu; Zelong Cai; Kuanfang He; Chengqiang Huang; Xianxin Lin; Zhenyong Liu; Zhicong Li; Minsheng Chen An Efficient Printing Defect Detection Based on YOLOv5-DCN-LSK. Available online: https://www.mdpi.com/1424-8220/24/23/7429 (accessed on 2 October 2025).
- Surface Defect Inspection of Industrial Products with Object Detection Deep Networks: A Systematic Review | Artificial Intelligence Review. Available online: https://link.springer.com/article/10.1007/s10462-024-10956-3 (accessed on 2 October 2025).
- Ren, Z.; Fang, F.; Yan, N.; Wu, Y. State of the Art in Defect Detection Based on Machine Vision. Int. J. of Precis. Eng. and Manuf.-Green Tech. 2022, 9, 661–691. [Google Scholar] [CrossRef]
- Wang, Y.-X.; Chen, B. Print Defect Detection Method Based on Deep Comparison Network. J. Comput. Appl. 2023, 43, 250–258. (In Chinese) [Google Scholar] [CrossRef]
- Ren, S.; He, K.; Girshick, R.; Sun, J. Faster R-CNN: Towards Real-Time Object Detection with Region Proposal Networks. IEEE Trans. Pattern Anal. Mach. Intell. 2017, 39, 1137–1149. [Google Scholar] [CrossRef]
- Wang, H.; Qian, H.; Feng, S.; Wang, W. L-SSD: Lightweight SSD Target Detection Based on Depth-Separable Convolution. J Real-Time Image Proc 2024, 21, 33. [Google Scholar] [CrossRef]
- Redmon, J.; Divvala, K.S.; Girshick, R.B.; Farhadi, A. You Only Look Once: Unified, Real-Time Object Detection. arXiv 2015, arXiv:1506.02640. [Google Scholar] [CrossRef]
- Redmon, J.; Farhadi, A. YOLO9000: Better, Faster, Stronger. arXiv 2016, arXiv:1612.08242. [Google Scholar] [CrossRef]
- Hu, J.; Shen, L.; Sun, G. Squeeze-and-Excitation Networks. In Proceedings of the 2018 IEEE/CVF Conference on Computer Vision and Pattern Recognition (CVPR), Salt Lake City, UT, USA, 18–22 June 2018; pp. 7132–7141. [Google Scholar] [CrossRef]
- Zhang, Y.-F.; Ren, W.; Zhang, Z.; Jia, Z.; Wang, L.; Tan, T. Focal and Efficient IOU Loss for Accurate Bounding Box Regression. Neurocomputing 2022, 506, 146–157. [Google Scholar] [CrossRef]
Figure 1.
SE attention module architecture.
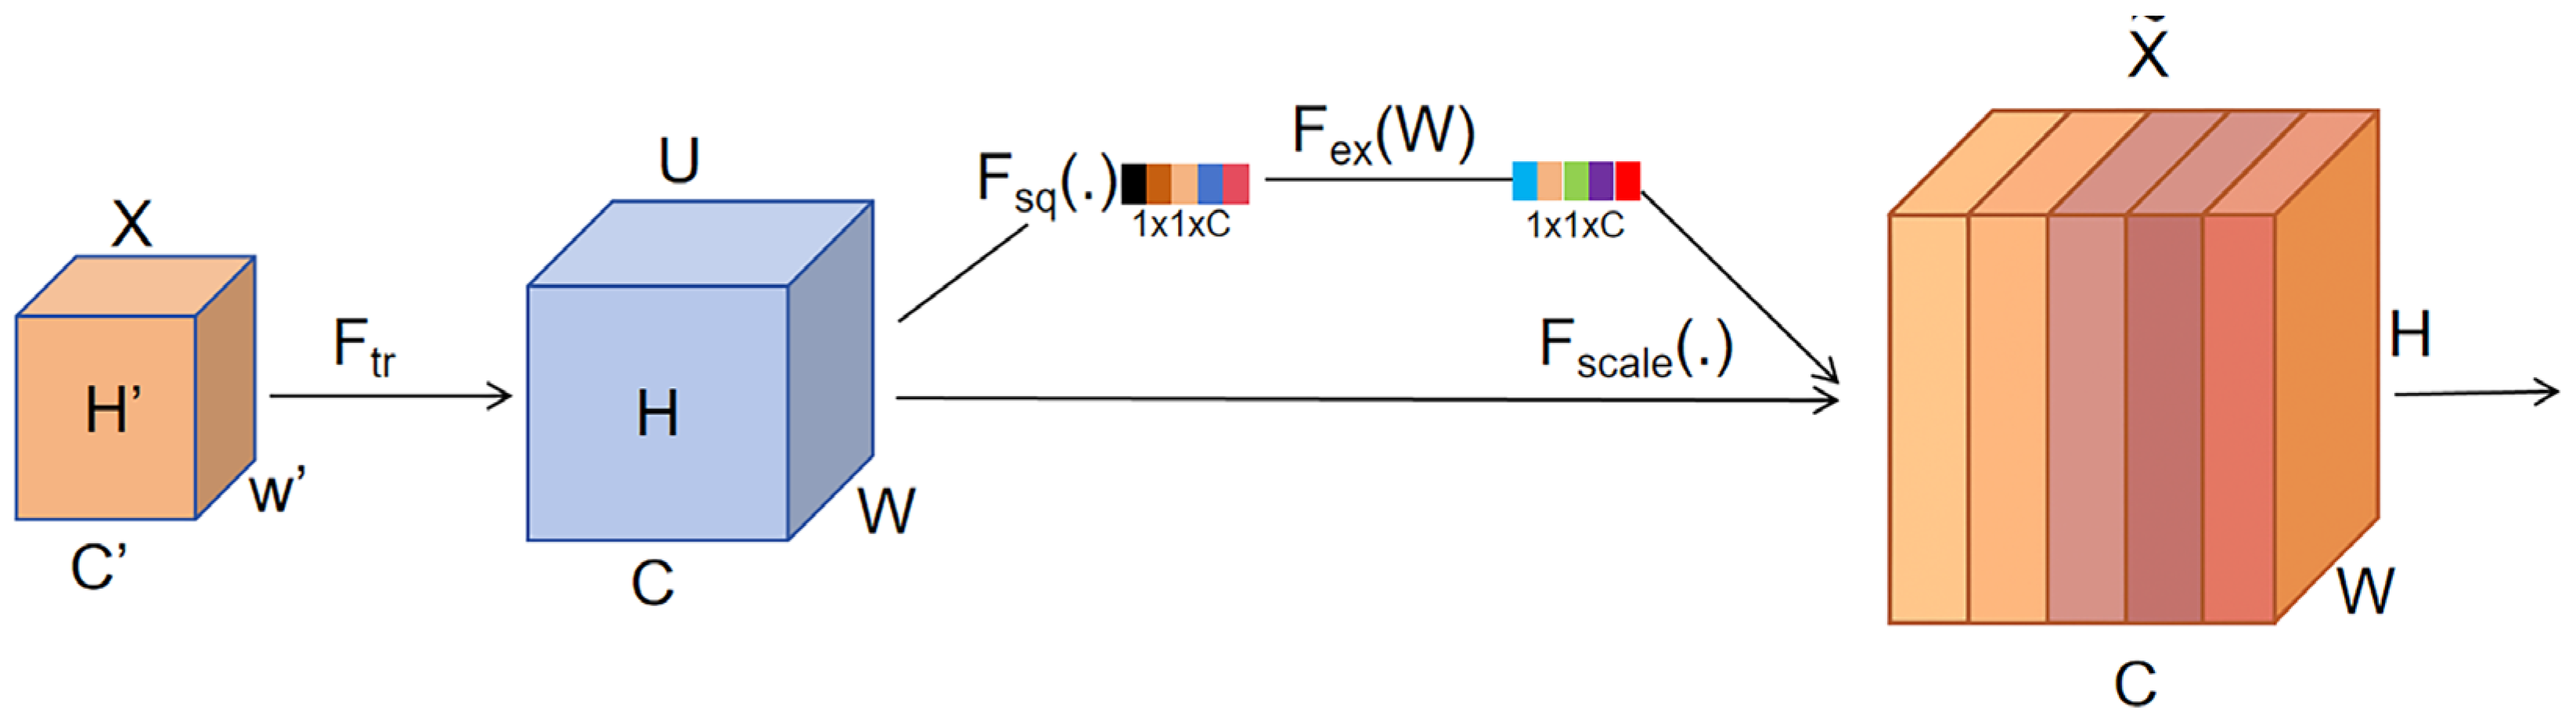
Figure 2.
Improved YOLOv8n model architecture.
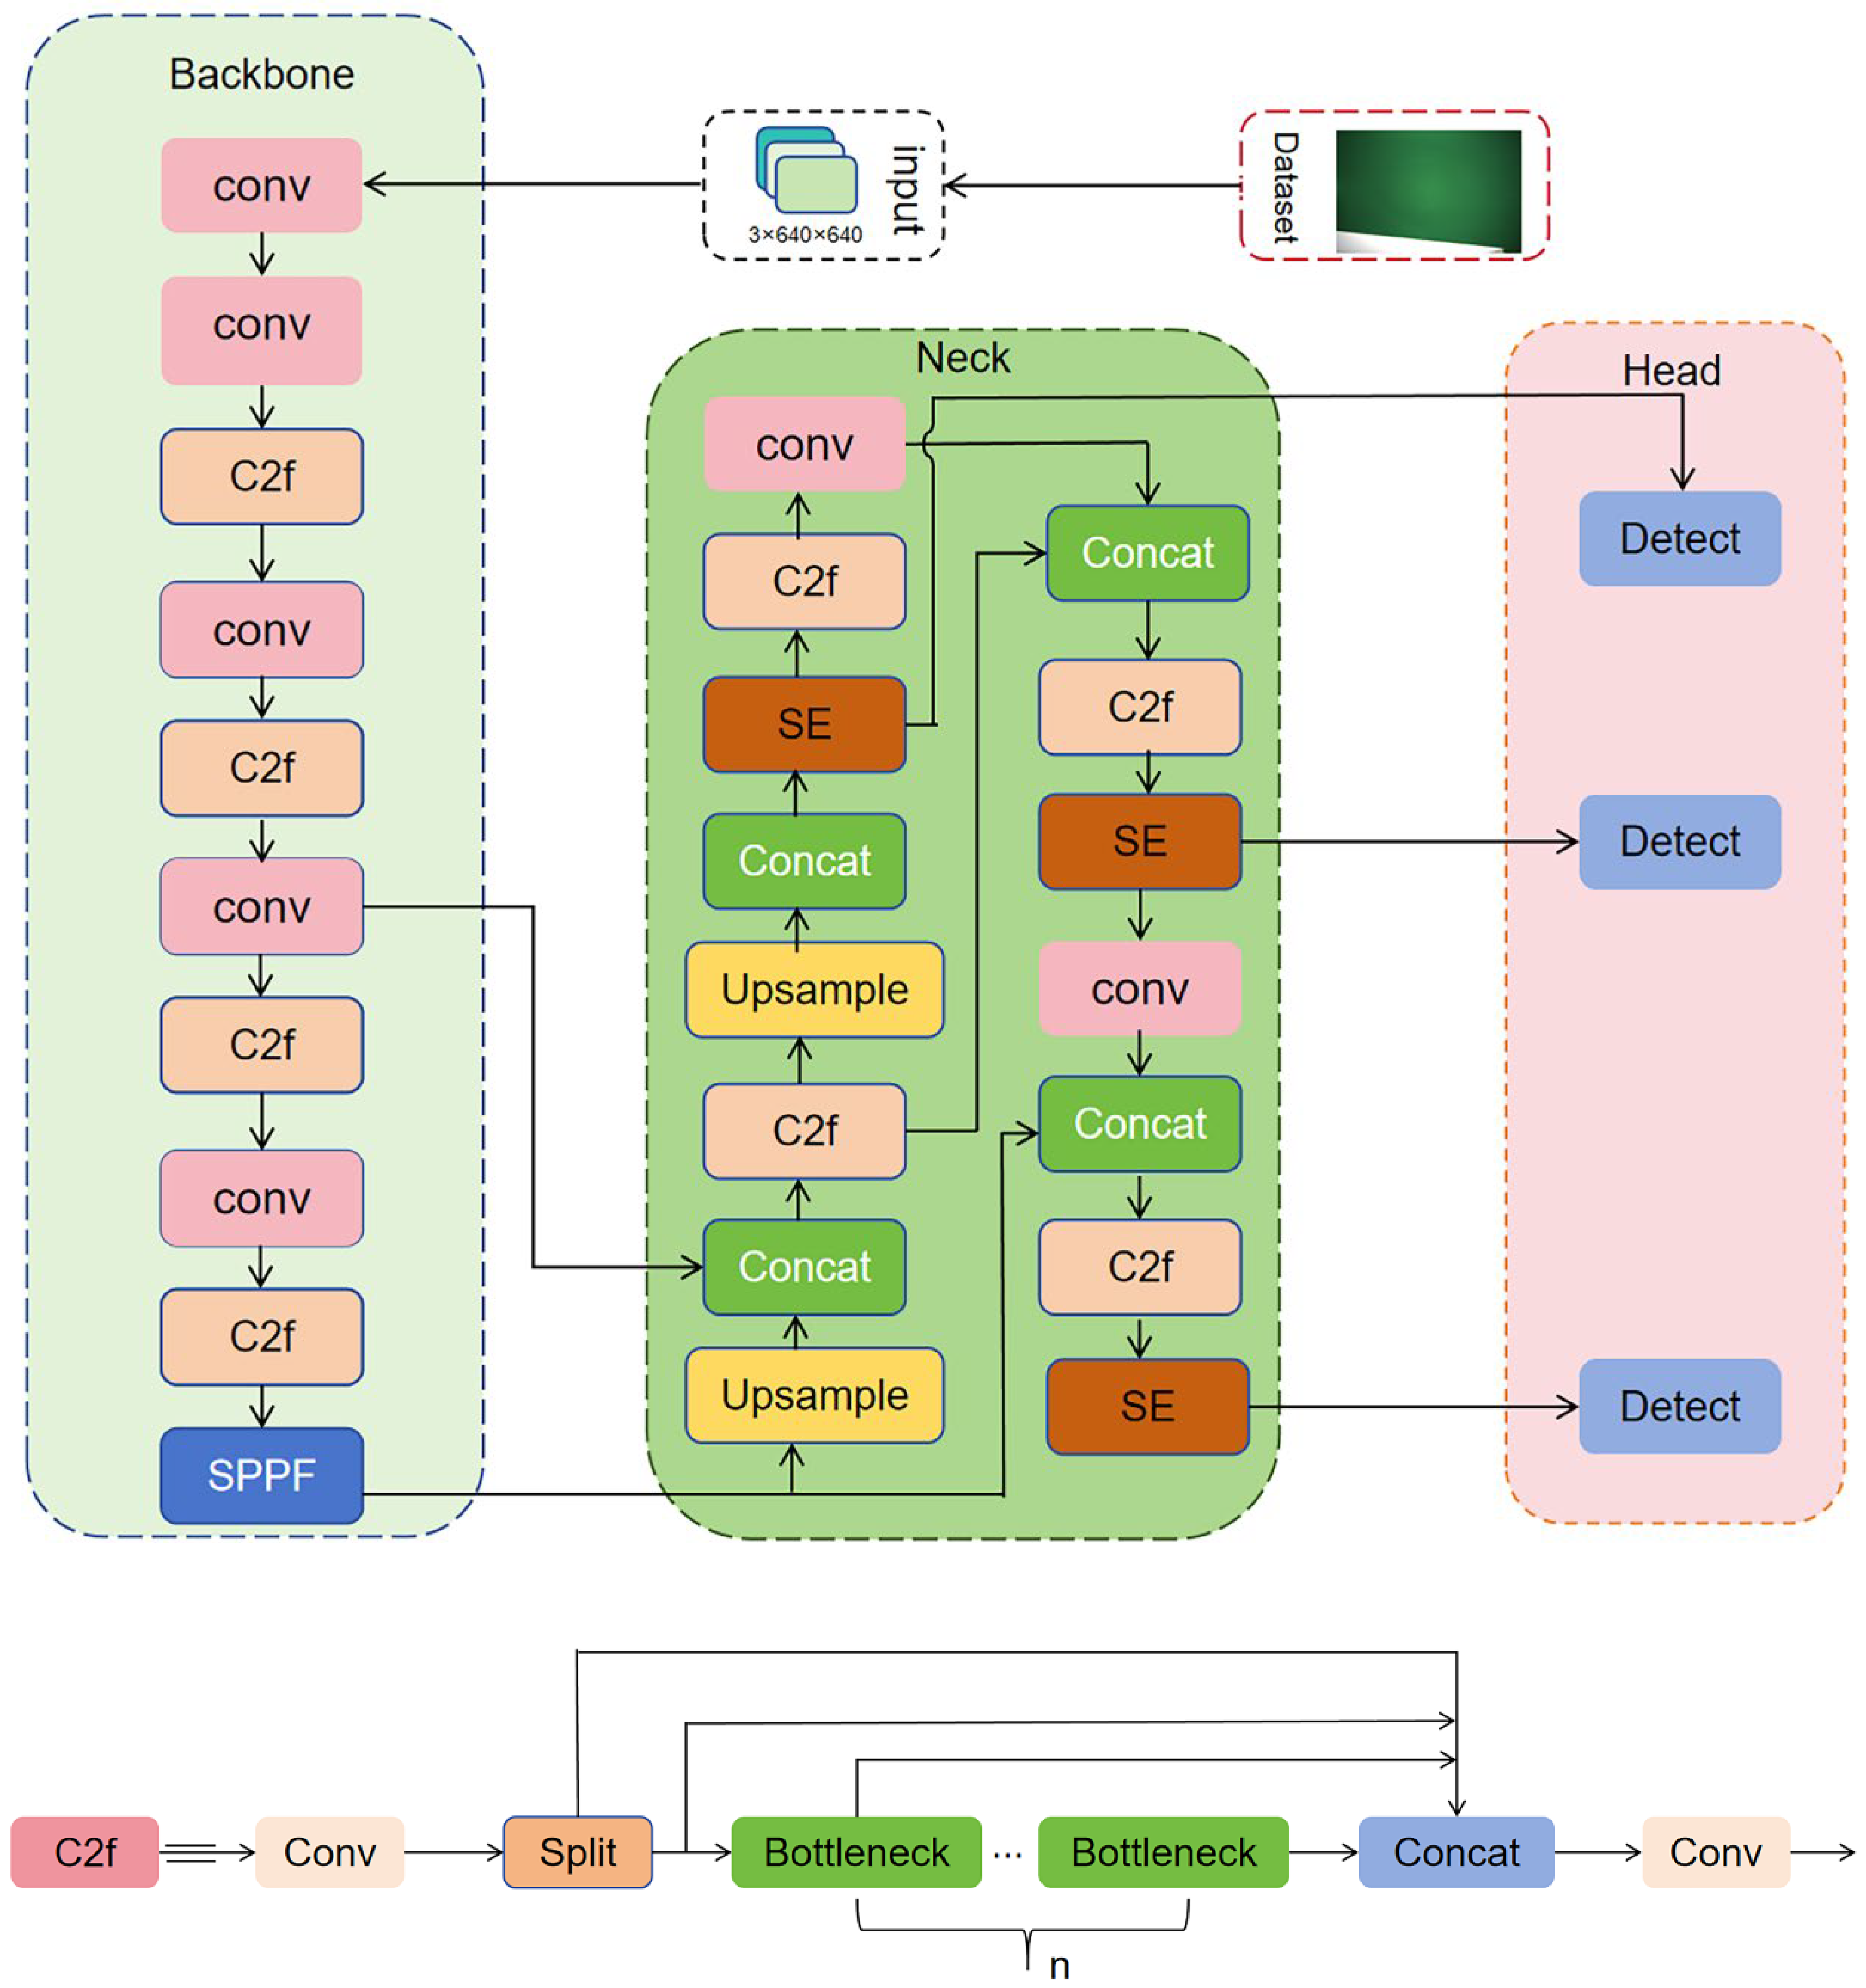
Figure 3.
Image acquisition platform for defect dataset construction.
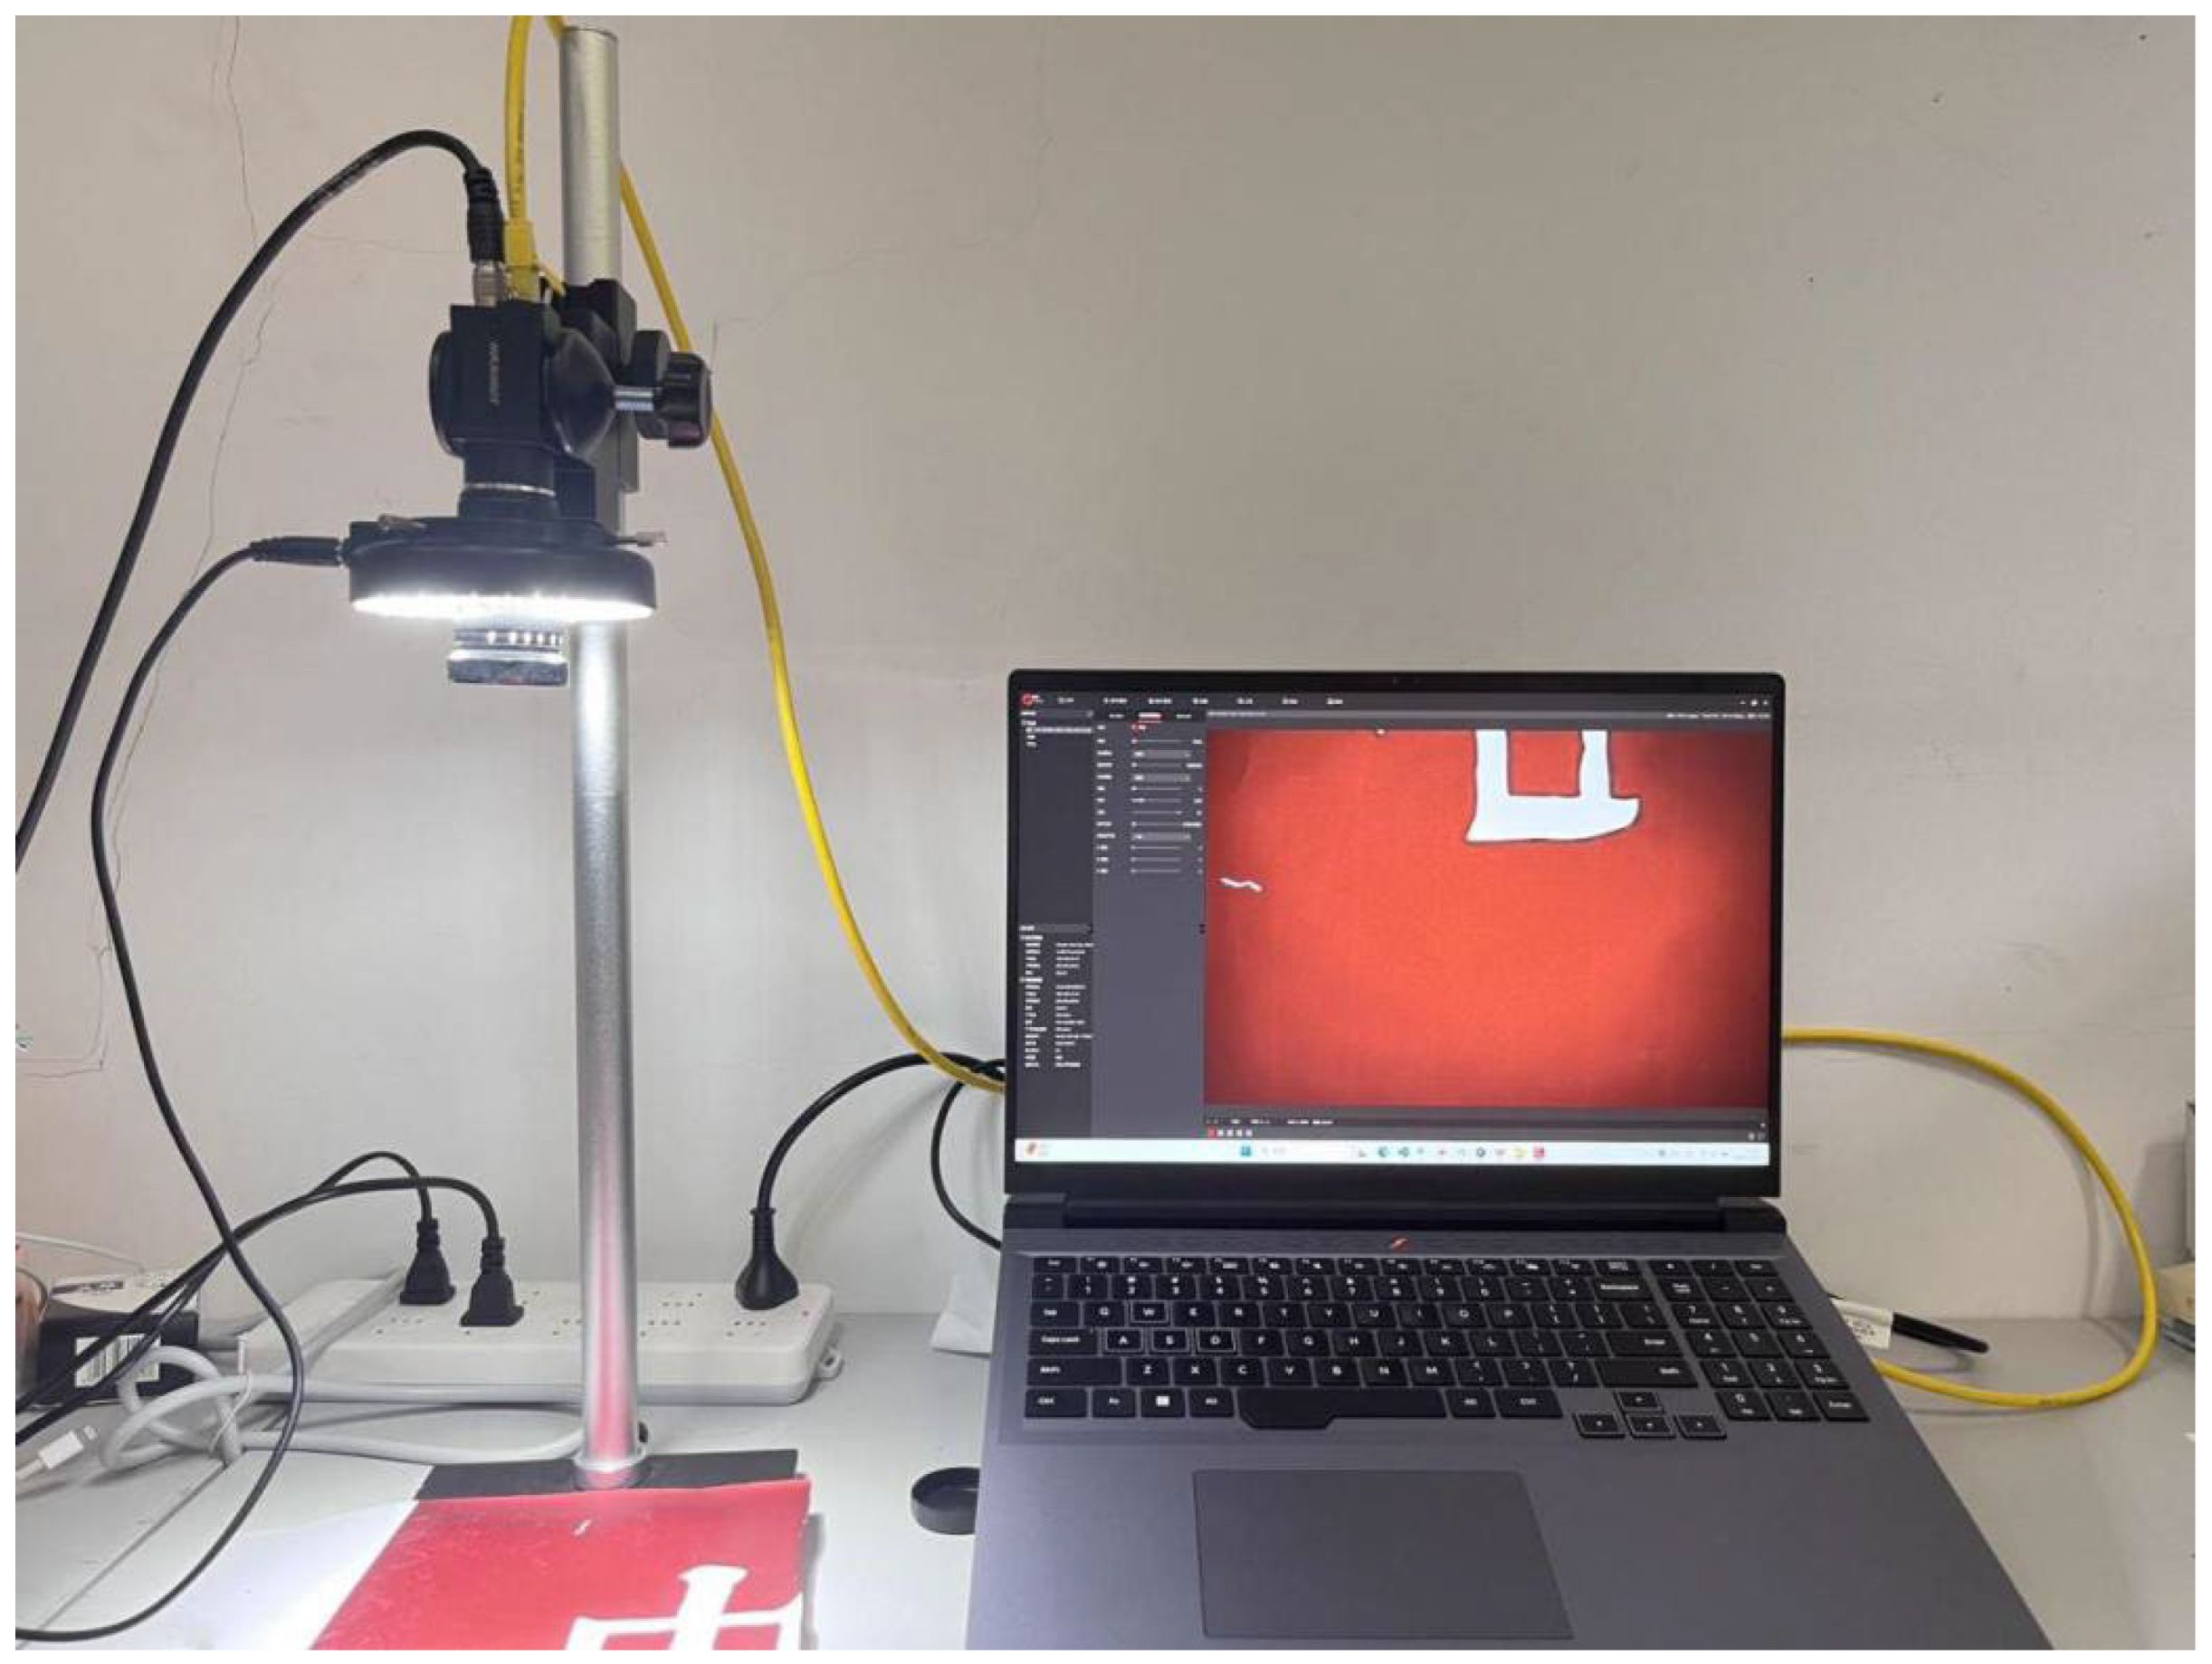
Figure 4.
Collected images of different defect types.
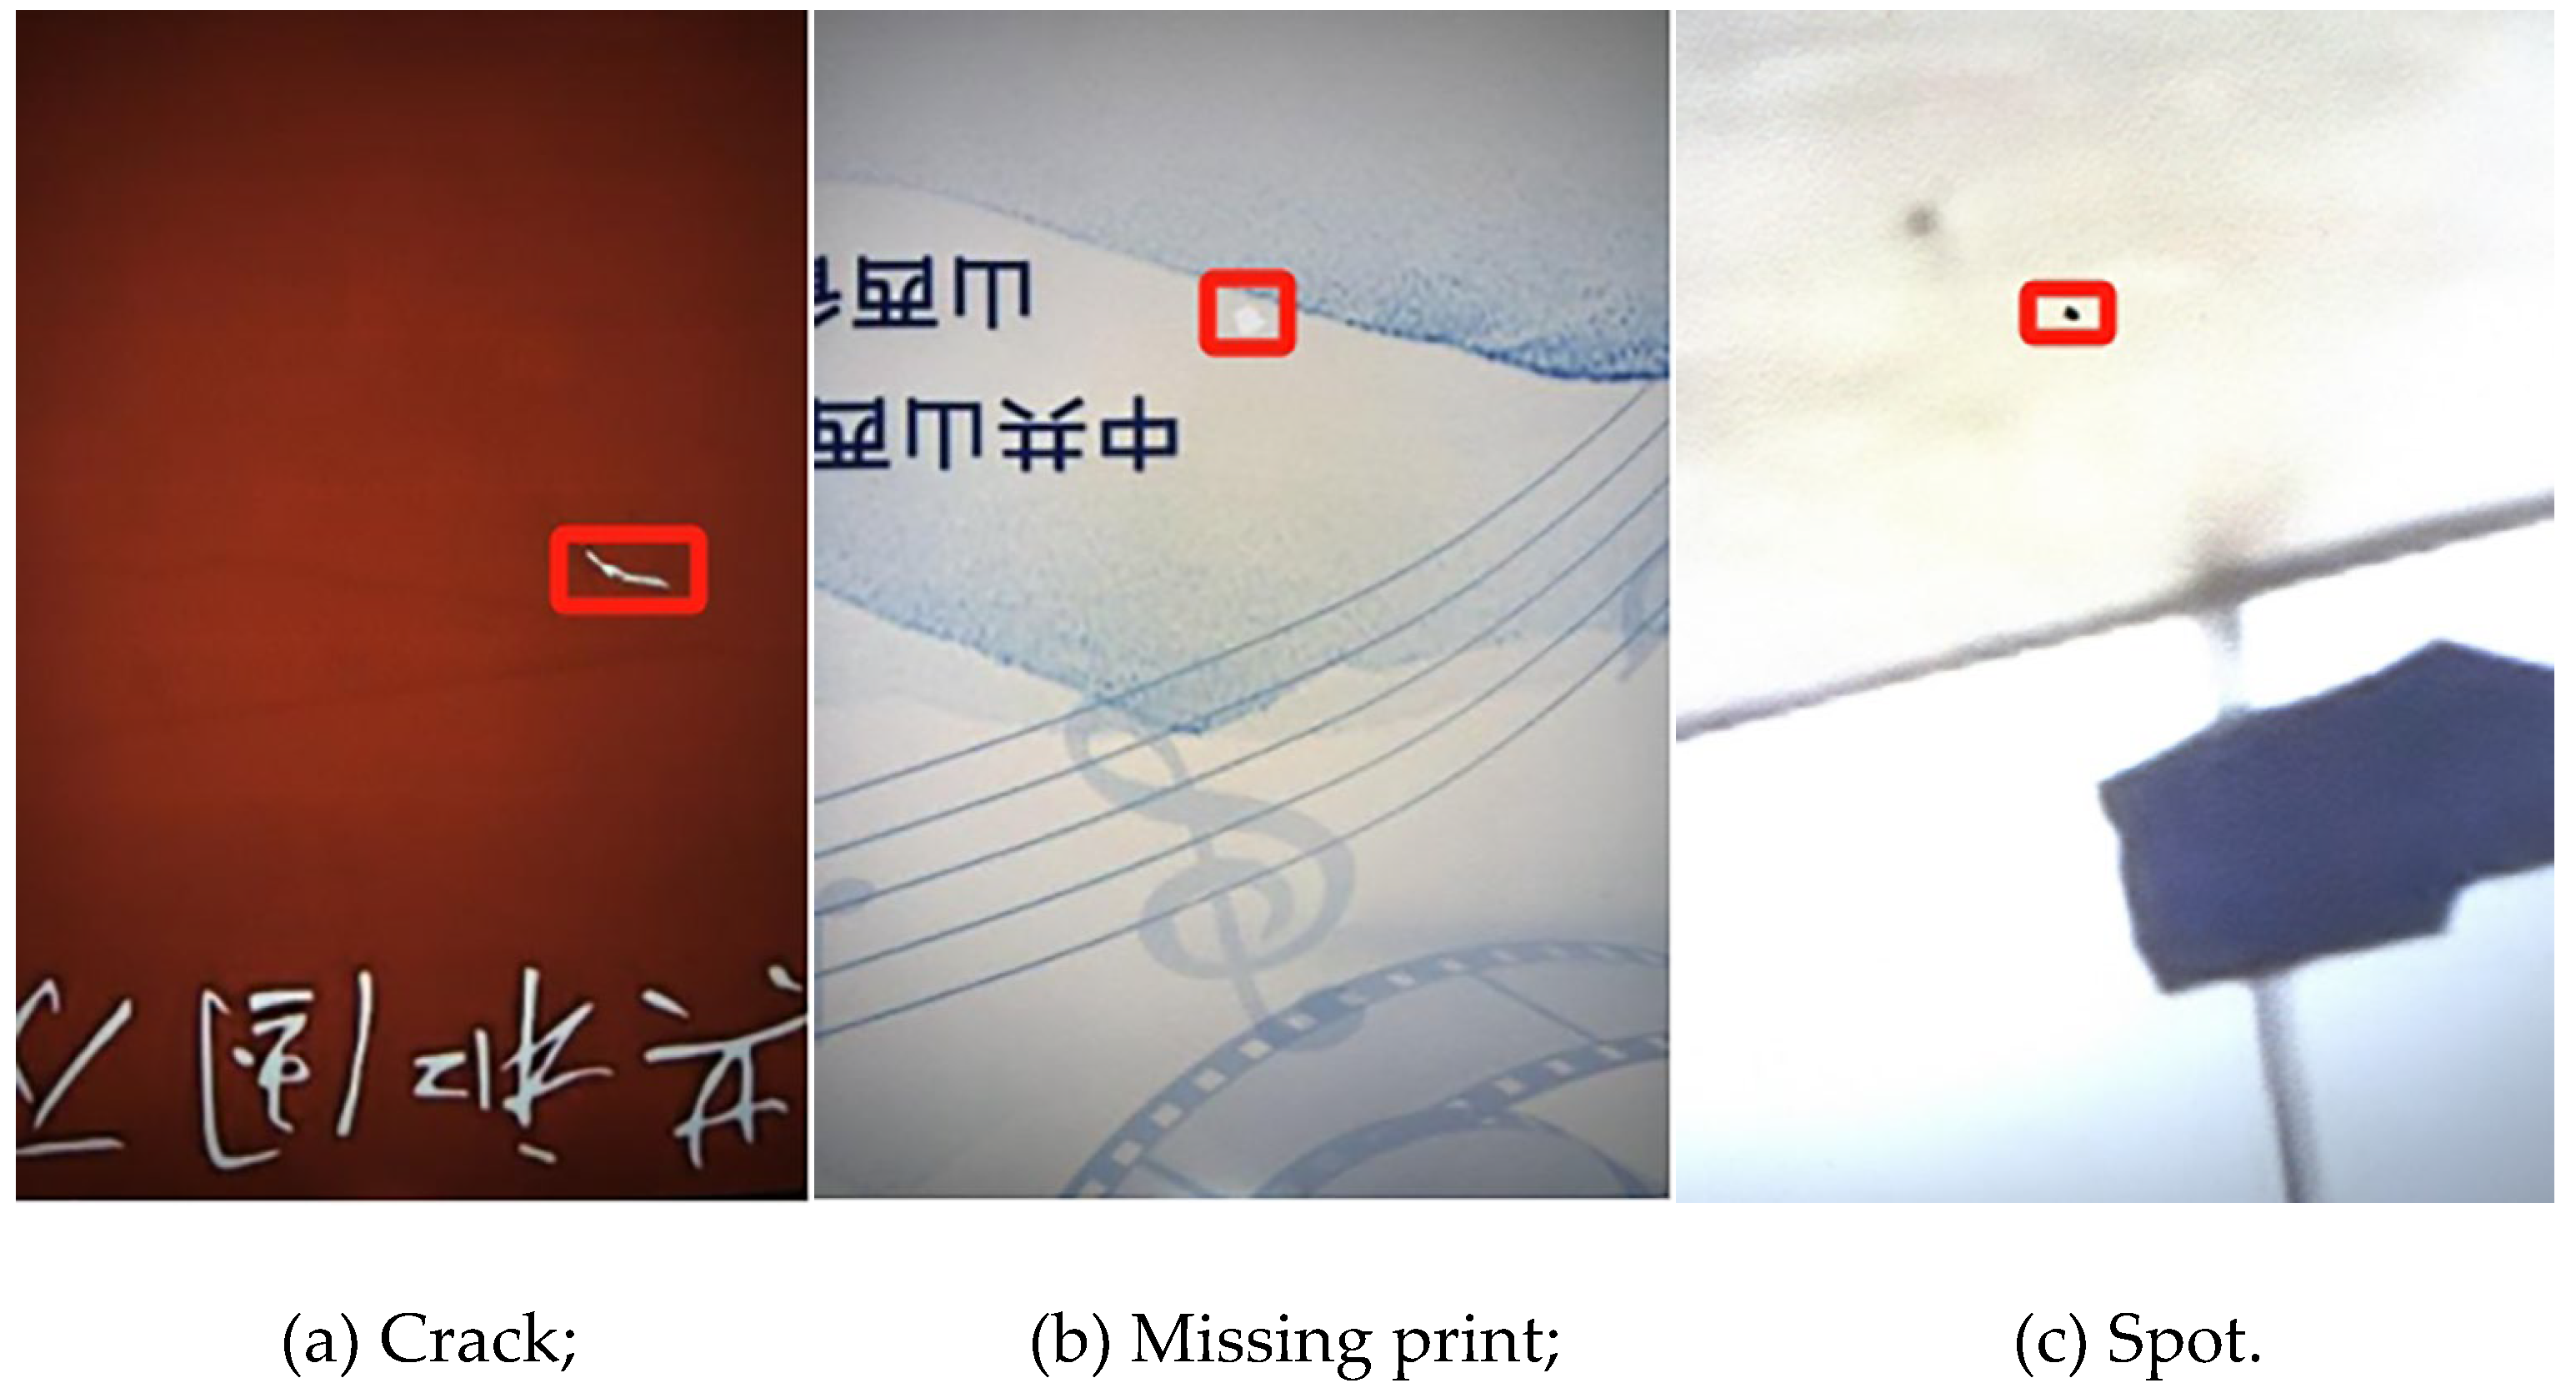
Figure 5.
Detection results on printed defects.
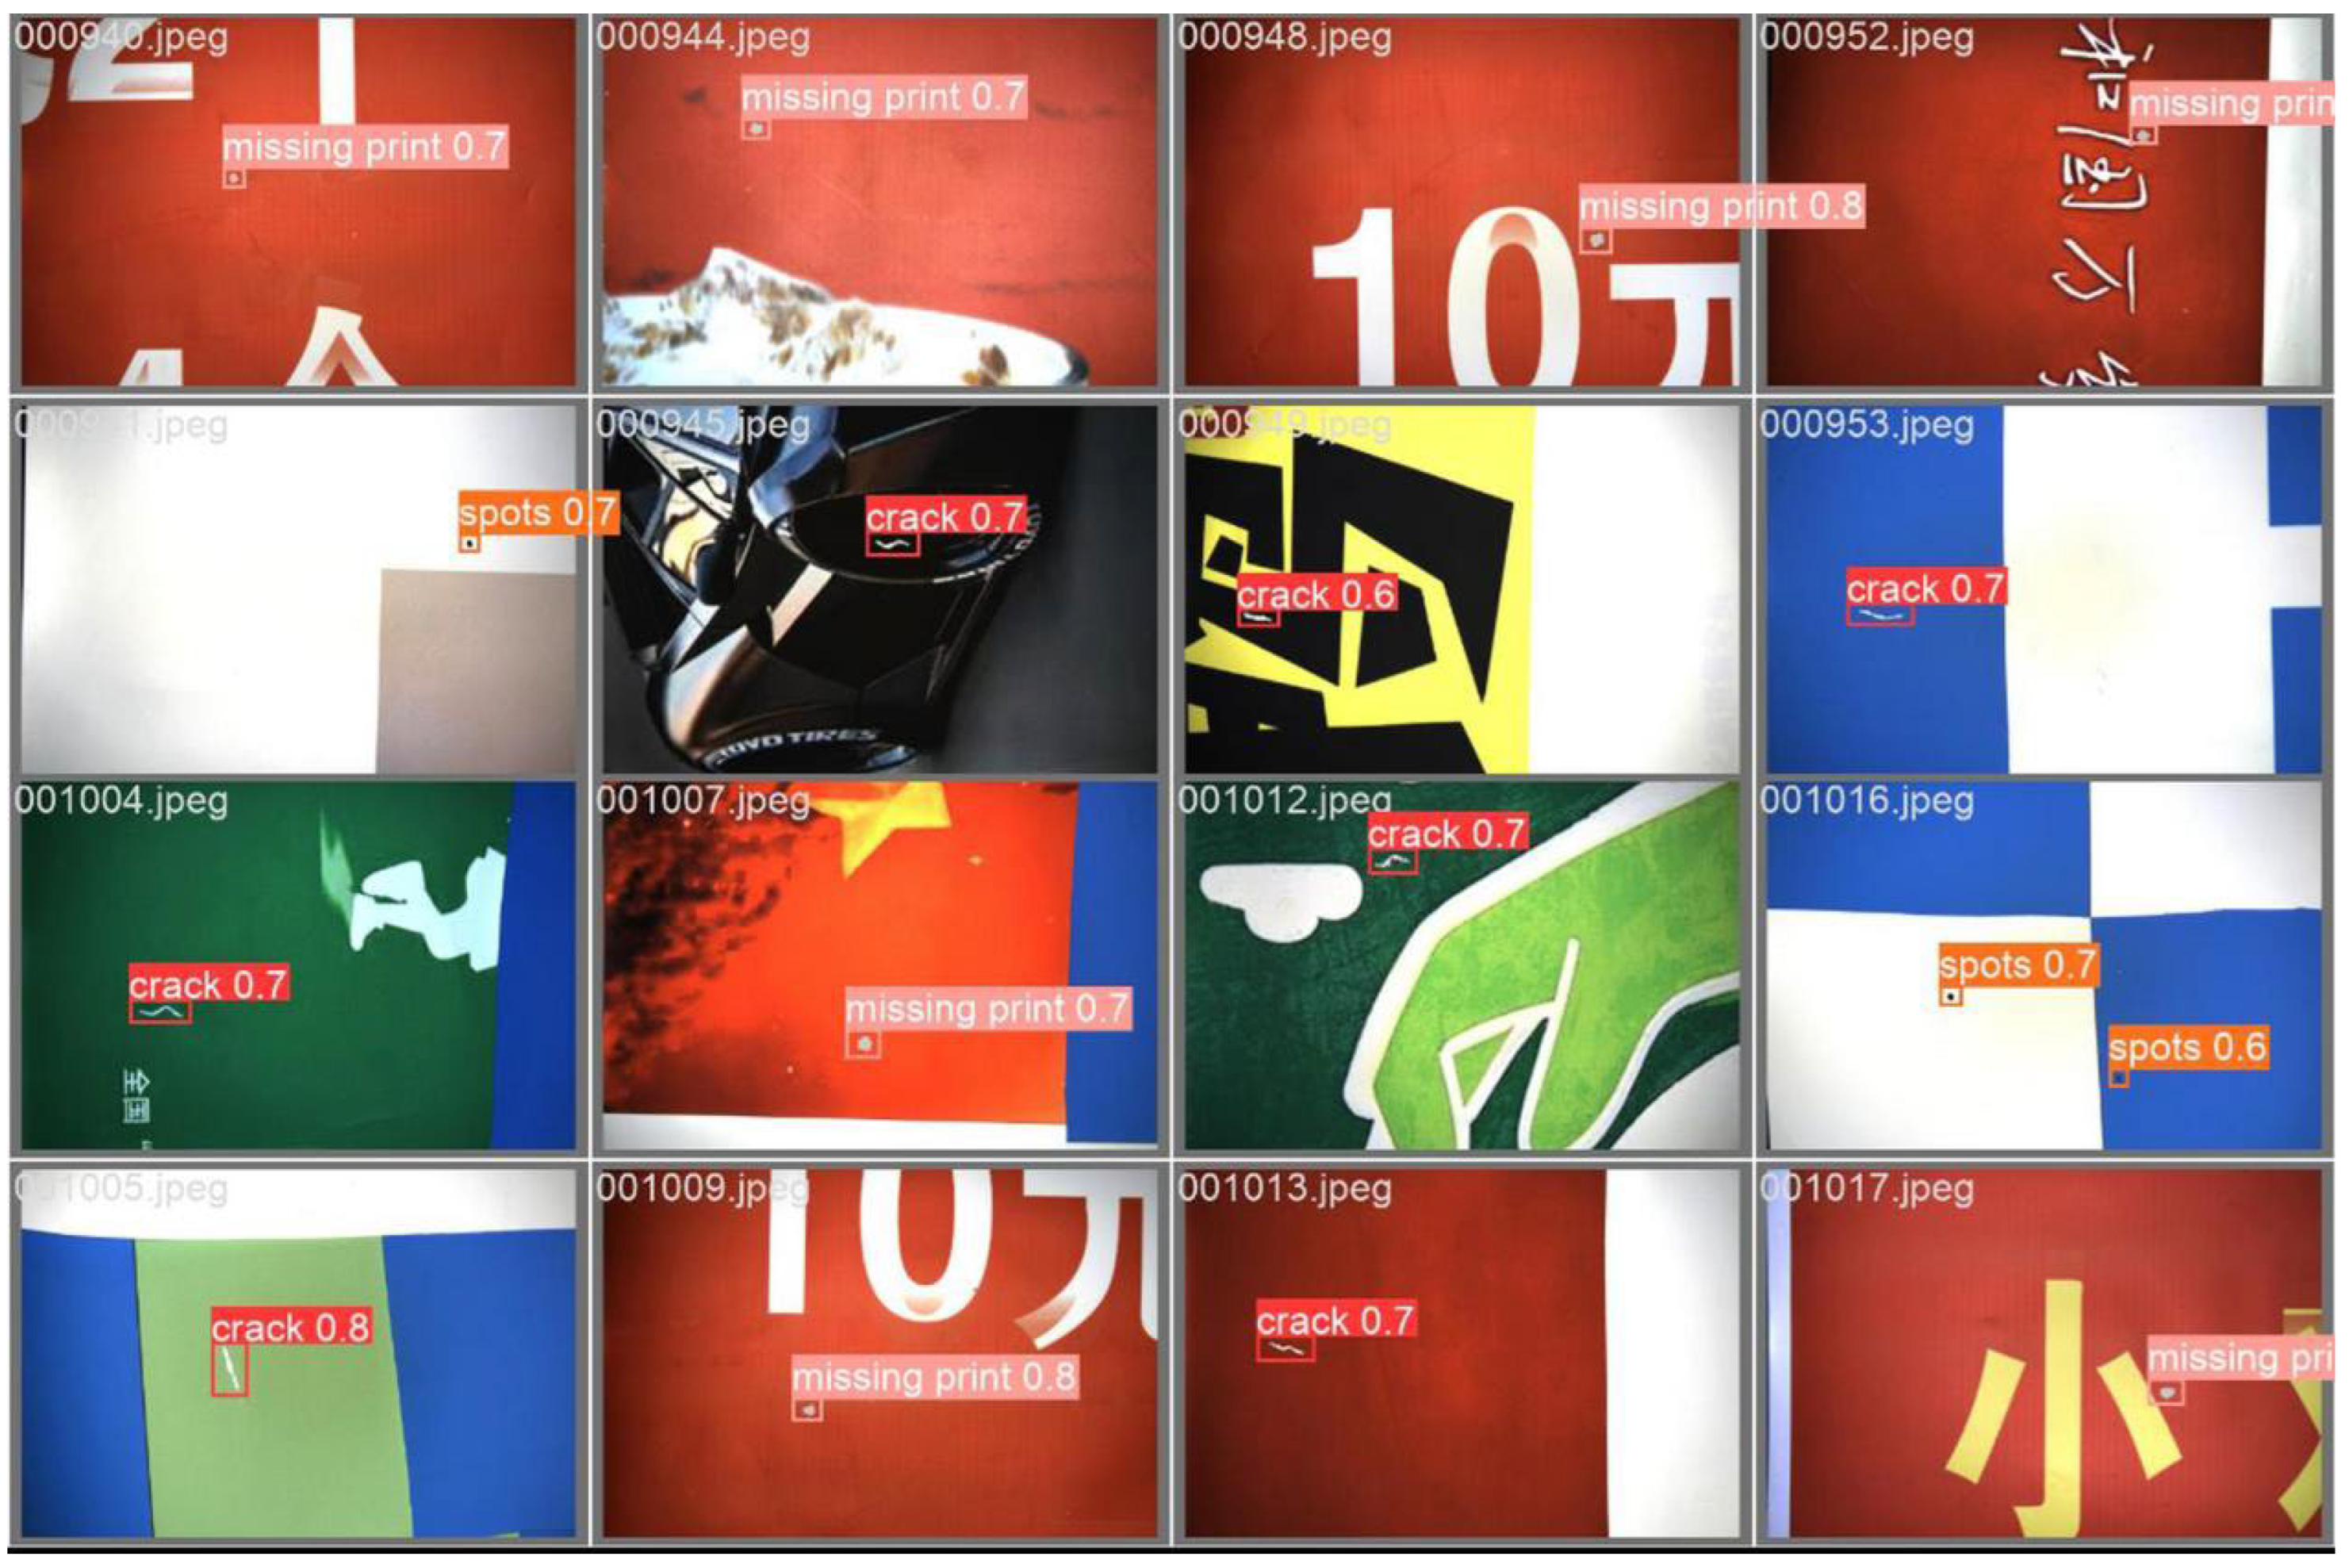
Figure 6.
Performance Comparison of Different Algorithmic Models.
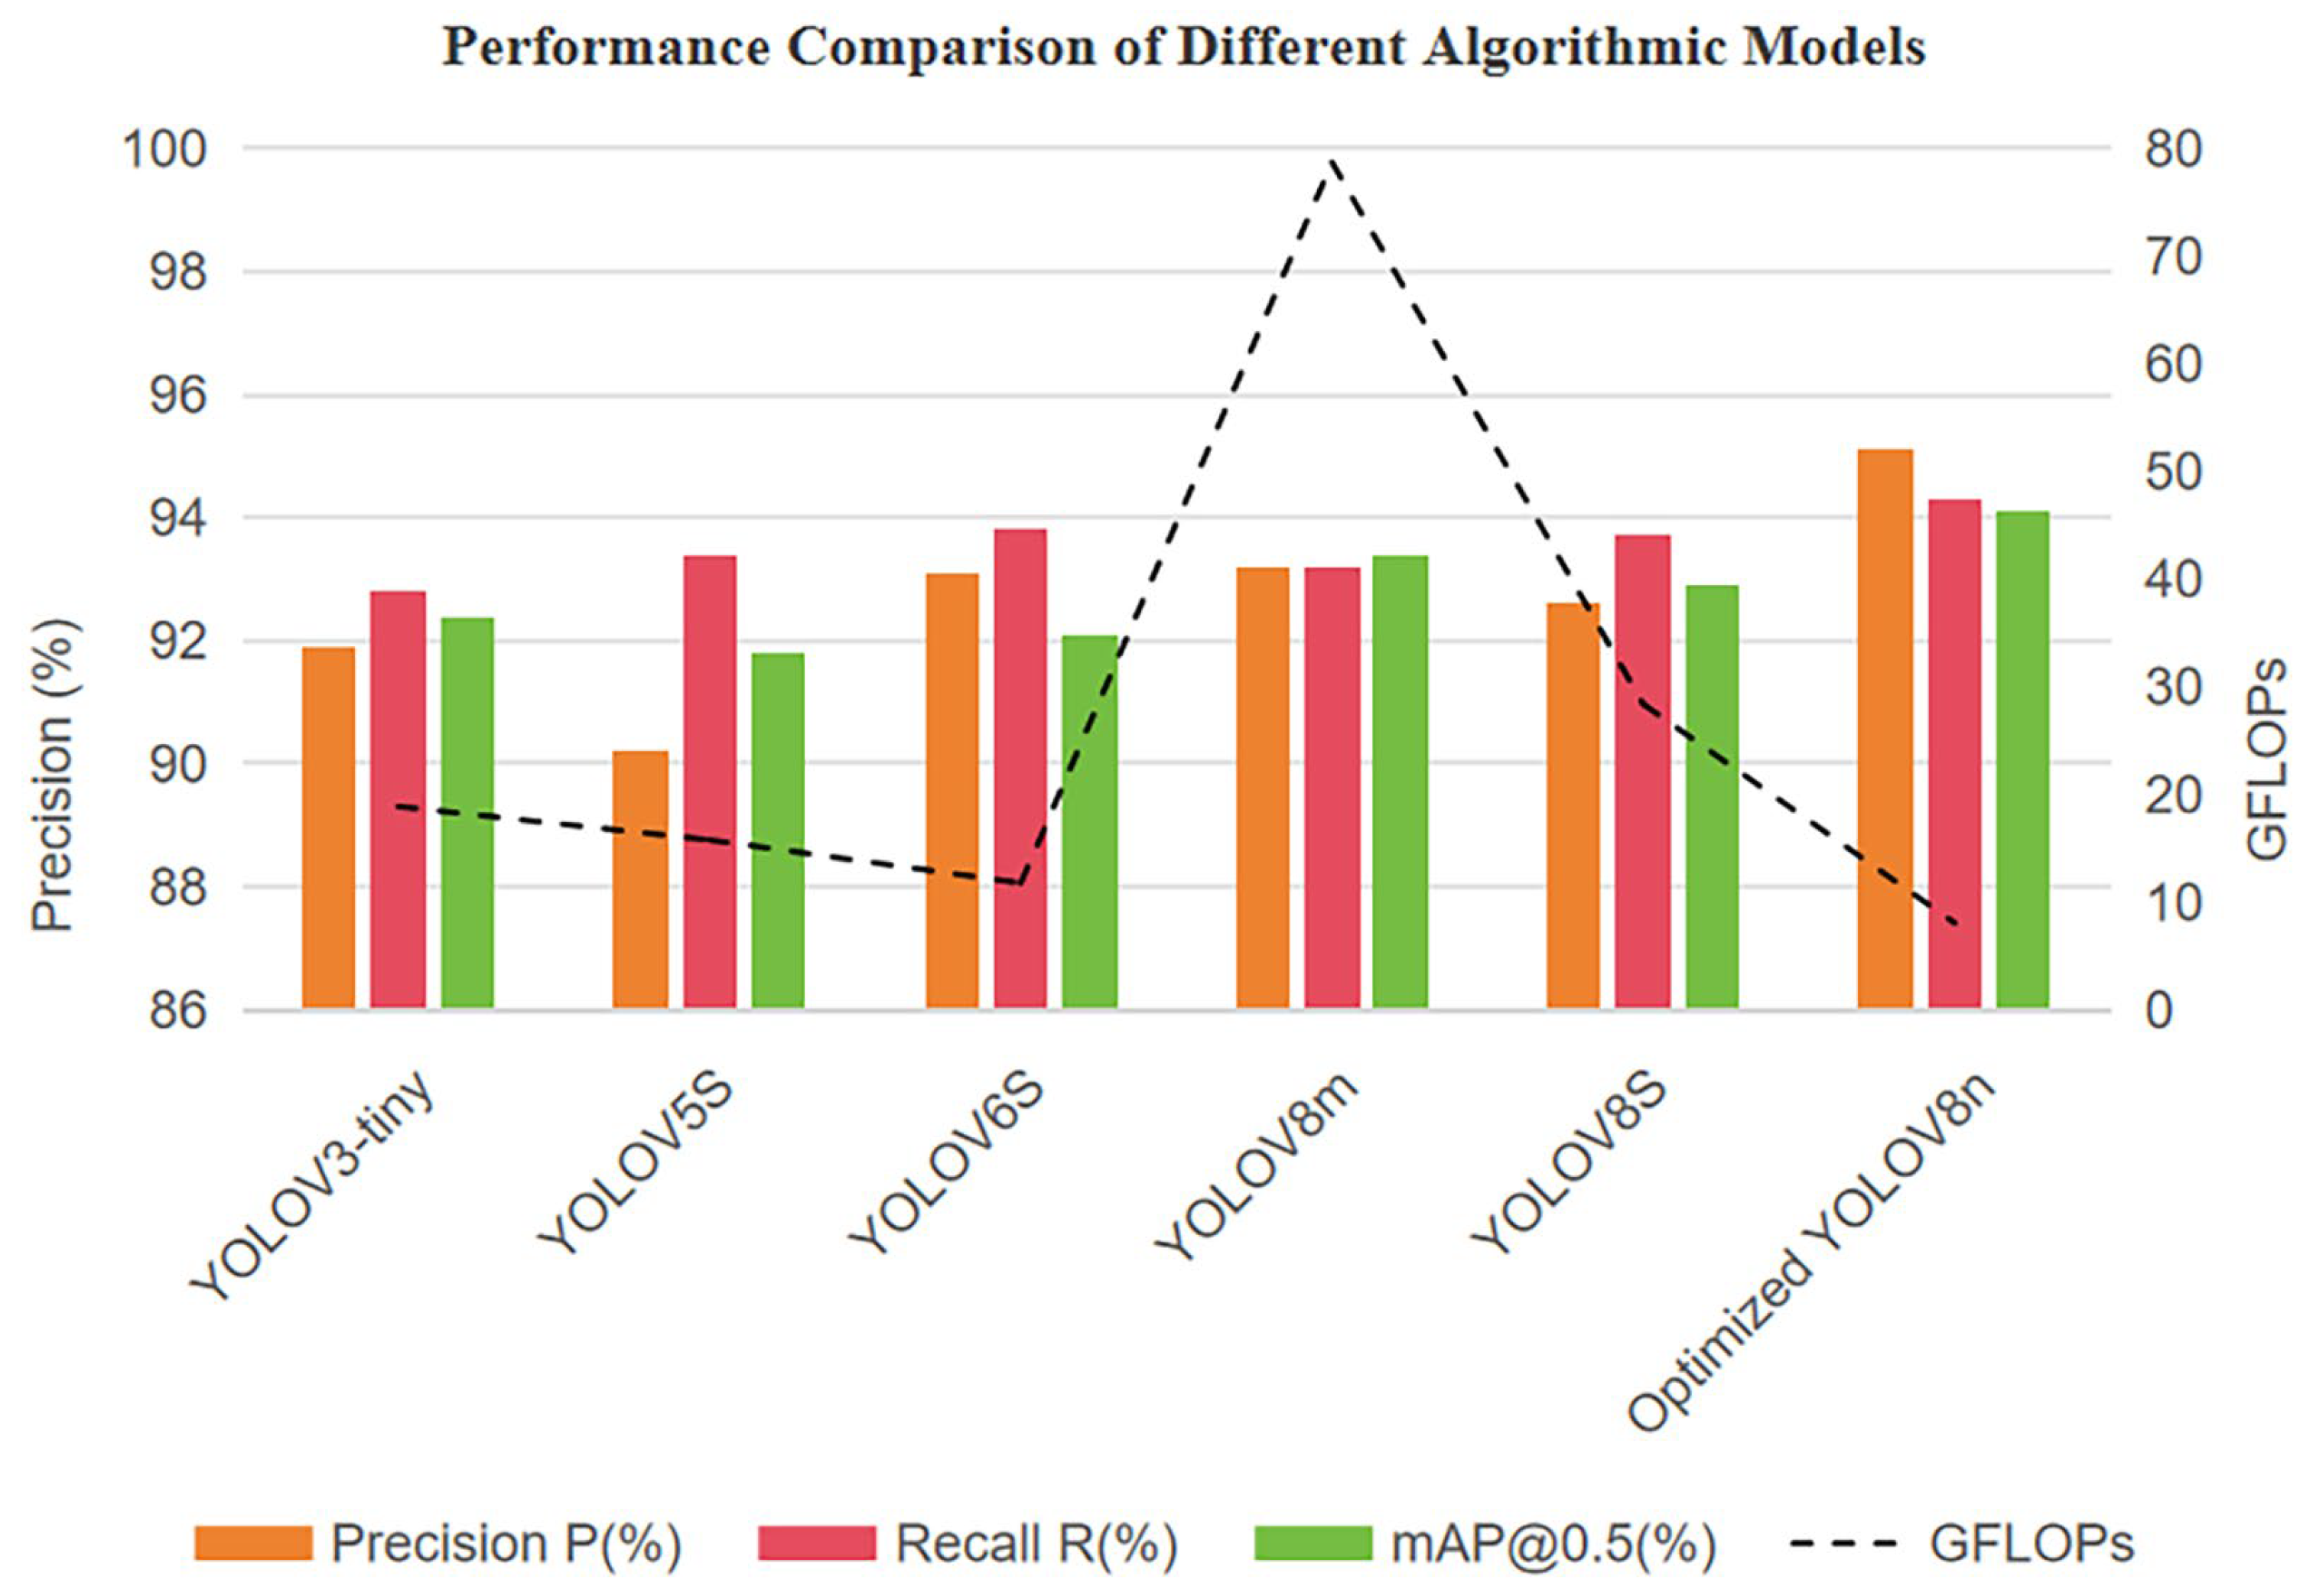
Table 3.
Comparative experiments of attention mechanisms.
| Model | P (%) | R (%) | mAP@0.5 (%) | mAP@[0.5:0.95] (%) |
|---|---|---|---|---|
| YOLOv8n | 93.2 | 94.2 | 92.8 | 39.1 |
| YOLOv8n+CA | 93.3 | 93.8 | 92.7 | 38.9 |
| YOLOv8n+Shuffle | 93.5 | 93.5 | 93.8 | 39.5 |
| YOLOv8n+CBAM | 93.4 | 94.2 | 93.5 | 39.9 |
| YOLOv8n+SE | 94.3 | 94.3 | 93.5 | 39.6 |
Table 4.
Comparison of bounding box regression loss functions.
| Loss function | P (%) | R (%) | mAP@0.5 (%) | mAP@[0.5:0.95] (%) |
|---|---|---|---|---|
| CIoU | 93.2 | 94.2 | 92.8 | 39.1 |
| WIoU-V3 | 93.2 | 93.8 | 93.1 | 39.3 |
| GIoU | 93.5 | 93.8 | 93.2 | 39.5 |
| EIoU | 94.1 | 95 | 93.8 | 39.6 |
Table 5.
Comparison of Defect Detection Results Before and After Optimization.
| Defect Type | Original YOLOv8n | Optimized YOLOv8n | ||
|---|---|---|---|---|
| P (%) | R (%) | P (%) | R (%) | |
| Crack | 95.9 | 96.5 | 98.5 | 96.8 |
| Missing print | 95.0 | 96.3 | 97.9 | 96.4 |
| Spot | 89.4 | 89.7 | 89.5 | 90.5 |
Table 6.
Comparison of Ablation Experiment Results.
| Model variant | P (%) | R (%) | mAP@0.5 (%) | mAP@[0.5:0.95] (%) |
|---|---|---|---|---|
| YOLOv8n | 93.2 | 94.2 | 92.8 | 39.1 |
| YOLOv8n+EIoU | 94.1 | 95 | 93.8 | 39.6 |
| YOLOv8n+SE | 94.3 | 94.3 | 93.5 | 39.6 |
| YOLOv8n+EIoU+SE | 95.1 | 94.3 | 94.1 | 39.6 |
Table 7.
Comparison of Detection Results Across Different Models.
| Model | P (%) | mAP@0.5 (%) | FPS | Params(M) | GFLOPs | Size/MB |
|---|---|---|---|---|---|---|
| YOLOv3-tiny | 91.9 | 92.4 | 108.9 | 12129206 | 18.9 | 23.2 |
| YOLOv5s | 90.2 | 91.8 | 104.3 | 7018216 | 15.8 | 14.4 |
| YOLOv6s | 93.1 | 92.1 | 145.6 | 4234041 | 11.8 | 8.3 |
| YOLOv8m | 93.2 | 93.4 | 106.4 | 25841497 | 78.7 | 49.6 |
| YOLOv8s | 92.6 | 92.9 | 105.3 | 11126745 | 28.4 | 21.5 |
| Optimized YOLOv8n | 95.1 | 94.1 | 100.2 | 3016985 | 8.1 | 6 |
Disclaimer/Publisher’s Note: The statements, opinions and data contained in all publications are solely those of the individual author(s) and contributor(s) and not of MDPI and/or the editor(s). MDPI and/or the editor(s) disclaim responsibility for any injury to people or property resulting from any ideas, methods, instructions or products referred to in the content. |
© 2025 by the authors. Licensee MDPI, Basel, Switzerland. This article is an open access article distributed under the terms and conditions of the Creative Commons Attribution (CC BY) license (http://creativecommons.org/licenses/by/4.0/).
Copyright: This open access article is published under a Creative Commons CC BY 4.0 license, which permit the free download, distribution, and reuse, provided that the author and preprint are cited in any reuse.


