Submitted:
18 June 2025
Posted:
19 June 2025
You are already at the latest version
Abstract
Steel surface defect detection plays a crucial role in industrial quality inspection. However, automated recognition remains challenging due to the complexity and diversity of defect types, such as cracks, pores, scratches, and dents. Traditional detection methods often struggle to balance accuracy and efficiency, especially in scenarios with complex backgrounds or small defect sizes. Although mainstream algorithms have made progress in improving recognition performance, they commonly exhibit limitations in sensitivity to small defects, robustness against background interference, and practicality for industrial applications. In order to confront the aforementioned difficulties, this paper proposes an enhanced surface defect detection method named MBY (MBDNet-Attention-YOLO), which integrates the MBDNet backbone with the YOLO framework. First, the backbone network incorporates modules such as HGStem,Dynamic Align Fusion,and C2f-DWR to achieve efficient extraction and fusion of multi-scale features while optimizing computational resource utilization. Second, in the neck structure, we design a MultiSEAM feature fusion module to enhance synergy across multi-scale features, thereby strengthening the model’s capability in detecting subtle defects and handling complex backgrounds. Furthermore, the Inner-SIoU cost function is incorporated to improve bounding box regression accuracy and accelerate training convergence by refining the alignment between predicted and ground-truth boxes. Experiments conducted on two public steel defect datasets, NEU-DET and PVEL-AD, demonstrate the effectiveness of our method. The MBY model achieves 85.8% mAP@0.5 on NEU-DET and 75.9% mAP@0.5 on PVEL-AD, outperforming state-of-the-art defect detection algorithms. These results validate that the proposed approach not only enhances detection accuracy but also exhibits strong generalization capability and practical potential.
Keywords:
MBDNet
; YOLO
; dynamic align fusion
; MultiSEAM
; Inner-SIoU
; steel surface defect detection
1. Introduction
The steel industry has become increasingly automated with industrial development. As an indispensable pillar of global infrastructure construction, the quality of steel is closely linked to engineering safety and service life. One of the most critical factors affecting steel quality is surface defect detection [1]. Therefore, steel surface defect detection is of paramount importance [2]. Defects such as pores, cracks, scratches, pits; decarburization often result from impurities in raw materials, improper production processes, or faulty equipment [3]. These defects not only compromise the aesthetic appeal of steel but also degrade its mechanical properties and corrosion resistance. For instance, cracks and pores may lead to structural fractures during subsequent processing or use, significantly reducing safety, while scratches and pits can adversely affect coating adhesion and surface treatment effectiveness.
Currently, steel surface anomaly identification methodologies can be broadly delineated into traditional image processing techniques and deep learning-based intelligent detection approaches [4]. Traditional methods rely heavily on manual experience or handcrafted features, impeding the capacity to fulfill the dual imperatives of efficiency and precision in modern manufacturing [5]. In contemporary times, the burgeoning field of Machine Learning and Cognitive Computing, particularly deep learning, have made it a dominant direction in steel defect detection. Common object detection algorithms can be apportioned into two divisions: Dual-Phase methods, illustrated by the R-CNN series [6], which offer high accuracy but suffer from slow inference speeds due to their multi-step process; and single-stage methods, such as YOLO [6,7,8] and SSD [10], which prioritize efficiency but often at the cost of reduced accuracy. Moreover, steel defects in real-world scenarios often exhibit irregular shapes and small sizes, further complicating accurate detection. To ensure robust performance, models must possess strong feature representation capabilities and maintain stability under varying backgrounds, placing higher demands on algorithm robustness.
Object detection methodologies predicated on Convolutional Neural Networks (CNNs) have consequently become a research hotspot in Steel Surface Anomaly Identification. Zhao et al. [11] put forward an enhanced YOLOv5 model called RDD-YOLO, which expands the receptive field using Res2Net, enhances feature reuse and expression through a dual feature pyramid network (DFPN); improves classification and regression independence with a decoupled detection head. Experimental results show that RDD-YOLO achieves a 4.3% and 5.8% increase in mAP across the NEU-DET and GC10-DET datasets, correspondingly, while maintaining high detection speeds. Sunkara et al. [12] introduced the YOGA model, which combines lightweight feature learning with multi-scale attention mechanisms. By employing a CSPGhostNet backbone and an AFF-PANet feature fusion network, YOGA improves detection accuracy. The model adopts a two-stage feature learning pipeline and group convolution to reduce the number of convolutional kernels, thereby lowering parameters and computational costs while retaining feature learning capabilities. To optimize multi-scale feature fusion, YOGA incorporates a local attention mechanism in the neck network, effectively enhancing small object detection. Experiments demonstrate that YOGA achieves a 15% improvement in average precision (AP) on the COCO validation set compared to YOLOv5, while reducing computational load and parameters by 29% and 23%, respectively, showcasing strong adaptability for edge devices.
Shi et al. [13] elaborated an optimized Faster R-CNN model, which adopts a ConvNeXt backbone and integrates a CBAM module to enhance focus on steel surface defects while reducing background interference. Additionally, the model optimizes anchor box generation using the k-means clustering algorithm. Experiments show that the improved Faster R-CNN achieves an mAP of 80.78% on the NEU-DET dataset, outperforming YOLOv5 by 1.5% and the original Faster R-CNN by 8.4%, with a detection velocity of 26 frames per second, demonstrating superior real-time defect detection capabilities. Meng et al. [14] introduced a refined YOLOv8n model by replacing the SPPF module to enhance the accuracy and speed of steel surface defect detection. Experimental results confirm that the modified YOLOv8n outperforms the original YOLOv8n on the NEU-DET dataset, validating its excellence in defect detection. Liu et al. [15] proposed an augmented zero-shot YOLOv10 model (EZS-YOLOv10) to optimize the detection of tiny steel defects. The model improves detection accuracy through adaptive multi-scale feature fusion and an enhanced anchor box mechanism, while incorporating a region feature synthesis network for zero-shot learning. Experimental results show that EZS-YOLOv10 realizes a 1.5% augmentation in mAP on the COCO dataset and a 2.7% improvement in mAP for tiny objects, along with a 2.7% mAP gain on the VisDrone dataset. Guo et al. [16] developed the MSFT-YOLO model, which integrates Transformer's TRANS module into YOLOv5. By leveraging multi-scale feature fusion and a BiFPN structure, MSFT-YOLO improves the detection accuracy of steel surface defects, particularly in scenarios with background interference and small defects. Experimental results indicate that MSFT-YOLO achieves a 7% increase in mAP on the NEU-DET dataset. Tang et al. [17] proposed an optimized YOLOv5n model for steel strip surface defect detection. By introducing an attention mechanism within the foundational network architecture, the model enhances defect feature distillation and accelerates convergence through an optimized loss function. Experimental findings demonstrate that the refined model attains an 8.3% increase in recall and a 3.6% improvement in average precision compared to YOLOv5n, while reducing training time by 44%. Jiang et al. [18] introduced the YOLOv8n-SDEC model, which replaces the SPPF module with an SPPCSPC module to improve perception of defects at different scales. The model also incorporates deformable convolution (DCNv2) and CARAFE modules to optimize feature extraction and upsampling. Furthermore, by replacing the CIoU loss function with EIoU, the model enhances regression accuracy and convergence speed. Experimental results demonstrate that YOLOv8n-SDEC achieves a 3.3% improvement in mAP on the NEU-DET dataset, significantly boosting detection accuracy. Zhong et al. [19] articulated an augmented YOLOv5 model for steel surface defect detection. By introducing an OSA-C3 module to enhance feature transformation, a BiC-PAN structure to improve multi-scale feature fusion; a coordinate attention (CA) mechanism to optimize localization accuracy, the model achieves an mAP of 79.1% on the NEU-DET dataset, outperforming YOLOv5 by 2.6% while maintaining high detection speeds. Zhao et al. [20] formulated an attention-based multi-scale feature fusion module (AMFF), which enhances steel surface defect detection accuracy through a self-enhanced attention module (SEAM) and a cross-enhanced attention module (CEAM). SEAM augments feature information using dilated convolution and internal attention mechanisms, while CEAM optimizes feature fusion through cross-layer attention. Experiments show that integrating AMFF into FPN and PAFPN significantly improves detection accuracy and real-time efficacy.
With the objective of confronting these issues, this paper proposes MBY (MBDNet-Attention-YOLO), a steel surface defect detection method that combines a dual-backbone structure with attention mechanisms. Specifically, we construct an efficient feature extraction backbone network, MBDNet, which incorporates HGStem [21], Dynamic Align Fusion [22]; C2f-DWR [23] modules to enhance multi-scale information perception and expression. Subsequently, the MultiSEAM [24] module is added to the neck structure to further extract and fuse spatial and channel information across different scales, adapting to complex texture backgrounds and tiny defect detection requirements. Additionally, to improve bounding box localization accuracy and accelerate training convergence, we introduce an improved Inner-SIoU [25] loss function to optimize the matching between predicted and ground-truth boxes. Finally, we validate the proposed method on two public datasets, NEU-DET [26] and PVEL-AD [27]. Experimental results demonstrate that MBY outperforms existing mainstream algorithms in both detection accuracy and recall, proving its effectiveness.
The principal advancements of this research are presented hereinafter:
1. We asserted MBY, a steel surface defect detection method that combines the MBDNet backbone with the YOLO framework, achieving high performance while maintaining inference efficiency.
2. We design a compact and powerful backbone network, MBDNet, incorporating HGStem, Dynamic Align Fusion; C2f-DWR modules to enhance multi-scale feature extraction.
3. We introduce the MultiSEAM module in the detection head to integrate multi-scale spatial and channel information, improving detection performance for small defects and complex backgrounds.
4. We propose the Inner-SIoU loss function to enhance bounding box regression accuracy and training stability, improving overall model robustness.
2. Proposed Method
2.1 Backbone Network: MBDNet
In this study, we introduce a novel backbone architecture named MBDNet, characterized by a dual-backbone framework designed to improve both feature extraction and integration. The comprehensive structure of the proposed network is depicted in Figure 1. Conventional convolutional neural networks (CNNs) frequently encounter difficulties in efficiently capturing multi-scale features, especially when addressing complex defect recognition challenges, which consequently hinders the comprehensive efficacy of the model.
To address this, we design two specialized modules: HGStem for low-level feature extraction and C2f for high-level feature fusion, both significantly improving the network’s representational capacity.
To further boost computational efficiency, we integrate the Depthwise Separable Convolution (DWConv) module [28]. DWConv decomposes standard convolutions into depthwise and pointwise operations, drastically reducing computational cost while preserving the ability to extract rich multi-scale feature information [29].Additionally, to strengthen feature fusion capabilities, we incorporate the Dynamic Align Fusion module, which aligns and merges feature maps across different scales, thereby enhancing the model’s multi-scale perception [30]. Ultimately, the Spatial Pyramid Pooling Fast (SPPF) module is integrated to enhance the perceptual domain, ergo boosting the network's ability to detect objects of diverse sizes.
In summary, the core components of MBDNet include HGBlock, DWConv, Dynamic Align Fusion; SPPF, collectively enabling efficient and robust multi-scale feature extraction and fusion.
In tasks involving small object detection, standard
convolution operations, as depicted in Figure 2(a),
tend to capture excessive redundant information, which leads to increased
computational overhead. To address this issue, this study replaces conventional
convolution (Conv) with Depthwise Separable Convolution (DWConv). The DWConv
process, illustrated in Figure 2(b), decomposes
convolution into two distinct stages. Initially, depthwise convolution is
applied independently on each input channel, producing a reduced feature map,
denoted as . Subsequently, a simpler linear operation is conducted: group
convolution is performed channel-wise, instead of the cross-channel convolution
used in standard methods, resulting in a redundant feature map, denoted as . In the end, these two feature maps, denoted as and , are merged to produce the final output feature map
with depth , which can be expressed as:
In this context, X refers to the
feature map at the input layer,while denotes the
standard convolution kernel, denotes the group
convolution kernel. ⊗ stands
for the standard convolution operation, ⊕ indicates
concatenation along the channel dimension.
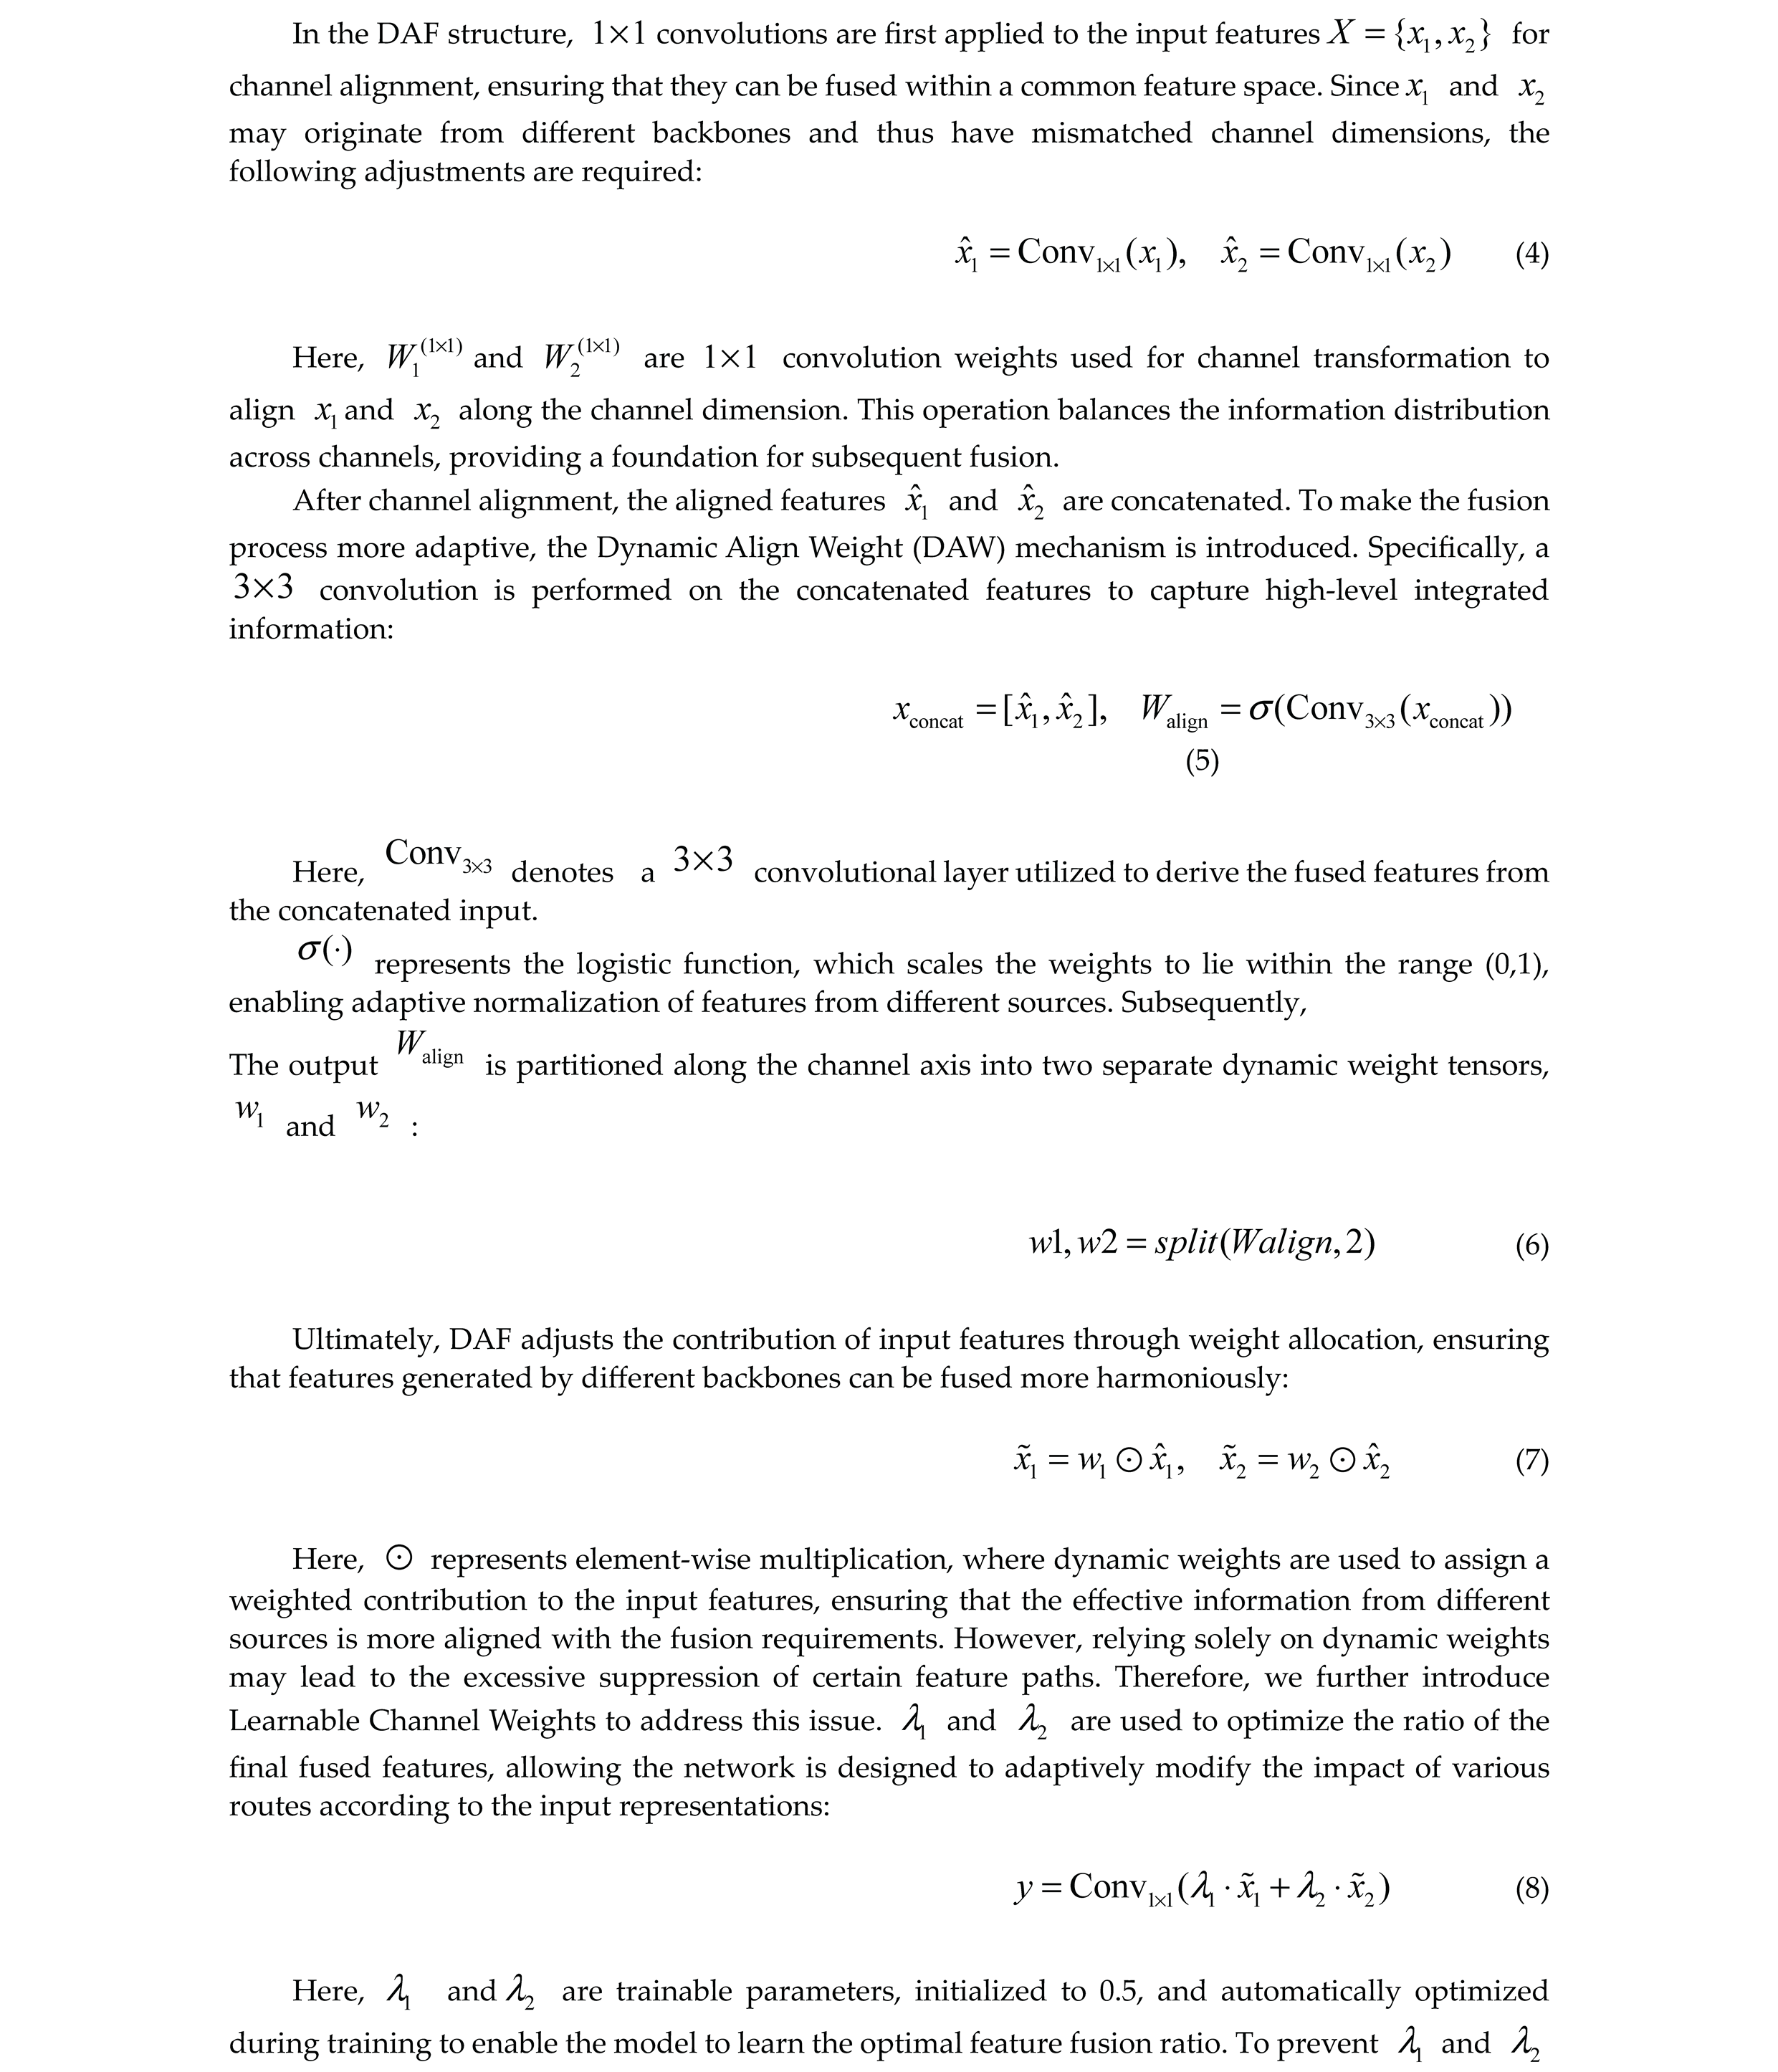
2.2. Dynamic Align Fusion (DAF)
To mitigate feature alignment errors across multiple backbones, this work introduces a Dynamic Align Fusion (DAF) mechanism [31]. Because features from different sources often differ in channel dimensions, spatial layouts; scales, straightforward concatenation or weighted fusion can degrade the completeness of feature representations. DAF addresses this by implementing feature alignment, adaptive weighting; channel-wise modulation, enabling more precise fusion and thereby boosting object detection network performance. The working principle of DAF is depicted in Figure 3. This approach is compatible with various architectures such as YOLOv8, EfficientDet [32]; PP-YOLO [33], enhancing detection accuracy while keeping additional computational costs low.
2.3. C2f-DWR Module
In object detection tasks, YOLOv8 utilizes the C2f (Cross Stage Partial Feature Fusion) module to achieve feature fusion, allowing efficient sharing of information across different layers and improving both detection accuracy and computational efficiency [34]. Nevertheless, in the domain of steel surface defect detection, challenges including edge damage
, pits, scratches; decarburization layers often vary significantly in terms of shape, size; distribution. The large scale variation and complex shapes of these defects make it difficult for the standard C2f structure to capture multi-scale information effectively. When defects have blurred boundaries or uneven distribution, the model may fail to gather enough contextual information, which impacts detection performance and may result in false positives or undetected defects.To address this issue, this paper proposes an enhanced solution — the C2f-DWR module, which incorporates the Dilated Residual (DWR) mechanism into the original C2f structure to further improve feature extraction [35].
The structural design of the DWR module is illustrated in Figure 4.This module adopts a dual-branch structure consisting of Region Residual (RR) and Semantic Residual (SR) components, aimed at enhancing feature extraction and enabling the model to achieve enhanced proficiency in managing defects that exhibit a wide range of dimensions.
Initially, the input features are processed with a 3×3 standard convolution.Afterward, the framework incorporates a normalization technique based on batch statistics, which is succeeded by an element-wise thresholding operation to introduce nonlinearity into the data flow, thus enabling the model to perform both normalization and nonlinear transformation effectively. This part belongs to the RR branch, which is primarily responsible for extracting local detail information, enabling the model to better recognize small defects.
Next, the features are passed to the SR branch for further
feature extraction. Subsequent to the application of depthwise
convolution (DConv), the feature maps are subjected to a pair of depthwise
convolutions, each characterized by distinct dilation rates, thereby
facilitating multi-scale feature extraction. Specifically, one branch employs a
dilation rate of 3 (denoted as D-3), while the other utilizes a dilation rate
of 5 (denoted as D-5). This dual-branch approach effectively expands the receptive
field, thereby facilitating the model's capacity to assimilate a more expansive
ambit of contextual intelligence.
Finally, the features from both branches are concatenated,
followed by batch normalization (BN) for data adjustment and a dimensionality-reducing
convolutional
layer is utilized to alleviate computational burden. Thereafter, the resultant
feature map is amalgamated with the initial input features by means of a
residual linkage. This process enables the network to conserve the pristine information,
refine feature depiction; augment detection precision.
The architectural configuration of the C2f-DWR unit is depicted in Figure 4(b).The core idea is to introduce different dilation rates into convolution operations to broaden the receptive field, thereby enabling it to capture a more extensive range of features while maintaining a relatively low computational complexity.Compared to increasing convolution kernel sizes or deepening the network layers, this strategy enhances computational efficiency while guaranteeing superior precision in detection and rapid processing velocity.With this improvement, the model can accurately extract features, whether for tiny scratches or large surface damages, improving detection stability and generalization.
2.4 Detect_MultiSEAM
Steel surface defects exhibit diverse types—including scratches, pits, cracks, oxidation spots; peeling—varying widely in size and morphology. These defects are further complicated by complex textures, illumination variations; noise interference, posing significant challenges to detection. To enhance defect feature extraction, the MultiSEAM module is introduced into the detection head of the YOLOv8n model, as illustrated in Figure 5. This module extracts and fuses deep features output from the backbone across multiple scales, enabling more comprehensive capture of the spatial distribution and morphological characteristics of defects. As a result, the model’s capacity to identify various types of defects is enhanced, thereby minimizing false alarms and reducing the incidence of undetected defects.Additionally, MultiSEAM mitigates information loss caused by occlusion and uneven lighting through feature fusion, thereby augmenting the model's robustness and versatility in steel surface defect detection [36].
MultiSEAM improves detection accuracy by strengthening feature extraction in unoccluded regions and alleviating the performance degradation caused by object occlusion. Its core component is the Channel and Spatial Mixed Module (CSMM), which processes input features using parallel convolution kernels of varying scales to more fully capture multi-scale information, allowing for more precise defect localization. Within CSMM, depthwise separable convolutions and residual connections are combined to reduce computational complexity while preserving feature integrity and improving efficiency. Since handling channel information individually might overlook inter-channel correlations, a 1×1 convolution is additionally employed to integrate channel features and enhance feature interactions. The processed features then undergo global average pooling to reduce spatial dimensions, minimizing redundant information and boosting feature stability. Subsequently, A dual-layer fully connected network further integrates channel information, thereby reinforcing the interconnections among distinct features. Finally, channel expansion operations integrate multi-scale information effectively, significantly reducing detection errors caused by occlusion or complex background interference.
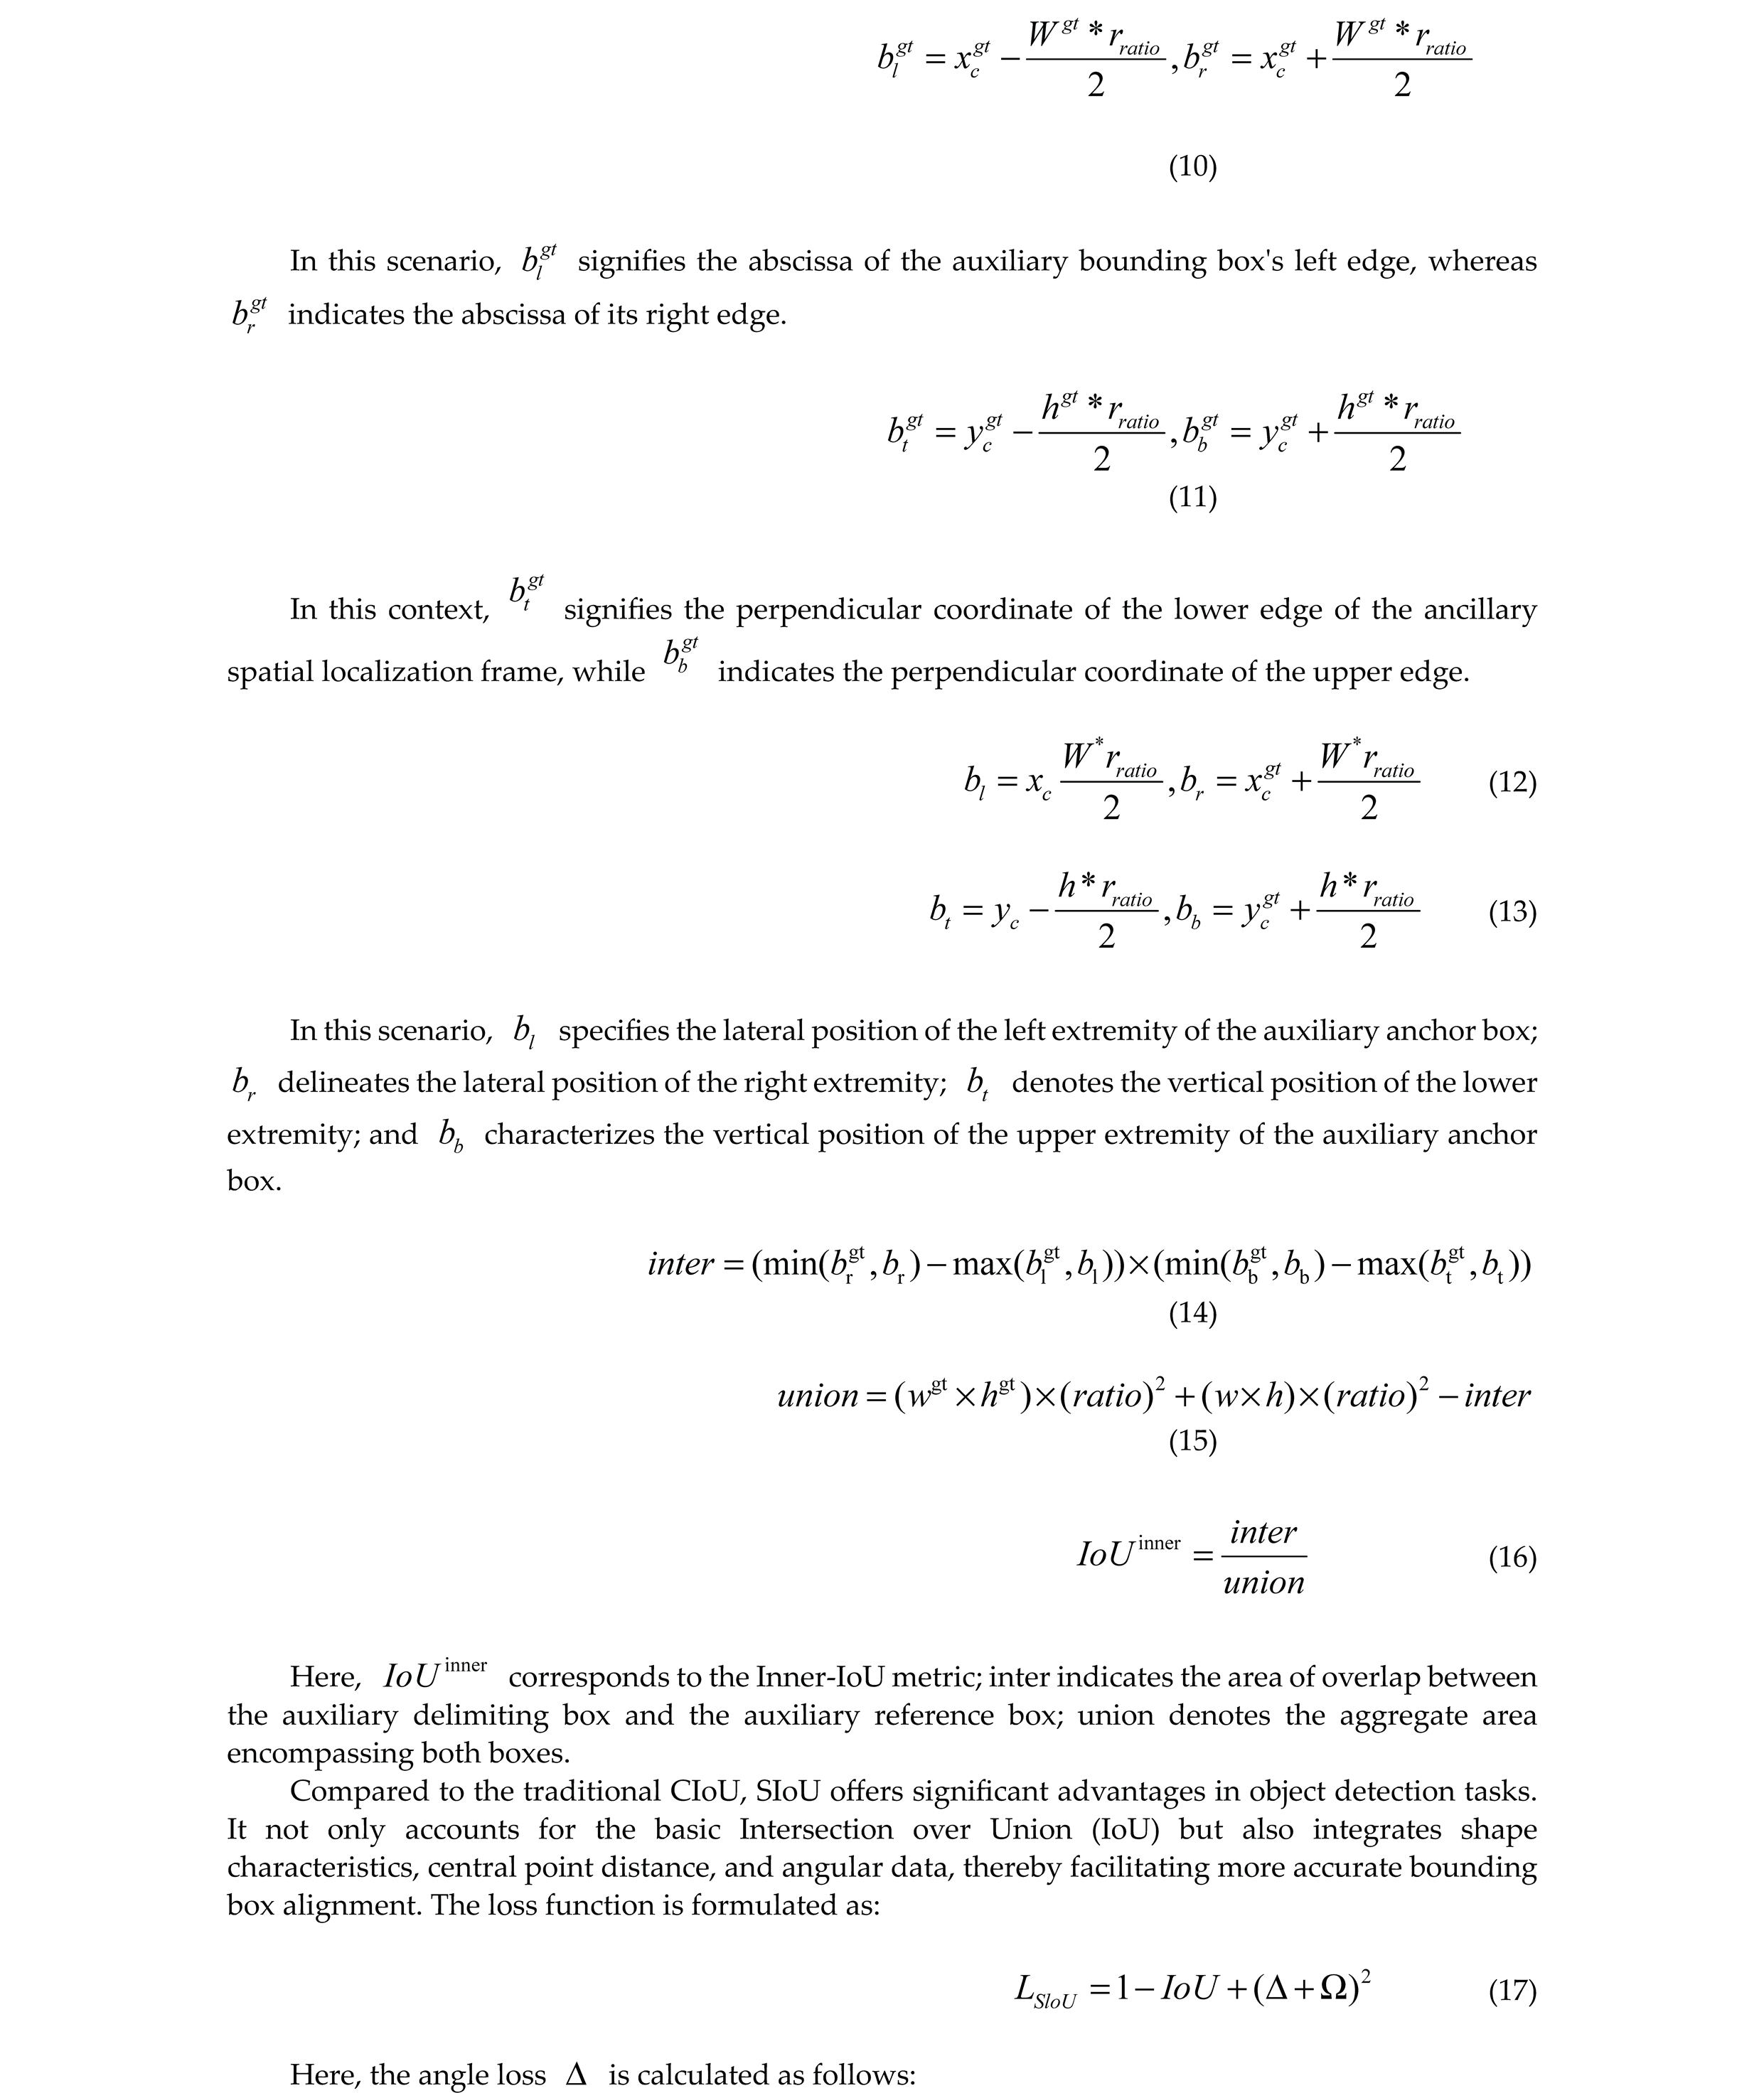
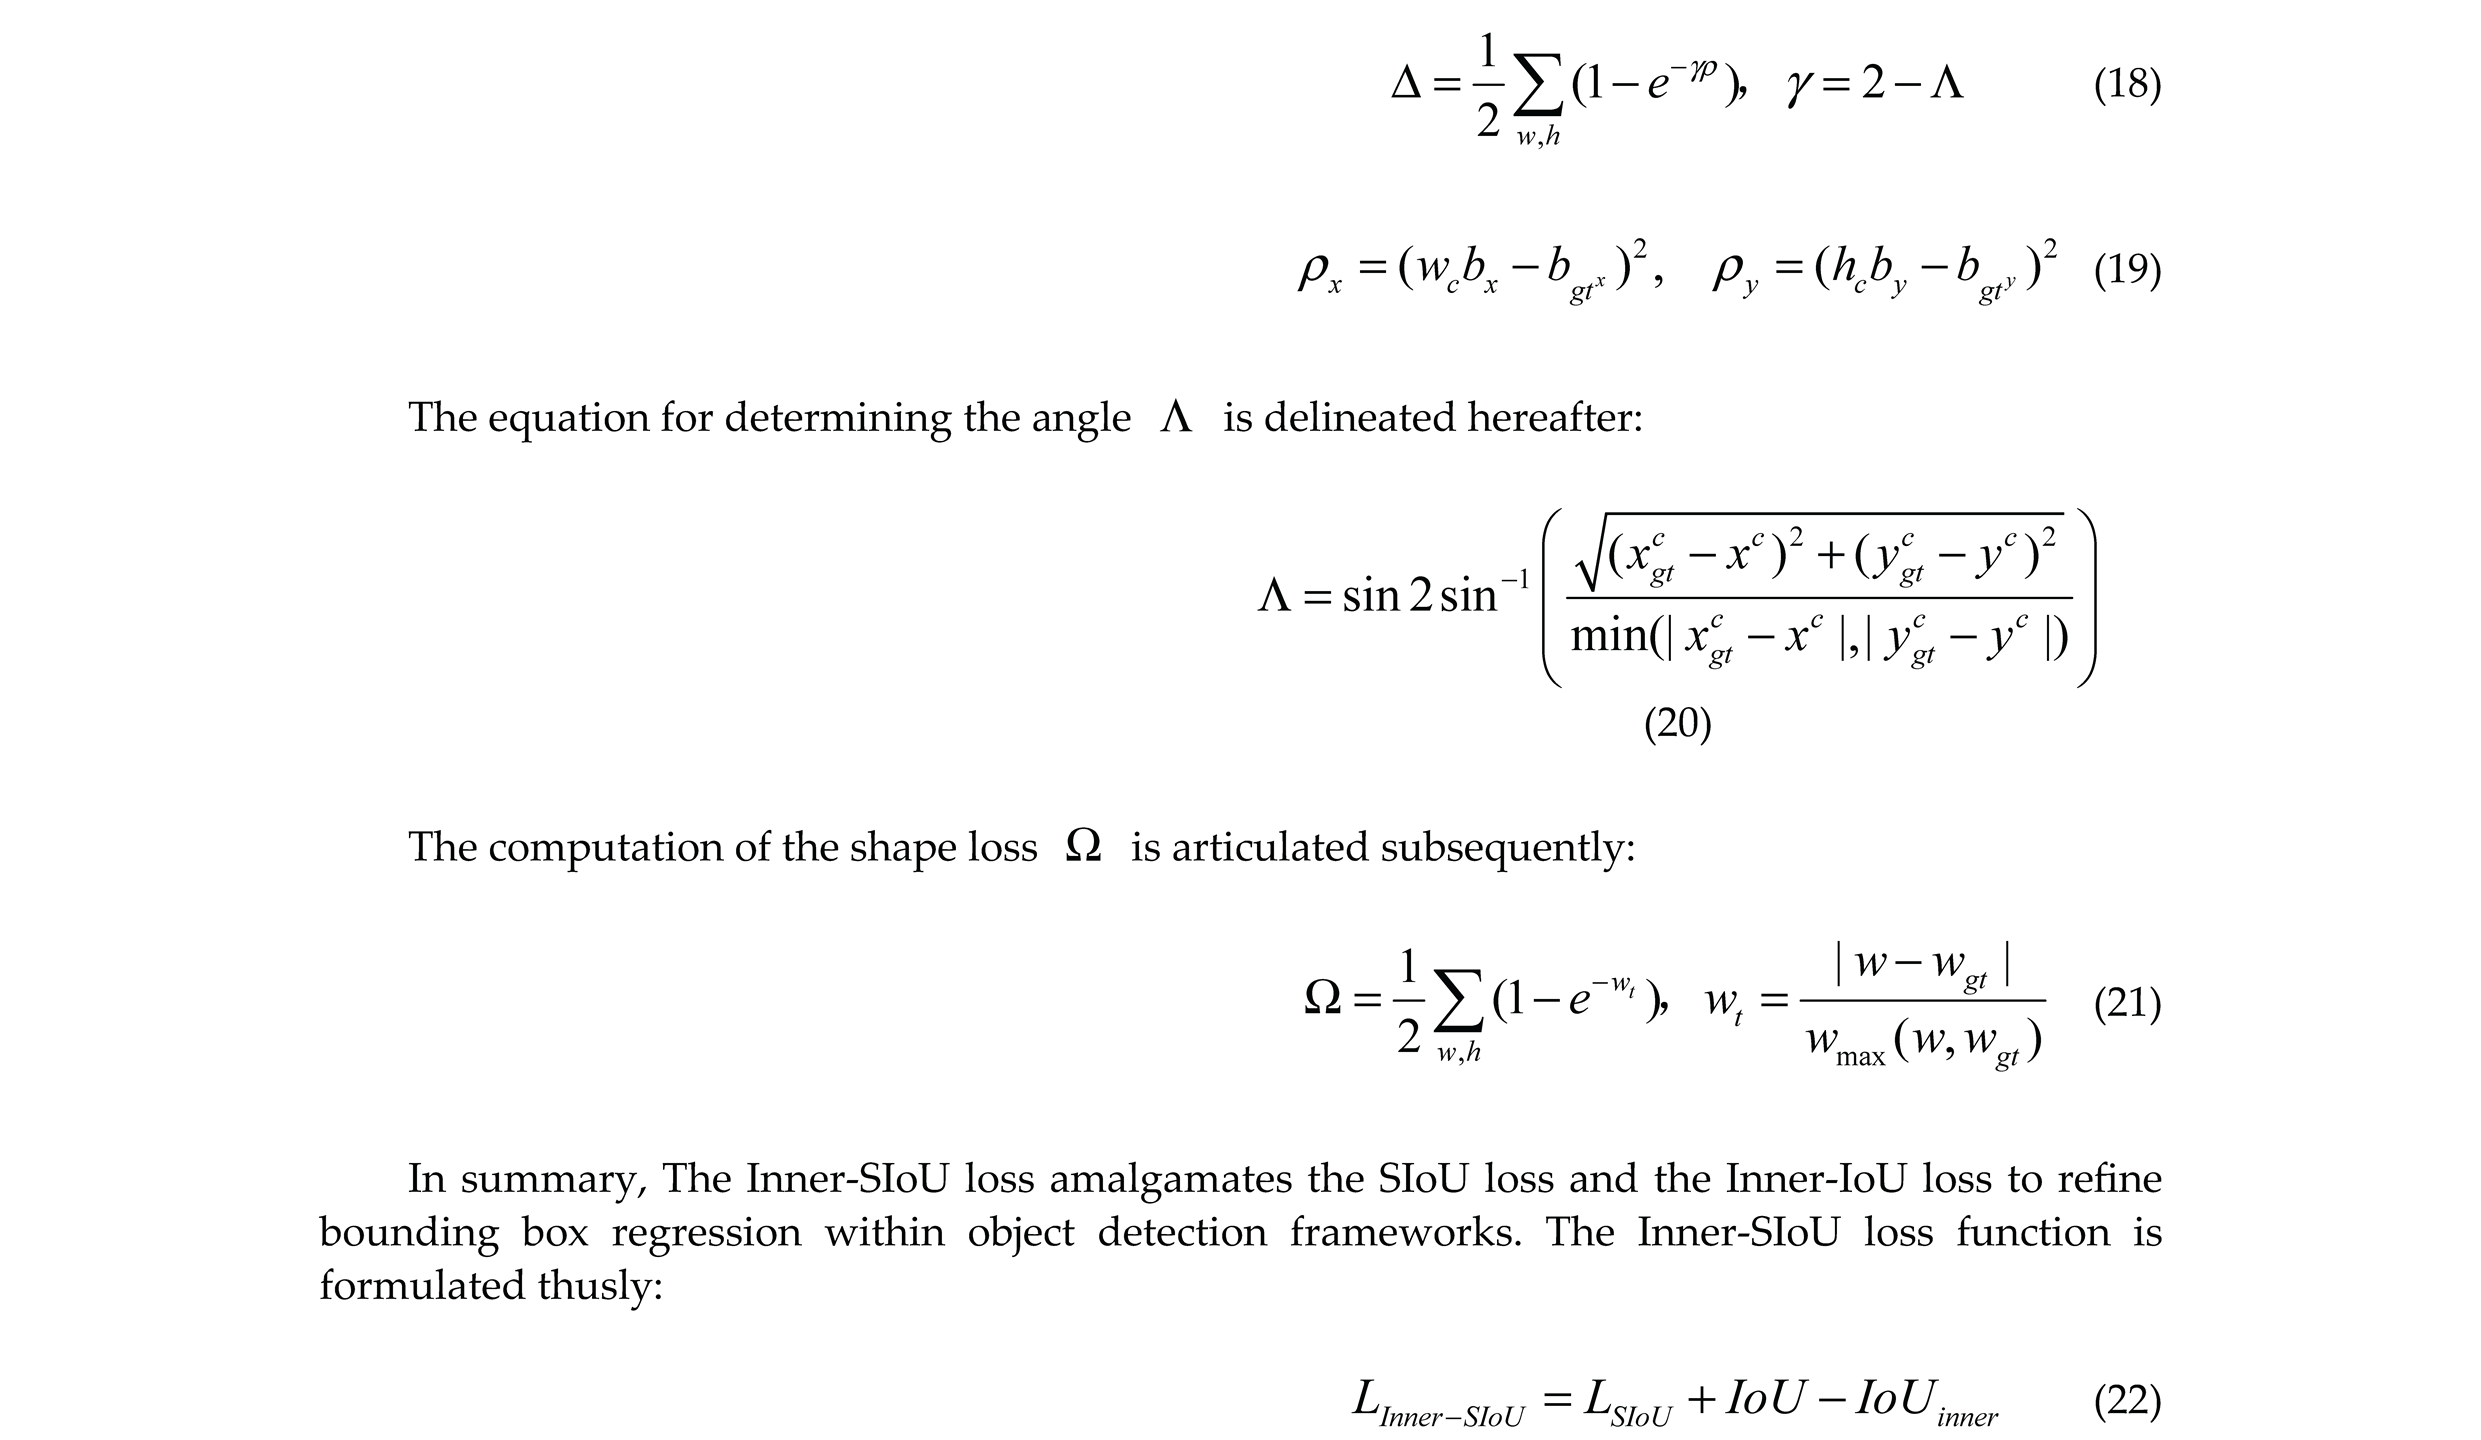
2.5 Inner-SIoU
Steel surface defects are diverse and often minute, leading to blurred object boundaries that negatively impact detection accuracy in surface inspection tasks. The traditional Complete IoU (CIoU) loss function tends to cause false positives and false negatives during bounding box optimization, which affects both detection precision and model convergence speed [37]. To overcome these issues, this research employs the Inner-SIoU loss function to augment the efficacy of spatial localization regression. Expanding on the SIoU foundation, Inner-SIoU incorporates a ratio-scale factor that modulates the dimensions of an auxiliary bounding box, thereby stabilizing the loss computation [38]. In contrast to CIoU, which chiefly takes into account the overlap area, center distance; aspect ratio,Inner-SIoU further improves directional awareness of the target, enabling more accurate defect localization in complex steel surface defect detection tasks and accelerating training convergence.

The ratio for Inner IoU is defined as follows:
2.6 Object Detection Network MBDNet-Attention-YOLO (MBY)
The initial YOLOv8 utilizes a dedicated deep learning framework for object detection tasks. At the outset, input images are standardized to a consistent size to align with the network's input specifications. Subsequently, these images are processed through a convolutional neural network (CNN) to extract salient features, which are then utilized for object prediction across multiple scales. Finally, the model processes the predictions to output detected object information.
In this research, we introduce the MBY detection algorithm, which is built upon the YOLOv8 architecture, as delineated in the accompanying graphic. The proposed model is primarily composed of three essential parts: the backbone, the neck; the head [39].
The backbone is entrusted with extracting critical image features and comprises several modules, including the HGStem module, C2f-DWR module, Dynamic Align Fusion (DAF) feature fusion module, DWConv convolution module, HGBlock module; SPPF module. These elements function collaboratively to capture rich hierarchical feature representations from the input data, which in turn augments the network's capacity for feature depiction.
The neck primarily integrates and refines feature information. It derives motivation from the Feature Pyramid Network (FPN) [40] and Path Aggregation Network (PANet) [39,40], enabling the integration of feature representations at multiple scales. This architecture markedly bolsters the framework's proficiency in identifying diminutive objects and augments the precision of detection across diverse object dimensions.
The detection head is tasked with generating the ultimate detection results. Utilizing a decoupled detection head architecture, the model optimizes classification and regression tasks independently. Moreover, to boost small object detection performance, an additional dedicated small-object detection layer is incorporated in the detection head, enabling MBY to reliably detect minute targets even in complex backgrounds.
3 Experiments
3.1 Data Description
The ongoing research utilizes the NEU-DET dataset provided by Northeastern University to evaluate the efficacy of the proposed network [42]. The dataset encompasses six categories of steel surface defects: cracks (Cr), inclusions (In), patches (Pa), pitted corrosion (Ps), rust spots (Rs); scratches (Sc). Each classification consists of 300 images, with each image exhibiting at least one defect. To additionally scrutinize the framework's capacity for generalization, the PVEL-AD dataset is employed. Detailed statistics, including the number of images per category as well as the training and validation splits, are presented in Table 1 [43]. These datasets support the subsequent experimental investigation and result analysis. Owing to the diverse defect categories, they enable a thorough assessment of the novel method across various target detection scenarios. Figure 8 illustrates the allocation of defect types in both datasets.
3.2 Hyperparameter Settings
To verify the efficacy of the introduced MBY algorithm, all model architectures were realized using the PyTorch 1.8 framework on an NVIDIA GeForce RTX 3090 GPU. The hyperparameter configurations for the models are detailed in Table 2.
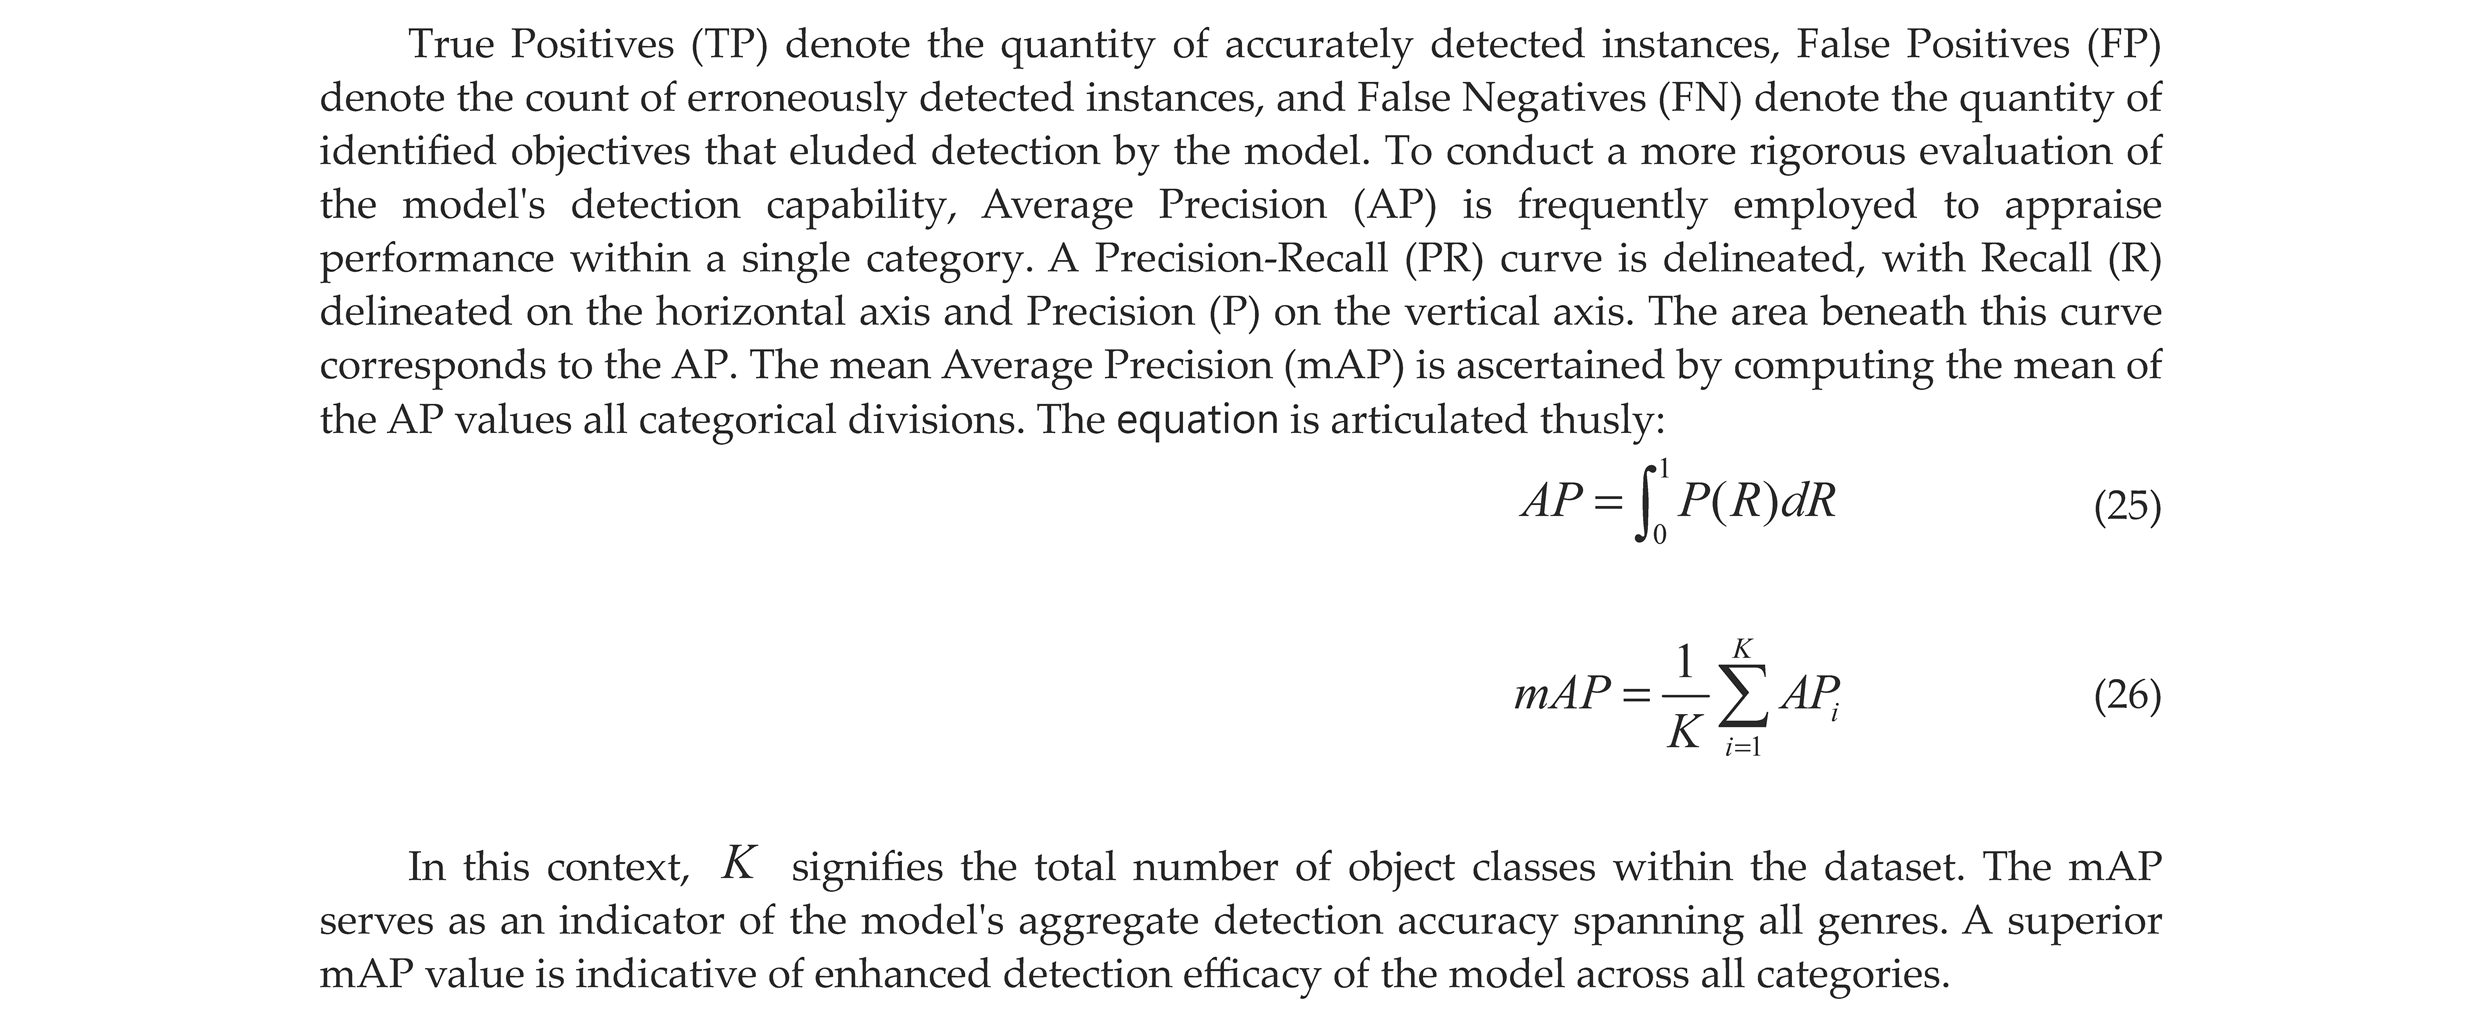
3.3. Evaluation Metrics
In the realm of object detection, Precision (P) and Recall (R) serve as canonical metrics for gauging the performance of detection models. They are defined as follows:

3.4. An Analytical Comparison of Backbone Networks
To substantiate the potency of the posited MBDNet backbone, correlative analytical researches were conducted on the NEU-DET and PVEL-AD datasets, juxtaposing it with several other backbone networks. Table 3 summarizes the performance of YOLOv8, HGNetV2 [44], MobileNetV4 [45], EfficientFormerV2 [46]; the performance of our proposed MBDNet is assessed with respect to mAP@0.5, mAP@0.5–0.95, recall and computational complexity (GFLOPs). The findings indicate that MBDNet attains an optimal trade-off between detection performance and computational cost on both datasets.
On the NEU-DET dataset, HGNetV2 enhances global information capture by incorporating Graph Convolutional Networks (GCN), boosting recall to 75.1%, a 2.3% improvement over the baseline, while maintaining a low computational cost of 6.9 GFLOPs. However, its feature representation remains limited, yielding an mAP@0.5–0.95 of only 52.0, indicating room for improvement in overall detection accuracy. MobileNetV4 leverages depth wise separable convolutions to optimize computational efficiency, with a GFLOPs of 22.5, but achieves an mAP@0.5–0.95 of merely 53.6. These results suggest that both HGNetV2 and MobileNetV4 exhibit constrained feature extraction abilities in complex environments, struggling to balance efficiency and accuracy. EfficientFormerV2 combines TransformerV2 and CNN architectures, effectively balancing efficiency and accuracy; however, its recall slightly drops by 0.3% compared to the baseline, revealing deficiencies in cross-scale feature extraction and local information capture. In contrast, the MBDNet backbone replacement demonstrates outstanding performance, improving mAP@0.5–0.95 by 2.7% over the baseline and increasing recall to 77.3%, while raising GFLOPs to 11.5. This represents a better trade-off between accuracy and computation, achieving higher detection precision without excessive computational burden.
On the PVEL-AD dataset, performance disparities among backbones become more pronounced. HGNetV2 attains a respectable recall of 70.8% but an mAP@0.5–0.95 of only 47.6%. MobileNetV4, despite its lightweight design, suffers a steep decline to 42.7% mAP@0.5–0.95 and reduced recall, indicating poor adaptability to the complex defect classes in this dataset. EfficientFormerV2 achieves a modest improvement with an mAP@0.5–0.95 of 51.0%, but overall performance remains limited. By comparison, MBDNet maintains robust performance, achieving an mAP@0.5 of 75.9%, substantially outperforming YOLOv8’s 64.6%, while maintaining a similar computational cost of 8.1 GFLOPs and delivering higher recall and detection accuracy.
In summary, the proposed MBDNet backbone consistently delivers excellent detection performance with lower computational costs across both datasets, demonstrating its strong potential for defect detection tasks.
3.5. An in-Depth Comparative Investigation of Loss Functions
To address the issues of imprecise bounding box regression and slow convergence associated with the traditional CIoU loss in steel surface defect detection, this study incorporates an improved Inner-SIoU mechanism into the object localization loss function, thereby enhancing detection accuracy and convergence efficiency. Comparative experimental outcomes pertaining to diverse loss functions are delineated in Table 4.
On the NEU-DET dataset, the model using the Inner-SIoU loss achieved an mAP@0.5 of 82.5%, outperforming CIoU [47], WIoU [48], Inner-IoU [49]; EIoU [50] by 2.3%, 2.5%, 1.3%; 1.1%, respectively. For the mAP@0.5–0.95 metric, it improved by 1.0% compared to CIoU, reaching 51.5%. Meanwhile, recall increased to 73.1%, indicating the loss function’s stronger capability in reducing missed detections. Experiments on the PVEL-AD dataset further validated the adaptability and robustness of Inner-SIoU. The method achieved an mAP@0.5 of 71.6%, surpassing CIoU, WIoU, Inner-IoU; EIoU, with an mAP@0.5–0.95 of 45.6% and recall of 66.7%. Although computational costs among these loss functions are comparable, the consistent performance gains of Inner-SIoU make it more suitable for defect detection scenarios demanding high precision.
Figure 9 illustrates the performance trends of different loss functions during training. Inner-SIoU demonstrates faster convergence on both datasets, with more stable loss reduction during training and validation phases. The trajectories of recall and mean Average Precision (mAP) metrics, including mAP@0.5 and mAP@0.5–0.95, manifest a progressive elevation, culminating in markedly enhanced performance levels. In summary, Inner-SIoU excels across multiple key performance metrics, particularly improving detection accuracy and recall, underscoring its practical value in defect detection tasks.
3.5 Ablation Experiments
To substantiate the efficacy of the proposed modules, an extensive set of ablation studies were executed on the NEU-DET and PVEL-AD datasets, aiming to scrutinize the influence of various enhancements on the model's performance. Table 5 and Table 6 summarize the results under various experimental settings, where MB-DAF, DWR, MultiSEAM; Inner-SIoU represent the four key modules. A checkmark ("√") signifies the incorporation of the module, whereas a cross ("×") indicates its omission.
In the initial experiment, the baseline YOLOv8n model attained an mAP@0.5 of 80.2%, an mAP@0.5–0.95 of 50.5%; a recall (R) of 72.8% on the NEU-DET dataset. In the subsequent experiment, the MB-DAF module was incorporated, thereby augmenting the model's capacity to adapt to intricate steel surface defects. This yielded a significant enhancement in mAP@0.5 to 83%, thereby corroborating the effectiveness of the MB-DAF module in augmenting recognition across a spectrum of object scales while effectively attenuating background noise.
The third experiment integrated the DWR module, designed to improve the model’s multi-scale feature representation and small object detection accuracy. This modification increased mAP@0.5 to 81.3%. The fourth experiment incorporated the MultiSEAM module, which strengthens multi-scale feature extraction and improves detection under complex backgrounds, elevating mAP@0.5 to 82.4%, mAP@0.5–0.95 to 51.3%; recall as well.
In the fifth experiment, the Inner-SIoU loss function was employed, incorporating internal bounding box information for more accurate matching between predicted and ground truth boxes. This improved mAP@0.5 to 82.5% and mAP@0.5–0.95 to 51.5%. The sixth experiment combined MultiSEAM and Inner-SIoU, leveraging their complementary advantages: MultiSEAM’s enhanced multi-scale feature extraction and Inner-SIoU’s refined bounding box regression. This synergy raised mAP@0.5 to 84.5%, mAP@0.5–0.95 to 54.0%; recall to 79.3%, confirming the significant contribution of these modules in steel surface defect detection.
In the seventh experiment, MB-DAF, DWR; MultiSEAM were jointly applied to further improve detection robustness in complex environments. The results indicated that the mAP@0.5 and mAP@0.5–0.95 values ascended to 85.8% and 56.2%, severally with the recall attaining a level of 79.7%.This validates that the integration of multiple optimization strategies can simultaneously enhance detection accuracy and model generalization.
Furthermore, experiments on the PVEL-AD dataset exhibited consistent significant improvements. Compared to the baseline YOLOv8n, the optimized MBY structure achieved an 11.3% increase in mAP@0.5, demonstrating the broad applicability and strong generalization potential of the proposed enhancements across diverse datasets.
Overall, the ablation study highlights the advantages of each improvement and further confirms their effectiveness.
4. Comparison of Different Object Detection Models
To assess the efficacy of the proposed MBY model in steel surface defect detection tasks, empirical trials were executed utilizing two publicly available datasets: NEU-DET and PVEL-AD. The selected benchmark models include YOLOv5 [51], YOLOv6 [52], YOLOv8 [34], YOLOv10 , YOLOv11 [53], as well as other advanced detection models such as CAY [54], YOLOv7-BA [55], EFd-YOLOv4 [56], MS-YOLOv5s [57]; PD-DETR [58]. All experiments were performed under consistent settings, with the specific detection metrics shown in Table 7 and Table 8.
In the initial experimental series, the YOLOv5 model attained mAP@0.5 of 84.5% and mAP@0.5–0.95 of 53.6% on the NEU-DET dataset. The second set of experiments introduced YOLOv6, which performed similarly to YOLOv5, with mAP@0.5 of 84.4% and a marginal enhancement in mAP@0.5–0.95. YOLOv8 and YOLOv10 demonstrated certain advantages in detection speed, but their overall accuracy did not meet expectations. YOLOv11, on the other hand, showed weaker performance, with mAP@0.5 of only 77.3%, indicating its subpar performance when dealing with complex textures.
In the sixth set of experiments, the proposed MBY model achieved superior performance compared to all other models with respect to detection correctness. On the NEU-DET dataset, the mAP@0.5 value ascended to 85.8%, while the mAP@0.5–0.95 metric climbed to 56.2% and recall reached 79.7%, with significant improvements across all metrics. This indicates that MBY excels in feature extraction, target localization; small defect recognition. On the PVEL-AD dataset, the MBY model also demonstrated excellent performance, with mAP@0.5 reaching 75.9%, outperforming models such as YOLOv8 and YOLOv10. Despite the improved detection accuracy, MBY’s computational cost remains at 8.1G, comparable to YOLOv8; significantly lower than YOLOv6's 11.8G, reflecting the model's balanced performance between accuracy and efficiency.
Figure 12 and Figure 13 show the detection visualization results of MBY, YOLOv8; YOLOv11 on two datasets. As seen in the figures, MBY demonstrates more stable performance in detecting small objects such as cracks, scratches; pits, with more accurate bounding box localization and a significant reduction in false positives and false negatives. Compared to YOLOv11, MBY maintains high recognition accuracy under complex background conditions, with the bounding boxes aligning more closely with the target contours.
It bears emphasis that the proposed model enhances detection performance and, concurrently, mitigates computational overhead to a notable extent. Overall, the empirical investigations within this segment validate the potency of the propounded enhancements and clearly highlight their advantages across different dimensions.
5. Conclusion
Within this investigation, an object detection model for steel surface defect detection, termed MBY (MBDNet-attention-YOLO), is proposed. First, a structurally well-designed backbone network, MBDNet, is introduced, significantly augmenting the model's capacity for multi-resolution defect feature encoding and representation. At the same time, the integration of the designed MultiSEAM module effectively improves feature adaptability across different scales and complex background conditions, particularly showing higher accuracy in handling small defects.
Next, to tackle the problem of inadequate bounding box regression precision, we introduce the Inner-SIoU loss function, optimizing the correspondence between predicted boxes and reference boxes, accelerating the convergence speed during training; improving detection stability. Finally, we conducted comprehensive evaluations on the NEU-DET and PVEL-AD public datasets, with experimental results showing that the MBY algorithm achieved a detection accuracy of 85.8% on the NEU-DET dataset and 70.8% on the PVEL-AD dataset. Compared to mainstream single-stage detection algorithms such as YOLOv5, YOLOv6; YOLOv8, MBY outperforms in multiple key metrics, demonstrating its strong adaptability and generalization capability in complex texture interference and small-object recognition.
To further propel this research, future endeavors will focus on the following three aspects: (1) refining the backbone network architecture to magnify the model's capacity for representing multi-scale defect features; (2) combining different feature fusion strategies and attention mechanisms to further strengthen the model's robustness in complex backgrounds; and (3) exploring the application of the MBY algorithm to other types of surface defect detection tasks.
Author Contributions
X.W., S.M., W.S., Z.L., J.C., P.X.: Conceptualization, Methodology, Software, Formal analysis, Writing—original draft preparation; Visualization; P.X.: Supervision. P.X.: Funding. All authors have read and agreed to the published version of the manuscript.
Funding
This research was funded by the Natural Science Foundation of Shanghai (grant number: 20ZR1422700) and the Class III Peak Discipline of Shanghai—Materials Science and Engineering (High–Energy Beam Intelligent Processing and Green Manufacturing).
Institutional Review Board Statement
Not applicable.
Informed Consent Statement
Not applicable.
Data Availability Statement
Not applicable.
Conflicts of Interest
The authors declare that there is no conflict of interest concerning the publication of this article.
References
- A Lightweight Multi-Scale Feature Fusion Steel Surface Defect Detection Model Based on YOLOv8 – IOP science. Available online: https://iopscience.iop.org/article/10.1088/1361-6501/ad296d/meta (accessed on 28 April 2025).
- Tang, M.; Li, Y.; Yao, W.; Hou, L.; Sun, Q.; Chen, J. A Strip Steel Surface Defect Detection Method Based on Attention Mechanism and Multi-Scale Maxpooling. Meas. Sci. Technol. 2021, 32, 115401. [Google Scholar] [CrossRef]
- Zuo, Y.; Wang, J.; Song, J. Application of YOLO Object Detection Network in Weld Surface Defect Detection. in 2021 IEEE 11th Annual International Conference on CYBER Technology in Automation, Control; Intelligent Systems (CYBER), Jul. 2021, pp. 704–710. [CrossRef]
- Wang, J.; Li, L.; Xu, P. Visual Sensing and Depth Perception for Welding Robots and Their Industrial Applications. Sensors 2023, 23, 24. [Google Scholar] [CrossRef] [PubMed]
- Deep Learning Based Online Metallic Surface Defect Detection Method for Wire and Arc Additive Manufacturing - ScienceDirect. Available online: https://www.sciencedirect.com/science/article/pii/S0736584522001521 (accessed on 28 April 2025).
- Girshick, R. Fast R-CNN. In Proceedings of the IEEE International Conference on Computer Vision; 2015; p. 1440. Available online: https://openaccess.thecvf.com/content_iccv_2015/html/Girshick_Fast_R-CNN_ICCV_2015_paper.html (accessed on 5 May 2025).
- A Comprehensive Review of YOLO Architectures in Computer Vision: From YOLOv1 to YOLOv8 and YOLO-NAS. Available online: https://www.mdpi.com/2504-4990/5/4/83 (accessed on 5 May 2025).
- A Review of Yolo Algorithm Developments - ScienceDirect. Available online: https://www.sciencedirect.com/science/article/pii/S1877050922001363 (accessed on 5 May 2025).
- Ge, Z.; Liu, S.; Wang, F.; Li, Z.; Sun, J. YOLOX: Exceeding YOLO Series in 2021. arXiv 2021, arXiv:2107. [CrossRef]
- Design Tradeoffs for SSD Performance. Available online: https://www.usenix.org/legacy/event/usenix08/tech/full_papers/agrawal/agrawal_html/ (accessed on 5 May 2025).
- Zhao, C.; Shu, X.; Yan, X.; Zuo, X.; Zhu, F. RDD-YOLO: A Modified YOLO for Detection of Steel Surface Defects. Measurement 2023, 214, 112776. [Google Scholar] [CrossRef]
- Sunkara, R.; Luo, T. YOGA: Deep Object Detection in the Wild with Lightweight Feature Learning and Multiscale Attention. Pattern Recognition 2023, 139, 109451. [Google Scholar] [CrossRef]
- Shi, X.; et al. An Improved Faster R-CNN for Steel Surface Defect Detection. in 2022 IEEE 24th International Workshop on Multimedia Signal Processing (MMSP), Shanghai, China: IEEE, Sep. 2022, pp. 1–5.
- Meng, J.; Wen, S. Detection of Steel Surface Defects Based on Improved YOLOv8n Algorithm. in 2024 2nd International Conference on Algorithm, Image Processing and Machine Vision (AIPMV), Zhenjiang, China: IEEE, Jul. 2024, pp. 8–12. [CrossRef]
- Liu, T. Enhanced Zero-Shot YOLOv10 for Multi-Class Tiny-Object Detection of Steel Surface Defects. in 2024 6th International Conference on Robotics and Computer Vision (ICRCV), Wuxi, China: IEEE, Sep. 2024, pp. 44–52. [CrossRef]
- Guo, Z.; Wang, C.; Yang, G.; Huang, Z.; Li, G. MSFT-YOLO: Improved YOLOv5 Based on Transformer for Detecting Defects of Steel Surface. Sensors 2022, 22, 9. [Google Scholar] [CrossRef] [PubMed]
- Tang, L.; Cai, L.C.; Cheng, K.; Wang, X.; Luo, C.; Zhao, Y. Improved Yolov5n Strip Surface Defect Detection Algorithm. in 2023 CAA Symposium on Fault Detection, Supervision and Safety for Technical Processes (SAFEPROCESS), Yibin, China: IEEE, Sep. 2023, pp. 1–5. [CrossRef]
- Jiang, X.; Cui, Y.; Cui, Y.; Xu, R.; Yang, J.; Zhou, J. Optimization Algorithm of Steel Surface Defect Detection Based on YOLOv8n-SDEC. IEEE Access 2024, 12, 95106–9 5117, 12, 95106–95117. [Google Scholar] [CrossRef]
- Zhong, H.; Wu, B.; Zhang, X.; Hu, Y.; Zhou, T.; Y. Zhang. Steel Surface Defect Detection Based on an Improved YOLOv5 Model. in 2023 5th International Conference on Intelligent Control, Measurement and Signal Processing (ICMSP), Chengdu, China: IEEE, May 2023, pp. 51–55. [CrossRef]
- Zhao, Y.; et al. Attention-Based Multiscale Feature Fusion for Efficient Surface Defect Detection. IEEE Transactions on Instrumentation and Measurement, vol. 73, pp. 1–10, 2024. [CrossRef]
- Wang, J.; Wang, J. A Lightweight YOLOv8 Based on Attention Mechanism for Mango Pest and Disease Detection. J Real-Time Image Proc, vol. 21, p. 136, Jul. 2024.
- Huang; Wang; Zhang; Yan; He; X. (2019). *Dynamic Context Correspondence Network for Semantic Alignment*. In *Proceedings of the IEEE/CVF International Conference on Computer Vision (ICCV)*, 2019, pp. 2010–2019.
- Wang; Liang; Wang; Zhang; Chen; Mou; X. (2024). An Efficient and Accurate Surface Defect Detection Method for Wood Based on Improved YOLOv8. Forests, 15(7), 1176.
- He, Y.; Song, K.; Meng, Q.; Y. Yan. An End-to-End Steel Surface Defect Detection Approach via Fusing Multiple Hierarchical Features. IEEE Transactions on Instrumentation and Measurement, vol. 69, pp. 1493–1504, Apr. 2020. 2020. [CrossRef]
- Su, B.; Zhou, Z.; H. Chen. PVEL-AD: A Large-Scale Open-World Dataset for Photovoltaic Cell Anomaly Detection. IEEE Transactions on Industrial Informatics, vol. 19, pp. 404–413, Jan. 2023. [CrossRef]
- Han, Q.; et al. On the Connection between Local Attention and Dynamic Depth-wise Convolution. 2022; arXiv:2106.04263. [Google Scholar]
- Zhang, P.; Lo, E.; B. Lu. High Performance Depthwise and Pointwise Convolutions on Mobile Devices. Proceedings of the AAAI Conference on Artificial Intelligence, vol. 34, Apr. 2020. 2020. [CrossRef]
- Li, H.; Zhao, J.; Li, J.; Yu, Z.; G. Lu. Feature Dynamic Alignment and Refinement for Infrared–Visible Image Fusion: Translation Robust Fusion. Information Fusion, vol. 95, pp. 26–41, Jul. 2023. 2023. [CrossRef]
- Zhong, Q.; Lyu, G.; Z. Yang. Align While Fusion: A Generalized Nonaligned Multiview Multilabel Classification Method. IEEE Transactions on Neural Networks and Learning Systems, vol. 36, pp. 7627–7636, Apr. 2025. [CrossRef]
- Tan, M.; Pang, R.; Q. V. Le. EfficientDet: Scalable and Efficient Object Detection. in Proceedings of the IEEE/CVF Conference on Computer Vision and Pattern Recognition (CVPR), 2020, pp. 10781–10790. [Online].
- Long, X. et al.. PP-YOLO: An Effective and Efficient Implementation of Object Detector. arXiv preprint arXiv:2007.12099, Aug. 2020. [Online].
- Sohan, M.; Ram, T.S.; Reddy, R.; C. Venkata. A Review on YOLOv8 and Its Advancements. in Data Intelligence and Cognitive Informatics, Springer, 2024, pp. 529–545.
- T. Z.; P. P.; J. Z.; X. Z.. Steel Surface Defect Detection Algorithm Based on Improved YOLOv8n. MDPI, 2024.
- Yu, Z.; Huang, H.; Chen, W.; Su, Y.; Liu, Y.; X. Wang. YOLO-FaceV2: A Scale and Occlusion Aware Face Detector. Pattern Recognition, vol. 155, p. 110714, Nov. 2024. 2024. [CrossRef]
- Du, S.; Zhang, B.; Zhang, P.; P. Xiang. An Improved Bounding Box Regression Loss Function Based on CIOU Loss for Multi-scale Object Detection. in 2021 IEEE 2nd International Conference on Pattern Recognition and Machine Learning (PRML), Jul. 2021, pp. 92–98. [CrossRef]
- Zhang, H.; Xu, C. ; S. Zhang. Inner-IoU: More Effective Intersection over Union Loss with Auxiliary Bounding Box. arXiv:2311.02877, Nov. 2023.
- Wang, J.; Xu, P.; Li, L. ; F. Zhang. DAssd-Net: A Lightweight Steel Surface Defect Detection Model Based on Multi-Branch Dilated Convolution Aggregation and Multi-Domain Perception Detection Head. Sensors, vol. 23, p. 12, Jan. 2023. [Google Scholar] [CrossRef]
- Gong, Y.; Yu, X.; Ding, Y.; Peng, X.; Zhao, J.; Z. Han. Effective Fusion Factor in FPN for Tiny Object Detection. in Proceedings of the IEEE/CVF Winter Conference on Applications of Computer Vision (WACV), 2021, pp. 1160–1168.
- Wang, K.; Liew, J.H.; Zou, Y.; Zhou, D.; J. Feng. PANet: Few-Shot Image Semantic Segmentation With Prototype Alignment. in Proceedings of the IEEE/CVF International Conference on Computer Vision (ICCV), 2019, pp. 9197–9206.
- Zheming, Y.; Terekhov, V.I. ; J. He. Research of Different Neural Network Architectures for Real-Time Metal Surface Defect Detection. in 2025 7th International Youth Conference on Radio Electronics, Electrical and Power Engineering (REEPE), Apr. 2025, pp. 1–5. [CrossRef]
- Su, B.; Zhou, Z. ; H. Chen. PVEL-AD: A Large-Scale Open-World Dataset for Photovoltaic Cell Anomaly Detection,"IEEE Transactions on Industrial Informatics, vol. 19, pp. 404–413, Jan. 2023.
- Zheming, Y.; Terekhov, V.I. ; J. He. Research of Different Neural Network Architectures for Real-Time Metal Surface Defect Detection. in 2025 7th International Youth Conference on Radio Electronics, Electrical and Power Engineering (REEPE), Apr. 2025, pp. 1–5. [CrossRef]
- Su, B.; Zhou, Z. ; H. Chen. PVEL-AD: A Large-Scale Open-World Dataset for Photovoltaic Cell Anomaly Detection. IEEE Transactions on Industrial Informatics, vol. 19, pp. 404–413, Jan. 2023. [Google Scholar] [CrossRef]
- Huang, H.; Peng, X.; Wu, S.; Ou, W.; Hu, X.; L. Chen. An Automotive Body-in-White Welding Stud Flexible and Efficient Recognition System. IEEE Access, vol. 13, pp. 51938–51955, 2025. [CrossRef]
- Qin, D. et al.. MobileNetV4 -- Universal Models for the Mobile Ecosystem. arXiv.org. (Accessed: May 7, 2025).
- Li, Y.; et al. . Rethinking Vision Transformers for MobileNet Size and Speed. arXiv:2212.08059, Sep. 4, 2023. [CrossRef]
- Zheng, Z.; et al. . Enhancing Geometric Factors in Model Learning and Inference for Object Detection and Instance Segmentation. arXiv:2005.03572, Jul. 5, 2021. [CrossRef]
- Y.-J. Cho. Weighted Intersection over Union (wIoU) for Evaluating Image Segmentation. Pattern Recognition Letters, vol. 185, pp. 101–107, Sep. 2024. [CrossRef]
- Zhang, H.; Xu, C. ; S. Zhang. Inner-IoU: More Effective Intersection over Union Loss with Auxiliary Bounding Box. arXiv:2311.02877, Nov. 14, 2023. [CrossRef]
- Zhang, Y.-F.; Ren, W.; Zhang, Z.; Jia, Z.; Wang, L. ; T. Tan. Focal and Efficient IOU Loss for Accurate Bounding Box Regression. arXiv:2101.08158, Jul. 16, 2022. [CrossRef]
- R. Khanam and M. Hussain. What is YOLOv5: A deep look into the internal features of the popular object detector. arXiv:2407.20892, Jul. 30, 2024. [CrossRef]
- Li, C.; et al. . YOLOv6: A Single-Stage Object Detection Framework for Industrial Applications. arXiv:2209.02976, Sep. 7, 2022. [CrossRef]
- R. Khanam and M. Hussain. YOLOv11: An Overview of the Key Architectural Enhancements. arXiv:2410.17725, Oct. 23, 2024. [CrossRef]
- Da, M.; Jiang, L.; Tao, Y., Z. Zhang. Infrared target detection algorithm based on multipath coordinate attention mechanism. Meas. Sci. Technol., vol. 36, p. 015208, Oct. 2024. [Google Scholar] [CrossRef]
- Ma, X.; Deng, X.; Kuang, H., X. Liu. YOLOv7-BA: A Metal Surface Defect Detection Model Based On Dynamic Sparse Sampling And Adaptive Spatial Feature Fusion. in 2024 IEEE 6th Advanced Information Management, Communicates, Electronic and Automation Control Conference (IMCEC), 24, pp. 292–296. 20 May. [CrossRef]
- Li, S.; Kong, F.; Wang, R.; Luo, T., Z. Shi. EFD-YOLOv4: A steel surface defect detection network with encoder-decoder residual block and feature alignment module. Measurement, vol. 220, p. 113359, Oct. 2023. [Google Scholar] [CrossRef]
- Wang, C.; Zhou, M.; Liang, Y.; Pan, W., Z. Gao. MS-YOLOv5s: An Improved YOLOv5s for the Detection of Imperceptible Defects on Steel Surfaces. Advanced Intelligent Computing Technology and Applications, D.-S. Huang, C. Zhang; J. Guo, Eds. Singapore: Springer Nature, 2024; pp. 404–415. [Google Scholar] [CrossRef]
- Zhao, L.; Wu, Y., Y. Yuan. PD-DETR: towards efficient parallel hybrid matching with transformer for photovoltaic cell defects detection. Complex Intell. Syst., vol. 10, pp. 7421–7434, Dec. 2024. [Google Scholar] [CrossRef]
Figure 1.
Figure 1. (a) MBDNet (b) SPPF (c) HGblock (d) HGSteam.
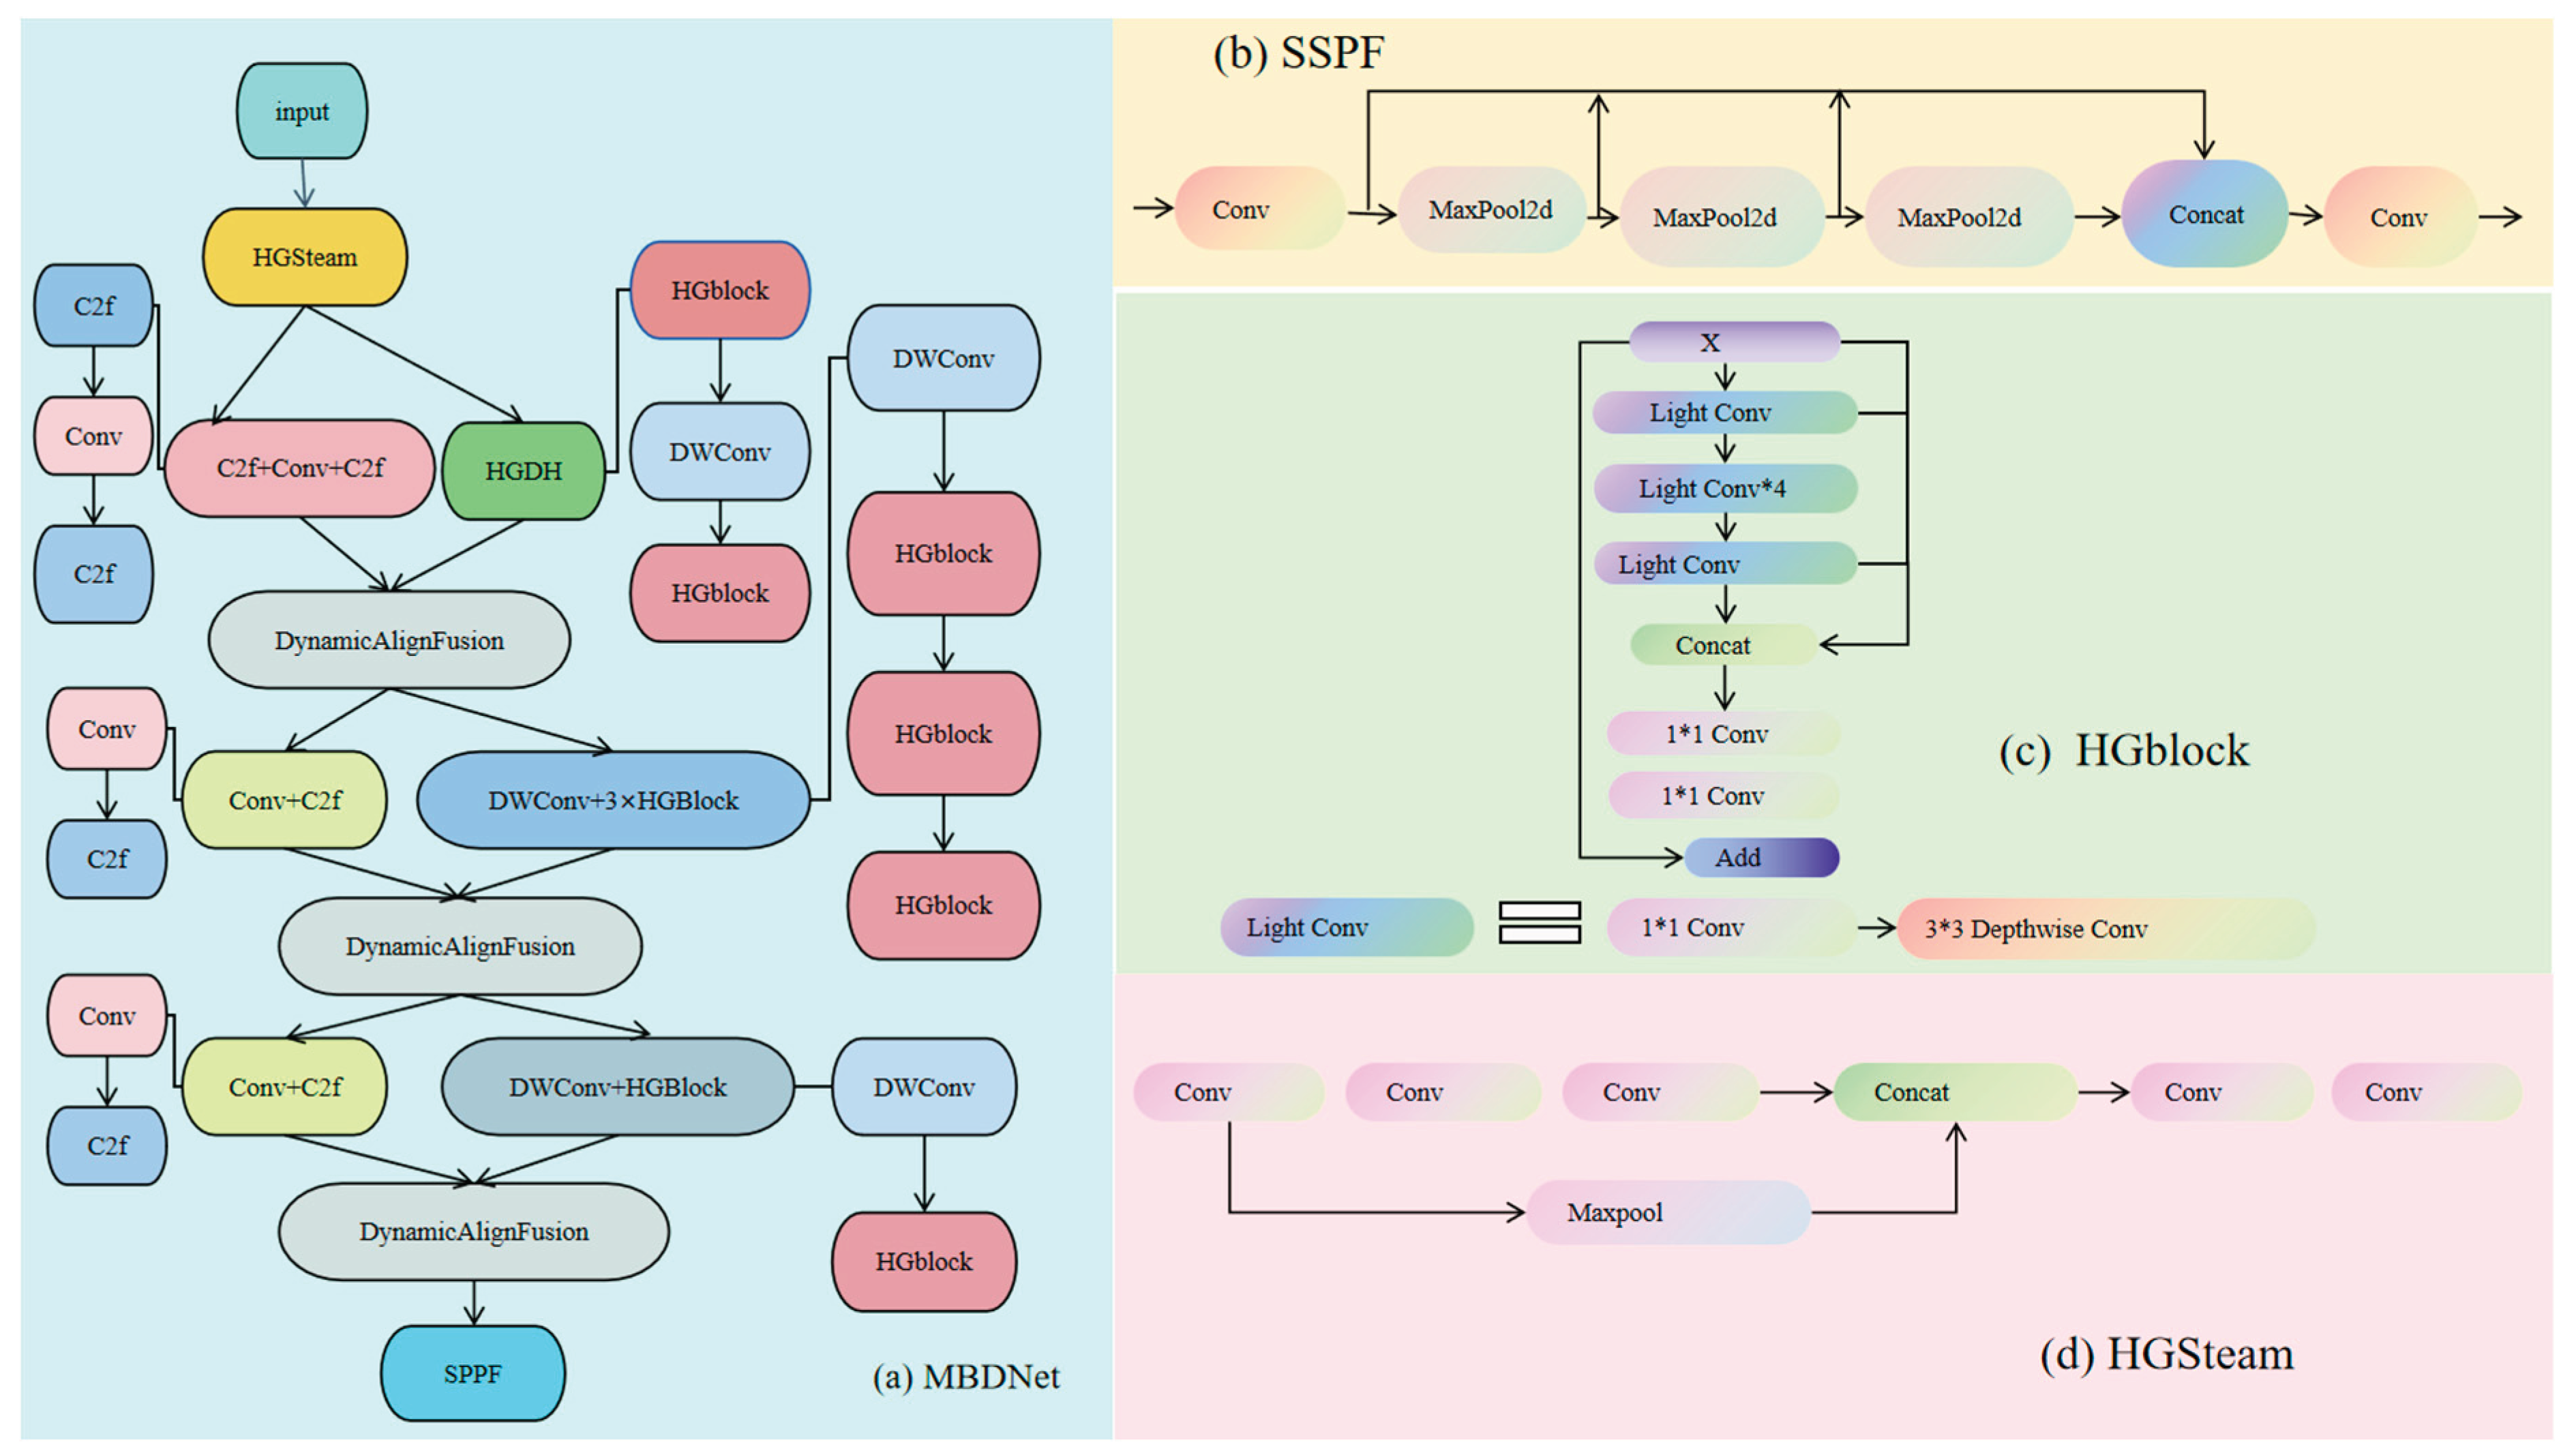
Figure 2.
(a) conv (b) DWConv.


Figure 3.
Network architecture of the Dynamic Align Fusion (DAF) mechanism.
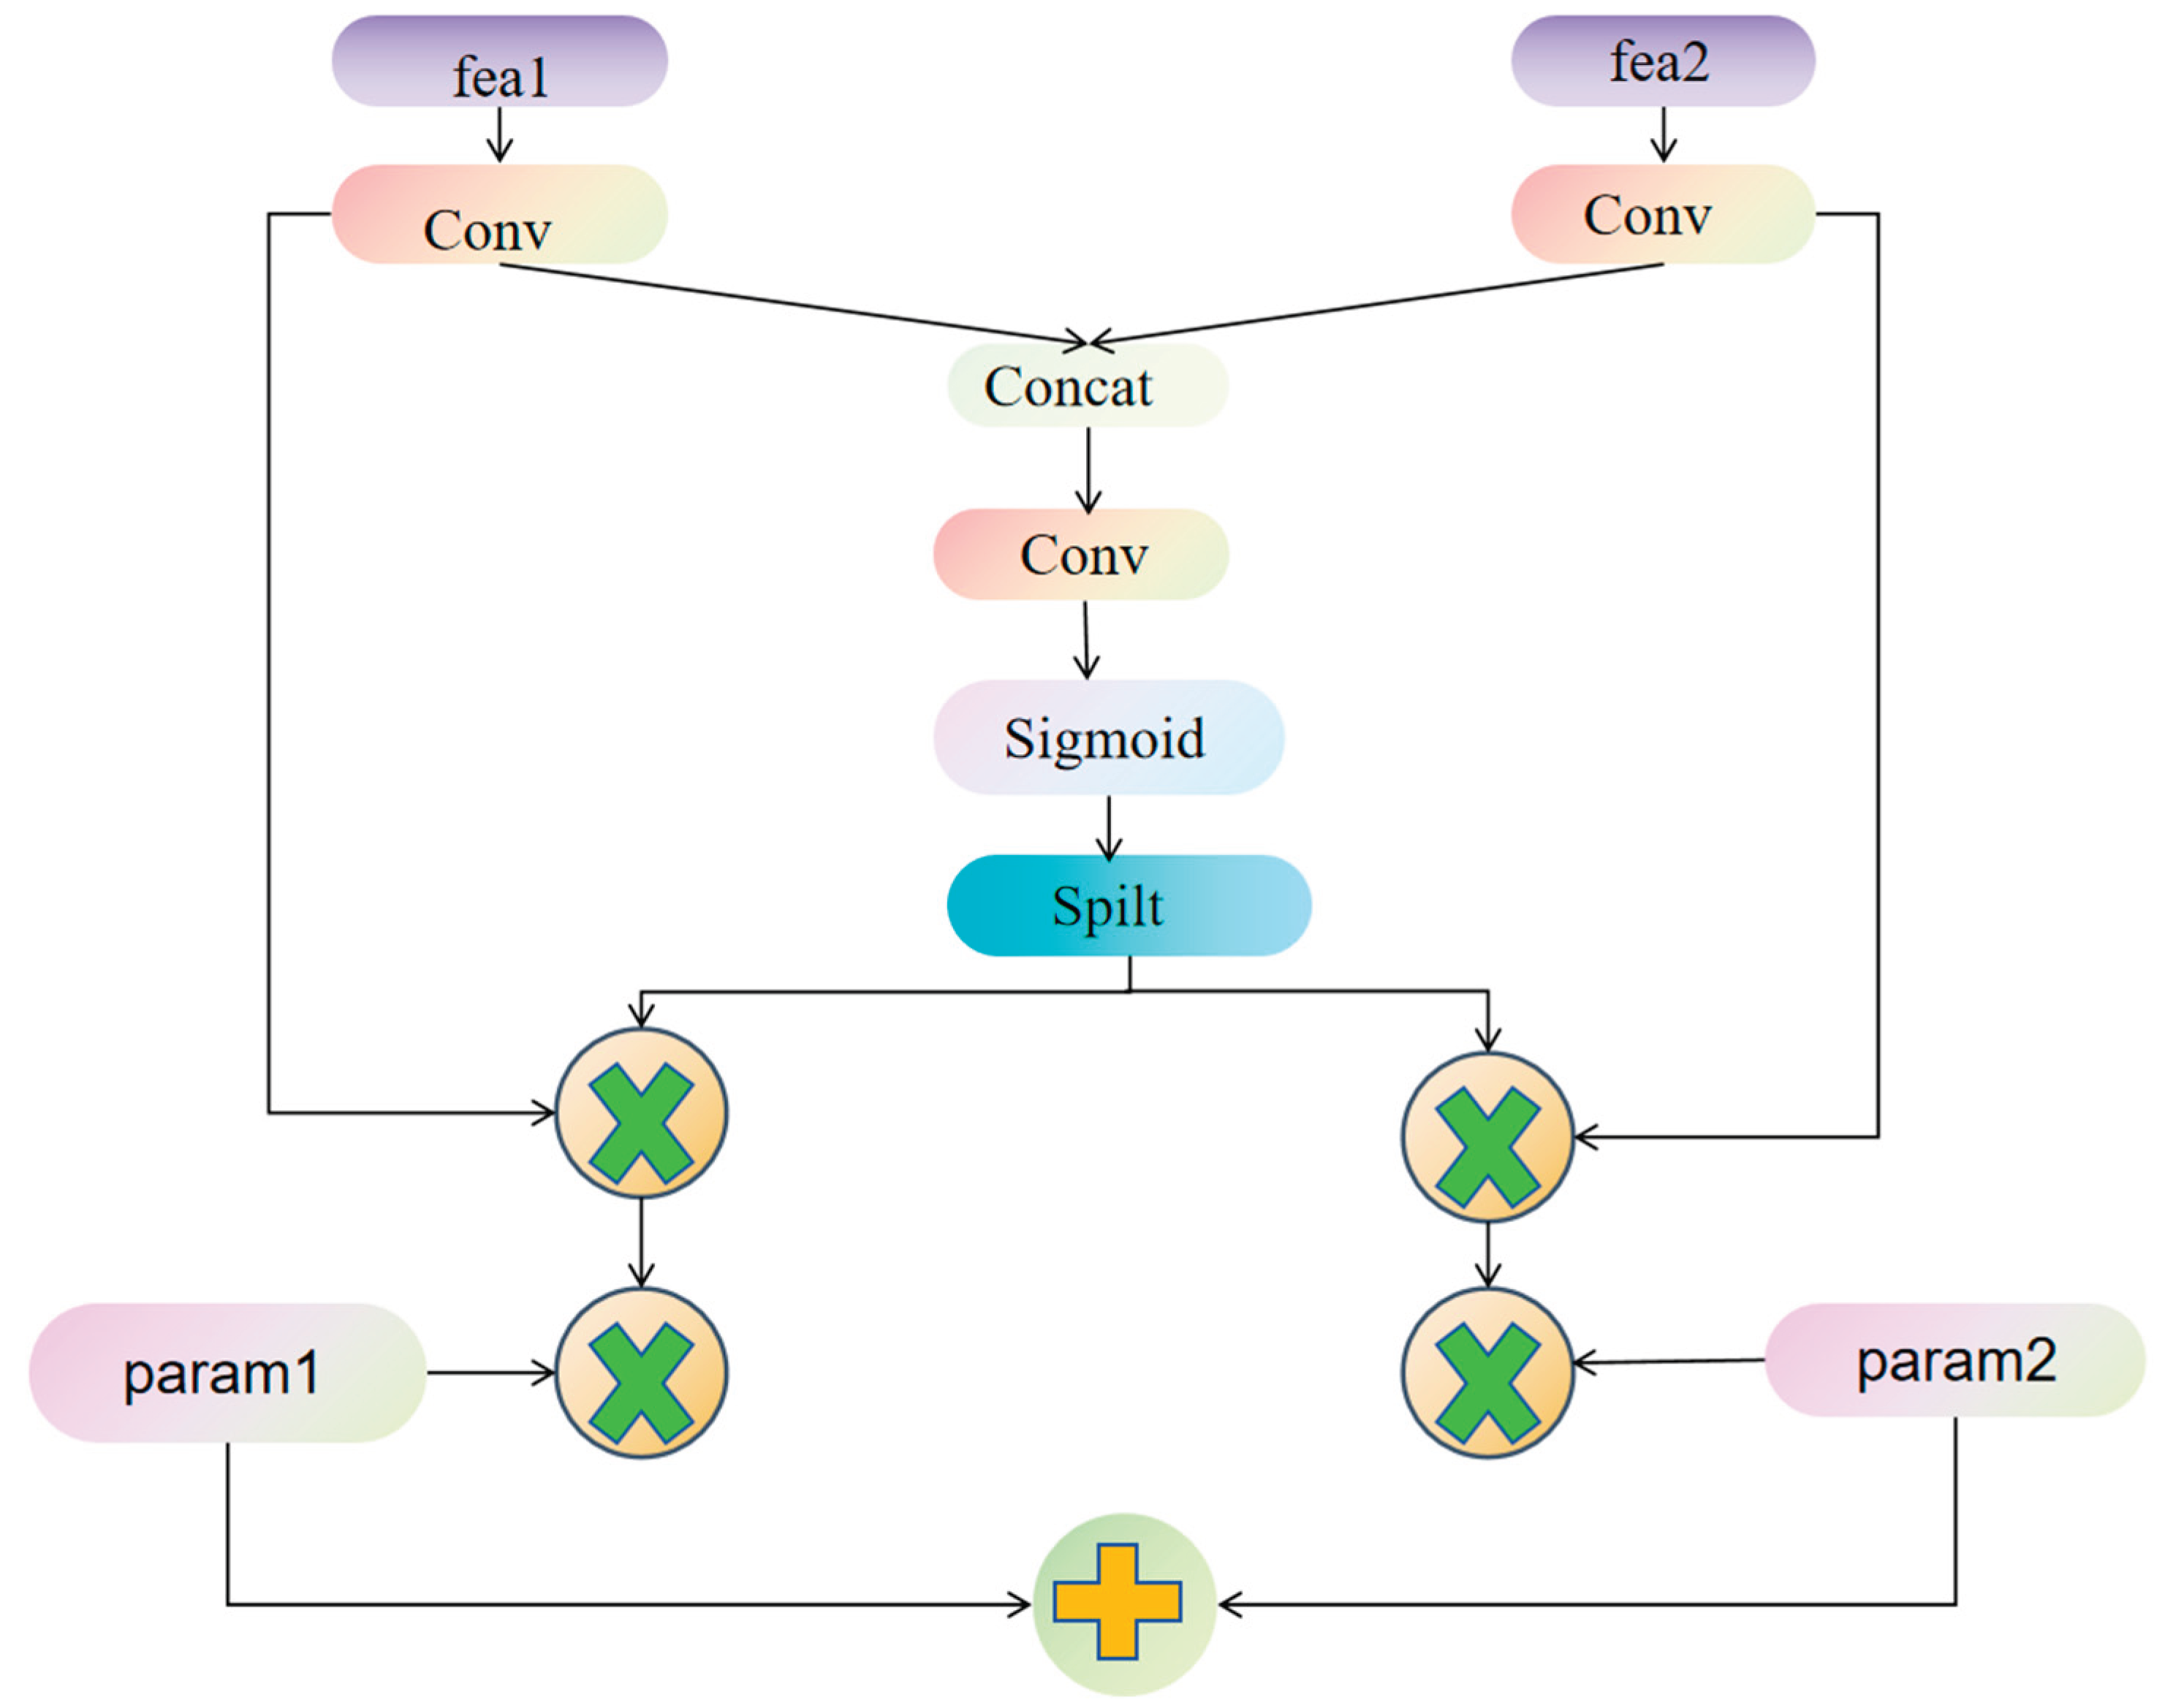
Figure 4.
DWR Module and C2f-DWR Architecture Diagram
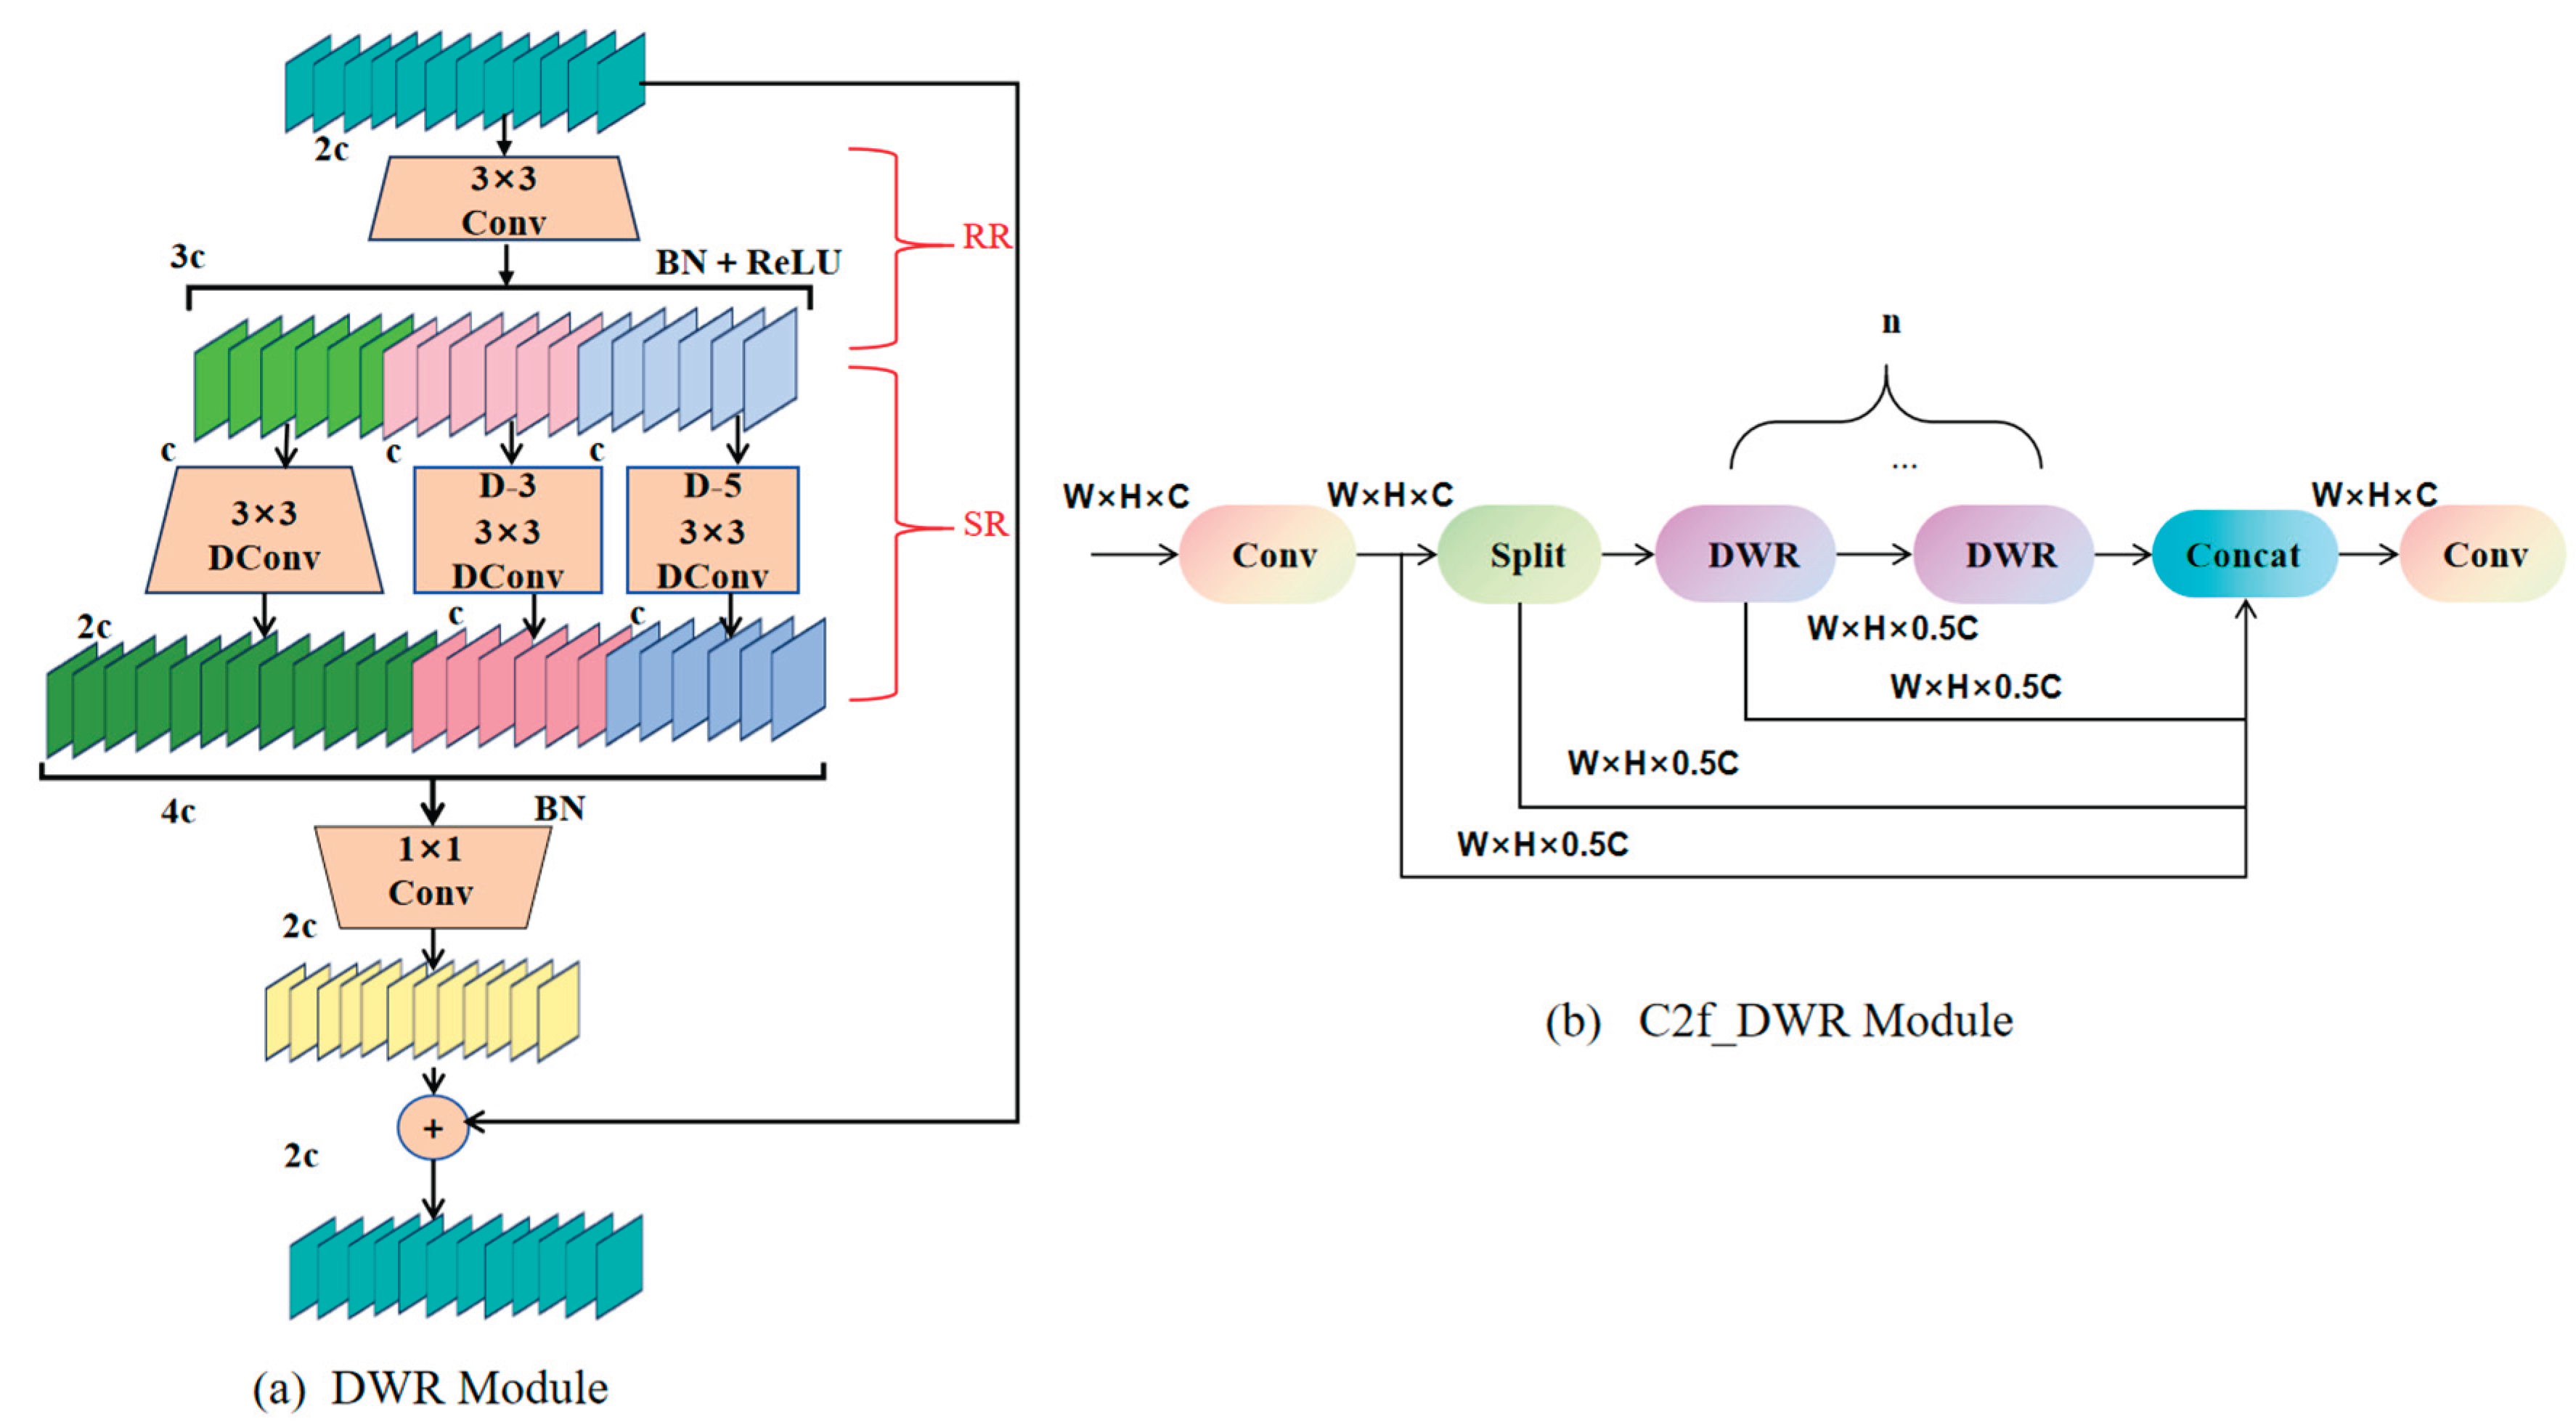
Figure 5.
Architecture diagram of the MultiSEAM module
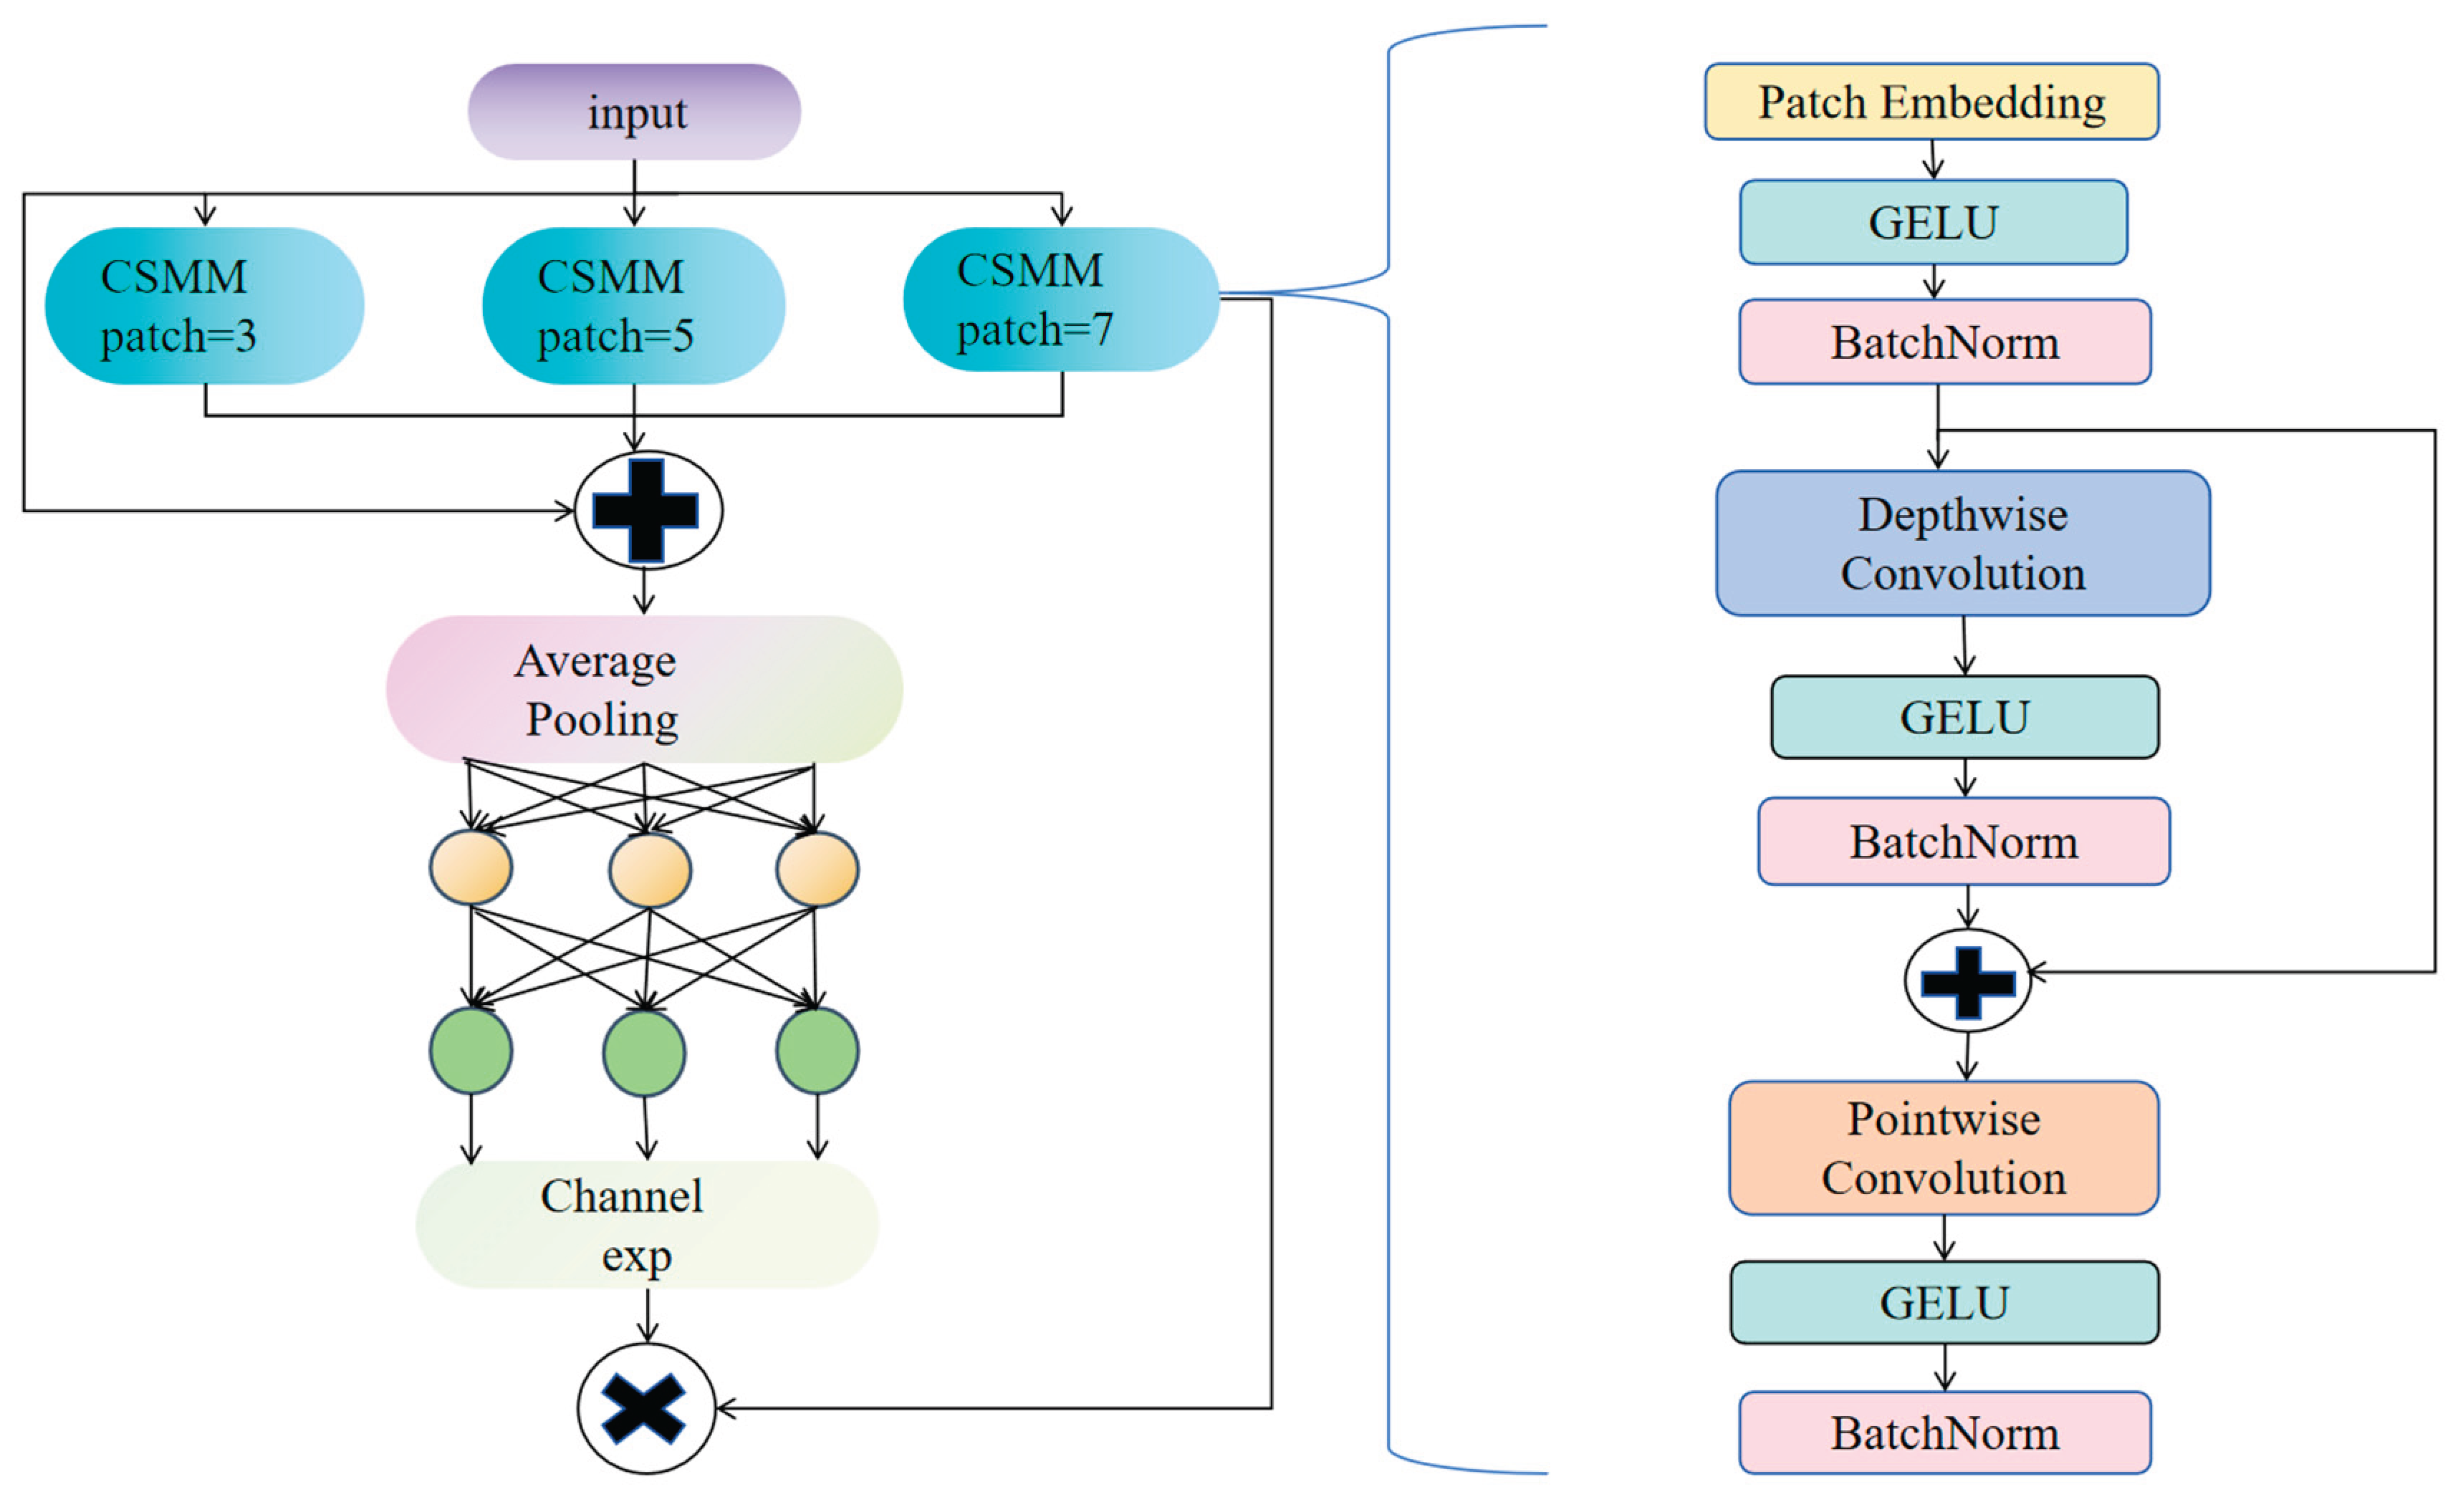
Figure 6.
Network architecture diagram of SIoU
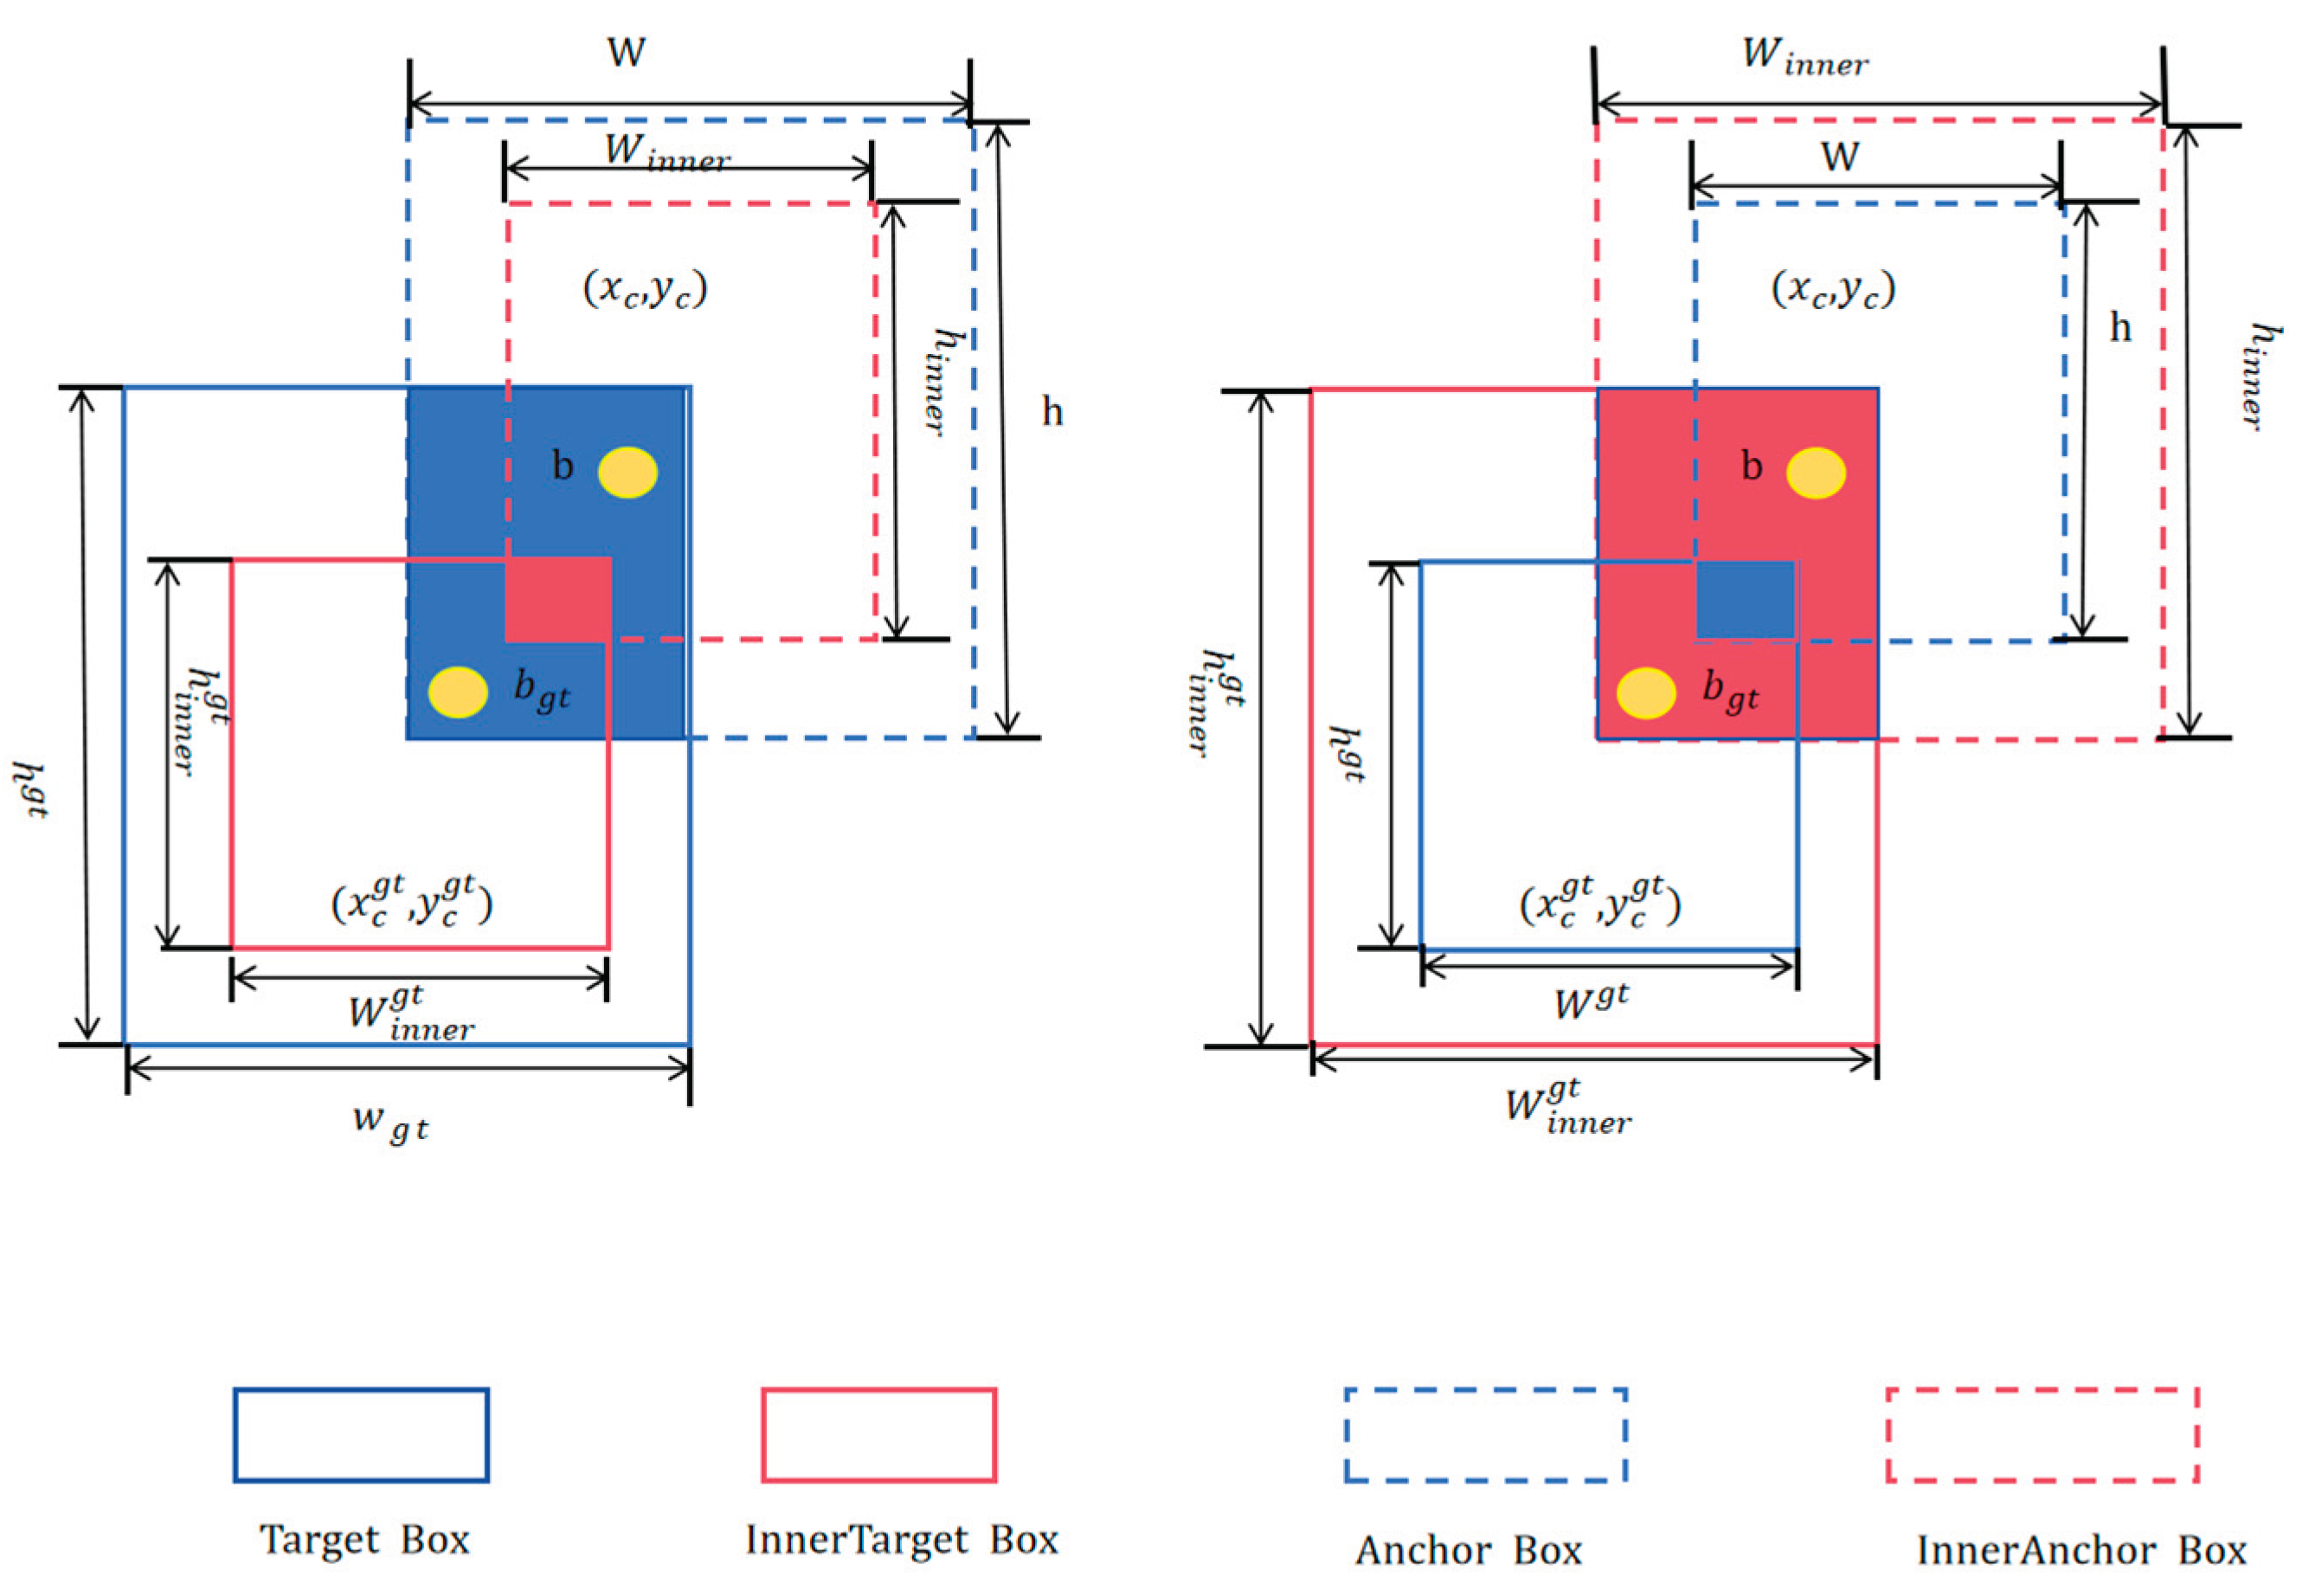
Figure 7.
Architecture diagram of the MBY algorithm
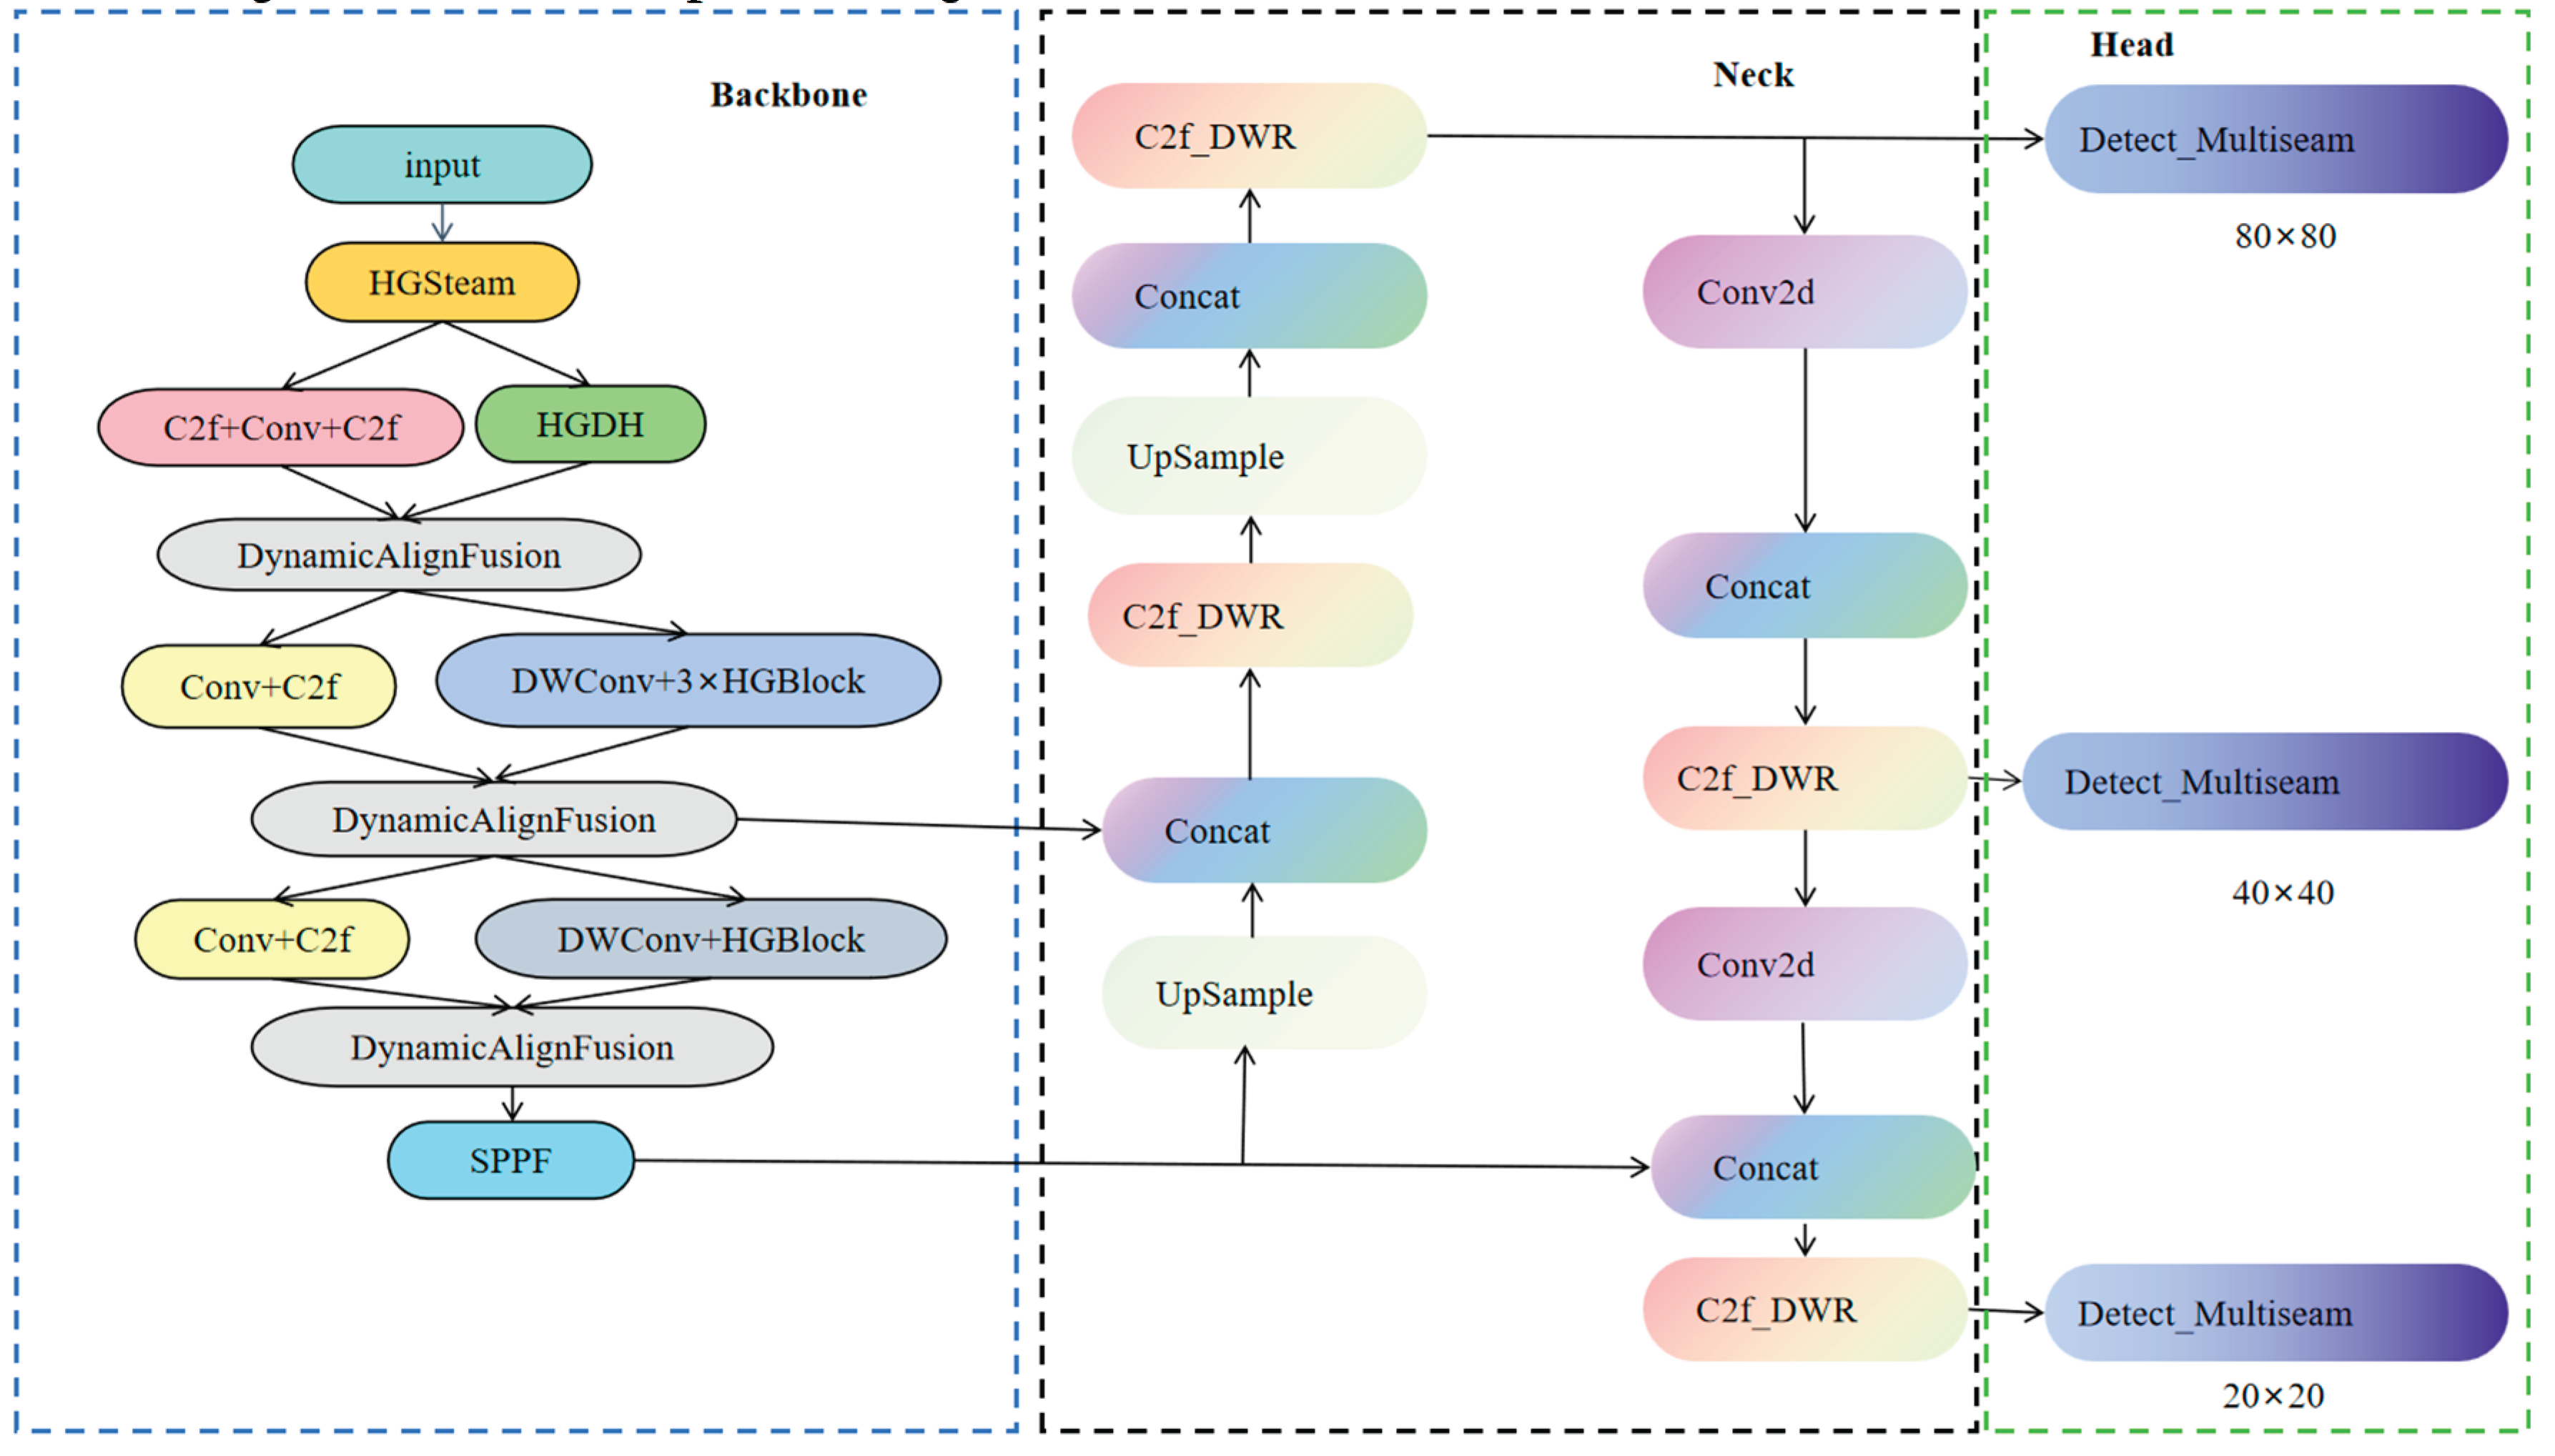
Figure 8.
Category distribution in the two datasets
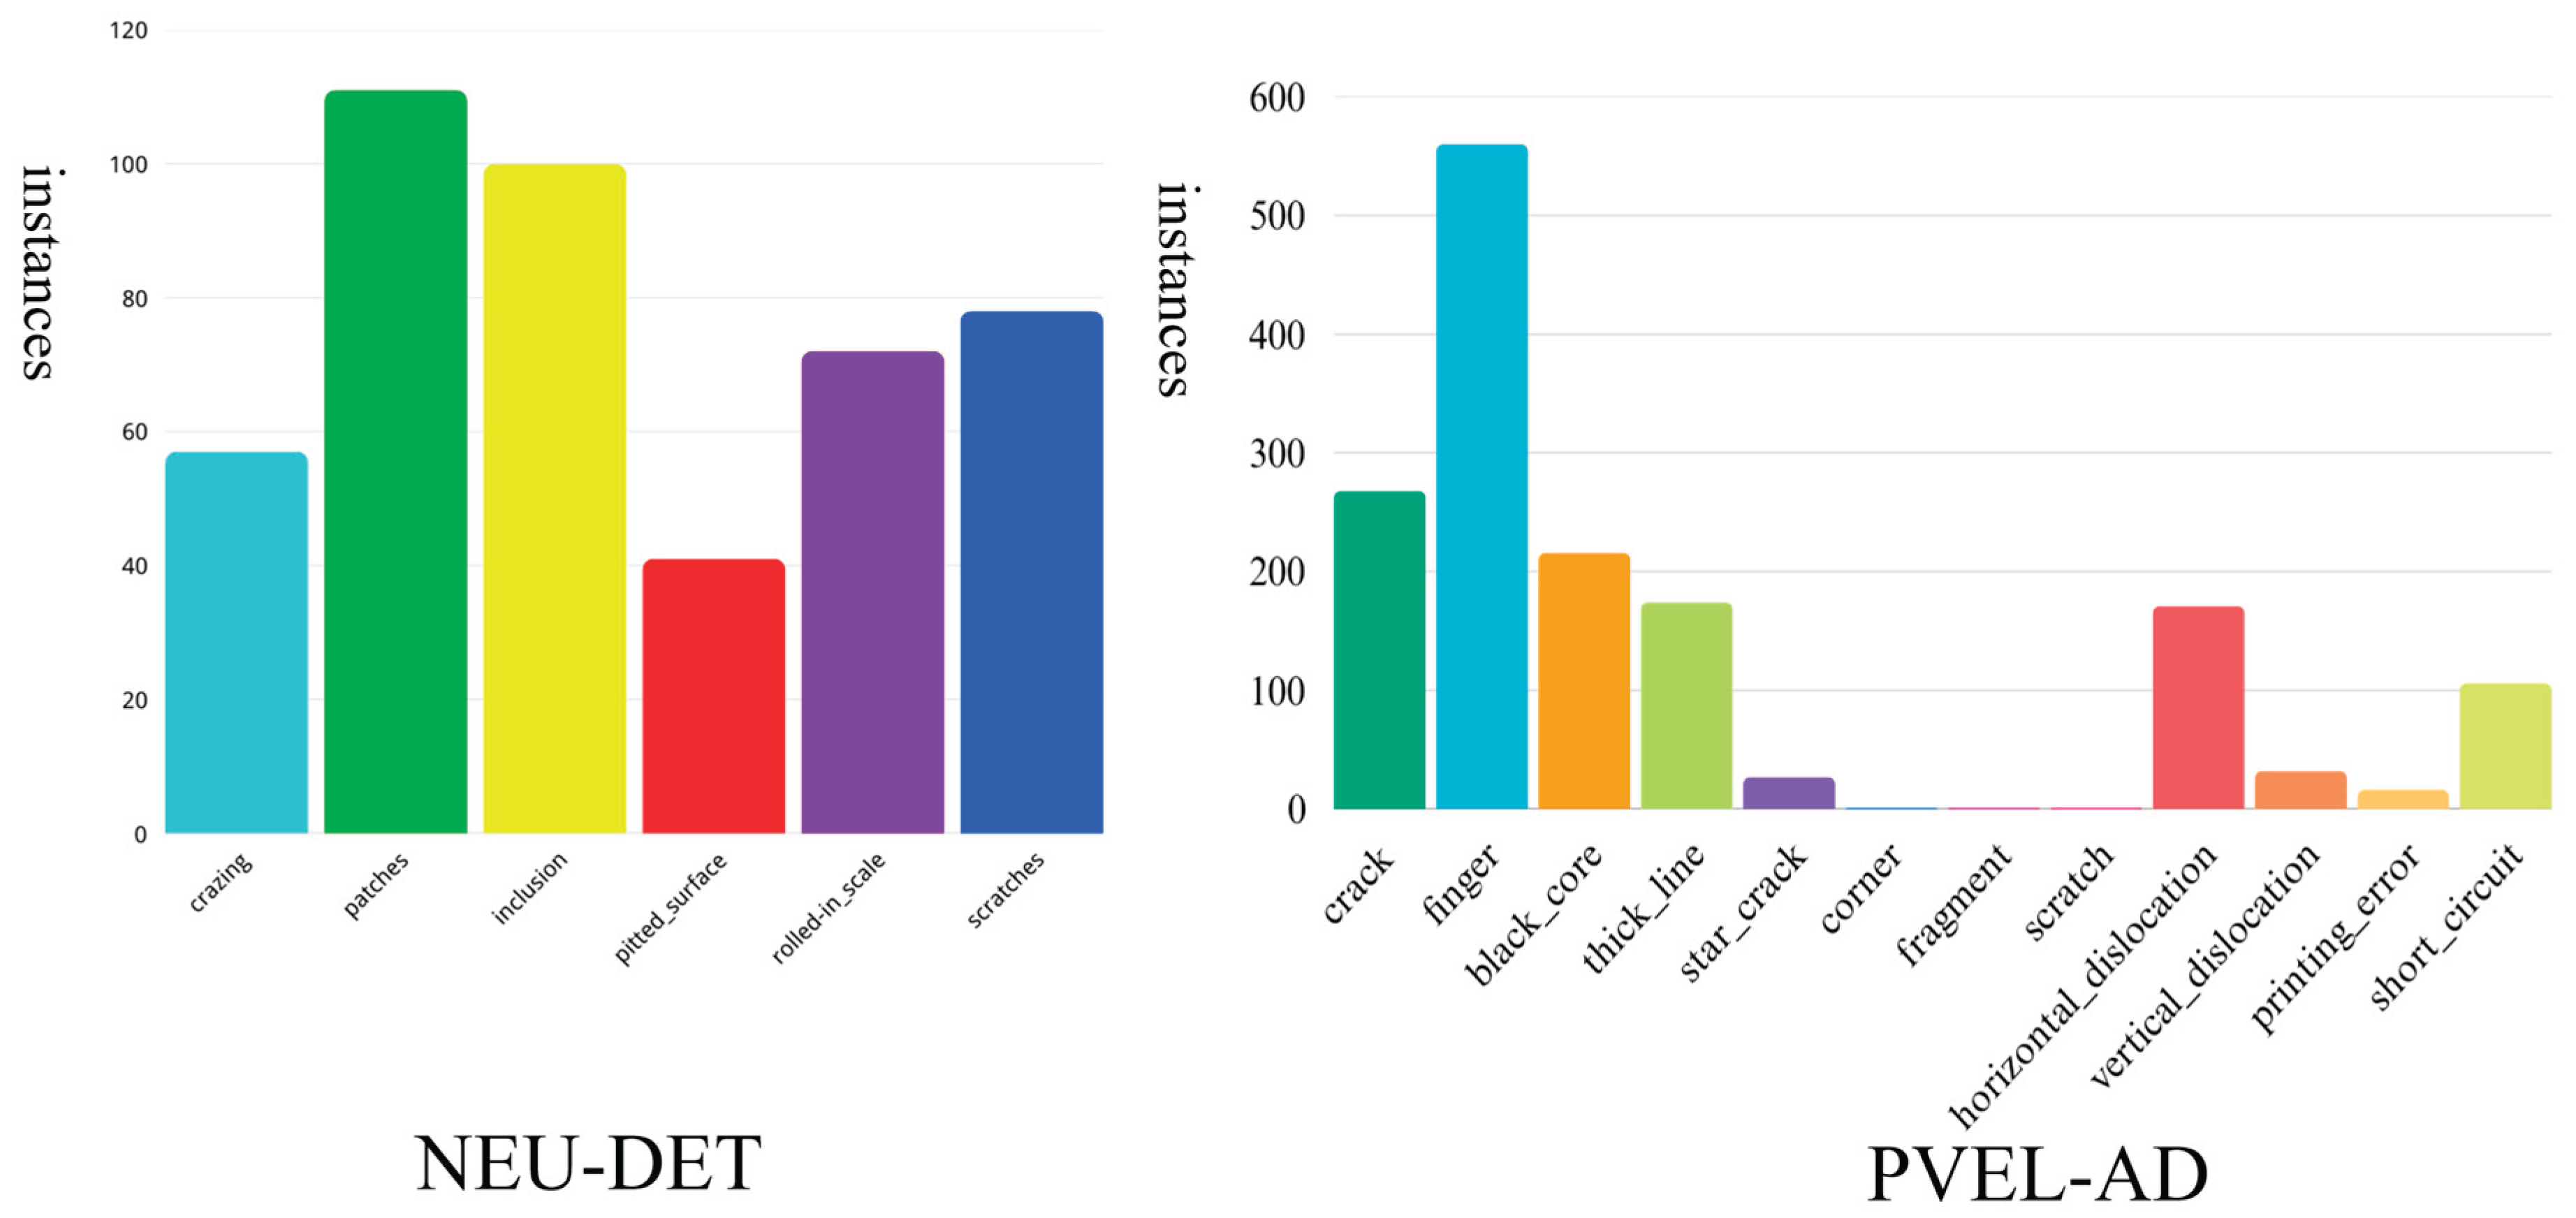
Figure 9.
Loss function performance on NEU-DET and PVEL-AD
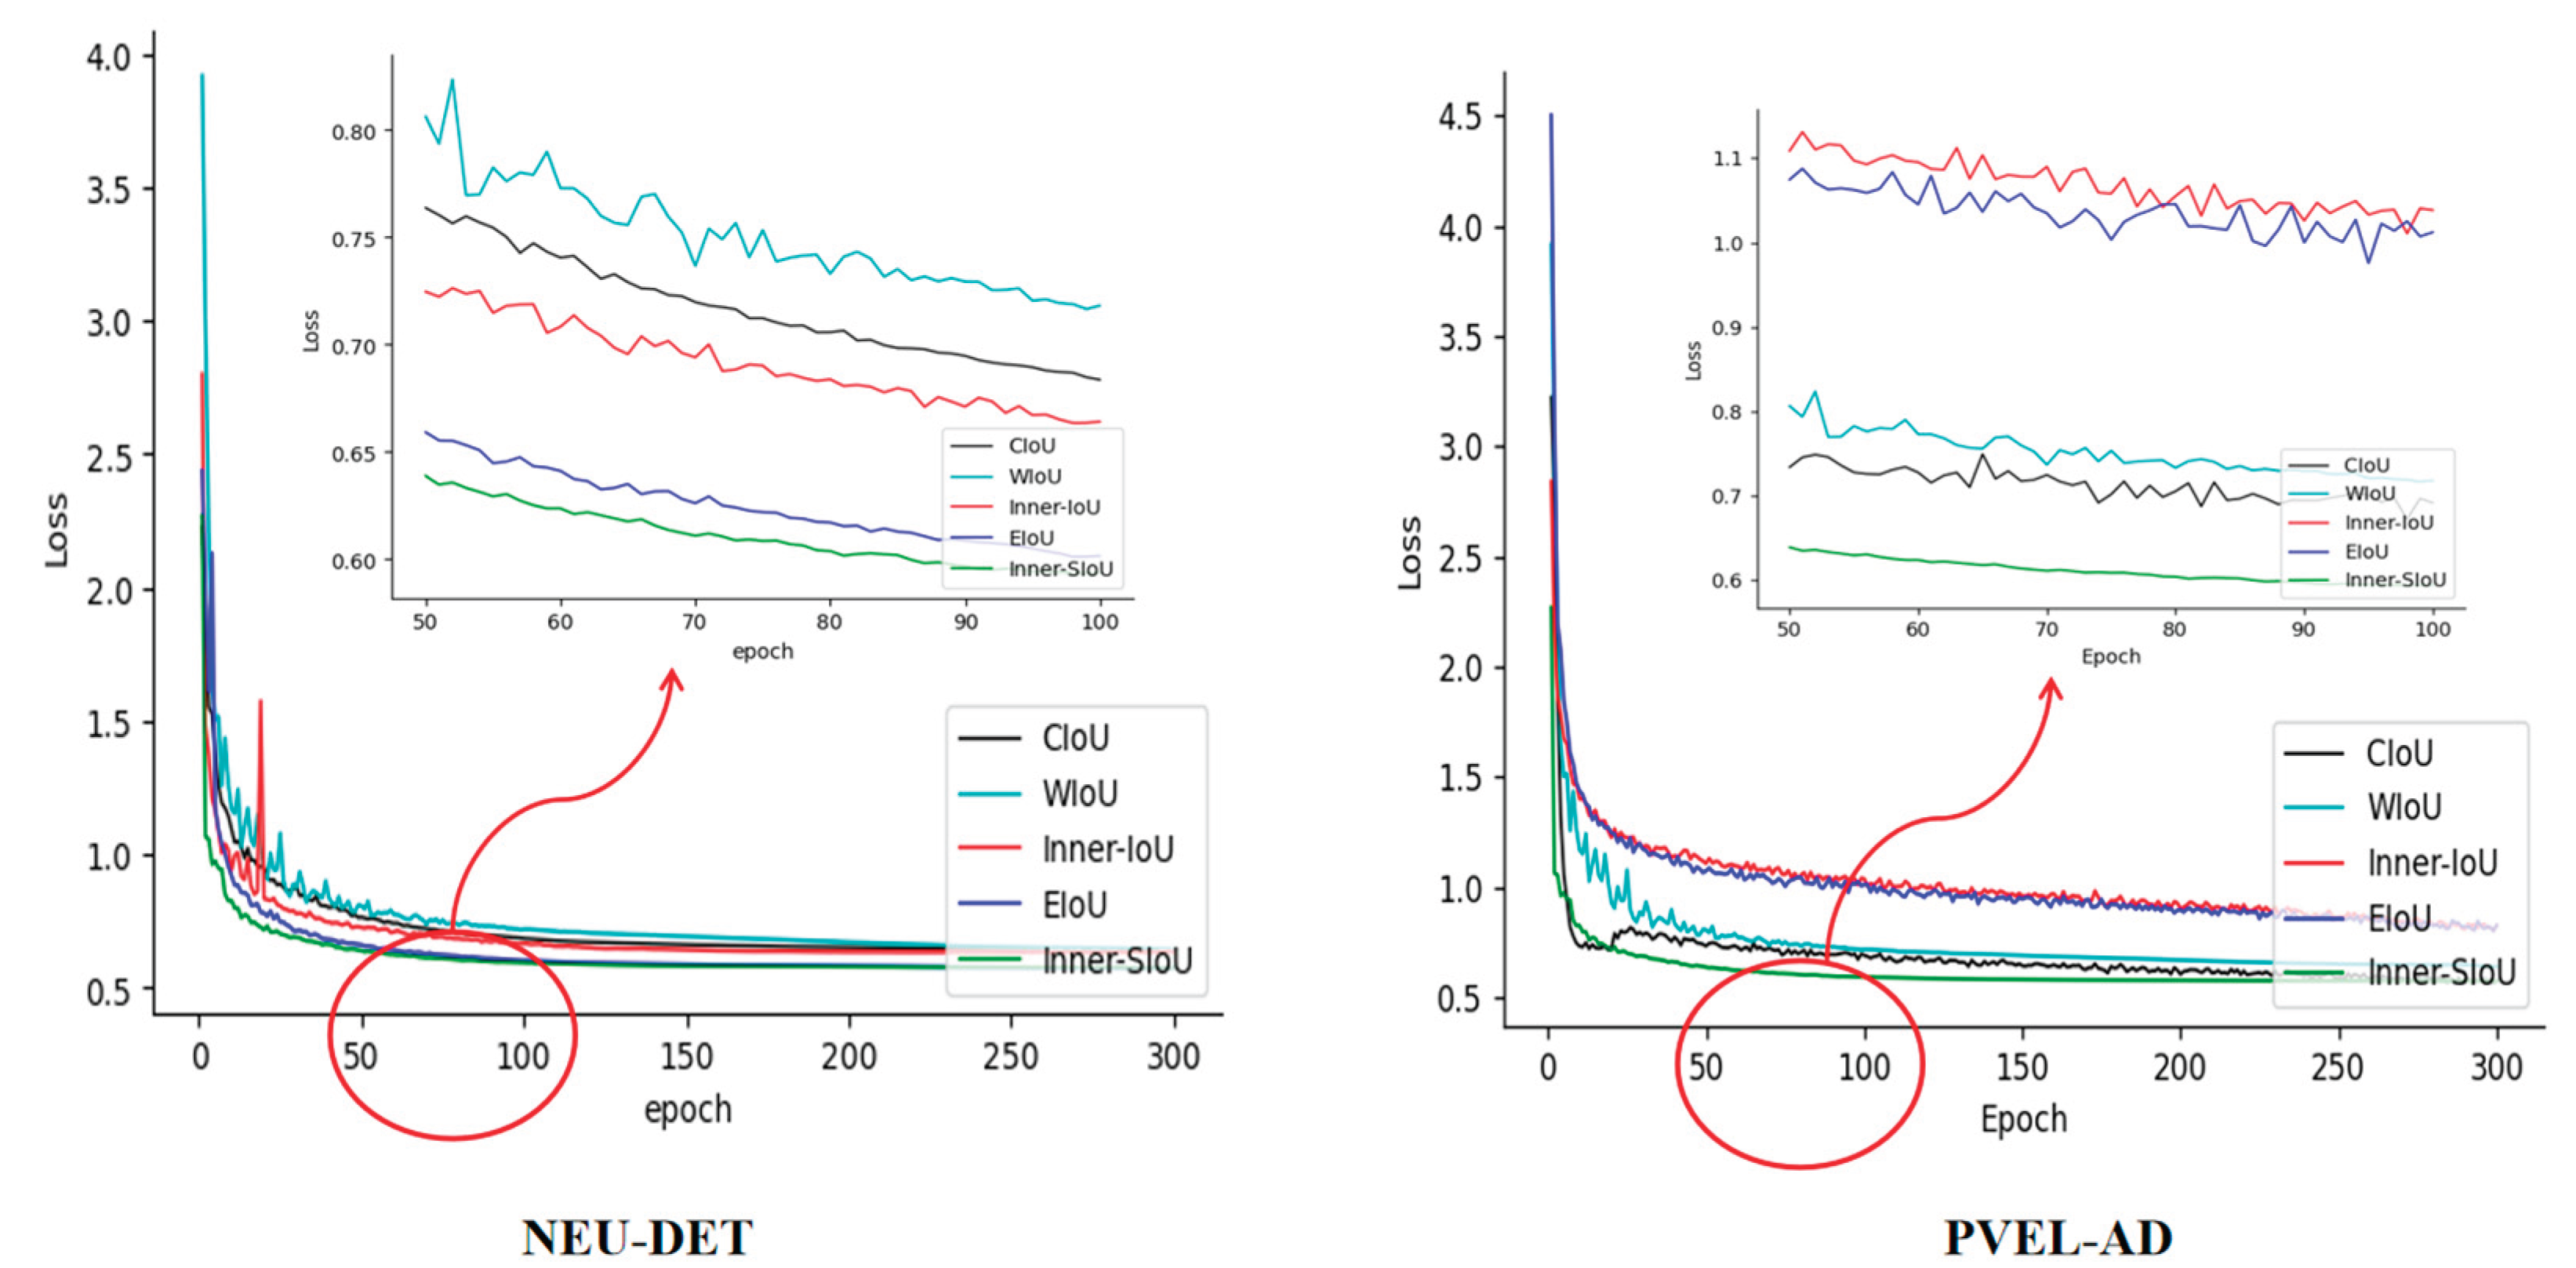
Figure 10.
P-R Curve of YOLOv8 and the Proposed Model on the NEU-DET Dataset
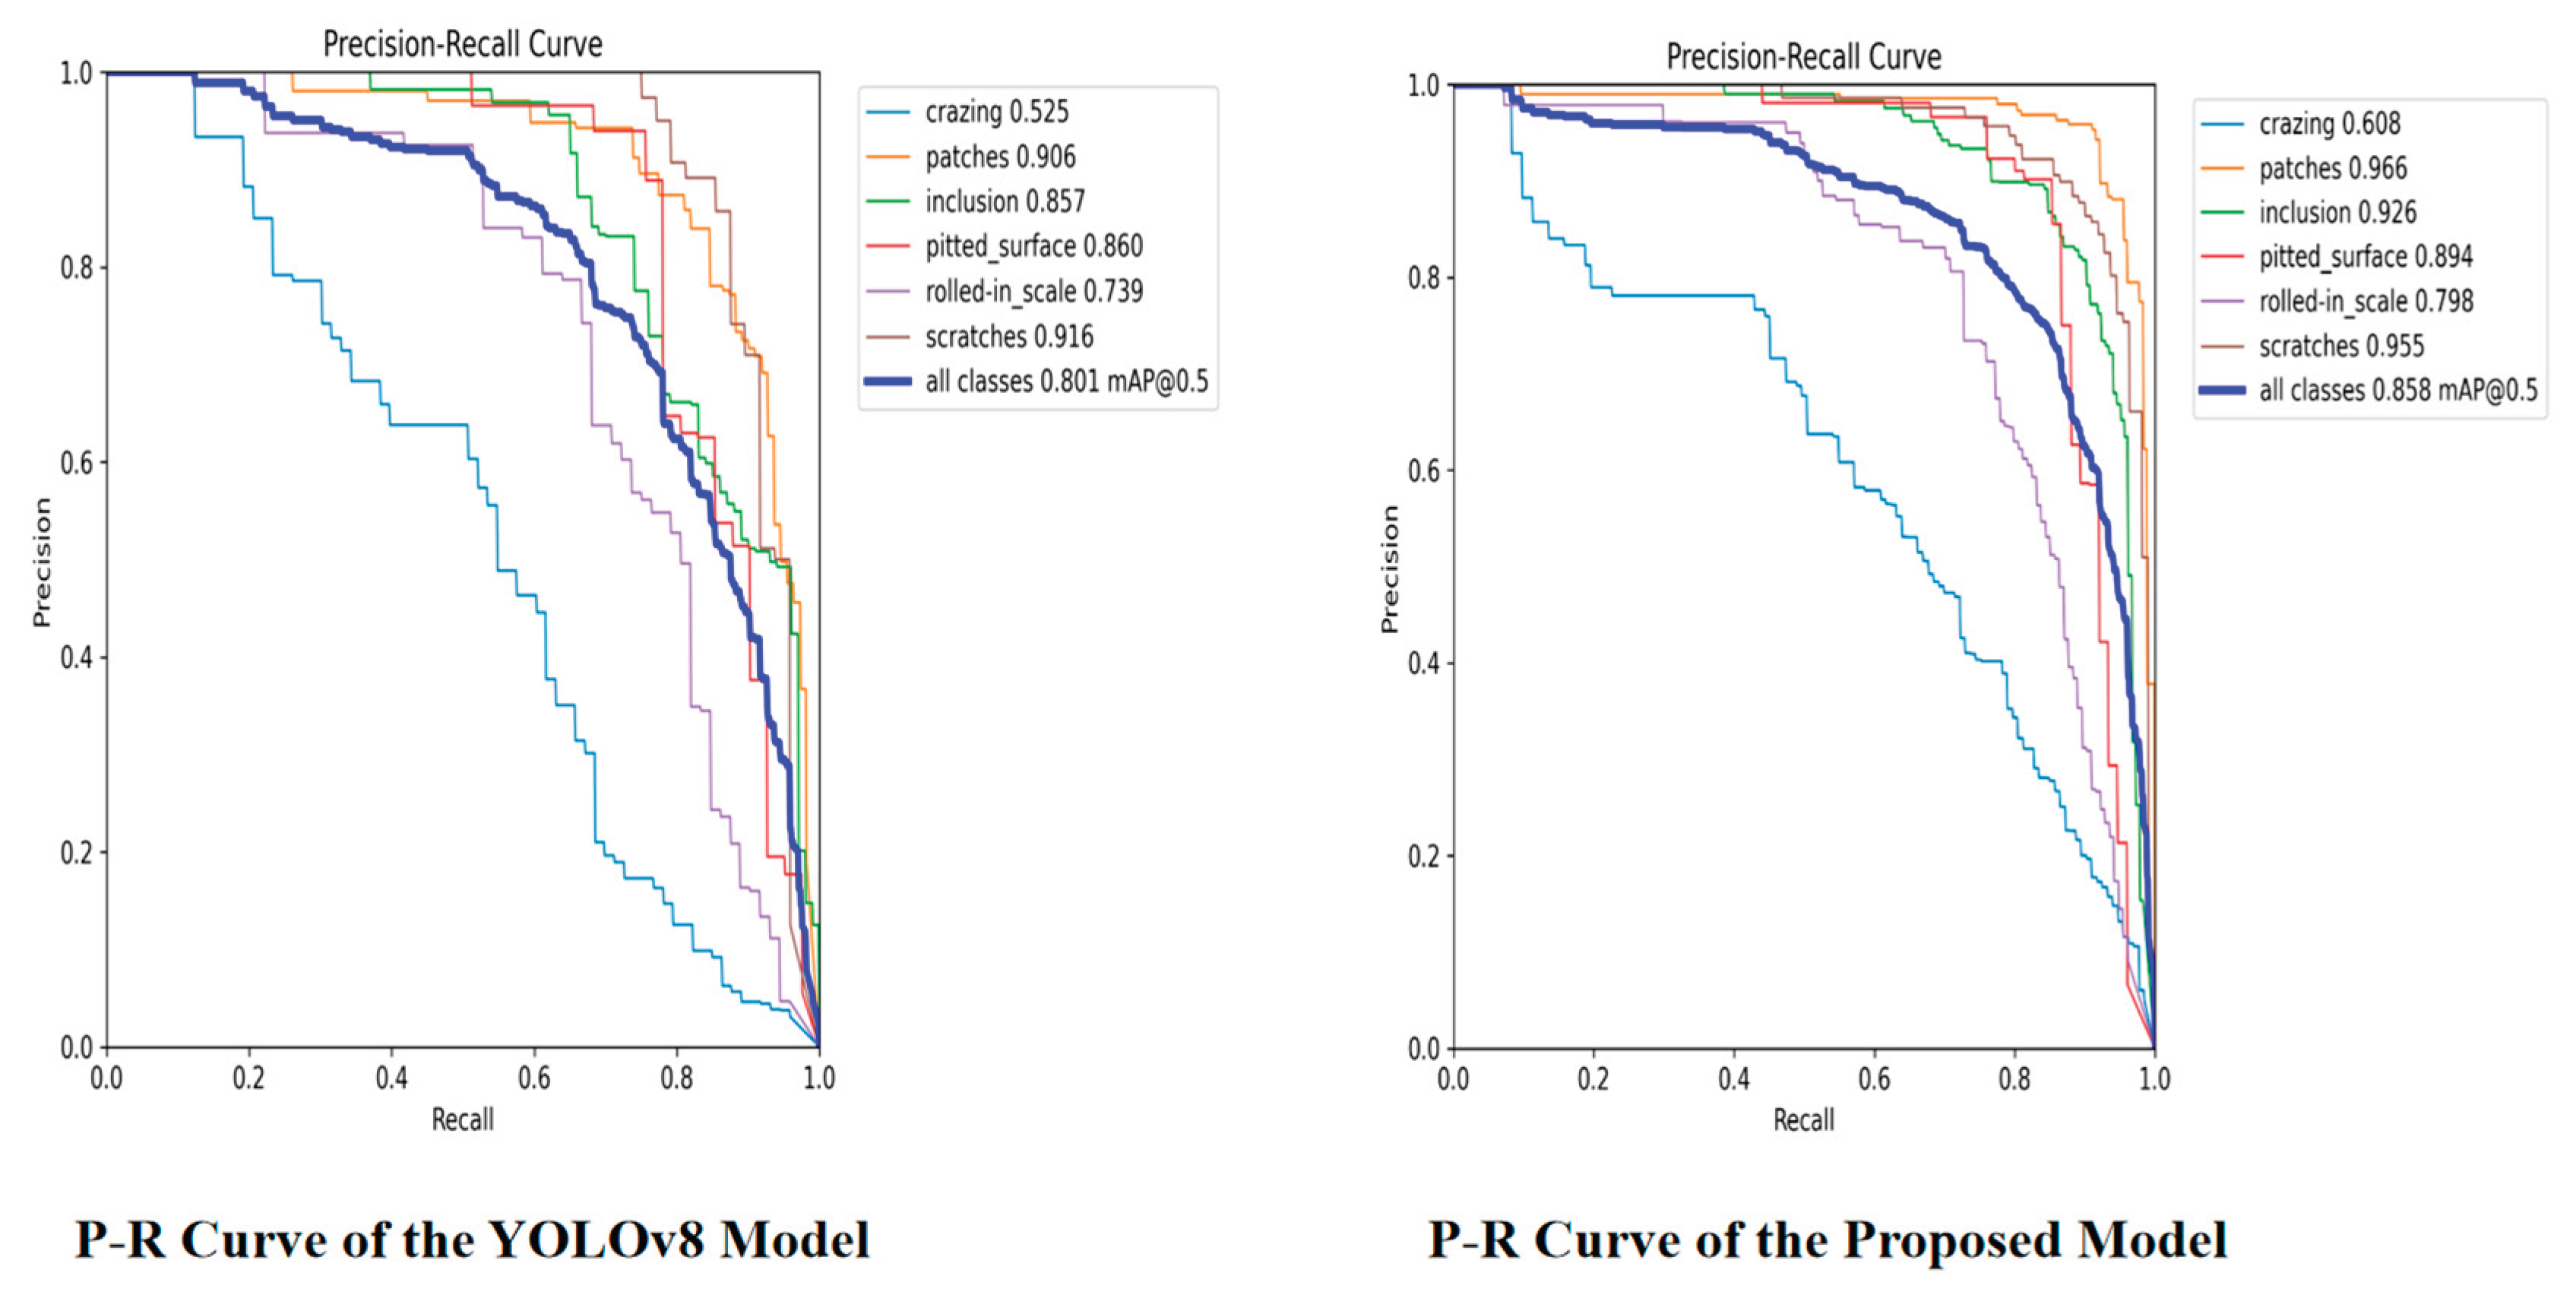
Figure 11.
P-R Curve of YOLOv8 and the Proposed Model on the PVEL-AD Dataset
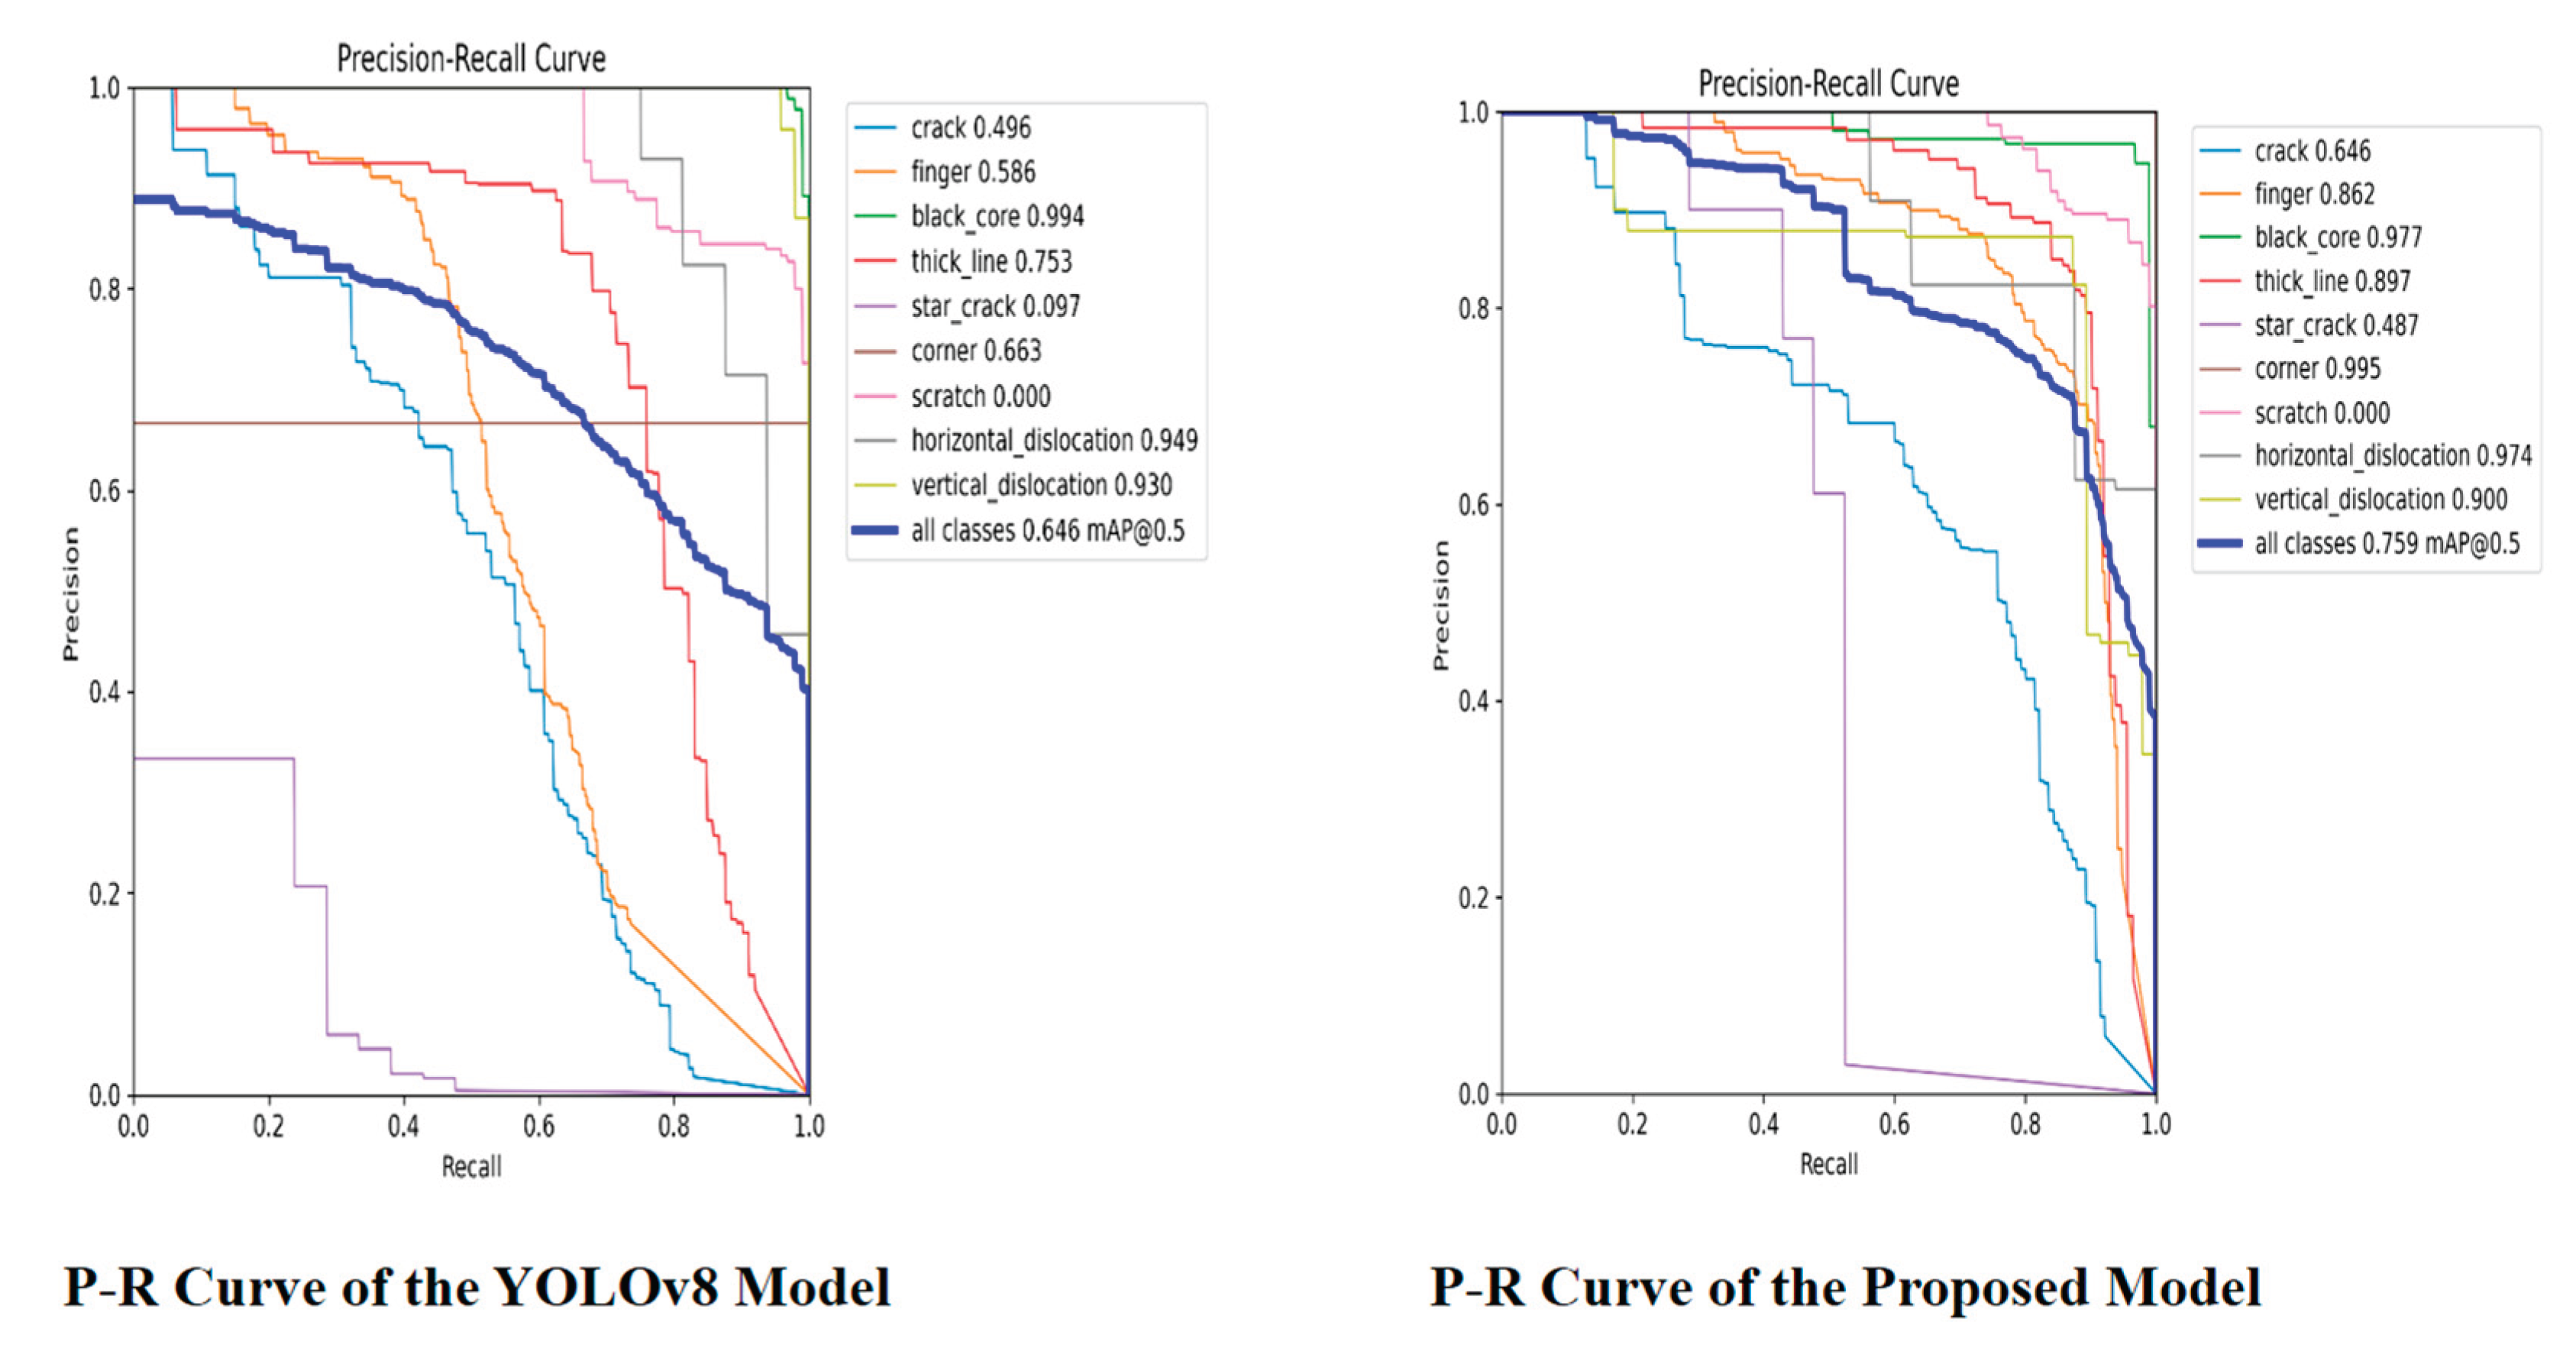
Figure 12.
Comparative Visualization of Networks on NEU-DET Dataset
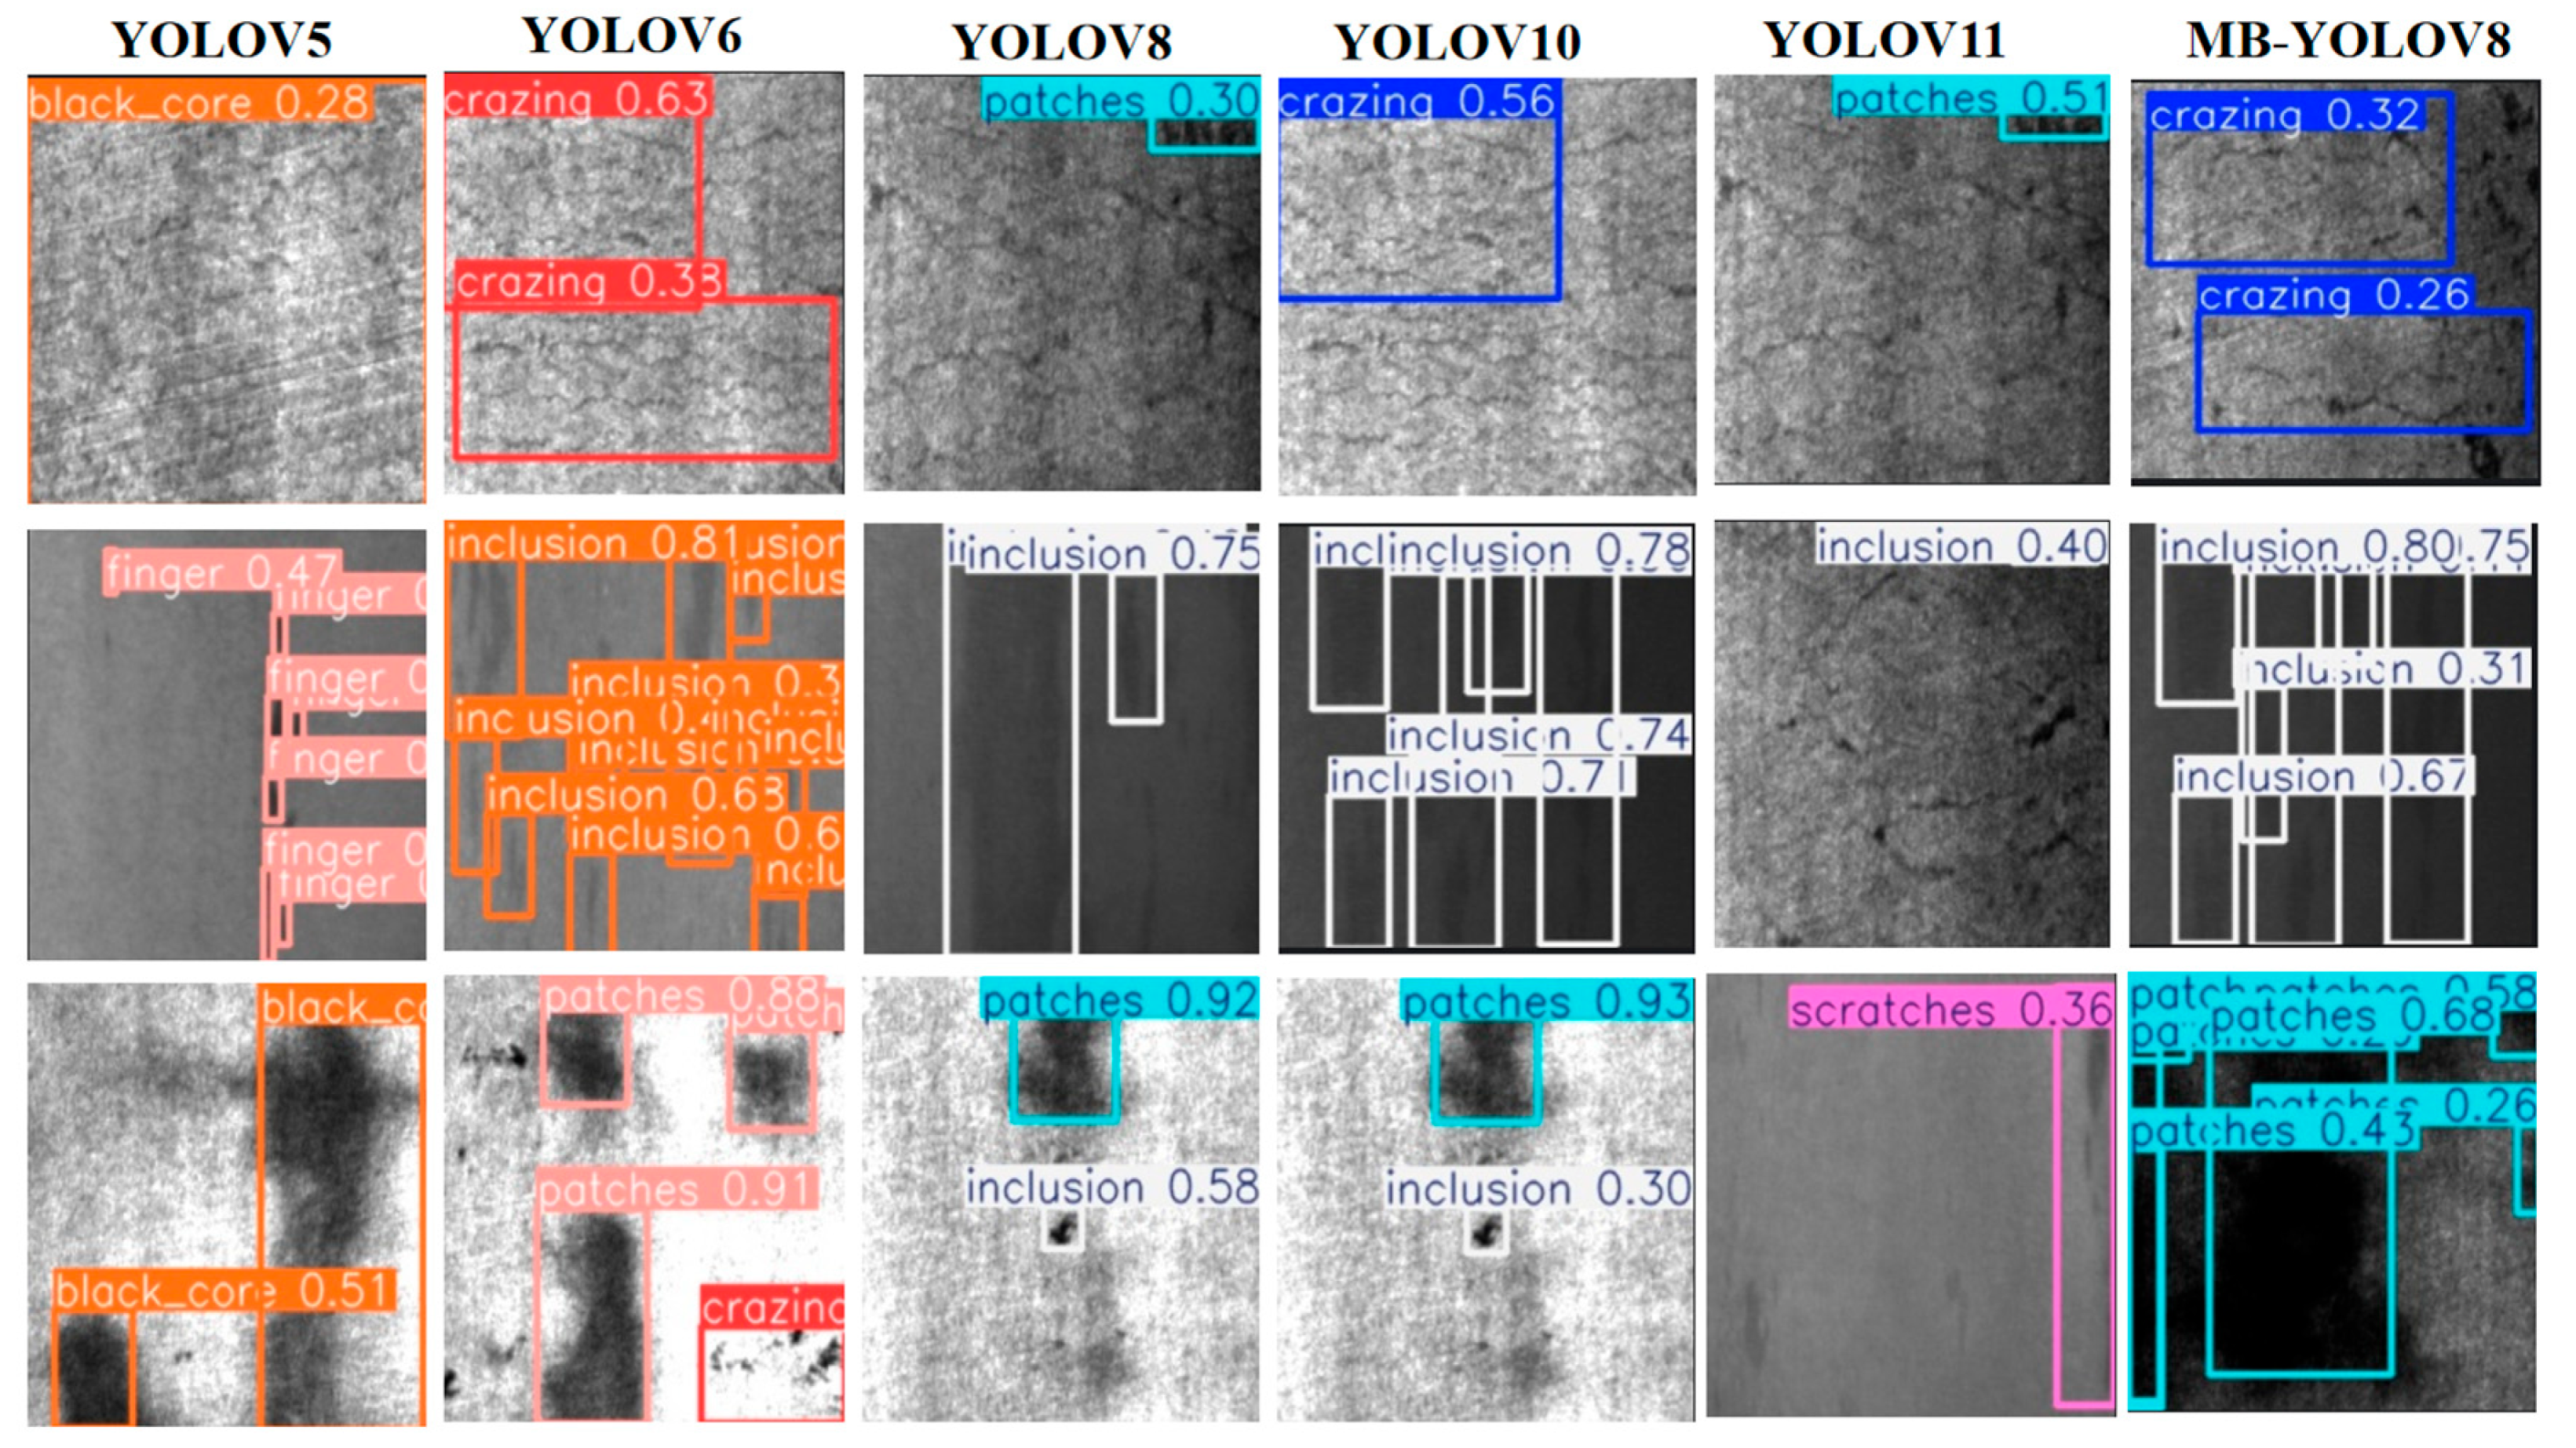
Figure 13.
Comparison of Visualization Results of Different Networks on the PVEL-AD Dataset
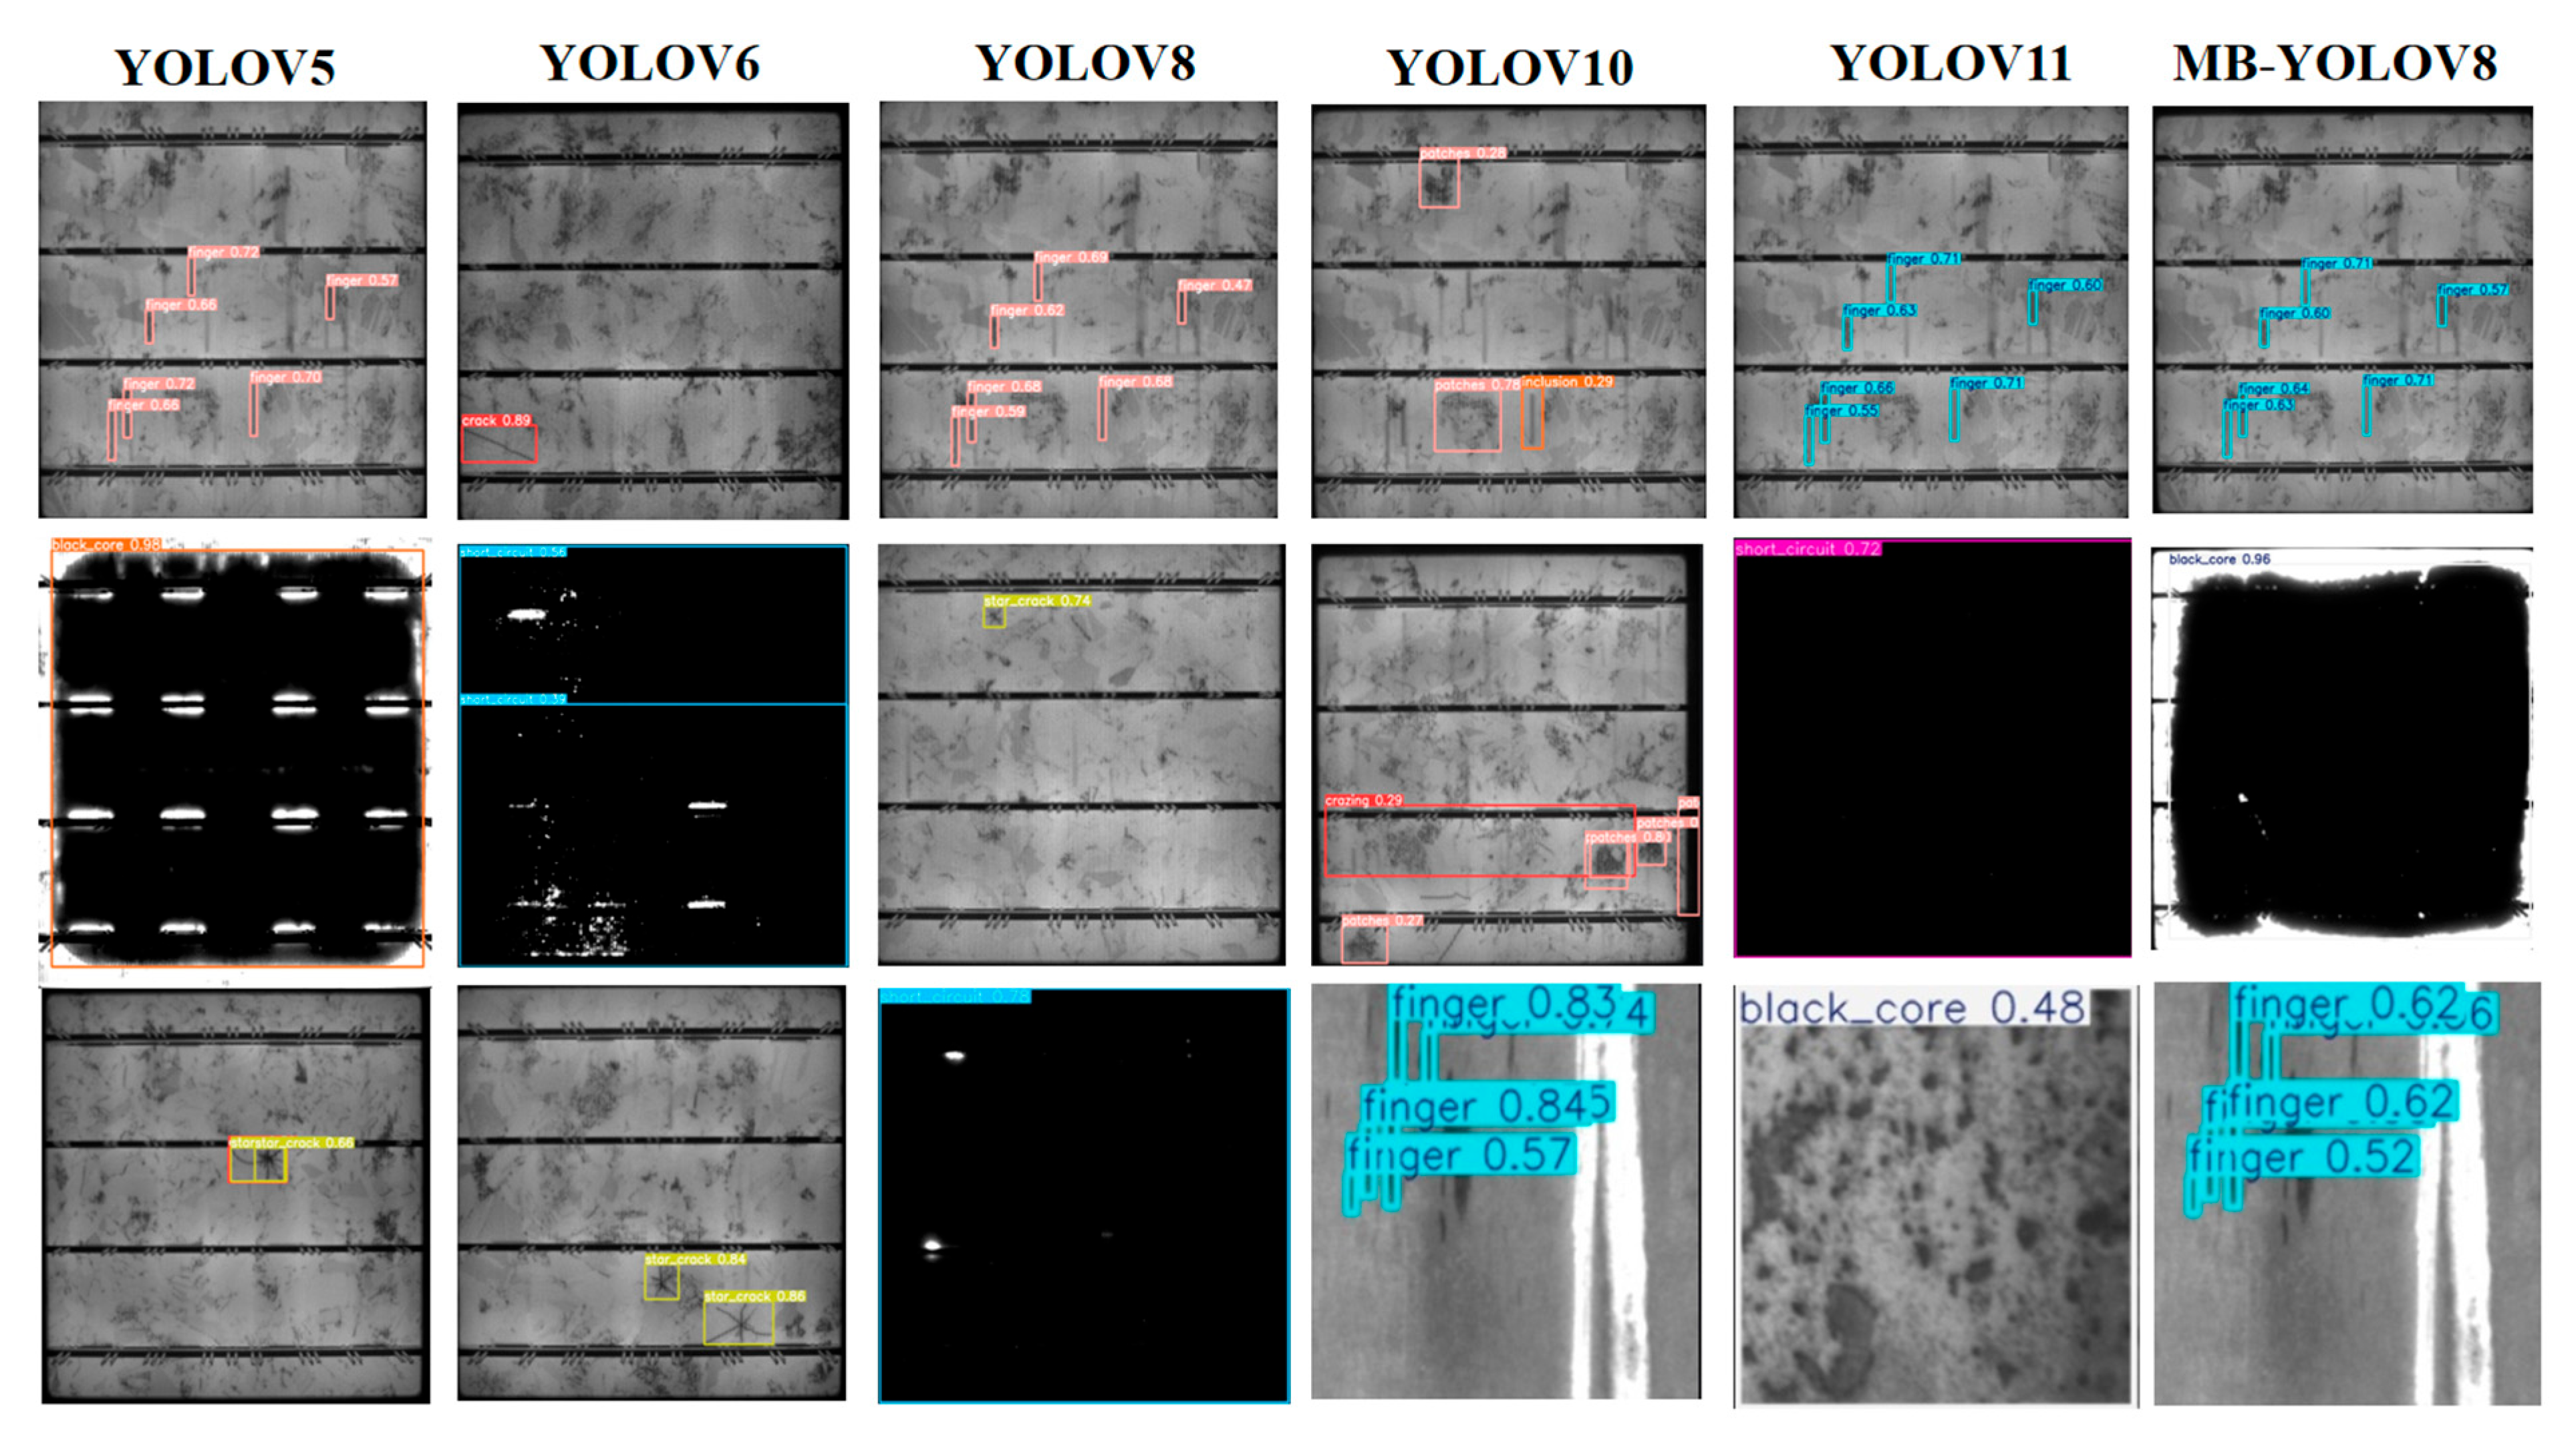

Table 1.
Statistics of Dataset Categories and Image Counts.
| Name | Number of categories | Training set | Validation set | Test set |
| NEU-DET | 6 | 1260 | 360 | 180 |
| PVEL-AD | 12 | 3600 | 900 | 450 |
Table 2.
Hyperparameter Settings.
| Name | NEU-DET | PVEL-AD |
| Optimizer | SGD | SGD |
| Learning rate | 0.01 | 0.01 |
| Weight decay factor | 0.0005 | 0.0005 |
| Batch size | 32 | 32 |
| Epoch | 300 | 300 |
| Image size | 640×640 | 640×640 |
Table 3.
Performance on NEU-DET and PVEL-AD with Different Backbones.
| Dataset | Method | mAP@0.5 | mAP@0.5-0.95 | Recall | GFLOPs |
| YOLOV8 | 80.2 | 50.5 | 72.8 | 8.1 | |
| HGNetV2 | 81.3 | 52.0 | 75.1 | 6.9 | |
| NEU-DET | MobileNetV4 | 82.9 | 53.6 | 77.1 | 22.5 |
| EfficientFormerV2 | 81.6 | 51.0 | 72.5 | 9.4 | |
| MBDNet | 83.0 | 53.2 | 77.3 | 11.5 | |
| YOLOV8 | 64.6 | 44.1 | 60.2 | 8.1 | |
| HGNetV2 | 69.1 | 47.6 | 70.8 | 6.9 | |
| PVEL-AD | MobileNetV4 | 70.7 | 42.7 | 65.0 | 22.6 |
| EfficientFormerV2 | 67.6 | 51.0 | 72.5 | 9.4 | |
| MBDNet | 75.9 | 37.4 | 58.8 | 8.1 |
Table 4.
Comparison of loss functions on NEU-DET and PVEL-AD datasets.
| Dataset | Method | mAP@0.5 | mAP@0.5-0.95 | Recall | GFLOPs |
| CIoU | 80.2 | 50.5 | 72.8 | 8.1 | |
| WIoU | 80.0 | 50.1 | 72.5 | 8.2 | |
| NEU-DET | Inner-IoU | 81.2 | 50.3 | 72.3 | 8.2 |
| EIoU | 81.4 | 50.6 | 72.8 | 8.2 | |
| Inner-SIoU | 82.5 | 51.5 | 73.1 | 8.1 | |
| CIoU | 64.6 | 44.1 | 60.2 | 8.1 | |
| WIoU | 70.8 | 50.3 | 69.0 | 8.1 | |
| PVEL-AD | Inner-IoU | 68.5 | 43.4 | 73.4 | 8.1 |
| EIoU | 66.9 | 42.3 | 57.4 | 8.1 | |
| Inner-SIoU | 71.6 | 45.6 | 66.7 | 8.1 |
Table 5.
Ablation Experiments of MBY on the NEU-DET Dataset
| Experiments | MB-DAF | DWR | MultiSEAM | Inner-SIoU | mAP@0.5 | mAP@0.5-0.95 | Recall | G |
| 1 | × | × | × | × | 80.2 | 50.5 | 72.8 | 8.1 |
| 2 | √ | × | × | × | 83.0 | 53.2 | 77.3 | 11.5 |
| 3 | × | √ | × | × | 81.3 | 50.8 | 71.2 | 8.1 |
| 4 | × | × | √ | × | 82.4 | 51.3 | 73.5 | 7.4 |
| 5 | × | × | × | √ | 82.5 | 51.5 | 73.1 | 8.1 |
| 6 | √ | × | √ | × | 84.5 | 54.0 | 79.3 | 10.5 |
| 7 | √ | √ | √ | √ | 85.8 | 56.2 | 79.7 | 10.5 |
Table 6.
Ablation Experiments of MBY on the PVEL-AD Dataset
| Experiments | MB-DAF | DWR | MultiSEAM | Inner-SIoU | mAP@0.5 | mAP@0.5-0.95 | Recall | G |
| 1 | × | × | × | × | 64.6 | 44.1 | 60.2 | 8.1 |
| 2 | √ | × | × | × | 68.4 | 42.5 | 77.3 | 9.9 |
| 3 | × | √ | × | × | 68.8 | 44.8 | 60.2 | 8.0 |
| 4 | × | × | √ | × | 71.4 | 48.8 | 69.6 | 7.3 |
| 5 | × | × | × | √ | 71.6 | 45.6 | 66.7 | 8.1 |
| 6 | √ | × | √ | × | 69.3 | 36.6 | 71.2 | 9.7 |
| 7 | √ | √ | √ | √ | 75.9 | 37.4 | 58.8 | 8.1 |
Table 7.
Comparison of Detection Performance for Various Single-Stage Algorithms on the NEU-DET Dataset.
Table 7.
Comparison of Detection Performance for Various Single-Stage Algorithms on the NEU-DET Dataset.
| models | mAP@0.5 | mAP@0.5-0.95 | GFLOPs |
| YOLOv5 | 84.5 | 53.6 | 7.1 |
| YOLOv6 | 84.4 | 54.1 | 11.8 |
| YOLOv8 | 80.2 | 50.5 | 8.1 |
| YOLOv10 | 82.9 | 52.2 | 6.5 |
| YOLOv11 | 77.3 | 50.9 | 6.3 |
| CAY | 79.9 | 45.6 | \ |
| YOLOV7-BA | 74.8 | 38.8 | \ |
| EFd-YOLOv4 | 79.88 | \ | \ |
| MS-YOLOv5s | 80.5 | \ | \ |
| Ours | 85.8 | 56.2 | 10.5 |
Table 8.
Comparison of Detection Performance for Various Single-Stage Algorithms on the PVEL-AD Dataset
Table 8.
Comparison of Detection Performance for Various Single-Stage Algorithms on the PVEL-AD Dataset
| models | mAP@0.5 | mAP@0.5-0.95 | GFLOPs |
| YOLOv5 | 69.5 | 44.8 | 7.1 |
| YOLOv6 | 65.2 | 43.4 | 11.8 |
| YOLOv8 | 59.2 | 37.7 | 8.1 |
| YOLOv10 | 69.2 | 44.3 | 6.5 |
| YOLOv11 | 69.3 | 45.9 | 6.3 |
| PD-DETR | 64.7 | \ | \ |
| Ours | 75.9 | 37.4 | 8.1 |
Disclaimer/Publisher’s Note: The statements, opinions and data contained in all publications are solely those of the individual author(s) and contributor(s) and not of MDPI and/or the editor(s). MDPI and/or the editor(s) disclaim responsibility for any injury to people or property resulting from any ideas, methods, instructions or products referred to in the content. |
© 2025 by the authors. Licensee MDPI, Basel, Switzerland. This article is an open access article distributed under the terms and conditions of the Creative Commons Attribution (CC BY) license (http://creativecommons.org/licenses/by/4.0/).
Copyright: This open access article is published under a Creative Commons CC BY 4.0 license, which permit the free download, distribution, and reuse, provided that the author and preprint are cited in any reuse.


