
Submitted:
14 August 2025
Posted:
15 August 2025
You are already at the latest version
Abstract
The automation of quality control in the food processing industry is critical for enhancing production efficiency, ensuring product safety, and reducing operational costs. A significant challenge in this domain is the automated inspection of tuber peeling, where incomplete processing can leave undesirable residual fragments. This paper addresses the specific problem of detecting small, low-contrast, and densely clustered residual taro peel fragments in a real-time industrial setting. We propose Multi-Dimensional Bionic YOLO (MDB-YOLO), a novel, lightweight object detection model based on the YOLOv8 architecture, specifically optimized for this challenging task. MDB-YOLO integrates several key innovations to achieve a superior balance of accuracy and efficiency: a C2f_EMA module enhances multi-scale feature representation through an efficient attention mechanism; Dynamic Upsampling (DySample) improves the reconstruction of high-resolution details; Omni-Dimensional Dynamic Convolution (ODConv2d) provides adaptive kernel learning; a BiFPN_Concat2 module is used for feature fusion; the Wise-IoU (WIoU) loss function focuses training on difficult examples; and Soft-NMS improves recall in dense scenes. Evaluated on a custom-built Taro Peel Industrial Dataset (TPID), MDB-YOLO achieves a mean Average Precision (mAP@0.5) of 92.1% and a mAP@0.5:0.95 of 69.7%, outperforming the YOLOv8s baseline and other state-of-the-art models. With only 13.44 million parameters and a computational load of 28.4 GFLOPS, MDB-YOLO demonstrates its suitability for lightweight deployment on resource-constrained edge devices, offering a practical and effective solution for automated quality control by delivering top-tier accuracy at a fraction of the computational cost and inference time of its competitors.
Keywords:
object detection
; MDB-YOLO
; taro peeling
; automated quality control
; lightweight model
; Small Target Detection
1. Introduction
The global food industry operates under immense pressure to increase output, guarantee food safety, and minimize operational expenditures while addressing broader goals of sustainability and food security [1]. In response, automation has emerged as a transformative force, enabling manufacturers to achieve higher levels of consistency, scalability, and compliance with stringent state and federal regulations, such as those set by the Food and Drug Administration (FDA) and the European Food Safety Authority (EFSA) [2]. Artificial intelligence (AI), particularly in the form of automated quality control systems powered by robotics and computer vision, is instrumental in this paradigm shift. These systems enhance product traceability throughout the supply chain, often leveraging technologies like blockchain to create transparent records from farm to consumer. They improve efficiency by operating continuously and bolster safety by reducing human error and contact with products. By leveraging data from sensors and cameras, AI-driven analytics can predict potential quality risks in real-time, allowing for preemptive action that prevents defective goods from reaching consumers, thereby safeguarding public health and preserving brand reputation [3,4].
Within the broader context of food processing, the peeling of root and tuber crops—such as taro, cassava, and potatoes—represents a significant operational bottleneck [5,6]. Conventional mechanical peelers, which often use abrasive methods, struggle with irregular surfaces, leading to either incomplete peeling or excessive flesh loss, both of which diminish product quality and yield [7]. While alternative methods such as steam or chemical peeling exist, they present their own trade-offs regarding energy consumption, environmental impact, and cost. For taro, manual handling can cause skin irritation for workers due to acrid compounds like calcium oxalate raphides, while prolonged exposure of the peeled tuber to air leads to oxidation, which adversely affects its color and flavor . The core industrial problem extends beyond the act of peeling to the crucial step of verifying its completeness. Residual peel fragments are unacceptable in many final food products. This necessitates a reliable, non-destructive inspection system capable of identifying these small, often inconspicuous, defects on a high-speed production line. The limitations of both mechanical and manual methods create a clear and compelling need for an automated solution that can perform this quality control task with high accuracy and efficiency [8].
Computer vision has become the state-of-the-art technology for implementing automated, non-destructive quality assessment in the food industry. By emulating human visual perception, these systems offer objective, consistent, and rapid inspection capabilities that far exceed manual methods. Leveraging advanced imaging techniques, such as hyperspectral imaging, and deep learning algorithms, computer vision systems can analyze visual attributes such as color, texture, size, and shape to detect defects, assess ripeness, and identify contaminants. For applications requiring real-time analysis on moving conveyor belts, object detection algorithms from the You Only Look Once (YOLO) family are particularly well-suited. YOLO's single-pass architecture, which processes an entire image at once to predict object locations and classes, provides the high inference speed necessary for industrial-scale production lines. The continuous evolution of the YOLO series has consistently improved the balance between speed and accuracy, making it a strong foundation for developing practical quality control solutions in industrial manufacturing and automation [9,10,11,12,13,14,15,16].
Despite the power of general-purpose object detectors like YOLO, the specific task of identifying residual taro peel fragments presents a confluence of challenges that standard models are not optimized to handle [17,18]. An analysis of the real-world industrial environment reveals a set of demanding conditions that form a significant research gap:
- Small Target Detection: Residual peel fragments are often diminutive, frequently measuring less than 20×20 pixels in a high-resolution image. Standard models often lose the features of such small objects during successive down-sampling operations;
- Low Contrast and Complex Backgrounds: The textural and chromatic properties of the peel can be remarkably similar to the taro flesh itself. Furthermore, the conveyor belts used in processing plants often have grid-like or striped patterns that can be easily misidentified as peel fragments, leading to a high false positive rate;
- Dense and Occluded Scenes: It is common for multiple peel fragments to appear in close proximity, creating dense clusters. These fragments may also be partially occluded by the main body of the taro or other debris on the conveyor;
Variable Lighting Conditions: Industrial settings are characterized by complex lighting, including strong reflections from overhead LEDs, deep shadows, and inconsistent illumination, which cause the appearance of the same object to vary significantly.
The central challenge, therefore, is not merely to improve a generic object detector, but to engineer a solution that simultaneously addresses the demands for high-accuracy small-target detection, real-time computational efficiency, and robustness to the harsh visual conditions of an industrial environment. While the latest general-purpose models like YOLOv9 demonstrate ever-increasing accuracy on benchmark datasets, a gap remains for creating highly specialized, lightweight models tailored to specific industrial niches that prioritize efficiency alongside accuracy [19,20]. Existing models often excel in one area at the expense of others; for example, large, highly accurate models are too slow for real-time deployment on edge hardware, while lightweight models lack the sensitivity to detect small, low-contrast targets reliably.
This paper bridges this gap by making the following primary contributions:
- The proposal of MDB-YOLO, a novel and lightweight architecture based on YOLOv8s. MDB-YOLO synergistically integrates six distinct technological enhancements designed specifically to improve the detection of small, irregular, and low-contrast targets while maintaining a low computational footprint;
- The development and public release of the TPID, a challenging, real-world benchmark dataset captured in an operational food processing facility. This dataset, with its detailed annotations, serves to validate our model and facilitate future research in industrial object detection;
- A comprehensive empirical evaluation, including extensive ablation studies and comparisons with other state-of-the-art (SOTA) models. The results demonstrate that MDB-YOLO achieves a superior balance of detection accuracy and computational efficiency, establishing it as a highly effective and practical solution for this industrial application.
2. The MDB-YOLO Method
2.1. Overall Network Architecture
The proposed MDB-YOLO model is engineered upon the robust and efficient foundation of the YOLOv8s architecture. The design philosophy is to preserve the lightweight core of YOLOv8s while introducing a series of targeted, synergistic enhancements to the backbone, neck, and head of the network. These modifications are specifically chosen to address the unique challenges of detecting residual taro peel fragments, namely their small size, low contrast, and dense distribution in complex industrial scenes.
As illustrated in Figure 1, the MDB-YOLO architecture incorporates six principal innovations. First, to enhance the model's ability to focus on relevant features, the C2f_EMA module is integrated into the backbone. Second, to improve the reconstruction of fine-grained details lost during down-sampling, the standard upsampling layers in the neck are replaced with the DySample module. Third, to enable more adaptive feature extraction, standard convolutional layers at critical cross-scale connection points are substituted with ODConv2d. Fourth, for more effective and lightweight multi-scale feature fusion, a BiFPN_Concat2 module is employed. Fifth, to optimize the training process for small and difficult targets, the default CIoU loss function is replaced with the WIoU v3 loss. Finally, to improve detection performance in crowded scenes, the standard Non-Maximum Suppression (NMS) algorithm is replaced with Soft-NMS during post-processing. Each of these components is detailed in the subsequent sections.
2.2. Enhanced Feature Representation with C2f_EMA
A fundamental limitation of standard convolutional neural networks is that they apply learned filters uniformly across all spatial locations and feature channels. This approach is suboptimal for tasks where certain regions or features are more informative than others. In our application, the model must learn to amplify the subtle textural patterns of peel fragments while simultaneously suppressing distracting background noise from the conveyor belt. While attention mechanisms like Squeeze-and-Excitation (SE) can recalibrate channel-wise feature responses, they often fail to capture rich spatial and multi-scale contextual information effectively [21,22,23].
To overcome this, we introduce the C2f_EMA module, which embeds the Efficient Multi-Scale Attention (EMA) mechanism directly into the C2f block of the YOLOv8 backbone. The EMA module, depicted in Figure 2, is designed to capture both short- and long-range dependencies efficiently. It achieves this by using two parallel pathways: a 1x1 convolution to model local, cross-channel interactions, and a 3×3 convolution to capture broader spatial context. Crucially, it employs a cross-spatial learning strategy that aggregates pixel-level relationships to build a global context-aware attention map without reducing the spatial dimensions of the feature map [24,25].
The core computation within the EMA component begins by encoding global spatial information for each channel c using 2D global average pooling:
where xc is the input feature for channel c, and H and W are its height and width. An attention map is then generated by applying a Softmax function to the pooled features and combining it with the outputs from the parallel convolutional branches. This process enhances the feature representation with both multi-scale and cross-spatial dependencies.
As shown in Figure 3, we strategically insert the EMA module immediately after the initial 3×3 convolution within the C2f block. This placement allows the model to perform feature enhancement before the input is split and passed through the bottleneck layers. By pre-focusing on salient regions and attenuating irrelevant background information, the C2f_EMA module provides a cleaner, more discriminative feature map to subsequent layers. This targeted enhancement is vital for improving the model's ability to distinguish very small targets from visually similar background clutter in a computationally efficient manner [26].
2.3. High-Resolution Feature Recovery via DySample
In object detection architectures, feature pyramids rely on upsampling layers to restore spatial resolution and fuse information from different scales. However, conventional upsampling methods, such as nearest-neighbor or bilinear interpolation, operate based on fixed, content-agnostic rules. These static approaches can introduce interpolation artifacts and often fail to accurately reconstruct the fine-grained details of small objects from coarse, low-resolution feature maps. This information loss is a primary reason why standard detectors struggle with targets smaller than 20×20 pixels [27,28].
To address this critical issue, we replace the standard upsampling layers in the model's neck with DySample, a dynamic, content-aware upsampling module. DySample fundamentally reframes the upsampling task from "learning a convolution kernel" to "learning how to sample." Its core operation is defined by the grid_sample function, a standard operation in deep learning frameworks like PyTorch:
Here, X is the input feature map of size C×H×W, S is a learned set of sampling points of size 2×sH×sW (where s is the upsampling scale factor), and X′ is the resulting upsampled feature map of size C×sH×sW.
As illustrated in Figure 4, instead of using a fixed grid, DySample employs a lightweight generator network to predict a set of fine-grained offsets O based on the content of the input feature map X. These offsets are added to a regular grid G to produce the final, dynamic sampling point set S=G+O. The grid_sample function then uses these dynamic points to sample values from the input feature map via bilinear interpolation, generating the high-resolution output. This dynamic, content-adaptive mechanism allows the network to learn the optimal way to reconstruct features for different inputs, effectively preserving the precise geometric shape and location information of small peel fragments. By mitigating the information loss inherent in static upsampling, DySample significantly enhances the quality of the feature maps provided to the detection head, directly improving the model's ability to detect small targets [29].
2.4. Adaptive Kernel Learning with ODConv2d
Standard convolutional layers utilize static kernels that are learned during training and remain fixed during inference. This static nature limits their ability to adapt to the wide variations in object appearance, scale, and lighting conditions commonly encountered in real-world scenes. While dynamic convolution methods like CondConv introduce input-dependent weights, they often focus on a single dimension of attention, constraining their expressive power [30,31,32,33,34].
To endow our model with a higher degree of adaptability, we replace the standard convolution operators at key cross-scale connection points with ODConv2d. As depicted in Figure 5 and Figure 6, ODConv2d revolutionizes the convolution operation by making the kernels dynamic across four orthogonal dimensions. For a given input tensor, ODConv2d learns four distinct attention scalars (α) that modulate the convolution operation in a complementary manner: a channel attention αc for the input channels, a spatial attention αs, a kernel attention αk across multiple base kernels, and an output channel attention αo.
The dynamic weight W is synthesized on-the-fly by taking a Hadamard product of the base kernels Wk with the spatial and kernel attentions. The final output Y is then produced by convolving the channel-attended input with the dynamic weight and applying the output attention. The complete operation is formulated as:
where denotes element-wise multiplication and we use K=4 base kernels. This multi-dimensional attention mechanism enables the convolutional kernel to adapt its receptive field and feature extraction strategy based on the specific content of the input. For our task, this means the model can learn to use different kernel configurations to detect a peel fragment on the edge of a taro versus one in the center, or adjust its sensitivity based on local shadows and reflections. This dramatically enhances the model's feature representation capabilities and its robustness to visual variations, all while maintaining a parameter count and computational cost comparable to a standard convolution.
2.5. Efficient Cross-Scale Integration with BiFPN_Concat2
Fusing features from different scales is essential for detecting objects of varying sizes. While Feature Pyramid Networks (FPN) provide a top-down pathway for feature fusion, their information flow is unidirectional. More advanced structures like the Bidirectional FPN (BiFPN), shown for context in Figure 7, introduce bidirectional information flow and learnable weights for more effective fusion, but a full implementation can be computationally intensive. For our lightweight model, a more efficient solution is required [35,36].
We propose BiFPN_Concat2, a simplified and ultra-lightweight module that borrows the core weighting concept from BiFPN without implementing its full complex topology. As shown in Figure 8, our module is designed for simplicity and efficiency. It takes two input feature maps, I1 and I2, from different pathways. It then learns a small, trainable scalar weight wi for each input. These weights are normalized using a fast approximation to ensure the fusion remains stable:
where ε is a small constant (e.g., 1×10⁻⁴) to prevent division by zero. Instead of performing a weighted sum, which can lead to information loss, our module concatenates the weighted features along the channel dimension:
This concatenation operation preserves all information from both input streams while still allowing the network to learn their relative importance via the learned weights. The resulting fused feature map is richer and more expressive. This heuristic, low-cost fusion strategy provides a tangible boost to the model's cross-scale representation capabilities with negligible computational overhead, making it an ideal fit for our efficiency-focused design.
2.6. Optimizing Bounding Box Regression with WIoU Loss
The choice of loss function is critical for training an accurate object detector, especially when dealing with challenging datasets. Standard Intersection over Union (IoU)-based loss functions often treat all training examples equally. In our scenario, the dataset is highly imbalanced, containing many easily classifiable background examples (e.g., well-peeled taro, conveyor belt) and a relatively small number of hard positive examples (the tiny residual peel fragments). A standard loss function can be dominated by the gradients from these easy examples, preventing the model from learning to precisely localize the small targets that are of primary interest [37,38,39,40,41].
To address this, we replace the default Complete IoU (CIoU) loss function in YOLOv8 with the WIoU v3 loss. WIoU introduces a dynamic, non-monotonic focusing mechanism that intelligently re-weights the loss based on the quality of the anchor box. The loss is defined as:
where and . The key component is the focusing coefficient, which is calculated based on the "outlierness" β of the anchor box.
This formulation has two key effects. First, for anchor boxes that have a good overlap with the ground truth (low outlierness), it down-weights the loss contribution from the IoU term, allowing the model to focus on refining the bounding box geometry without being penalized. Second, for anchor boxes with very poor overlap (high outlierness), it also dynamically reduces their gradient contribution. This prevents extreme outliers from generating excessively large gradients that could destabilize the training process. By intelligently prioritizing the "difficult but learnable" examples—the small, partially occluded peel fragments—WIoU v3 guides the model to learn more accurate and robust bounding box predictions for the targets of interest.
2.7. Improving Detection in Dense Scenes with Soft-NMS
A standard step in object detection post-processing is NMS, which eliminates redundant bounding box predictions. Traditional NMS is a greedy algorithm: for any set of overlapping boxes, it retains only the one with the highest confidence score and discards all others whose IoU with the top box exceeds a predefined threshold. While effective in sparse scenes, this aggressive approach is detrimental in crowded environments where multiple distinct objects are in close proximity. In our application, where peel fragments can be densely clustered, NMS can erroneously suppress valid detections, leading to a significant drop in recall (i.e., missed detections) [42,43].
To mitigate this problem, we replace the standard NMS algorithm with Soft-NMS during the inference stage. Unlike hard NMS, which sets the scores of overlapping boxes to zero, Soft-NMS applies a penalty that is a function of the overlap. As shown in Figure 9, for any bounding box bi that overlaps with the highest-scoring box M, its score si is decayed using a Gaussian function:
where σ is a parameter that controls the steepness of the penalty. This allows boxes that highly overlap with M to be penalized more heavily, while boxes with moderate overlap retain a reduced but non-zero score.
By gracefully decaying the scores instead of eliminating the boxes, Soft-NMS allows the model to retain multiple detections in dense regions. This is crucial for accurately identifying and counting all fragments in a cluster. This simple, one-line code change requires no model retraining and significantly improves recall in crowded scenes, making it an essential final component for robust performance in the target industrial environment.
3. Results
3.1. Experimental Setup
3.1.1. The TPID
A significant contribution of this research is the creation of a specialized dataset, the TPID (Taro Peel Industrial Dataset), which is essential for training and evaluating models for this specific industrial task. The data was collected from the taro deep-processing production line at Dongguan Deying Food Machinery Co., Ltd. Multiple industrial-grade network cameras with a resolution of 1920×1080 pixels were installed at key points along the conveyor system, capturing continuous video from both top-down and side-angle perspectives.
From this video footage, 282 unique static images were extracted. To address the limited size of the initial dataset and to enhance the model's robustness to real-world variations, a comprehensive set of data augmentation techniques was applied. These included horizontal flipping, random cropping, brightness and contrast adjustments, and slight rotations. This process expanded the dataset to a total of 1056 images. The augmented dataset was then randomly partitioned into training, validation, and test sets following a 7:2:1 ratio, resulting in 739 images for training, 212 for validation, and 105 for testing.
All images in the dataset were meticulously annotated using the open-source tool X-Anylabeling. This process yielded a total of 18,341 annotated instances of residual taro peel. The high density and quality of these annotations provide a reliable supervisory signal for training the model on fine-grained features. The dataset's key characteristics and challenges are summarized in Table 1, while a visualization of the dataset's characteristics, including instance counts and object size distribution, is provided in Figure 10. This dataset is particularly challenging due to the prevalence of small targets (<20 pixels), occlusions, complex background textures, and variable lighting, making it a robust benchmark for evaluating object detectors in realistic industrial settings.
3.1.2. Evaluation Metrics
To provide a comprehensive and quantitative assessment of model performance, we employ a standard set of evaluation metrics for object detection, along with metrics for computational efficiency.
-
Precision: Measures the accuracy of positive predictions. It is the ratio of true positives (TP) to the total number of predicted positives (TP + FP);Recall: Measures the model's ability to find all relevant instances. It is the ratio of TP to the total number of actual positives (TP + FN);
- mean Average Precision (mAP): The primary metric for evaluating object detection performance. The Average Precision (AP) for a single class is the area under the Precision-Recall curve. The mAP is the average of the AP values across all classes. In this study, since there is only one class ("peel fragment"), the AP and mAP are equivalent.
- Parameters (M): The total number of learnable parameters in the model, measured in millions. This is a key indicator of model size and memory footprint;
- GFLOPS: Giga Floating Point Operations Per Second. This metric quantifies the computational complexity of the model, indicating the number of multiply-add operations required for a single forward pass.
We report two variants of mAP:
- mAP@0.5: Calculated at a fixed Intersection over Union (IoU) threshold of 0.5. This metric is often used to evaluate general detection capability.
- mAP@0.5:0.95: The average of mAP values calculated over a range of IoU thresholds from 0.5 to 0.95 with a step of 0.05. This metric provides a more stringent evaluation of localization accuracy.
3.1.3. Implementation and Training Details
All experiments were conducted on a server running a Linux operating system, equipped with an NVIDIA A100-PCIE GPU with 40 GB of memory. The deep learning framework used was PyTorch 1.11, with CUDA 11.3 and Python 3.9.13. The model implementation was based on the Ultralytics library, version 8.3.18.
The models were trained for 200 epochs. We used the AdamW optimizer, which decouples weight decay from the gradient updates, with a momentum parameter of 0.9 and an initial learning rate of 0.002. A learning rate warm-up strategy was employed at the beginning of training. To manage GPU memory and ensure stable training, a batch size of 32 and 16 worker threads were used. Input images were resized to 640×640 pixels. To prevent overfitting and enhance generalization, a weight decay coefficient of 0.0005 was applied. The convergence and learning dynamics of the model throughout the training process are visualized in Figure 11, which plots the mAP metric over the 200 epochs.
3.2. Ablation Studies
To systematically deconstruct the MDB-YOLO architecture and rigorously quantify the contribution of each proposed component, a comprehensive series of ablation experiments was conducted on the TPID validation set. This methodical approach, detailed in Table 2, begins with the YOLOv8s model as a baseline (Model 1) and incrementally integrates each innovation. This allows for a precise analysis of each module's individual impact and its synergistic interactions within the network. The training dynamics for all seven experimental models, visualized in Figure 12, demonstrate stable and consistent convergence over 200 epochs, providing a solid foundation for the subsequent quantitative analysis.
The baseline model, an unmodified YOLOv8s architecture, establishes a strong but generic performance benchmark. It achieves a mAP@0.5 of 90.8% and a mAP@0.5:0.95 of 65.7%, with a parameter count of 11.14M and a computational load of 28.6 GFLOPS. While effective for general-purpose object detection, its performance on the specialized TPID dataset highlights the necessity for targeted optimizations to address the unique challenges of detecting small, low-contrast industrial defects.
The initial enhancement stage (Model 2) integrates two distinct components: the C2f_EMA module for feature perception and the WIoU loss function for training optimization. This combination results in a 0.6 percentage point increase in mAP@0.5 to 91.4%, with a negligible change in computational cost. The C2f_EMA module embeds the Efficient Multi-Scale Attention (EMA) mechanism, which utilizes parallel convolutional pathways to capture both local cross-channel interactions and broader spatial context. This empowers the model to focus on the subtle textural patterns of peel fragments while suppressing distracting background noise. Concurrently, the WIoU v3 loss function introduces a dynamic, non-monotonic focusing mechanism. Instead of treating all training examples equally, WIoU uses the "outlierness" of an anchor box to intelligently allocate gradient gains, prioritizing the "ordinary-quality" anchor boxes where the most productive learning occurs. This synergy is critical: EMA provides cleaner, more discriminative features, while WIoU ensures the model learns to utilize these features more effectively for precise bounding box regression.
The integration of the DySample module in Model 3 addresses the critical issue of information loss during feature upsampling. This modification elevates mAP@0.5 to 91.6% and, more importantly, recovers and surpasses the baseline mAP@0.5:0.95, reaching 65.8%. Conventional upsampling methods like nearest-neighbor interpolation are content-agnostic and often introduce artifacts that degrade the features of small objects. DySample reframes the task as "learning to sample," employing a lightweight generator to predict content-aware spatial offsets for sampling points. This dynamic mechanism preserves the precise geometric details of small, irregularly shaped peel fragments that are typically lost, directly improving the model's localization accuracy, as validated by the significant recovery in the stricter mAP@0.5:0.95 metric.
In Model 4, the introduction of the BiFPN_Concat2 module, intended to enhance multi-scale feature fusion, led to an unexpected and scientifically valuable performance regression. The mAP@0.5 dropped by 0.9 points to 90.7%, and mAP@0.5:0.95 fell to 65.4%. This anomalous result contradicts the initial hypothesis that all advanced modules would contribute positively and highlights the non-linear complexities of neural network design. While BiFPN architectures are engineered for efficient, weighted, bidirectional feature fusion , its integration in this specific context proved detrimental. One plausible explanation is a phenomenon of "feature detail annihilation." The high-fidelity, high-frequency details preserved by DySample may have been inadvertently smoothed or averaged out by BiFPN's aggressive feature aggregation logic, which is not optimized for such inputs. Another possibility is a negative synergy, where the simple scalar weights learned by our BiFPN_Concat2 module were insufficient to properly balance the dynamically generated features from DySample with features from other pathways, leading to a suboptimal fusion. This result underscores the critical necessity of rigorous, step-by-step empirical validation over theoretical assumptions.
Model 5 demonstrates the profound impact of post-processing optimization by replacing the standard greedy NMS with Soft-NMS. This change, which requires no architectural modification or retraining, resulted in a modest recovery of mAP@0.5 to 90.9% but a dramatic 3.2 percentage point leap in mAP@0.5:0.95 to 68.6%. Greedy NMS aggressively discards any bounding box whose IoU with a higher-scoring box exceeds a predefined threshold—an approach that is highly detrimental in scenes with densely clustered objects, such as the taro peel fragments in this study. Soft-NMS, in contrast, applies a Gaussian decay function to the confidence scores of overlapping boxes instead of eliminating them entirely. The disproportionately large gain in the mAP@0.5:0.95 metric is highly informative; it reveals that the model was already capable of generating multiple, accurately localized predictions within dense clusters, but the greedy NMS algorithm was erroneously suppressing these valid detections. This powerfully confirms that dense clustering is a key challenge of the TPID dataset and that improving recall in such scenarios was a primary performance bottleneck.
The final architectural enhancement, the integration of ODConv2d in Model 6, boosted mAP@0.5 to 91.2%. ODConv2d (Omni-Dimensional Dynamic Convolution) is a generalized form of dynamic convolution that employs a multi-dimensional attention mechanism to learn four complementary types of attention weights for its kernels. This allows the kernels to adapt to input features along all four dimensions of the kernel space: spatial, input channel, output channel, and the number of kernels. This enhanced, context-specific feature extraction capability improves the model's robustness to the wide visual variations encountered in industrial environments, such as inconsistent lighting and reflections. This improvement came with a 2.24M increase in parameters, though interestingly, the GFLOPS slightly decreased.
The final MDB-YOLO model (Model 7) was achieved by applying fine-grained hyperparameter tuning to the architecture of Model 6, successfully harmonizing all integrated components. This last optimization step pushed performance to its peak, reaching a mAP@0.5 of 92.1% and a mAP@0.5:0.95 of 69.7%. This represents a total improvement of 1.3 percentage points in mAP@0.5 and a substantial 4.0 percentage point gain in mAP@0.5:0.95 compared to the YOLOv8s baseline. These significant accuracy gains were realized with only a modest 20.6% increase in parameters and a slight decrease in GFLOPS, confirming that the proposed architectural enhancements deliver a highly effective and efficient solution that strikes an optimal balance between performance and computational cost. A direct comparison between the baseline (Model 1) and the final MDB-YOLO (Model 7) is presented in Figure 13. These curves clearly illustrate the substantial and consistent performance advantage of MDB-YOLO across all four key metrics, with the most pronounced gains visible in mAP@0.5:0.95 and Recall, underscoring the final model's superior localization precision and its enhanced ability to identify all relevant targets.
3.3. Comparative Analysis with SOTA Models
To contextualize the performance of MDB-YOLO within the broader landscape of contemporary object detectors, a rigorous comparative benchmark was conducted. MDB-YOLO was evaluated against the original YOLOv8s baseline and two other prominent state-of-the-art (SOTA) models: YOLOv9-C, a recent evolution in the YOLO series, and the transformer-based RT-DETR-L. To ensure a fair and direct comparison, all models were trained from scratch and subsequently evaluated on the TPID test set under identical experimental conditions. This analysis is centered on the critical trade-off between detection accuracy and computational efficiency, as this balance is the most important factor for determining feasibility and value in real-world, resource-constrained industrial deployment scenarios. The comprehensive results of this benchmark are summarized in Table 3. The performance gap in the key mAP metrics is visually represented in Figure 14 and Figure 15.
The accuracy metrics presented in Table 3 unequivocally establish MDB-YOLO's competitive and, in several key aspects, superior detection performance on the specialized TPID dataset. In terms of mAP@0.5, our proposed model achieves a score of 92.1%, placing it on par with the much larger and more computationally intensive RT-DETR-L model and notably ahead of YOLOv9-C (+1.2%). When evaluated using the more stringent mAP@0.5:0.95 metric, which demands higher localization precision, MDB-YOLO achieves the highest score among all tested models at 69.7%. This surpasses both YOLOv9-C (68.3%) and RT-DETR-L (67.6%), demonstrating that our model's specialized architecture provides not only superior detection but also the most precise bounding box localization. Furthermore, MDB-YOLO delivers the highest recall rate of 88.0% among all competitors, a crucial metric for industrial quality control where minimizing missed defects (false negatives) is paramount.
While the accuracy metrics are impressive, the analysis of computational efficiency reveals the most compelling advantage of the MDB-YOLO architecture. With a parameter count of 13.44M and a computational load of 28.4 GFLOPS, our model is only marginally more complex than the YOLOv8s baseline. In stark contrast, YOLOv9-C and RT-DETR-L are substantially heavier, requiring up to 2.4 times the parameters and 3.8 times the GFLOPS. This efficiency translates directly into unparalleled inference speed. MDB-YOLO processes an image in just 2.0 ms, which is 70% faster than its own baseline and more than 3.6 times faster than both YOLOv9-C and RT-DETR-L. This speed is a critical differentiator for high-throughput industrial applications where real-time processing is non-negotiable.
The comparative analysis culminates in a clear conclusion: MDB-YOLO successfully redefines the accuracy-efficiency frontier for this specialized industrial task. It delivers state-of-the-art accuracy, matching the general detection capability of the heavyweight RT-DETR-L and surpassing all competitors in the more demanding high-precision metric, all without the massive computational burden of contemporary detectors. This exceptional performance profile is not an accident but a direct result of a design philosophy that prioritized efficiency alongside accuracy. The ability to provide top-tier accuracy at a fraction of the computational cost and with more than triple the inference speed of its competitors makes MDB-YOLO a far more pragmatic and economically viable solution for large-scale deployment on affordable edge hardware. This advantage lowers the barrier to entry for small and medium-sized enterprises to adopt advanced AI-based quality control, potentially leading to widespread improvements in food safety and production efficiency. Finally, the stable and consistent convergence observed during training (visualized in Figure 14 and Figure 15) indicates a model that is not only highly performant at inference but also robust and efficient to train, further solidifying its suitability for the rigorous demands of real-time industrial object detection.
3.4. Qualitative and Visual Analysis
To provide an intuitive understanding of the performance improvements offered by MDB-YOLO, we present a qualitative analysis of its detection results on challenging images from the test set. Figure 16 and Figure 17 show a side-by-side comparison between the predictions of the baseline YOLOv8s model and our proposed MDB-YOLO.
In these examples, the images contain numerous small, low-contrast, and partially occluded peel fragments, representing the most difficult cases for an automated system. The baseline YOLOv8s model is observed to miss several of these challenging instances, particularly those that are very small or blend in with the background texture of the conveyor belt.
In contrast, the MDB-YOLO model demonstrates a markedly superior detection capability. It successfully identifies nearly all the peel fragments that were missed by the baseline, including those in dense clusters and those with very subtle visual cues. The bounding boxes generated by MDB-YOLO are accurate and tightly enclose the target objects. This visual evidence powerfully corroborates the quantitative results from the ablation and comparative studies, highlighting the real-world effectiveness of the architectural and methodological innovations integrated into MDB-YOLO. The model's enhanced sensitivity to small targets and its robustness to background clutter are clearly visible, confirming its suitability for this demanding industrial inspection task.
4. Discussion
The empirical results demonstrate that MDB-YOLO's success is not due to a single component but to the orchestrated synergy of its integrated modules. The process begins at the feature level, where DySample provides high-fidelity, content-aware upsampling to preserve the fine-grained details of small targets. The C2f_EMA and ODConv2d modules then operate on these enhanced feature maps, with C2f_EMA selectively focusing on salient regions and ODConv2d providing unprecedented kernel adaptability to match the visual characteristics of the input. During training, the WIoU loss function guides the system to focus its learning capacity on challenging examples, while in post-processing, Soft-NMS ensures that this enhanced detection capability is not undermined by the aggressive suppression of valid boxes in dense scenes. The ablation study also revealed a crucial insight: the integration of BiFPN_Concat2 led to an anomalous performance dip, underscoring that even theoretically superior components can underperform without proper architectural synergy and validating the necessity of rigorous, step-by-step empirical testing.
A central theme of this research is the optimization of the accuracy-efficiency frontier for industrial deployment. MDB-YOLO was explicitly designed to occupy the "sweet spot" on this frontier. The comparative analysis validates this position perfectly. MDB-YOLO achieves state-of-the-art accuracy, matching the mAP@0.5 of the much larger RT-DETR-L and, more importantly, surpassing all competitors with a mAP@0.5:0.95 of 69.7%. This superior performance is achieved with a fraction of the computational budget. With only 13.44M parameters and 28.4 GFLOPS, MDB-YOLO is dramatically more efficient than models like YOLOv9-C (25.53M, 103.7 GFLOPS) and RT-DETR-L (32.87M, 108.0 GFLOPS). This efficiency translates to a 2.0 ms inference time, making it over 3.6 times faster than its high-accuracy competitors. MDB-YOLO is not simply a high-performing model; it is the right model for the application, delivering the required accuracy at a speed and cost that makes large-scale, real-time deployment feasible.
The successful validation of MDB-YOLO carries significant practical implications, particularly for the food processing industry, by enabling automation that can lower labor costs, increase throughput, and enhance final product quality. Beyond taro peeling, the architectural principles—combining efficient attention, dynamic upsampling, adaptive convolutions, and intelligent training strategies—provide a powerful, extensible framework for other small, low-contrast defect detection tasks in agriculture and manufacturing. However, it is important to acknowledge that the model was validated on a dataset from a single facility; future work should test its generalization on data from varied environments. Promising research directions include model compression (e.g., pruning, quantization) for deployment on even more resource-constrained devices, expanding the model for multi-class defect detection, and integrating it into a closed-loop, robotic "detect-and-remove" system for full automation.
5. Conclusions
This paper addressed the significant industrial challenge of detecting small, low-contrast residual peel fragments in automated taro processing, a task for which standard object detectors are often ill-equipped. To overcome these limitations, we proposed MDB-YOLO, a lightweight yet powerful object detection model that builds upon the YOLOv8 framework with several synergistic innovations. Through targeted enhancements—including the C2f_EMA attention module, DySample dynamic upsampling, ODConv2d adaptive convolution, WIoU loss, and Soft-NMS—MDB-YOLO is specifically engineered to excel at small-target detection in complex industrial environments. Our extensive experiments, conducted on a custom-built Taro Peel Industrial Dataset (TPID), validated the efficacy of our approach. The ablation study confirmed the contribution of each component, and the comparative analysis demonstrated that MDB-YOLO achieves a state-of-the-art balance between accuracy and efficiency. It achieves a mAP@0.5 of 92.1% and a leading mAP@0.5:0.95 of 69.7%, all while maintaining a minimal computational footprint and a superior inference speed of 2.0 ms. Ultimately, MDB-YOLO stands as a robust, practical, and effective solution poised to advance the state of automated quality control in the food processing industry.
Author Contributions
Conceptualization, H.S.; methodology, X.F.; software, L.Y. and Y.Z.; validation, X.Y.; formal analysis, L.Y.; investigation, L.Y., X.F. and W.G.; resources, W.G.; data curation, X.F.; writing—original draft preparation, L.Y.; writing—review and editing, X.Y. and H.S.; visualization, Y.Z.; supervision, Y.T., X.L. and C.S.; project administration, X.Z.; funding acquisition, C.S. All authors have read and agreed to the published version of the manuscript.
Funding
This research was funded by Guangdong University of Science and Technology, grant number GKY-2024KYZDK-13 and the Department of Education of Guangdong Province, grant numbers 2023ZDZX3049 and 2024KTSCX189.
Conflicts of Interest
The authors declare no conflicts of interest.
Abbreviations
The following abbreviations are used in this manuscript:
| MDB-YOLO | Multi-Dimensional Bionic YOLO |
| DySample | Dynamic Upsampling |
| ODConv2d | Omni-Dimensional Dynamic Convolution |
| WIoU | Wise-IoU |
| TPID | Taro Peel Industrial Dataset |
| FDA | Food and Drug Administration |
| EFSA | European Food Safety Authority |
| AI | Artificial intelligence |
| YOLO | You Only Look Once |
| SOTA | State-of-the-art |
| NMS | Non-Maximum Suppression |
| SE | Squeeze-and-Excitation |
| EMA | Efficient Multi-Scale Attention |
| FPN | Feature Pyramid Networks |
| BiFPN | Bidirectional FPN |
| CIoU | Complete IoU |
| TP | True positive |
| AP | Average Precision |
| mAP | mean Average Precision |
References
- World Health Organization. WHO global strategy for food safety 2022-2030: Towards stronger food safety systems and global cooperation; World Health Organization: Geneva, Switzerland, 2022. [Google Scholar]
- Wani, N.R.; Rather, R.A.; Farooq, A.; et al. New insights in food security and environmental sustainability through waste food management. Environ. Sci. Pollut. Res. 2024, 31, 17835–17857. [Google Scholar] [CrossRef] [PubMed]
- Deeba, K.; Shankar, K.C.P.; Gnanavel, S.; et al. Artificial intelligence, computer vision, and robotics for industry 5.0. In Next Generation Data Science and Blockchain Technology for Industry 5.0: Concepts and Paradigms; Tyagi, A.K., Ed.; CRC Press: Boca Raton, FL, USA, 2025; pp. 295–324. [Google Scholar]
- Chhetri, K.B. Applications of artificial intelligence and machine learning in food quality control and safety assessment. Food Eng. Rev. 2024, 16, 1–21. [Google Scholar] [CrossRef]
- Roy, N.; Mukherjee, S.; Singh, S.; Singh, V.K.; Kumar, R. Root and tuber crops and their role in global food security. In Sustainable Production of Root and Tuber Crops; Kumar, R., Lal, M.K., Tiwari, R.K., Singh, B., Eds.; Routledge: London, UK, 2025; pp. 11–26. [Google Scholar]
- Thiele, G.; Friedmann, M.; Campos, H.; Polar, V.; Bentley, J. Root, tuber and banana food system innovations: Value creation for inclusive outcomes; Springer Nature: Cham, Switzerland, 2022. [Google Scholar]
- Tadesse, B.; Gebeyehu, S.; Kirui, L.; Maru, J. The contribution of potato to food security, income generation, employment, and the national economy of Ethiopia. Potato Res. 2025, in press. [Google Scholar]
- Mann, S.; Dixit, A.K.; Shrivastav, A. Development and performance optimization of a taro (Colocasia esculenta) peeling machine for enhanced efficiency in small-scale farming. Sci. Rep. 2025, 15, 11336. [Google Scholar] [CrossRef]
- Yu, K.; Zhong, M.; Zhu, W.; Rashid, A.; Han, R.; Virk, M.S.; Duan, K.; Zhao, Y.; Ren, X. Advances in computer vision and spectroscopy techniques for non-destructive quality assessment of citrus fruits: A comprehensive review. Foods 2025, 14, 386. [Google Scholar] [CrossRef]
- Kim, Y.A.; Kim, S.W.; Lee, M.H.; Lee, H.K.; Hwang, I.H. Erratum to: Comparisons of chemical composition, flavor and bioactive substances between Korean and imported velvet antler extracts. Food Sci. Anim. Resour. 2021, 41, 748. [Google Scholar] [CrossRef]
- Sun, D.W. Computer vision technology for food quality evaluation, 1st ed.; Academic Press: Amsterdam, The Netherlands, 2016. [Google Scholar]
- Anjali; Kumar, N. ; Nema, P.K. State-of-the-art non-destructive approaches for maturity index determination in fruits and vegetables: Principles, applications, and future directions. Food Prod. Process. Nutr. 2024, 6, 56. [Google Scholar] [CrossRef]
- Lin, Y.; Ma, J.; Wang, Q.; et al. Applications of machine learning techniques for enhancing nondestructive food quality and safety detection. Crit. Rev. Food Sci. Nutr. 2023, 63, 1649–1669. [Google Scholar] [CrossRef] [PubMed]
- Liu, Z.; Wang, S.; Zhang, Y.; et al. Artificial intelligence in food safety: A decade review and bibliometric analysis. Foods 2023, 12, 1242. [Google Scholar] [CrossRef]
- Tamasiga, P.; Onyeaka, H.; Bakwena, M.; et al. Forecasting disruptions in global food value chains to tackle food insecurity: The role of AI and big data analytics–A bibliometric and scientometric analysis. J. Agric. Food Res. 2023, 14, 100819. [Google Scholar] [CrossRef]
- Rahman, A.; Raj, A.; Tomy, P.; et al. A comprehensive bibliometric and content analysis of artificial intelligence in language learning: Tracing between the years 2017 and 2023. Artif. Intell. Rev. 2024, 57, 107. [Google Scholar] [CrossRef]
- Kale, R.S.; Shitole, S. Non-destructive fruit quality assessment: a review on emerging trends in thermal imaging technology. J. Comput. Anal. Appl. 2024, 33, 118–132. [Google Scholar]
- Fracarolli, J.A.; de Matos, L.M.; Santos, T.T.; et al. Computer vision applied to food and agricultural products. Rev. Ciênc. Agron. 2020, 51, e20207749. [Google Scholar] [CrossRef]
- Wang, C.Y.; Yeh, I.H.; Liao, H.Y.M. Yolov9: Learning what you want to learn using programmable gradient information. In Proceedings of the Computer Vision – ECCV 2024, Cham, Switzerland; 2024. [Google Scholar]
- Sharma, A.; Kumar, V.; Longchamps, L. Comparative performance of YOLOv8, YOLOv9, YOLOv10, and Faster R-CNN models for detection of multiple weed species. Smart Agric. Technol. 2024, 9, 100648. [Google Scholar] [CrossRef]
- Zhou, C.; Li, Y.; Wang, H.; et al. A comprehensive survey on pretrained foundation models: A history from bert to chatgpt. Int. J. Mach. Learn. Cybern. 2024, 1–65. [Google Scholar] [CrossRef]
- Zhu, J.; Hu, T.; Zheng, L.; et al. YOLOv8-C2f-Faster-EMA: An improved underwater trash detection model based on YOLOv8. Sensors 2024, 24, 2483. [Google Scholar] [CrossRef]
- Wang, J.; Meng, R.; Huang, Y.; et al. Road defect detection based on improved YOLOv8s model. Sci. Rep. 2024, 14, 16758. [Google Scholar] [CrossRef]
- Zhu, J.; Hu, T.; Zheng, L.; et al. YOLOv8-C2f-Faster-EMA: an improved underwater trash detection model based on YOLOv8. Sensors 2024, 24, 2483. [Google Scholar] [CrossRef] [PubMed]
- Ouyang, D.; Zhang, H.; Zhang, Y.; et al. Efficient multi-scale attention module with cross-spatial learning. In Proceedings of the ICASSP 2023 - 2023 IEEE International Conference on Acoustics, Speech and Signal Processing (ICASSP), Rhodes Island, Greece, 4-10 June 2023. [Google Scholar]
- Li, J.; Wang, B.; Liu, Z.; et al. CAMFv2: Better, faster and stronger for electrochemiluminescence image denoising. Appl. Intell. 2025, 55, 779–795. [Google Scholar] [CrossRef]
- Liu, W.; Tang, Z.; Han, G.; et al. Learning to upsample by learning to sample. In Proceedings of the IEEE/CVF International Conference on Computer Vision, Paris, France, 2-6 October 2023; pp. 6176–6186. [Google Scholar]
- Xi, Y.; Qu, D.; Du, L. DDM-YOLOv8s for Small Object Detection in Remote Sensing Images. In Proceedings of the 2024 7th International Conference on Machine Learning and Natural Language Processing (MLNLP), Singapore, 23-25 February 2024. [Google Scholar]
- Wang, H.; Gao, Y.; Yang, Z.; et al. Precision and speed: LSOD-YOLO for lightweight small object detection. Expert Syst. Appl. 2025, 269, 126440. [Google Scholar] [CrossRef]
- Li, C.; Zhou, A.; Yao, A. Omni-dimensional dynamic convolution. arXiv 2022, arXiv:2209.07947. [Google Scholar] [CrossRef]
- Gao, W.; Wen, P.; Wang, Y.; et al. ODCS-YOLO detection algorithm for rail surface defects based on omni-dimensional dynamic convolution and context augmentation module. Meas. Sci. Technol. 2024, 35, 106006. [Google Scholar] [CrossRef]
- Zhang, Z.; Geng, X.; Liu, H.; et al. TDR-Model: Tomato disease recognition based on image dehazing and improved MobileNetV3 model. IEEE Access 2024, 12, 74363–74373. [Google Scholar] [CrossRef]
- Long, Y.; Yang, Y.; Hu, J.; et al. Operating mechanism detection in aluminum electrolysis workshops via YOLOv8-MIE. IEEE Trans. Instrum. Meas. 2025, 74, 4501211. [Google Scholar] [CrossRef]
- Lei, T.; Zhang, D.; Du, X.; et al. Semi-supervised medical image segmentation using adversarial consistency learning and dynamic convolution network. IEEE Trans. Med. Imaging 2023, 42, 1265–1277. [Google Scholar] [CrossRef]
- Tang, X.; Wu, S.; Wang, J.; et al. Enhancing multilevel tea leaf recognition based on improved YOLOv8n. Front. Plant Sci. 2025, 16, 1540670. [Google Scholar] [CrossRef]
- Xiao, H.; Tian, K.; Wang, K.; et al. YOSBG: UAV image data-driven high-throughput field tobacco leaf counting method. arXiv 2023, arXiv:2308.08643. [Google Scholar]
- Tong, Z.; Chen, Y.; Xu, Y.; et al. Wise-IoU: Bounding box regression loss with dynamic focusing mechanism. arXiv 2023, arXiv:2301.10051. [Google Scholar]
- Zhang, Y.; Wu, C.; Zhang, T.; et al. Full-scale feature aggregation and grouping feature reconstruction-based UAV image target detection. IEEE Trans. Geosci. Remote Sens. 2024, 62, 1–11. [Google Scholar] [CrossRef]
- Tang, X.; Zhang, J.; Xia, Y.; et al. DBW-YOLO: A high-precision SAR ship detection method for complex environments. IEEE J. Sel. Top. Appl. Earth Obs. Remote Sens. 2024, 17, 7029–7039. [Google Scholar] [CrossRef]
- Zhou, W.; Li, C.; Ye, Z.; et al. An efficient tiny defect detection method for PCB with improved YOLO through a compression training strategy. IEEE Trans. Instrum. Meas. 2024, 73, 1–14. [Google Scholar] [CrossRef]
- Pan, L.; Diao, J.; Wang, Z.; et al. Hf-yolo: Advanced pedestrian detection model with feature fusion and imbalance resolution. Neural Process. Lett. 2024, 56, 90. [Google Scholar] [CrossRef]
- Noh, K.; Jeon, J.; Baek, S.; et al. Enhancing object detection in dense images: Adjustable non-maximum suppression for single-class detection. IEEE Access 2024, 12, 62963–62976. [Google Scholar] [CrossRef]
- Chen, F.; Chen, X.; Xu, Y.; et al. Soft-NMS-enabled YOLOv5 with SIOU for small water surface floater detection in UAV-captured images. Sustainability 2023, 15, 10751. [Google Scholar] [CrossRef]
- Alif, M.A.R.; Hussain, M. YOLOv1 to YOLOv10: A comprehensive review of YOLO variants and their application in the agricultural domain. arXiv 2024, arXiv:2406.10139. [Google Scholar] [CrossRef]
- Chen, J.; Er, M.J. Dynamic YOLO for small underwater object detection. Artif. Intell. Rev. 2024, 57, 165. [Google Scholar] [CrossRef]
- Filho, E.V.; da Silva, L.A.P.P.; de Aguiar, A.P.; et al. Computer vision as a tool to support quality control and robotic handling of fruit: A case study. Appl. Sci. 2024, 14, 9727. [Google Scholar] [CrossRef]
- Kumar, P.; Chang, T.H.; Zhong, Z.G.; et al. Enhanced activity detection in mechanical robot-dog using dynamic strain-based FBG sensors and YOLO-v7. IEEE Sens. J. 2025, 25, 1807–1817. [Google Scholar] [CrossRef]
- Liu, H.; Li, D.; Jiang, B.; et al. MGBM-YOLO: a faster light-weight object detection model for robotic grasping of bolster spring based on image-based visual servoing. J. Intell. Robot. Syst. 2022, 104, 77. [Google Scholar] [CrossRef]
- Mei, Z.; Li, Y.; Zhu, R.; et al. Intelligent fruit localization and grasping method based on YOLO VX model and 3D vision. Agriculture 2025, 15, 1508. [Google Scholar] [CrossRef]
- Chen, W.; Zhang, J.; Guo, B.; et al. An apple detection method based on Des-YOLO v4 algorithm for harvesting robots in complex environment. Math. Probl. Eng. 2021, 2021, 7351470. [Google Scholar] [CrossRef]
Figure 1.
The architecture of the proposed MDB-YOLO model.
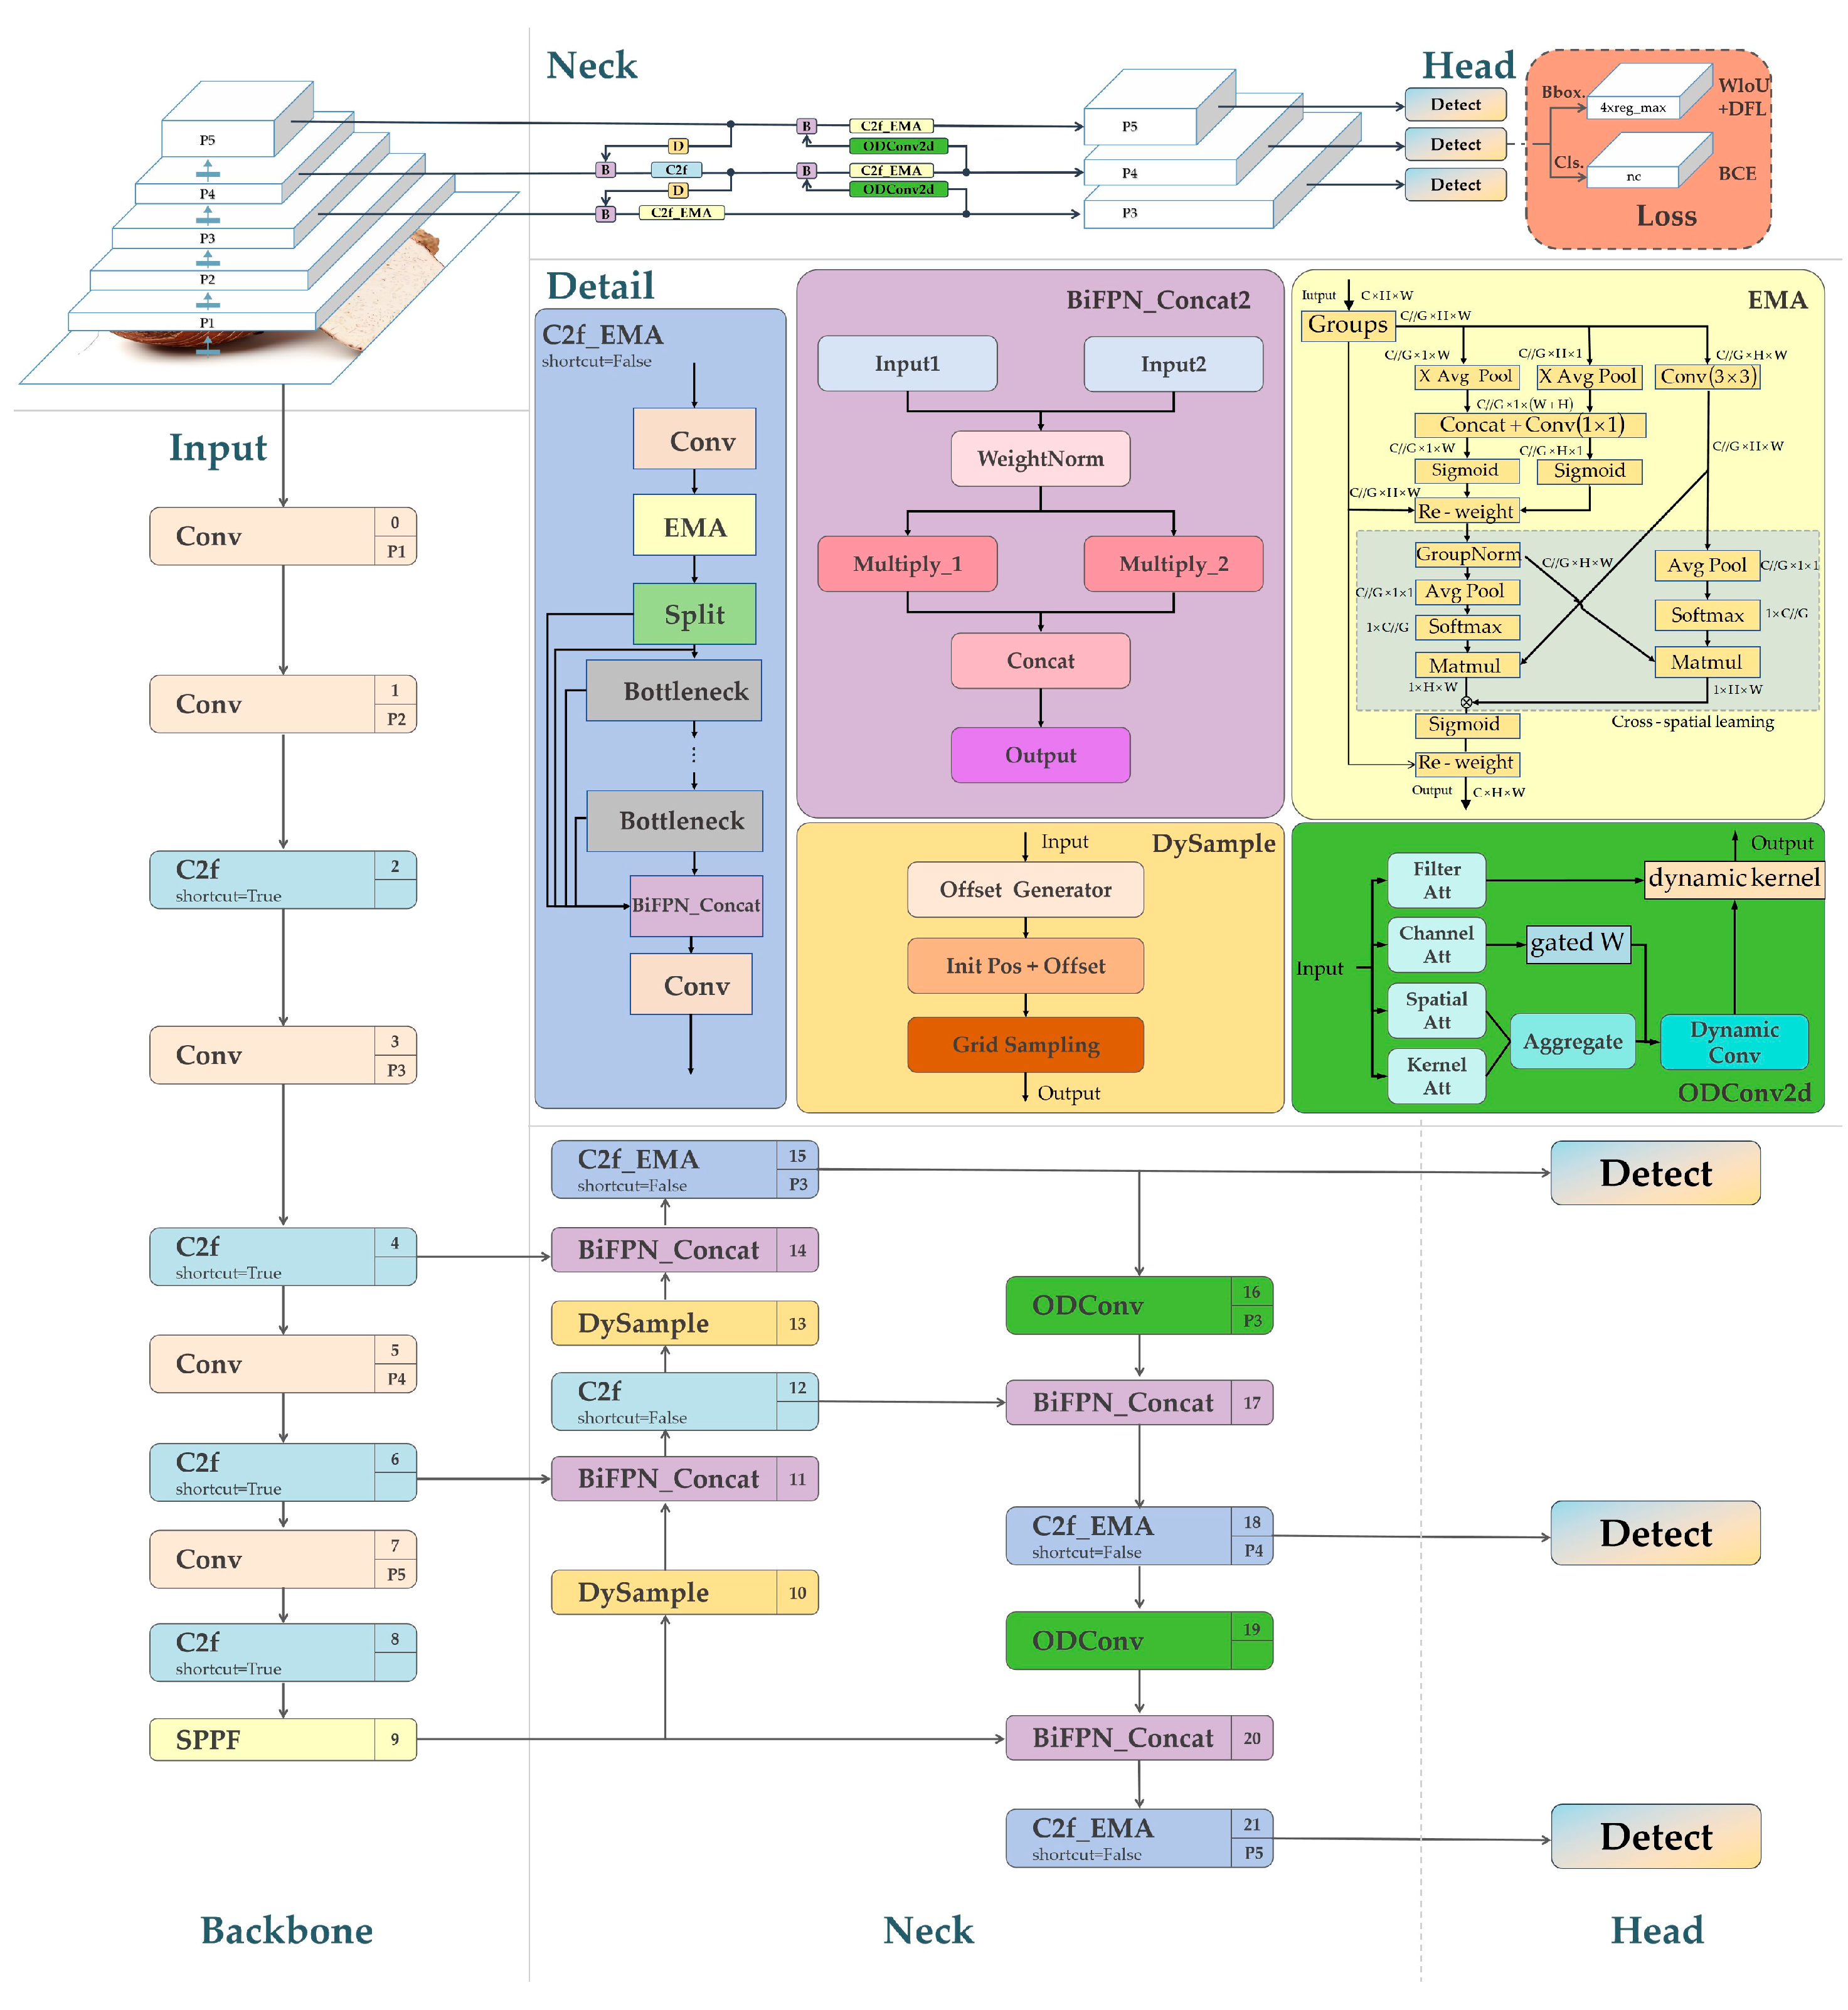
Figure 2.
This is a figure. Schemes follow the same formatting.
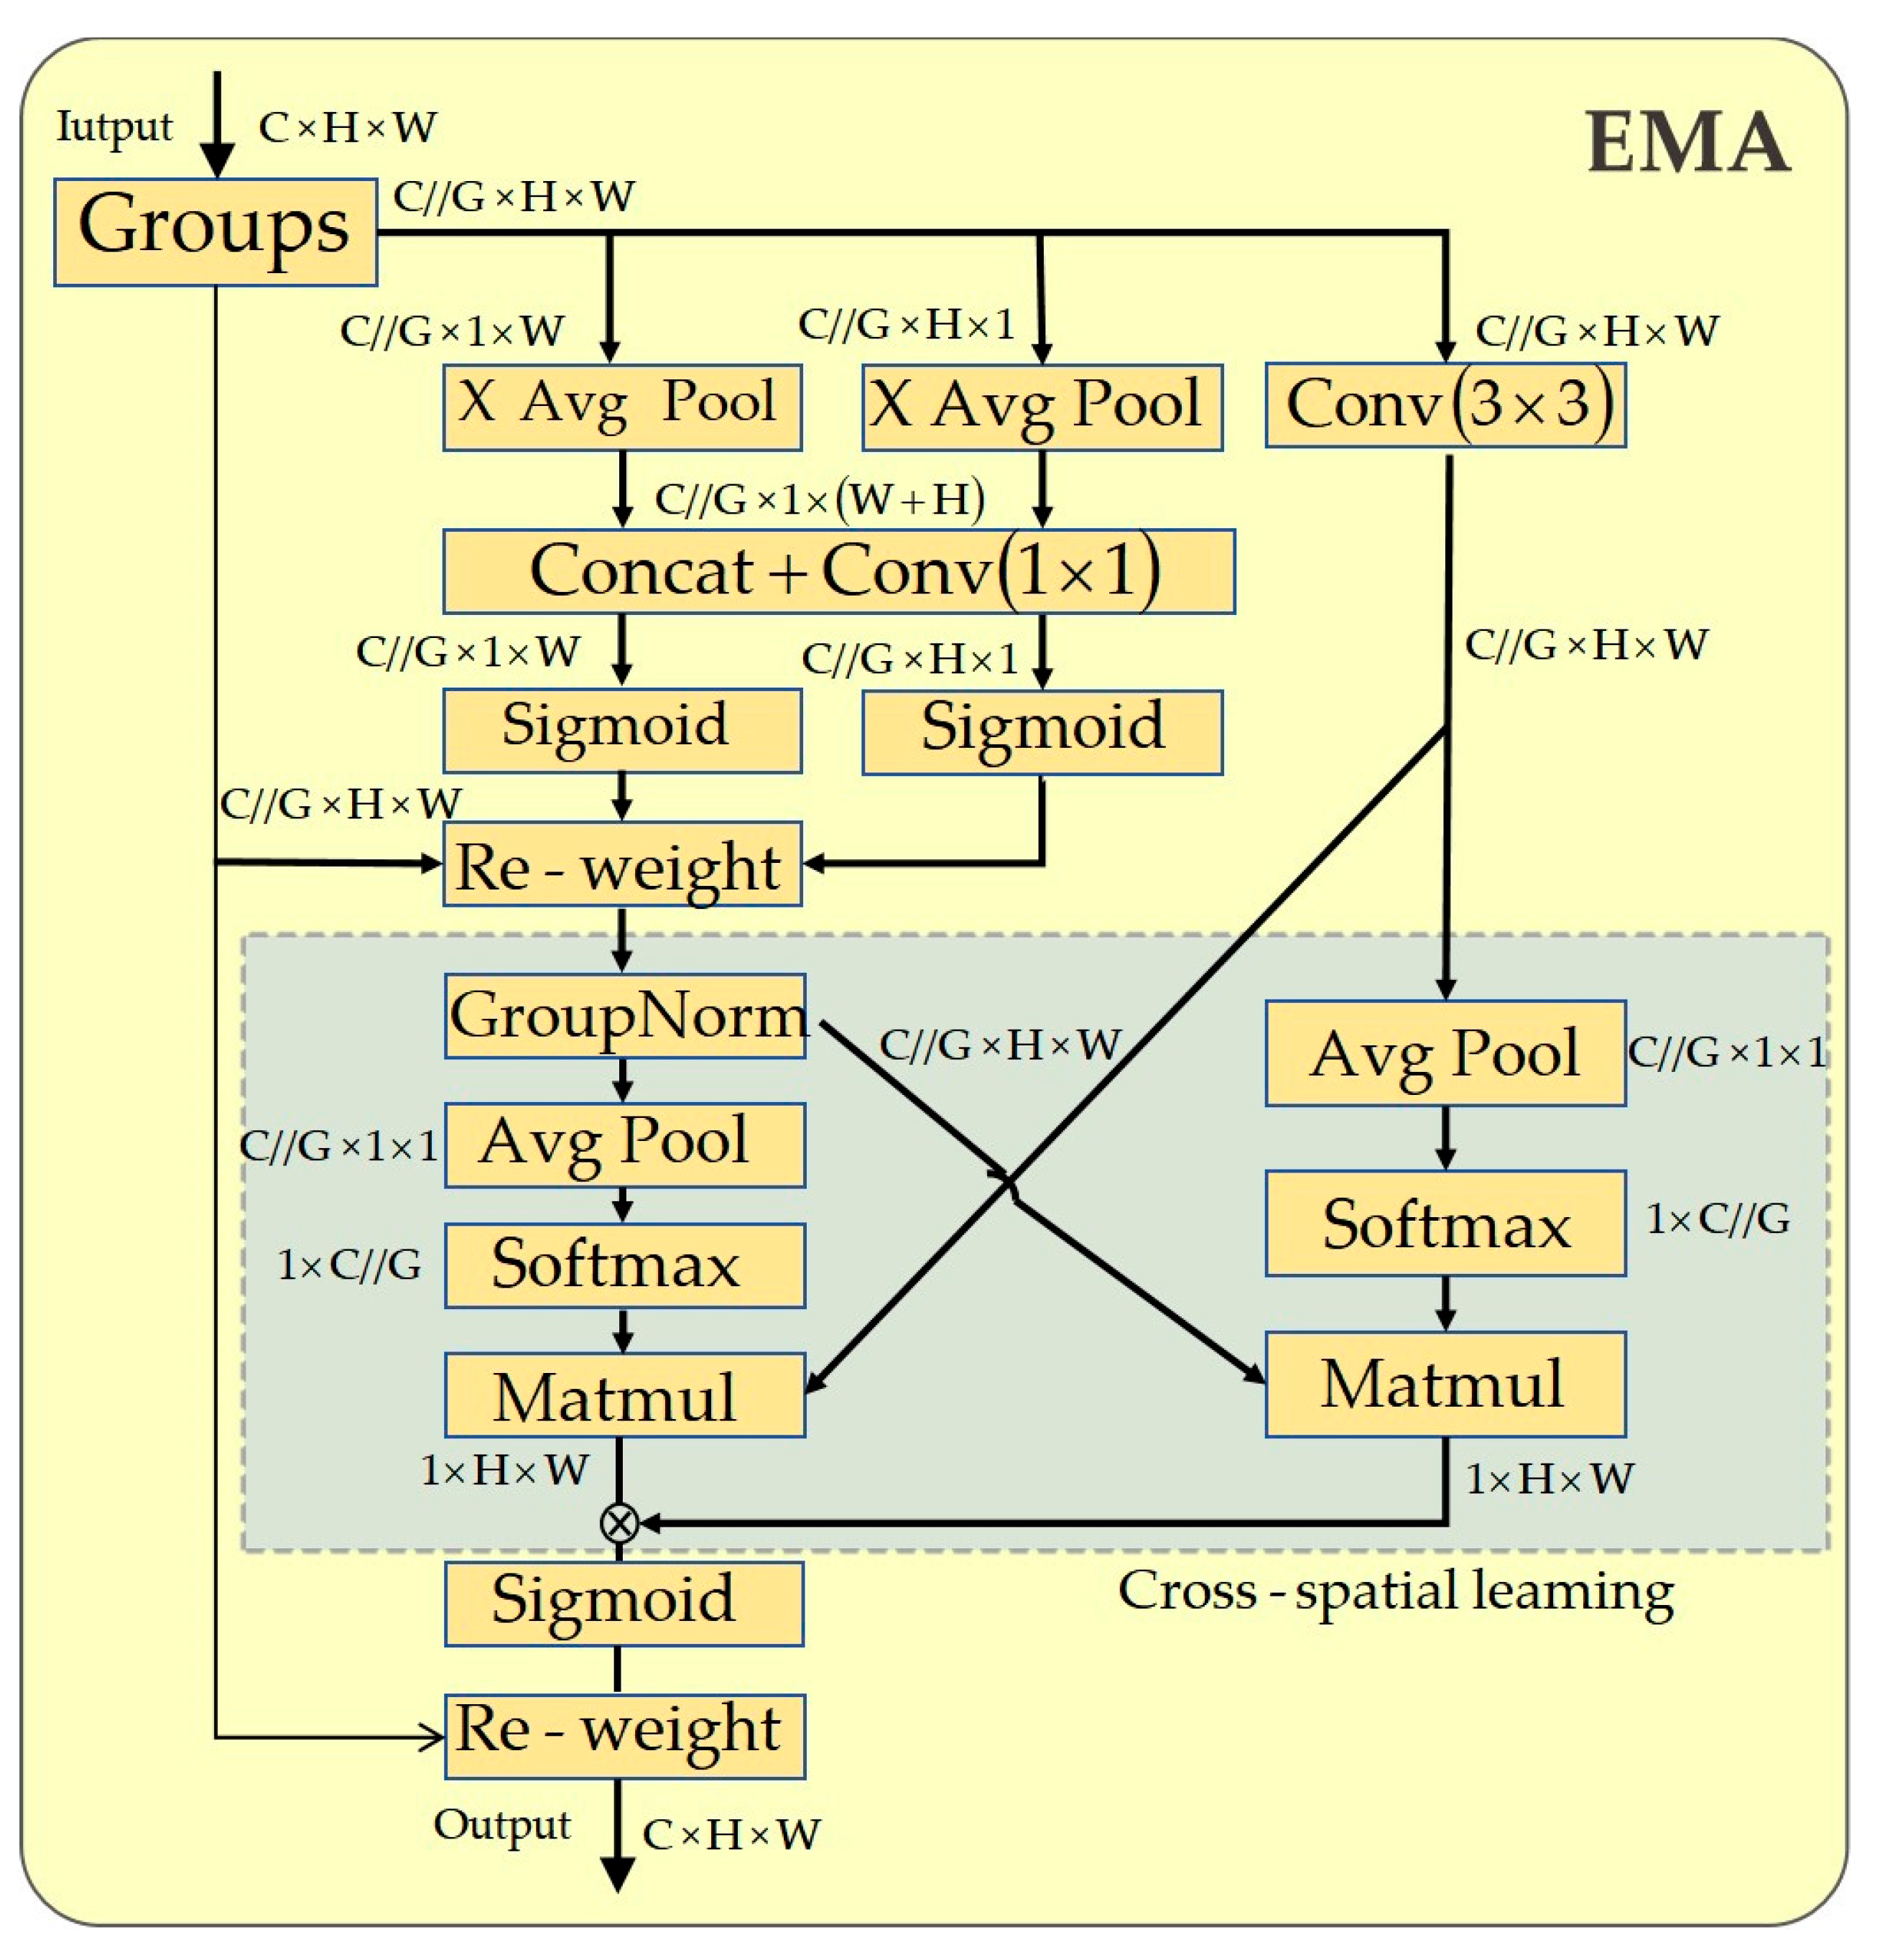
Figure 3.
The structure of the proposed C2f_EMA module.
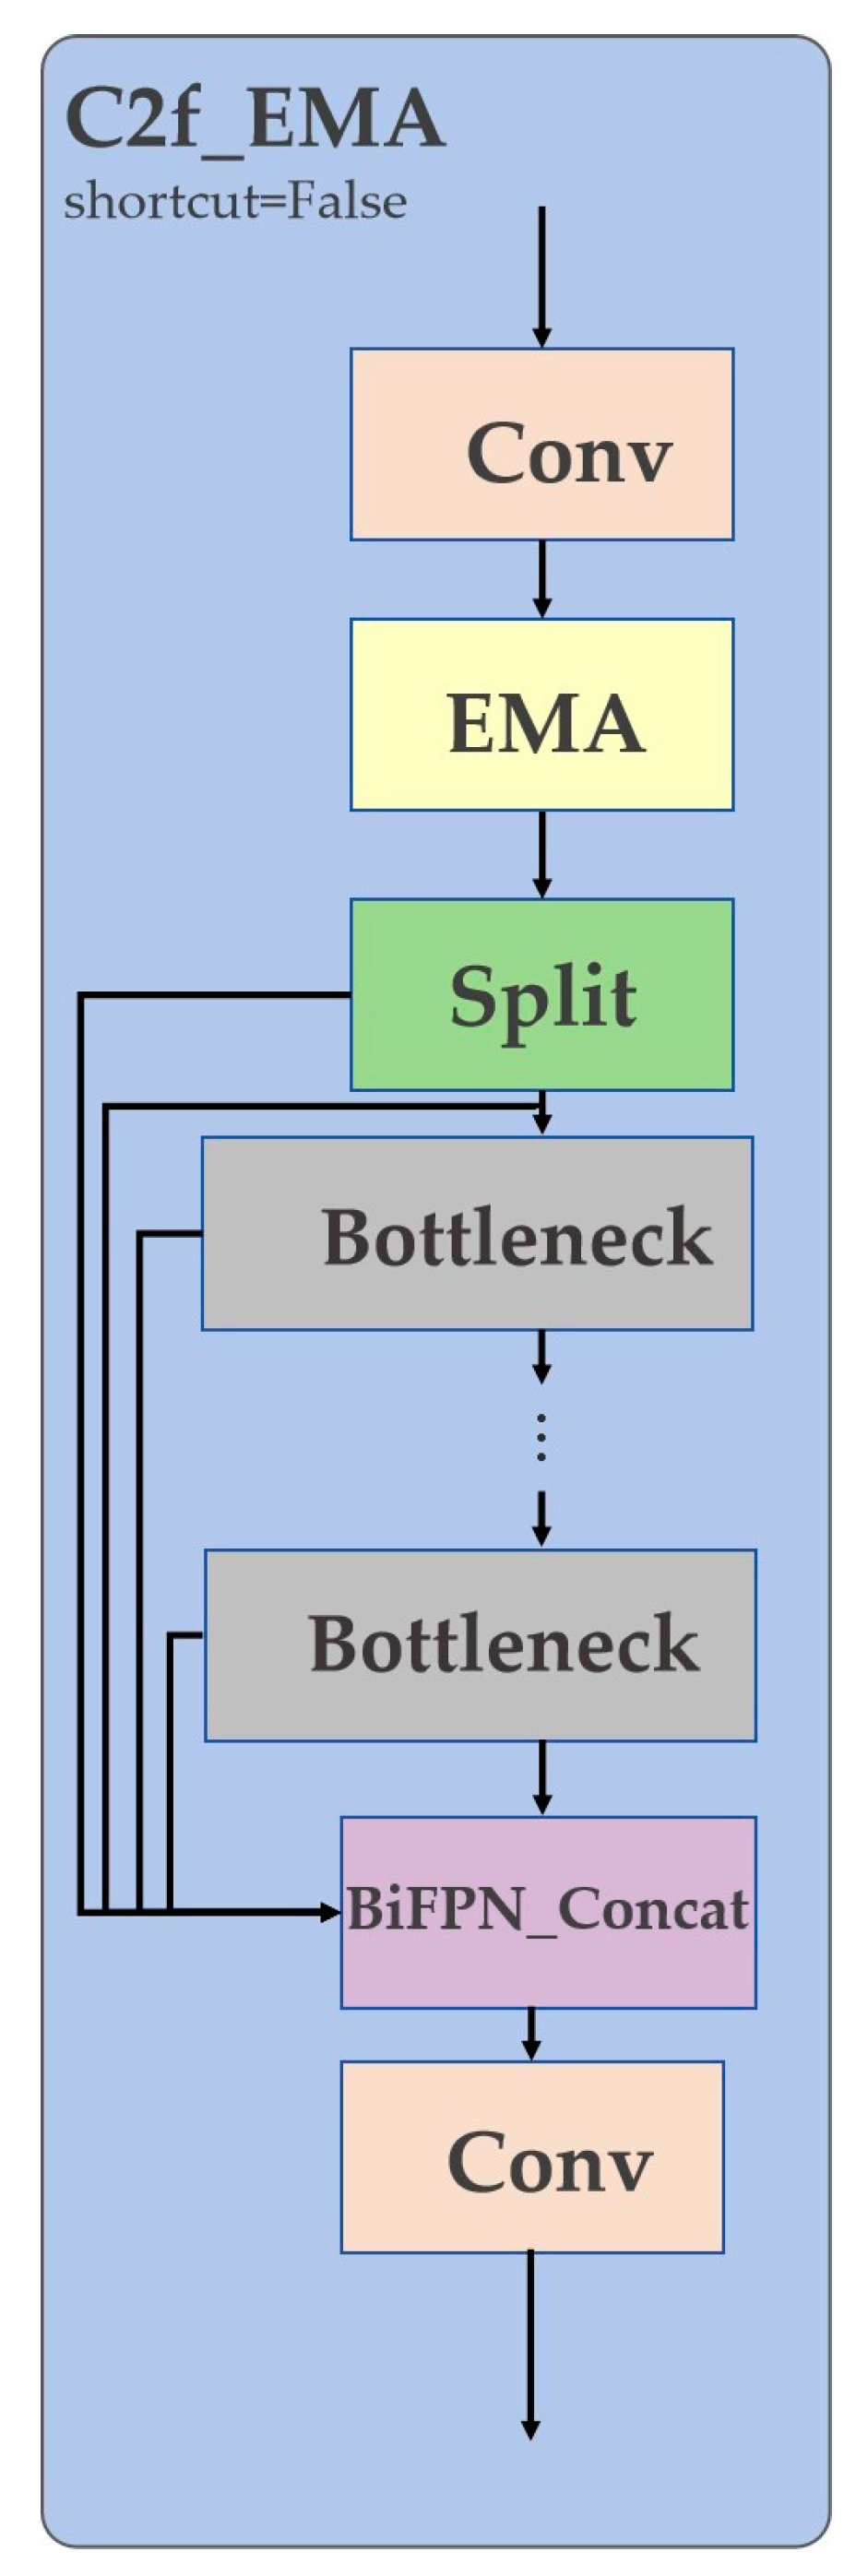
Figure 4.
This is a figure. Schemes follow the same formatting.
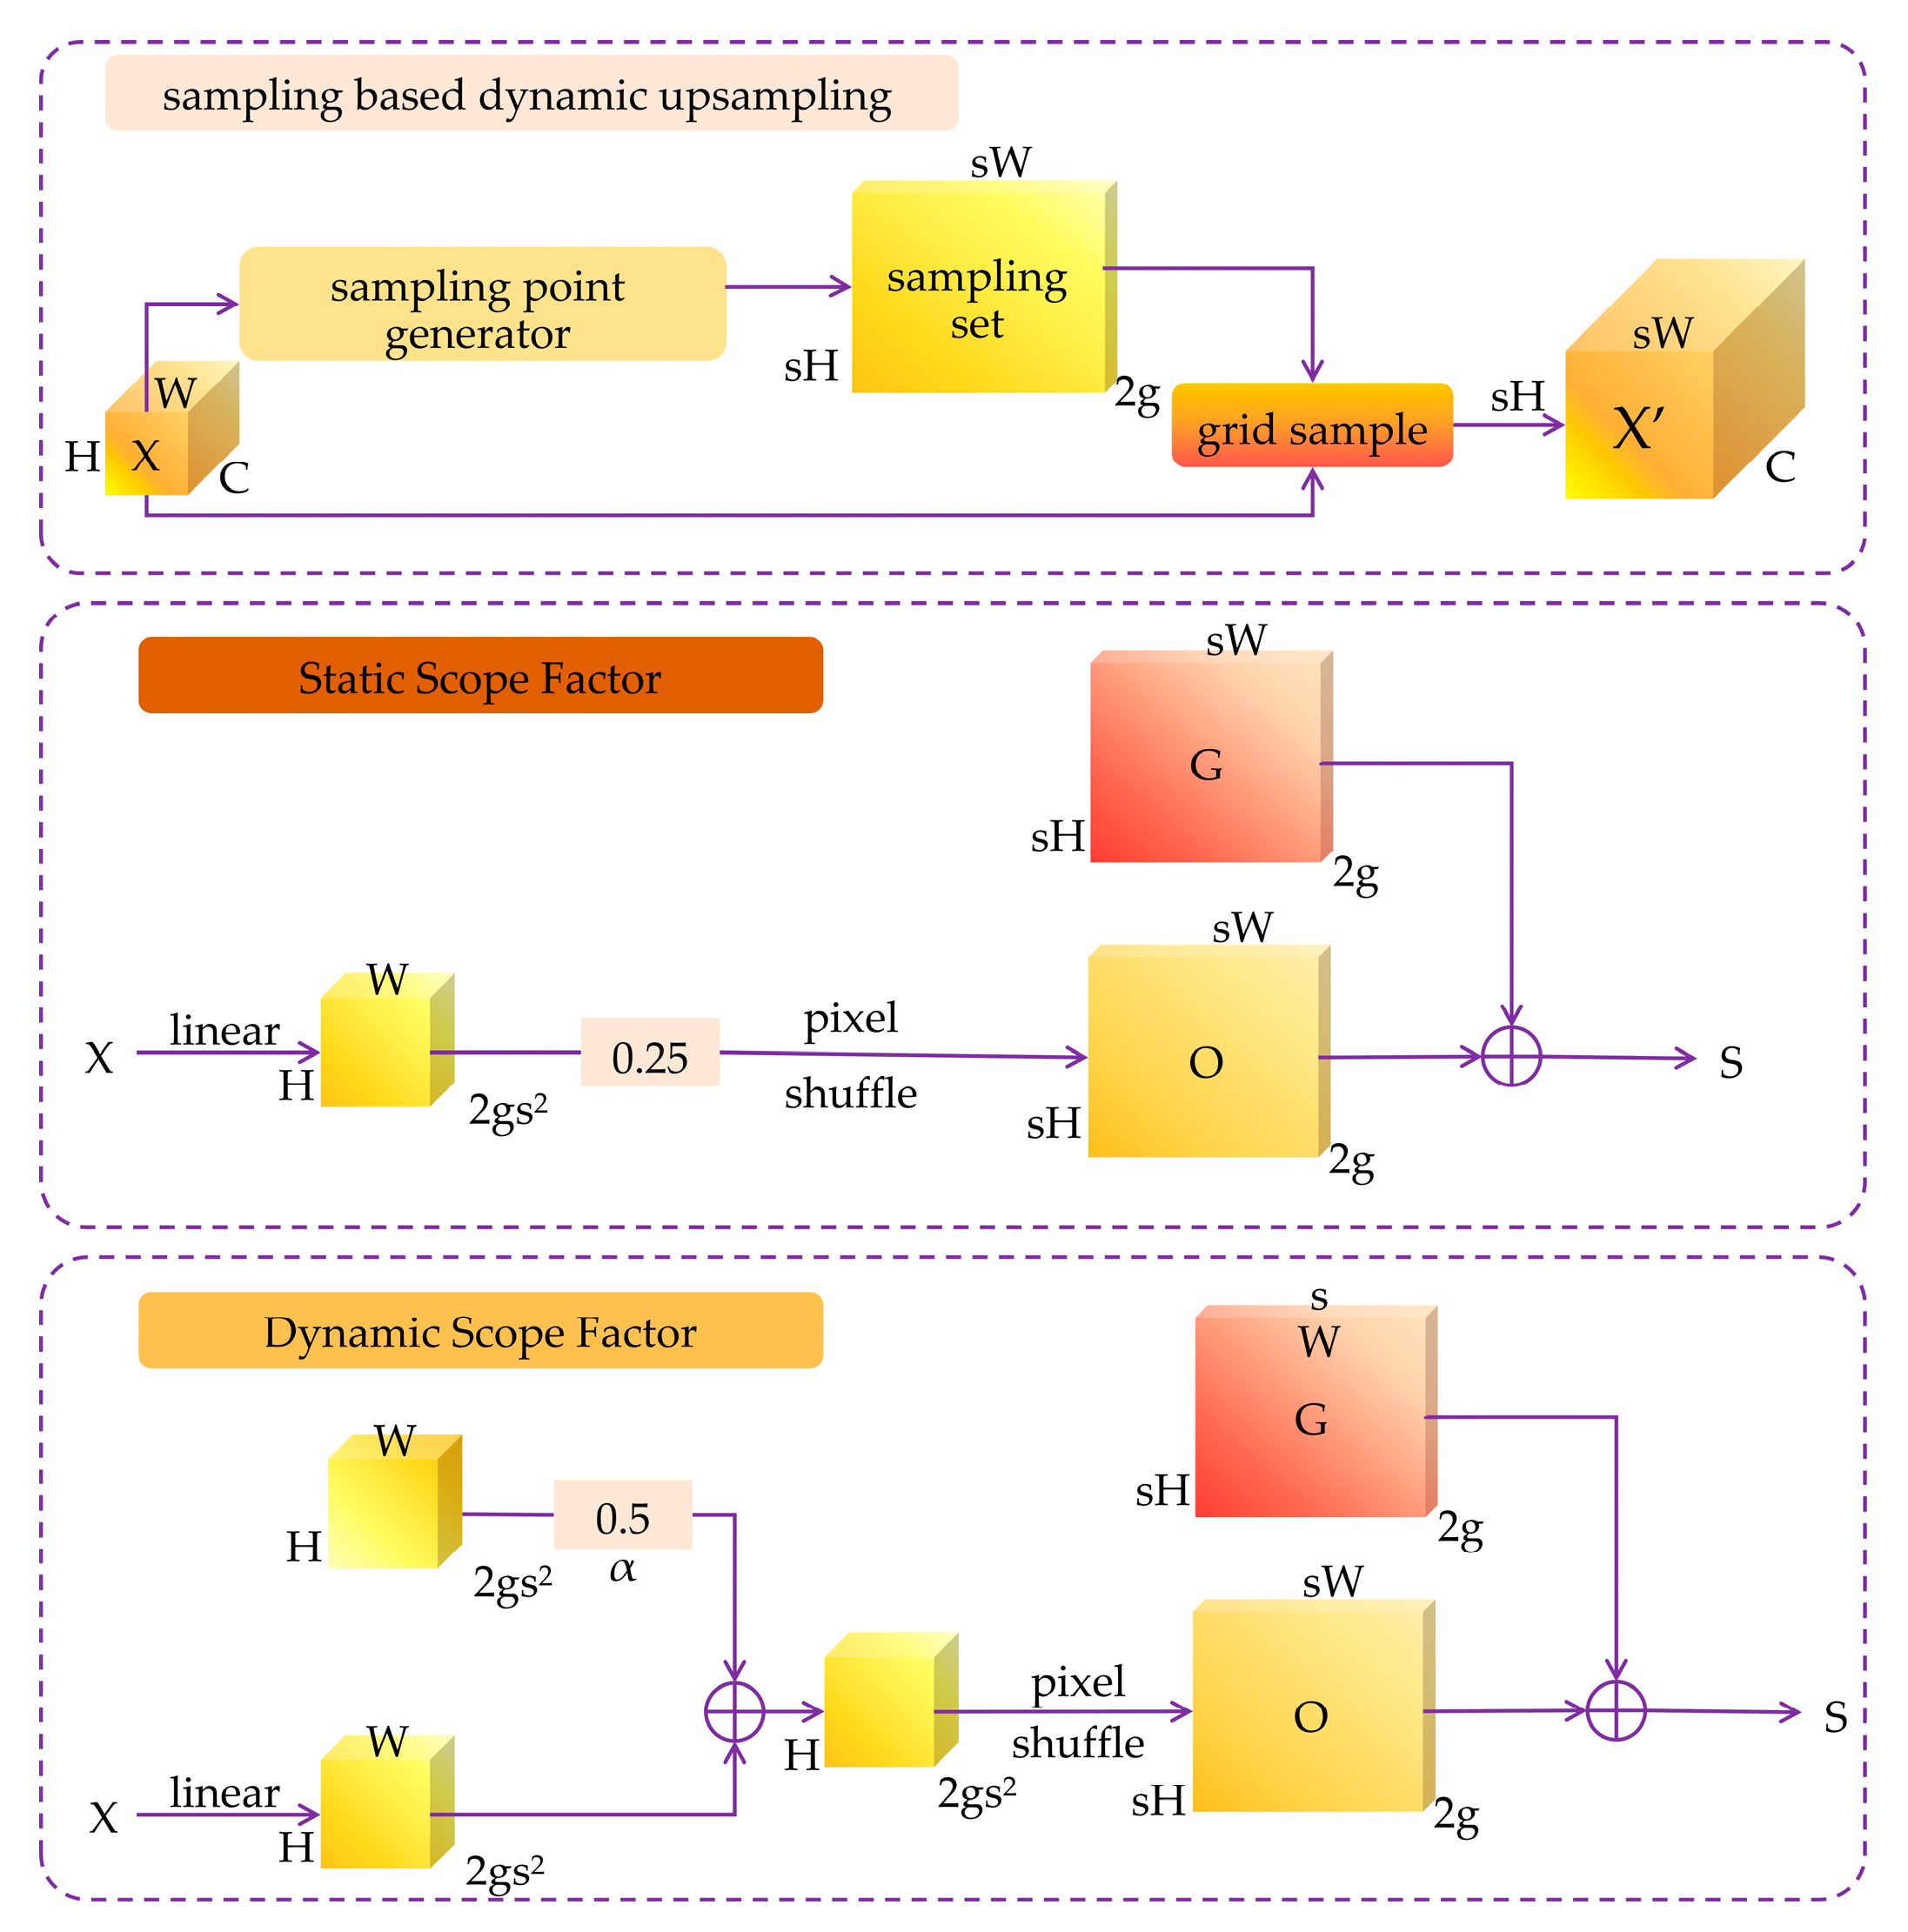
Figure 5.
The four complementary attention mechanisms in ODConv.
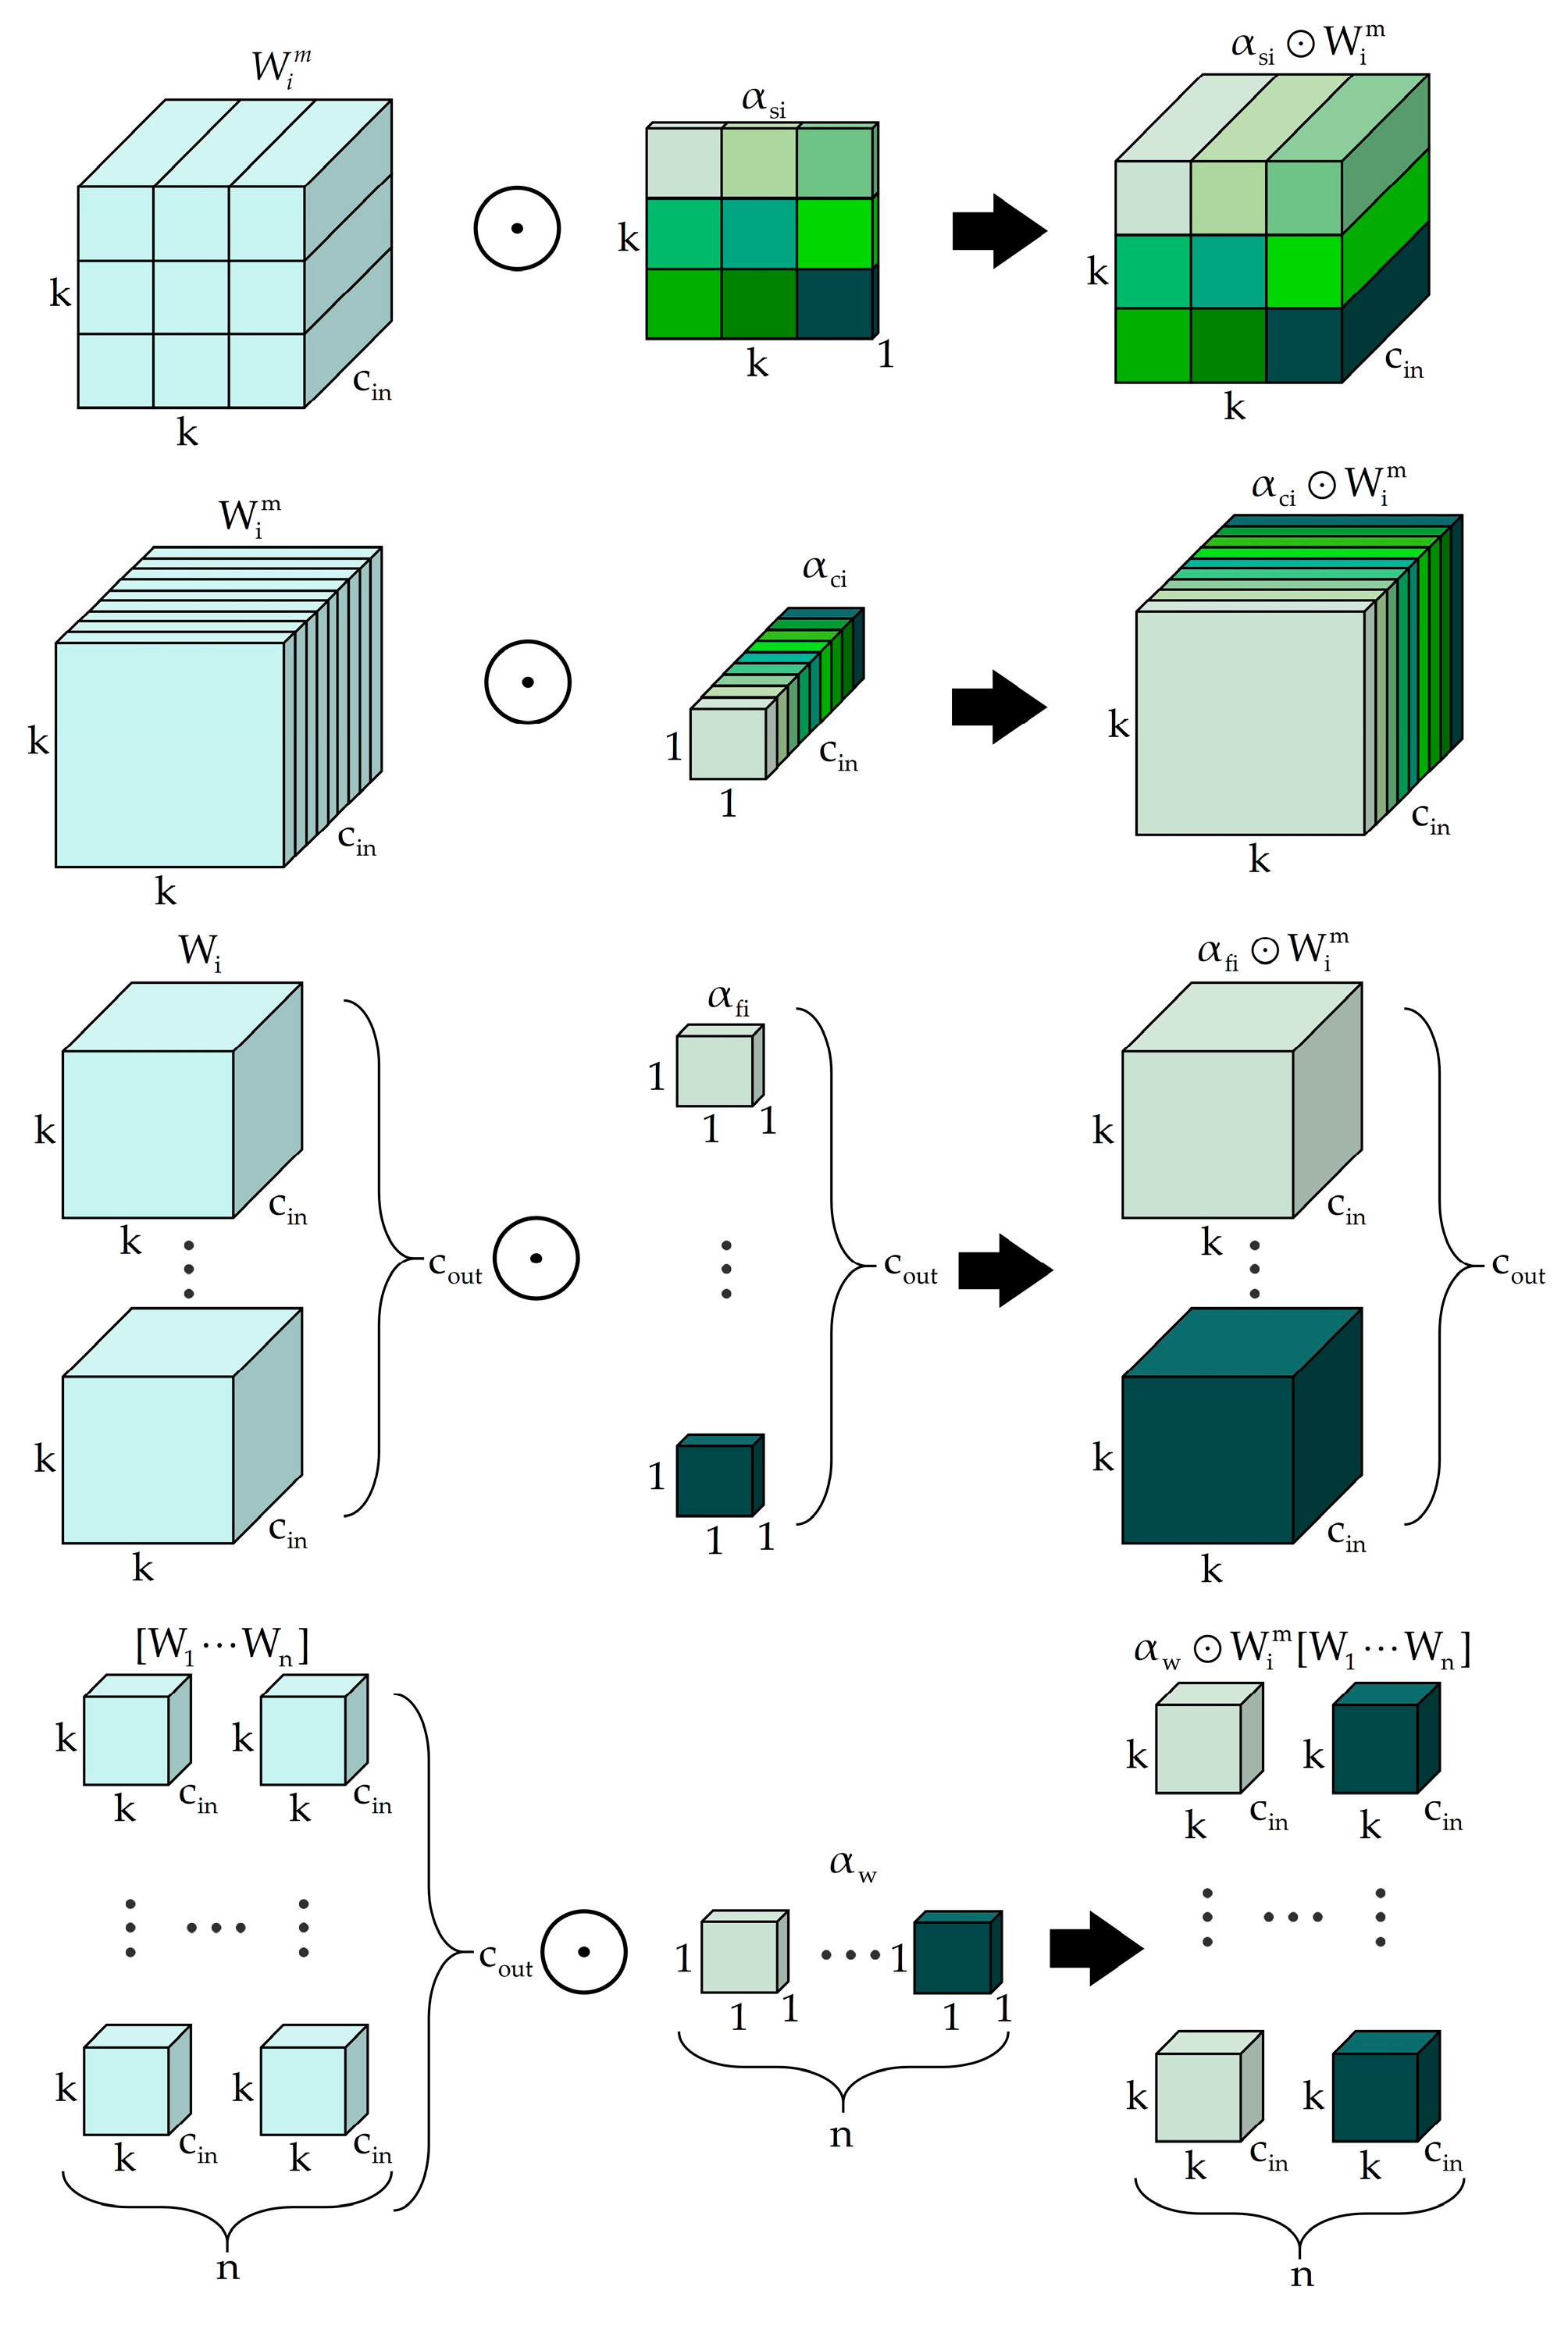
Figure 6.
The structural implementation of the ODConv2d module.
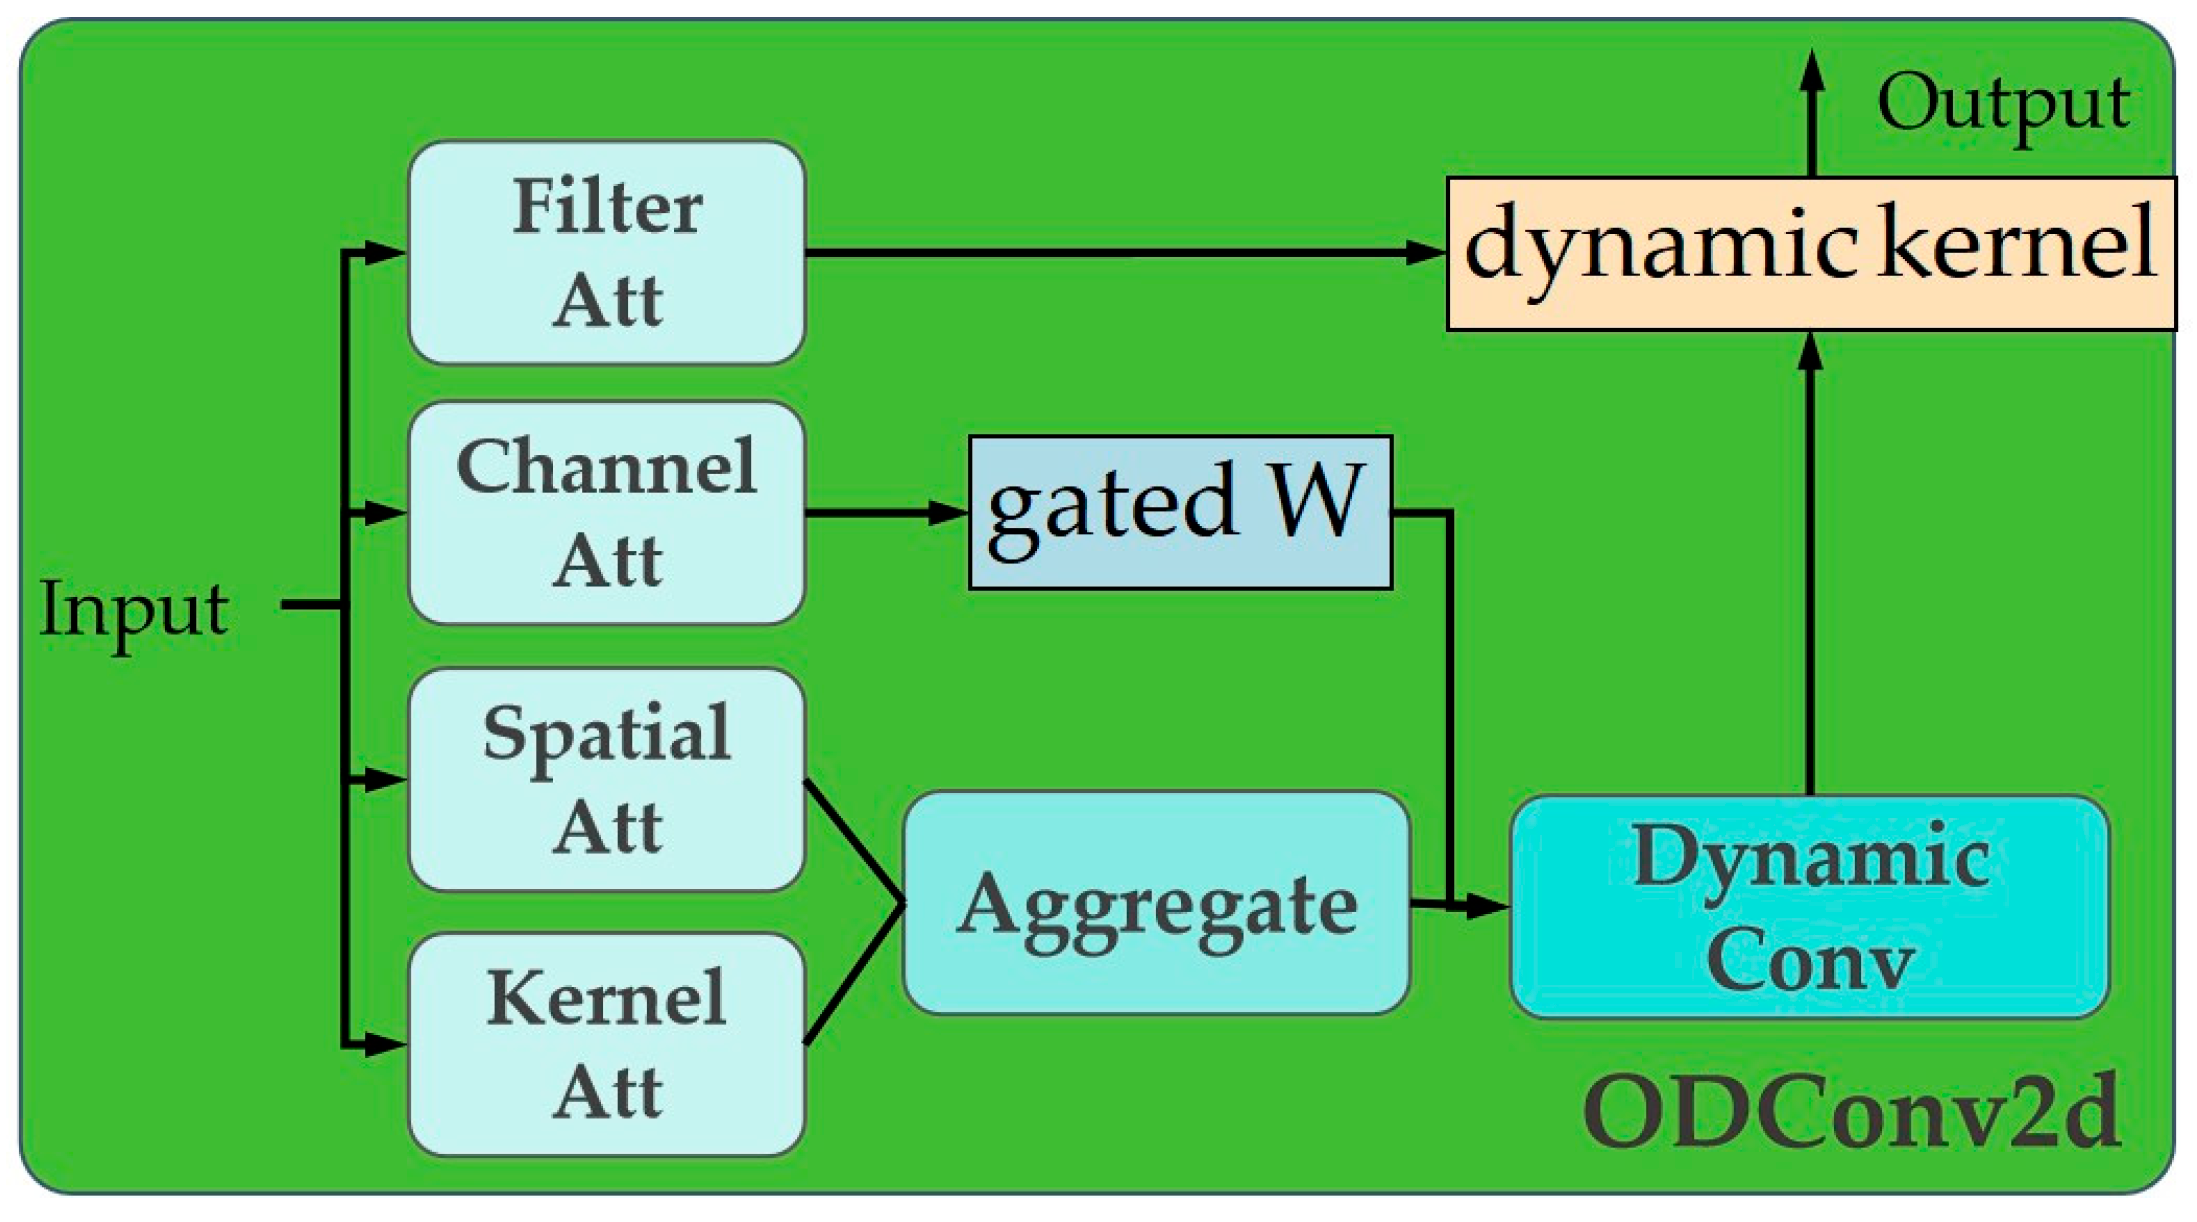
Figure 7.
The structure of a standard BiFPN.
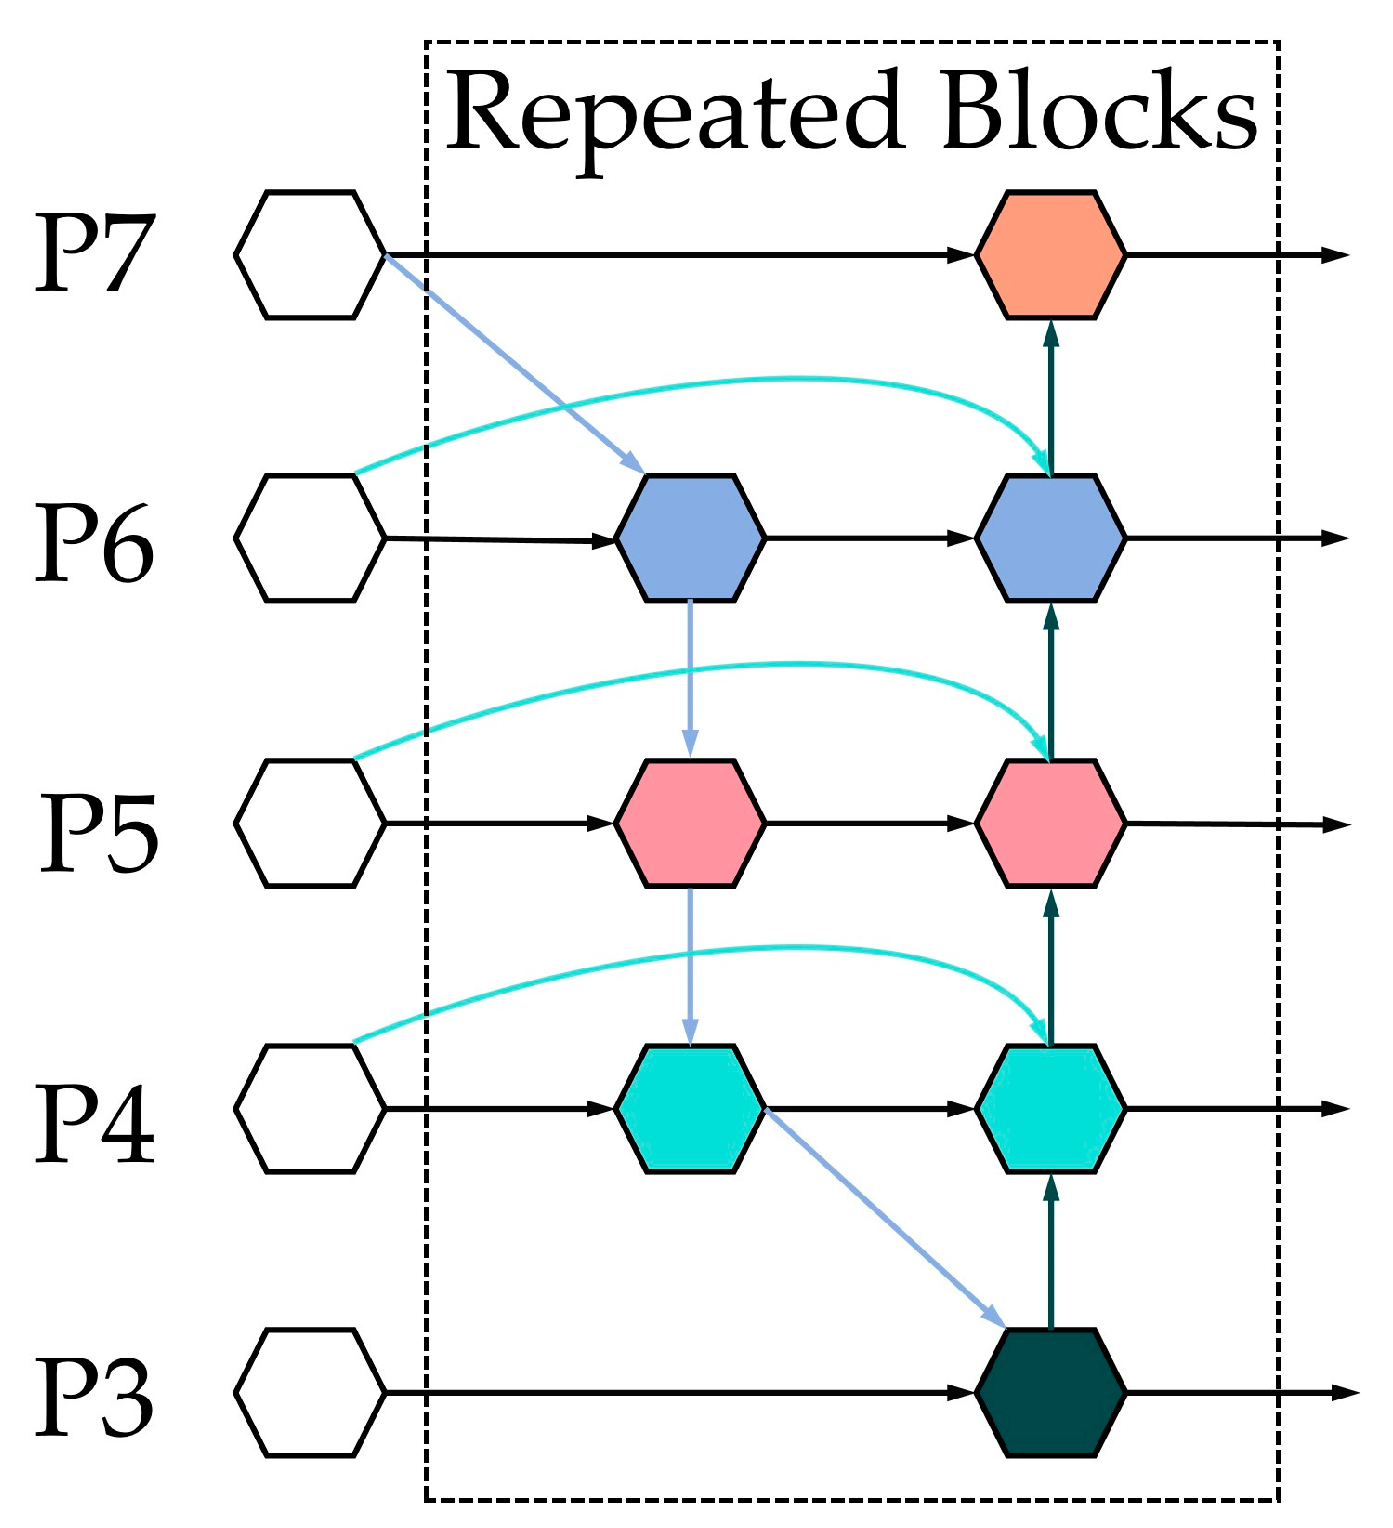
Figure 8.
The simplified structure of our proposed BiFPN_Concat2 module.
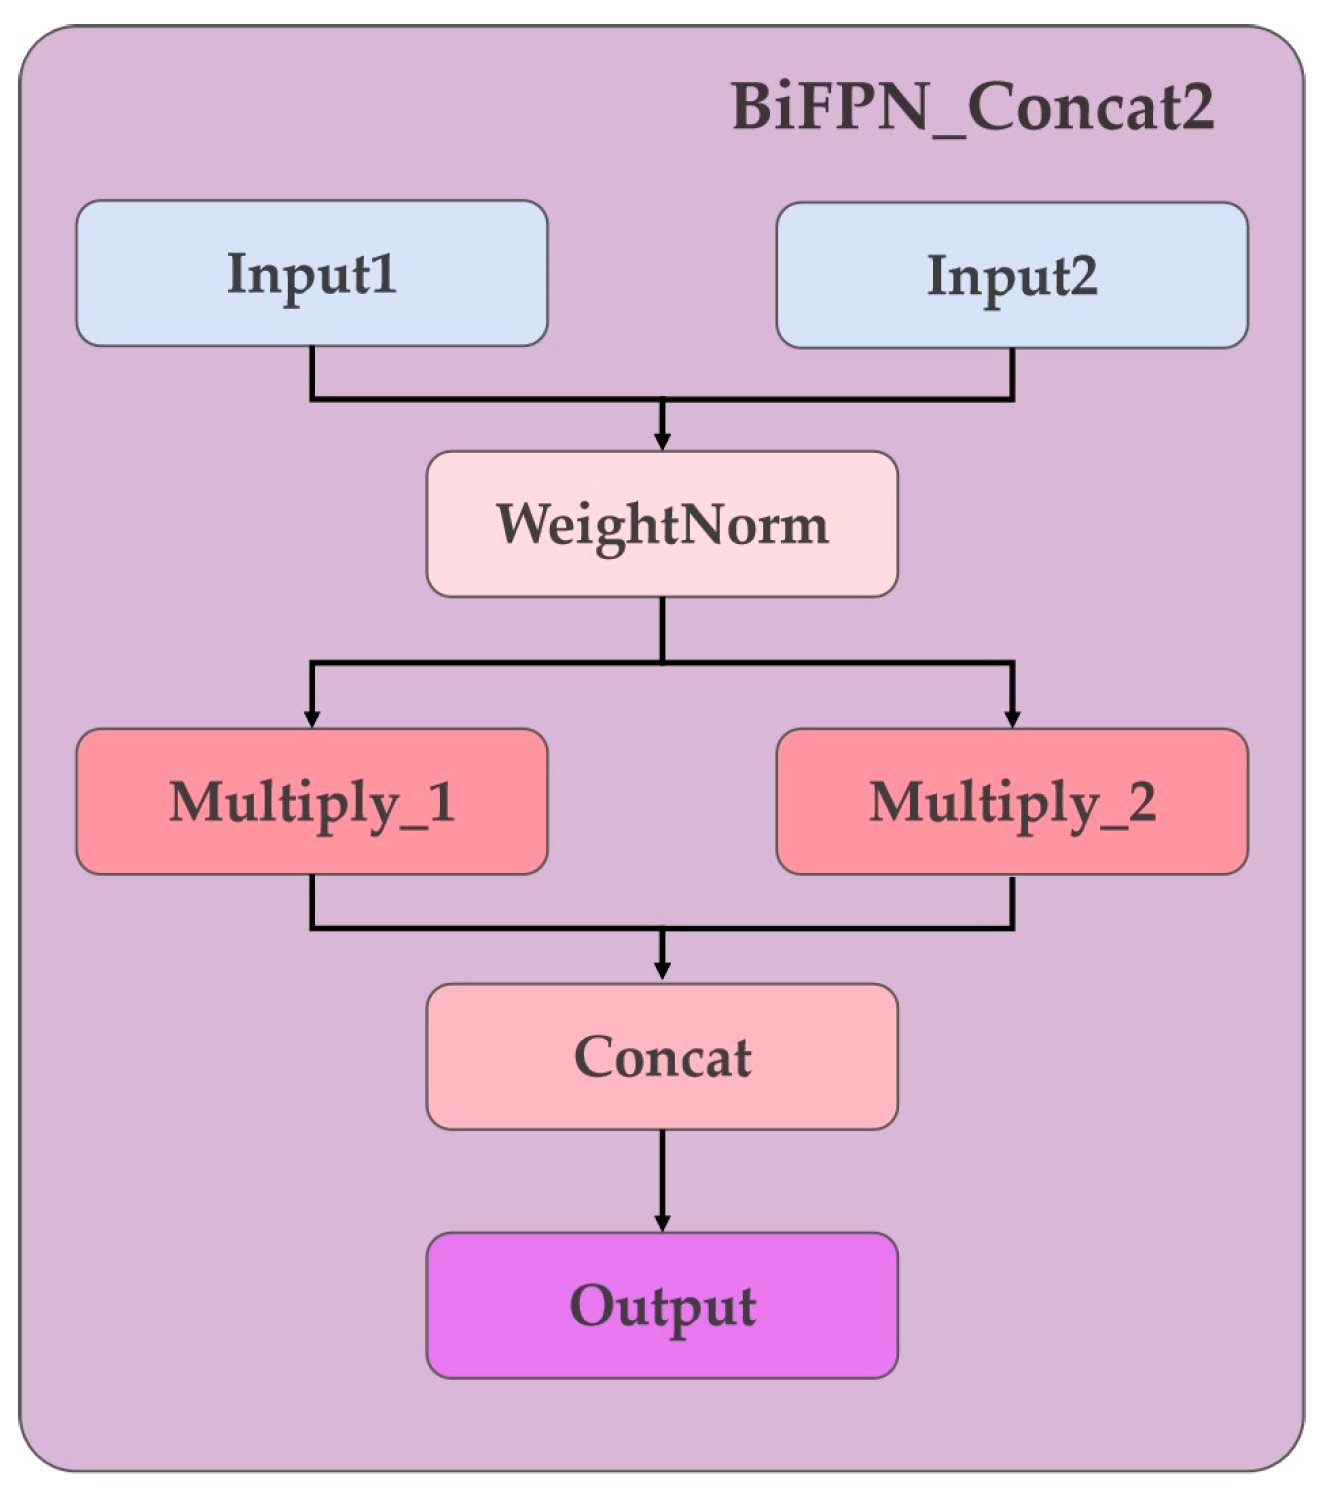
Figure 9.
The pseudo-code comparison between standard NMS (red) and Soft-NMS (green).
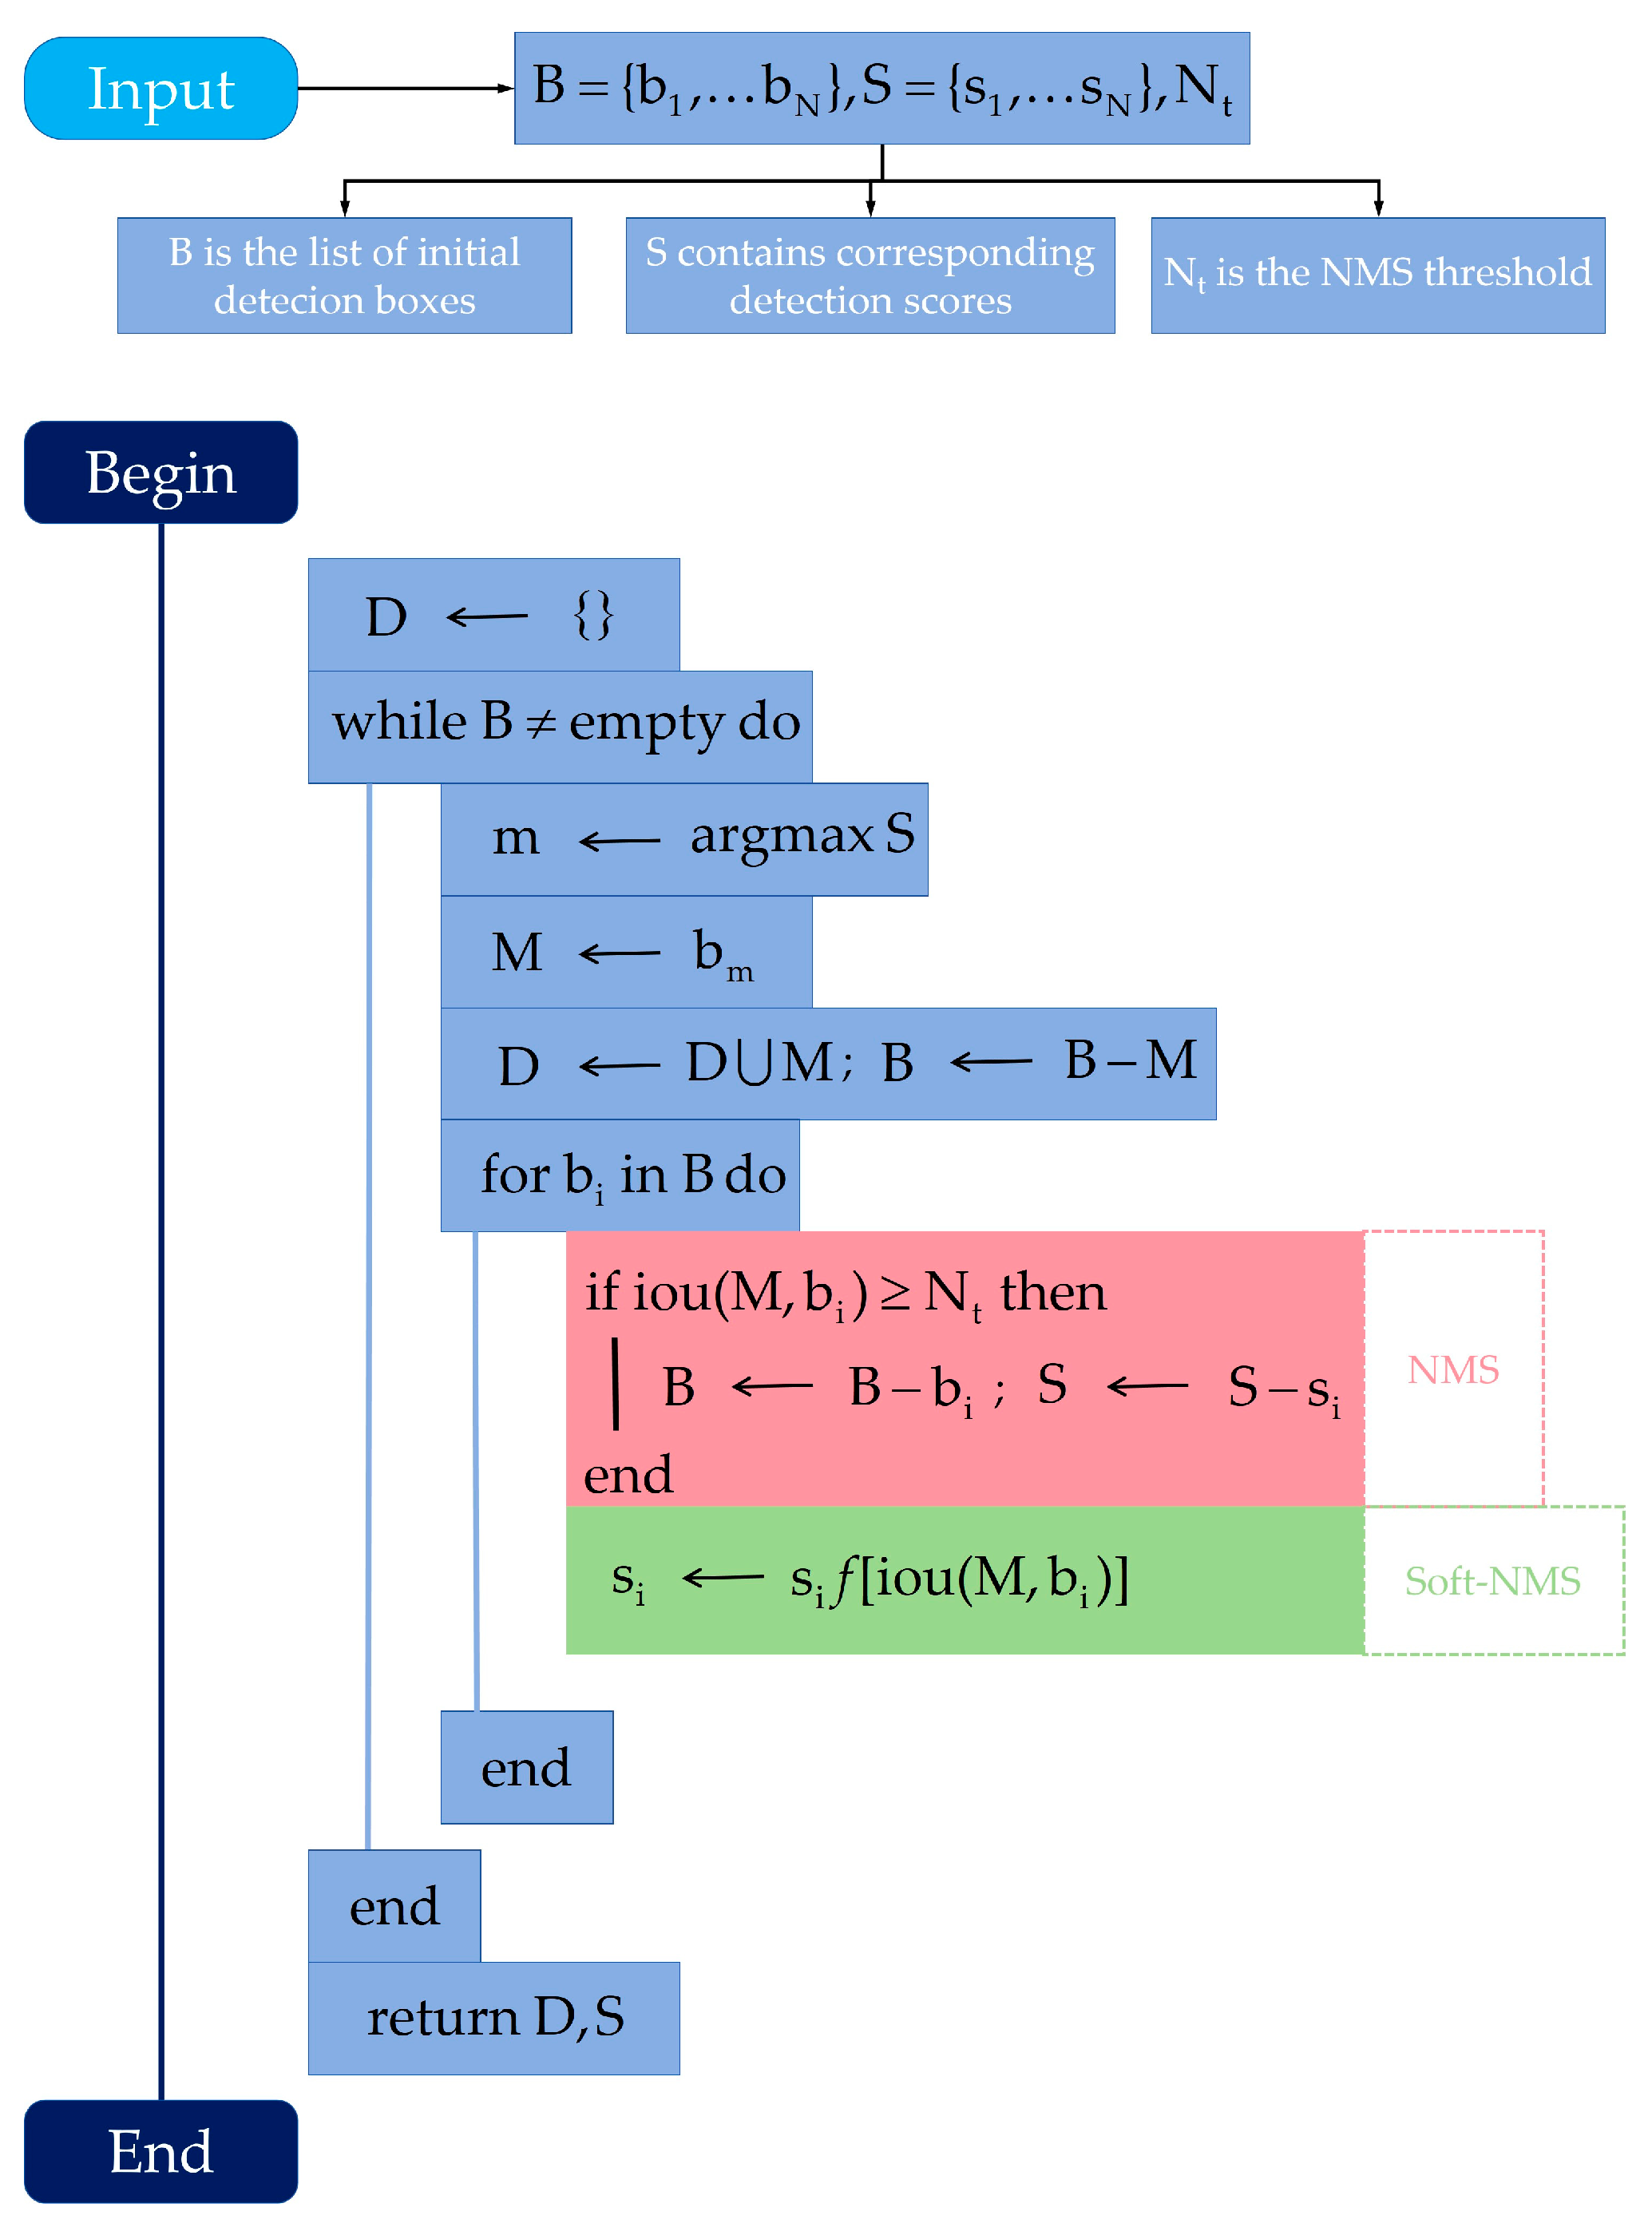
Figure 10.
This is a figure. Schemes follow the same formatting.
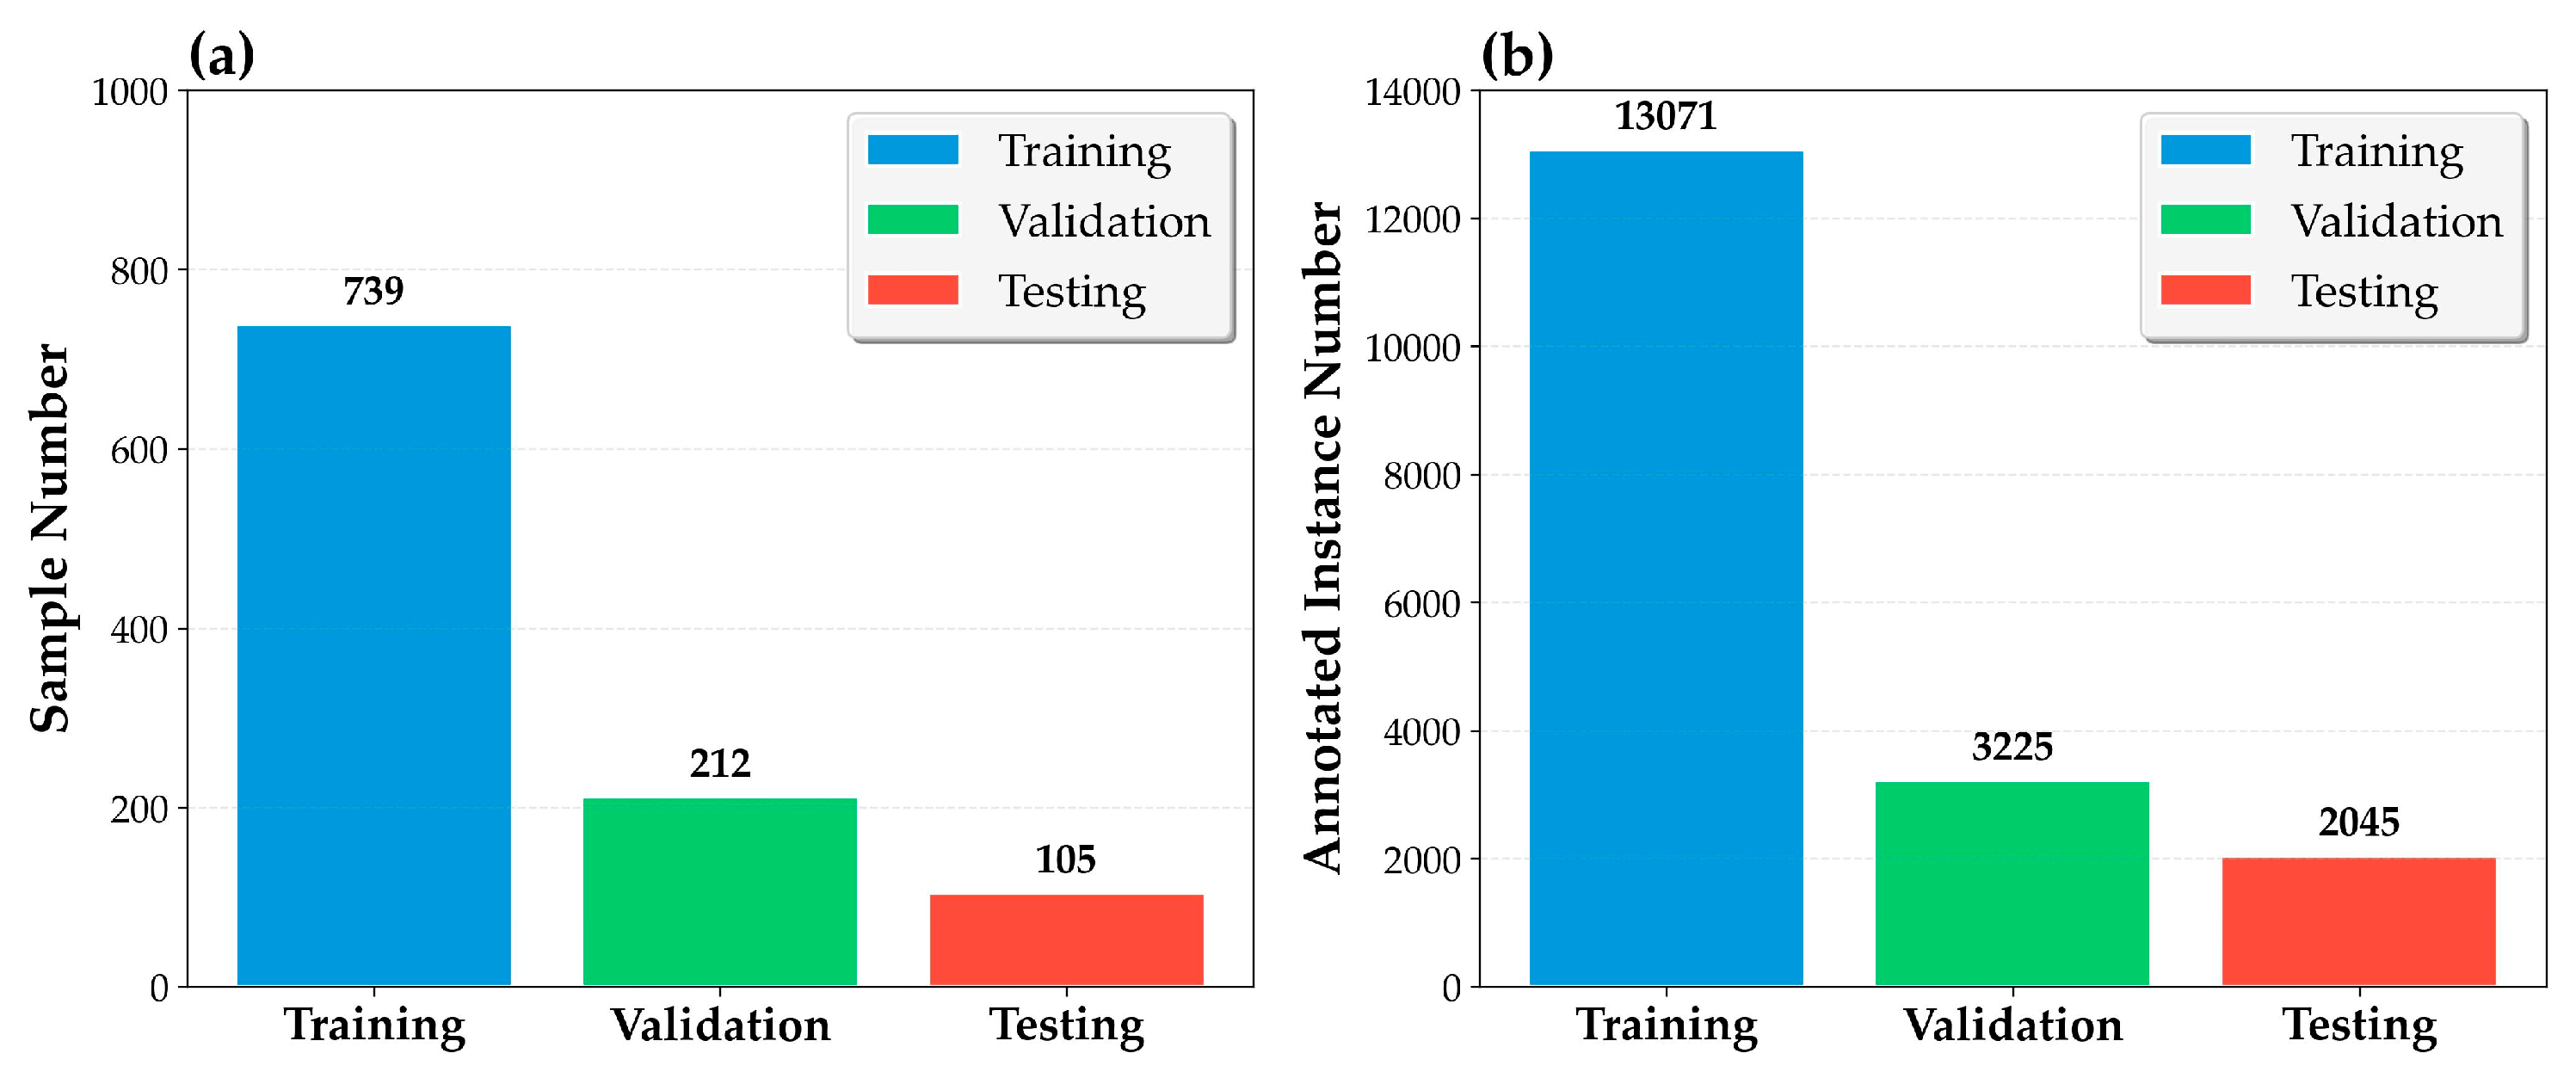
Figure 11.
The mAP trend during model training over 200 epochs, showing model convergence and learning dynamics.
Figure 11.
The mAP trend during model training over 200 epochs, showing model convergence and learning dynamics.
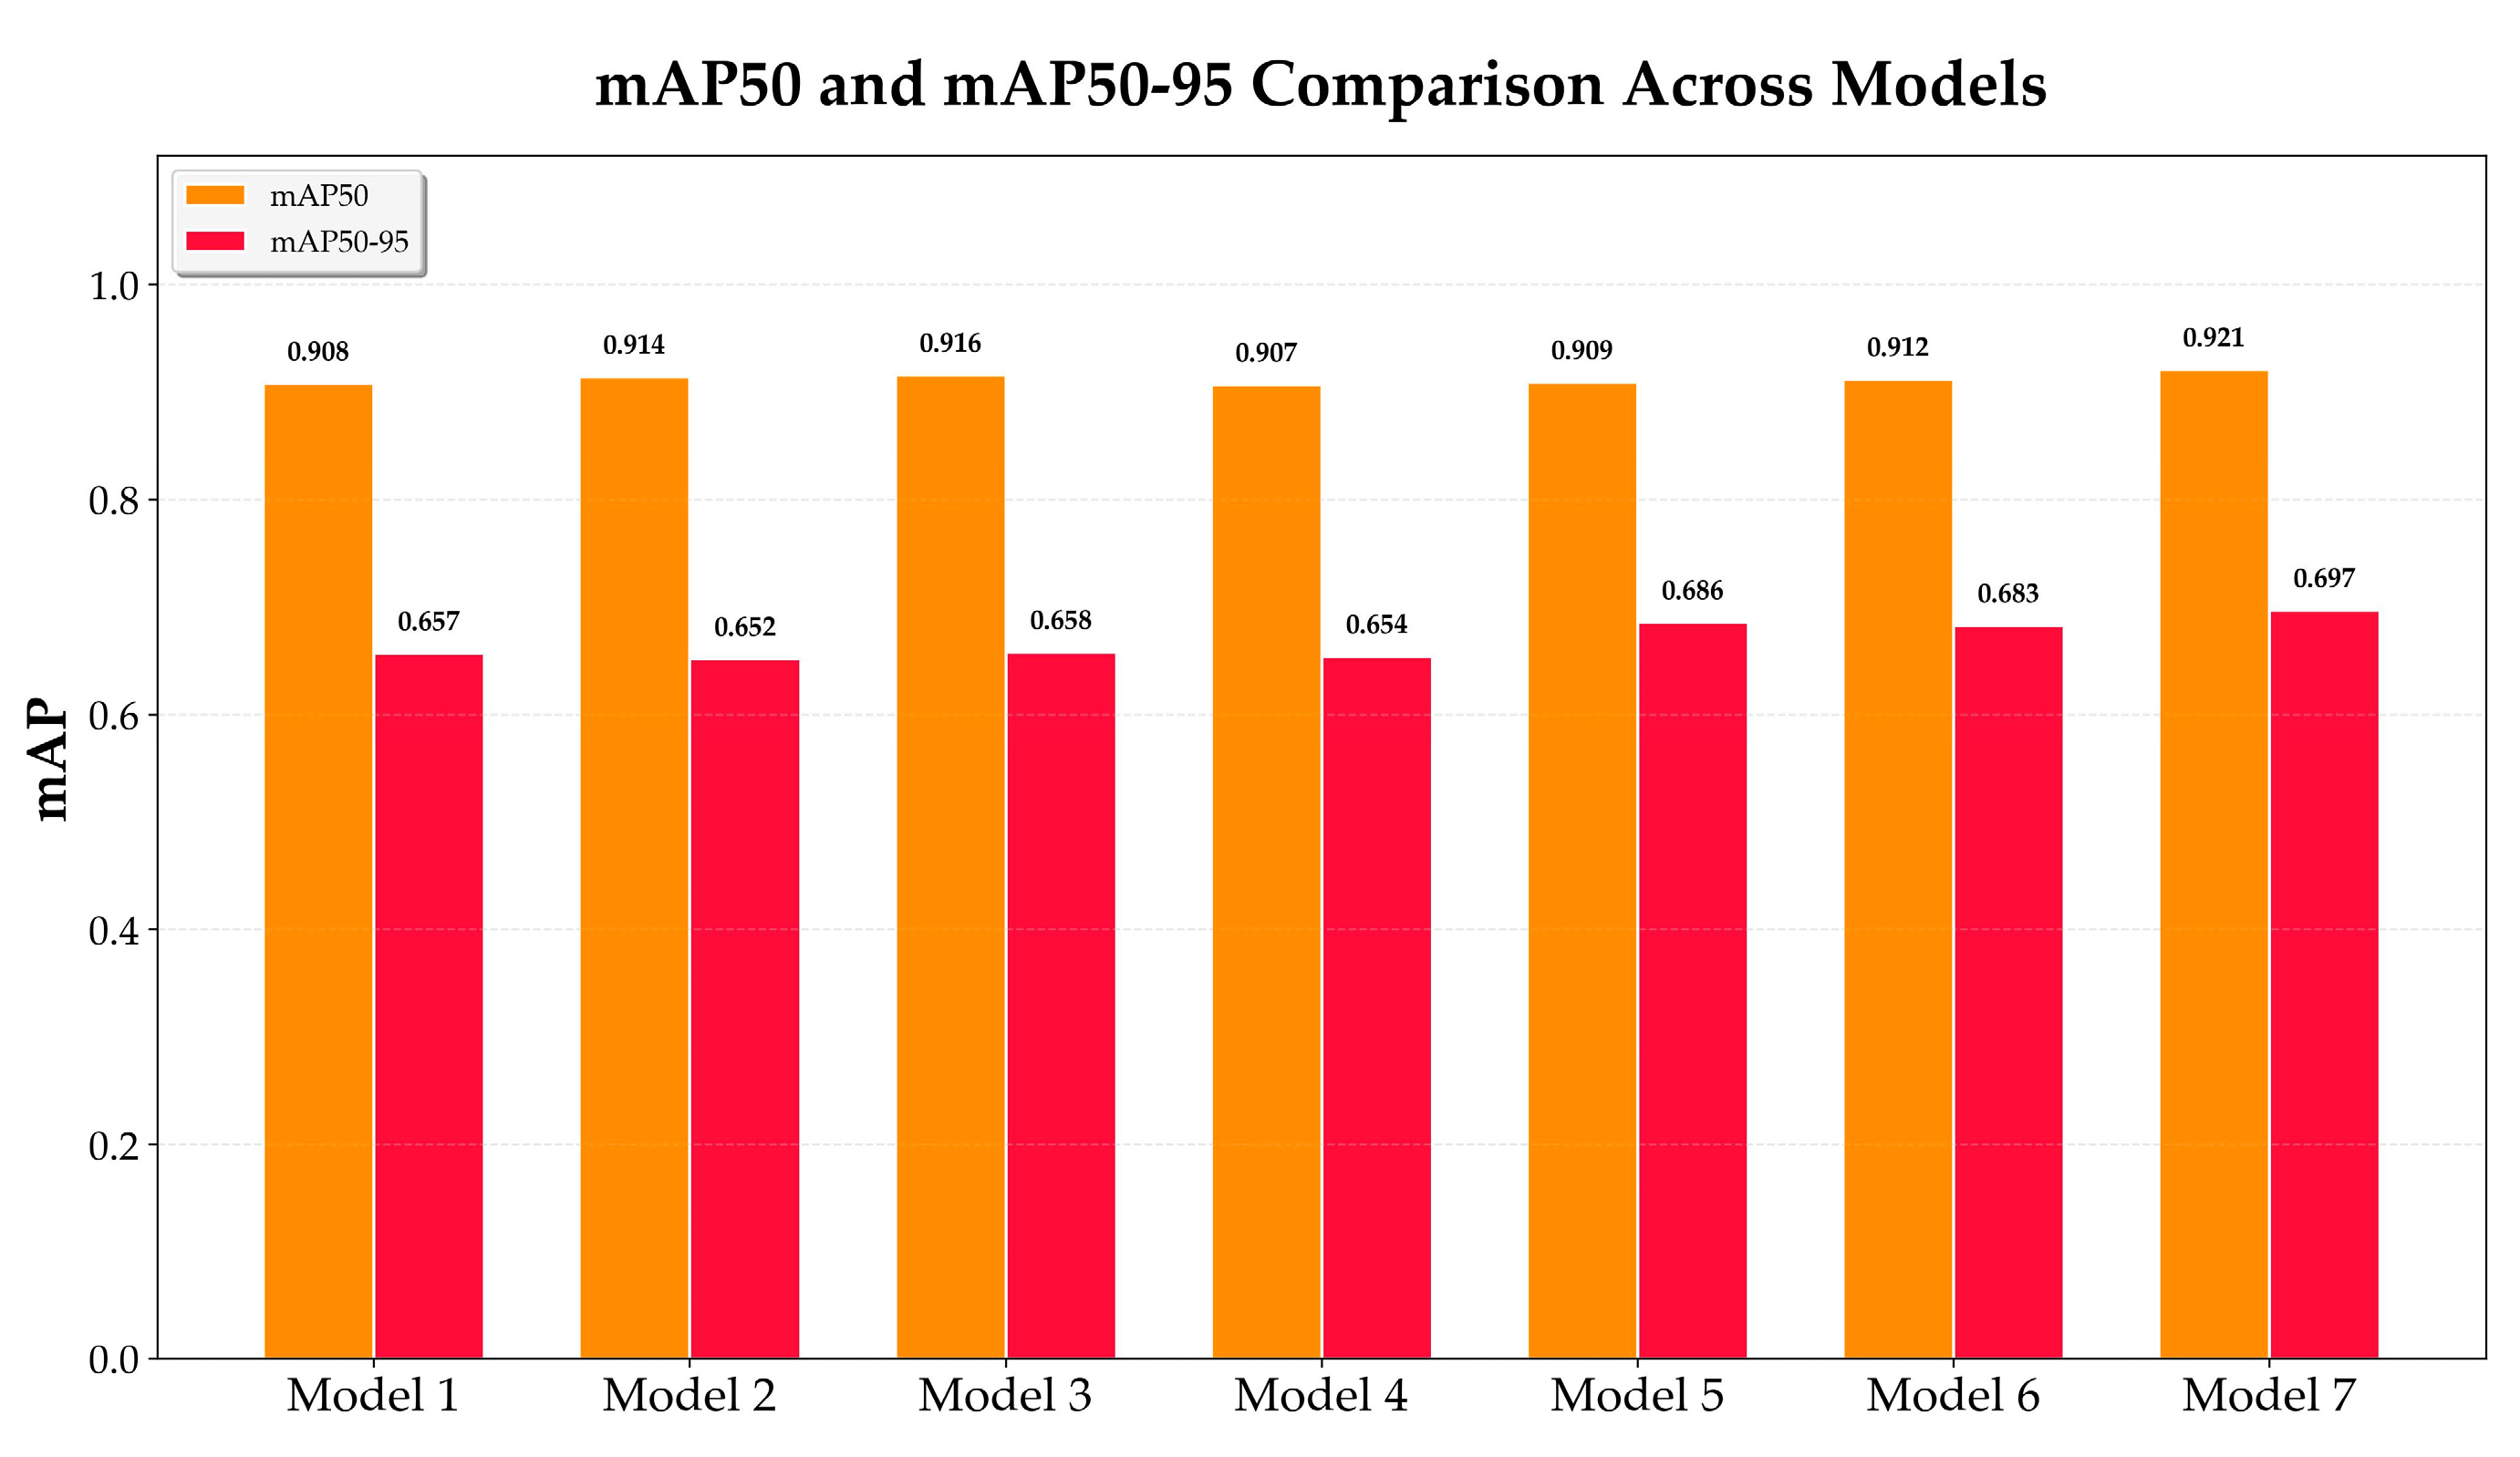
Figure 12.
Performance comparison curves of models from the ablation study (Model 1 to Model 7) across four key metrics: mAP@0.5, mAP@0.5:0.95, Precision, and Recall.
Figure 12.
Performance comparison curves of models from the ablation study (Model 1 to Model 7) across four key metrics: mAP@0.5, mAP@0.5:0.95, Precision, and Recall.
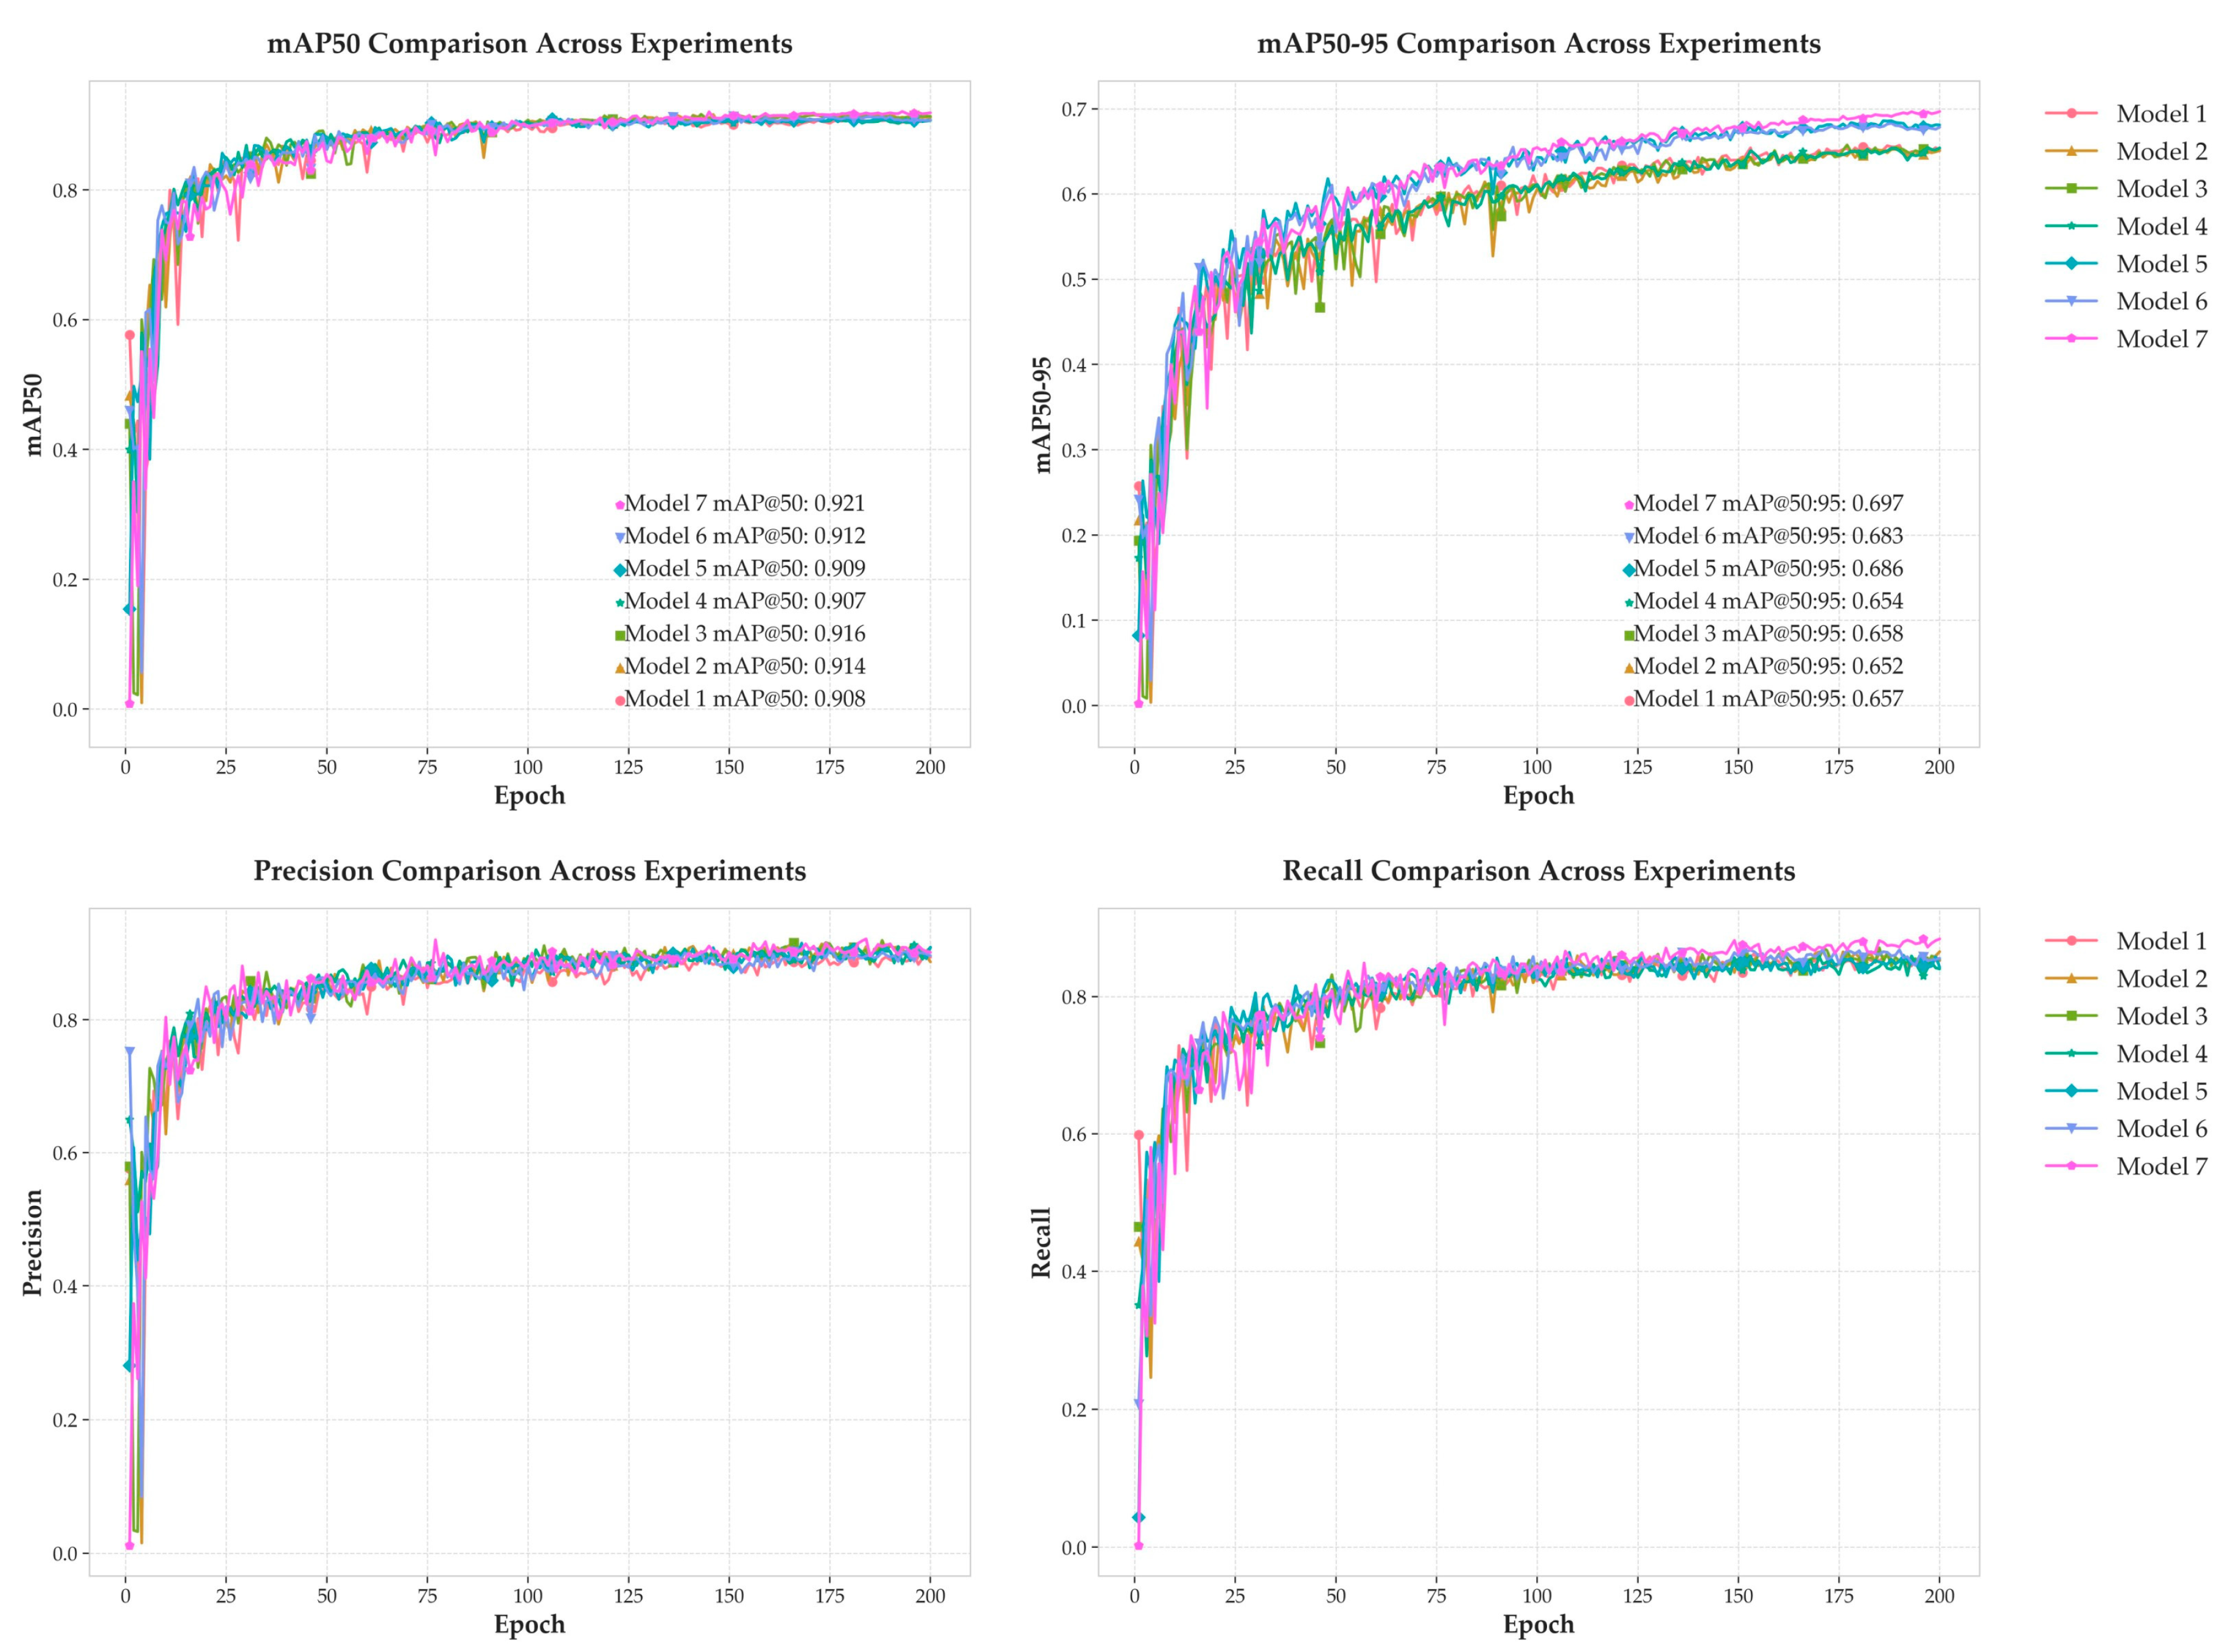
Figure 13.
Direct performance comparison between the baseline YOLOv8s (Model 1) and the final MDB-YOLO (Model 7) across four key metrics.
Figure 13.
Direct performance comparison between the baseline YOLOv8s (Model 1) and the final MDB-YOLO (Model 7) across four key metrics.
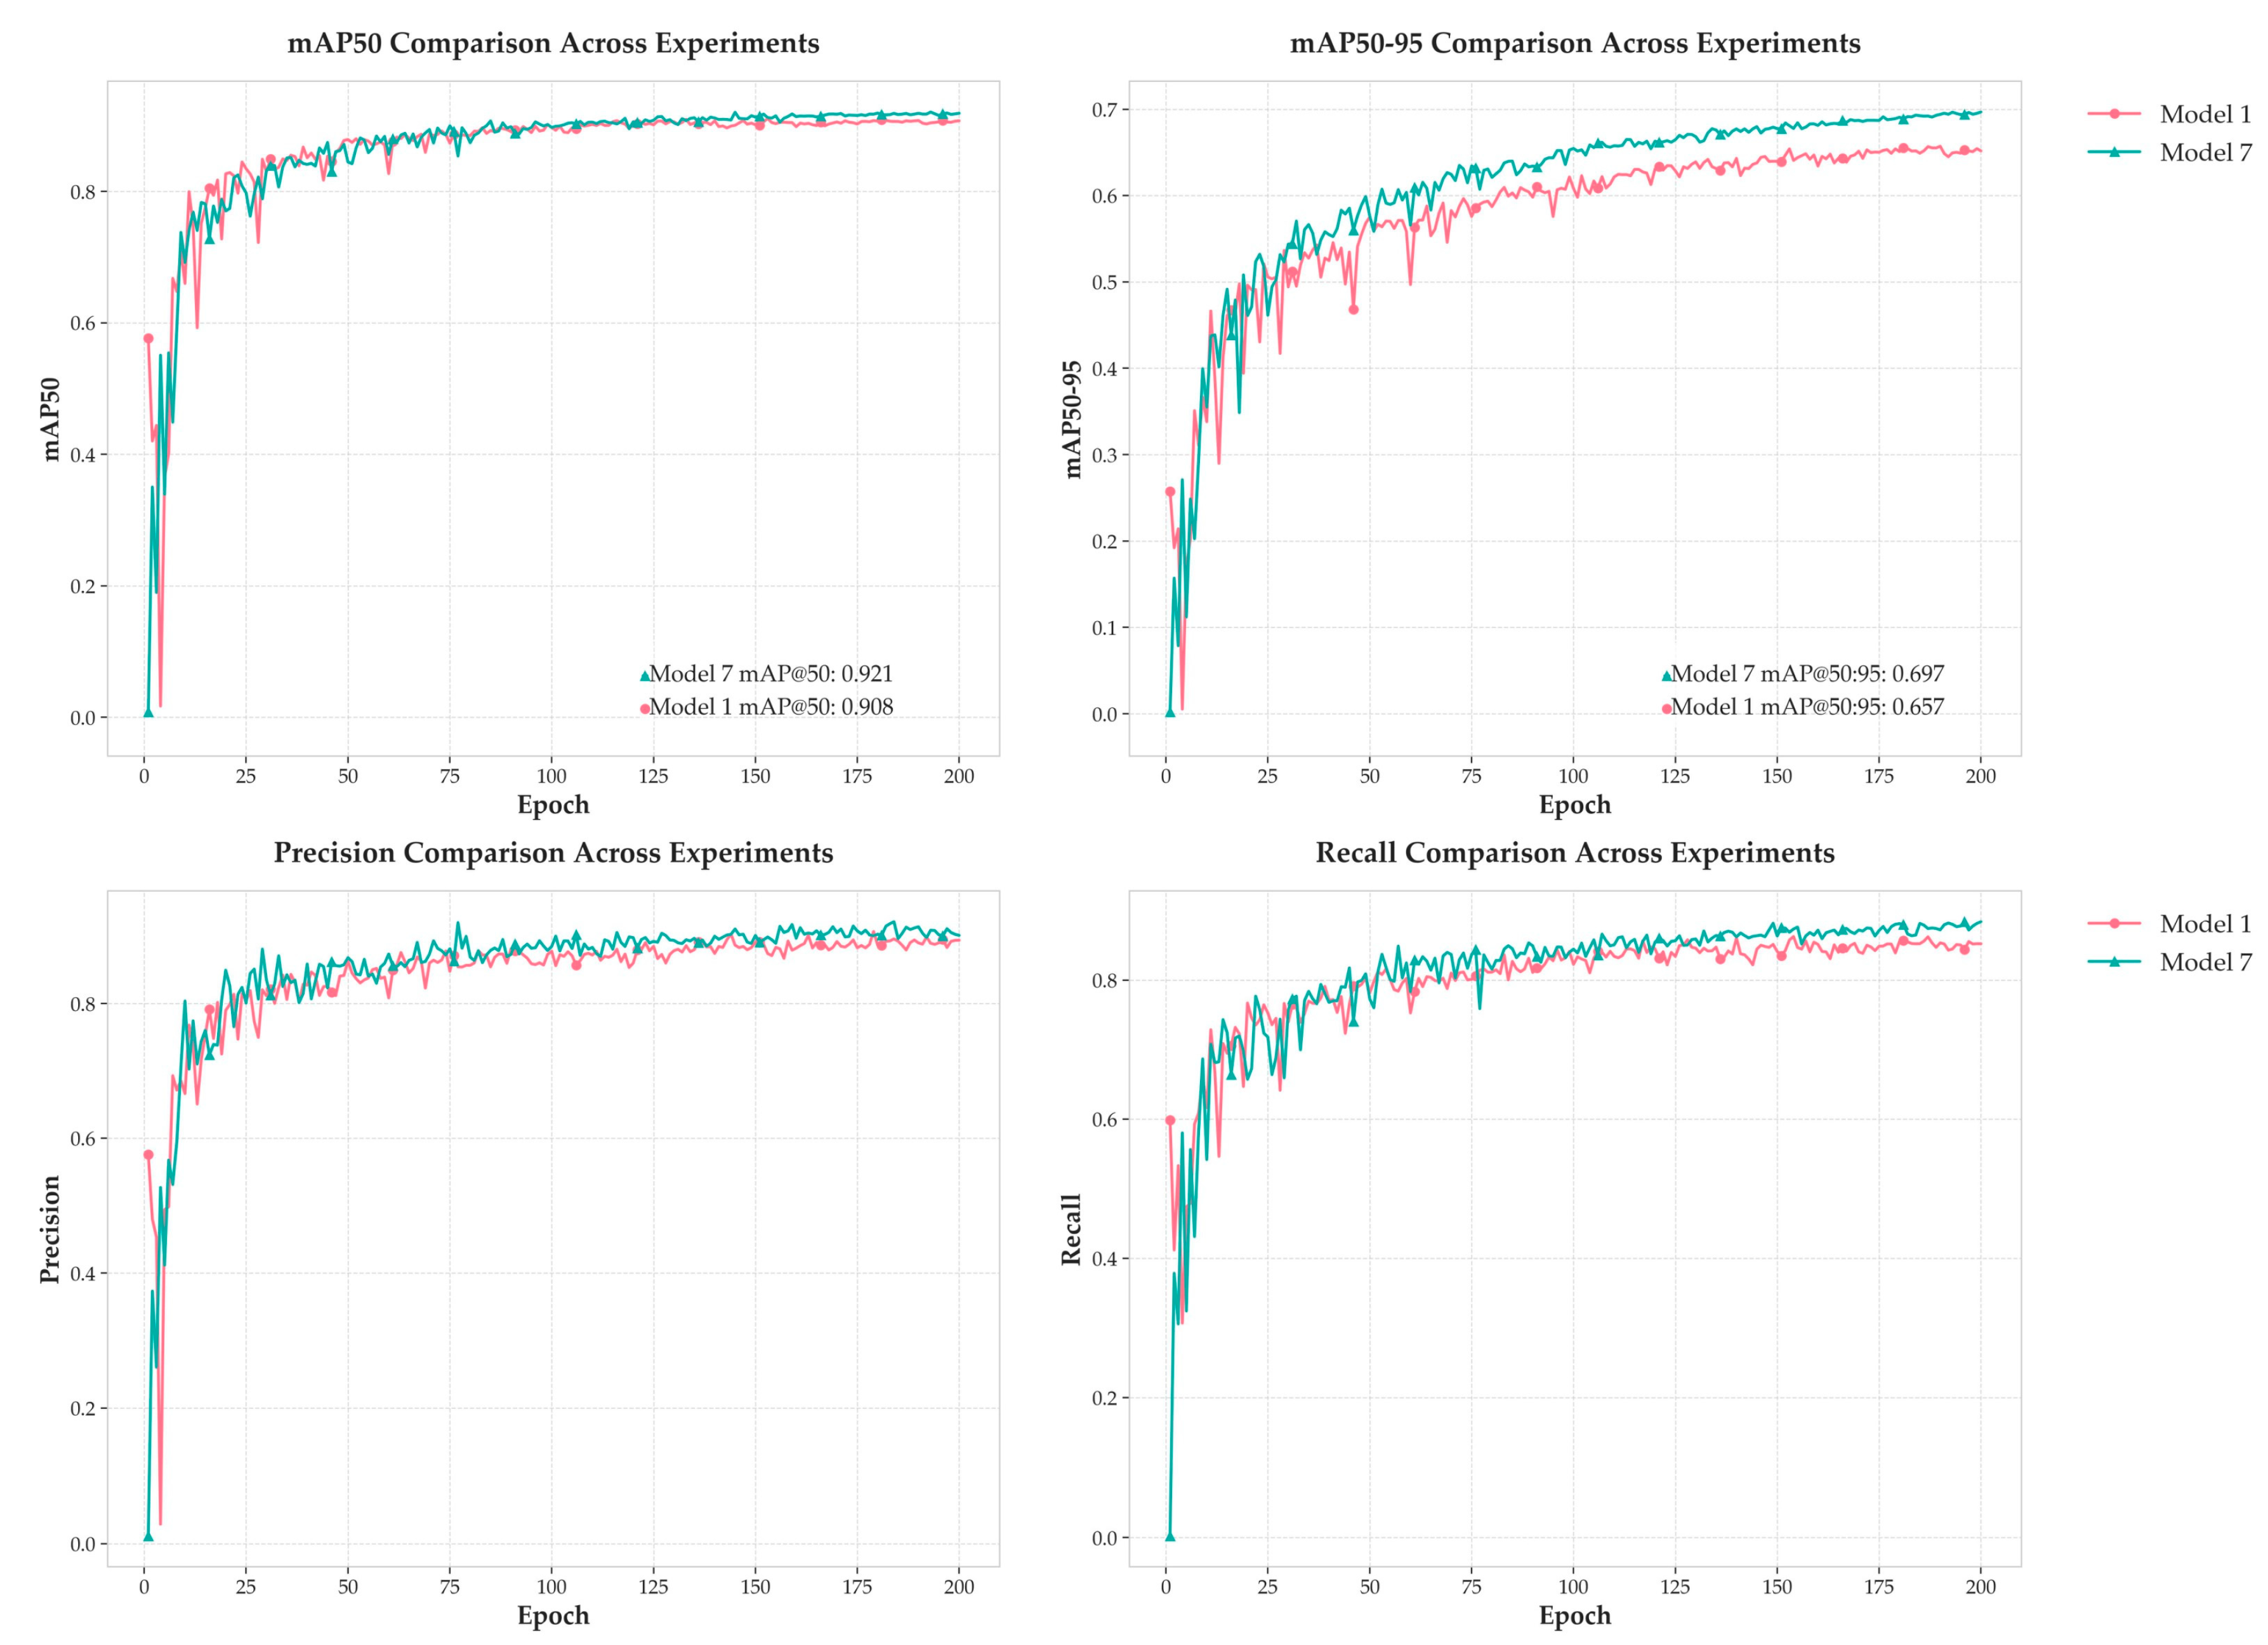
Figure 14.
Comparison of mAP@0.5 performance between MDB-YOLO and other SOTA models on the custom test set.
Figure 14.
Comparison of mAP@0.5 performance between MDB-YOLO and other SOTA models on the custom test set.
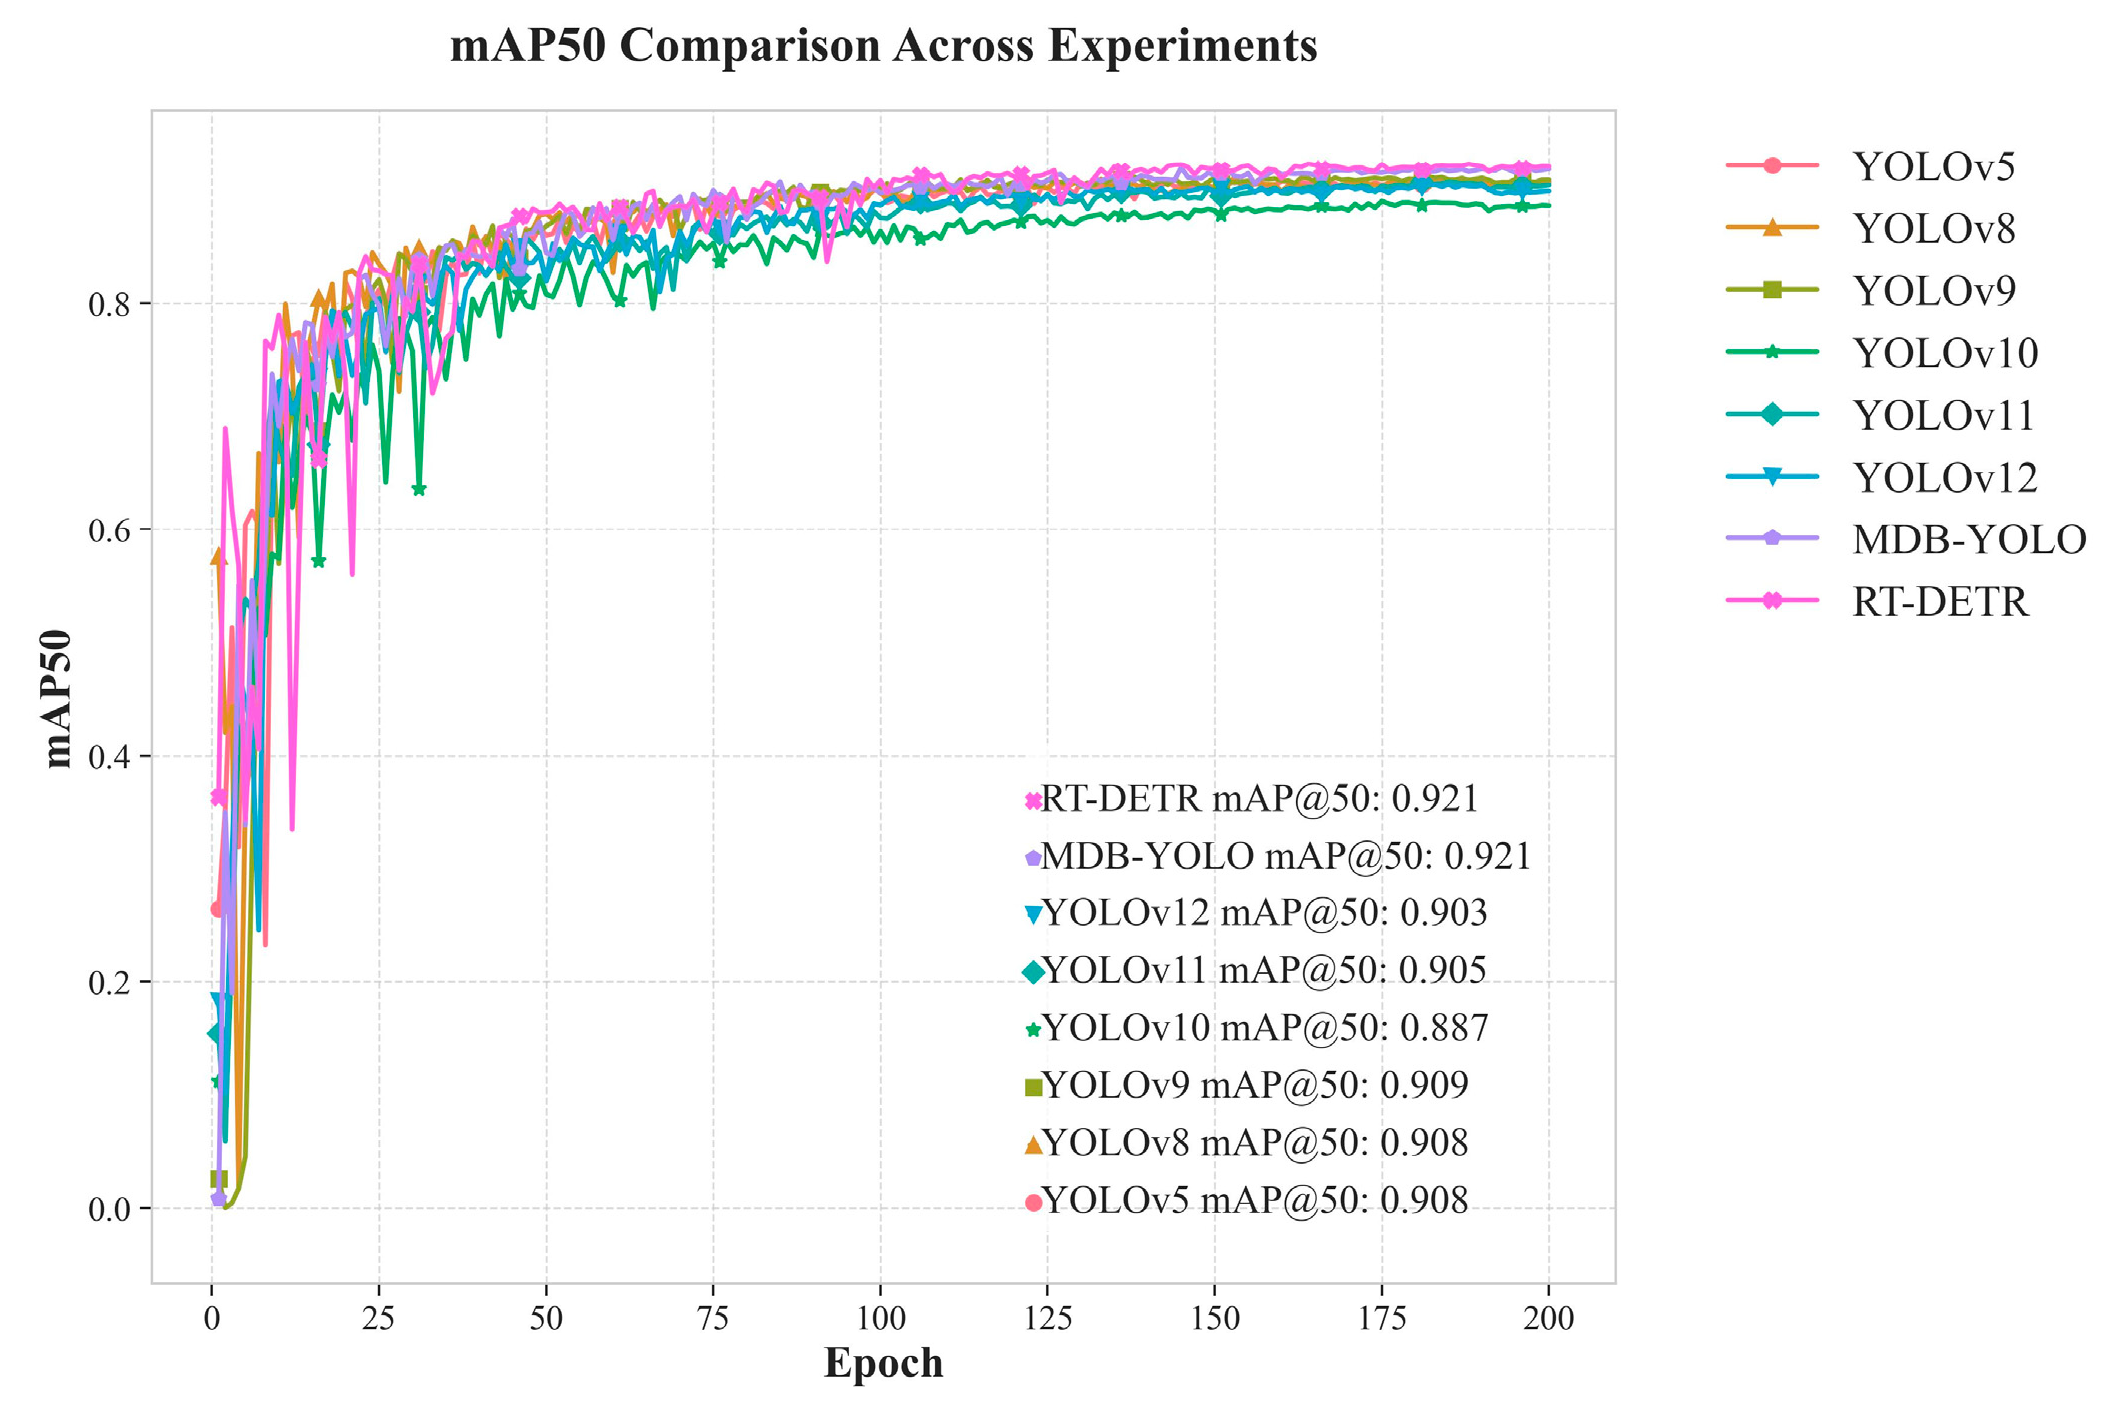
Figure 15.
The mAP trend during model training over 200 epochs, showing model convergence and learning dynamics.
Figure 15.
The mAP trend during model training over 200 epochs, showing model convergence and learning dynamics.
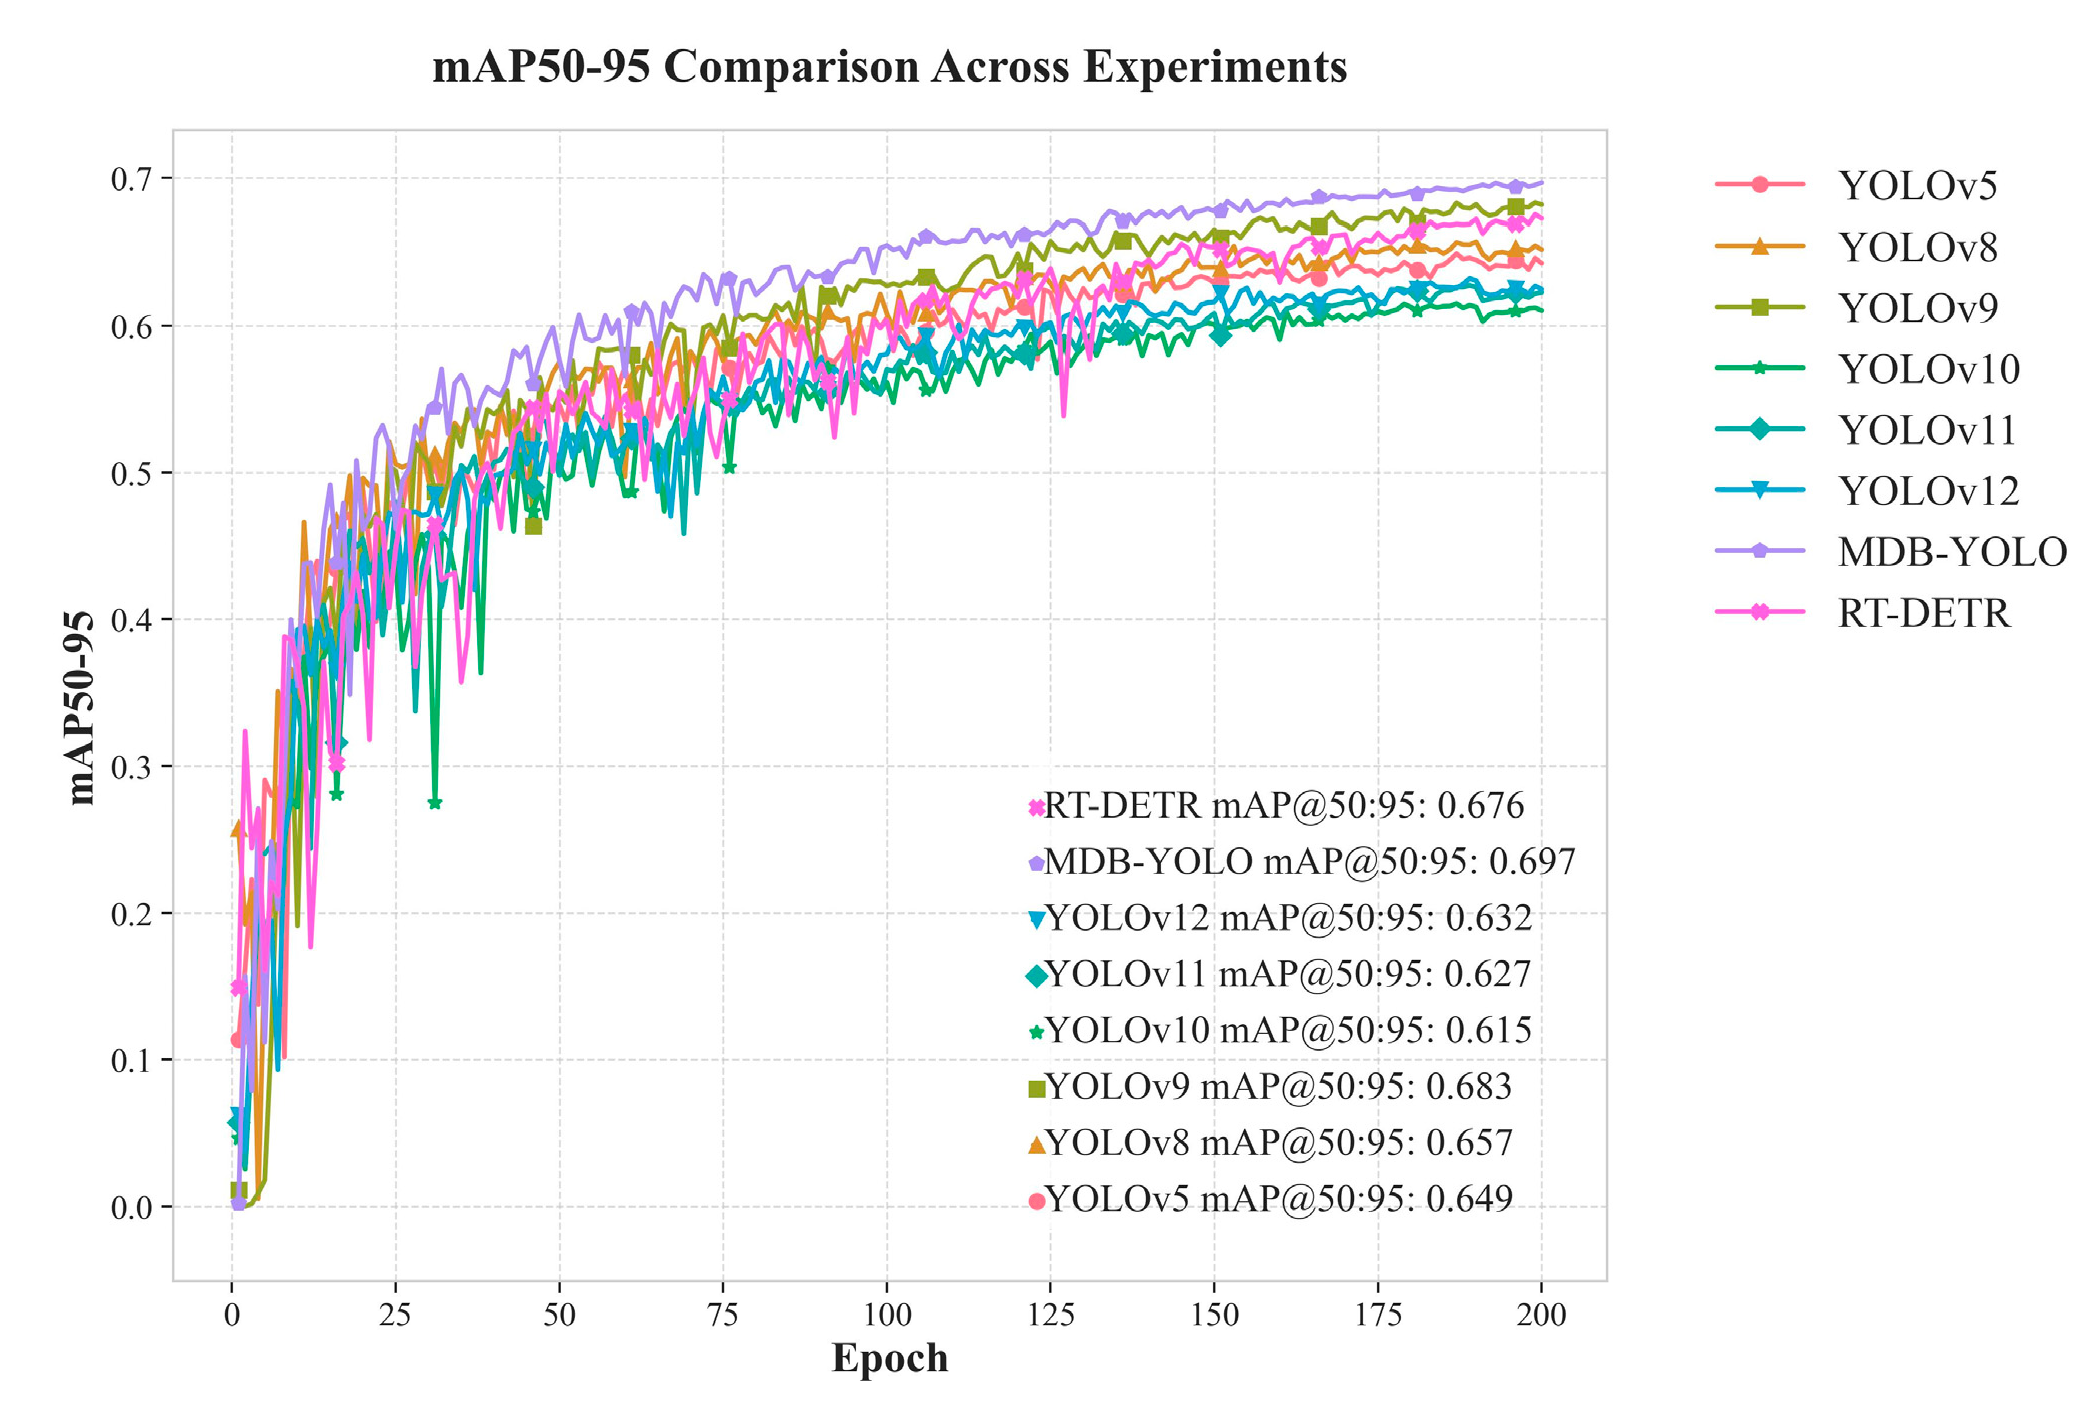
Figure 16.
Visual comparison of detection results on a challenging test image (Instance 1). MDB-YOLO successfully detects small fragments missed by the baseline.
Figure 16.
Visual comparison of detection results on a challenging test image (Instance 1). MDB-YOLO successfully detects small fragments missed by the baseline.
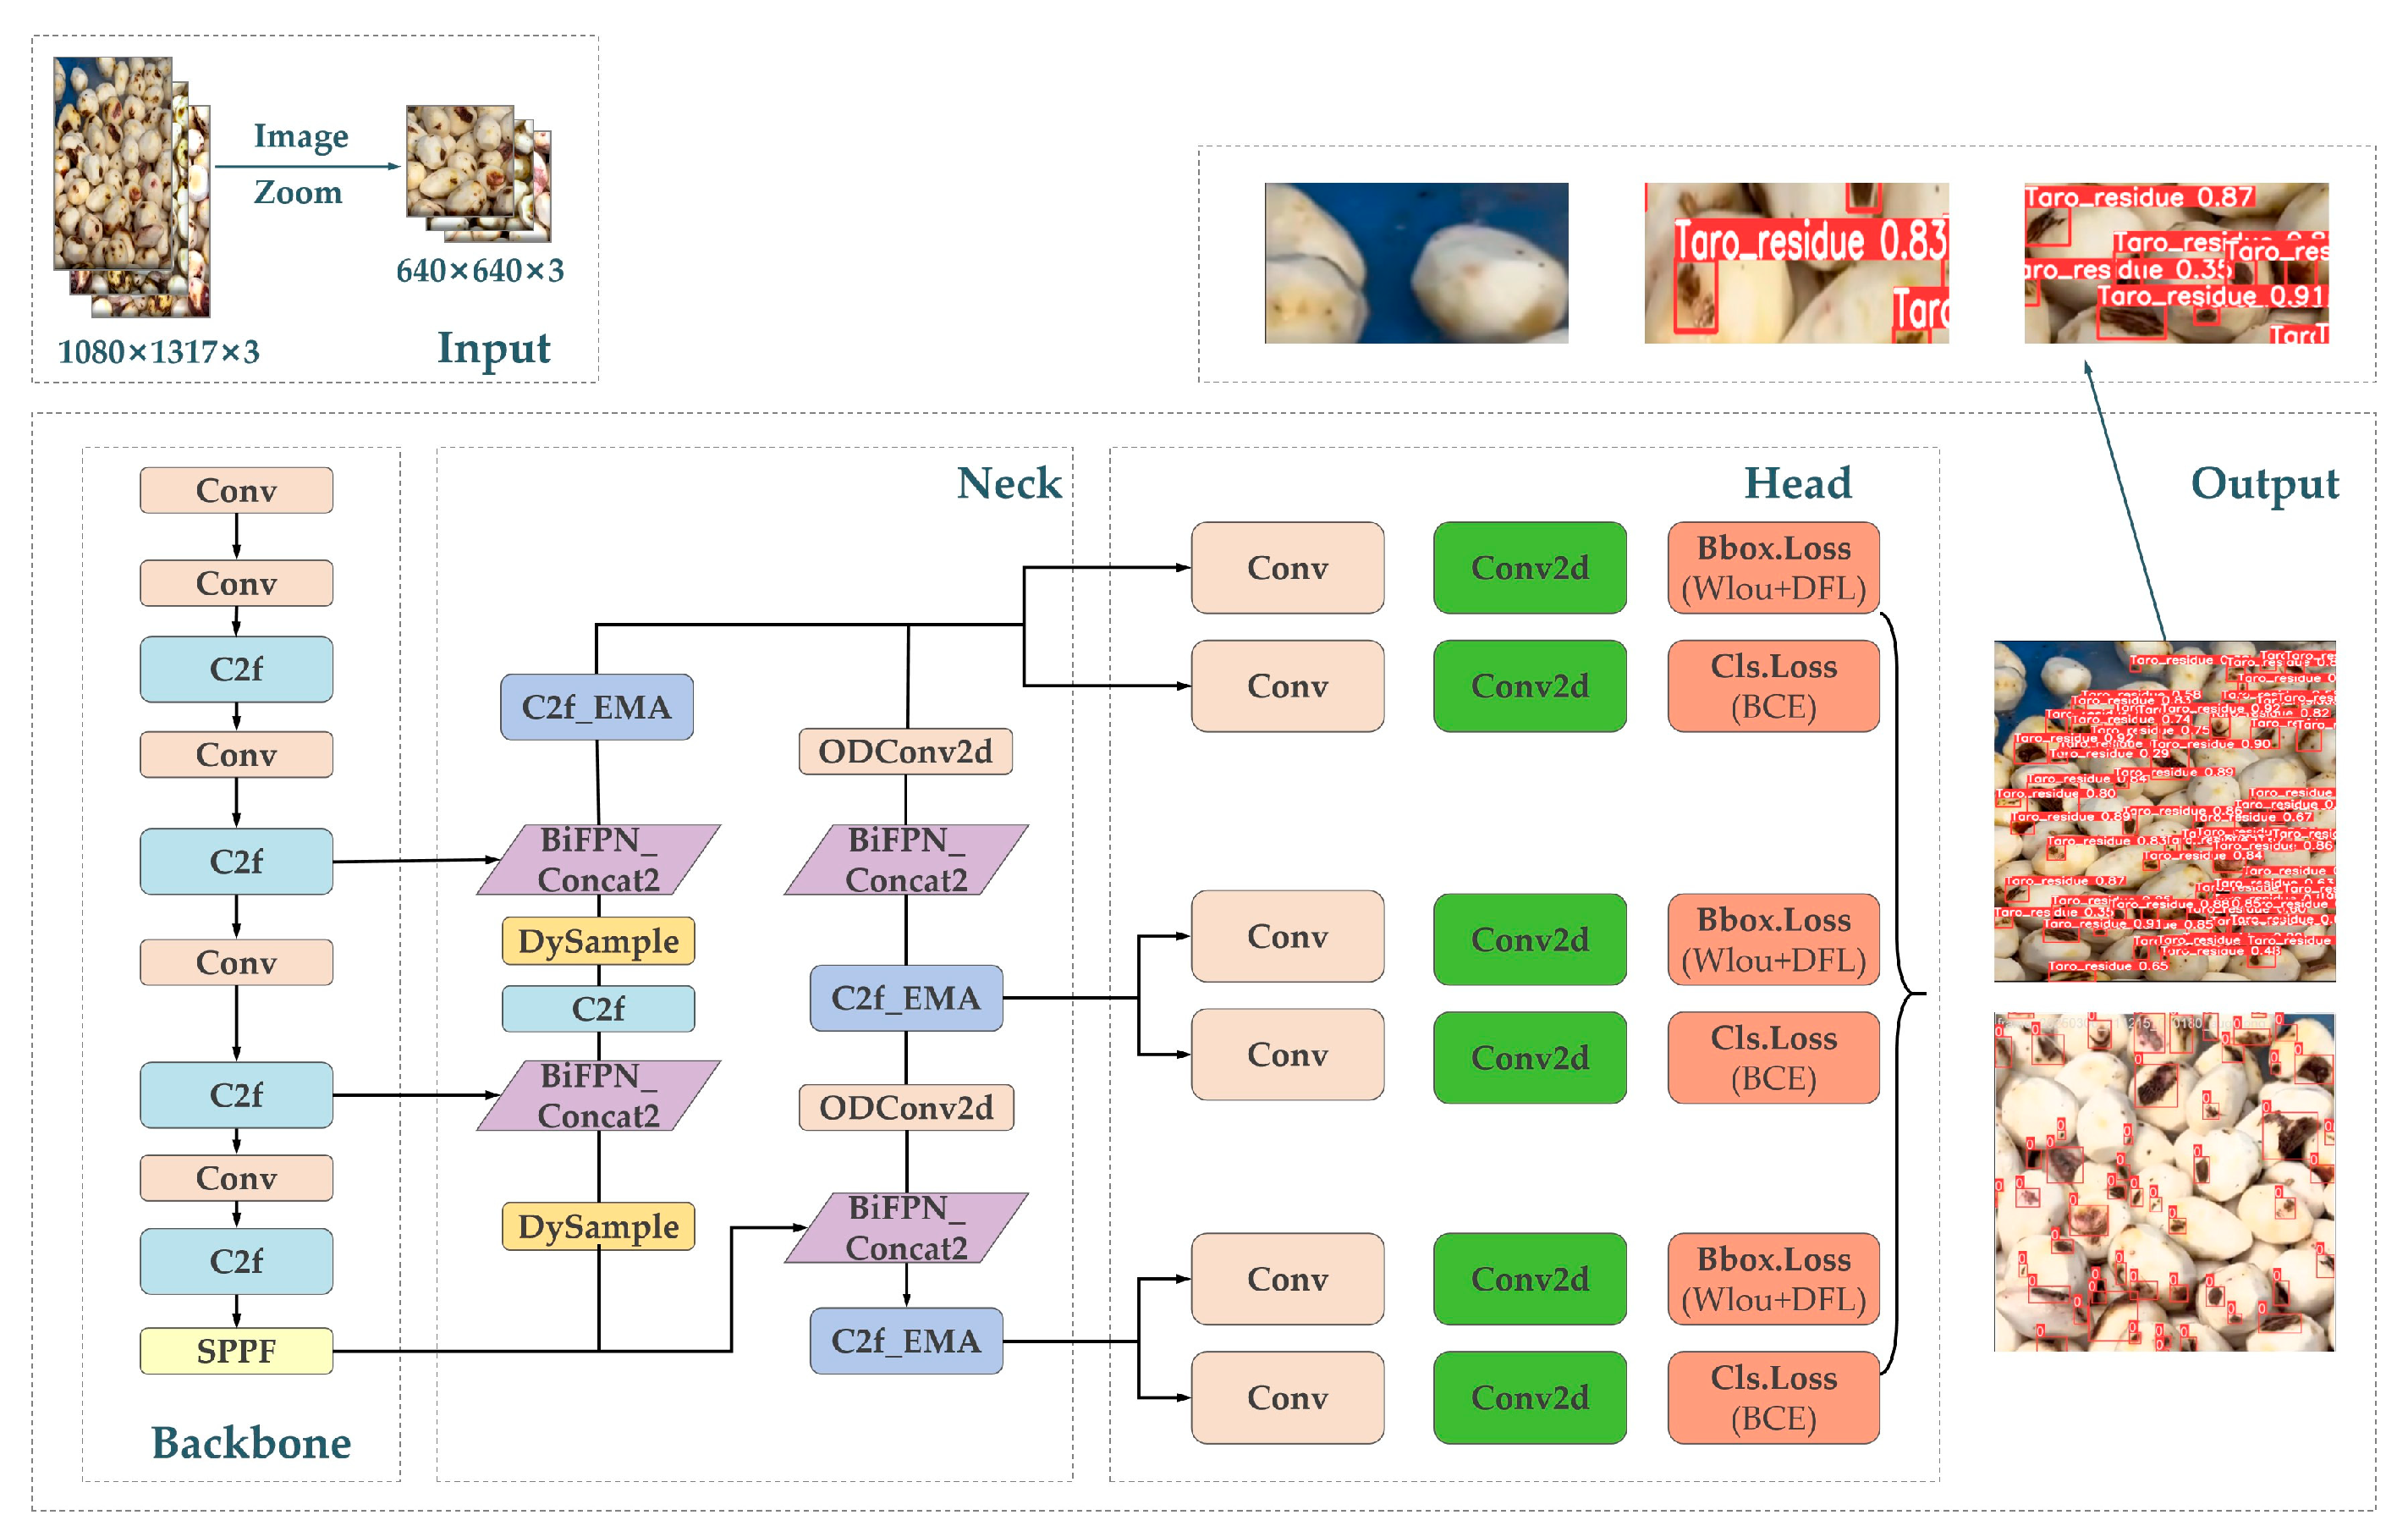
Figure 17.
Visual comparison on a second test image (Instance 2), further demonstrating MDB-YOLO's superior recall for small and clustered targets.
Figure 17.
Visual comparison on a second test image (Instance 2), further demonstrating MDB-YOLO's superior recall for small and clustered targets.
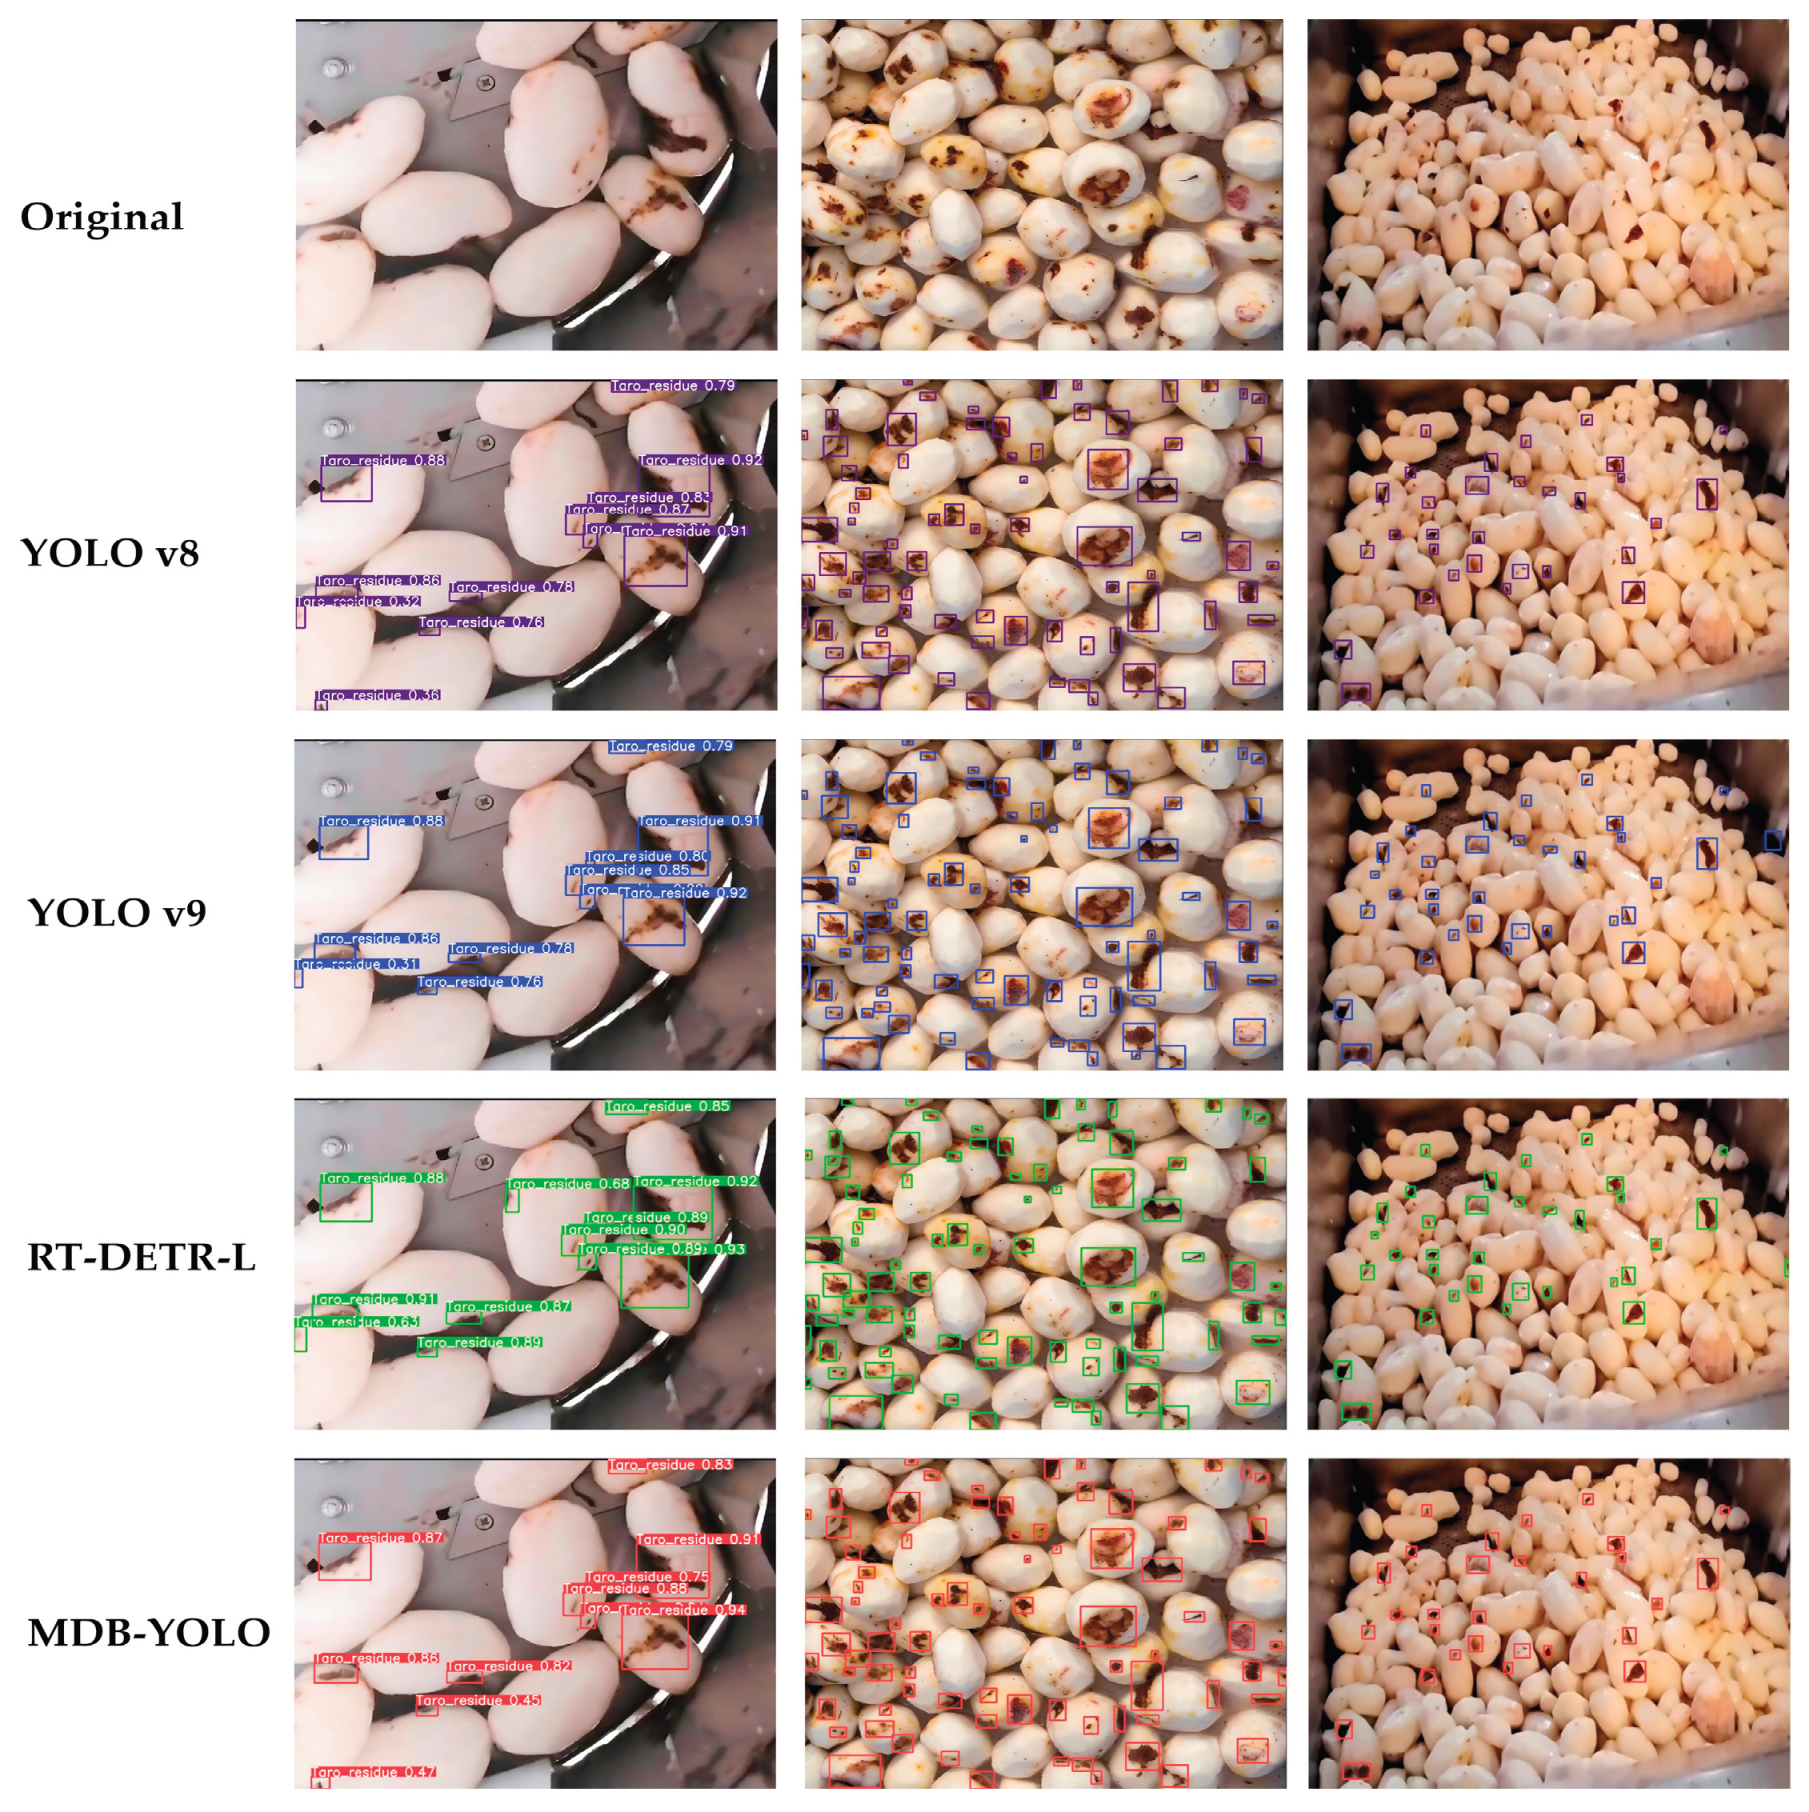

Table 1.
Characteristics of the Taro Peel Industrial Dataset (TPID).
| Characteristic | Value |
|---|---|
| Data Source | Operational Taro Processing Line (Dongguan Deying Food Machinery) |
| Image Resolution | 1920 × 1080 pixels |
| Total Images (Original / Augmented) | 282 / 1056 |
| Train/Val/Test Split (Images) | 739 / 212 / 105 |
| Total Instances | 18,341 |
| Train/Val/Test Split (Instances) | 13,071 / 3,225 / 2,045 |
| Annotation Tool | X-Anylabeling |
| Key Visual Challenges | Small targets (<20px), low contrast, dense clustering, occlusion, complex background textures, variable lighting, motion blur |
Table 2.
Ablation Study of MDB-YOLO Components on the TPID Validation Set.
| Model ID | Modifications | Parameters (M) | GFLOPS | mAP@0.5 (%) | mAP@0.5:0.95 (%) |
|---|---|---|---|---|---|
| 1 | YOLOv8s (Baseline) | 11.14 | 28.6 | 90.8 | 65.7 |
| 2 | Model 1 + C2f_EMA + WIoU | 11.18 | 29.3 | 91.4 | 65.2 |
| 3 | Model 2 + DySample | 11.20 | 29.3 | 91.6 | 65.8 |
| 4 | Model 3 + BiFPN_Concat2 | 11.20 | 29.3 | 90.7 | 65.4 |
| 5 | Model 4 + Soft-NMS | 11.20 | 29.3 | 90.9 | 68.6 |
| 6 | Model 5 + ODConv2d | 13.44 | 28.4 | 91.2 | 68.3 |
| 7 | MDB-YOLO (Model 6 + Hyperparameter Tuning) | 13.44 | 28.4 | 92.1 | 69.7 |
Table 3.
Table 3. Performance and Efficiency Comparison with SOTA Models on the TPID Test Set.
| Model ID | Parameters (M) | GFLOPS | Inference Time (ms) | Precision (%) | Recall (%) | mAP@0.5 (%) | mAP@0.5:0.95 (%) |
|---|---|---|---|---|---|---|---|
| YOLOv8s | 11.14 | 28.6 | 3.4 | 89.2 | 85.2 | 90.8 | 65.7 |
| YOLOv9-C | 25.53 | 103.7 | 7.3 | 90.1 | 84.5 | 90.9 | 68.3 |
| RT-DETR-L | 32.87 | 108 | 7.3 | 90.8 | 86.4 | 92.1 | 67.6 |
| MDB-YOLO (ours) | 13.44 | 28.4 | 2.0 | 90.9 | 0.88 | 92.1 | 69.7 |
Disclaimer/Publisher’s Note: The statements, opinions and data contained in all publications are solely those of the individual author(s) and contributor(s) and not of MDPI and/or the editor(s). MDPI and/or the editor(s) disclaim responsibility for any injury to people or property resulting from any ideas, methods, instructions or products referred to in the content. |
© 2025 by the authors. Licensee MDPI, Basel, Switzerland. This article is an open access article distributed under the terms and conditions of the Creative Commons Attribution (CC BY) license (http://creativecommons.org/licenses/by/4.0/).
Copyright: This open access article is published under a Creative Commons CC BY 4.0 license, which permit the free download, distribution, and reuse, provided that the author and preprint are cited in any reuse.


