
Submitted:
23 October 2025
Posted:
27 October 2025
You are already at the latest version
Abstract
The natural draft direct dry cooling system (NDDDCS) offers advantages over traditional forced draft air-cooled condensers and indirect natural draft systems, including reduced complexity, lower auxiliary power consumption, and improved thermal efficiency via direct condensation. This study investigates the transient cold start-up and operational performance of a large-scale (900 MWt) coal-fired power plant with vertically arranged heat exchangers under no-wind and crosswind conditions. A novel co-simulation approach couples a transient 3-D CFD air-side model (Ansys FLUENT) with a 1-D transient steam-side model (Python), integrated through PyFLUENT. Validated against previous steady-state models, the transient simulations capture complex airflow and thermal start-up behaviour. Four operational scenarios are analysed: windless start-up with step input, windless ramped load, ramped start-up under 9 m/s crosswind, and full-load turbine islanding. Results reveal significant flow and thermal inertia, causing a delayed response during start-up, though condenser pressure limits remain within safe bounds. Crosswind conditions enhance start-up performance, indicating beneficial airflow effects. The system demonstrates strong turbine islanding capability (100% to 265% load increase) without breaching low-pressure turbine protection limit. Design adjustments to the tower-to-heat exchanger layout are recommended to further improve start-up efficiency.
Keywords:
natural draft direct dry cooling system
; air cooled condenser
; transient start-up
; load ramp
; turbine islanding
; co-simulation
; vertically arranged
; system scaling
; wind speed
1. Introduction
Given the widespread international consensus on the impact of humanity on global warming [1], it is clear that a comprehensive overhaul of the power generation sector is imperative. The repercussions of global warming require a strategic pivot towards conserving vital resources such as water, which is expected to face severe scarcity with the projected increase in global mean temperature [2]. Moreover, with the per capita energy demand expected to double by 2050 [3], the power generation industry faces technical challenges ahead.
Dry cooling technologies offer inherent resource efficiency by minimising water wastage compared to wet cooling technologies [4]. Widely embraced in arid and semi-arid regions, these systems typically fall into two categories: direct and indirect dry cooling systems.
Among direct dry cooling systems, the most commonly adopted technology is air-cooled condensers (ACCs). In this system, the expanded steam from the low-pressure turbine is directed into finned tube bundles. These bundles, arranged in A-frames, are subjected to airflow that is mechanically driven by large-diameter fans. This airflow facilitates the condensation of steam, which is reused within the power cycle.
Indirect natural draft dry cooling systems, in turn, are often preferred in various applications [5]. These systems typically consist of two primary components: the cooling tower and the shell-and-tube condenser. In this configuration, the condenser receives expanded steam, facilitating condensation on the outer surface of the condenser tubes by transferring thermal energy to the water circulating within the tubes. The heated water is then pumped to the cooling tower, where it undergoes air cooling via finned tube bundles. As a result, the heated air rises, inducing an updraft that drives airflow through the cooling tower.
Much like ACCs [6], indirect natural draft dry cooling towers suffer from decreased performance in the presence of crosswinds. The sensitivity of the tower to these winds is influenced by several factors, including its scale, finned tube attributes, geometric ratios, and heat exchanger arrangement [7]. An extensively researched mitigation solution involves installing windbreaker walls [8], which can be either internal or external. Internal windbreaker walls prove advantageous in high wind conditions [9] and have demonstrated benefits for small-scale cooling towers as well [10]. Additionally, swirl induction platforms have shown promise in reducing cold inflow effects and crosswind sensitivity in small-scale systems [11]. On the other hand, external windbreaker walls perform well under lower crosswind speeds and are available in solid or radiator-type constructions [12]. Furthermore, windbreaker walls enhance system performance in multi-tower arrangements [13]. Lastly, contemporary wedged heat exchanger arrangements offer notable performance benefits [14].
When comparing ACCs and indirect natural draft dry cooling systems, distinct features emerge. ACCs boast high thermal efficiencies and compactness, yet they require fans and fan drives for airflow, leading to elevated operational costs and frequent maintenance. Conversely, indirect natural draft dry cooling systems are sizable and include expensive shell-and-tube condensers, demanding substantial capital investment [15]. However, they do not require fan drives, offering passive cooling with associated maintenance cost savings.
While both ACCs and indirect natural draft dry cooling systems are utilised worldwide, there’s a growing interest in developing a cooling system that combines the beneficial aspects of both mentioned technologies. This system would boast high thermal efficiency, eliminate the need for fan drives, forego separate components like shell-and-tube condensers, and significantly reduce operational costs. The natural draft direct dry cooling system (NDDDCS) has been proposed as a system that meets these objectives.
Foundational studies on the NDDDCS have explored various aspects, including heat exchanger arrangement [16,17,18], tower shape [19], the effectiveness of windbreaker walls [20], and the scalability and relative performance of the system [21], employing 3-D CFD simulations under steady-state conditions. Additionally, sensitivity studies on tower geometry have been conducted using 1-D models, building upon the groundwork laid by Krger [22,23]. While these investigations offer insights into the steady-state performance of NDDDCSs under both calm and windy conditions, there is still considerable research to be done in this field.
In all the aforementioned 3-D CFD studies, a constant saturated steam temperature boundary condition was utilised to approximate the behaviour of the heat exchangers which are subjected to internal steam flow. While this approach is suitable for assessing relative NDDDCS performance, it diverges from actual operational conditions because the system would receive a variable steam supply rate from the associated power cycle.
Having investigated some of the major aspects of steady-state NDDDCS performance, the study of the transient performance of such systems follow logically. Additionally, the current work is motivated by a long-standing concern among power plant operators and cooling system contractors about the ability of NDDDCSs to support cold plant start-up. These concerns originate from the following argument: unlike indirect natural draft dry cooling systems, which can circulate water through their finned tubes, the NDDDCS relies on steam for this purpose, necessitating the creation of vacuum conditions within the finned tube bundles. ACCs typically utilise fans to generate airflow over the vacuum-induced finned tube bundles, facilitating start-up [7]. However, the NDDDCS faces a unique challenge: it requires airflow across its heat exchangers to condense the steam, yet internal steam flow is needed to induce the natural draft-driven airflow. Insufficient heat rejection capability during cold-start conditions may result in an excessive build-up of steam back pressure due to inadequate condensation, potentially preventing the plant from starting up.
CFD studies focusing on small-scale indirect natural draft dry cooling towers, by Dong et al. [24,25,26], provide insights that parallel the aforementioned research. These studies delineate four stages in the start-up process: stagnation, plume dominant, draft dominant, and overshoot. Furthermore, researchers utilise the Richardson number to discern between natural, mixed, and forced convection flow regimes. Results for their 1-D model [25] indicate reduced start-up times with higher heat exchanger temperatures, albeit at the expense of increased transition (mixed convection) phases. Subsequently, a 2-D CFD model indicated reduced start-up times relative to those predicted by the 1-D model [26], highlighting start-up enhancing 2-D airflow effects. Lastly, a 3-D CFD investigation [24] showed that start-up performance is improved when either the natural draft or the crosswind dominates the draft driving potential of the system. Moreover, start-up time did not increase with crosswinds exceeding 9 m/s. In the investigated small-scale indirect natural draft dry cooling tower, horizontally arranged heat exchanger bundles were employed, aligning the direction of natural convection plumes parallel to the steady-state flow direction. However, the NDDDCS under scrutiny here utilises vertically arranged heat exchanger bundles. This configuration causes the direction of airflow to vary depending on the dominant convective flow regime.
This study aims to address the gap in the literature concerning the transient start-up characteristics of NDDDCSs. It does so by developing a transient co-simulation model, which integrates adapted versions of previously validated 1-D [27] and 3-D CFD models [21], to characterise the start-up performance of the NDDDCS under windless and windy conditions. The analysis considers a large-scale system (900 MWt) intended for a coal-fired power plant. Simulation results from the adapted transient 1-D model are compared with those from the transient co-simulation model, emphasizing their differences and revealing the limitations of the 1-D model. Both the transient 1-D and co-simulation models offer original contributions to the literature by simulating the transient start-up behaviour of the system in an operationally realistic manner, incorporating a variable steam supply rate as an independent boundary condition. The transient 3-D CFD model (forming part of the co-simulation model), adapted from a previous steady-state model [21], incorporates its same features such as an atmospheric pressure gradient, a porous zone heat exchanger formulation, adaptive source terms triggered by reverse flow, and a user-defined scalar used as a transport equation for the upstream air temperature.
The manuscript is organized as follows: Section 2 begins by defining the reference tower geometry for each system scale and the finned tube dimensions (Section 2.1). It then details the equations used in the transient 1-D numerical model (Section 2.2) and the setup of the transient 3-D CFD model (Section 2.3), including boundary conditions (Section 2.3.1), and the heat exchanger modelling approach (Section 2.3.2). Following this, subsequent sections outline the co-simulation calculation procedure and program logic (Section 2.4), discuss the convective flow regime monitoring approach (Section 2.5), and covers the convergence criteria and solution initialization (Section 2.6), respectively. Thereafter, the mesh independence and uncertainty analyses (Section 2.7), as well as the time step independence analysis (Section 2.8) and the validation of both the 1-D and co-simulation models (Section 2.9), are respectively addressed. Section 3 describes the simulation protocols and specifications, while Section 4 presents and discusses the simulation results. Section 5 draws conclusions from the work, and Section 6 discusses the study’s implications and limitations, while suggesting potential avenues and improvements for future research.
2. Modelling
2.1. Reference Geometries
A reference system geometry is established for a large-scale NDDDCS with vertically arranged heat exchanger bundles. The work of Krger [7] is foundational to this study, and as such, corresponding empirically tested double-row condenser tubes [7] are adapted for this study. To match modern condensing system designs, the steam-side cross-sectional area, pressure drop and heat transfer characteristics of the double-row configuration are combined to form an effective single-row tube. Inherently, due to the lumping of the double-row tube characteristics into a single-row tube, the air-side pressure drop will be higher than is usually expected from an actual single-row finned tube.
A schematic of the NDDDCS is shown in Figure 1 (a), while an illustration of the condenser tube is shown in Figure 1 (b). The dimensions for both the tower and finned tubes are listed in Table 1. The numbers shown in Figure 1 (a) relate to important positions throughout the tower flow domain, where 1 is the ground level, 2 is half the heat exchanger height, 3 is the inlet diameter, 4 is the inlet height, and 5 is the tower outlet. The height of the tower throat is selected as a fixed ratio (0.91) relative to the tower inlet diameter (), and the diameter thereof is equivalent to the outlet diameter [17]. Furthermore, the tower geometry incorporates a shell thickness, which is crucial for accurately capturing cold inflow effects [21].
2.2. Transient 1-D Numerical Model
A thermofluid network approach was combined with correlations from Krger [7] in order to create the 1-D model. Section 2.4 discusses how these equations are incorporated in the development of the co-simulation model. The equations are derived explicitly from first principles, assuming the entire steam- and air-side as one control volume, respectively. All properties are calculated using CoolProp. The pressure drop on the steam-side is assumed to be negligible, thus the presentation of a steam-side momentum equation is omitted. The mass, momentum and energy conservation equations are derived for the air-side. The steam density at the next time step is calculated via:
where represents the time step. The condenser tube volume is given by , while is the steam condensation rate and is the steam density at the current time step. Note that denotes the steam mass flow rate, which is the independent boundary condition, and can be fixed or time-varying (). The internal energy of the steam at the next time step is calculated using:
where the current internal energy is represented by . The enthalpy of steam entering the condenser tubes is represented by , while is the enthalpy of the exiting condensate. The steam-to-tube and tube-to-air heat transfer rates, and , are described by:
where , and represent the tube wall, inlet air (at half the heat exchanger height) and inlet saturated steam temperature, respectively. The air mass flow rate is given by , with representing the average specific heat capacity of air. The heat exchanger effectiveness is denoted by , while represents the condensation heat transfer coefficient and the condenser tube wall internal area. The tube wall temperature is assumed to be uniform throughout, and is described by:
where is the tube wall temperature at the next time step, is the mass of the condenser tubes and is the specific heat capacity of the tubes. The condensation heat transfer coefficient is given by:
where represents the number of tubes per bundle and refers to the total number of bundles. The thermal conductivity, density, modified latent heat of vaporization and dynamic viscosity of the condensate are given by , , and respectively. The modified latent heat of vaporization accounts for steam superheating effects via:
where the latent heat of vaporization (based on the steam saturation temperature) is given by and the vapour enthalpy, , is represented by:
where and represent the specific heat and temperature of the superheated vapour, respectively. The specific heat of the vapour is used instead of an average property value to ensure a more conservative estimate. It is assumed that the condensate film acts as a barrier between the steam vapour and the condenser tube wall. The heat exchanger effectiveness, , is described by:
Due to the inclusion of the tube wall temperature in the energy balance of Equations (3) and (4), which effectively separates the steam- and air-sides, the overall heat conductance is equivalent to the air-side heat conductance, represented by:
where is the average thermal conductivity of air, is the mean Prandtl number of air, is the total frontal area of the heat exchanger bundles and is the characteristic heat transfer parameter. This parameter describes the heat transfer characteristics of the finned tubes, defined by:
where refers to the characteristic flow parameter, which is calculated via:
where refers to the mean dynamic viscosity of air. The mass flow rate of condensate leaving the condenser tubes is calculated as:
The heat transfer rate on the air-side is given by:
where and are the respective enthalpies of air exiting and entering the NDDDCS control volume. Note that corresponds to the inlet air temperature at half the heat exchanger height (). The air mass flow rate at the next time step is calculated via:
where the average area between the inlet and outlet diameter of the NDDDCS is given by . The draft driving potential and pressure loss throughout the NDDDCS are represented by and . The air travel distance is defined as:
where is the thickness of the heat exchanger, and the vertical air travel distance, , is described by:
The pressure balance in Equation (15) consists of the draft equation taken from the work of Krger [7]. Thus, the draft driving potential is:
where and are the atmospheric temperature and pressure at zero elevation and is the air temperature after the heat exchangers of the NDDDCS. The flow resistance is given by:
where , , and represent the inlet louvre, heat exchanger delta, tower, and tower support loss coefficients. The outlet loss coefficient and velocity correction factor are represented by and respectively. The density of air exiting the tower is represented by , with the mean air density given by . The corresponding tower outlet area is . The heat exchanger delta loss coefficient () incorporates redirection, entrance contraction, and downstream losses experienced by the air. This loss coefficient is described in [7], and is calculated via:
where and denote the density of air before and after the heat exchanger, respectively. The downstream and entrance contraction losses are represented by and . The non-dimensional pressure drop coefficient of the finned tube bundles, , is given by:
The mean angle of airflow incident into the heat exchangers is given by:
where is half the heat exchanger delta apex angle. The downstream loss is calculated using:
The entrance contraction loss to the heat exchanger is defined by:
where is the minimum to free stream area ratio, calculated as:
where is the volume occupied by the finned tube bundles and is the total air and heat exchanger volume. The contraction loss, , is given by:
where is the contraction ratio, determined by:
The reader is referred to [23], where some of the other loss factors () are further elaborated on. The enthalpy of air leaving the NDDDCS control volume is calculated via:
where is half of the NDDDCS air-side flow volume, due to the thermofluid network approach utilised.
2.3. Transient 3-D CFD Model Setup
The transient 3-D CFD model was developed using ANSYS FLUENT 2024 R1. As many aspects of the foundational steady-state 3-D CFD model are thoroughly described in previous work [21], only the main equations and settings are highlighted in the sections that follow. Table 2 lists the general transport equations that describe compressible fluid flow, while ignoring viscous stresses.
In the equations provided in Table 2, represents the velocity vector, and denotes the fluid density. Viscosity is denoted by , while signifies the turbulent viscosity. Thermal conductivity is represented by k. Momentum and energy sources are included via S, and indicates the energy dissipation term. The velocity components in the x-, y-, and z-directions are given by u, v, and w, respectively.
The model employs the k- shear stress transport (SST) turbulence model, which implements the enhanced wall treatment option by default in FLUENT. The pressure-velocity coupling is solved using the SIMPLE algorithm [28]. The second-order upwind differencing scheme is implemented to discretise all the governing equations. Additionally, air is modelled as an ideal gas. The bounded second-order scheme is used for the temporal discretisation, while the PRESTO! pressure interpolation scheme is also utilised. Gradients are computed using the least squares cell-based method. The elevation-dependent pressure gradient is given by:
with the scale height described as:
where represents the constant atmospheric temperature, g denotes the gravitational acceleration, z is the elevation above ground level, R is the universal gas constant, and represents the molecular weight of air. The operating pressure, denoted as , is prescribed as 101325 Pa, while the operating density is set to zero [29].
2.3.1. CFD Model Boundary Conditions
The domain is proportionally sized relative to the NDDDCS to ensure that boundary effects do not unrealistically influence the system flow characteristics as per [16,17]. The domain is schematically illustrated in Figure 2, and has a radius of 2000 m and a height of 1000 m.
For the no-wind scenarios, the inlets are both prescribed a pressure inlet boundary condition, with the upper boundary of the domain being the pressure outlet. For the crosswind scenarios, the inlet is assigned a velocity inlet boundary condition, while the outlets are designated as pressure outlets. Due to the assumed axisymmetric nature of the simulation, a symmetry boundary condition is applied at the domain mirror plane [16,17]. The tower shell, clapboard and ground surface are treated as adiabatic walls with a designated no-slip condition. The turbulence intensity and viscosity ratio are set to 0.1% and 0.1, respectively, matching the values adopted by Kong et al. [17]. The wind profile used in this study is given by:
where denotes the crosswind velocity, while is the reference wind speed at a prescribed height of 10 m. The wind profile index, e, is assumed to be 0.2 as per [7,16,17].
2.3.2. CFD Heat Exchanger Modelling
The heat exchangers are modelled as a porous media zone with volumetric momentum and energy source terms. The superficial velocity formulation is employed, as the relevant heat exchanger characteristics were empirically determined using the approach velocity of air [7]. All properties refer to conditions within the porous zone.
Previous work has studied NDDDCS steady-state performance under windless and windy conditions, thus a constant saturated steam temperature was assumed. To incorporate the desired inlet steam mass flow rate boundary condition, similar to the 1-D equations presented in Section 2.2, the steam- and air-side must be separated via a tube wall temperature. Consequently, the energy source term is adapted from previous work [21] as follows:
where is the velocity magnitude of air through the porous zone, is the specific heat capacity thereof, is the air density, is the heat exchanger thickness (0.18 m), is the tube wall temperature (received from the 1-D model via Equation (5)), represents the inlet air temperature to the heat exchanger and is the heat exchanger effectiveness based on the air-side of the tubes.
It is assumed that there are no pressure losses on the steam-side, in line with previous studies [16,17]. The effects of possible condensate subcooling under crosswind conditions are neglected for this study, however the effects of steam superheating are incorporated, as described in Equations (7) and (8).
Although the atmospheric temperature is constant, the inlet air temperature to the heat exchanger will vary with time and space as recirculation effects occur. A user defined scalar (UDS) field is thus utilised in conjunction with the energy source term employed in the porous zone, by acting as a transport equation for the upstream air temperature () information. This UDS field does not interact with the flow field, as the flux is set to zero.
Reversed airflow is accounted for via:
where refers to the air temperature within the porous zone, representing the outlet air temperature of the heat exchanger. Under conditions of reversed flow, the heat exchanger effectiveness is assumed to approach unity.
Note that Equations (1) and (2) are applied to the co-simulation and determine the state of the inlet steam at the next time step for the co-simulation. This implies that for every respective time step, all the NDDDCS heat exchangers are subject to the same uniform saturated steam temperature. The pressure drop through the porous zone can be described by:
where refers to the sum of all non-dimensional pressure drop loss factors. This work does not geometrically model the inlet louvres or tower supports, and thus includes these losses in the total loss through the heat exchanger. The total loss is described by:
where and assume constant values of 0.69 and 2.5, respectively. The inertial () and viscous () loss coefficients are employed to represent the pressure drop within FLUENT, given by:
When simulating tube banks, it is common practice to neglect the viscous term in Equation (36) [29,30]. Equation (34) can be reformulated as a body force by dividing it by the heat exchanger thickness, . Consequently, it can be equated to Equation (36), where the inertial loss coefficient, , is then expressed as:
2.4. Co-Simulation Calculation Procedure
Starting from the initial conditions, the simulation proceeds in a sequential manner. The 1-D steam-side model first advances the solution by calculating the following: the updated steam density (Equation (1)), steam internal energy (Equation (2)), tube wall temperature (Equation (5)), condensation heat transfer coefficient (Equation (6)), steam-to-tube heat transfer rate (Equation (3)), and steam condensation rate (Equation (13)).
Among these, the updated tube wall temperature (Equation (5)) is the only variable required as input to the 3-D CFD simulation. The CFD model then computes the local heat source term using Equation (32) (adapted from Equation (4)), which incorporates the heat exchanger effectiveness (Equation (9)), overall heat conductance (Equation (10)), characteristic heat transfer parameter (Equation (11)), and characteristic flow parameter (Equation (12)). All of these equations are adapted such that they are calculated on a per-cell basis.
Subsequently, the total heat energy transferred to the air is computed within the 3-D CFD simulation as , which is equivalent to . This value is then passed back to the 1-D steam-side model, completing one iteration of the coupled simulation loop.
2.5. Convective Flow Regime Monitoring
This work utilises the Richardson () number, in accordance with the approach of Dong et al. [26], to identify the specific convective flow regime (natural, mixed, or forced) present during the transient start-up process. The Richardson number is described by:
where L is the characteristic length, which is equivalent to the heat exchanger thickness (), is the thermal expansion coefficient and v is the velocity of air. Note that corresponds to the air temperature at half the heat exchanger height (applicable to the 1-D model), which is interchangeable with , the cell-level inlet air temperature of the 3-D CFD simulation.
Due to the porous zone formulation, airflow can only flow through the heat exchangers in the perpendicular (horizontal) direction. Thus, the heat exchanger thickness is consistently selected as the characteristic length. The thermal expansion coefficient is defined by:
Similar to the approach of Dong et al. [26], the Richardson number is logarithmically scaled, due to the variance in Richardson number spanning several orders of magnitude. Thus (or ) indicates that forced convection dominates, whereas (or ) signifies that natural convection effects are dominant. Mixed convection occurs when (or ).
2.6. Convergence Criteria and Solution Initialisation
The convergence criteria for the 3-D CFD simulations were defined based on the scaled residuals of the governing equations. Specifically, the continuity equation was considered converged when its residual dropped below . For the momentum equations in the x, y, and z directions, a stricter criterion of was applied. The residual thresholds for the turbulence quantities were set to for the turbulent kinetic energy and for the turbulent dissipation rate. Lastly, the energy equation was deemed converged when the residual fell below . The 1-D model is accepted as being converged when the differences between , and are below .
Monitored variable trends include the air mass flow rate, total heat transfer rate, air-side pressure drop (analogous to the draft driving potential), inlet and outlet air temperatures and Richardson number. The differences in air mass flow rate between time steps are continuously evaluated, with values less than indicating convergence. However, these differences are considered in conjunction with the overall trends of the monitored variables, as pseudo steady-state conditions can be qualitatively assessed. Additionally, the difference between the inlet steam mass flow rate () and the condensation rate () is considered to confirm that a pseudo steady-state condition has been reached.
The initial conditions for the windless and windy conditions are obtained from corresponding steady-state CFD simulations, where the saturated steam temperature is equated to the ambient temperature.
2.7. Mesh Independence and Uncertainty Analysis
A structured mesh is applied to the extended domain and the NDDDCS flow volume, while an unstructured mesh is employed in the transition region between the two to allow for cell size growth. These meshes are illustrated in Figure 3, and are identical to those adopted in a previous study [21]. Additionally, inflation layers are neglected for the purpose of this study, in accordance with the approach and motivation of [21].
Two computational meshes were evaluated as part of the mesh sensitivity analysis. The coarse mesh consisted of approximately 7.34 million cells in total, with about 2.40 million cells located within the tower volume. In contrast, the fine mesh comprised roughly 11.29 million total cells, of which approximately 6.13 million were within the tower volume.
The mesh independence analysis is conducted utilising the grid convergence index (GCI) approach combined with Richardson Extrapolation [31,32,33,34] under steady-state windless conditions for the large-scale NDDDCS. The results are summarised in Table 3. From these results, it is clear that the listed errors for the fine meshes are acceptable. Thus, the fine mesh is selected for all subsequent simulations.
Mesh quality metrics were assessed for the cell with the lowest quality in the selected 11 million-cell mesh. The maximum aspect ratio was found to be 30.32, which is within the recommended limit of less than 35. The minimum orthogonal quality was 0.12, exceeding the acceptable lower threshold of 0.1. Lastly, the maximum skewness was 0.87, remaining below the recommended upper limit of 0.95 [29].
2.8. Time Step Independence Analysis
Since the air-side solver is implicit, FLUENT is unconditionally stable, and CFL values below unity are not required. While CFL is a stability criterion for explicit schemes [29,30], it serves here only as a rough indicator of numerical accuracy and is not used as a convergence metric. Temporal accuracy is instead verified through the time step sensitivity analysis.
Time step independence is evaluated by varying the spatial and temporal resolution of the CFD simulations. Two configurations are tested: a large-scale system with a step input, and a downscaled mesh with a load ramp. Each is simulated using time steps of 0.25 s and 0.125 s.
The large-scale case is chosen due to the strong gradients it induces on the steam-side and its reliance on natural convection under windless conditions - an inherently transient process. Its higher thermal inertia also makes it the more conservative test case. To assess the impact of high velocities in smaller cells, the domain is downscaled by a factor of 2.5. Under crosswind conditions, this results in increased local velocities and elevated CFL numbers, which represents a worst-case scenario for transient simulations. Note that the results are non-dimensionalised for ease of comparison.
A slight discrepancy is observed in the maximum steam back pressure calculated for the large-scale step input (Figure 4 (a)). However, all other trends depicted in Figure 4 (b) show close agreement, confirming that a time step of 0.25 s is appropriate for this simulation case.
Results for the downscaled system time sensitivity analysis indicate some initial instability in the air mass flow rate, as shown in Figure 4 (d). However, these trends converge to a reasonable extent after 150 s. Moreover, the steam-side responses are relatively insensitive to the observed oscillations in the air mass flow rates for the respective time steps. Similarly, a smaller time step leads to slightly higher steam back pressures, as illustrated in Figure 4 (c). Nevertheless, all other trends demonstrate acceptable agreement.
2.9. Validation Overview
The transient 1-D numerical and co-simulation models are validated through comparison to their respective steady-state 1-D numerical [22,23] and 3-D CFD [21] models. These steady-state models have been validated against the work of Kong et al. [16,17], which itself has been validated against large-scale experimental results.
2.9.1. 1-D Numerical Model Validation
The transient 1-D numerical model is validated through systematic comparison to a previously validated 1-D steady-state numerical model [22,23], and the work of Kong et al. [17] (steady-state 3-D CFD). The tower geometry and heat exchanger characteristics of the steady-state 1-D model are aligned to that utilised by Kong et al. [17] as a first step. Thereafter, the heat exchanger characteristics as described in Equations (11) and (21) are adopted for the steady-state and transient 1-D models while maintaining the tower geometry from Kong et al. [17].
It is important to note that Kong et al. [17] assumes a constant saturated steam temperature of 360.95 K in their work. This saturated steam temperature is prescribed for the steady-state 1-D numerical model. However, the transient 1-D numerical model computes a saturated steam temperature (and associated steam back pressure) for a certain inlet steam mass flow rate (independent) boundary condition. Thus, this inlet steam mass flow rate is obtained from the work of Kong et al. [17], and assigned to the 1-D transient numerical model. Consequently, as seen in Table 4, for the underlined variables, the saturated steam temperature is matched between the 3-D CFD [17] and 1-D steady state models [22,23], and the steam mass flow rates are aligned between the 3-D CFD and transient 1-D model [27].
The results presented in Table 4 show close agreement between the respective models. When the heat exchanger characteristics utilised for this study [7] are adopted, the 1-D steady-state model overpredicts the heat transfer rate by 14.9% when matching the steam saturation temperature. The transient 1-D model indicates that a lower steam saturation temperature is required to match the prescribed steam mass flow rate. When the heat exchanger characteristics are matched between the 1-D steady-state and CFD validation case, close agreement is reached. All evaluated numerical models show good agreement, thus validating the transient 1-D numerical model.
2.9.2. Co-Simulation Model Validation
The transient co-simulation model is validated through comparison to a previously validated steady-state CFD model [21], which itself was validated against the work of Kong et al. [17]. These previous validation results are shown in Table 5 for the steady-state no-wind and 6 m/s crosswind cases. Note that for these steady-state validation results, the tower geometries, saturated steam and ambient temperature, and heat exchanger characteristics are aligned to those implemented by Kong et al. [17].
The results in Table 5 indicate close agreement between the respective models. As noted in a prior study [21], the discrepancies are mainly attributed to the different heat exchanger modelling approaches. Kong et al. [17] utilise the radiator boundary condition, whereas the 3-D NDDDCS model [21] makes use of the porous zone formulation.
The co-simulation model calculates a resulting steam saturation temperature (and back pressure) for a prescribed steam mass flow rate. Thus, for a reference simulation utilising the steady-state 3-D NDDDCS model [21], where the saturated steam temperature is 323.15 K and the ambient temperature is 293.15 K, the resulting steam mass flow rate (385.87 kg/s) is calculated. This steam mass flow rate is then assigned as the independent boundary condition for the co-simulation. Consequently, for a matched steam mass flow rate, the co-simulation should calculate similar performance variables once steady-state is achieved. These results are shown in Table 6, with the matched boundary condition underlined.
The co-simulation validation results closely align with the 3-D NDDDCS validation case. The largest discrepancy is observed for the draft driving potential (), which is only 2%. Thus, the co-simulation model is accepted as being validated.
3. Simulation Protocols and Specifications
The co-simulation model for the large-scale NDDDCS uses a thermal load ramp curve as an input, to simulate the transient heat rejection requirements on the cooling system for a cold start at a power plant. This profile was obtained from proprietary sources related to commercially operating plants of a similar scale and intended application. The load profile is non-dimensionally fitted to the operational plant data such that it represents the largest gradient in steam flow admission over a given time period during start-up. The gradient of the load ramp profile is such that the steam mass flow rate increases by about 18% per hour.
A specified condenser tube pressure limit of 40 kPa(g) (or 141.325 kPa(a)) is adopted for the co-simulations. This limit is selected to avoid the NDDDCS triggering the statutory pressure vessel requirements for systems operating with design pressures above 50 kPa(g) [35]. This limit is commonly adopted for dry-cooled power plants under start-up conditions while the turbine is not on load [36], where the low-pressure turbine bypass valve feeds steam directly to the condensing system.
The investigation will assess the performance of the large-scale NDDDCS under the following four critical start-up and operational scenarios:
- Cold start-up steam admission step input under no-wind conditions: This scenario evaluates the response of the NDDDCS to a step input in steam mass flow rate (heat load) while avoiding overpressure.
- Cold start-up steam admission load ramp under no-wind conditions: This represents a typical cold start-up operational procedure for a power plant.
- Cold start-up steam admission load ramp under 9 m/s crosswind conditions: The response of the NDDDCS to a thermal load ramp is investigated under 9 m/s crosswind conditions.
- Full load turbine islanding scenario: A turbine islanding event occurs when a power plant rapidly shifts from generating an operational load to house load, which is the electric output needed to only sustain power plant operations. During this event, steam is diverted from the low-pressure turbine to the NDDDCS via the bypass valve, resulting in a sudden and significant increase in the NDDDCS heat load. The turbine back pressure protection limit is specified as 75 kPa(a) for this case [36]. The NDDDCS initially operates steadily at 100% of its maximum load, which is assumed as full load operation.
4. Results and Discussion
For the transient co-simulations performed in this section, a constant ambient temperature of 293.15 K (20°C) is prescribed. The atmospheric pressure gradient follows the definition given in Equation (29), with the pressure at ground level set to 101.325 kPa. The design point (maximum) steam admission rates for the large-scale NDDDCS is 385.87 kg/s, calculated from steady-state simulations [21] which utilised a constant saturated steam temperature of 323.15 K (50°C). The reference system dimensions are listed in Table 1. Initial conditions for all transient no-wind and crosswind cold-start simulations are respectively obtained from an equivalent steady-state 3-D CFD simulation, where the saturated steam temperature is matched to the ambient temperature, eliminating heat transfer. For the sake of the discussion, , will be noted as the steam-to-tube heat transfer rate, , as the tube-to-air heat transfer rate and as the air-side heat transfer rate.
Note that for all subsequent trends, the same inlet steam mass flow rate is specified between to co-simulation and 1-D models. This effectively equates the imposed heat load between the two simulation models, which provides a more sensible comparison.
4.1. No-Wind Results: Cold Start-Up Steam Admission Step Input
Results for the large-scale NDDDCS are presented in this section for a maximum permissible step input of steam admission under no-wind conditions. The maximum permissible condenser tube pressure is limited to 40 kPa(g) (141.325 kPa(a)), thus the step inputs are iteratively varied until a corresponding steam flow step input is found which makes the steam back pressure approach this limit.
The initial conditions for both scales are obtained from windless steady-state CFD simulations, where the saturated steam temperature is equated to the ambient temperature. The resulting initial air mass flow rate calculated for the large-scale NDDDCS is 33.41 kg/s. It is important to note that atmospheric air, under windless conditions, will commonly lack the required momentum to overcome the inertial resistance of a heat exchanger, thus this initial air mass flow rate is potentially non-physical. However, due to the adopted atmospheric pressure gradient, a static pressure differential (≈ 2 kPa for the large-scale NDDDCS) exists between the tower outlet and inlet, which possibly provides a minor driving force. This air mass flow rate accounts for only 0.08% of the steady-state operational air mass flow rate computed for the large-scale (44079.51 kg/s) system [21], and is thus accepted as representing a no-flow condition.
The overall transient responses predicted by the co-simulation and the 1-D models are shown in Figure 5. Major differences are evident between the 1-D and co-simulation results at both scales, due to the 1-D model having a rapid air-side responsivity. Due to the adopted derivation approach, outlined in Section 2.2, the 1-D model assumes the entire NDDDCS flow volume as a singular control volume. Naturally, this approximation negates any of the complex 3-D airflow effects which the co-simulation accounts for. Furthermore, the transportation of heated airflow throughout the NDDDCS flow volume is negated by this 1-D approach, and intricate flow field development effects are omitted.
The large-scale system exhibits a limited tolerance to a steam admission step input under these windless conditions. A minor steam admission step input of 5.8% of its maximum steam admission rate results in a pronounced rise in steam back pressure (Figure 5 (a)), which narrowly avoids the condenser tube pressure limit. In stark contrast, for the same steam admission step input, the 1-D model computes a peak steam back pressure of 16 kPa(a).
As indicated in Figure 5 (b), the stagnation in air mass flow rate computed by the co-simulation strongly coincides with the large peak in steam back pressure. Due to the lack of airflow in the initial 750 s predicted by the co-simulation, the system must raise the steam saturation temperature (and associated steam back pressure), in order to match the imposed steam flow step input. The 1-D simulation predicts a rapid rise in the air mass flow rate, which already settles within the first 500 s, thus explaining the dramatic differences observed for the steam-side responses in Figure 5 (a).
Furthermore, the tube-to-air heat transfer rate () of the 1-D model peaks at 50 s, whereas the corresponding peak for the co-simulation model only occurs at 1100 s (Figure 5 (c)). The air-side heat transfer rate () strongly trends with the air mass flow rate, which along with the minor air temperature difference (Figure 5 (b)) explains the delay in peak air-side heat rejection (1200 s).
The large-scale co-simulation Richardson number response highlights the overt reliance the system has on natural convection, especially in the first 750 s. Moreover, upon cold start-up, which is several orders of magnitude away from the mixed and forced convection flow regimes. The natural convective currents, which flow in the vertical direction, cause a blocking effect at the outlet of the heat exchangers, illustrated in Figure 6 (a) and (b). Downstream of the heat exchangers, the unheated internal airflow recirculates, as a small amount of heated air flows along the internal tower shell wall surfaces. Furthermore, these buoyant plumes collide with the inner face of the clapboard, causing a localised stagnation of air as depicted in Figure 6 (a). Some heated air flows around the outer edge of the clapboard, exiting the NDDDCS flow volume. This thermal energy is effectively wasted in the cold start-up process, as it does not contribute to the system’s draft driving potential. Adjustment of the tower-to-heat exchanger arrangement is recommended to mitigate these effects.
At 960 s, bulk flow initiates through the heat exchangers of the large-scale NDDDCS, coinciding with mixed convection effects becoming significant, illustrated in Figure 6 (c). In contrast, the 1-D model is already within the forced convection stage at 960 s (Figure 5 (d)). As predicted by the co-simulation model, the lower regions of the NDDDCS flow volume remain unheated at this stage. The colder, denser air in these regions effectively impose a flow resistance on the incoming air, which is accelerated along the inner surfaces of the tower shell wall, shown in Figure 7 (a). The leading edges of these high-velocity air streams mix and collide with the colder regions of air above it, and more toward the tower centre, leading to flow separation and the formation of recirculation zones.
Pronounced overshoots in the air mass flow rate and outlet air temperature are predicted by the large-scale co-simulation as seen in Figure 5 (b). These overshoots are significantly larger than those predicted by the 1-D model. As the steam-to-tube heat transfer rate rises almost instantly along with the imposed heat load, it remains unmatched by the tube-to-air heat transfer rate (). This rise in steam saturation temperature elevates the condenser tube wall temperature, leading to a peak in outlet air temperature. The overshoot in outlet air temperature temporary boosts the system draft driving potential, culminating in an inertia-driven overshoot for the air mass flow rate. This effect has also been observed for a small-scale indirect system in another study [26].
Figure 5 (d) reveals significant differences in the transition times between the convective flow regimes as predicted by the co-simulation versus the 1-D model. By 100 s, both systems remain in the natural convection regime, but the Richardson number differs by more than three orders of magnitude between the two models. Notably, the co-simulation predicts a sharp rise and subsequent plateau in the Richardson number for the first 400 s, a feature much less evident in the 1-D model. The 1-D model shows a transition to forced convection around 250 s, whereas the co-simulation reaches this stage only after approximately 1100 s.
Despite forced convection dominating for the co-simulation beyond 1100 s, the flow field remains underdeveloped even at 1140 s, as shown in Figure 7 (b). It is evident that the majority of the NDDDCS thermal flow field development occurs once the forced convection regime begins (). Figure 7 (b) illustrates how airflow becomes more organized near the inner tower walls, contrasting with the chaotic downward flow in the core, which converges toward the heat exchangers and interacts with the incoming forced airflow, creating recirculation zones.
Figure 8 illustrates the start up process and the NDDDCS transitions through the various convective flow regimes. At 1050 s (Figure 8 (c)), the outlet air temperature from the heat exchangers is relatively high due to low air velocities, resulting in higher heat exchanger effectivenesses. As plume formation initiates around 1080 s (Figure 8 (d)), a choking effect occurs at the NDDDCS outlet which forces heated air downward, subsequently mixing with the cooler air in the middle region of the NDDDCS flow volume. This mixing suddenly decreases the air density throughout much of the tower flow volume, which rapidly augments the system’s draft driving potential. Resultantly, a sharp rise in air mass flow rate from 1500 kg/s at 1050 s (Figure 8 (c)) to 28600 kg/s at 1140 s (Figure 8 (f)), is observed. This sudden surge causes an inertia-driven overshoot in air mass flow rate, consistent with observations by others [26].
The subsequent increase in air velocity leads to a sharp drop in the heat exchanger outlet air temperature. Between 1050 s and 1200 s (Figure 8 (c) to (h)), the last remnants of cold air become trapped between the incoming airflow from the heat exchangers and the merging flow from the upper regions of the tower, resulting in thorough mixing. Consequently, the air temperature at the centre of the tower is slightly lower than near the inner tower wall surfaces. Plume stabilization occurs between 1080 s and 1170 s, after which the thermal flow field is fully developed.
4.2. No-Wind Results: Cold Start-Up Steam Admission Load Ramp
This section presents the simulation results for the large-scale NDDDCS subjected to windless conditions and a load ramp. The initial windless condition is identical to that used in the previous section, utilising a no-wind CFD simulation where the saturated steam temperature is equated to the ambient temperature.
Figure 9 shows the transient co-simulation response of the large-scale system. The co-simulation predicts a surge in steam back pressure to a maximum of 87 kPa(a), about 1350 s after initial steam admission, as illustrated in Figure 9 (a). In contrast, the 1-D simulation computes only a slight increase in steam back pressure which promptly subsides as the air mass flow rate quickly rises, as shown in Figure 9 (a) and (b). Similar to the steam admission step input results, the 1-D simulation responds significantly faster than the co-simulation. This difference in response time is due to the 1-D model’s inability to capture complex air-side phenomena, such as plume blocking, flow field development, and air mixing, which play a pivotal role during the cold start-up process.
The tube-to-air () heat transfer rate predicted by the co-simulation model significantly trails behind that of the 1-D simulation, as shown in Figure 9 (c). The co-simulation also indicates that the air-side () heat transfer rate is nearly negligible, primarily due to the minimal air mass flow through the heat exchanger and the small air temperature difference. The large discrepancy between the steam-to-tube and tube-to-air heat transfer rate results in an overt reliance on the thermal storage capacity of the condenser tube walls, leading to an excessive increase in tube wall temperature. This restricts the steam-to-tube heat transfer rate, which in turn limits the steam condensation rate, thus increasing the steam back pressure, and associated steam saturation temperature. As a result, a substantial mass imbalance arises between the steam entering and the condensate leaving the condenser tubes, causing the steam back pressure to surge. The exceedance of the steam back pressure limit of 40 kPa(g) is avoided by the large thermal energy sink provided by the condenser tube wall, thus avoiding further rises in steam back pressure. However, as the results indicate, improper selection of the condenser tubes - and subsequent thermal storage sink provided by them - could lead to system overpressure.
During the initial cold start-up phase, the predicted Richardson number of the large-scale co-simulation remains stagnant for the entire period up to 1200 s, as depicted in Figure 9 (d). At this same time instance, the Richardson number for the step input, shown in Figure 5 (d), is lower () = -1.5) than for the load ramp () = 3.8), indicating that airflow in the large-scale NDDDCS relies less on natural convection during the steam admission step input scenario. As the steam supply rate in the steam admission load ramp eventually surpasses that of the step input, the NDDDCS encounters a higher heat load. However, the system is less equipped to reject this heat to the ambient air due to its reliance on natural convection. Beyond 1200 s, the escalating heat load in the load ramp scenario exacerbates the system’s dependence on natural convection, the only available convective heat transfer mechanism at this stage. This reliance intensifies plume blocking effects and continues to stall the Richardson number, due to the low air velocities and elevated condenser tube wall temperatures. These observations highlight the intricate relationship between NDDDCS start-up performance, flow field development and the steam admission rate.
These findings underscore the critical role of air-side flow field development in the NDDDCS for effective heat rejection and steam condensation, which are essential for preventing system overpressure during cold start-up. The load ramp profile employed here results in lower thermal heat transfer to the air-side compared to the more abrupt heat load imposed by steam flow step inputs. While step inputs immediately introduce a substantial heat load to the NDDDCS, load ramps gradually increase the heat load. This gradual increase delays the development of the flow field, causing the steam back pressure to spike to 87 kPa(a) before the system can achieve start-up. Although the large-scale NDDDCS does not pose any limitation on power plant start-up under these conditions, the corresponding thermal sink provided by the condenser tubes should be seen as an important design parameter for avoiding system overpressure under no-wind conditions.
4.3. 9 m/s Crosswind Results: Cold Start-Up Steam Admission Load Ramp
This section presents the co-simulation results for a cold start-up scenario under a 9 m/s crosswind and a load ramp steam admission rate. The initial condition is established by calculating the steady-state flow field for the NDDDCS with a 9 m/s crosswind, where the steam temperature matches the ambient temperature, resulting in no initial heat transfer. The transient response of the large-scale NDDDCS under these conditions is illustrated in Figure 10.
The 9 m/s crosswind proves beneficial for the large-scale NDDDCSs, facilitating successful cold start-up. Despite the initial chaotic fluctuations in air mass flow rate following steam admission, as seen in Figure 10 (b), the increased airflow from the crosswind allows the systems to effectively manage the imposed heat load dictated by the ramp profile.
The steam back pressure of the large-scale NDDDCS closely tracks the imposed steam admission load ramp profile, as shown in Figure 10 (a), indicating that the system can effectively reject the required heat load under 9 m/s crosswind conditions. The observed oscillations in steam back pressure, following the load ramp curve, are attributed to constant flow separation and recirculation around the heat exchanger deltas, consistent with steady-state crosswind CFD results presented in previous work [16,17,21].
The large-scale system reaches a pseudo steady-state, as evidenced by the alignment of the steam-to-tube () and tube-to-air () heat transfer rates with the load ramp profile in Figure 10 (c). The air-side heat transfer rate () also increases in response to the steam admission load ramp curves, but trails behind. This indicates that at this stage in the NDDDCS start-up a notable amount of thermal energy is carried away by the crosswind, and thus does not contribute to the NDDDCS draft driving potential. Although the crosswind proves detrimental from the perspective of increasing the draft driving potential of the system, it nonetheless aids in providing adequate air-side heat rejection capacity to facilitate cold start-up.
For the large-scale system, the difference between the imposed steam mass flow rate and the calculated condensation rate is negligible by 400 s. Furthermore, the steam-to-tube and tube-to-air heat transfer rates trend closely, confirming that a pseudo steady-state condition is achieved beyond this point. The trend in the outlet air temperature shown in Figure 10 (b), correlates with the air-side heat transfer rate. Furthermore, the outlet air temperature rises proportionally along with the tube wall temperature, driven by the increasing steam saturation temperatures. This air temperature rise facilitates a reduction in air density within the NDDDCS flow volume, which enhances the draft driving potential of the large-scale NDDDCS.
Initially, the system operates in the forced convection flow regime, as indicated in Figure 10 (d), due to the lack of a temperature differential between the condenser tube walls and the ambient air, rendering buoyancy effects negligible compared to the inertial forces originating from the crosswind. As steam is introduced into the condenser tubes, the steam saturation temperature rises. This increase in temperature is reflected in the Richardson number, which drifts towards a maximum value of in response to the expanding temperature differential. However, the Richardson number remains significantly lower than that computed under no-wind steam admission load ramp conditions, as shown by comparing Figure 10 (d) with Figure 9 (d). Moreover, the crosswind effectively mitigates the no-wind flow interference effects caused by rising buoyant plumes. By driving air horizontally through the heat exchangers, particularly on the windward side, the crosswind negates these detrimental effects.
These results demonstrate that under 9 m/s crosswind conditions with a steam admission load ramp, the start-up performance of the NDDDCS is significantly improved compared to equivalent no-wind scenarios. As a result, large-scale NDDDCSs do not pose any limitations on power plant start-up under these conditions, aligning with findings from [24], which reported enhanced start-up performance when crosswinds dominate the system’s draft driving potential.
4.4. No-Wind Results: Full Load Turbine Islanding Scenario
This section presents the transient response of a large-scale NDDDCS subjected to a full-load islanding event, evaluated using both a 1-D numerical model and a co-simulation. Initially, the NDDDCS operates steadily at 100% of its rated steam admission rate (385.57 kg/s). A step increase in steam admission is then applied, simulating a sudden rise in thermal load. The steam admission rate was incrementally increased until a limiting step input was identified, corresponding to a rise in back pressure approaching the turbine protection threshold of 75 kPa(a).
Figure 11 presents the transient evolution of key system variables. Results indicate that the NDDDCS can accommodate a step change in steam load from 100% (385.57 kg/s) to 265% (1021.76 kg/s) - a 165% relative increase without exceeding the low-pressure turbine back pressure protection limit (Figure 11 (a)). The 1-D model predicts a peak back pressure of 46 kPa(a). Additionally, the differences in the predicted steady-state steam back pressures between the 1-D and co-simulation models, under identical steam mass flow rate boundary conditions, are consistent with the validation results discussed in Section 2.9.
Figure 11 (b) illustrates the temperature response. The 1-D model predicts a sharp increase in tube wall temperature from 323 K to 352 K within 20 s. The co-simulation mirrors this trend but with amplified values, reaching 365 K after 45 s. Steady-state conditions are achieved at 75 s and 125 s for the 1-D and co-simulation models, respectively. The discrepancy in final steam saturation temperatures is attributed to the lower air-side flow losses predicted by the 1-D model. This is reflected in a higher steady-state air mass flow rate and thus a reduced steam pack pressure. These dynamics are further evidenced in the outlet air temperature trends, where the 1-D model reaches steady-state after 55 s, compared to 200 s for the co-simulation.
Due to the thermal sink provided by the finned tubes, the steam-side heat transfer rate () rapidly equilibrates with the imposed heat load (Figure 11 (c)). Both models show closely aligned heat transfer rate trends. The 1-D model predicts a faster response in , with reduced overshoot compared to the co-simulation. A similar trend is observed for , which rises slightly faster in the 1-D model, though overshoot magnitudes are comparable.
The enhanced responsiveness of the 1-D model is further supported by the predicted evolution of the Richardson number (Figure 11 (d)). Upon islanding, both models show an increase in the Richardson number, but to different extents. The 1-D model predicts a peak value of -1.2, while the co-simulation reaches -1.08, approaching the transition to mixed convection flow.
Overall, these full-load islanding results demonstrate that once the NDDDCS flow field is fully developed - as it typically is under steady, windless operational conditions - the system can reliably accommodate significant and instantaneous load increases. The close agreement between the 1-D and co-simulation model transient predictions underscores the robustness and practical utility of the 1-D model for dynamic analysis of large-scale NDDDCS systems under critical operational scenarios.
5. Conclusions
The main findings regarding the transient start-up and operational performance of the NDDDCS, derived from the presented graphs, contour and vector plots, are:
- The large-scale NDDDCS, as computed by the co-simulations, exhibits a limited tolerance to a steam admission step input (5.8%). Furthermore, the 1-D model predicts a significantly lower peak steam back pressure relative to the large-scale system.
- The co-simulation model predicts notably extended cold start-up times compared to the 1-D numerical model.
- Based on co-simulation results, the large-scale systems does not exceed the allowable condenser tube pressure limit under no-wind conditions with a ramped heat load input. Large discrepancies arise in the transient response of the co-simulation versus the 1-D model under these conditions.
- The adoption of vertically arranged heat exchanger bundles presents difficulties for NDDDCS start-up, as the flow direction must shift from the initial vertical direction, caused by the rising natural convective plumes, to the horizontal direction which results from the mixed and forced convection flow regimes.
- Values of result in the NDDDCS flow field stagnating within the natural convective flow regime, culminating in prolonged transition times from natural to mixed / forced convection regimes.
- The NDDDCS poses no limitation on power plant start-up under 9 m/s crosswind conditions with a steam admission load ramp.
- The NDDDCS, as predicted by the transient 1-D and co-simulation models, has a substantial full load islanding capacity. An instantaneous steam admission load increase from 100% to 265% can be accepted without exceeding the low pressure turbine pressure protection limit of 75 kPa(a).
- The co-simulation and 1-D model predicts similar trends for the full load islanding scenario, highlighting the efficacy of utilising the 1-D numerical model for rapid estimations of transient NDDDCS performance under no-wind islanding conditions.
6. Implications and Future Work
This study highlights the intricate cold start-up and operational performance characteristics of NDDDCSs utilising two different models, under both windless and windy conditions. A key finding is that the tower-to-heat exchanger arrangement should be adjusted to enhance NDDDCS start-up performance, ensuring that the rising natural convective currents flow directly into the NDDDCS flow volume under initial heat transfer from the heat exchangers. To achieve this, the heat exchanger bundles could potentially be vertically arranged within the perimeter of the NDDDCS tower shell wall (inlet diameter) or the clapboard could be extended.
The transient 1-D NDDDCS model employed in this study assumes a uniform air-side flow volume, encompassing the entire air-side control volume. This assumption overlooks the complex airflow effects predicted by the co-simulation. However, by discretising the air-side of the 1-D model, some of these effects could be captured, thereby enhancing the model’s predictive accuracy.
The co-simulation model combines the total condenser tube steam-side volume into a singular control volume. Future studies could divide the condenser tubes into distinct sectors, allowing for spatial variability in the steam back pressure, the corresponding steam saturation temperature and condenser tube wall temperature for every time step. Moreover, the 1-D steam-side of the co-simulation model can be extended to include momentum losses, which would result in a reduction in steam saturation pressure as the steam flows through the condenser tubes.
Finally, future work should explore integrating the co-simulation model approach into steady-state 3-D CFD models, allowing for coupled interaction between the steam- and air-sides, thereby providing a more accurate representation of NDDDCS operation.
Acknowledgments
This work is based on research supported by the National Research Foundation of South Africa (Grant number: PMDS2205108605), as well as the Solar Thermal Energy Research Group (STERG) of the University of Stellenbosch. Furthermore, the authors acknowledge the Centre for High Performance Computing (CHPC), South Africa, for providing computational resources to this research project.
Conflicts of Interest
The authors declare that there is no conflict of interest.
References
- Myers, K.; Doran, P.; Cook, J.; Kotcher, J.; Myers, T. Consensus revisited: quantifying scientific agreement on climate change and climate expertise among Earth scientists 10 years later. Environmental Research Letters 2021, 16, 104030. [CrossRef]
- Schellnhuber, H.; Heinke, J.; Gerten, D.; Haddeland, I.; Arnell, N.; Clark, D.; Dankers, R.; Eisner, S.; Kabat, P. Multimodel assessment of water scarcity under climate change. Proceedings of the National Academy of Sciences - PNAS 2014, 111, 3245–3250. [CrossRef]
- WEC. World energy scenarios. Technical report, World Energy Council, 2013.
- Macknick, J.; Newmark, R.; Heath, G.; Hallett, K. Review of Operational Water Consumption and Withdrawal Factors for Electricity Generating Technologies. National Renewable Energy Lab (NREL) 2011. [CrossRef]
- Li, W.; Chai, J.; Zheng, J. Investigation of Natural Draft Cooling Tower in China. Heat Transfer Engineering 2017, 38, 1101–1107. [CrossRef]
- Duvenhage, K.; KrÖger, D. The influence of wind on the performance of forced draught air-cooled heat exchangers. Journal of Wind Engineering and Industrial Aerodynamics 1996, 62, 259–277. [CrossRef]
- KrÖger, D. Air-cooled heat exchangers and cooling towers; Penwell Corp.: Tulsa, Okla, 2004.
- Reshadatjoo, H.; Pormahmod, N.; Moltagh, S. The effect of cross-winds on an indirect dry cooling tower with or without windbreaks. Journal of Power and Energy 2011, 225, 635–646. [CrossRef]
- Al-Waked, R.; Behnia, M. The Effect of Windbreak Walls on the Thermal Performance of Natural Draft Dry Cooling Towers. Heat Transfer Engineering 2005, 26, 50–62. [CrossRef]
- Lu, Y.; Guan, Z.; Gurgenci, H.; Zou, Z. Windbreak walls reverse the negative effect of crosswind in short natural draft dry cooling towers into a performance enhancement. International Journal of Heat and Mass Transfer 2013, 63, 162–170. [CrossRef]
- Dai, Y.; Lu, Y.; Klimenko, A.; Wang, Y.; Hooman, K. Numerical investigation of swirl effects on a short natural draft dry cooling tower under windless and crosswind conditions. Applied Thermal Engineering 2021, 188, 116628. [CrossRef]
- Goodarzi, M.; Keimanesh, R. Heat rejection enhancement in natural draft cooling tower using radiator-type windbreakers. Energy Conversion and Management 2013, 71, 120–125. [CrossRef]
- Yang, J.; Wang, W.; Chen, L.; Yang, L.; Du, X. Enhancement of Thermo-Flow Performances by Windbreakers for Two-Tower Indirect Dry Cooling System. Journal of Thermal Science 2020, 29, 676–686. [CrossRef]
- Li, X.; Guo, T.; Huang, W.; Wang, L.; Zhao, Y. Improvement mechanism of wedged column on the cooling performance of vertical delta radiator. International Journal of Heat and Mass Transfer 2022, 188, 122619. [CrossRef]
- Conradie, A.; Buys, J.; Kröger, D. Performance optimization of dry-cooling systems for power plants through SQP methods. Applied Thermal Engineering 1998, 18, 25–45. [CrossRef]
- Kong, Y.; Wang, W.; Yang, L.; Du, X.; Yang, Y. Thermo-flow performances of natural draft direct dry cooling system at ambient winds. International Journal of Heat and Mass Transfer 2018, 116, 173–184. [CrossRef]
- Kong, Y.; Wang, W.; Huang, X.; Yang, L.; Du, X. Annularly arranged air-cooled condenser to improve cooling efficiency of natural draft direct dry cooling system. International Journal of Heat and Mass Transfer 2018, 118, 587–601. [CrossRef]
- Kong, Y.; Wang, W.; Zuo, Z.; Yang, L.; Du, X.; Yang, Y. Combined air-cooled condenser layout with in line configured finned tube bundles to improve cooling performance. Applied Thermal Engineering 2019, 154, 505–518. [CrossRef]
- Kong, Y.; Wang, W.; Yang, L.; Du, X.; Yang, Y. A novel natural draft dry cooling system with bilaterally arranged air-cooled heat exchanger. International Journal of Thermal Sciences 2017, 112, 318–334.
- Kong, Y.; Wang, W.; Huang, X.; Yang, L.; Du, X.; Yang, Y. Wind leading to improve cooling performance of natural draft air-cooled condenser. Applied Thermal Engineering 2018, 136, 63–83. [CrossRef]
- Strydom, W.; Pretorius, J.; Hoffmann, J. Natural draft direct dry cooling system performance at various application scales under windless and windy conditions. Applied Thermal Engineering 2024, 248, 123181. [CrossRef]
- Strydom, W.; Pretorius, J.; Hoffmann, J. Natural draft direct dry cooling system scaling for diverse applications. In Proceedings of the 16th International Conference on Heat Transfer, Fluid Mechanics and Thermodynamics (HEFAT), 2022, pp. 693–698.
- Strydom, W.; Pretorius, J.; Hoffmann, J. Sensitivity analysis on the performance of a natural draft direct dry cooling system for a 50MWe CSP application. In Proceedings of the 8th World Congress on Momentum, Heat and Mass Transfer, 2023. [CrossRef]
- Dong, P.; Li, X.; Hooman, K.; Sun, Y.; Li, J.; Guan, Z.; Gurgenci, H. The crosswind effects on the start-up process of natural draft dry cooling towers in dispatchable power plants. International Journal of Heat and Mass Transfer 2019, 135, 950–961. [CrossRef]
- Dong, P.; Li, X.; Guan, Z.; Gurgenci, H. The transient start-up process of natural draft dry cooling towers in dispatchable thermal power plants. International Journal of Heat and Mass Transfer 2018, 123, 201–212. [CrossRef]
- Dong, P.; Li, X.; Sun, Y.; K., H.; Guan, Y.; Dai, Y.; H., G. Numerical investigation of the influence of local effects on the transient start-up process of natural draft dry cooling towers in dispatchable power plants. International Journal of Heat and Mass Transfer 2019, 133, 166–178. [CrossRef]
- Strydom, W.; Pretorius, J.; Laubscher, R. Start-up and Transient Response Characteristics of Natural Draft Direct Dry Cooling Systems at Various Scales. In Proceedings of the Preprint presented at 13th South African Conference on Computational and Applied Mechanics (SACAM’24; Proceedings in preparation), 2024. [CrossRef]
- Patankar, S.; Spalding, D. A calculation procedure for heat, mass and momentum transfer in three-dimensional parabolic flows. International Journal of Heat and Mass Transfer 1972, 15, 1787–1806. [CrossRef]
- FLUENT. FLUENT 14.5 user guide. FLUENT Inc., Lebanon. NH-03766 2002.
- FLUENT. ANSYS FLUENT 12.0. Theory Guide 2009.
- Roache, P. Perspective: A Method for Uniform Reporting of Grid Refinement Studies. Journal of Fluids Engineering 1994, 116, 405–413. [CrossRef]
- Richardson, L. The approximate arithmetical solution by finite differences of physical problems involving differential equations, with an application to the stresses in a masonry dam. Philosophical Transactions of the Royal Society of London. Series A, Containing Papers of a Mathematical or Physical Character 1911, 210, 307–357. [CrossRef]
- Richardson, L. The deferred approach to the limit. Philosophical Transactions of the Royal Society of London. Series A, Containing Papers of a Mathematical or Physical Character 1927, 226, 299–361. [CrossRef]
- Procedure for Estimation and Reporting of Uncertainty Due to Discretization in CFD Applications. Journal of Fluids Engineering 2008, 130, 078001. [CrossRef]
- European Union. European Union Pressure Equipment Directive [Online]. Available at: https://single-market-economy.ec.europa.eu/sectors/pressure-equipment-and-gas-appliances/pressure-equipment-sector/pressure-equipment-directive_en, 2016.
- Dr. A.F. du Preez. Personal communication, 2024.
Figure 1.
Schematic of NDDDCS (a) and effective single-row finned tube (b).
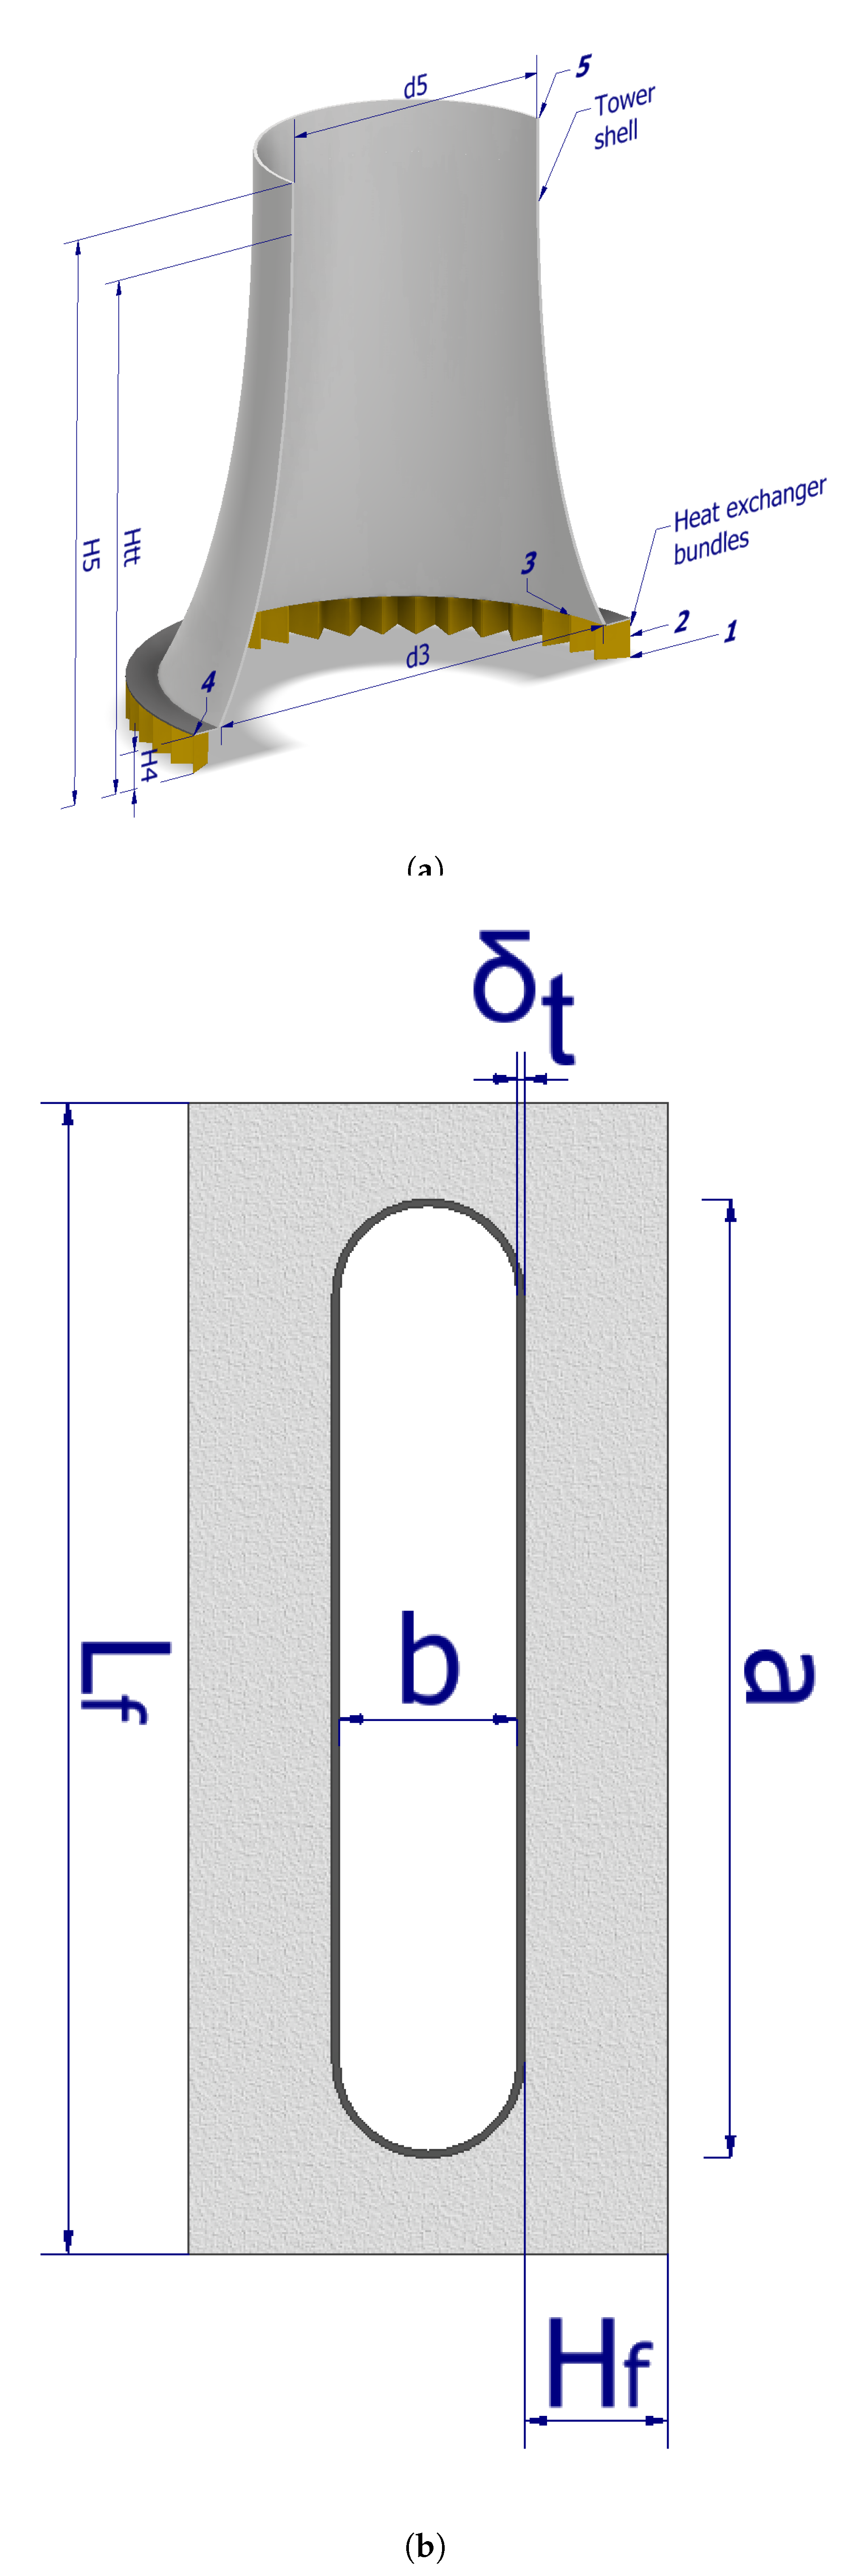
Figure 2.
Schematic of domain and boundary conditions for NDDDCS simulation.
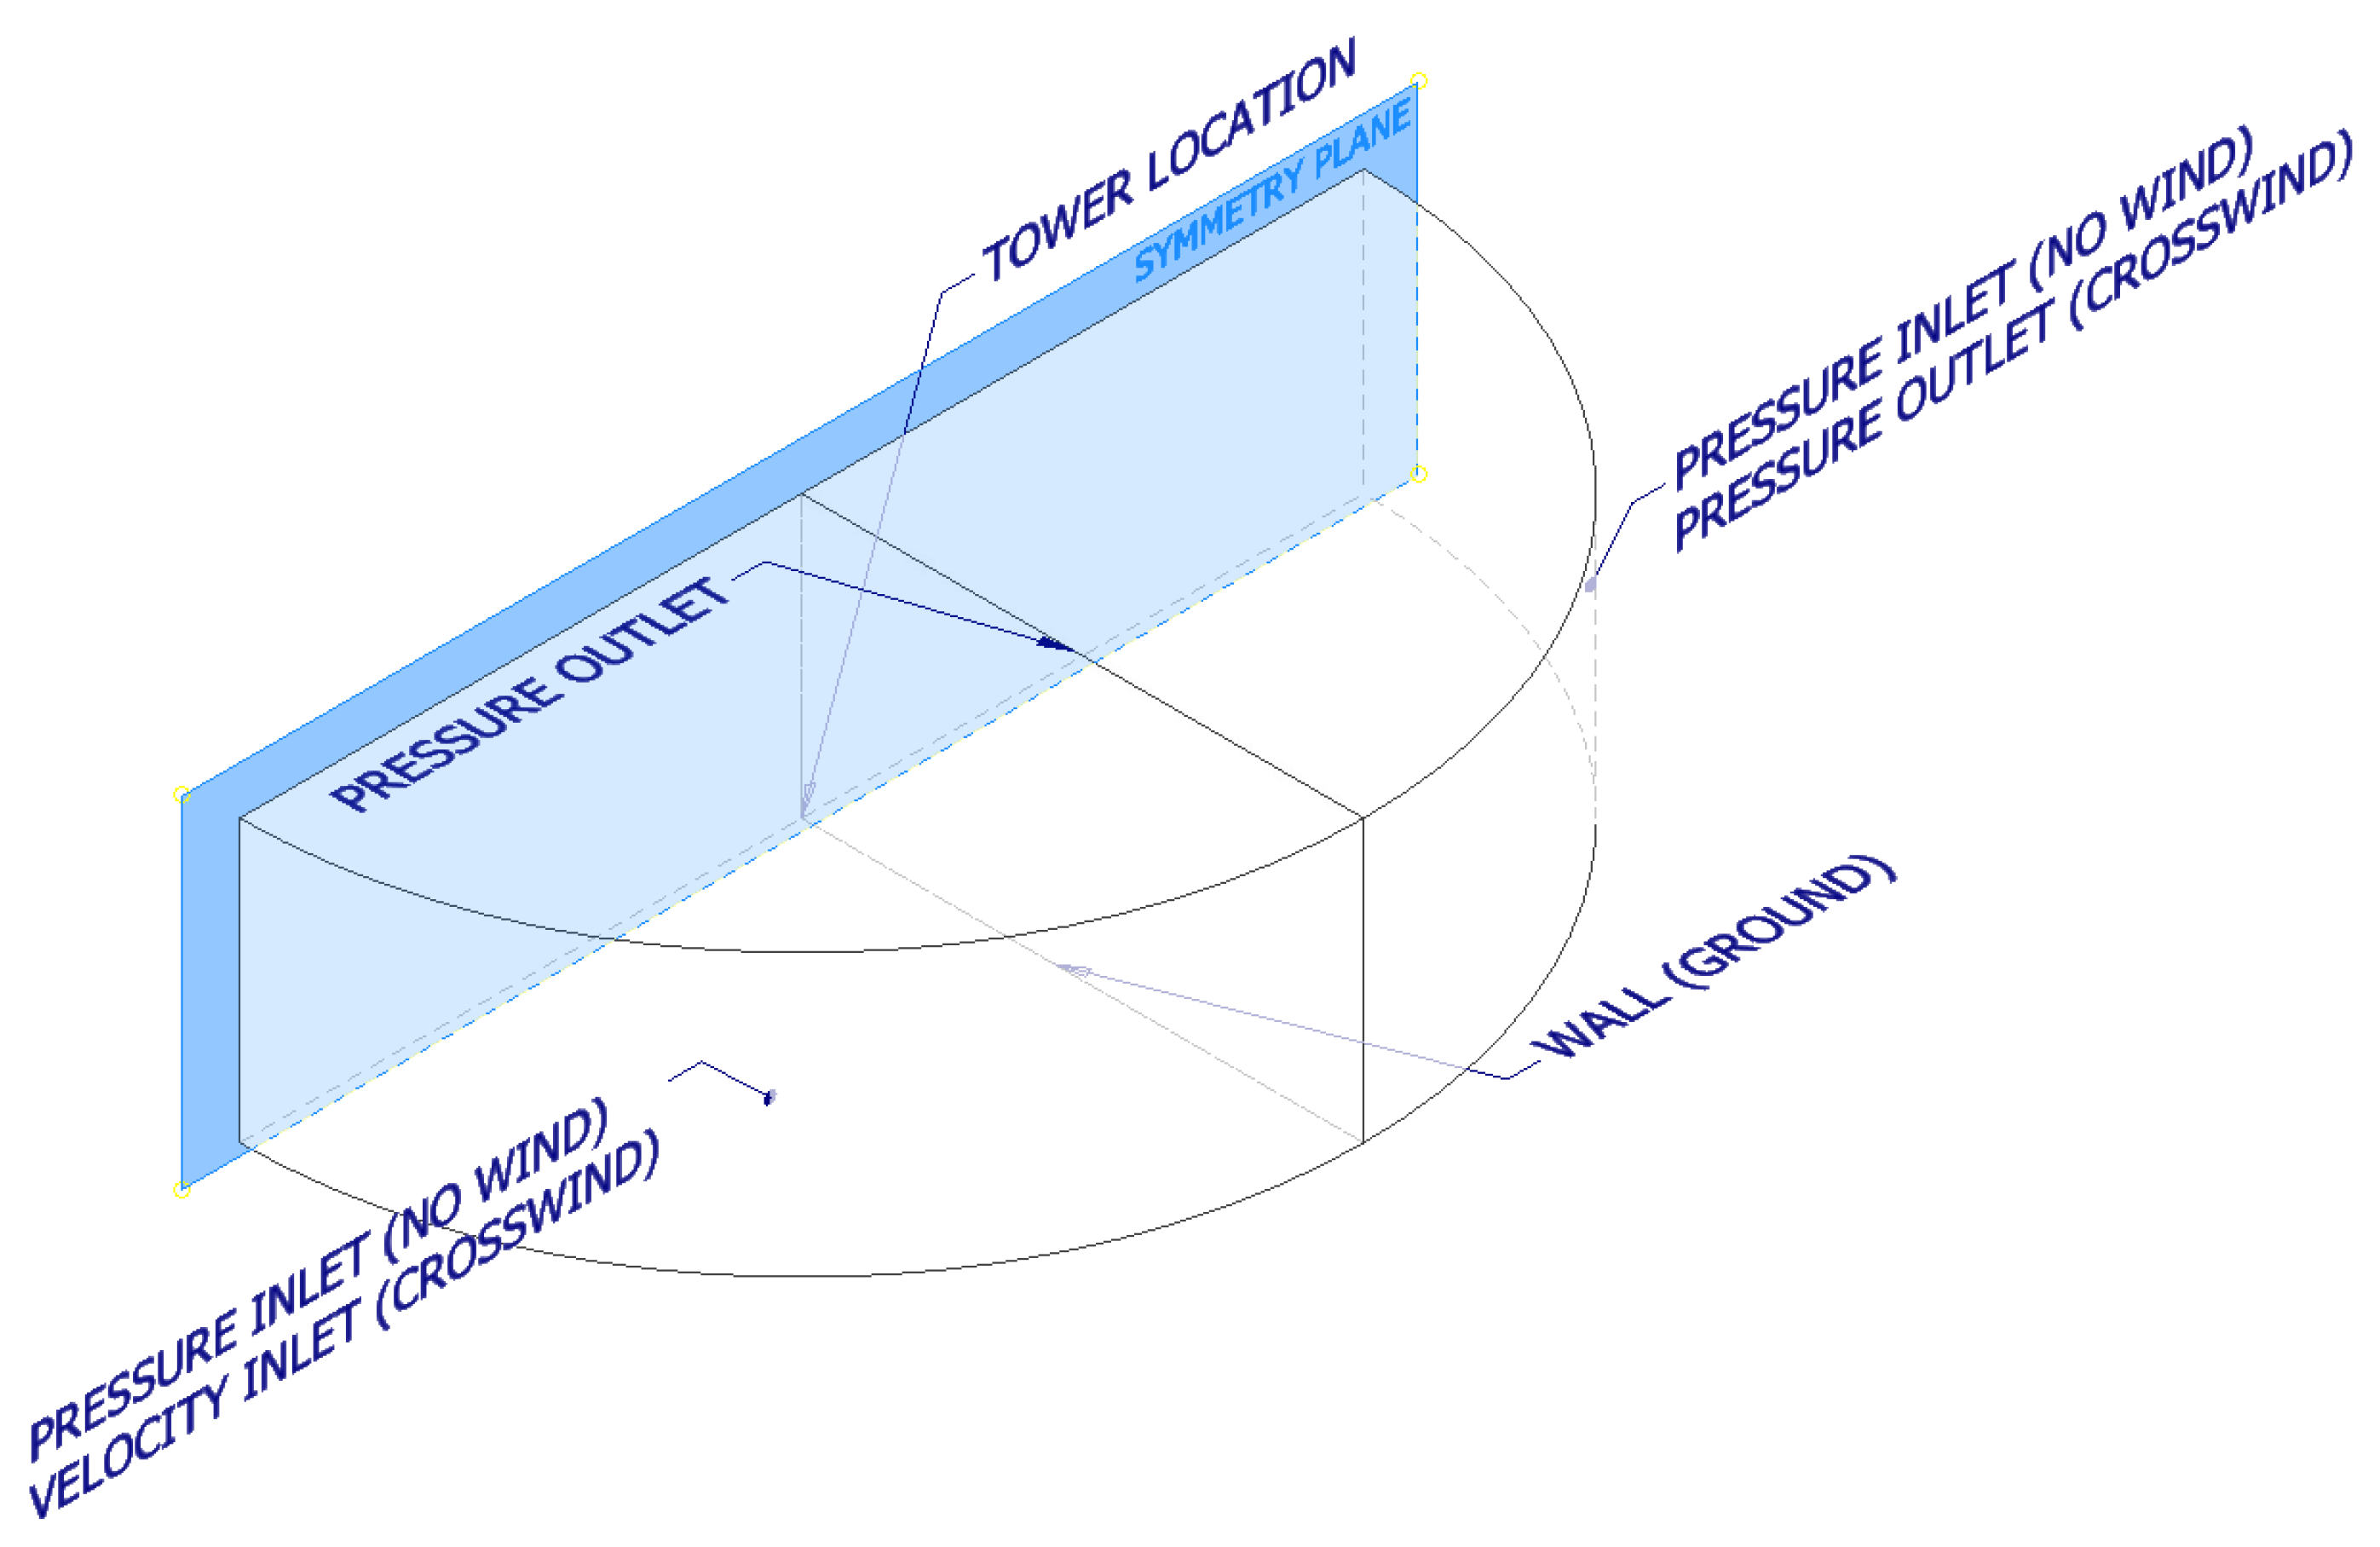
Figure 3.
Structured mesh in extended domain (8 m element size top region, 4 m element size lower region) and unstructured near-field mesh (4 m element size) (a) and local mesh around (0.25 m element size) and within (0.25 m element size) porous zone (b) for large-scale NDDDCS simulation.
Figure 3.
Structured mesh in extended domain (8 m element size top region, 4 m element size lower region) and unstructured near-field mesh (4 m element size) (a) and local mesh around (0.25 m element size) and within (0.25 m element size) porous zone (b) for large-scale NDDDCS simulation.
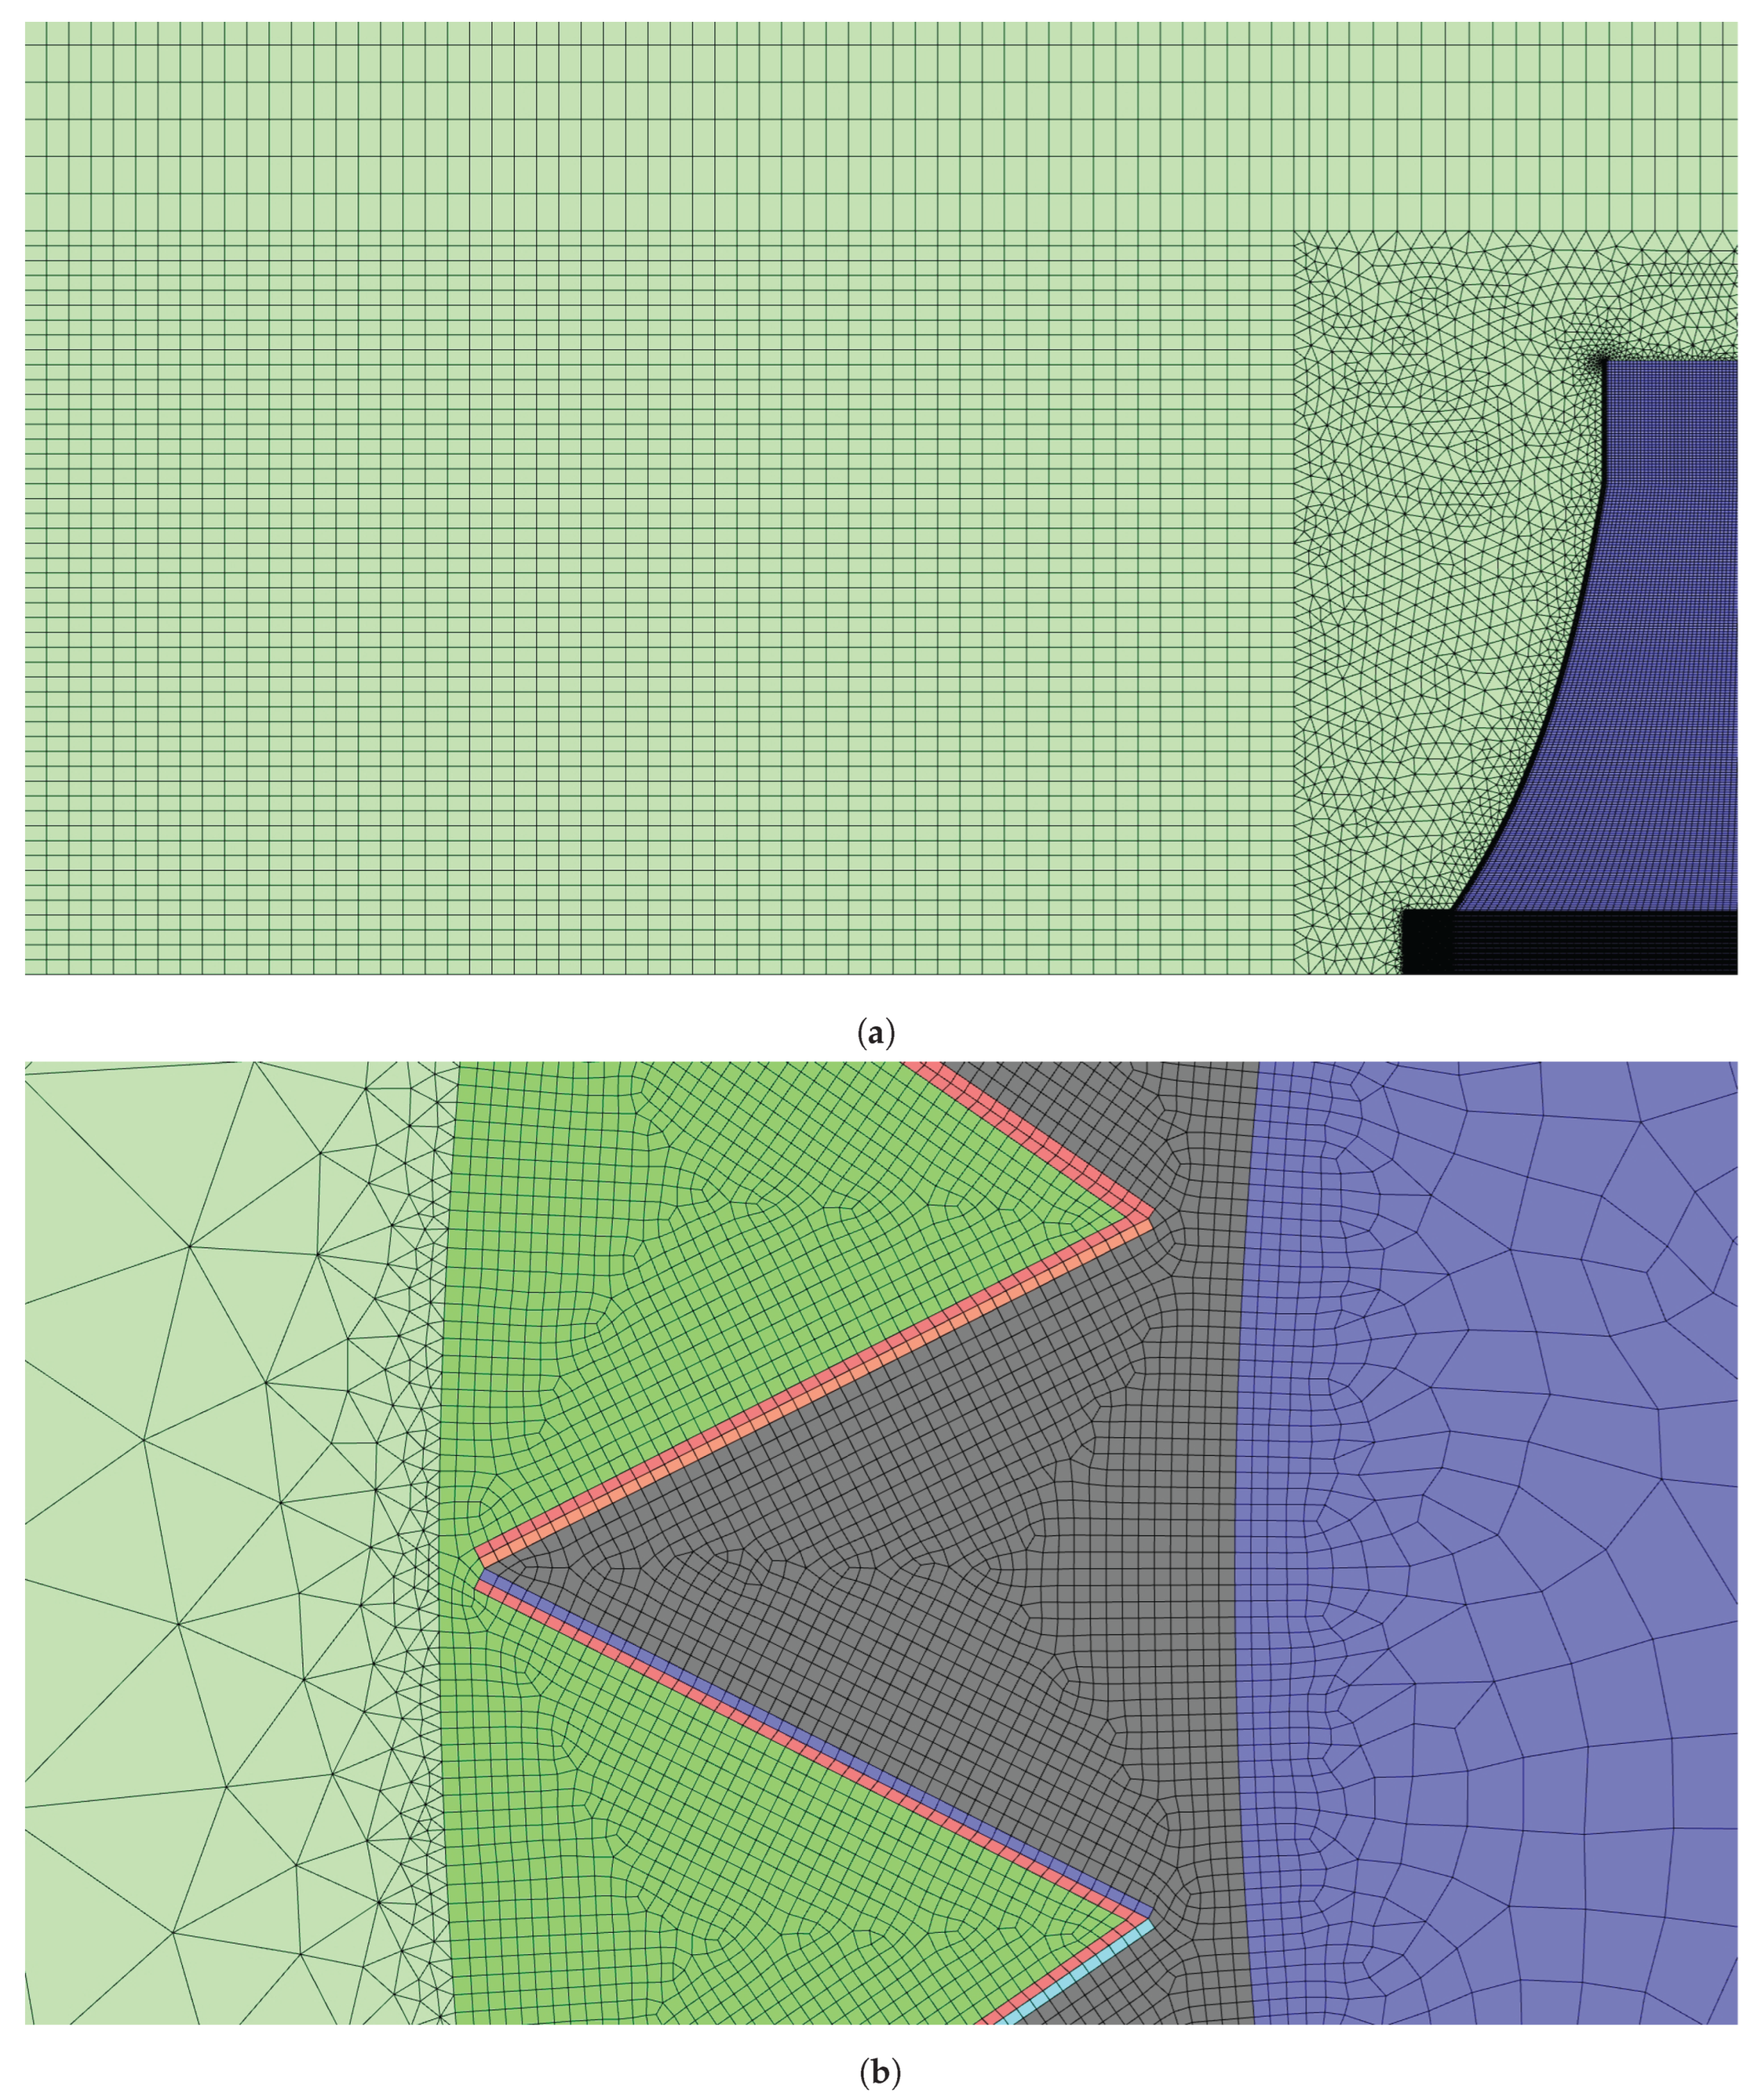
Figure 4.
Co-simulation time step sensitivity study: large-scale system steam back pressure (abs) (a) and air mass flow rate (b); downscaled system steam back pressure (abs) (c) and air mass flow rate (d) transient response (primary y-axis) under step input steam admission (secondary y-axis) and no-wind conditions.
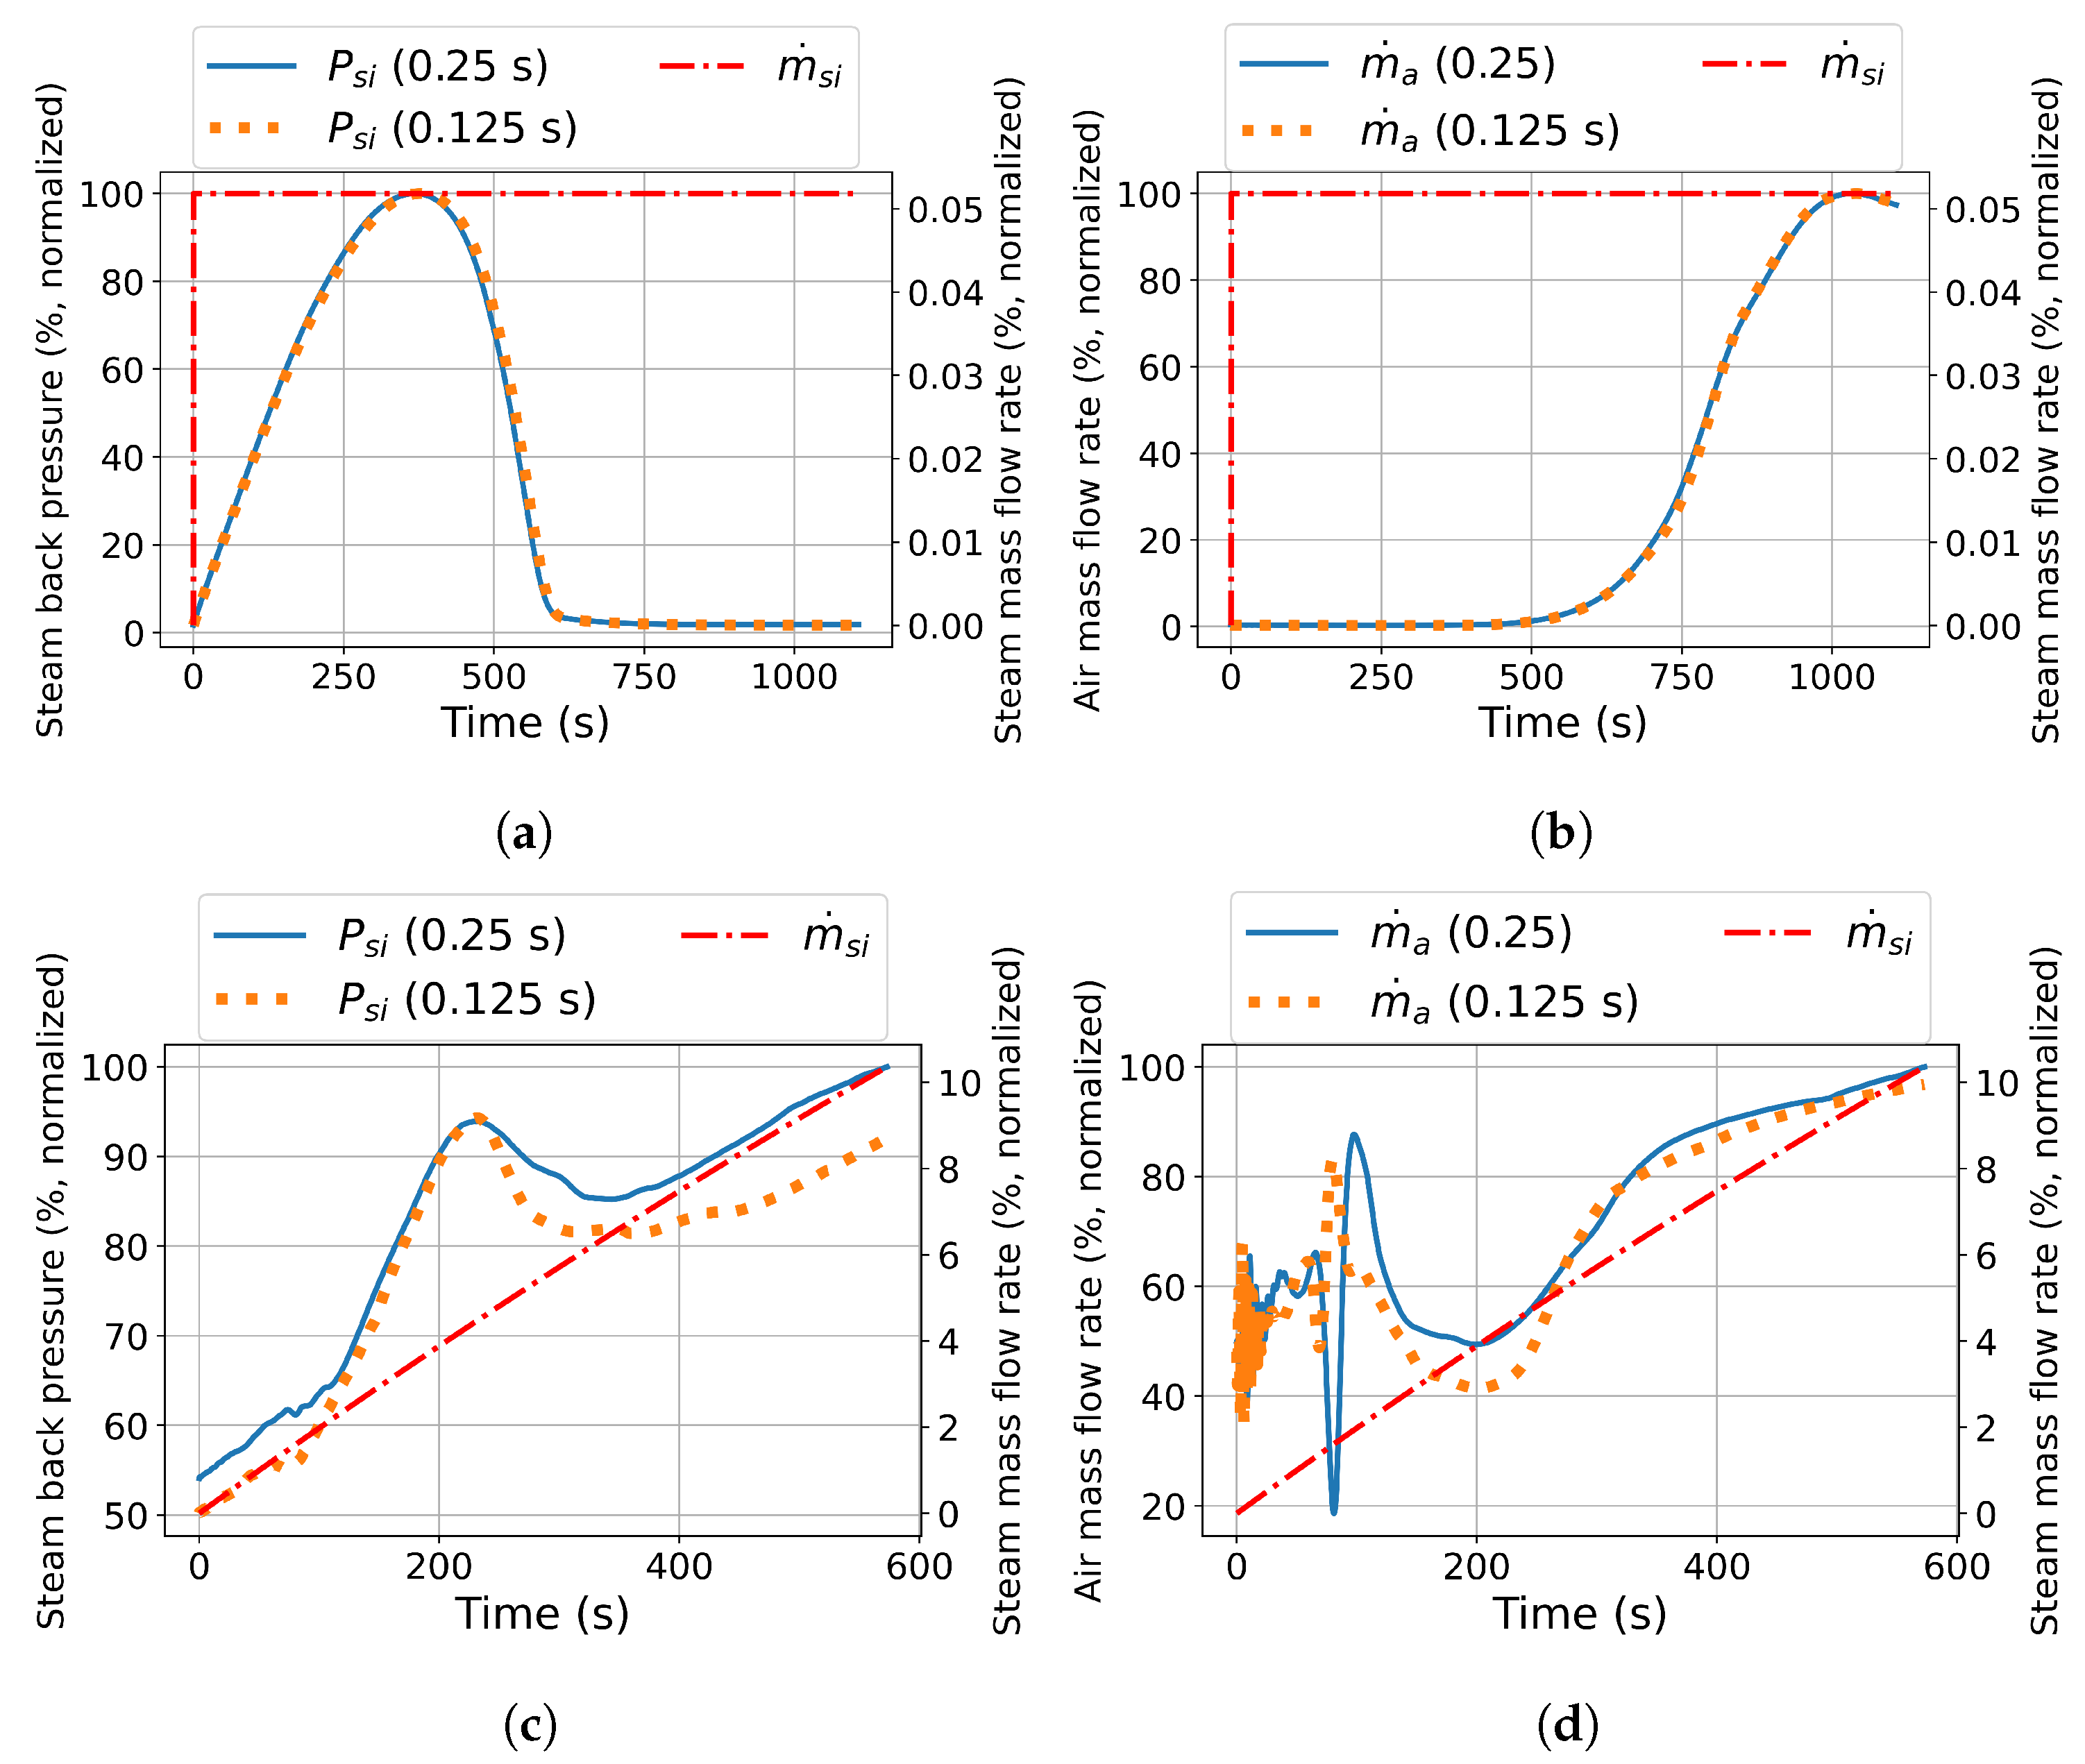
Figure 5.
Co-simulation vs 1-D: steam back pressure (a) and heat transfer rate (b) (primary y-axis) vs steam mass flow rate (secondary y-axis); temperature (c) (primary y-axis) vs air mass flow rate (secondary y-axis); air mass flow rate (d) (primary y-axis) vs Richardson number (secondary y-axis) transient response for large-scale NDDDCS under step input steam admission (secondary y-axis) and no-wind conditions.
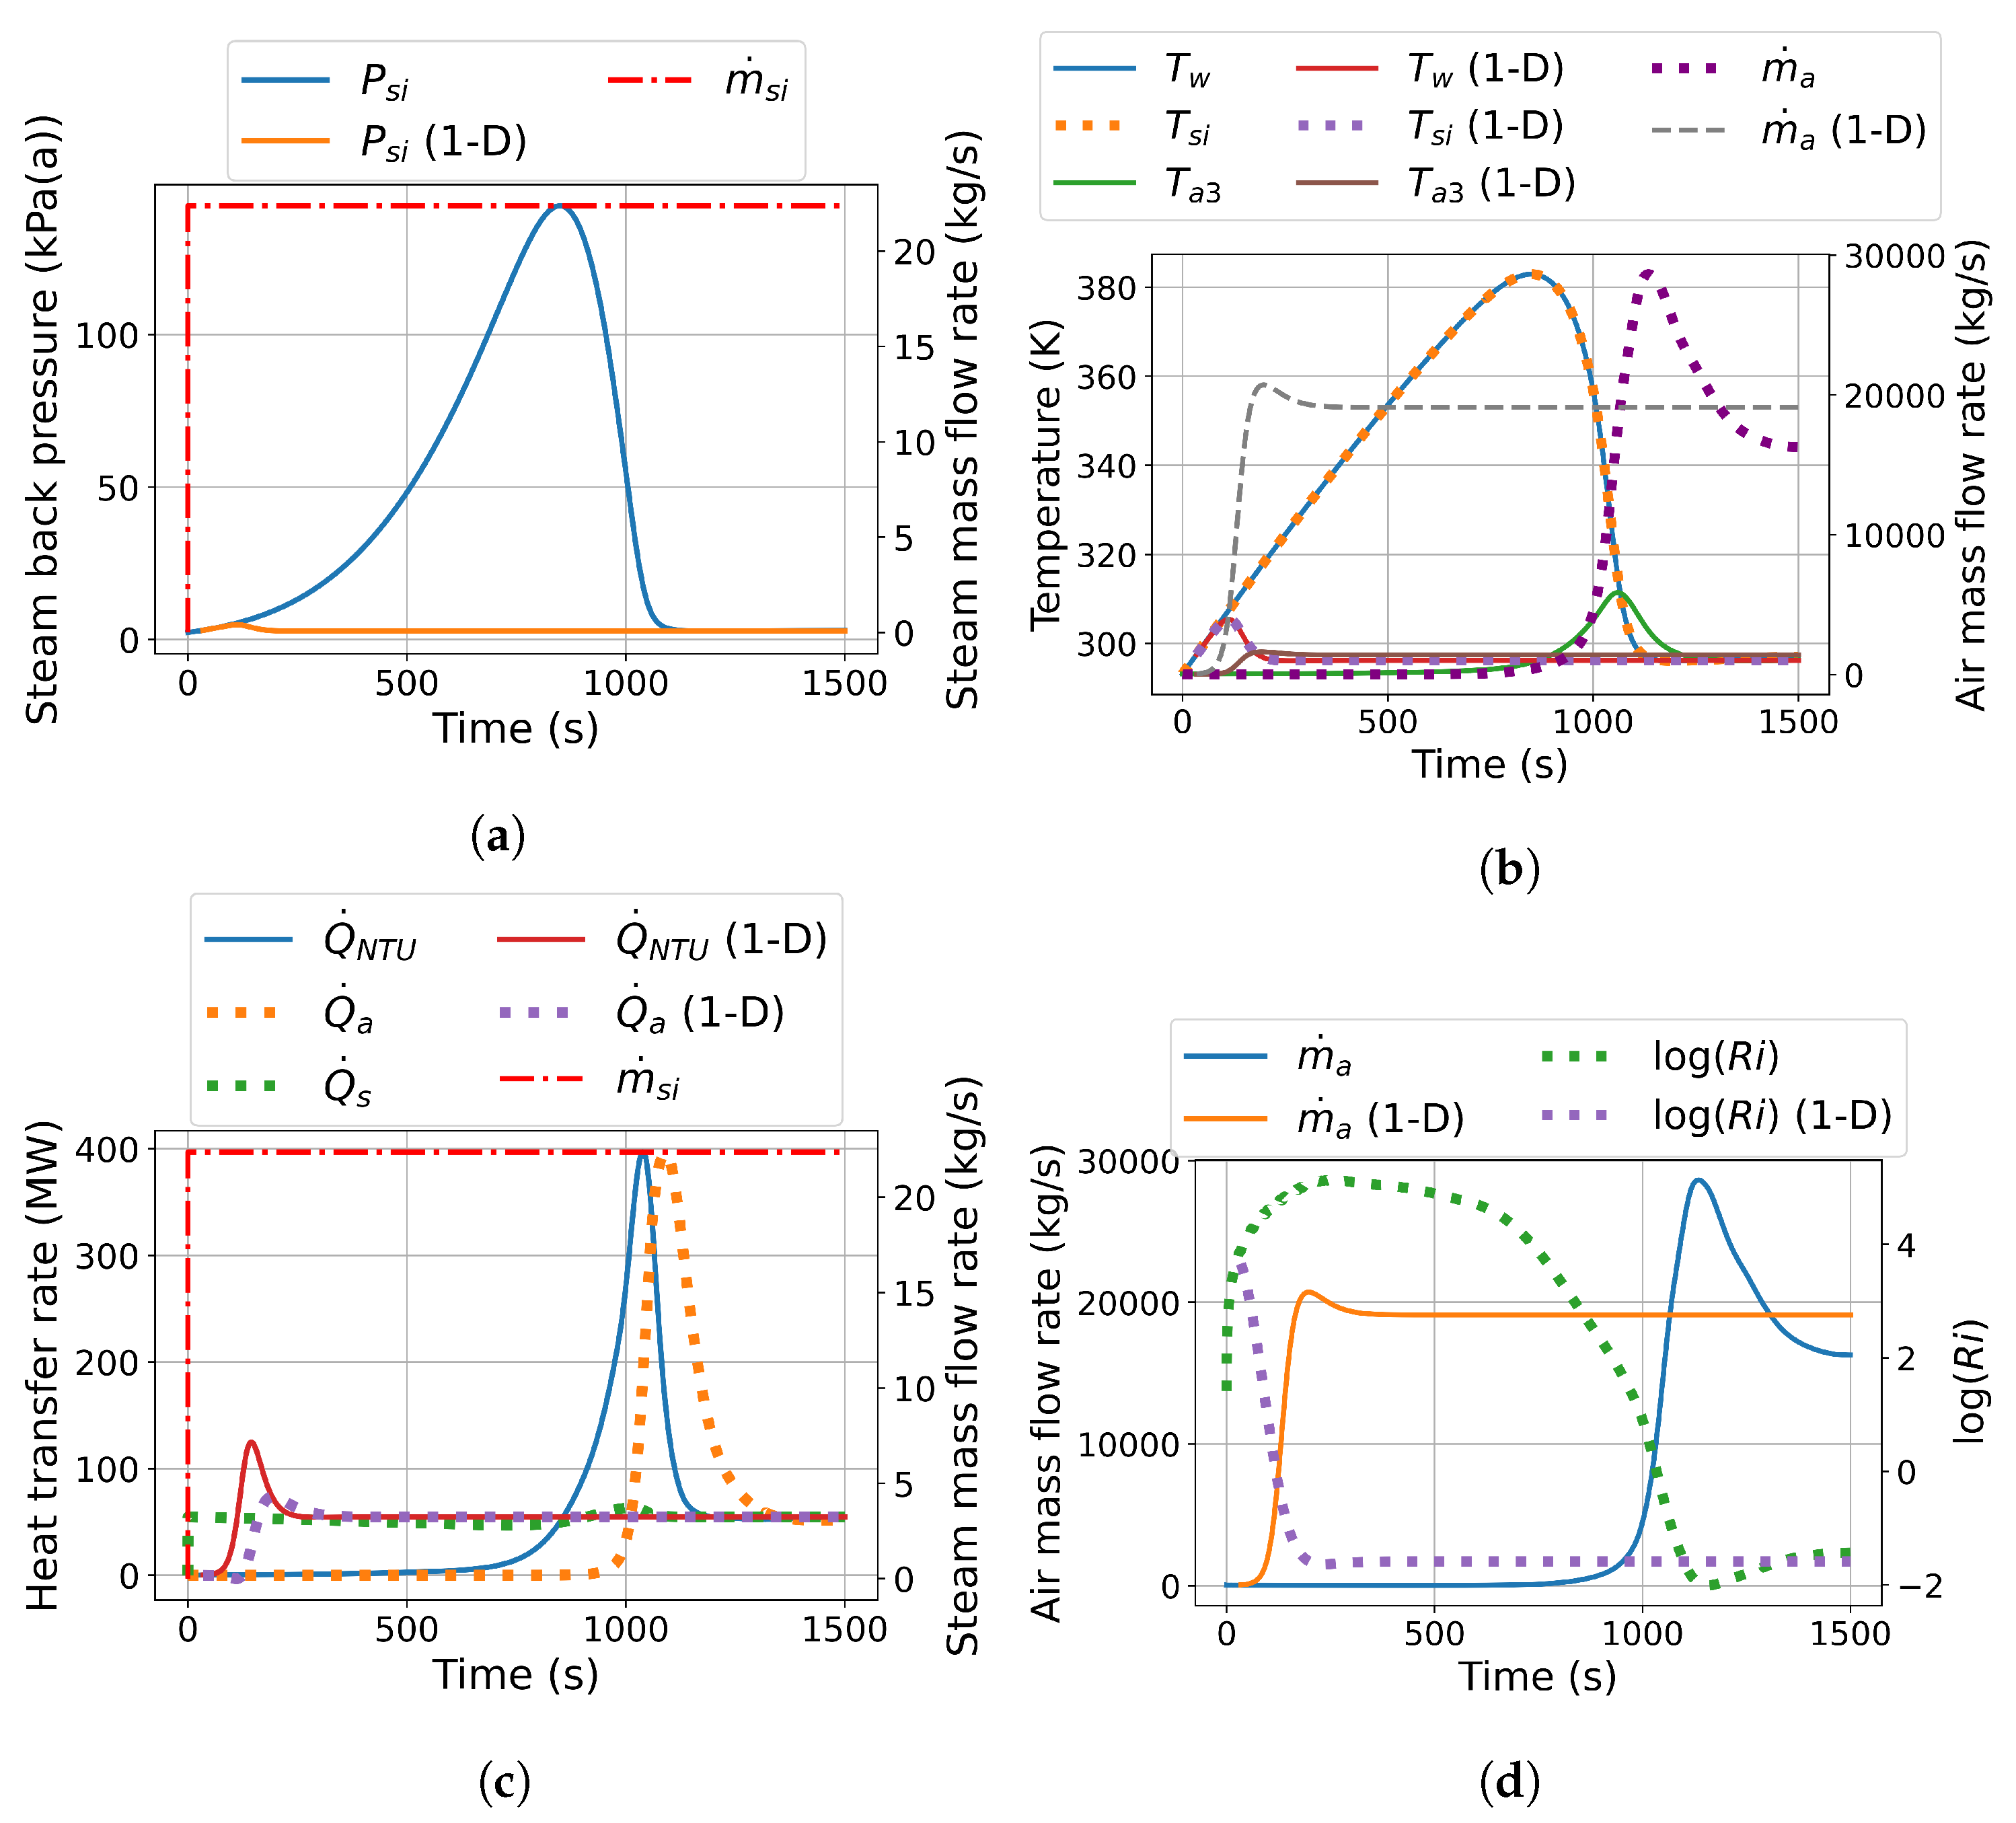
Figure 6.
Vector plot (a) and contour plot (b) coloured by temperature for large-scale NDDDCS inlet at 600 s, showing blocking effect due to rising plumes from natural convection () = 4.5); Vector plot (c) coloured by temperature for large-scale NDDDCS inlet at 960 s showing initiation of bulk flow () = 0.2).
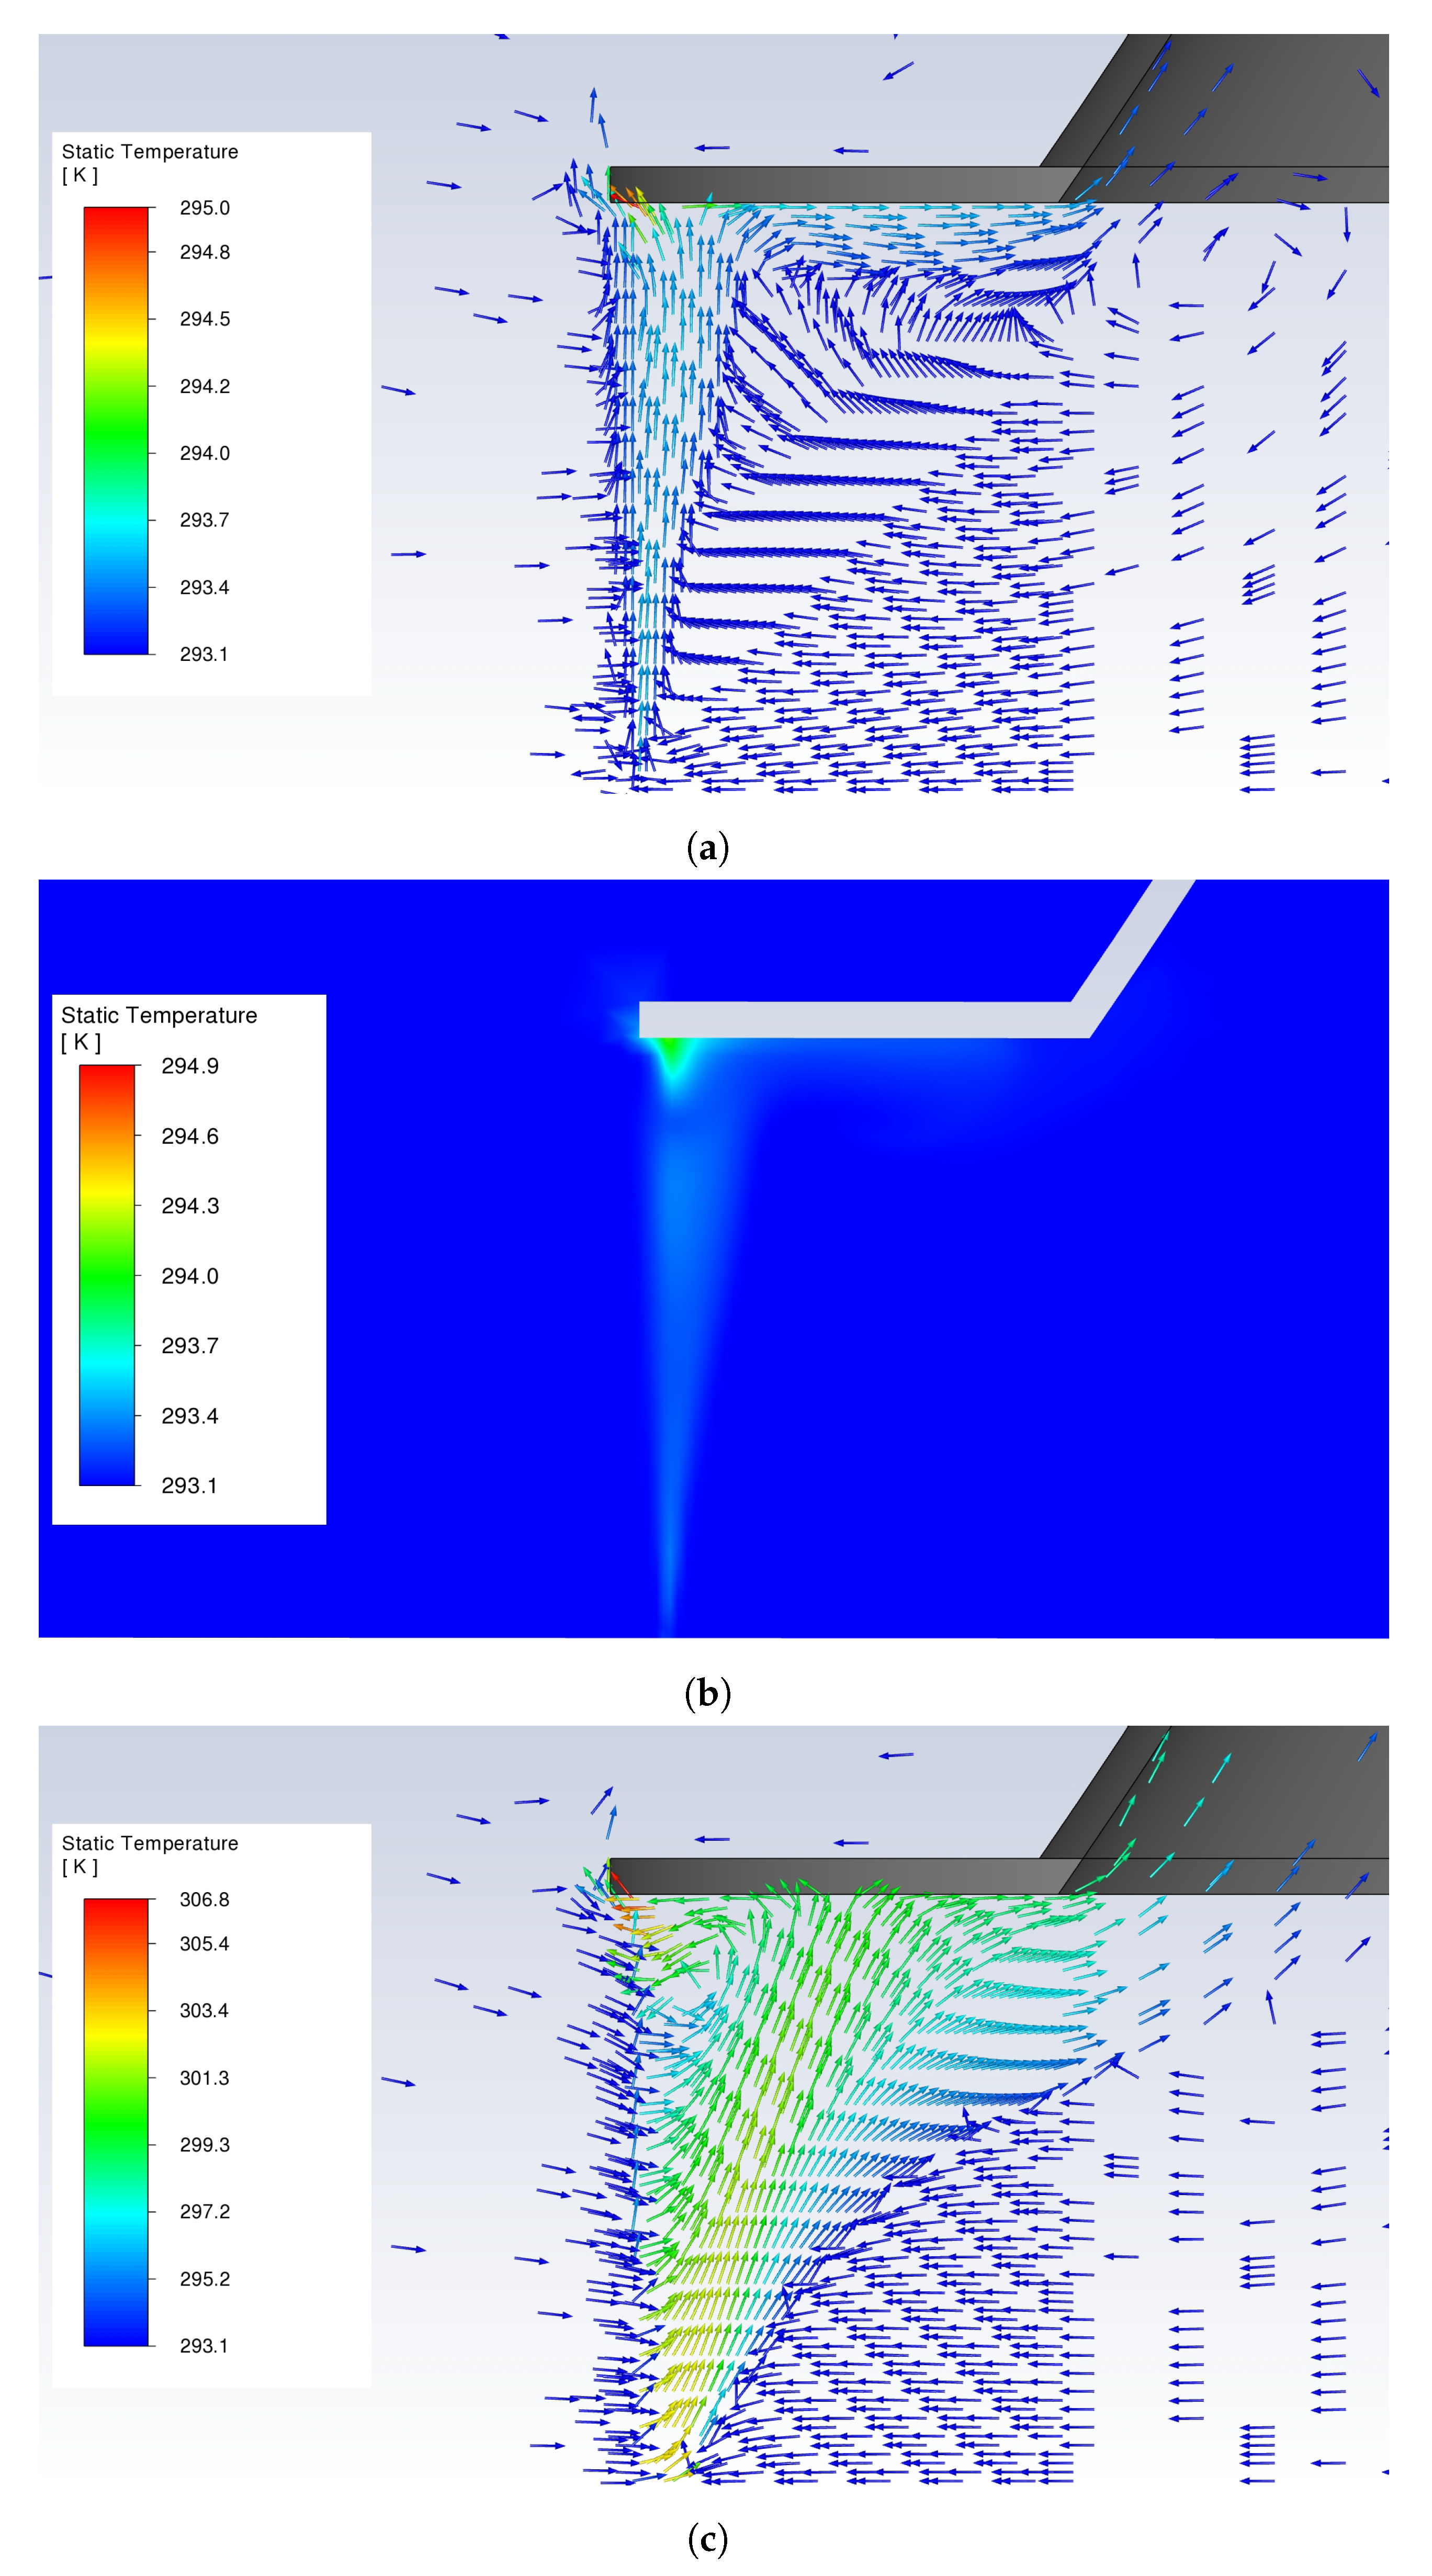
Figure 7.
Contour plot coloured by velocity magnitude for large-scale NDDDCS showing wall-bound flow at 960 s ()) = 0.2); Vector plot coloured by velocity magnitude for large-scale NDDDCS showing partially developed flow at 1140 s () = -1).
Figure 7.
Contour plot coloured by velocity magnitude for large-scale NDDDCS showing wall-bound flow at 960 s ()) = 0.2); Vector plot coloured by velocity magnitude for large-scale NDDDCS showing partially developed flow at 1140 s () = -1).
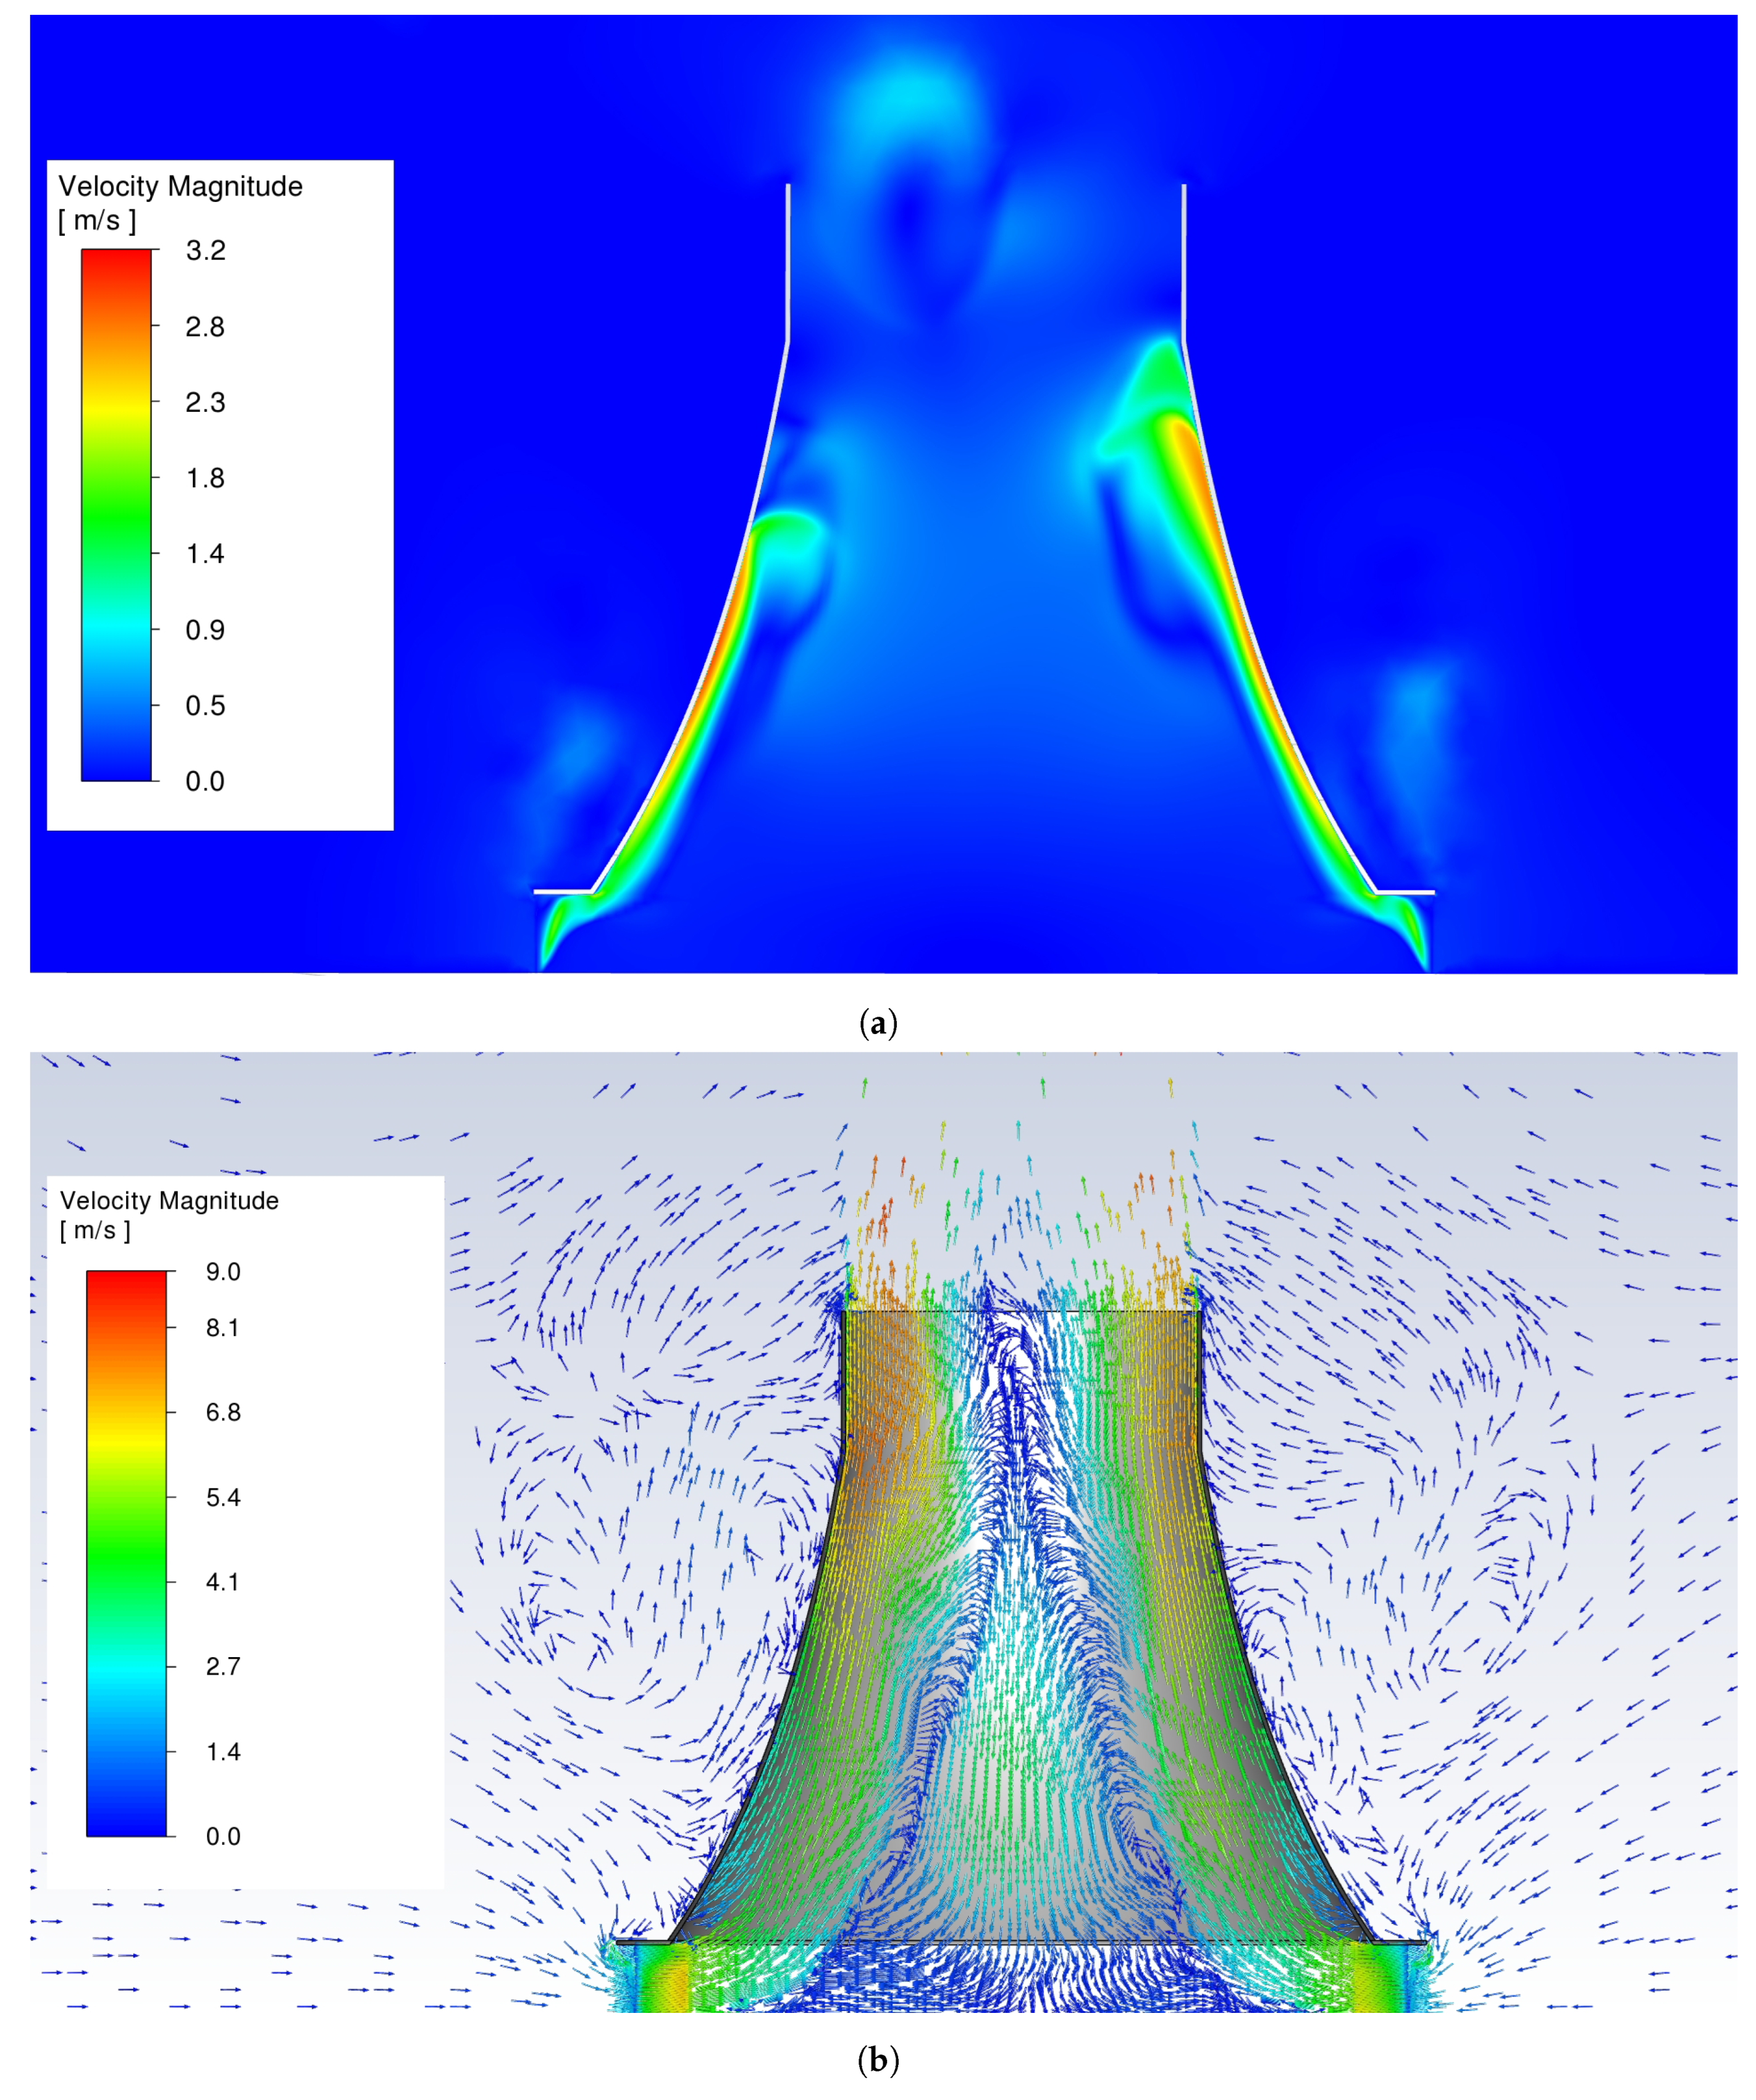
Figure 8.
Large-scale NDDDCS contour plots coloured by temperature showing development of thermal flow field under step input steam admission and no-wind conditions.
Figure 8.
Large-scale NDDDCS contour plots coloured by temperature showing development of thermal flow field under step input steam admission and no-wind conditions.
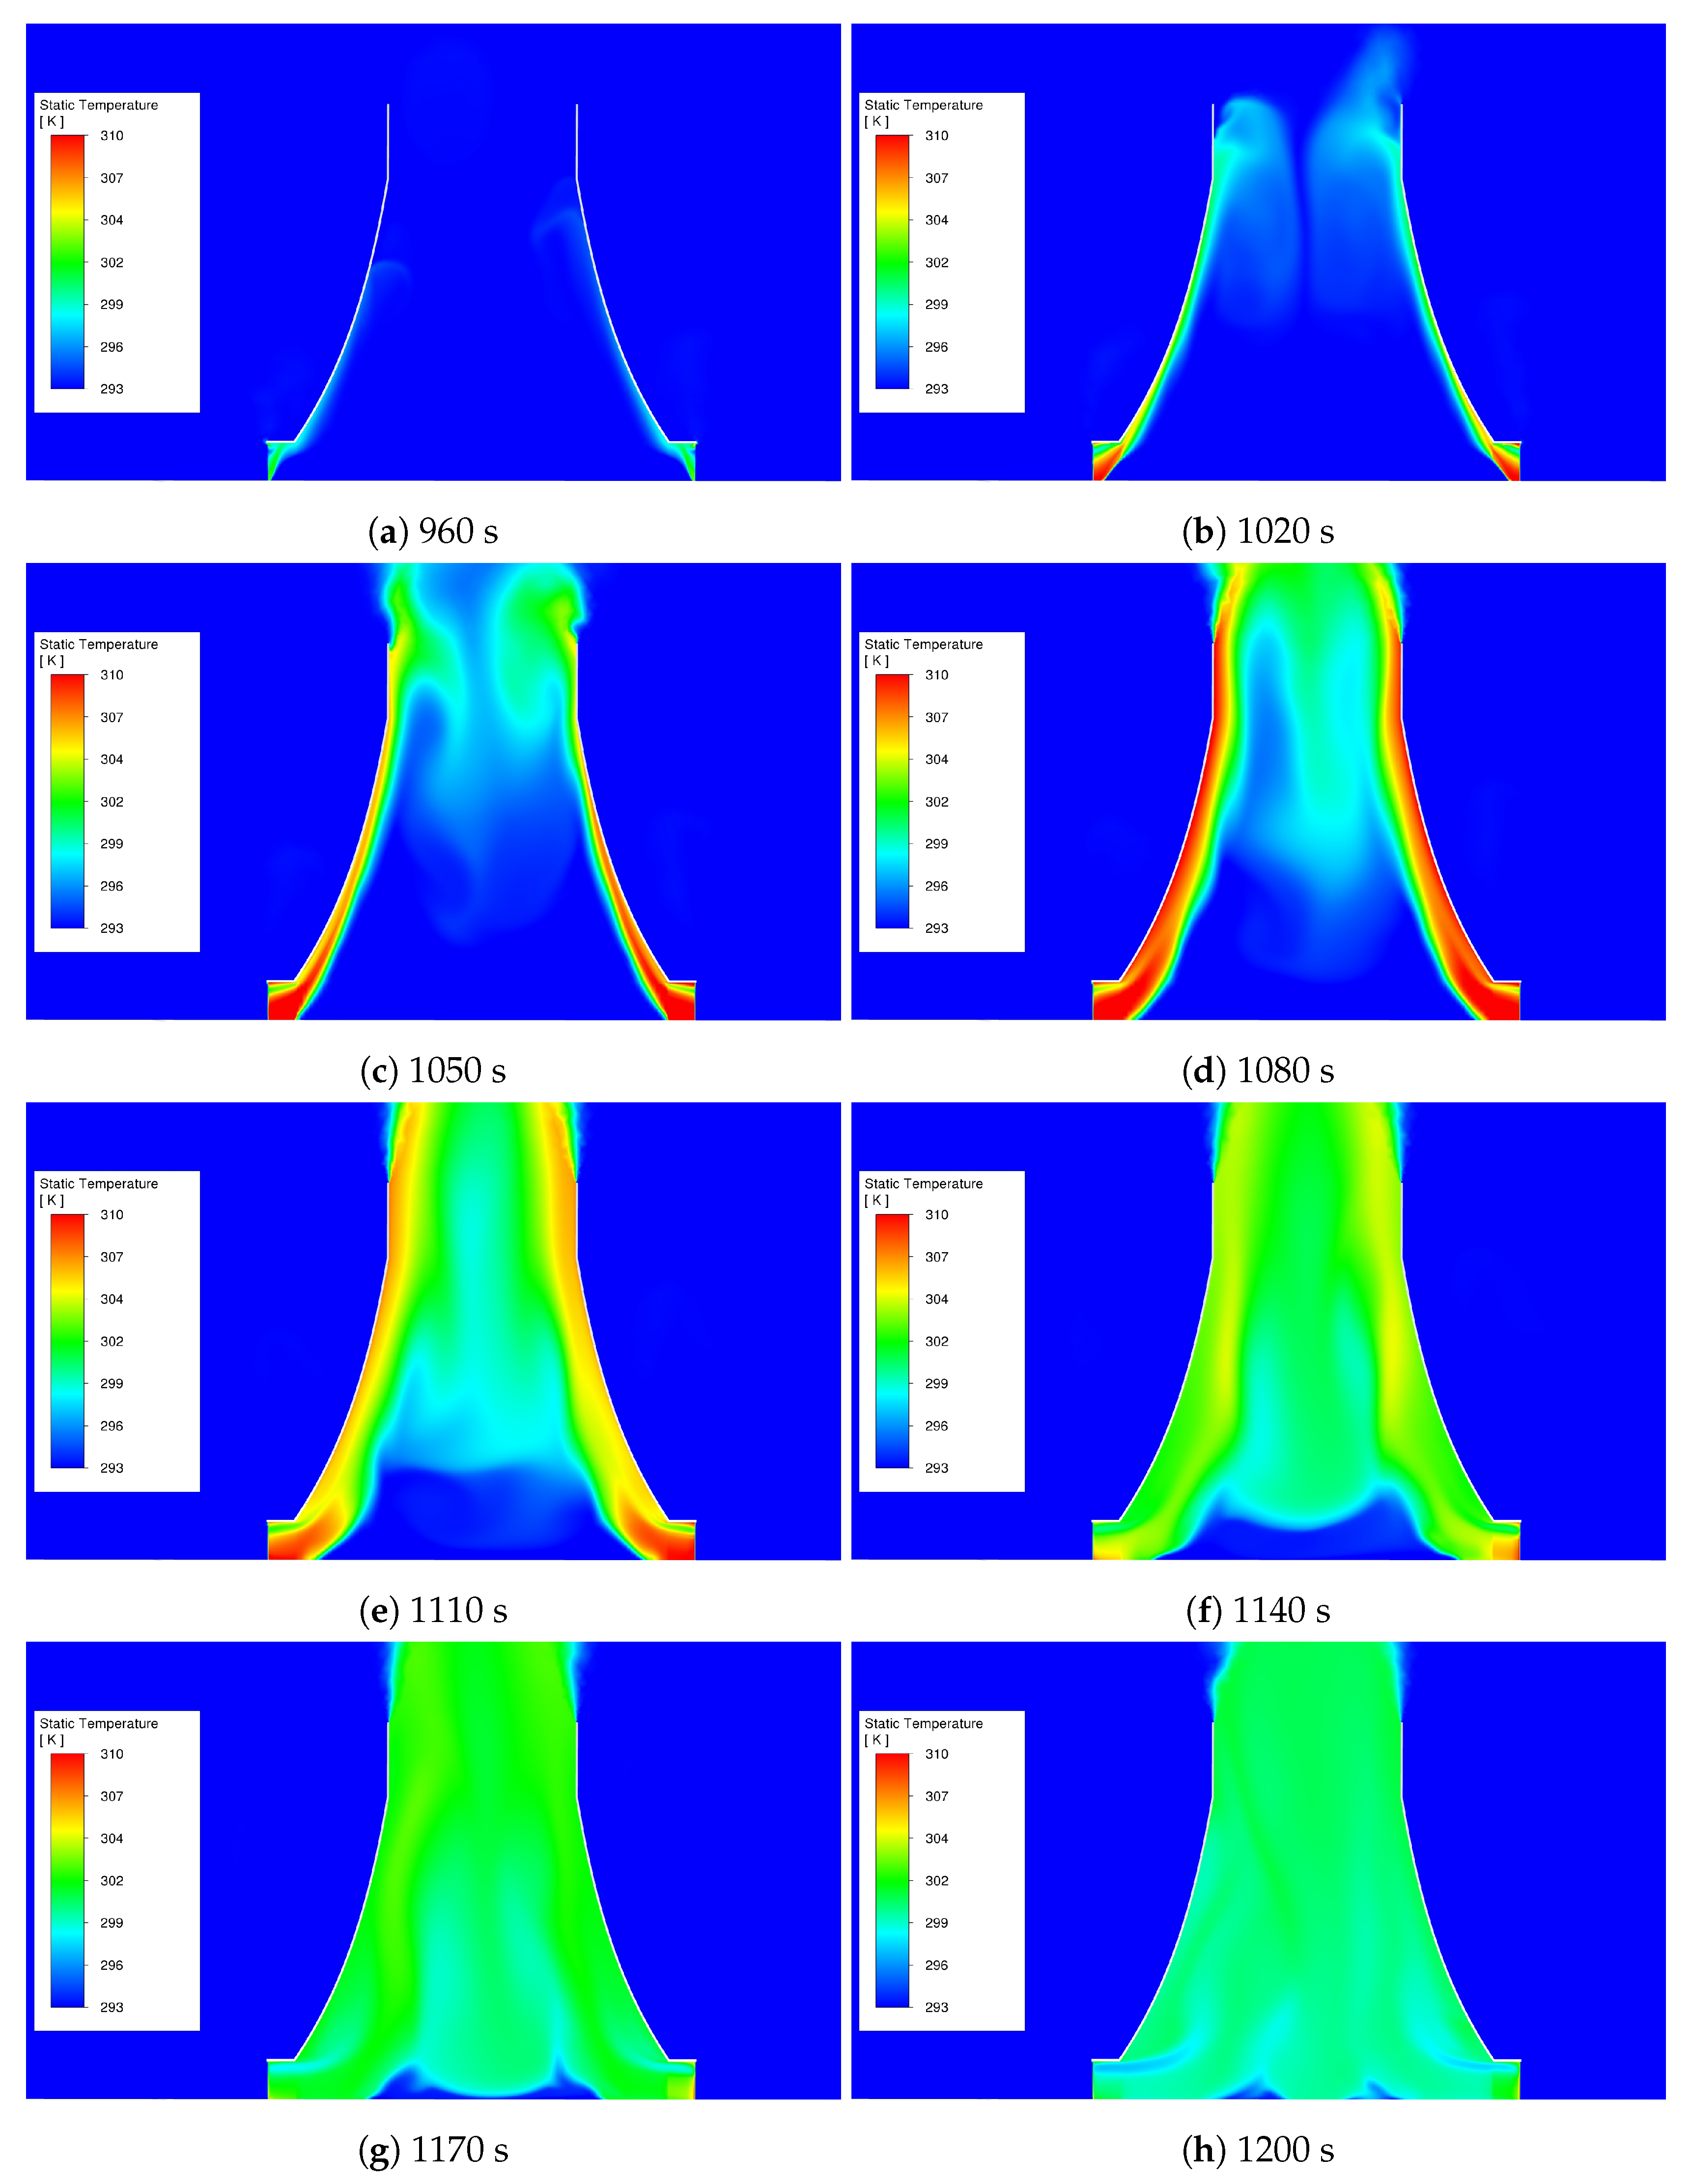
Figure 9.
Co-simulation vs 1-D: steam back pressure (a) and heat transfer rate (b) (primary y-axis) vs steam mass flow rate (secondary y-axis); temperature (c) (primary y-axis) vs air mass flow rate (secondary y-axis); air mass flow rate (d) (primary y-axis) vs Richardson number (secondary y-axis) transient response for large-scale NDDDCS under under no-wind load ramp.
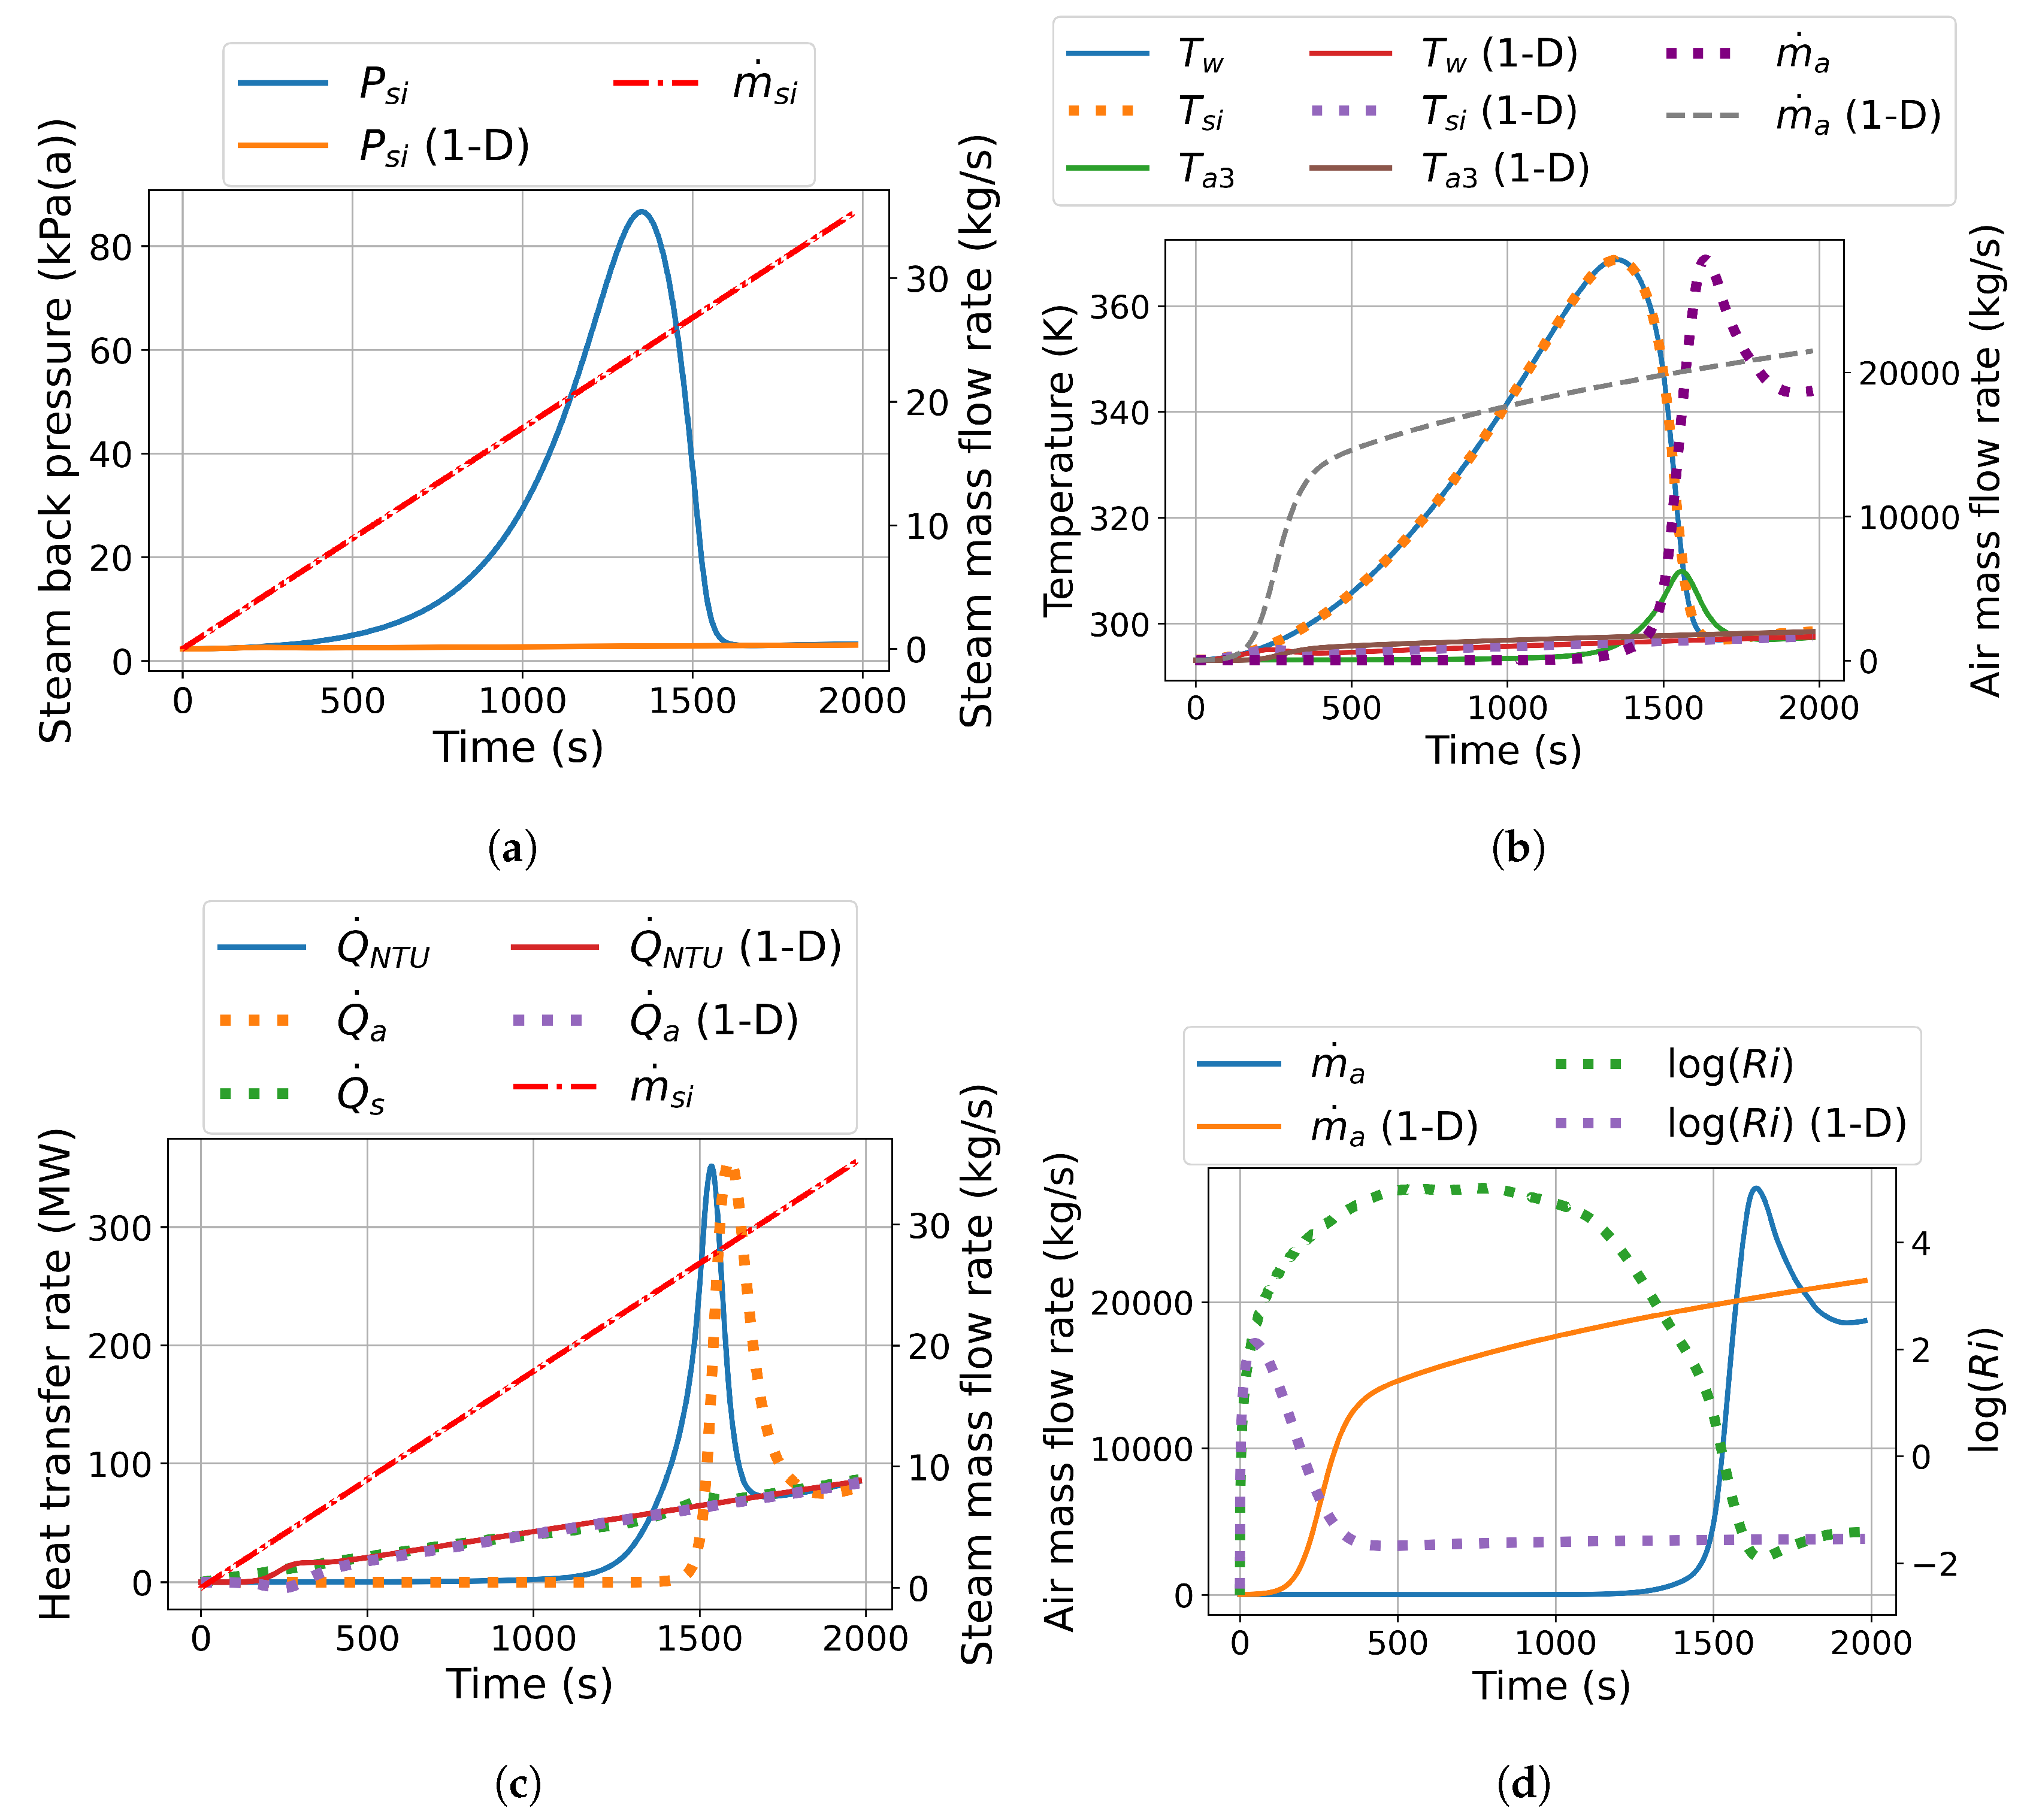
Figure 10.
Co-simulation: steam back pressure (a) and heat transfer rate (b) (primary y-axis) vs steam mass flow rate (secondary y-axis); temperature (c) (primary y-axis) vs air mass flow rate (secondary y-axis); air mass flow rate (d) (primary y-axis) vs Richardson number (secondary y-axis) transient response for large-scale NDDDCS under load ramp and 9 m/s crosswind conditions.
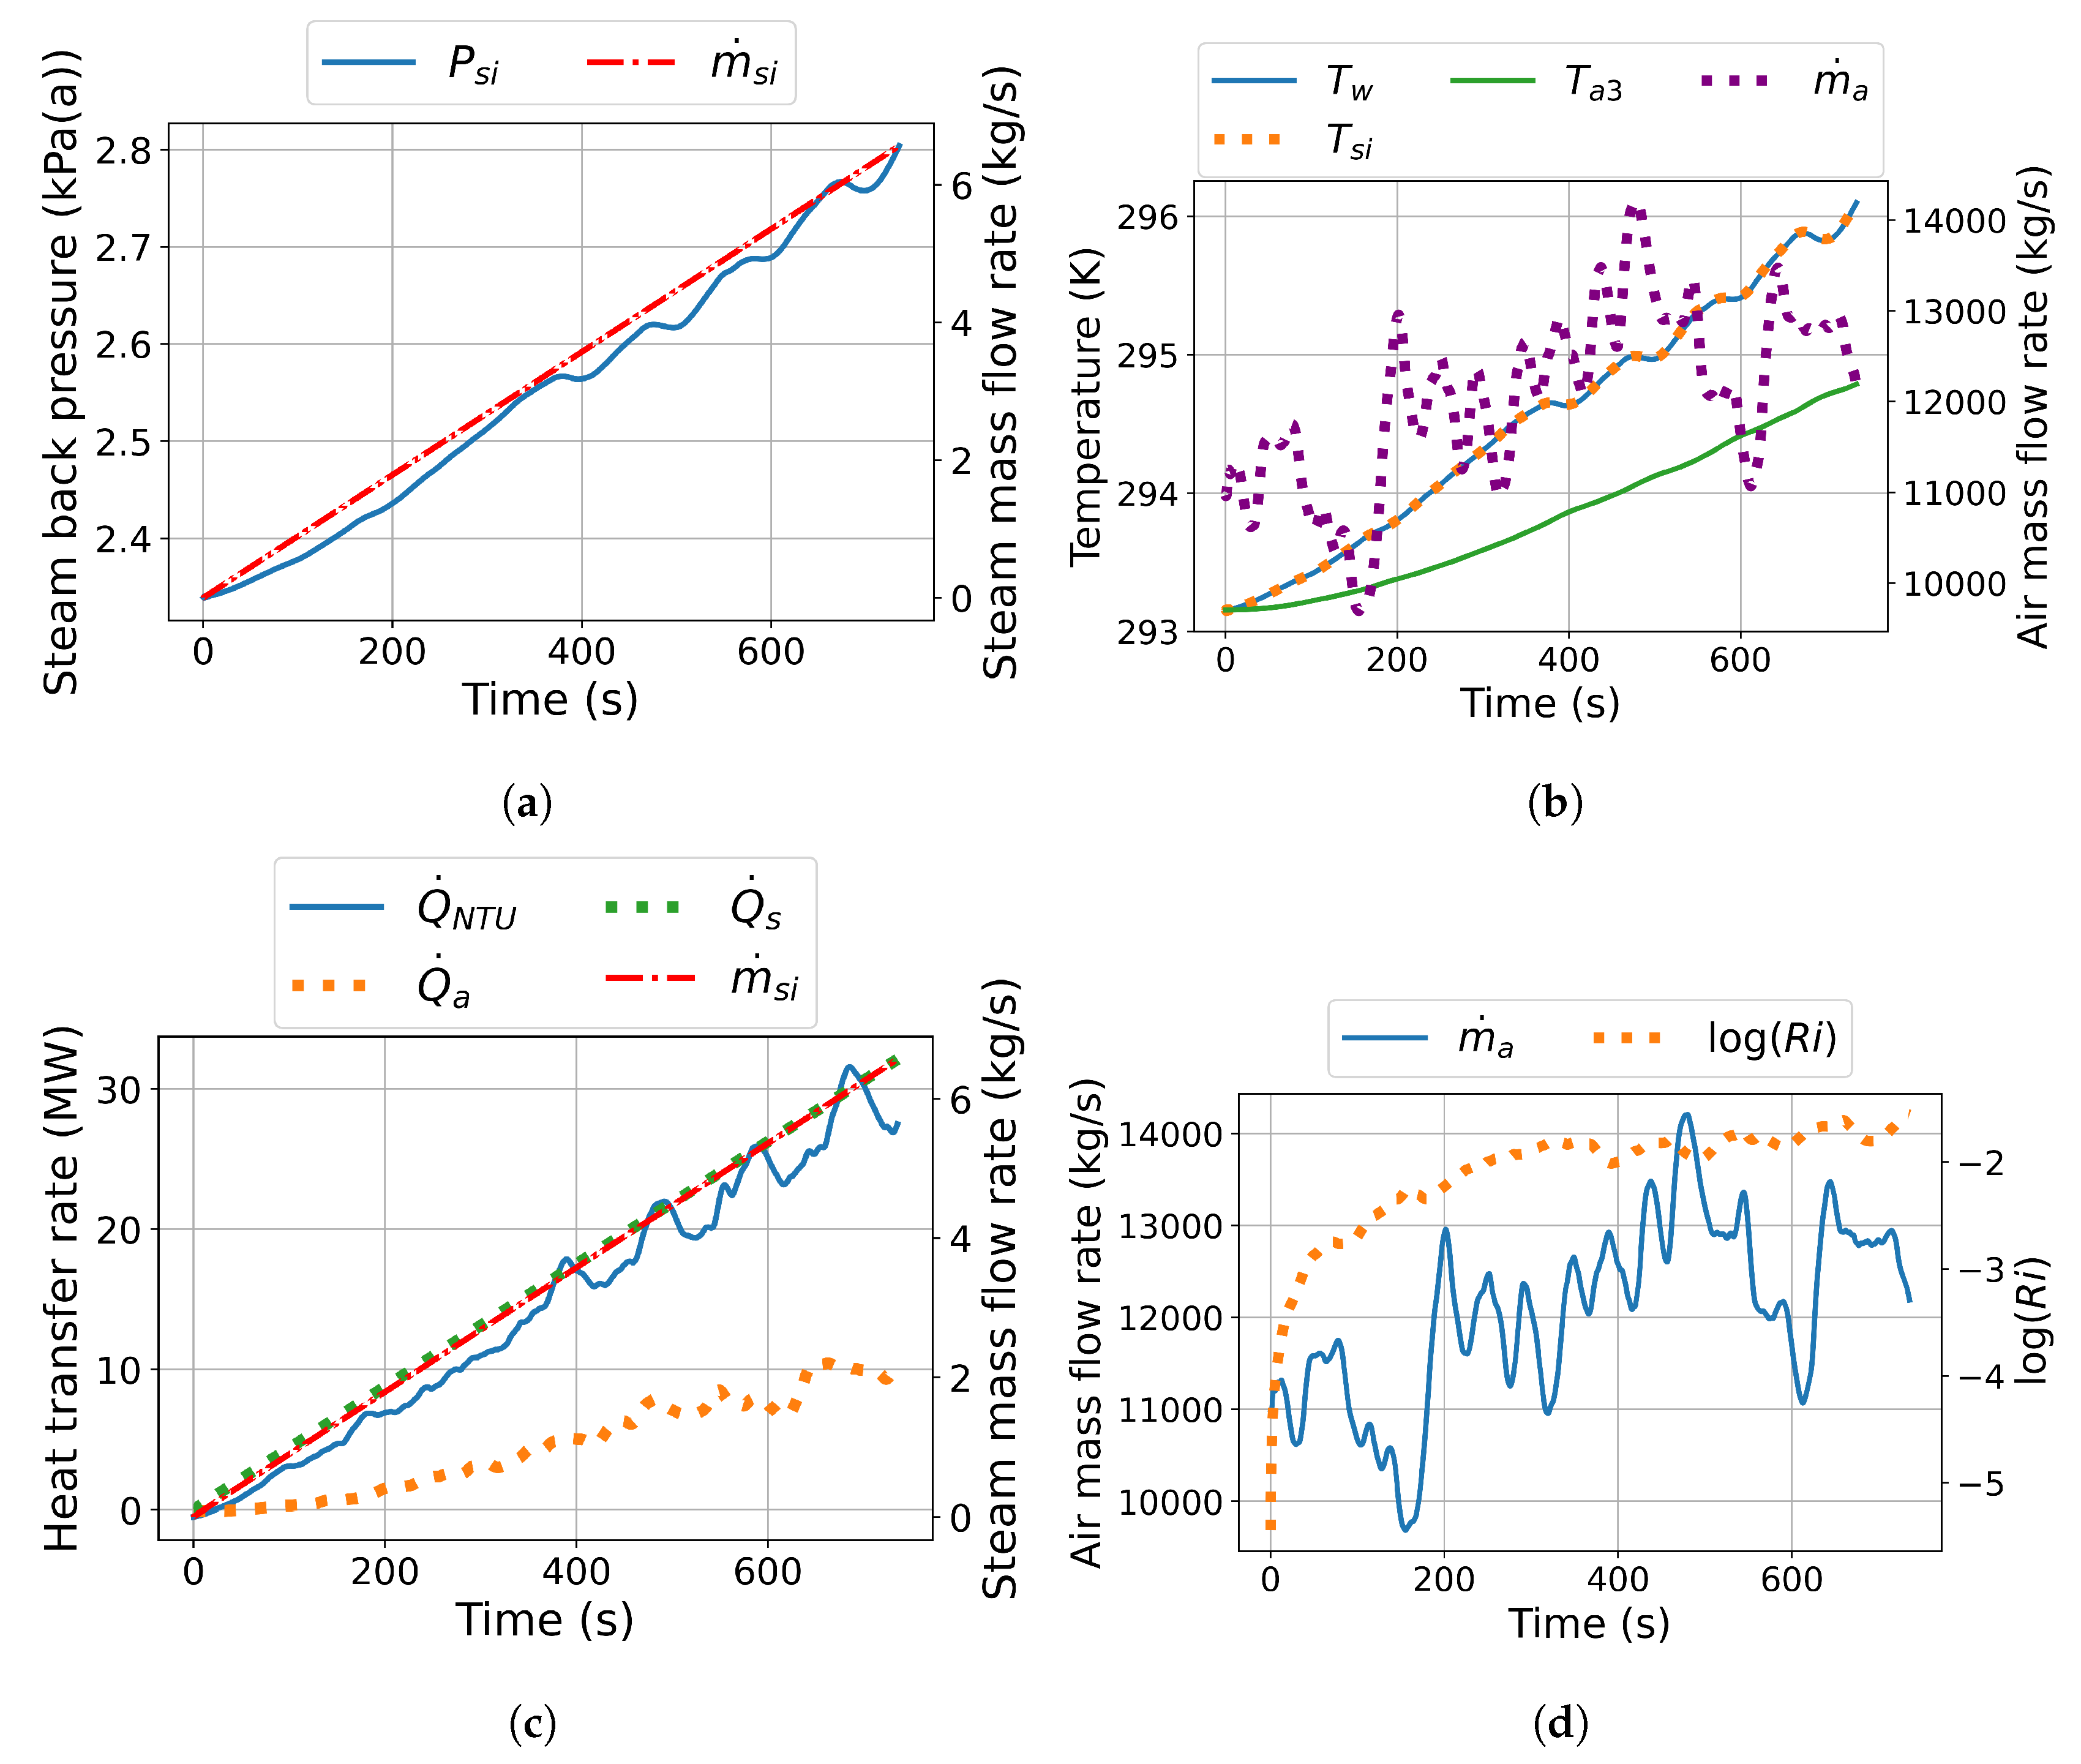
Figure 11.
Co-simulation vs 1-D: steam back pressure (a) and temperature (b) (primary y-axis) vs steam mass flow rate (secondary y-axis); heat transfer rate (c) (primary y-axis) vs air mass flow rate (secondary y-axis); air mass flow rate (d) (primary y-axis) vs Richardson number (secondary y-axis) transient response for large-scale NDDDCS under full load turbine islanding scenario.
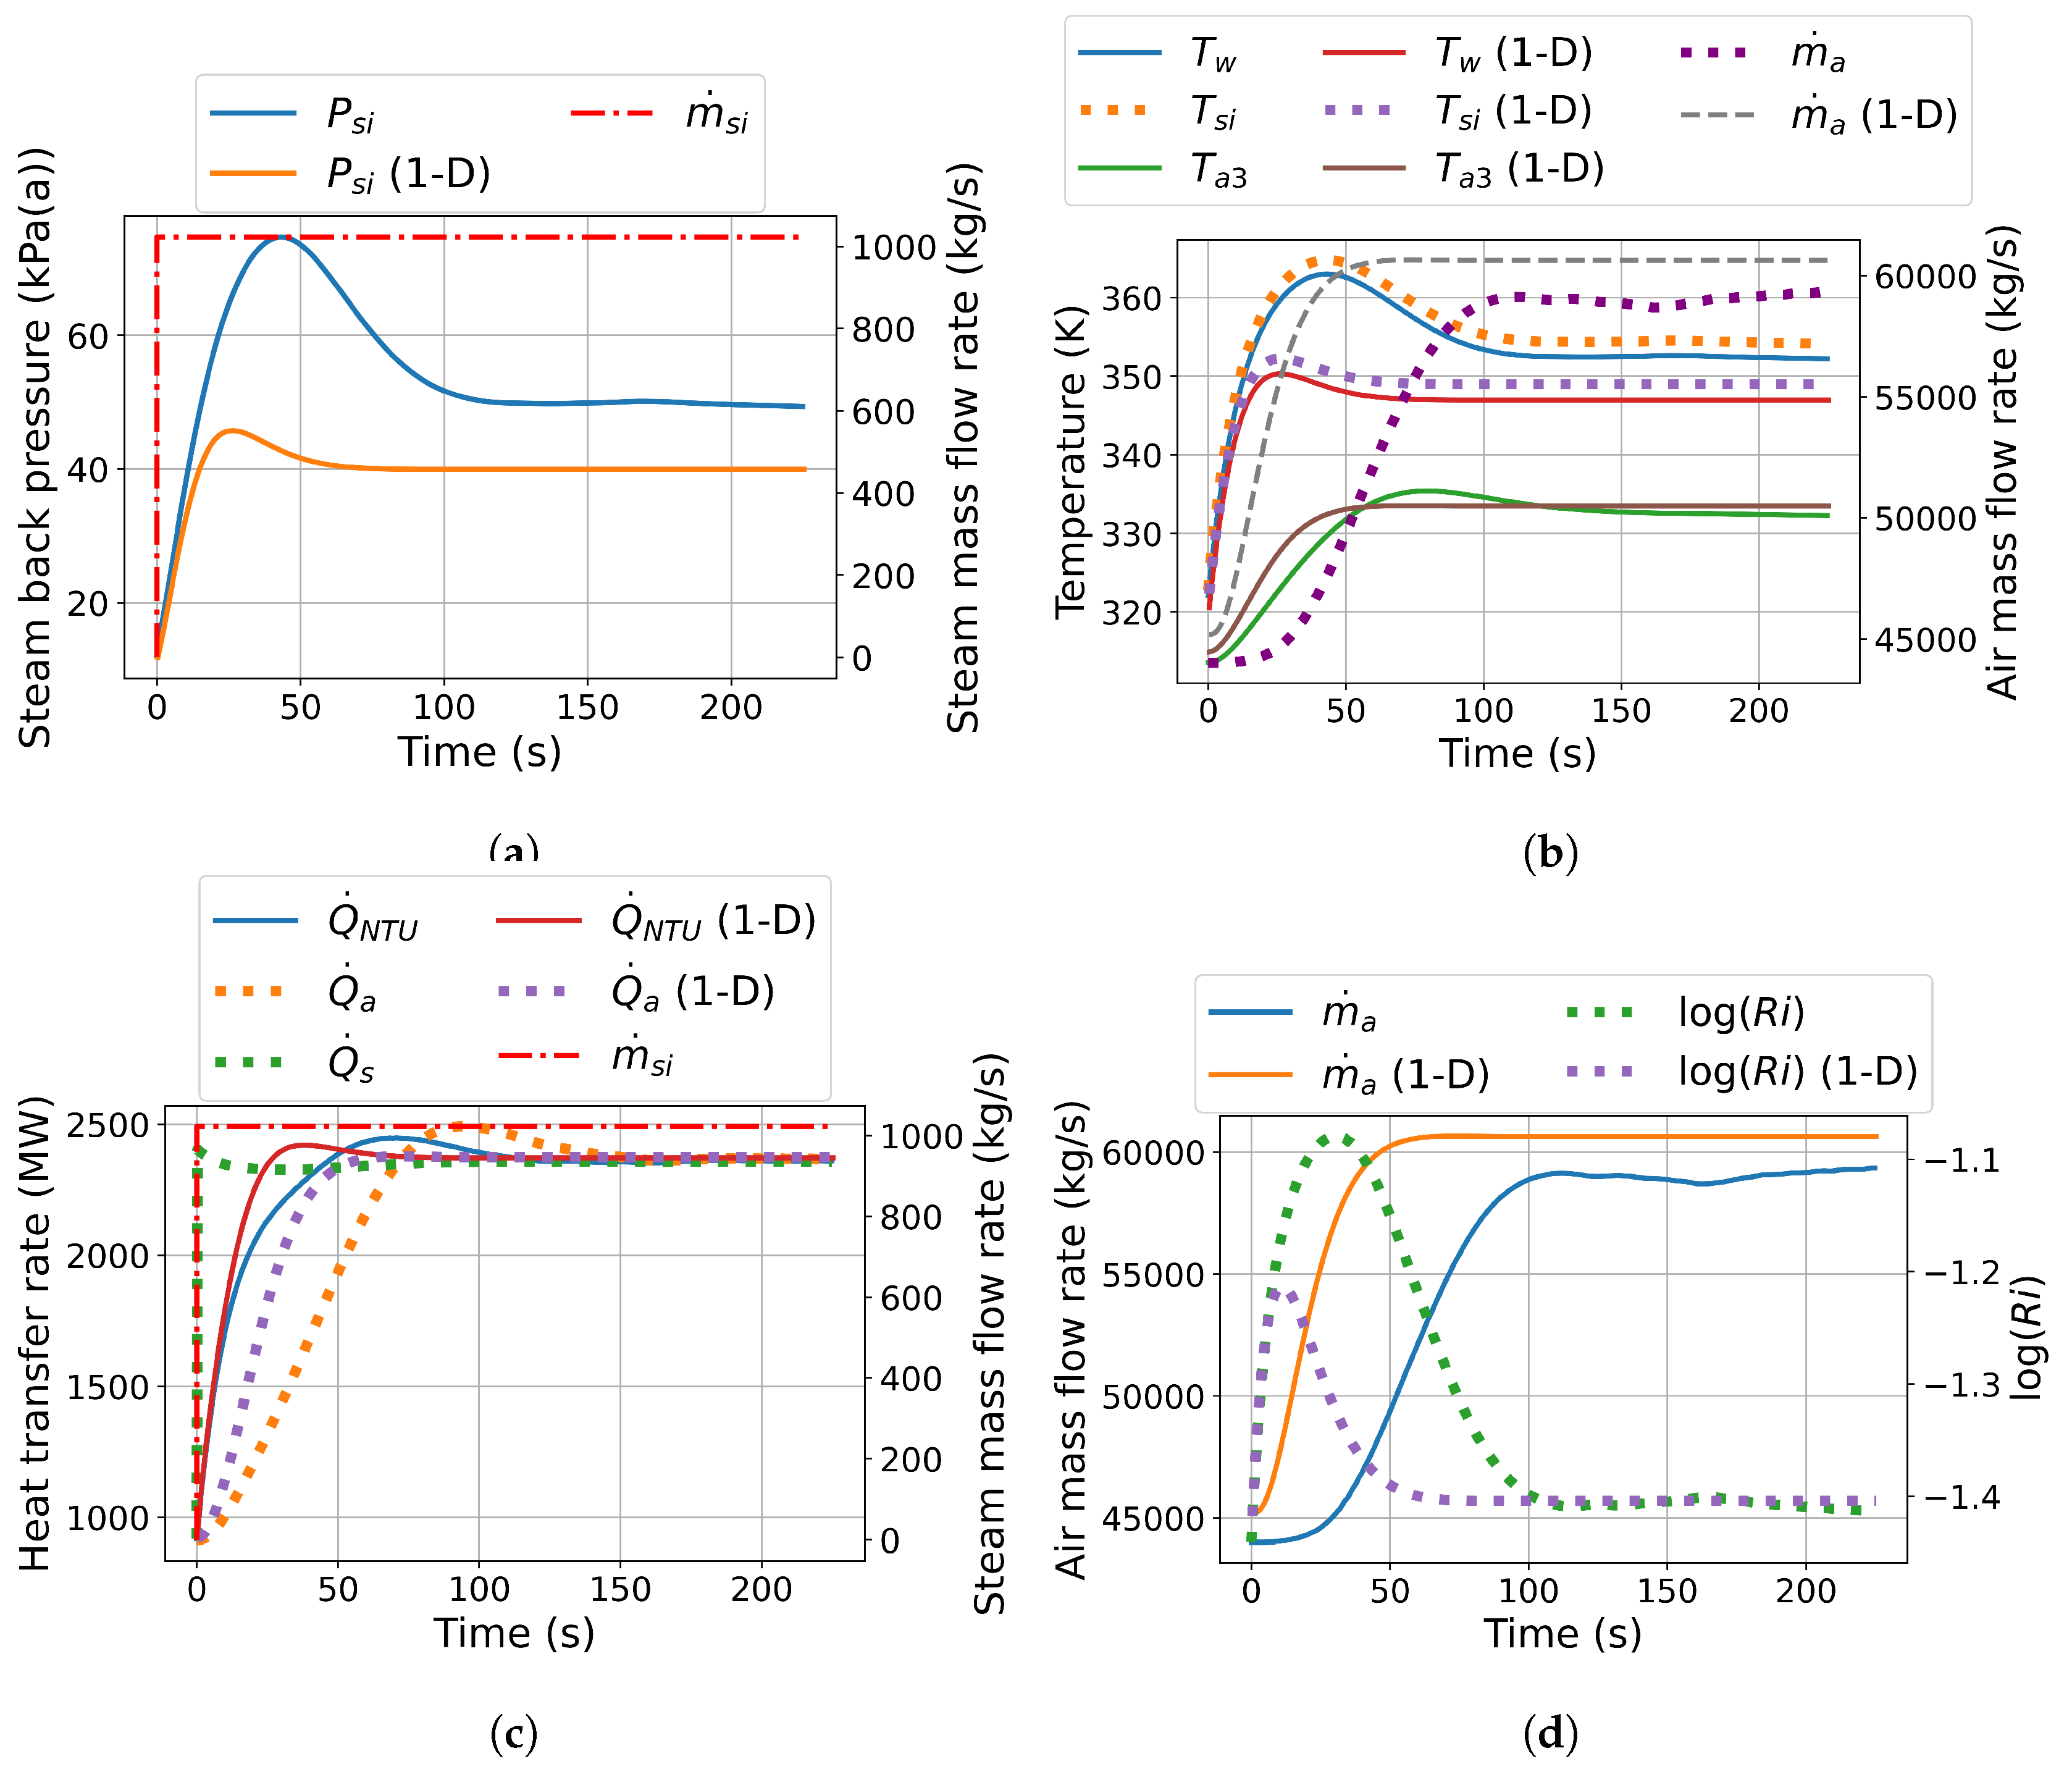

Table 1.
NDDDCS reference dimensions at the two scales under consideration.
| Description | Symbol | Value (m) |
|---|---|---|
| Tower dimensions | ||
| Total tower height | 165.0 | |
| Height of tower throat | 150.3 | |
| Inlet height | 16.5 | |
| Inlet diameter | 165.0 | |
| Outlet/Throat diameter | 82.5 | |
| Tower shell thickness | 1 | |
| Finned tube dimensions | ||
| Base tube major axis | a | 0.15 |
| Base tube minor axis | b | 0.026 |
| Base tube thickness | 0.0015 | |
| Tube pitch | 0.067 | |
| Fin length | 0.18 | |
| Fin height | 0.0195 | |
| Fin thickness | 0.00025 | |
| Fin pitch | 0.0023 |
Table 2.
Summary of governing equations.
| Description | Equation |
|---|---|
| Continuity | |
| X-momentum | |
| Y-momentum | |
| Z-momentum | |
| Energy |
Table 3.
Mesh sensitivity analysis and grid convergence index results.
| Mesh | (kg/s) | (MW) |
|---|---|---|
| Coarse (7.3 M) | 44126.20 | 924.18 |
| Fine (11.3 M) | 44094.68 | 928.18 |
| 44058.27 | 932.80 | |
| (%) | 0.083 | 0.495 |
| (%) | 0.248 | 1.493 |
Table 4.
Systematic validation of transient 1-D numerical model to 3-D CFD model by [17].
Table 4.
Systematic validation of transient 1-D numerical model to 3-D CFD model by [17].
| Variable | (kg/s) | (MW) | (K) | (kg/s) |
|---|---|---|---|---|
| 3-D CFD by Kong et al. [17] | 32557.97 | 1136.35 | 360.95 | 496.62 |
| Heat exchanger characteristics from Kong et al. [17] | ||||
| 1-D steady-state model [22,23] | 31942.47 | 1130.02 | 360.95 | 493.70 |
| Heat exchanger characteristics from Krger [7] | ||||
| 1-D steady-state model [22,23] | 33058.44 | 1305.60 | 360.95 | 570.41 |
| 1-D transient model | 31108.19 | 1142.08 | 356.43 | 496.62 |
Table 5.
Validation of steady-state NDDDCS 3-D CFD model under no-wind and 6 m/s crosswind conditions [21].
Table 5.
Validation of steady-state NDDDCS 3-D CFD model under no-wind and 6 m/s crosswind conditions [21].
| Variable | (kg/s) | (MW) |
|---|---|---|
| No-wind | ||
| CFD by Kong et al. [17] | 32557.97 | 1136.35 |
| 3-D NDDDCS model [21] | 32926.18 | 1080.42 |
| 6 m/s crosswind | ||
| CFD by Kong et al. [17] | 29499.58 | 1055.27 |
| 3-D NDDDCS model [21] | 29439.39 | 971.02 |
| Relative performance deterioration | ||
| CFD by Kong et al. [17] | -9.39% | -7.14% |
| 3-D NDDDCS model [21] | -10.59% | -10.13% |
Table 6.
Validation of transient co-simulation model under no-wind conditions.
| Model | (K) | (MW) | (kg/s) | (Pa) | (kg/s) |
|---|---|---|---|---|---|
| 3-D NDDDCS model [21] | 323.15 | 927.51 | 44097.51 | 79.95 | 385.87 |
| Co-simulation model | 322.74 | 918.92 | 44015.73 | 78.24 | 385.87 |
Disclaimer/Publisher’s Note: The statements, opinions and data contained in all publications are solely those of the individual author(s) and contributor(s) and not of MDPI and/or the editor(s). MDPI and/or the editor(s) disclaim responsibility for any injury to people or property resulting from any ideas, methods, instructions or products referred to in the content. |
© 2025 by the authors. Licensee MDPI, Basel, Switzerland. This article is an open access article distributed under the terms and conditions of the Creative Commons Attribution (CC BY) license (http://creativecommons.org/licenses/by/4.0/).
Copyright: This open access article is published under a Creative Commons CC BY 4.0 license, which permit the free download, distribution, and reuse, provided that the author and preprint are cited in any reuse.


