
Submitted:
21 October 2025
Posted:
22 October 2025
You are already at the latest version
Abstract
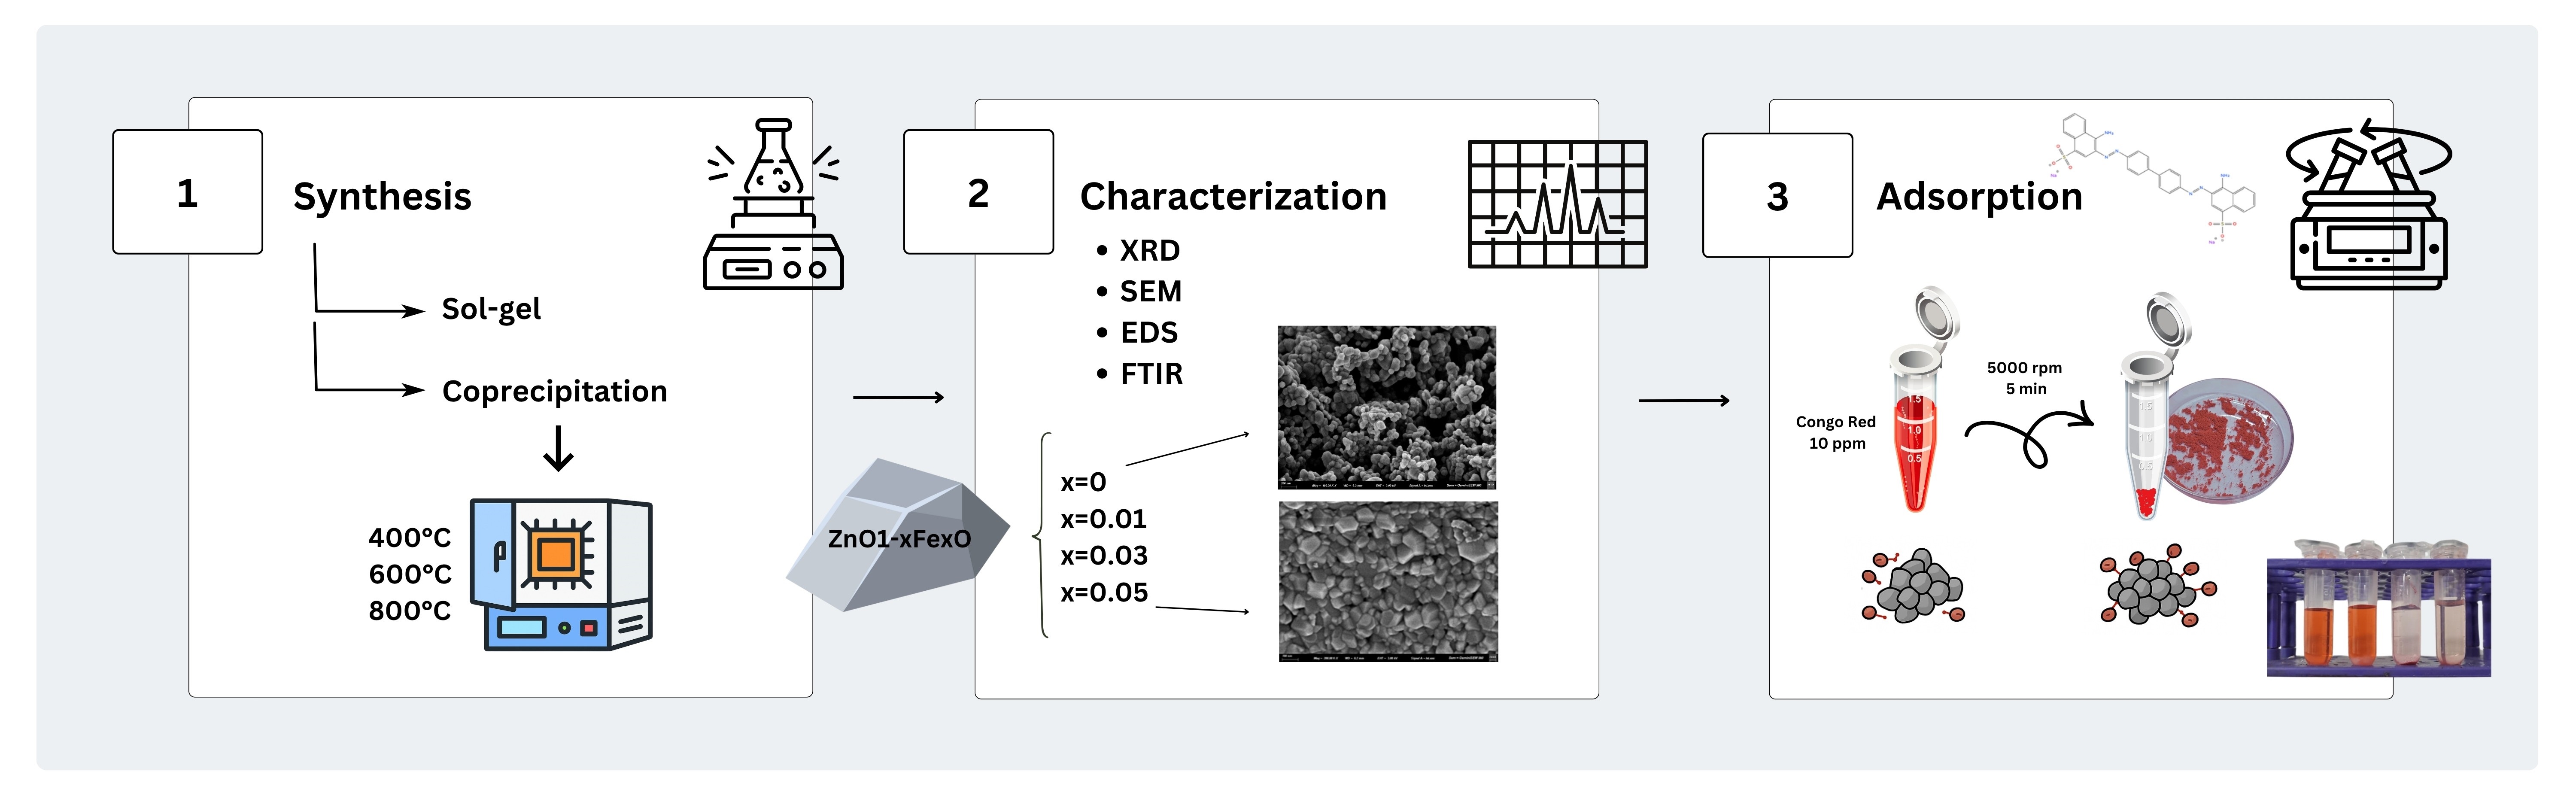
The influence of the synthesis method on the properties of Zn₁₋ₓFeₓO nanoparticles with different Fe doping levels (x = 0, 0.01, 0.03, and 0.05) for Congo Red (CR) adsorption was investigated. Nanoparticles were prepared by sol-gel and coprecipitation, and characterized using XRD, SEM, and FTIR. Sol-gel synthesis produced smaller (~13 nm) particles, exhibiting high CR adsorption efficiency (~90%) at 10 ppm and room temperature. In contrast, coprecipitation generated larger (~35 nm) nanostructures, with lower adsorption capacity (~24%). Both the synthesis method and calcination temperature significantly influenced the nanocrystallite size. Fe doping enhanced adsorption in all cases, particularly by maintaining high adsorption percentages at elevated temperatures. Fe³⁺ incorporation into ZnO nanoparticles modifies the crystal structure, possibly creating defects and vacancies that serve as preferential adsorption sites for anionic dyes. Efficient removal of organic dyes such as Congo Red is critical due to their toxicity and environmental persistence in industrial wastewater. These findings suggest that careful selection of synthesis parameters can yield highly effective adsorbents, providing a promising strategy for environmental remediation and sustainable water treatment applications.
Keywords:
nanoparticles
; zinc oxide
; Fe-doped
; adsorption
; Congo Red
1. Introduction
In recent years, zinc oxide (ZnO) nanoparticles have received much attention due to their physicochemical properties, with important applications such as sensors, solar cells, catalysts, adsorbent, electrical and optoelectronic processes and systems, and additives in many industrial products, among others [1,2].
This metal oxide, in its crystalline form, exhibits the wurtzite structure, with a hexagonal unit cell with two lattice parameters, a = 3.2489 (1) Å and c = 5.2053 (4) Å under ambient conditions. Furthermore, ZnO nanostructures possess a high surface area and remarkable catalytic activity [3], with interesting qualities for the treatment of contaminated water [4].
Therefore, the challenge involves the design of practical, effective, and low-cost methods that allow the large-scale production of this nanomaterial.
Among the most promising synthesis methods, wet chemical processes such as sol-gel and coprecipitation allow nanostructures to be synthesized in a few steps and do not require complex instruments or techniques [5]. In this way, pure ZnO nanoparticles can be obtained, using non-toxic solvents and low synthesis temperatures [6].
The sol-gel method involves the transition from sol to gel, followed by drying and calcination, while the coprecipitation method involves the conversion of a solution into an insoluble solid, which can be separated from the solution by sedimentation, filtration, and washing [7,8,9,10]. Since both methods allow for the economical and reproducible production of ZnO nanopowders with different characteristics, their comparative study is crucial.
Furthermore, doping transition metal ions, such as Fe, in the ZnO crystal structure modifies the optical, electrical, magnetic, and physical properties of the material, providing new functionalities. In fact, Fe doping has been proposed as a stabilizer of ZnO in aqueous media, preventing the aggregation of nanoparticles into large flocculates due to their hydrophobic nature [11,12,13,14,15]. These new improved characteristics of Fe-doped ZnO nanoparticles substantially improve their application as an adsorbent for the treatment of contaminated water [16].
In terms of industrial pollution, approximately 1 million tons of dyes are produced annually worldwide by the textile industry, and almost 15% of these pollutants are discharged as effluents [17,18]. Effective treatment of colored wastewater is costly and involves chemical and energy-intensive treatments.
The presence of traces of dyes in aqueous systems has led to severe environmental problems because many of them have toxic, mutagenic, and carcinogenic characteristics [19]. Congo Red, in addition to having these characteristics, is interesting as a contaminant in industrial effluents and as a good model for complex pollutants [20].
Among the technologies available for water treatment, adsorption is a simple, economical, effective, and universal method [21]. ZnO nanoparticles have been frequently used for the adsorption of dyes, predominantly anionic dyes. At pH above 10 the surface species Zn(OH)3- and Zn(OH)42- dominate. However, at pH below 9, Zn(OH)+ and Zn2+ are the dominant species [22]. This explains the affinity of CR for the nanoparticles used as adsorbents. Sachin et al., [23] have shown that sol-gel prepared ZnO nanoparticles doped with Fe, Co and Mg, at a nominal 2 wt.%, have high removal efficiency of Congo Red from aqueous solutions. Although Co doping has been reported to achieve much higher removal efficiencies (around 230 mg/g), doping with Fe at different amounts can significantly affect the capacity of the nanoadsorbent.
To the best of our knowledge, there are no previous reports comparing different synthesis methods of Fe-doped ZnO nanoparticles with respect to their influence on performance in a specific application, as investigated in the present study. Therefore, the objective of this work was to synthesize and characterize Fe-doped ZnO nanoparticles at different amounts (Zn1−xFexO with x=0, 0.01, 0.03, and 0.05) using sol-gel and coprecipitation methods to evaluate their capacity as nanoadsorbents in the treatment of aqueous solutions contaminated with Congo Red.
2. Materials and Methods
2.1. Materials
For the synthesis of the nanostructures, the following reagents were employed: zinc acetate dihydrate ([Zn(CH3CO2)2.2(H2O)], 98-101%, Biopack, Buenos Aires, Argentina), iron(III) nitrate nonahydrate ([Fe(NO3)3.9H2O], 98-101%, Biopack, Buenos Aires, Argentina), citric acid monohydrate (C₆H₈O₇, ≥99%, Sigma Aldrich, Mumbai, India), ethylene glycol (C₂H₆O₂, ≥99%, Biopack, Buenos Aires, Argentina), sodium hydroxide (NaOH, ≥97%, Cicarelli, Santa Fe, Argentina), ammonium hydroxide (NH₄OH, 25-30%, Cicarelli, Santa Fe, Argentina) and absolute ethanol (C₂H₅OH, ≥99.5%, Biopack, Buenos Aires, Argentina). All reagents were stored in a cool, dry, and dark environment. Ultrapure deionized water obtained from the OSMOION water purification system (APEMA S.R.L.) was used in all experiments.
2.2. Synthesis of Zn1−xFexO Nanoparticles
ZnO nanoparticles doped with different Fe contents were synthesized in triplicate to obtain the Zn1−xFexO molar ratio (x = 0, 0.01, 0.03, and 0.05) by sol-gel and coprecipitation. In both methods, zinc acetate [Zn(CH3CO2)2.2(H2O)] was used as the metal precursor and ferric nitrate [Fe(NO3)3.9H2O] as the dopant.
For the sol-gel method, the procedure described in [24] was followed, with the addition of 2 ml of ethylene glycol as the surfactant. This involves the chelation of the precursor’s metal cations by surfactants in an aqueous environment. The solution was then allowed to form a yellow/orange gel, depending on the dopant concentration. Finally, the samples were dried at 120 °C for 24 hours in an oven and subsequently calcined at 400, 600, and 800 °C for 2 hours in a muffle furnace.
Coprecipitation synthesis was performed following the procedure reported by [25] and the same precursors as for the sol-gel method were used, with the addition of 2 ml of ethylene glycol. The nanoparticles were rinsed with a 50% solution of double-distilled water and 50% ethanol and filtered repeatedly up to 6 times. Finally, the drying and calcination methods were applied under the conditions described above.
2.3. Characterization
The crystalline nature of Zn1−xFexO nanoparticles was analyzed by X-ray diffraction (XRD). The XRD patterns of the nanopowder samples were obtained with a SmartLab® X-ray diffractometer (Cu Kα (λ = 1.5418 Å), 40 kV and 30 mA, 2θ from 0 to 80°, step of 0.05° and time of 1 s). All measurements were performed at ambient temperature. The average diameter of the crystalline domain of the nanostructures was estimated using the Debye-Scherrer model formula [26] according to the equation:
where D is the size of the coherently diffracting crystallite, λ is the incident X-ray wavelength (Cu Kα = 0.15406 nm), β is the full width at half maximum (FWHM) of the X-ray peaks in radians, θ is the diffraction angle (Bragg half angle) in radians, and C is the correction factor typically taken as ~0.9 for spherical particles.
The morphology of the nanoparticles was studied by scanning electron microscopy (SEM) using a ZEISS EVO 15 microscope (Carl Zeiss NTS GmbH, Jena, Germany). The free ImageJ software was used to process the obtained micrographs. Elemental analysis was performed by energy-dispersive X-ray spectroscopy (EDS), to verify the presence of Fe in the samples.
To determine the surface functional groups, Fourier transform infrared spectroscopy (FTIR) analyses were performed using a Shimadzu IRSpirit FT-IR spectrometer with QATR-S AT (Kyoto, Japan) in the region between 500 and 5000 cm−1.
2.4. Adsorption Assays
The removal percentage of CR (Table 1) by Zn1−xFexO nanoparticles was evaluated by triplicate in 50 ml volume under magnetic stirring at 300 rpm and a contact time of 60 minutes, with an adsorbate concentration of 10 ppm. This concentration was chosen considering that most industrial effluents contain between 5 and 30 ppm of CR [27]. The amount of adsorbent was kept at 0.05 g for the 50 ml reaction volume used, in an attempt to minimize the amount of adsorbent for a standard adsorbate concentration. The contact time was set at 60 minutes, since similar studies indicate that the adsorption percentage does not change after this time [28]. For the adsorption tests, the Zn1−xFexO samples obtained by sol-gel and coprecipitation, calcined at 600 °C, were used.
An aqueous solution of CR dye was prepared at a concentration of 1000 ppm. From this stock solution, serial dilutions were made to obtain the desired concentrations using distilled water. The exact dye concentration was determined using a UV-Visible spectrophotometer (Shimadzu UV-2550, Kyoto, Japan). The calibration curve for CR was obtained from various dilutions of the stock solution, using a concentration range between 1 and 20 ppm. The variation of the dye concentration versus the absorbance showed a linear behavior at λmax ≅ 500 nm, and the linear regression equation of the calibration curve showed a high correlation coefficient (R² = 0.993). The CR concentration in the solutions before and after adsorption was determined from the calibration curve equation.
From these obtained data, the removal percentage (or adsorption percentage, %A) was calculated using the following equation [29]:
where Co is the initial concentration of the adsorbate or dye (ppm), and Cf (ppm) is the concentration of the adsorbate in the solution after the adsorption process and the removal of the adsorbent by centrifugation (5000 rpm for 5 min).
Prior to the adsorption tests, the Zn1−xFexO nanoparticles samples used were homogenized in a mortar.
3. Results
3.1. X-Ray Diffraction (DRX) and Energy Dispersive Spectroscopy (EDS)
The phase purity and crystal structure of the Zn1−xFexO samples were examined by X-ray diffraction (Figure 1). XRD results revealed that all the obtained diffraction peaks could be indexed according to the hexagonal wurtzite system of ZnO, structure P63mc, as specified in JCPDS (Joint Committee of Powder Diffraction Studies of International Center) standard number 36–1451 [30]. The FWHM of the samples analyzed here progressively increases with increasing Fe content, indicating that the crystallinity of the samples decreases accordingly. A decrease in peak intensity with increasing Fe doping concentration is also observed (Figure 1).
The absence of other peaks allows excluding the presence of crystalline impurities, such as other zinc or iron phases [31]. The presence of the element Fe in the doped samples versus its absence in the pure ZnO samples was verified by EDS analysis (Figure 2).
It is observed that the average crystallite domain size of the nanostructures is 13.23 ± 0.19 nm for the sol–gel synthesis, and almost three times higher for the nanoparticles obtained by coprecipitation (34.93 ± 3.05 nm), considering in both cases the samples calcined at 400 °C and without Fe doping (Figure 3). It is important to note that the size of the crystalline domain depended on the synthesis method and was affected by the calcination temperature of the samples. The amount of dopant in this case was not significant in the change in size of the nanoparticles.
3.2. Fourier Transform Infrared Spectroscopy (FTIR)
Infrared spectroscopy results in a positive identification (qualitative analysis) of each type of material, and also allows the functional groups of the synthesized nanoparticles to be recognized. Figure 4 presents the results obtained by FTIR-ATR analysis of Zn1-xFexO nanoparticle samples synthesized using both methods, with different concentrations of doped Fe.
In both figures, the most important band is observed in the low frequency region, which is located below 600 cm-1 and corresponds to the antisymmetric vibration tension of the O-Zn-O bonds, which also confirms the wurtzite structure [32]. In the doped samples, this Zn–O stretching peak shifts slightly towards lower frequencies, indicating a strain in the crystal lattice due to the partial replacement of Zn²⁺ by Fe³⁺ [33]. The broad band in the region near ~3400 cm⁻¹ is attributed to the O–H stretching vibration of hydroxyl groups, and the band at ~1600 cm⁻¹ is associated with the bending of the H-O-H group of water [34].
3.3. Scanning Electron Microscopy (SEM)
The morphological characteristics of the o nanopowders were examined by scanning electron microscopy (SEM). Figure 5 shows comparative micrographs of Fe-doped and undoped ZnO nanoparticles synthesized by sol–gel and coprecipitation methods, after calcination at 600 °C.
In agreement with the XRD results, a marked difference in particle size is observed: the nanostructures synthesized by coprecipitation (Figure 5b) have dimensions approximately twice those of the particles obtained by sol–gel (Figure 5f). The undoped samples obtained by both methods do not show significant variations in their apparent morphology, exhibit a predominantly spherical morphology, sometimes elongated, with facets (Figures 5a, 5b, 5e and 5f). With increasing Fe doping, a trend toward the formation of sharper tips is observed. The Fe-doped samples (x=0.05) synthesized by coprecipitation (Figures 5c and 5d) present nanostructures with sharper ends compared to the undoped samples synthesized by the same method. Comparing these doped samples with those obtained by sol-gel, in both cases the increase in the percentage of doped Fe causes a morphology change toward structures with sharp, pointed ends. However, the nanoparticles synthesized by sol-gel have a more uniform and densely packed structure, with defined edges (Figures 5g, 5h and 5i). They present a mostly polyhedral and homogeneous morphology, with compact agglomeration.
Figure 6 shows the micrographs of Zn1−x FeₓO nanoparticles synthesized by coprecipitation, with different calcination temperatures. The change in nanostructure morphology with increasing calcination temperature is clearly demonstrated, with the samples calcined at higher temperatures exhibiting more rounded or less sharp tips (Figures 6e and 6f).
3.4. Adsorption Assays
Congo Red (CR) is an anionic dye, and its structure contains two (–N=N–) groups linked to aromatic rings, as well as two sulfonate groups (–SO₃⁻) attached to these rings (Table 1). In aqueous solution, these sulfonate groups are fully ionized to –SO₃⁻, giving the molecule a net negative charge, which causes CR to behave as a strong anionic dye with high affinity for positively charged surfaces.
The adsorption of CR at a concentration of 10 ppm by Zn1-xFexO nanoparticles with different dopant percentage was compared. Figure 7 shows the percentage of CR adsorption according to each synthesis method used to obtain the adsorbent. It can be observed that the nanoparticles synthesized by sol-gel clearly show a higher performance (%A greater than 80%) than those synthesized by coprecipitation. In this regard, the samples obtained by coprecipitation showed a maximum A% of less than 24%. Furthermore, it can be observed that increasing the percentage of Fe doped in the nanoparticles increases CR adsorption.
To elucidate the importance of Fe as a dopant in the adsorption of CR, adsorption experiments were carried out using Zn1−xFexO nanoparticles synthesized by the sol–gel method, with dopant concentrations in the range 0≤x≤0.05. Figure 8 shows that the adsorption percentage for undoped ZnO nanostructures exceeds 80%, whereas samples containing Fe in the crystal lattice (x=0.01, x=0.03, and x=0.05) exhibit an increase of approximately 10% in the adsorption efficiency.
The variation in the percentage of CR adsorption at 10 ppm concentration by Zn₁₋ₓFeₓO nanostructures with x=0 and x=0.05 in an amount of 0.05 g was also analyzed versus the increase in temperature. Figure 9 shows that the adsorption decreases with increasing temperature in ZnO nanostructures, this has been previously reported as an exothermic reaction [35]. It is important to note that under the same conditions, doped nanoparticles maintain high adsorption (>85%).
Figure 10 shows Zn1-xFexO nanoparticles before and after adsorption of 10 ppm of CR, after the adsorption tests the samples were dried at 80 °C for 24 hours. Micrographs of the samples prior to dye adsorption (Figures 10a, 10b and 10e) show particles with well-defined edges and granular distribution. In contrast, after adsorption of 10 ppm of CR (Figures 10c, 10d and 10f), the nanoparticles show an apparent increase in size, with less defined surfaces and smoothed edges, suggesting the presence of an organic layer coating the particles. Likewise, greater compaction and the appearance of amorphous material between the agglomerates are observed, attributable to the adsorbed dye.
Figure 11 shows the FTIR spectra for the 1% and 5% doped Zn1−xFexO samples, before and after CR adsorption, only in the region between 500 and 2000 cm-1. In the samples with adsorbed CR, new peaks or intensity increases appear in the region between 1000 and 1600 cm⁻¹, associated with the vibrations of the functional groups of the dye, such as C–N, C–C aromatic stretching (~1400–1600 cm⁻¹), N=N (~1500–1550 cm⁻¹) and –SO₃⁻ (~1180–1250 cm⁻¹) [36,37]. The presence of these bands confirms the adsorption of the dye on the surface of the nanoparticles.
4. Discussion
4.1. X-Ray Diffraction (DRX) and Energy Dispersive Spectroscopy (EDS)
X-ray diffraction (XRD) analysis provides essential information on the crystal structure, phase purity, and crystallite size of materials. The resulting samples are highly crystalline, as evidenced by the high peak intensity and smoothed baseline (Figure 1). The absence of additional phases may suggest that Fe has been successfully inserted into the ZnO crystal lattice over the entire concentration range analyzed in this work (0≤x≤0.05). The presence of the element Fe in the samples was confirmed by EDS (Figure 2).
As the calcination temperature increases, a tendency toward an increase in crystallite size is observed (Figure 3). At such high temperatures, grain boundary migration occurs, leading to the coalescence of small grains and the formation of larger ones. FWHM in an XRD pattern is related to the degree of disorder in the crystal arrangement of a material. The FWHM of the samples analyzed here progressively increases with increasing Fe content, indicating that the crystallinity of the samples decreases accordingly (Figure 1). Results from other authors suggest that doping leads to an increasing number of cation vacancies because of the substitution of Zn²⁺ by Fe³⁺ in the zinc oxide unit cell [38]. The increased disorder in the ZnO crystal structure can be attributed to the difference in the ionic radius of Zn²⁺ (0.74 Å) compared to that of Fe³⁺ (0.64 Å) [39].
4.2. Fourier Transform Infrared Spectroscopy (FTIR)
In the doped samples, this Zn–O stretching peak shifts slightly to lower frequencies, which is further evidence of successful doping. No new peaks appear, in agreement with the XRD analysis, since no new phases such as Fe oxides are present. The bands corresponding to water adsorbed on the surface are reduced, showing that the nanoparticles were practically dry. Also in both cases (sol-gel and coprecipitation), greater peak definition is observed particularly in the undoped samples (x=0). This is because a more ordered crystal lattice produces more defined vibrational modes, and consequently, sharper peaks [40].
Comparing both methods, it is observed that the FTIR spectra of the nanoparticles synthesized by coprecipitation show more intense O–H bands and a general broadening of the peaks with respect to those obtained by sol-gel, which shows a greater amount of hydroxyl groups and a greater degree of structural disorder. Several authors demonstrated that synthesis methods such as sol-gel allow obtaining greater crystallinity at similar calcination temperatures [41,42], which correlates with the more defined vibrational modes observed here in FTIR. In coprecipitation synthesis, the presence of a greater structural disorder generates broader or less defined bands.
4.3. Scanning Electron Microscopy (SEM)
The change in morphology with increasing Fe doping (Figure 5), including the appearance of edges or pointed shapes, is consistent with others authors [43]. This morphological transformation can be attributed to a progressive change in the preferential direction of crystal growth, observing a marked anisotropic growth along a primary axis derived from the increase in dopant concentrations. In the doped samples the nanoparticles are clustering together and even forming larger structures resembling prisms, ranging in size from 200 nm up to 1 µm (Figures 5g and 5h) particularly with the sol–gel method. This has already been reported by other authors [44,45], where it is shown that at higher Fe concentrations, the nanoparticles tend to form larger agglomerates, even under the same pH and ionic strength conditions, confirming that doping reduces the surface repulsion between particles. It may also be due to changes in morphology, which in turn influences their coalescence, or to changes in the surface charge of the nanostructures and/or slight magnetic interactions induced by the Fe doped in the ZnO crystal structure. In this sense, the nanoparticles can retain Fe³⁺/Fe²⁺ magnetic moments, which can partially align and form collective magnetic domains or clusters when they approach each other [46]. Several authors agree that the presence of Fe creates magnetic moments on the surface of the doped nanoparticles, which causes residual magnetic dipoles to exist even in the absence of an external field [47]. Doping is also likely to modify the isoelectric point or zeta potential of the particles. Near the isoelectric point, colloidal stability decreases. Doping can modify these parameters, reducing electrostatic repulsion and promoting particle-particle contacts [48].
Regarding the influence of calcination temperature on the morphology of the obtained nanoparticles, those calcined at higher temperatures exhibit greater agglomeration, as the nucleation and growth rate increases with calcination temperature. The fusion of grain boundaries results in larger particle sizes at higher temperatures (as observed in the XRD analysis). Likewise, a lower specific surface area has been observed at higher calcination temperatures [49].
4.4. Adsorption Assays
The CR adsorption results using zinc oxide nanoparticles obtained by sol-gel showed higher adsorption efficiency compared to those obtained by coprecipitation. This could be attributed to the smaller size of the nanoparticles synthesized by sol-gel, approximately on the order of 10 nm (Figure 3), which increases the specific surface area of the nanostructures and, therefore, the number of active sites available for dye adsorption. Furthermore, each synthesis method can generate nanoparticles with different surface characteristics, such as porosity, crystalline defects, or diverse functional groups, which significantly influence the interaction between the surface and the dye [50]. In this regard, the FTIR spectra of ZnO nanoparticles synthesized by both methods showed that the sol-gel method generates nanoparticles with a more homogeneous crystalline structure. This could influence adsorption and is possibly accompanied by pores and defects that favor the specific interaction between CR and the Fe-doped ZnO surface. In contrast, the coprecipitation method may have a lower effective surface area and difficulties for uniform adsorption. Previous studies show that treatments that increase crystalline order or surface stability can enhance the adsorption capacity of synthetic dyes [51].
On the other hand, although the addition of Fe as a dopant did not prevent the aggregation of the nanostructures as reported in certain studies, the percentage of dye adsorption was favored by the presence of Fe as a dopant in the ZnO crystal structure. Thus, a high percentage of RC dye adsorption could be obtained with a small amount of Fe-doped nanostructured zinc oxide. In this case, it could be inferred that the partial substitution of Zn²⁺ by Fe³⁺ alters the crystalline lattice and could generate structural defects and oxygen vacancies that act as preferential adsorption sites (with greater affinity towards molecules such as CR) [52].
As the reaction temperature increased, the percentage of adsorption was observed to decrease in the undoped samples of nanoparticles, reaching ~60% at 60 °C. However, the doped samples did not show a significant decrease in adsorption. It is possible that the adsorption of CR on undoped ZnO is mainly physical, with weak interactions that are affected by thermal changes since at higher temperatures, the adsorbed molecules acquire more kinetic energy and are easily desorbed, decreasing the adsorption percentage. The active sites generated by the substituted Fe³⁺ ion are likely more stable at elevated temperatures, allowing the nanomaterial to maintain high adsorption efficiency even when the system is heated. Previous work has supported the theory of enhanced stability and adsorption of transition metal-doped ZnO [53], enhancing adsorbent-adsorbate bond stability. Studies with Fe-containing materials indicate that Fe is an atom that can play an important role in strengthening the Van der Waals forces [54].
SEM micrographs of the samples before and after adsorption show changes such as an apparent increase in size and filler material between nanoparticles. This result is consistent with other studies evaluating the adsorption of organic dyes onto nanostructures [55,56,57]. Although these morphological changes are consistent with the partial coverage of the nanoparticles by organic dye molecules, due to the low electronic contrast of organic compounds in SEM, confirmation of the presence of the dye should rely on complementary techniques such as FTIR, as verified here (Figure 11).
5. Conclusions
The study demonstrates that synthesis conditions strongly influence the properties and performance of Zn₁₋ₓFeₓO nanoparticles, allowing near-complete Congo Red adsorption (~100%) with a very small amount of nanoadsorbent. Fe-doped ZnO shows improved adsorption performance and thermal stability, suggesting that Fe not only increases surface affinity but also maintains efficiency under varying conditions. These findings highlight the importance of optimizing the production of effective adsorbents and show that it is possible to develop nanoparticles specifically tailored for the efficient removal of organic dyes, providing a practical strategy for environmental remediation and sustainable water treatment.
Author Contributions
Conceptualization, Carla Y. Potiliski and Gustavo R. Kramer; methodology, Carla Y. Potiliski; validation, Gustavo R. Kramer, Pedro D. Zapata and Alicia E. Ares; formal analysis, Carla Y. Potiliski; investigation, Gustavo R. Kramer; resources, Alicia E. Ares; data curation, Florencia A. Bruera; writing—original draft preparation, Carla Y. Potiliski; writing—review and editing, Florencia A. Bruera and A. E. Ares; visualization, A. E. Ares; supervision, Alicia E. Ares; project administration, Alicia E. Ares. All authors have read and agreed to the published version of the manuscript.
Funding
This research received no external funding.
Conflicts of Interest
The authors declare no conflicts of interest.
References
- Wahab, R.; Mishra, A. Antibacterial activity of ZnO nanoparticles prepared via non-hydrolytic solution route. Appl. Microbiol. Biotechnol. 2010, 87, 1917–1925. [Google Scholar] [CrossRef]
- Srivastava, V.; Gusain, D. Synthesis, characterization and application of zinc oxide nanoparticles (n-ZnO). Ceram. Int. 2013, 39, 9803–9808. [Google Scholar] [CrossRef]
- Chen, J.-C.; Tang, C.-T. Preparation and application of granular ZnO/Al₂O₃ catalyst for the removal of hazardous trichloroethylene. J. Hazard. Mater. 2007, 142, 88–96. [Google Scholar] [CrossRef]
- Iandolo, B.; Hagfeldt, A. Zinc Oxide Nanostructures for Water Treatment: Synthesis, Properties and Applications. Crystals 2024, 14, 611. [Google Scholar] [CrossRef]
- Mahmood, N.B.; Saeed, F.R. Synthesis and characterization of zinc oxide nanoparticles via oxalate co-precipitation method. Mater. Lett. X 2022, 13, 100126. [Google Scholar] [CrossRef]
- Carofiglio, M.; Barui, S. Doped Zinc Oxide Nanoparticles: Synthesis, Characterization and Potential Use in Nanomedicine. Appl. Sci. 2020, 10, 5194. [Google Scholar] [CrossRef]
- Azam, A.; Khan, Z. M. Formation and characterization of ZnO nanopowder synthesized by sol–gel method. J. Alloys Compd. 2010, 495, 121–125. [Google Scholar] [CrossRef]
- Kołodziejczak-Radzimska, A.; Jesionowski, T. Zinc Oxide—From Synthesis to Application: A Review. Materials 2014, 7, 2833–2881. [Google Scholar] [CrossRef]
- Shafiee, P.; Reisi Nafchi, M. Sol-gel zinc oxide nanoparticles: advances in synthesis and applications. Synthesis and Sintering 2021, 1, 242–254. [Google Scholar] [CrossRef]
- Mondal, S.; Ayon, S. A. Comparative study of structural, optical, and photocatalytic properties of ZnO synthesized by chemical coprecipitation and modified sol–gel methods. Surf. Interface Anal. 2023, 55, 424–429. [Google Scholar] [CrossRef]
- Khan, I.; Khan, S. Temperature-dependent dielectric and magnetic properties of Mn-doped zinc oxide nanoparticles. Mater. Sci. Semicond. Process. 2014, 26, 516–526. [Google Scholar] [CrossRef]
- Droepenu, E.K.; Wee, B.S. Zinc Oxide Nanoparticles Synthesis Methods and its Effect on Morphology: A Review. Biointerface Research in Applied Chemistry 2022, 12, 4261–4292. [Google Scholar] [CrossRef]
- George, S.; Pokhrel, S. Use of a Rapid Cytotoxicity Screening Approach To Engineer a Safer Zinc Oxide Nanoparticle for Nanomedicine. ACS Nano 2010, 4, 15–29. [Google Scholar] [CrossRef]
- Gordon, T.; Perlstein, B. Synthesis and characterization of zinc/iron oxide composite nanoparticles and their antibacterial properties. Colloids Surf. A Physicochem. Eng. Asp. 2011, 374, 1–8. [Google Scholar] [CrossRef]
- Beltrán, J. J.; Barrero, C. A. Understanding the role of iron in the magnetism of Fe doped ZnO nanoparticles. Phys. Chem. Chem. Phys. 2015, 17, 15284–15296. [Google Scholar] [CrossRef]
- Mahato, T.H.; Prasad, G.K. Nanocrystalline zinc oxide for the decontamination of sarin. J. Hazard. Mater. 2009, 165, 928–932. [Google Scholar] [CrossRef] [PubMed]
- Al-Arjan, W.S. Zinc Oxide Nanoparticles and Their Application in Adsorption of Toxic Dye from Aqueous Solution. Polymers 2022, 14, 3086. [Google Scholar] [CrossRef]
- Díaz, A.B.; Blandino, A. Modelling of different enzyme productions by solid-state fermentation on several agro-industrial residues. Appl. Microbiol. Biotechnol. 2016, 100, 9555–9566. [Google Scholar] [CrossRef]
- Attallah, M.F.; Ahmed, I.M. Treatment of industrial wastewater containing Congo Red and Naphthol Green B using low-cost adsorbent. Environ. Sci. Pollut. Res. 2013, 20, 1106–1116. [Google Scholar] [CrossRef]
- Gharbani, P.; Tabatabaii, S.M. Removal of Congo red from textile wastewater by ozonation. Int. J. Environ. Sci. Technol. 2008, 5, 495–500. [Google Scholar] [CrossRef]
- Attallah, M.F.; Ahmed, I.M. Treatment of industrial wastewater containing Congo Red and Naphthol Green B using low-cost adsorbent. Environ. Sci. Pollut. Res. 2013, 20, 1106–1116. [Google Scholar] [CrossRef]
- Labille, J.; Brant, J. Stability of nanoparticles in water. Nanomed. 2010, 5, 985–998. [Google Scholar] [CrossRef]
- Sachin; Pramanik, B. K.; Singh, N. Fast and Effective Removal of Congo Red by Doped ZnO Nanoparticles. Nanomaterials 2023, 13, 566. [Google Scholar] [CrossRef]
- Samanta, A.; Chattopadhyay, S. Structural, optical and magnetic properties of Fe-doped ZnO nanoparticles. Mater. Chem. Phys. 2020, 239, 122180. [Google Scholar] [CrossRef]
- Kanchana, S.; Chithra, M.J. Violet emission from Fe doped ZnO nanoparticles synthesized by precipitation method. J. Lumin. 2016, 176, 6–14. [Google Scholar] [CrossRef]
- Sarkar, S.; Sarkar, R. Synthesis, characterization and tribological study of zinc oxide nanoparticles. Mater. Today: Proc. 2021, 44, 3606–3612. [Google Scholar] [CrossRef]
- Liu, J.; Wang, N. Adsorption of Congo red dye on FeₓCo₃₋ₓO₄ nanoparticles. J. Environ. Manage. 2019, 238, 473–483. [Google Scholar] [CrossRef] [PubMed]
- Şişmanoğlu, T.; Pozan, G.S. Adsorption of Congo red from aqueous solution using various TiO₂ nanoparticles. Desal. Water Treat. 2016, 57, 13318–13333. [Google Scholar] [CrossRef]
- Priyadarshini, B.; Patra, T. An efficient and comparative adsorption of Congo Red and Trypan Blue dyes on MgO nanoparticles: Kinetics, thermodynamics and isotherm studies. J. Magnesium Alloys 2021, 9, 478–488. [Google Scholar] [CrossRef]
- Wahab, R.; Mishra, A. Antibacterial activity of ZnO nanoparticles prepared via non-hydrolytic solution route. Appl. Microbiol. Biotechnol. 2010, 87, 1917–1925. [Google Scholar] [CrossRef]
- Swapna, P.; Venkatramana Reddy, S. Structural, optical & magnetic properties of (Fe, Al) co-doped zinc oxide nanoparticles. Nanoscale Reports 2019, 2, 3–16. [Google Scholar] [CrossRef]
- Sarkar, S.; Sarkar, R. Synthesis, characterization and tribological study of zinc oxide nanoparticles. Mater. Today: Proc. 2021, 44, 3606–3612. [Google Scholar] [CrossRef]
- Mouzaia, F.; Djouadi, D. Particularities of pure and Al-doped ZnO nanostructures aerogels elaborated in supercritical isopropanol. Arab J. Basic Appl. Sci. 2020, 27, 423–430. [Google Scholar] [CrossRef]
- Faramawy, A.M.; Agami, W.R. Tailoring the preparation, microstructure, FTIR, optical properties and photocatalysis of (Fe/Co) co-doped ZnO nanoparticles (Zn₀.₉FeₓCo₀.₁₋ₓO). Ceramics 2025, 8, 2. [Google Scholar] [CrossRef]
- Sachin; Pramanik, B. K.; Singh, N. Fast and effective removal of Congo red by doped ZnO nanoparticles. Nanomaterials 2023, 13, 566. [Google Scholar] [CrossRef]
- Huang, Y.; Yin, W. Efficient removal of Congo red, methylene blue and Pb(II) by hydrochar–MgAlLDH nanocomposite: Synthesis, performance and mechanism. Nanomaterials 2023, 13, 1145. [Google Scholar] [CrossRef]
- Hou, F.; Wang, D. Enhanced adsorption of Congo red using chitin suspension after sonoenzymolysis. Ultrason. Sonochem. 2020, 70, 105327. [Google Scholar] [CrossRef]
- Giuli, G.; Eisenmann, T. Structural and Electrochemical Characterization of Zn₁₋ₓFeₓO—Effect of Aliovalent Doping on the Li⁺ Storage Mechanism. Materials 2018, 11, 49. [Google Scholar] [CrossRef]
- Wu, X.; Wei, Z. Optical and magnetic properties of Fe-doped ZnO nanoparticles obtained by hydrothermal synthesis. J. Nanomater. 2014, 792102. [Google Scholar] [CrossRef]
- Ellerbrock, R.H.; Stein, M. Comparing silicon mineral species of different crystallinity using Fourier transform infrared spectroscopy. Front. Environ. Chem. 2024, 5, 1462678. [Google Scholar] [CrossRef]
- Irede, E.L.; Awoyemi, R.F. Cutting-edge developments in zinc oxide nanoparticles: synthesis and applications for enhanced antimicrobial and UV protection in healthcare solutions. RSC Adv. 2024, 14, 20992–21034. [Google Scholar] [CrossRef]
- Zahra, S.; Bukhari, H. Synthesis of nanosize zinc oxide through aqueous sol-gel route in polyol medium. BMC Chem. 2022, 16, 104. [Google Scholar] [CrossRef]
- Sahai, A.; Kumar, Y. Doping concentration driven morphological evolution of Fe-doped ZnO nanostructures. J. Appl. Phys. 2014, 116, 164315. [Google Scholar] [CrossRef]
- Chavan, K. B.; Mohite, S. V. Studies on effect of Fe doping on ZnO nanoparticles microstructural features using x-ray diffraction technique. Phys. Scr. 2025, 100, 065904. [Google Scholar] [CrossRef]
- Abd-Elkader, O. H.; Nasrallah, M. Biosynthesis, Optical and Magnetic Properties of Fe-Doped ZnO/C Nanoparticles. Surfaces 2023, 6, 410–429. [Google Scholar] [CrossRef]
- Ramos, J. E.; Montero-Muñoz, M. Evidence of a cluster glass-like behavior in Fe-doped ZnO nanoparticles. J. Appl. Phys. 2014, 115, 17E123. [Google Scholar] [CrossRef]
- Lokesha, H.S.; Mohanty, P. Structure, optical and magnetic properties of Fe-doped, Fe + Cr co-doped ZnO nanoparticles. arXiv arXiv:2111.07266, 2021. [CrossRef]
- Kosmulski, M. The pH dependent surface charging and points of zero charge. IX. Update. Adv. Colloid Interface Sci. 2021, 296, 102519. [Google Scholar] [CrossRef] [PubMed]
- Schelonka, D.; Tolasz, J. Doping of Zinc Oxide with Selected First Row Transition Metals for Photocatalytic Applications. Photochem. Photobiol. 2015, 91, 1071–1077. [Google Scholar] [CrossRef]
- Baig, N.; Kammakakam, I. Nanomaterials: a review of synthesis methods, properties, recent progress, and challenges. Mater. Adv. 2021, 2, 1821–1871. [Google Scholar] [CrossRef]
- Hussein, S. A.; Taha, G. M. Three different methods for ZnO-RGO nanocomposite synthesis and its adsorption capacity for methylene blue dye removal in a comparative study. BMC Chem. 2025, 19, 18. [Google Scholar] [CrossRef] [PubMed]
- Rao, Y. B. S.; Parajuli, D. Effect of Fe-doped and capping agent – Structural, optical, luminescence, and antibacterial activity of ZnO nanoparticles. Chem. Phys. Impact 2023, 7, 100270. [Google Scholar] [CrossRef]
- Tang, H.; Duan, Y. Adsorption and sensing performances of transition metal doped ZnO monolayer for CO and NO: A DFT study. SSRN 2024, 26, 4958262. [Google Scholar] [CrossRef]
- Muedi, K.L.; Masindi, V. Effective adsorption of Congo Red from aqueous solution using Fe/Al di-metal nanostructured composite synthesised from Fe(III) and Al(III) recovered from real acid mine drainage. Nanomaterials 2022, 12, 776. [Google Scholar] [CrossRef]
- Bekele, E.A.; Korsa, H.A. Electrolytic synthesis of γ-Al₂O₃ nanoparticle from aluminum scrap for enhanced methylene blue adsorption: experimental and RSM modeling. Sci. Rep. 2024, 14, 16957. [Google Scholar] [CrossRef]
- Majani, S.S.; Manoj; Lavanya, M. Nano-catalytic behavior of CeO₂ nanoparticles in dye adsorption: Synthesis through bio-combustion and assessment of UV-light-driven photo-adsorption of indigo carmine dye. Heliyon 2024, 10, e35505. [Google Scholar] [CrossRef]
- Şişmanoğlu, T.; Pozan, G.S. Adsorption of Congo Red from aqueous solution using various TiO₂ nanoparticles. Desalination Water Treat. 2016, 57, 13318–13333. [Google Scholar] [CrossRef]
Figure 1.
X-ray diffractogram for sol-gel and coprecipitation Zn1−xFexO samples with x=0 and x=0.05.
Figure 1.
X-ray diffractogram for sol-gel and coprecipitation Zn1−xFexO samples with x=0 and x=0.05.
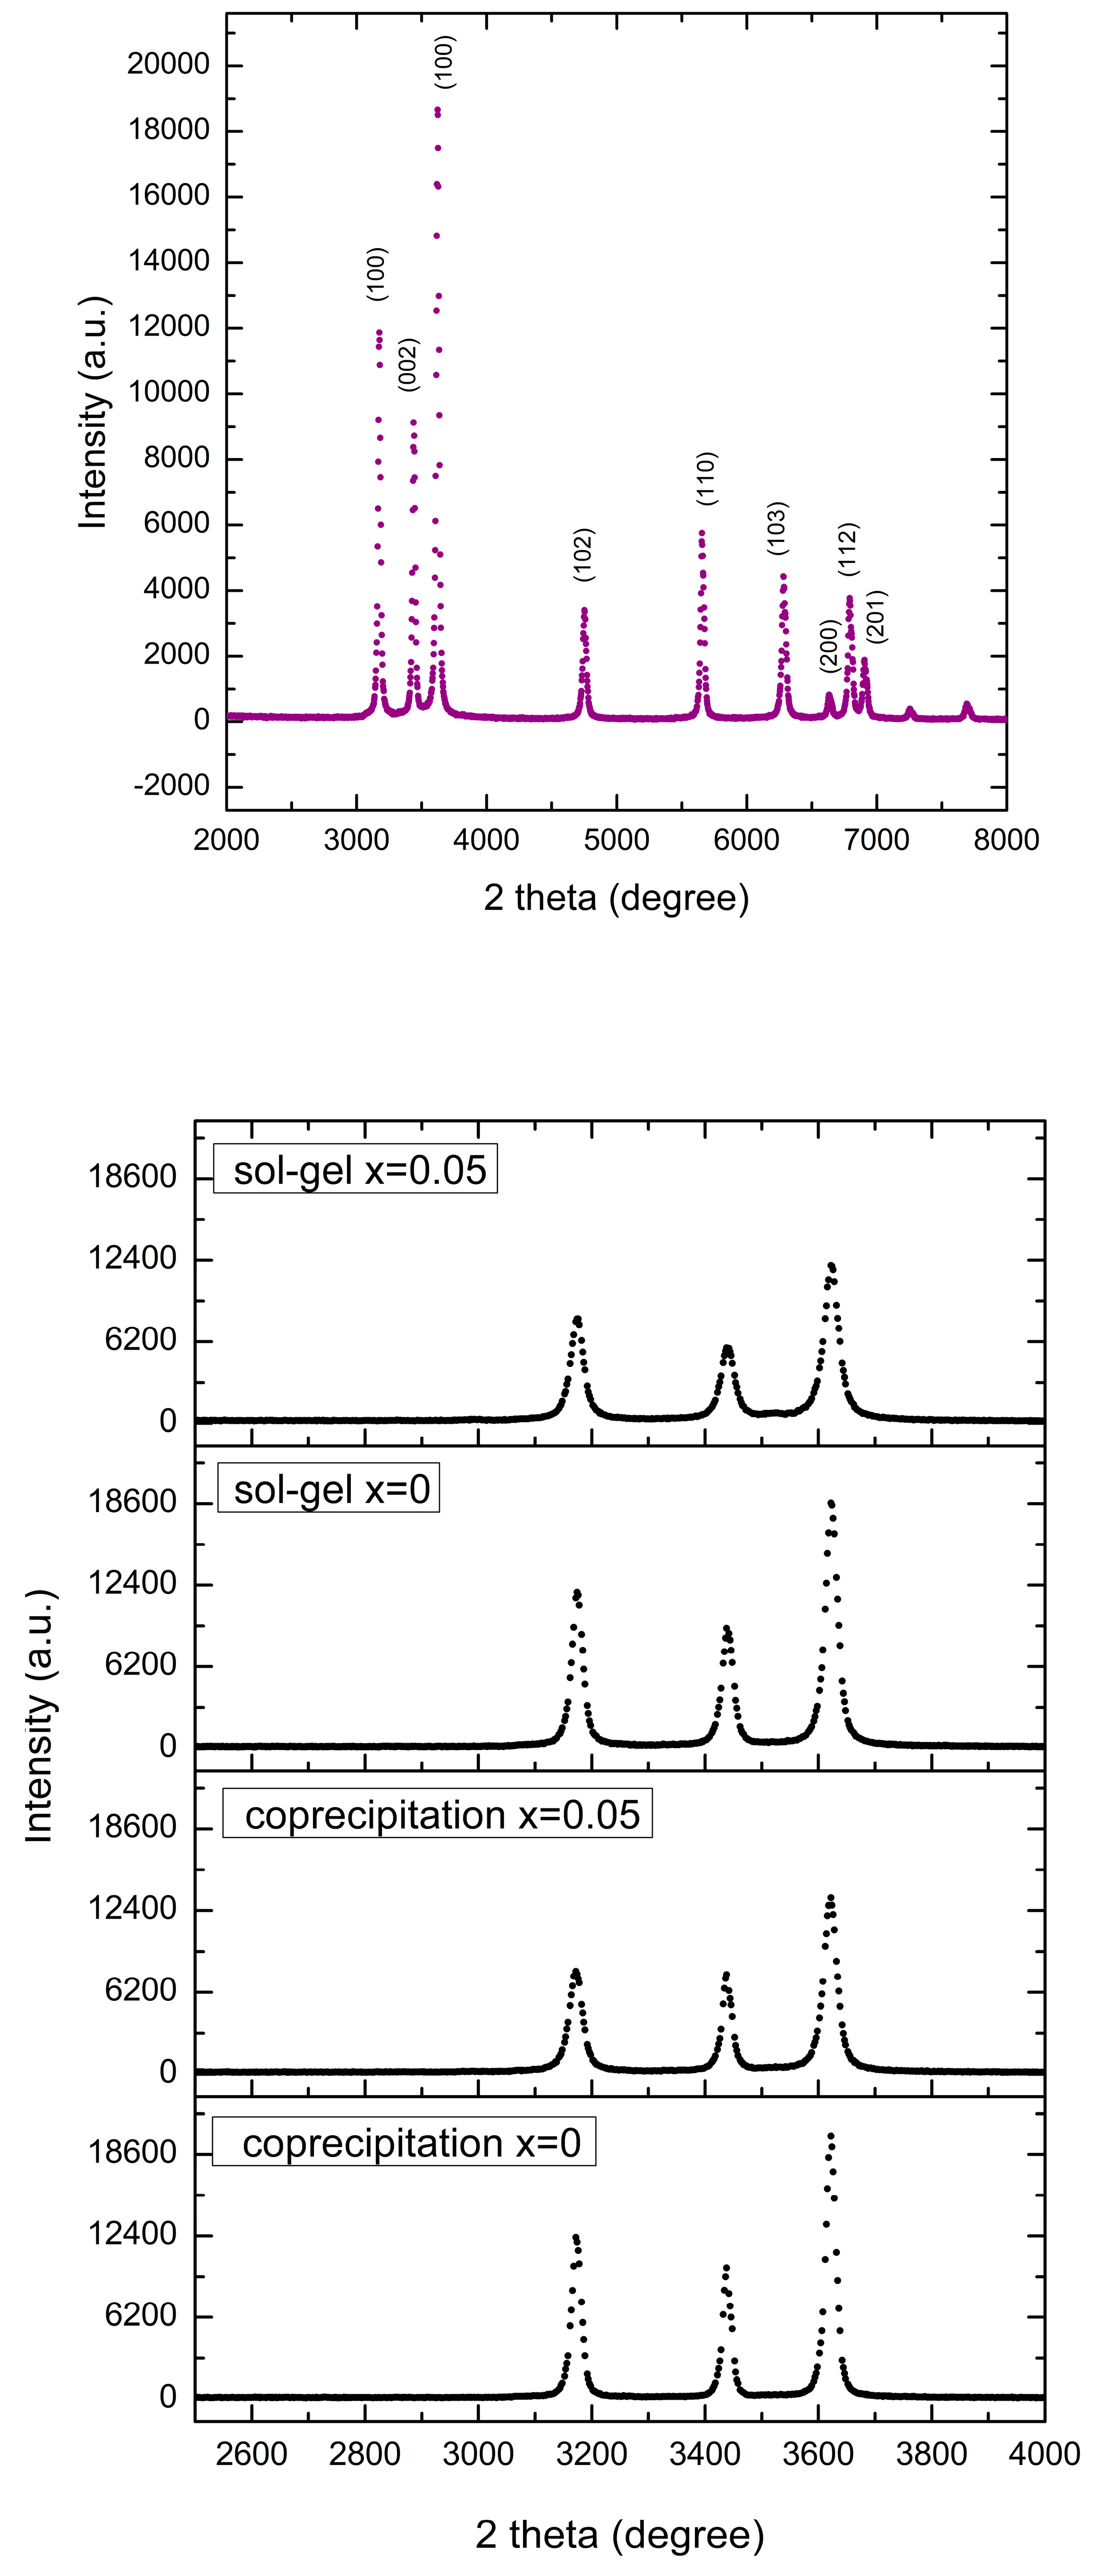
Figure 2.
Energy Dispersive Spectroscopy (EDS) spectrum for samples a) Zn1−xFexO with x=0 and b) x=0.03.
Figure 2.
Energy Dispersive Spectroscopy (EDS) spectrum for samples a) Zn1−xFexO with x=0 and b) x=0.03.
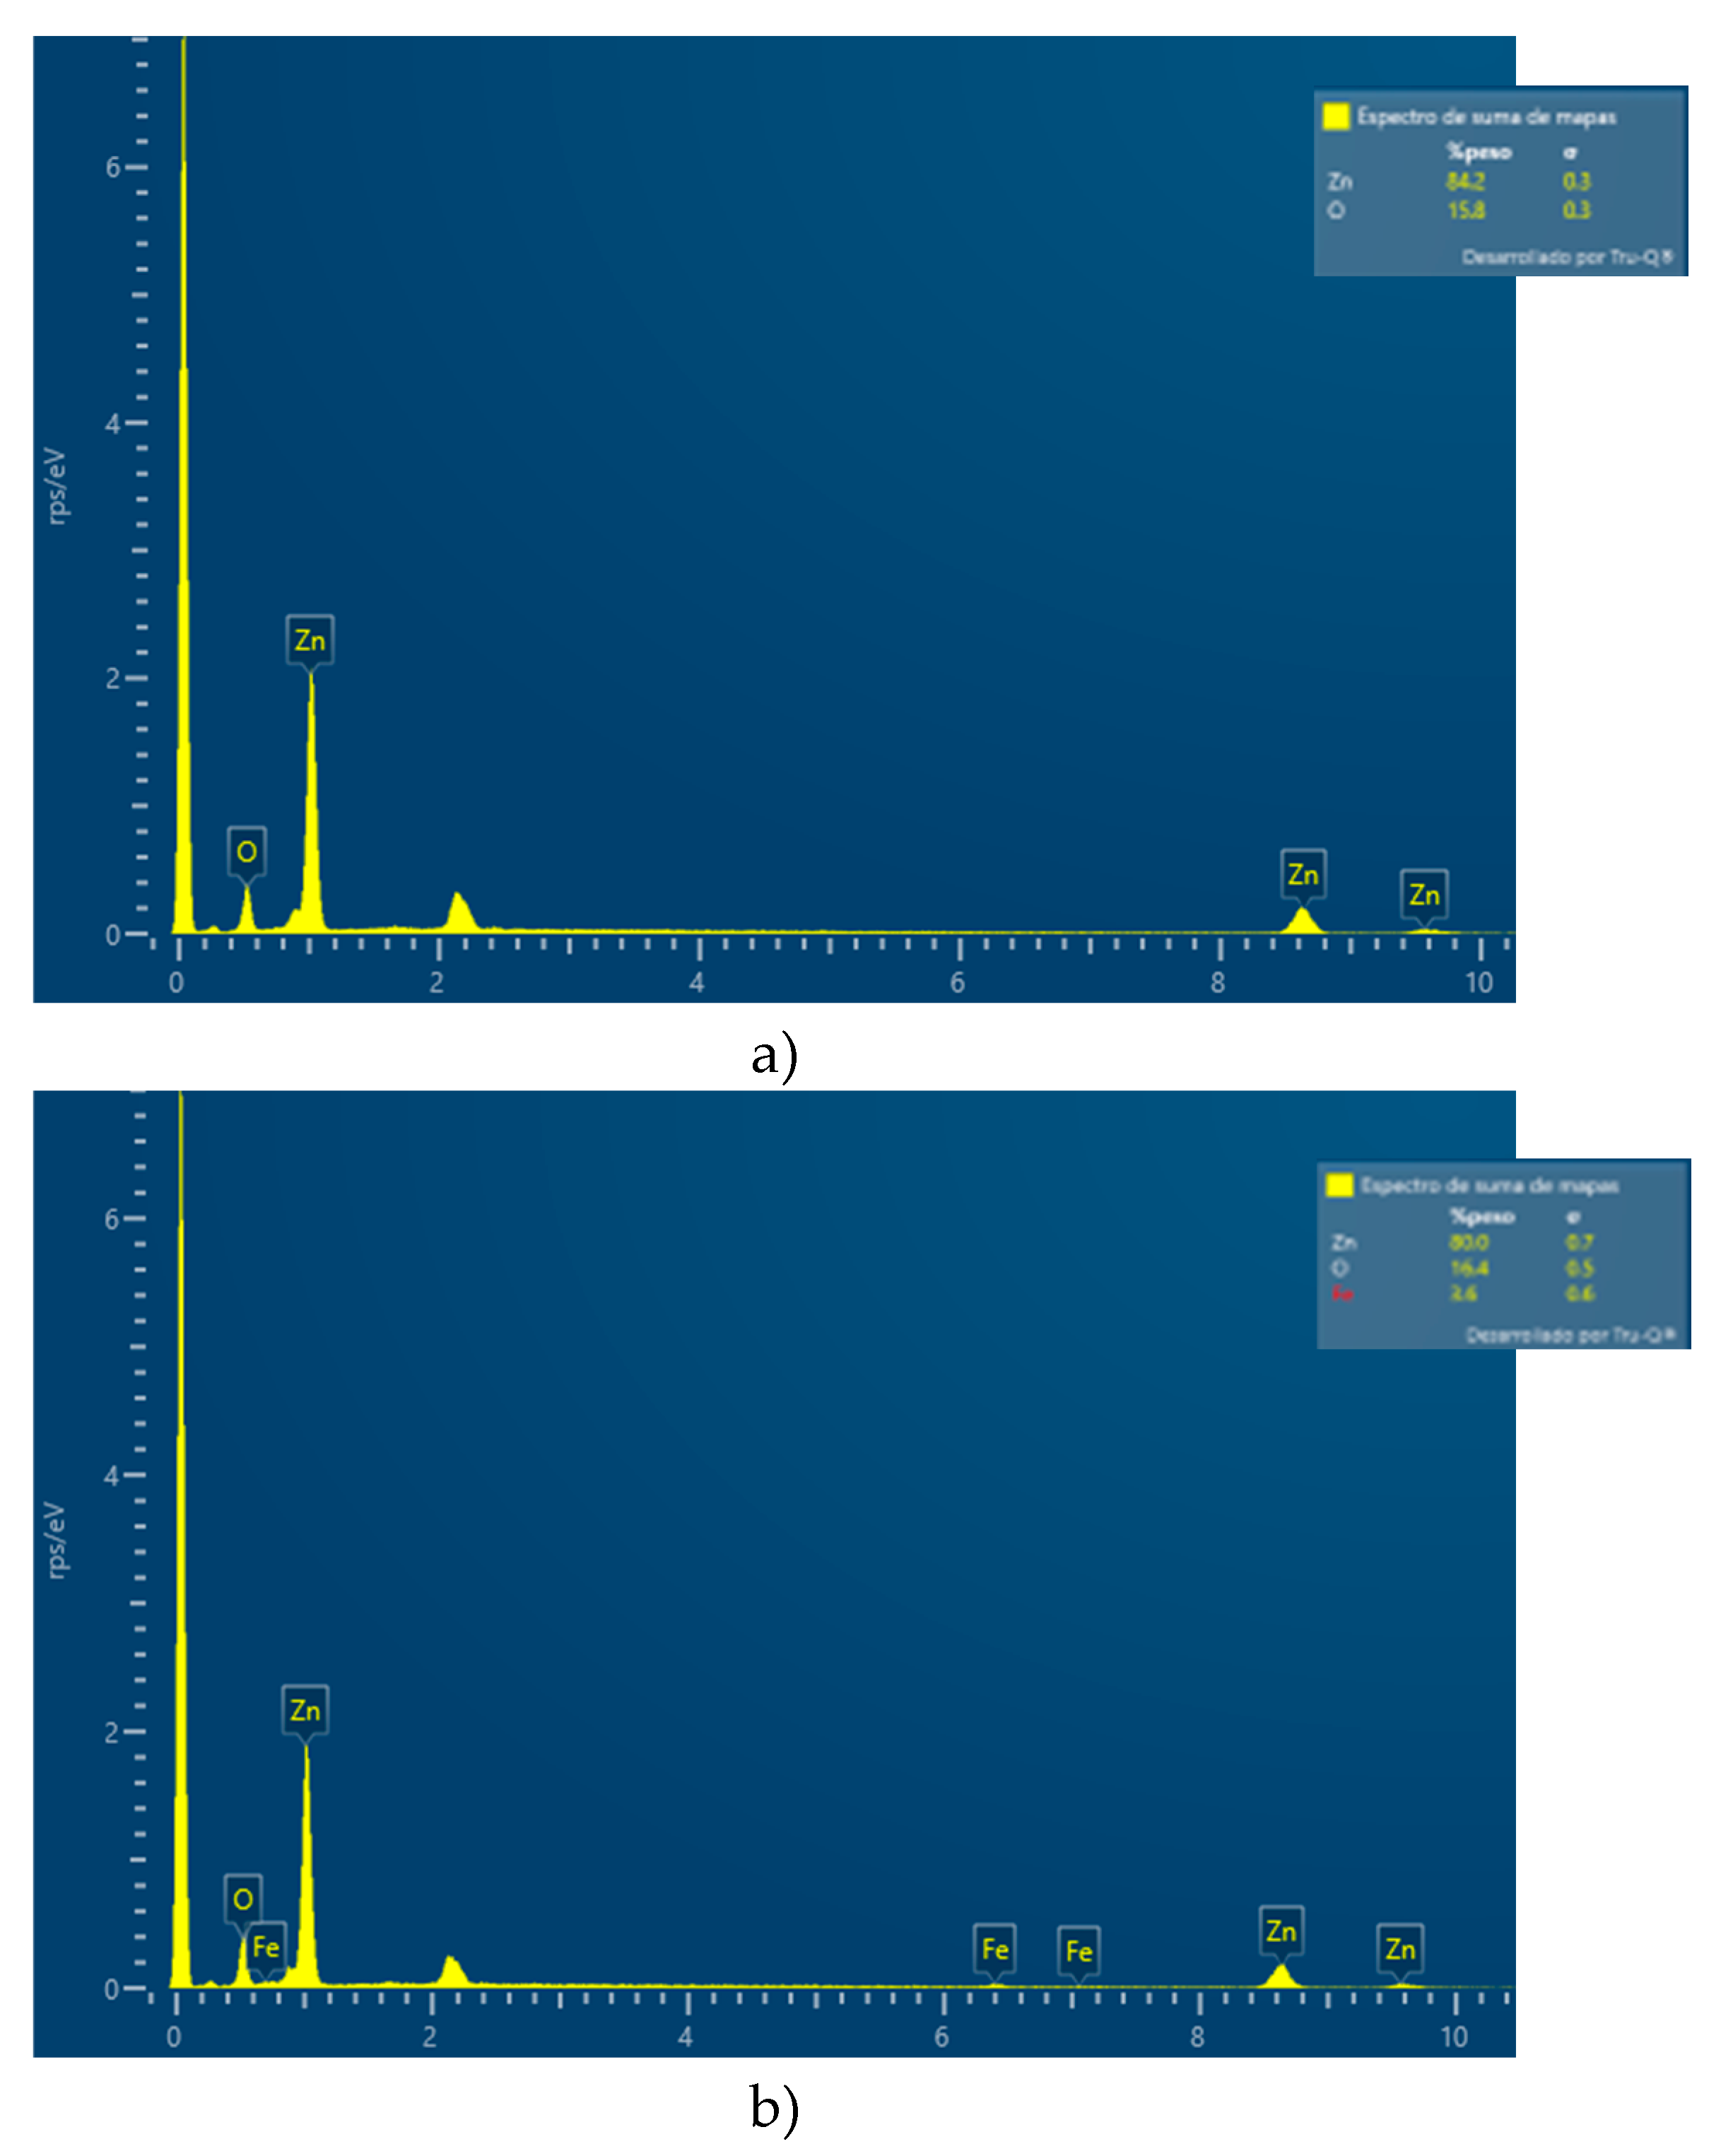
Figure 3.
Size of Zn1−xFexO nanoparticles synthesized by sol-gel (a) and coprecipitation (b) as a function of the amount of dopant and the calcination temperature.
Figure 3.
Size of Zn1−xFexO nanoparticles synthesized by sol-gel (a) and coprecipitation (b) as a function of the amount of dopant and the calcination temperature.
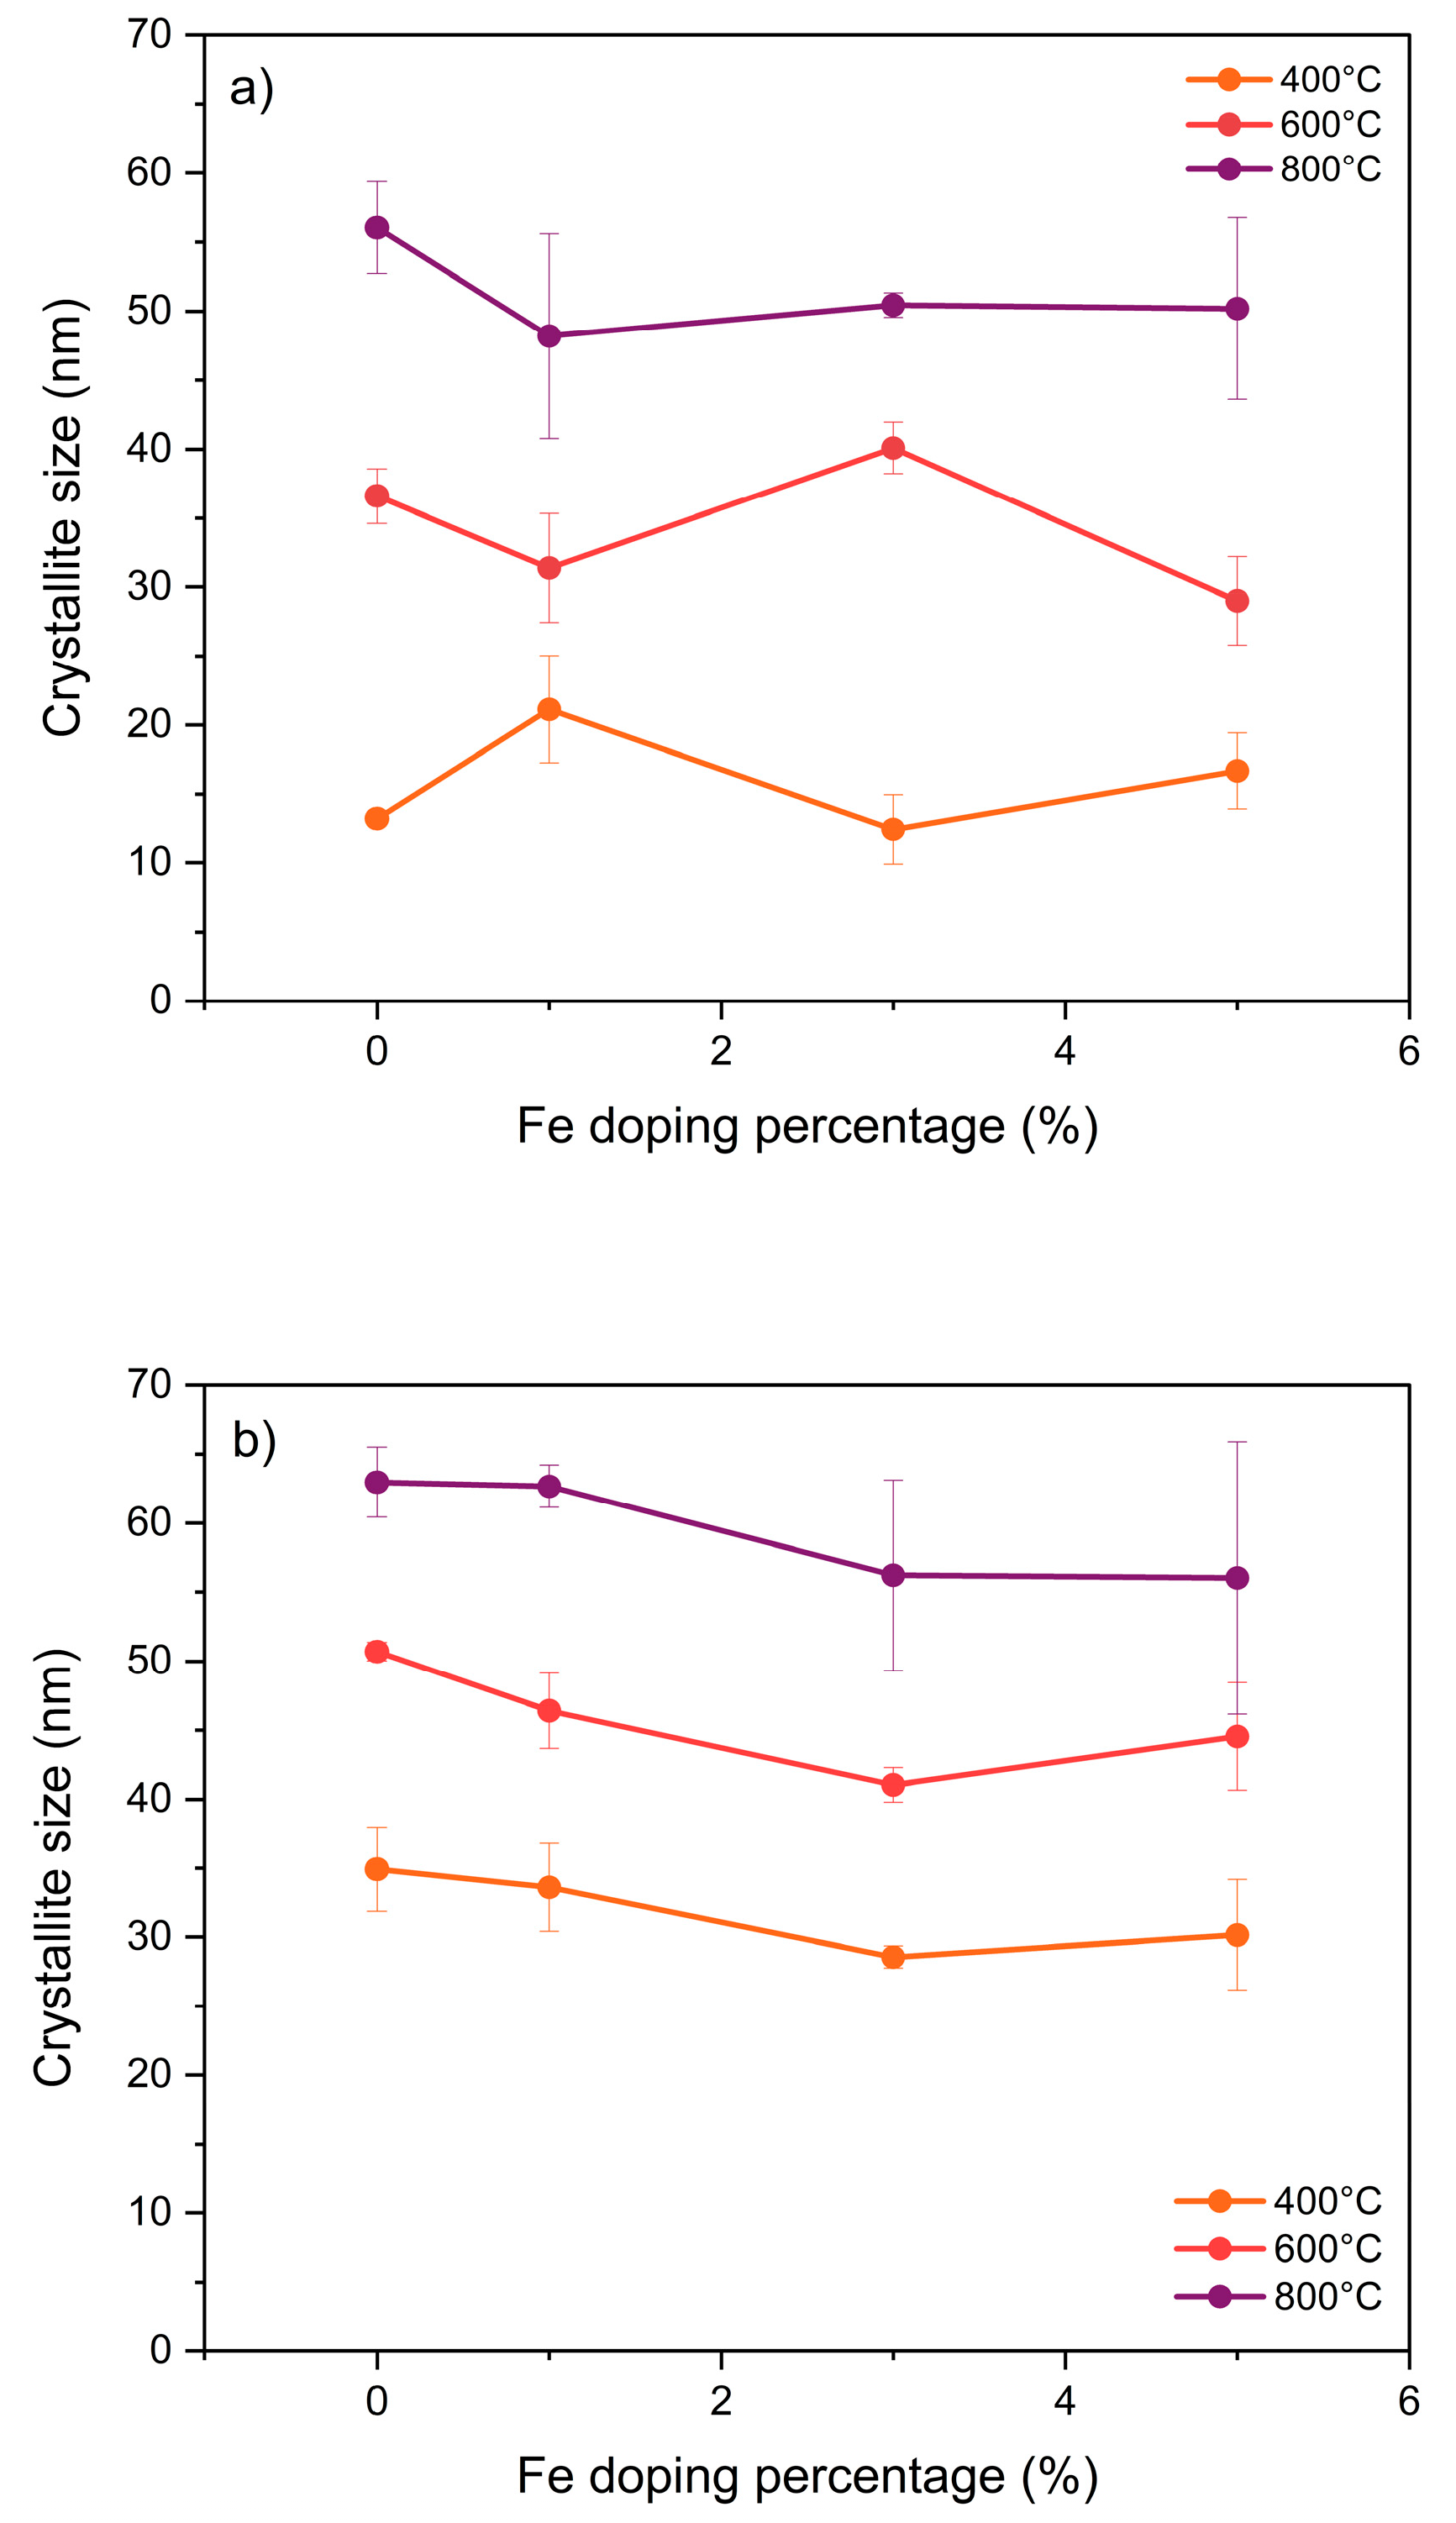
Figure 4.
Fourier Transform Infrared Spectroscopy (FTIR) spectrum of Zn1−xFexO nanoparticles obtained by a) sol-gel and b) coprecipitation, with variable amount of doping Fe.
Figure 4.
Fourier Transform Infrared Spectroscopy (FTIR) spectrum of Zn1−xFexO nanoparticles obtained by a) sol-gel and b) coprecipitation, with variable amount of doping Fe.
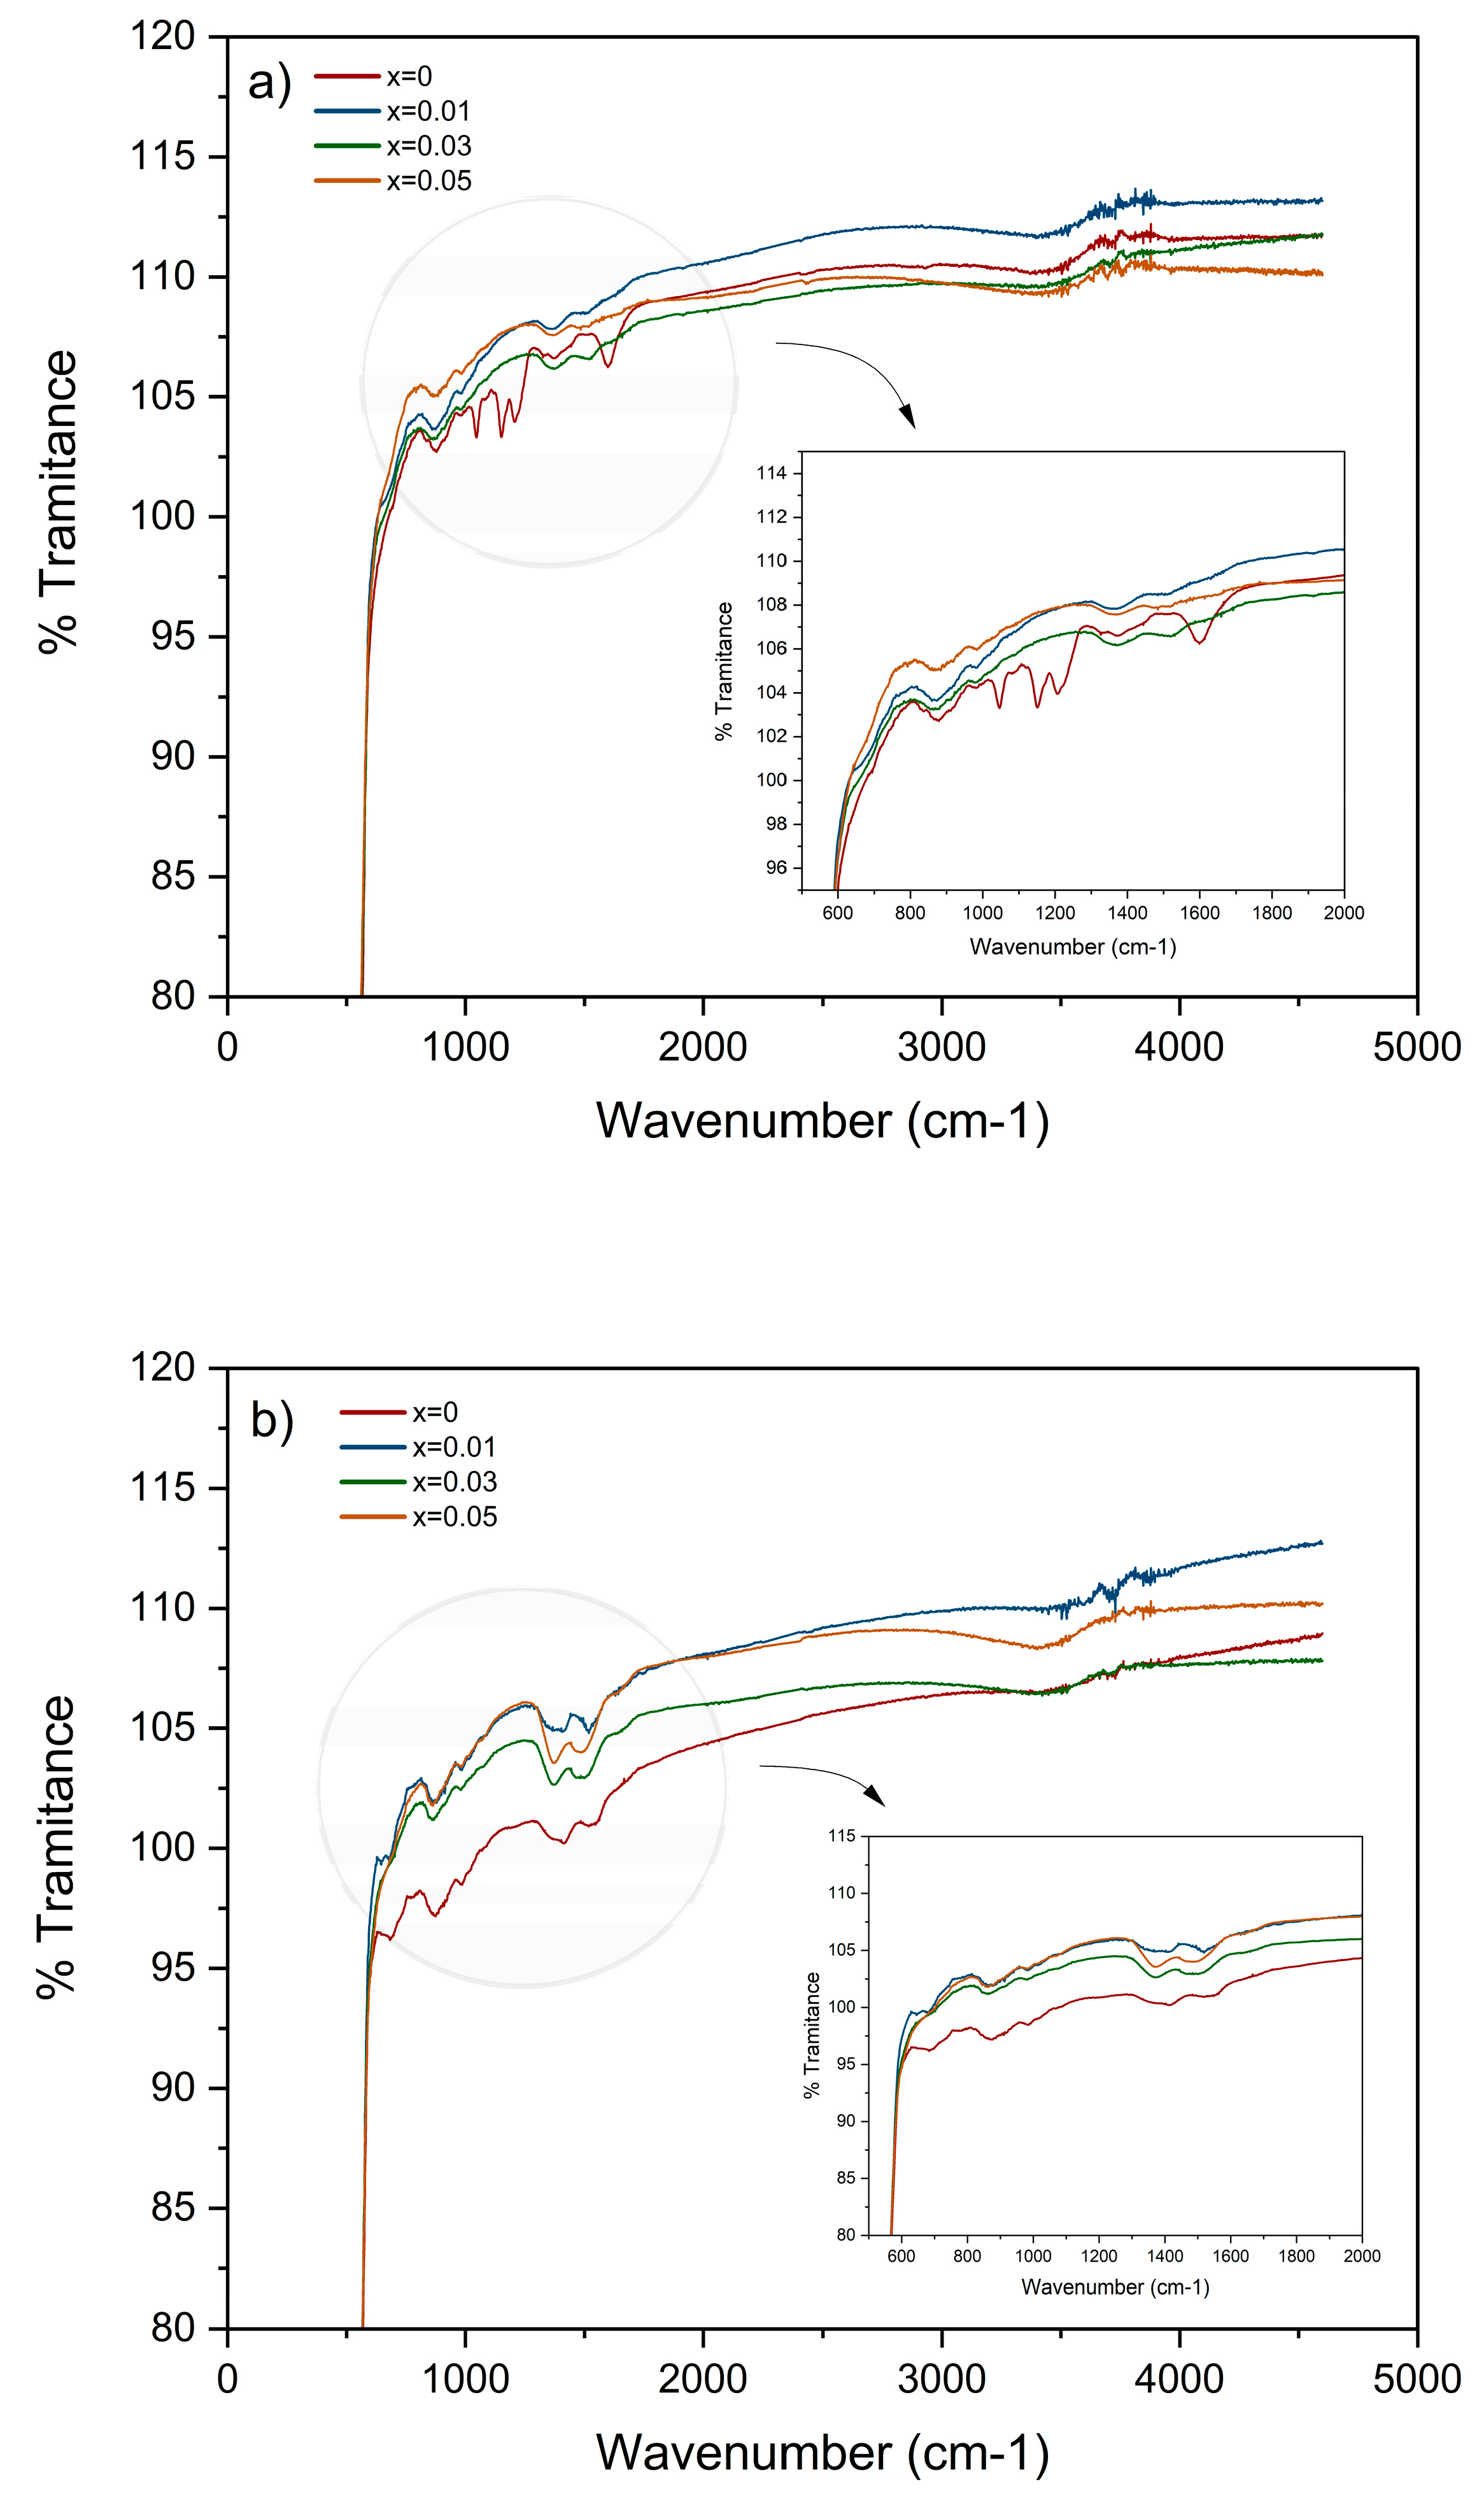
Figure 5.
Scanning Electron Microscopy (SEM) micrographs of Zn1−xFexO nanoparticles obtained by methods a) and b) coprecipitation with x=0, c) and d) coprecipitation with x=0.05, e) and f) sol-gel with x=0, and g), h) and i) sol-gel with x=0.05.
Figure 5.
Scanning Electron Microscopy (SEM) micrographs of Zn1−xFexO nanoparticles obtained by methods a) and b) coprecipitation with x=0, c) and d) coprecipitation with x=0.05, e) and f) sol-gel with x=0, and g), h) and i) sol-gel with x=0.05.
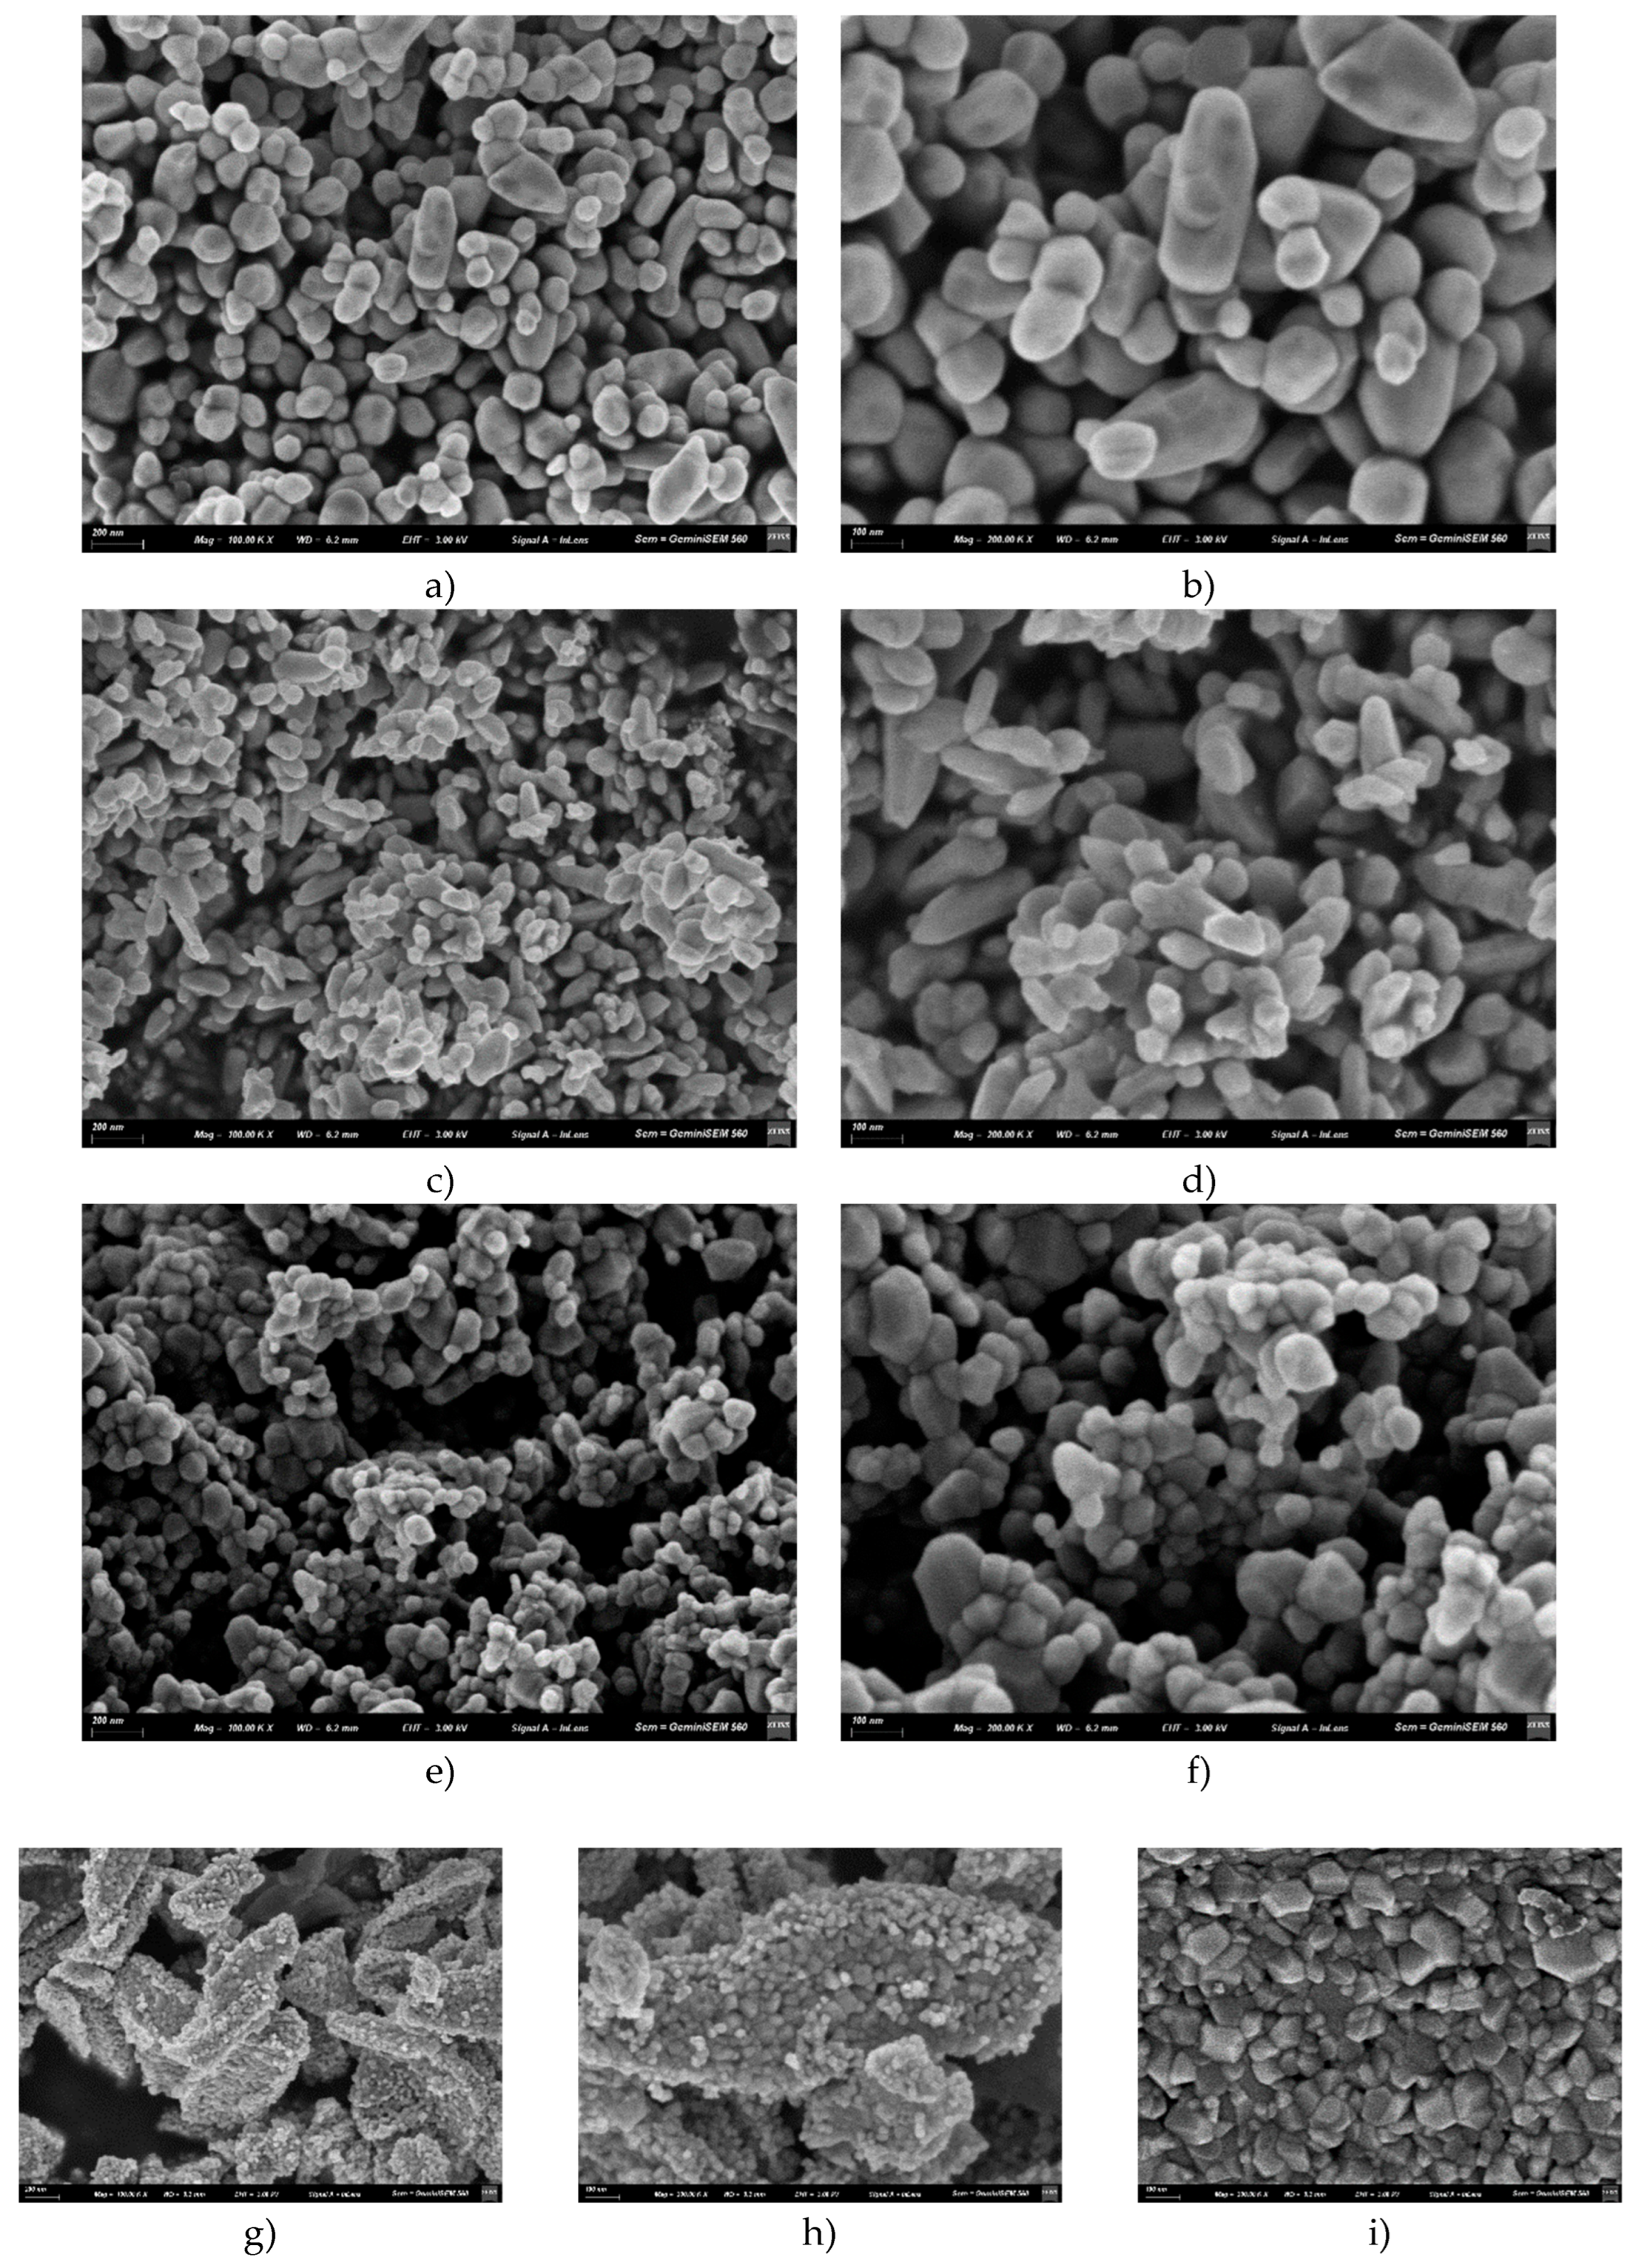
Figure 6.
Scanning Electron Microscopy (SEM) micrographs of Zn1−xFexO nanoparticles with x=0.05 obtained by coprecipitation and calcination at a) and b) 400 °C and c), d) 600 °C e) and f) 800 °C.
Figure 6.
Scanning Electron Microscopy (SEM) micrographs of Zn1−xFexO nanoparticles with x=0.05 obtained by coprecipitation and calcination at a) and b) 400 °C and c), d) 600 °C e) and f) 800 °C.
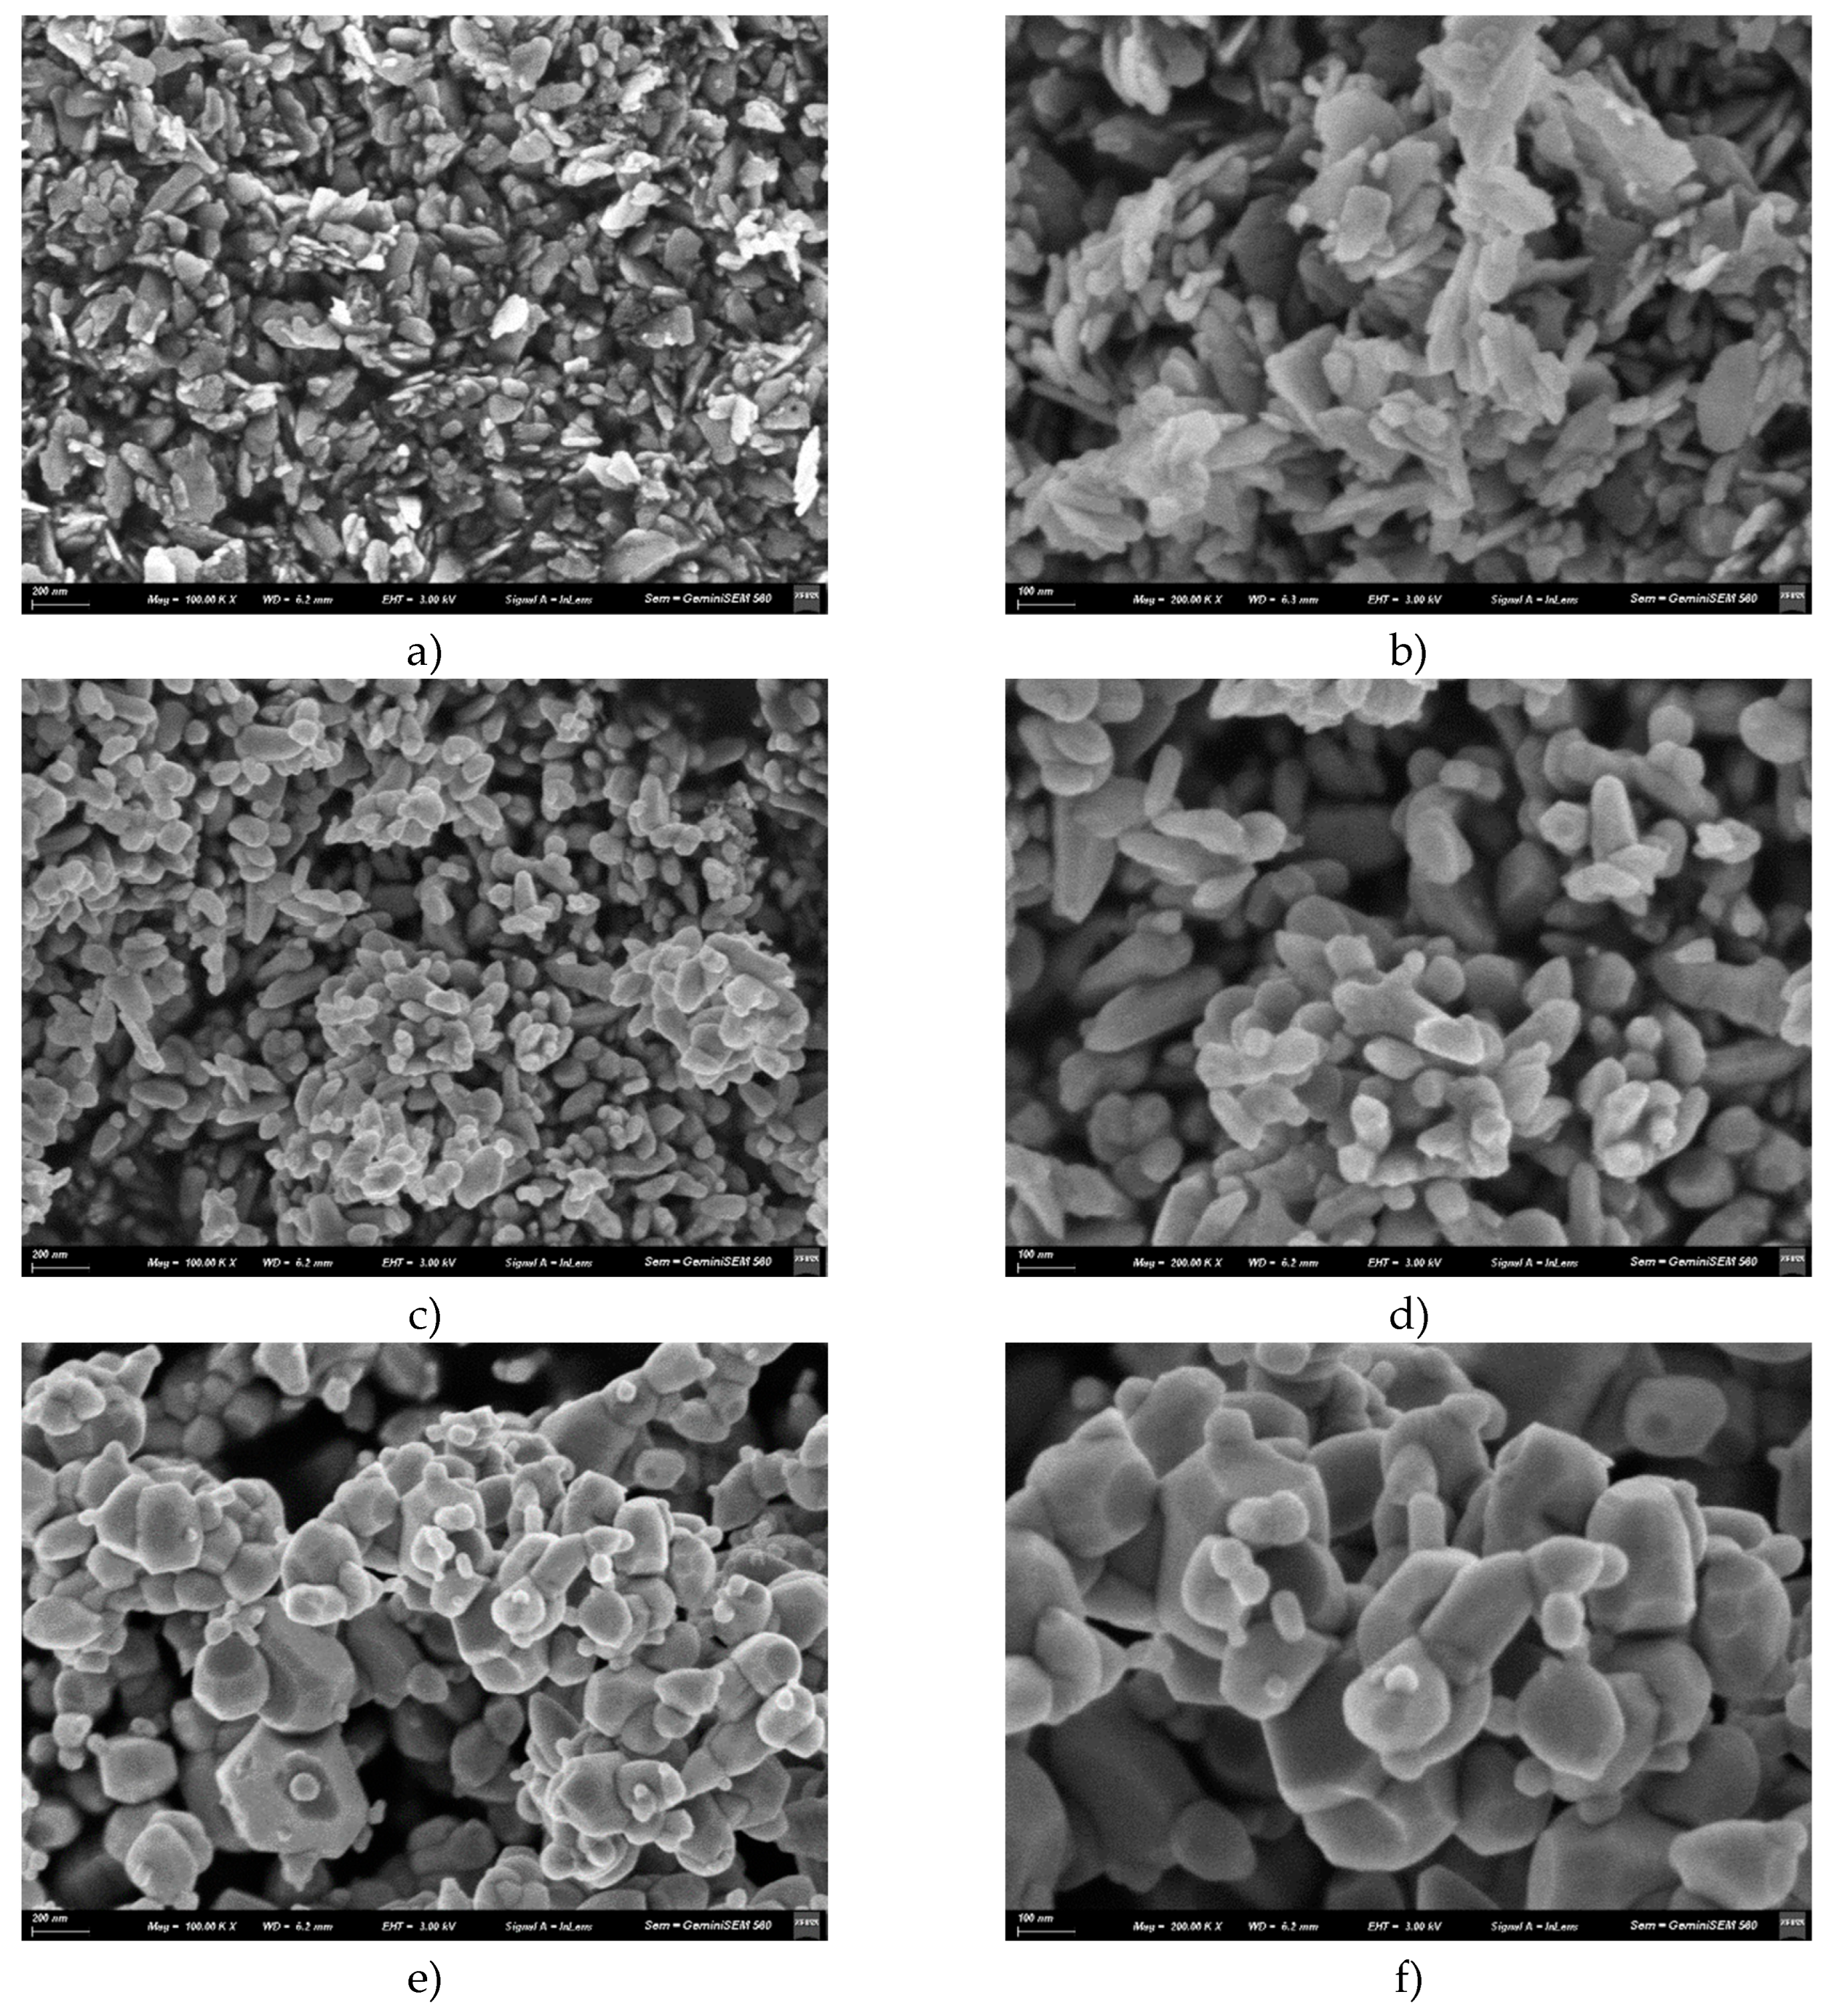
Figure 7.
Congo Red adsorption percentage according to each synthesis method used to obtain the adsorbent samples, with varying Fe doping percentage.
Figure 7.
Congo Red adsorption percentage according to each synthesis method used to obtain the adsorbent samples, with varying Fe doping percentage.
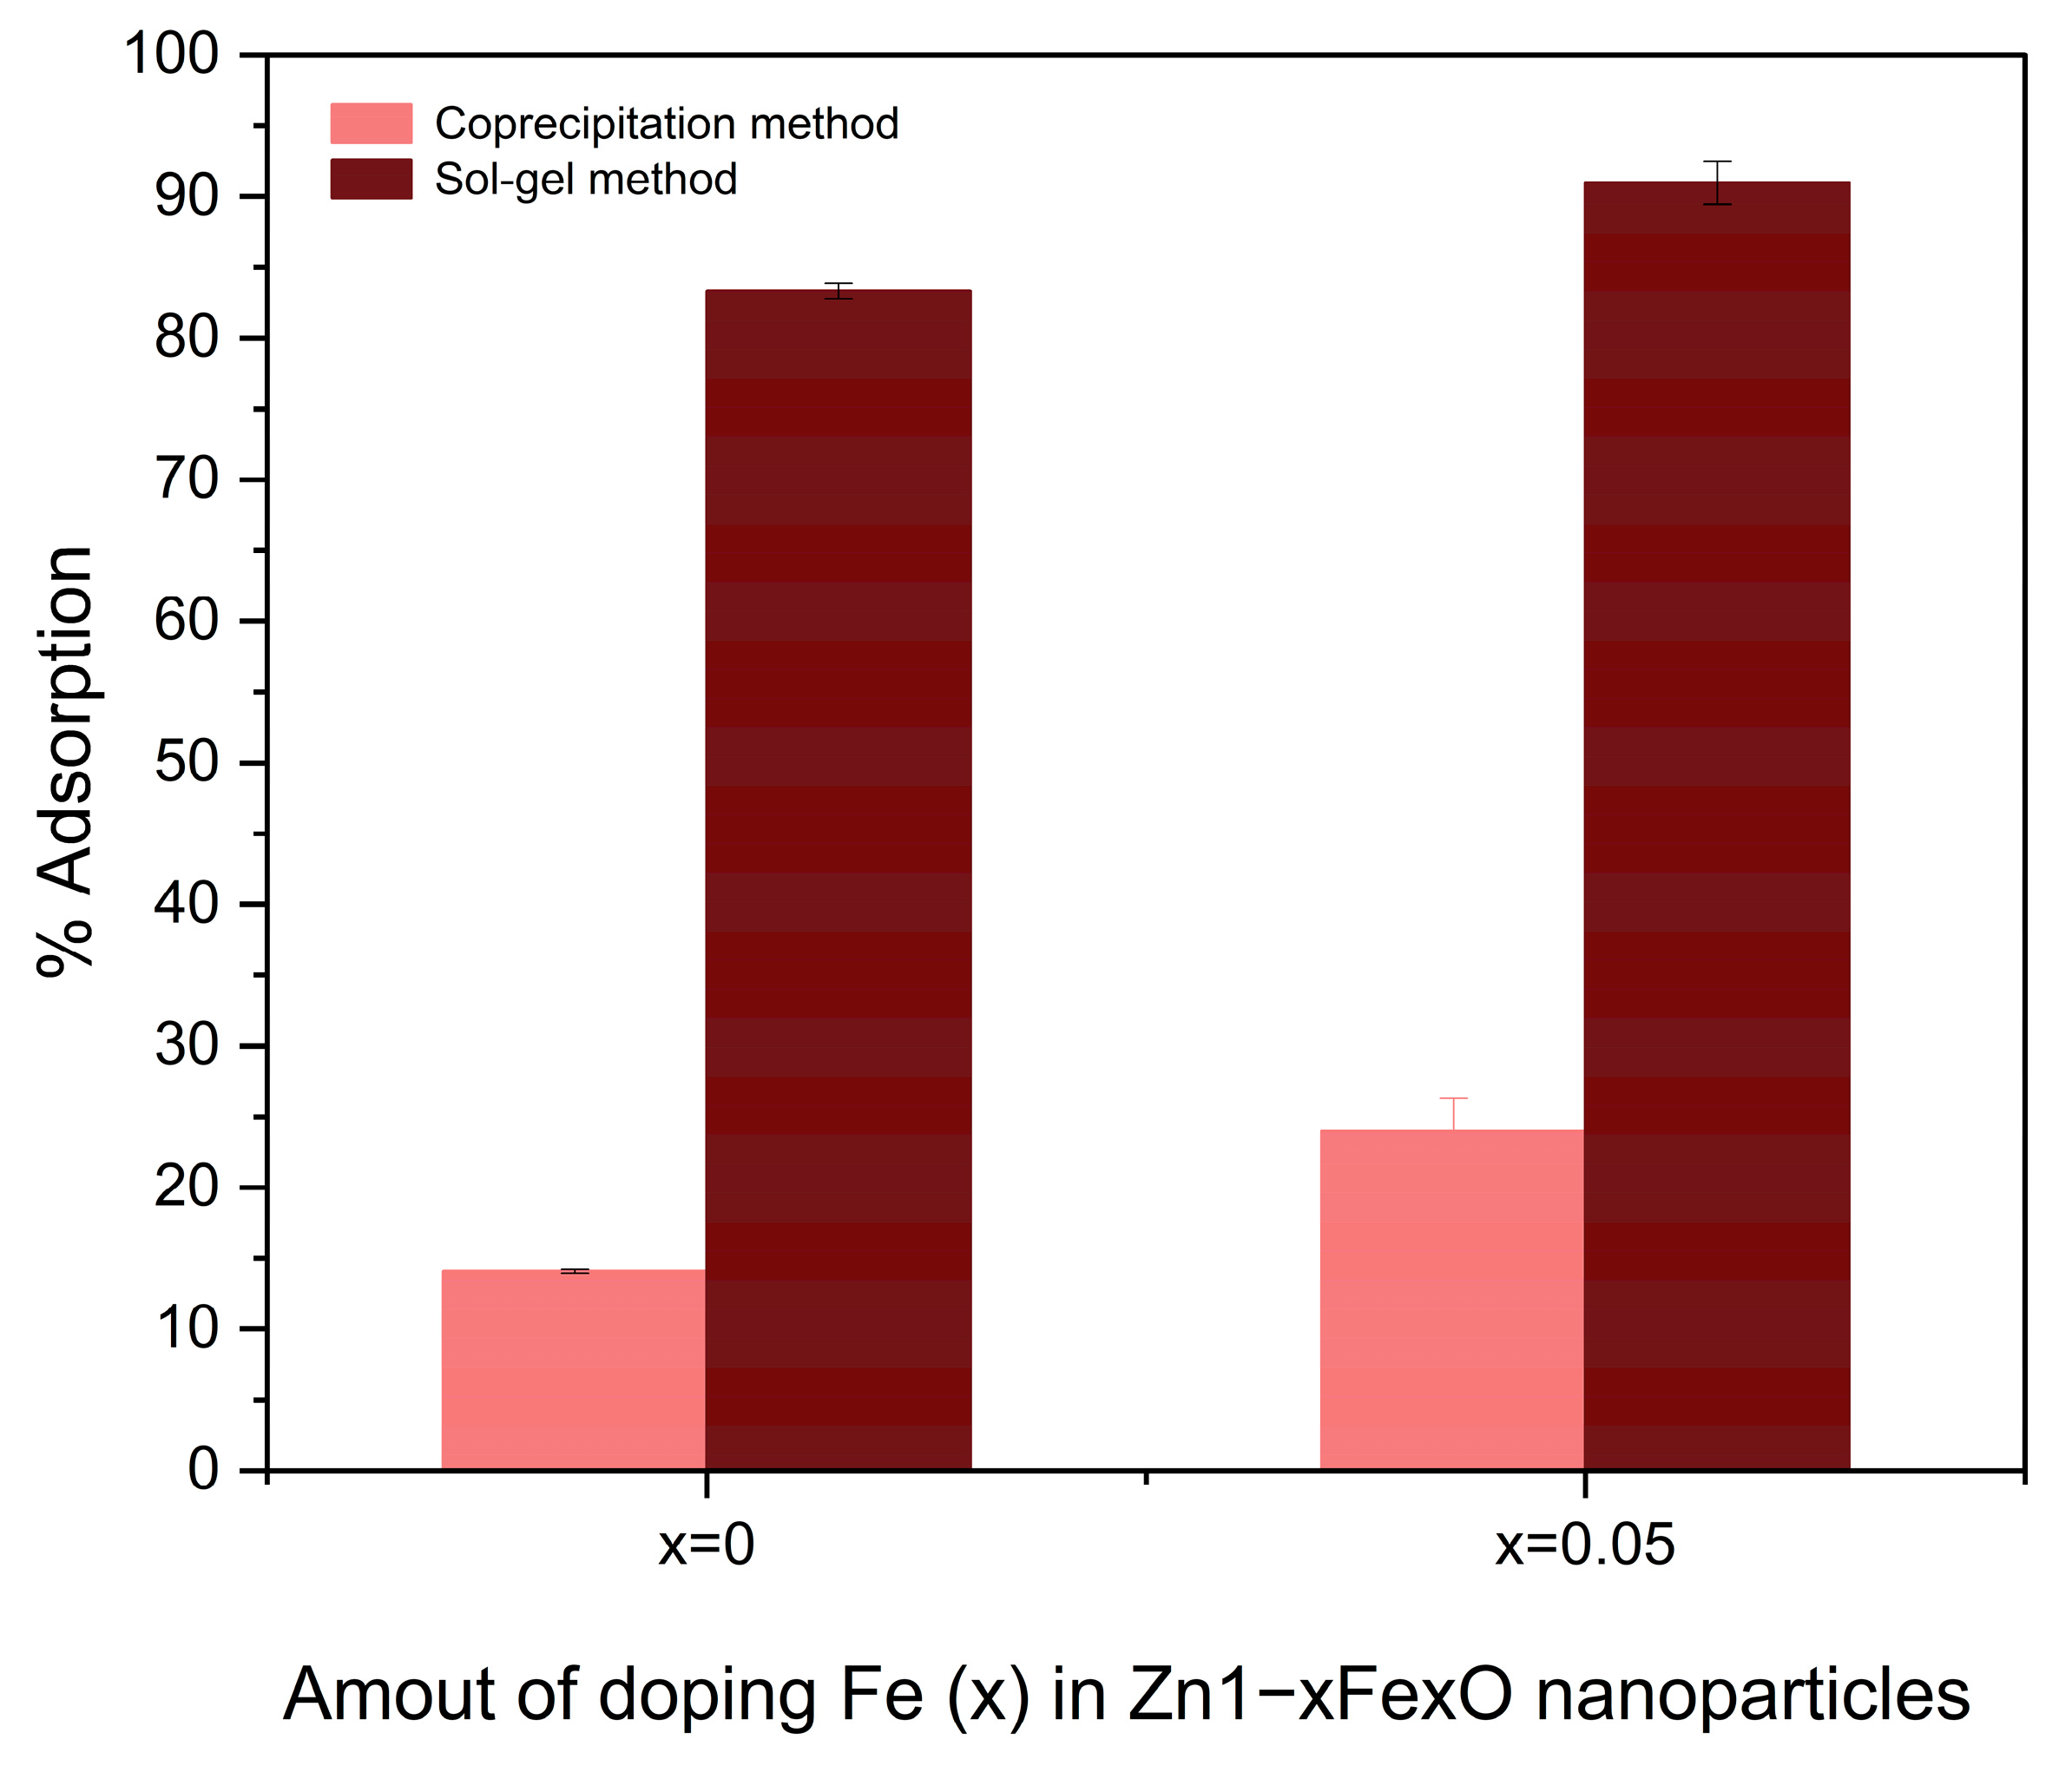
Figure 8.
Congo Red adsorption percentage for Zn1−xFexO nanoparticles synthesized by sol-gel and with variable Fe doping percentage.
Figure 8.
Congo Red adsorption percentage for Zn1−xFexO nanoparticles synthesized by sol-gel and with variable Fe doping percentage.
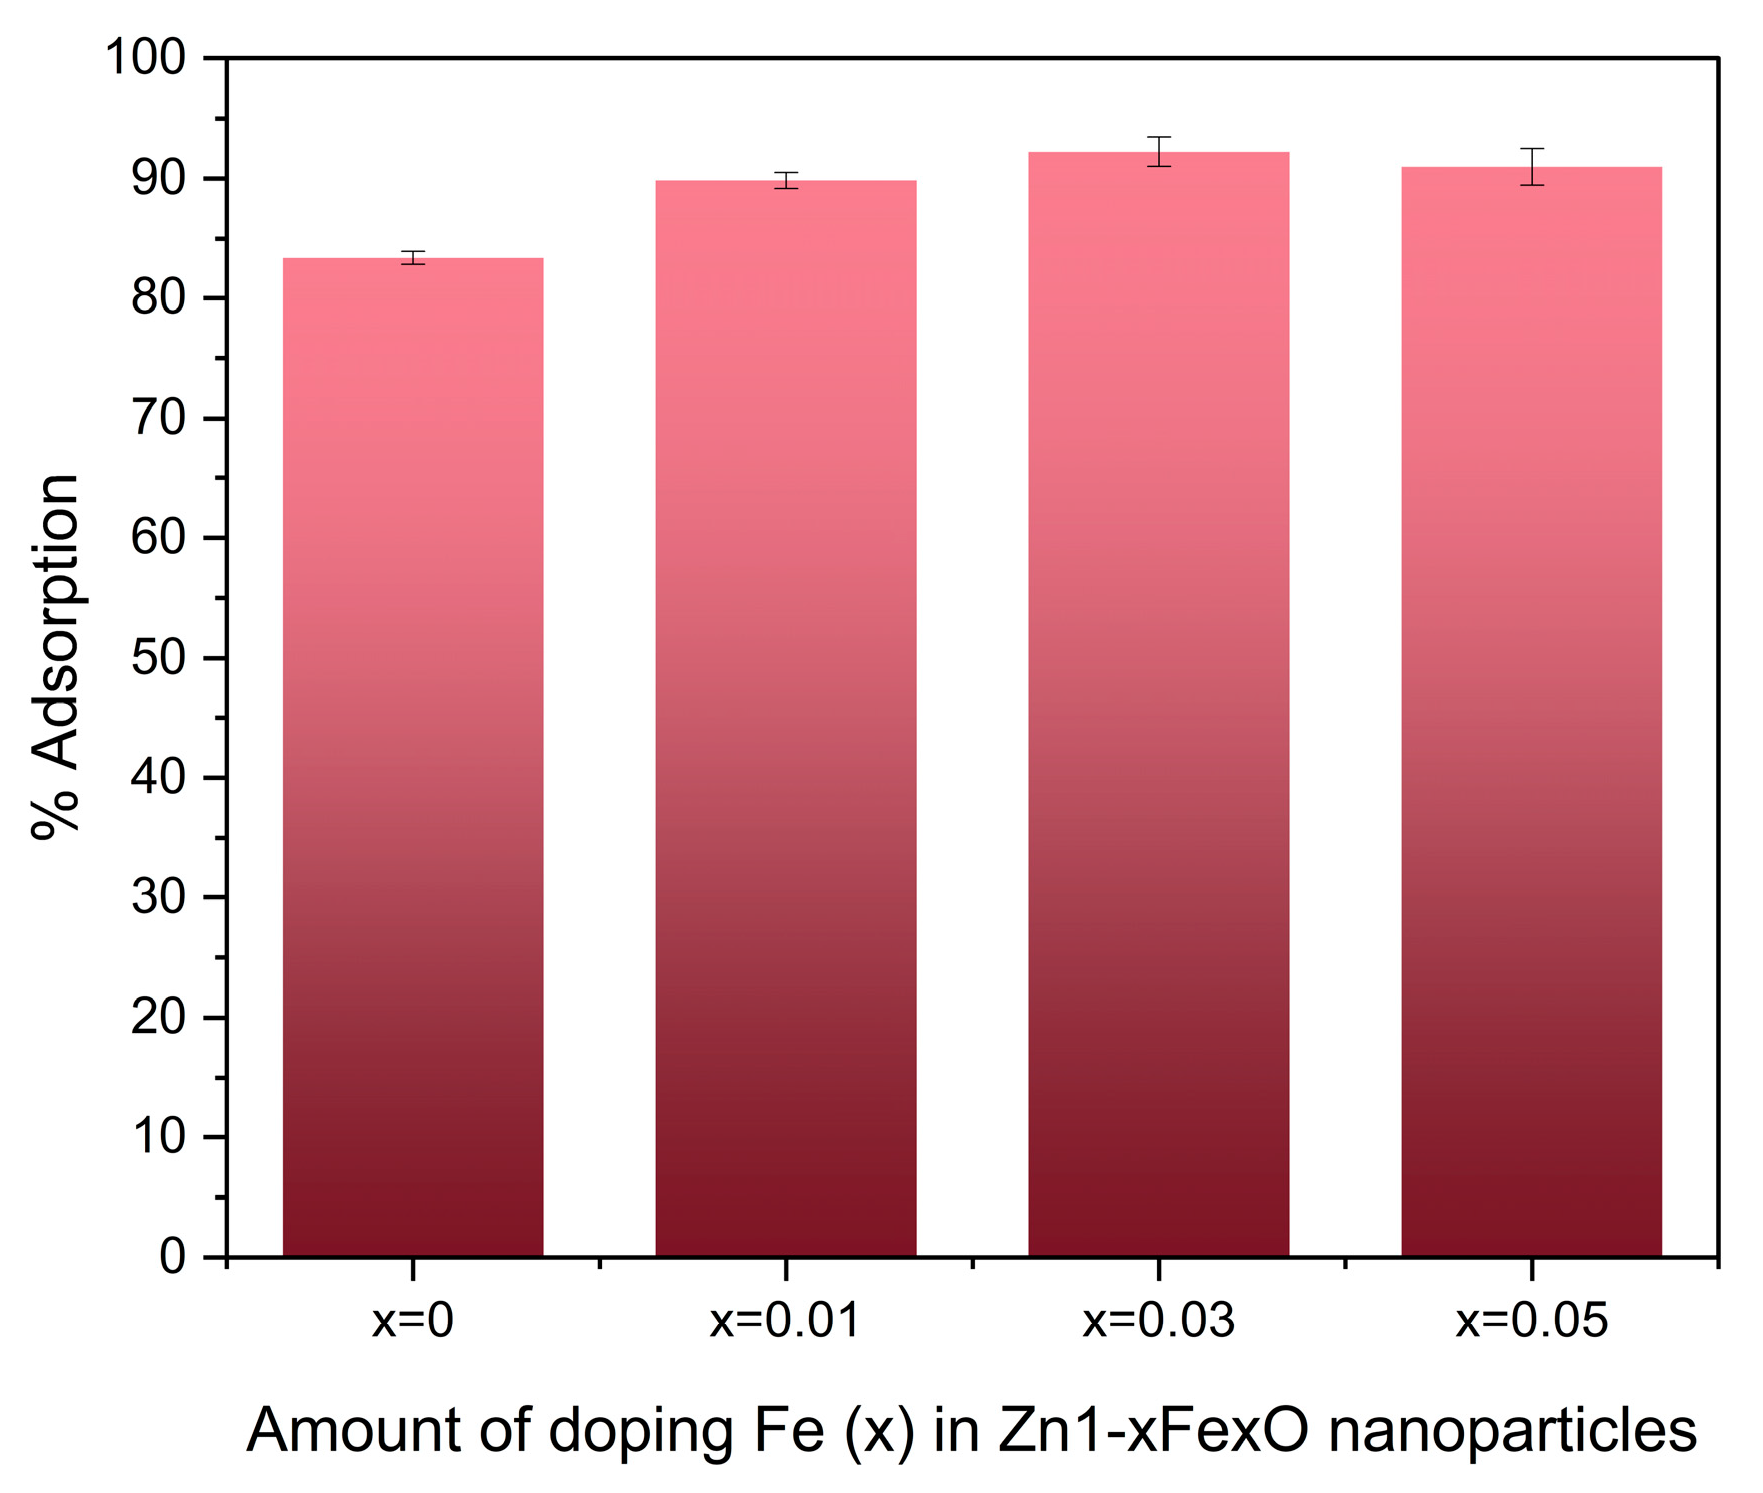
Figure 9.
Congo Red adsorption percentage according to each type of nanostructure used as an adsorbent, varying the percentage of Fe dopant and the reaction temperature.
Figure 9.
Congo Red adsorption percentage according to each type of nanostructure used as an adsorbent, varying the percentage of Fe dopant and the reaction temperature.
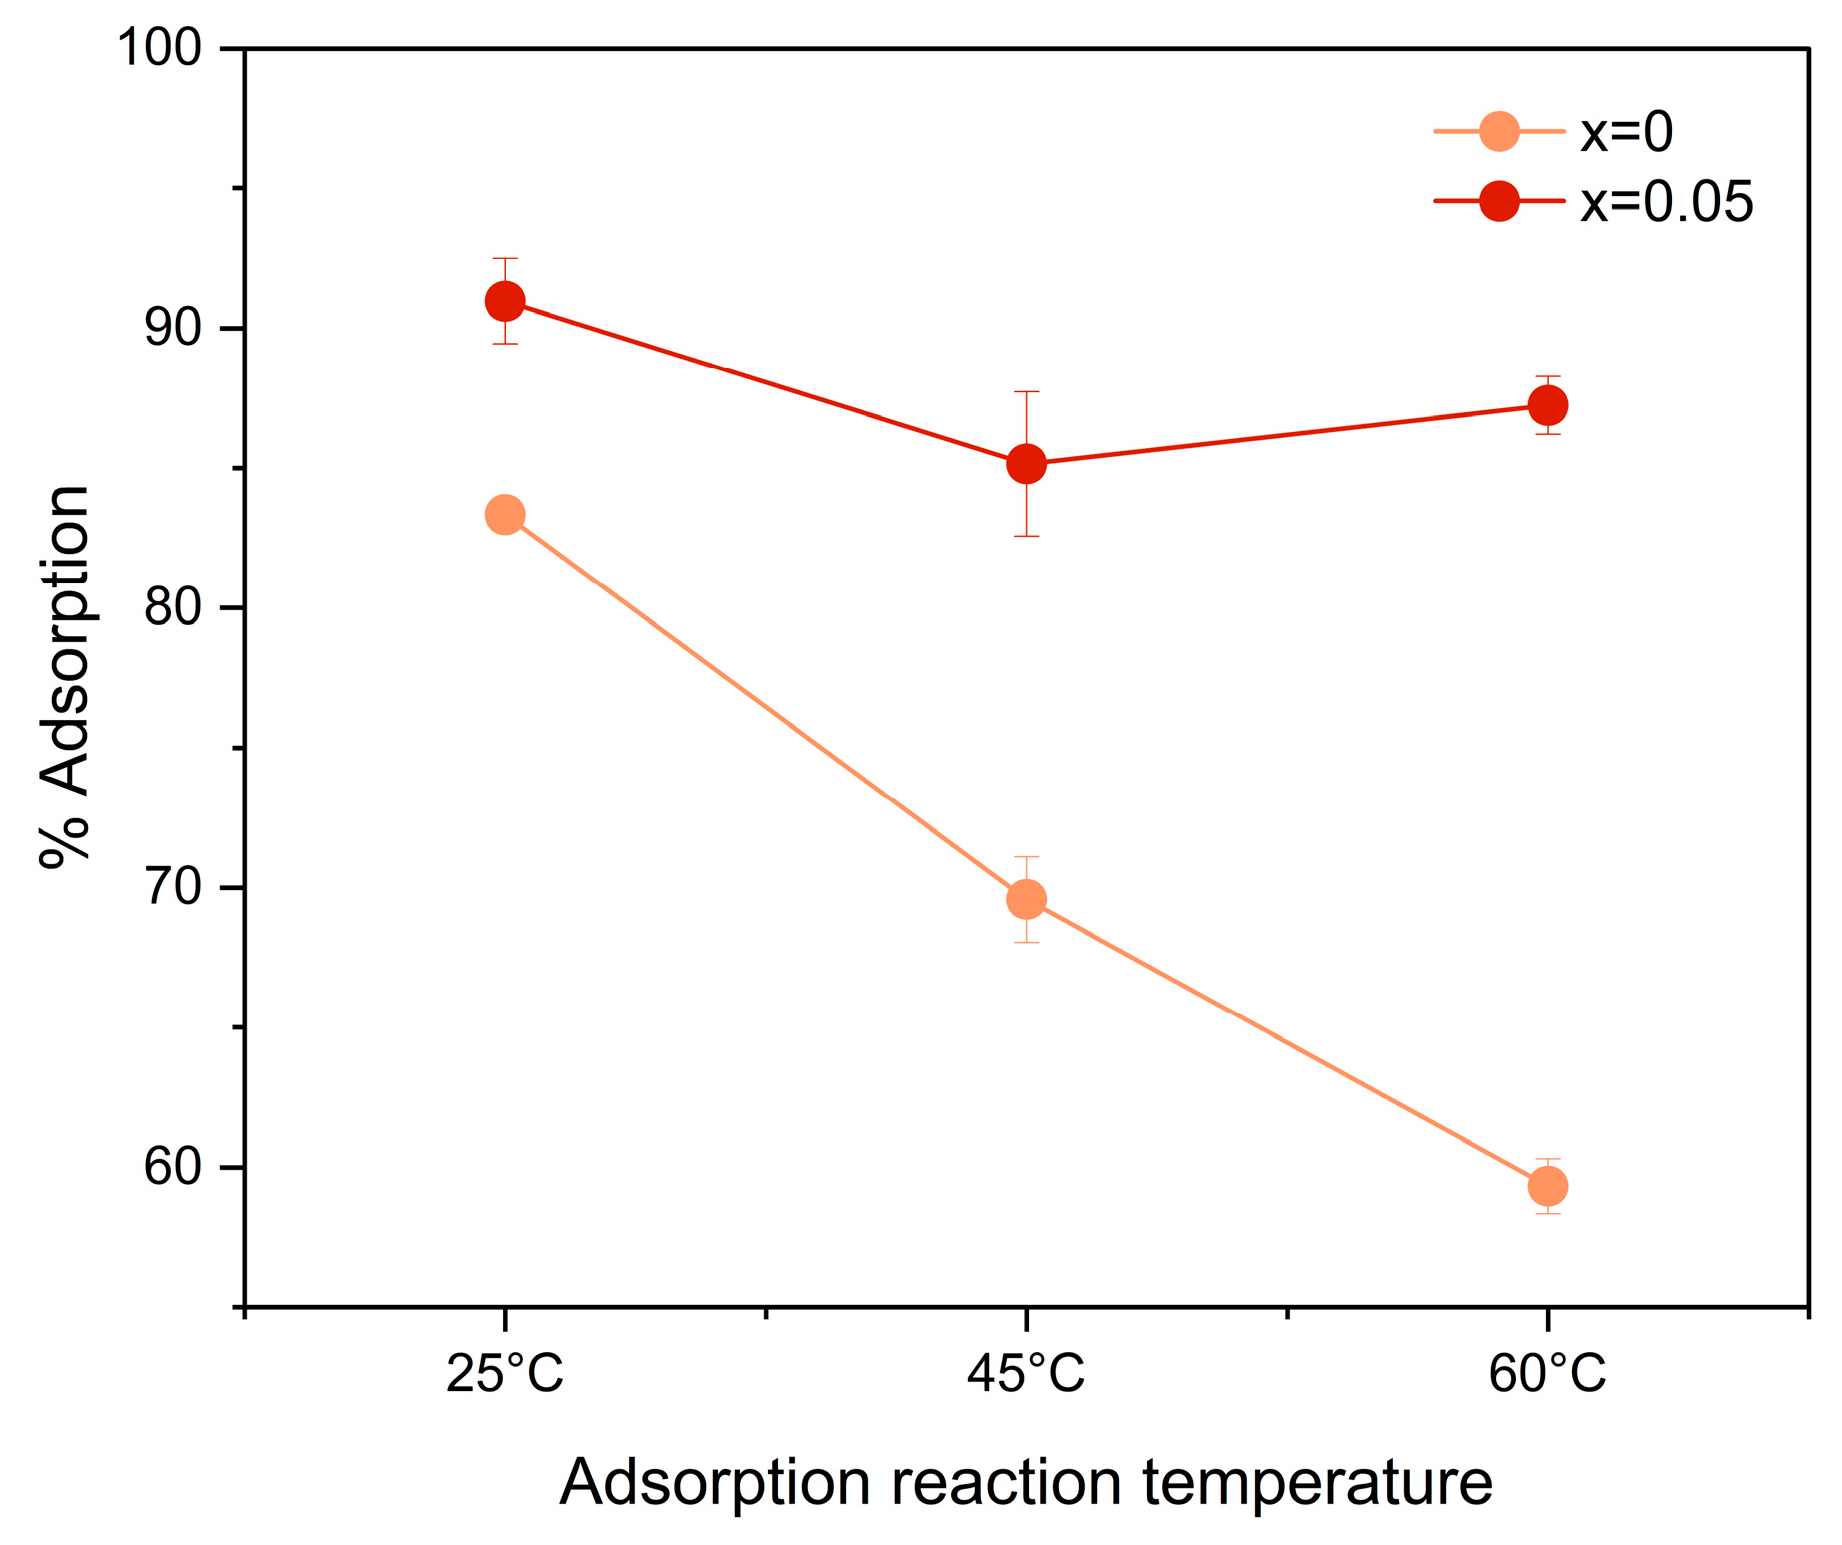
Figure 10.
Scanning Electron Microscopy (SEM) micrographs of Zn1−xFexO nanoparticles obtained by sol-gel and calcination at 600 °C, a) and b) x=0 and before adsorption, c) and d) x=0 and after adsorption of 10 ppm of CR, e) x=0.05 and before adsorption, and f) x=0.5 and after adsorption of 10 ppm of CR.
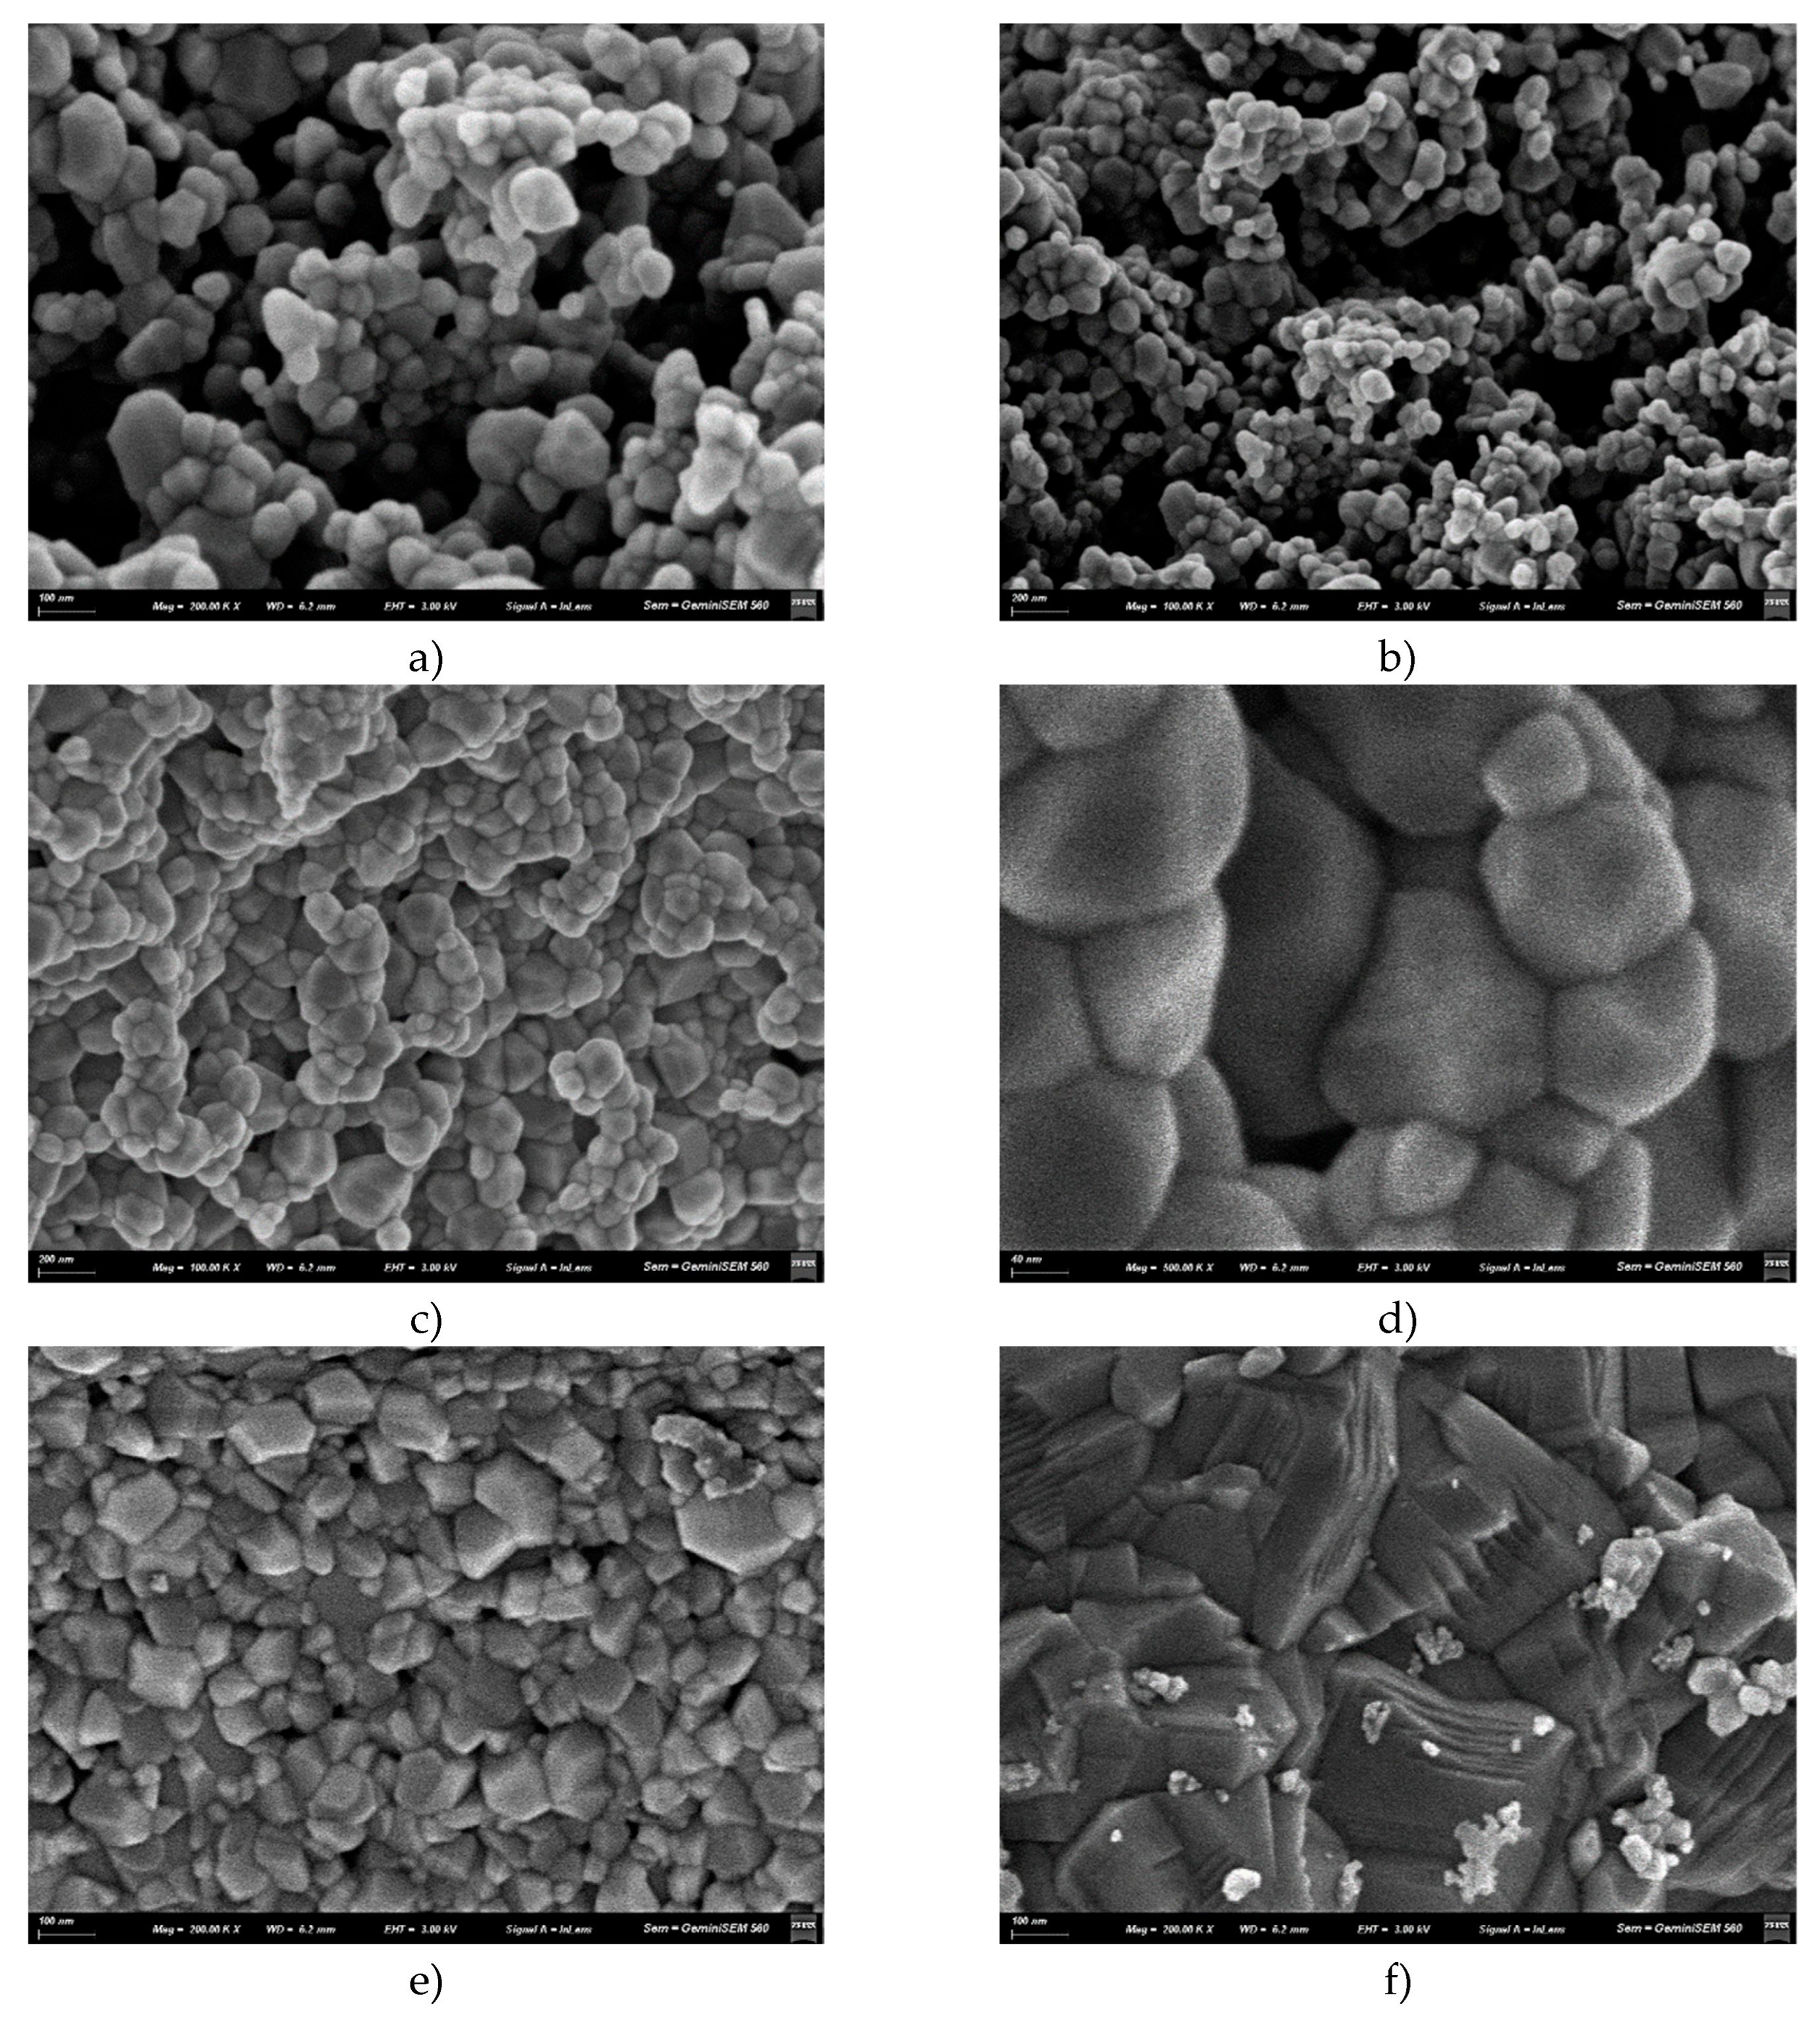
Figure 11.
Fourier Transform Infrared Spectroscopy (FTIR) spectrum of Zn1−xFexO nanoparticles obtained by sol-gel, with variable amount of doping Fe and before and after adsorption CR.
Figure 11.
Fourier Transform Infrared Spectroscopy (FTIR) spectrum of Zn1−xFexO nanoparticles obtained by sol-gel, with variable amount of doping Fe and before and after adsorption CR.
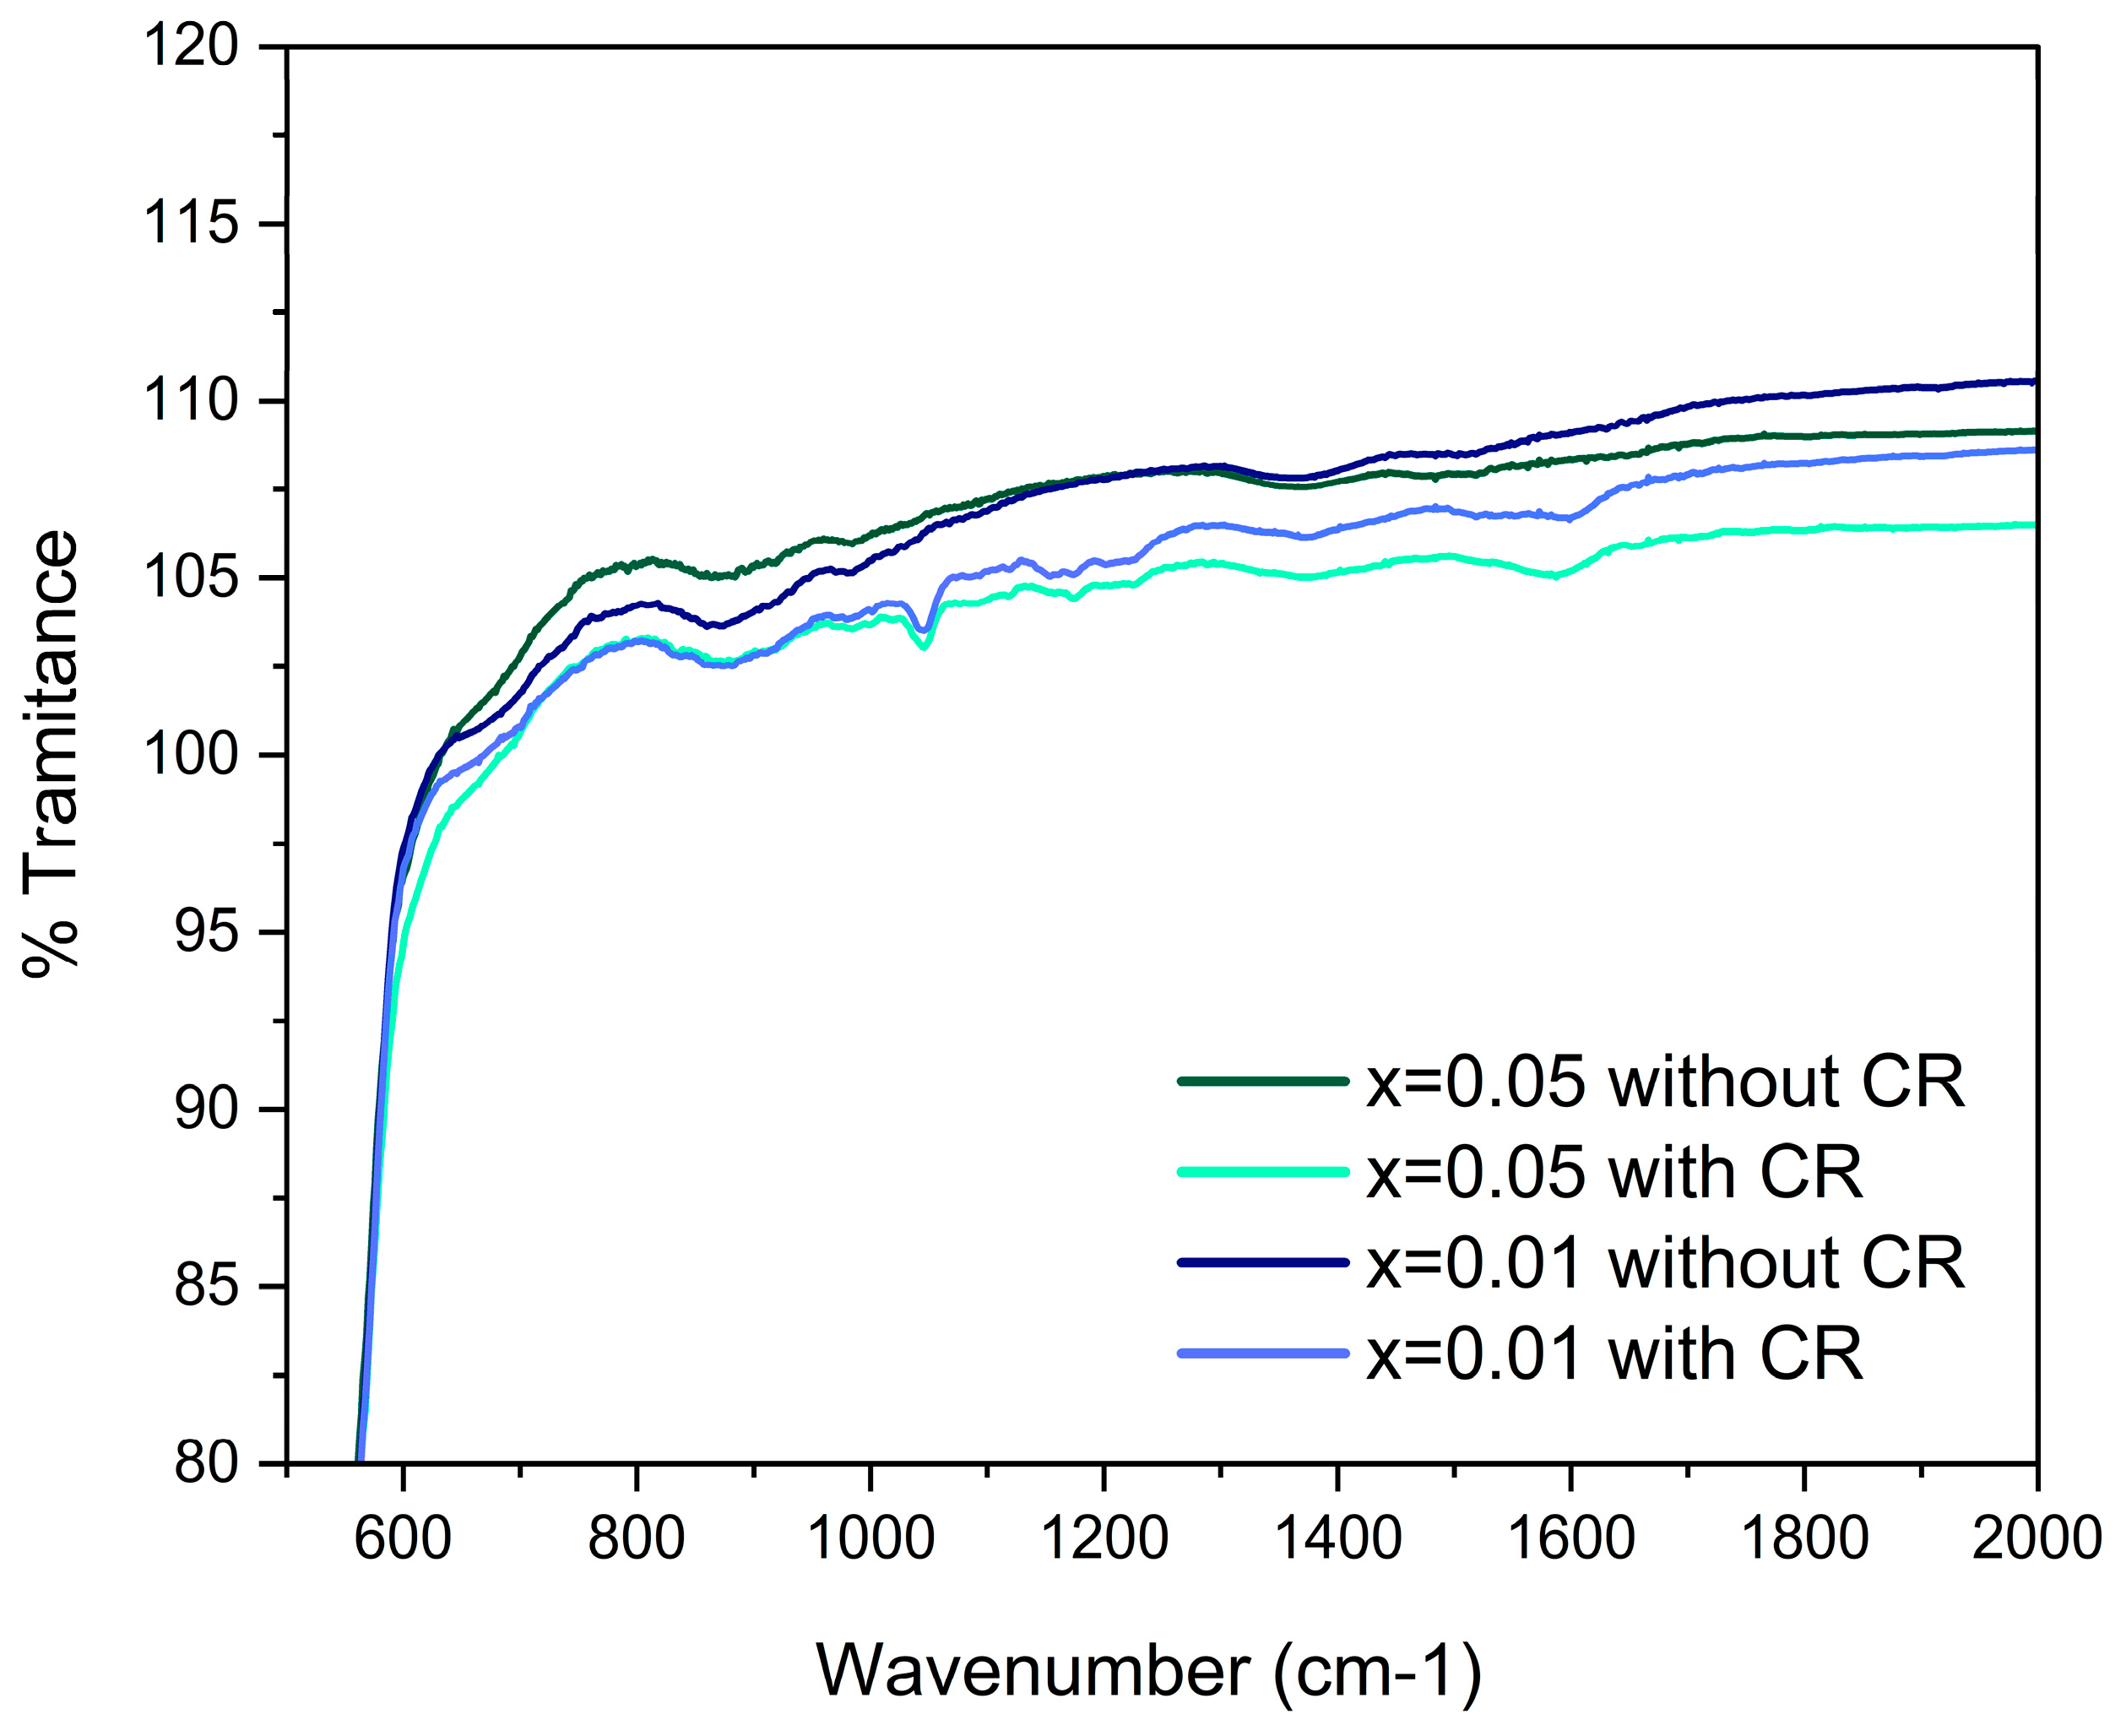

Table 1.
General characteristics of the colorant used.
| Characteristic | |
| Generic name | Congo Red |
| Molecular weight | 696,66 g/mol |
| Chemical formula | C32H22N6Na2O6S2 |
| Maximum wavelength (λmax) | 500 nm |
| CAS number | 573-58-0 |
| Molecular structure | 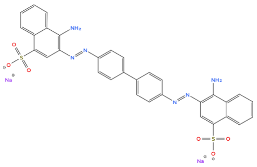 |
Disclaimer/Publisher’s Note: The statements, opinions and data contained in all publications are solely those of the individual author(s) and contributor(s) and not of MDPI and/or the editor(s). MDPI and/or the editor(s) disclaim responsibility for any injury to people or property resulting from any ideas, methods, instructions or products referred to in the content. |
© 2025 by the authors. Licensee MDPI, Basel, Switzerland. This article is an open access article distributed under the terms and conditions of the Creative Commons Attribution (CC BY) license (http://creativecommons.org/licenses/by/4.0/).
Copyright: This open access article is published under a Creative Commons CC BY 4.0 license, which permit the free download, distribution, and reuse, provided that the author and preprint are cited in any reuse.


