
Submitted:
21 October 2025
Posted:
22 October 2025
You are already at the latest version
Abstract
Quantitative data on the colors of early film productions is very scarce but may be useful for preserving these cultural assets and for guiding modern digitization processes. We measured the spectral transmittance of 46 small areas in 13 frames of films from the 1910s and 1920s, which were colored using the same tinting process. From spectral measure-ments of the light source in an early carbon arc cinema projector (Gaumont, Paris, 1913), we computed CIELAB color coordinates for these areas and the results were compared with those from two more recent light sources: a Xenon lamp and an ultra-high perfor-mance (UHP) lamp. Average color inconstancy values for the 46 samples were 2.4, 6.8, and 6.5 CIELAB units for carbon-Xenon, carbon-UHP and Xenon-UHP changes, respec-tively, which are color differences above human visual thresholds for observers with nor-mal color vision. Therefore, for accurate color specifications of such films, in addition to the spectral transmittances of frames we must consider the spectral power distribution of projection lamps. Compared with a recent surface object-color gamut, the 46 samples were spread across a relatively wide region of color space, excluding CIELAB hue-angles in the range of 270-360 degrees.
Keywords:
cinema color
; colored film
; color difference
; color inconstancy
; CIECAM16
; color gamut
; carbon arc spectrum
1. Introduction
Quantitative color specifications are currently needed in many fields related to the preservation of objects with cultural interest [1,2,3,4,5]. With respect to early cinema films, it is generally agreed that, as they form part of our cultural heritage, their restoration, digitalization, and reproduction must be faithful to the original materials. Although a recent paper has analyzed the colors of two early cinema frames under CIE illuminant A and CIE 1931 standard colorimetric observer [6], quantitative data on color in these films is very scarce. The question of color in early cinema films deserves closer attention and constitutes the topic of the current paper. While several criteria (high resolution, adoption of pleasing colors, etc.) may also play a role in the digital production of early films, it is desirable to identify the original colors and thus avoid potential subjectivity introduced by film restorers or colorists. A more accurate knowledge of the color of the original films may also be useful for calibrating the digitization equipment used to preserve these films for posterity. Undoubtedly, automatic and unsupervised techniques that mimic the processes of the human visual system are useful [7,8,9,10], but while the digitization of archival films has been practiced for more than a decade, there is still a lack of academic rigor in this field, on the scientific as well as the interdisciplinary level [11,12].
From the viewpoint of color science [13], color is a human perception, and in most cases the perceived color of an object is the result of the interaction of three factors: the spectral power distribution (SPD) of the light source illuminating the object; the spectral characteristics of the object; and the spectral sensitivity of the human visual system. Therefore, in the case of these early film productions, the colors we see on the screen are the result of the light illuminating the screen, the spectral reflectance of the screen itself, and the sensitivity of the human visual system, which for images implies the use of the so-called “CIE 1931 standard colorimetric observer” [14]. Indeed, in early films the light illuminating the screen is the product of the SPD of the light source and the spectral transmittances of frames. The spectral transmittances of frames from the original films are unavailable, and the physical properties of the light sources used in older cinemas (e.g., carbon arcs) have been disregarded in previous literature.
The current study begins by measuring spectral transmittances in different regions for a set of 13 frames from specific early films. From these spectral measurements, we then computed the colors of these regions under several traditional light sources used in cinema venues. The color difference of a single object across two different viewing conditions (e.g., two light sources) is known as “color inconstancy” [13]. Color inconstancy values have been reported previously for some materials and lighting conditions [15,16], but not for specific frames from early films.
The gamut of real surface colors is defined as the range of colors that can be found in the natural or artificial objects around us. Color gamut has been recently re-assessed and a proposal has been made from a wide dataset of 102,801 natural and artificial objects, which include textiles, plastics, graphics, flowers, human skin, etc. [17]. However, in this dataset there were unfortunately no colors from early cinema films, and so, as far as we know, the color gamut of early cinema films remains almost unexplored. Some findings on this topic are reported here.
In summary, the current paper provides quantitative data on color in early cinema films by analyzing the following two questions:
1) How much are colors affected by the use of the various light sources employed in the past to illuminate film frames?
2) Where are the color stimuli generated in early films located in color space, in comparison with the color stimuli we find in everyday life?
2. Materials and Methods
The oldest coloration process in early cinema involved immersing a positive copy of the film in baths of dye, scene by scene, to apply color to the entire image area, including the regions between perforations. This process is known as tinting. Different anilines and acid-based dyes were used for the chemical formulations of the different colors, combining and modifying their concentrations to obtain the desired shades, according to the creative needs of the cinematic narrative. This process, which appeared in the late 19th century, was widely used in silent films from the 1910s onwards to highlight specific moods or scene settings. For example, blue was often used for night scenes or mystery scenes, while warm tones, such as yellow or sepia, were common for daytime scenes or desert environments. This technique helped create an atmosphere and reinforced the visual narrative, allowing viewers to identify the mood or time of day in the story simply by the color of the scene.
We used a set of 13 cellulose nitrate frames (35 mm film) provided by the National Film Archive of Spain (Figure 1, Table 1) that were colored using the tinting technique. The frames were in a very good state of conservation (only a few parts of some frames have been lost). Table 1 provides basic information on the 13 frames used. For each one of the 13 frames, spectral transmittances were measured at 3-4 very small regions using a SpectraScan® PR-655 spectroradiometer (380-780 nm, in steps of 4 nm). Figure 2 shows the specific experimental laboratory setup employed for these measurements. An annular light source (MI-150 Edmund Optics) provided a sufficiently uniform illumination on the surface of the frame, which was placed between two glass slides on a holder that allowed precise vertical and horizontal displacements. A beam splitter was positioned between the frame and the spectroradiometer, in such a way that a camera (Imaging Sources DFK 61BUC02) located at 90° of the optical axis allowed a careful selection of the region of the frame to be measured by the spectroradiometer. The region between perforations as well as 3-4 regions with low, medium, and high levels of brightness were selected on each frame.
In total, 46 regions of frames were measured, discounting the effects of the slides holding the frame and the beam splitter, using the following procedure. First, spectral irradiance was measured by the spectroradiometer for a specific region of the frame:
where is the SPD of the light source, is the spectral transmittance of the slides holding the frame plus the beam splitter, and is the spectral transmittance of the region of the frame. Second, we used the spectroradiometer to measure spectral irradiance in the empty region or perforation, where :
Finally, we obtained the spectral transmittance of the region of the frame needed for further colorimetric computations from the ratio of the two previous measurements:
Over time, the light sources used in film projection have undergone major changes, from early graphite arcs to today’s laser digital projectors [18,19]. For approximately the first 60 years of cinema history, projector light sources were graphite arc lamps, as these were the only light sources capable of illuminating the frames with sufficient intensity to be projected onto screens. However, graphite arcs posed numerous problems. As the graphite burned, the shape of the electrodes and the distance between them was altered, causing changes in the light emitted, and this had to be adjusted by the projectionist [20]. Around 1963, the early graphite arcs were replaced by Xenon lamps, because the latter were more stable and durable, and by 1970, the use of such lamps had become widespread in the USA. In the 1960s, metal halide lamps were developed, consisting of voltaic arcs in a mixture of gases consisting of mercury and metal halides. These lamps were widely used in projection systems until they were in turn replaced by the so-called “ultra-high-pressure lamps” (UHP, a Philips trademark) which use only mercury [19]. Currently, light-emitting diodes (LEDs) and lasers are the common light sources employed in projection systems.
From the chronological sequence of light sources employed in early cinema, for the current paper we considered three: the carbon arc, the Xenon lamp, and the UHP lamp. As far as we know, the SPDs of light sources used in early cinemas are not available. Therefore, we measured the SPD of the light emitted by the carbon arc in a 35 mm film projector manufactured in 1913 (Gaumont Doble Serie CM-B, Paris), using a calibrated white reflectance plaque (Spectralon) and a spectroradiometer (Ocean Optics Red Tide USB 650). Figure 3 shows this projector and some of its main components. For this paper, the SPD of the light emitted by this projector may be considered the main (oldest) light source, and was obtained as the average of five measurements made at intervals of 3 minutes. For comparison purposes, we also considered the SPDs of two additional light sources employed in film projectors: a Super-Quiet Xenon lamp (L2273, Hamamatsu Photonics K.K., Japan, 2025) [21], whose SPD was obtained from manufacturer’s catalogue using WebPlotDigitizer [22]; and an ultra-high-performance lamp (Philips UHP-E22,7) [23], whose SPD was provided by the manufacturer. Figure 4 shows the normalized (tristimulus value Y=100) SPDs for the three light sources under consideration (carbon arc, Xenon lamp, and UHP lamp), while Table 2 shows their main colorimetric parameters.
From Figure 4, we note that the SPDs of the three light sources in the visible range (380-780 nm in steps of 1 nm) are considerably different: the SPD of the carbon arc roughly resembles a Gaussian curve with considerable noise; the SPD of the Xenon lamp is close to a horizontal line; and the SPD of the UHP lamp shows high peaks, particularly in the short and medium wavelengths. All three sources in Figure 4 may be considered “white lights,” as [14]. However, they have significantly different CCT and [24] values (Table 2). As a side note, the CCT of the carbon arc was 4917 K, considerably different from the 2856 K of CIE illuminant A (CIE, 2018), indicating that it may be not accurate to assume this CIE standard illuminant for color computations of early cinema frames. In comparison with the carbon arc, we note that the tristimulus value is about twice as high in the UHP lamp due to the considerably higher emission in short wavelengths of this source.
From spectral transmittances, we computed the CIE tristimulus values of the 46 samples in the 13 frames shown in Figure 1 illuminated by the three light sources previously described, assuming the CIE 1931 standard colorimetric observer and using CIE standard procedures [14]. However, the comparison of perceived colors under these three light sources is not straightforward, as the reference whites for each source are different, and we must compute the so-called “corresponding colors” for a common reference condition. We performed computations of corresponding colors using the two-step chromatic adaptation transform embedded in the current color appearance model CIECAM16 [25], using as reference condition the CIE standard illuminant D65 and the CIE 1931 standard colorimetric observer (LA=191 cd/m2; F=1). This specific reference condition was chosen for further comparison with a recently reported color gamut for surface colors [17].
3. Results
Using cubic splines, we interpolated at 1 nm steps the initial measurements of spectral transmittances of the 46 samples at 4 nm steps, in order to match the 1 nm steps of SPDs of the three light sources considered. Supplementary material provides both, the spectral transmittances of the samples and the SPDs of the three light sources. As an example, Figure 5 shows the spectral transmittances for the regions between perforations in the 13 frames (see Figure 1). We can note transmittance values are small (<0.4) in the wavelength range below 525 nm, approximately, except for the frame 12.
Table 3 shows color inconstancy values (CIELAB units) for the 46 samples (Figure 1) resulting from specific changes in the SPDs of the light sources illuminating the frames. Assuming that carbon arcs were the light sources employed in early film projectors (Figure 3), the results in Table 3 indicate that the average colors produced by a Xenon lamp are about twice as close to those from a carbon arc than those produced by a UHP lamp. More specifically, Figure 6 shows the color shifts of the 46 samples in CIELAB and planes for the three pairs of light sources under consideration. The origins and extremes of the arrows in Figure 6 correspond to colors under the two light sources specified in each plot. We can note that most of the arrows in Figure 6 are nearly horizontal, in agreement with the very low values of shown in Table 3. It must be taken into account that hue differences () are different from hue-angle differences () shown in the x-axes of plots in the left column of Figure 6 [26].
Another interesting finding from plots in the left column of Figure 6 is the absence of colors with CIELAB hue-angles higher than about 270°, which means that there were no “purple hues” in projections of the 13 frames in Figure 1 using any of the 3 light sources considered here (Figure 4). We analyzed the spread of colors for the 46 samples illuminated by the carbon arc source, and compared the results with a recently proposed color gamut for surface object colors named “proposed gamut”[17]. The results of this comparison are shown in Figure 7. While the color gamut is a 3D volume in CIELAB color space, the plot in Figure 7 allows an initial, simple, and approximate comparison between the ranges of colors in real everyday objects and those in early films.
4. Discussion
Returning to the first question posed at the end of the Introduction, the results in Table 3 indicate that color inconstancy values are relatively high, as, with regard to human perception, color differences above 1.1 CIELAB units are perceptible for observers with normal color vision. Specifically, it has been reported that color differences in the range of 0.55-1.10 CIELAB units are “threshold color differences” while color differences in the range of 1.38-3.04 CIELAB units are “small color differences” [27]. Therefore, a value of 2.4 CIELAB units (Table 3) means that, on average, observers with normal color vision will perceive different colors when the same frame is illuminated by a carbon arc (the oldest traditional source in cinema venues) and a Xenon lamp (the source used in cinemas since the 1960s). Using a UHP lamp, average color differences with respect to the carbon arc or the Xenon lamp are even higher and are clearly perceptible: 6.8 and 6.5 CIELAB units, respectively (Table 3). For an accurate reproduction of the colors achieved using the older carbon arc source, it is better to use a Xenon lamp than a UHP lamp. We can conclude that for accurate characterizations of individual colors in early cinema, the specification of the SPD of the light source employed is necessary.
The standard deviations of color inconstancy values shown in Table 3 are also high. This means that when the light source changes, the magnitude of color changes on a projection screen may be significantly different for some colors with respect to others, as may be noted from the very different lengths of arrows in Figure 6. Color differences (also called color shifts) generated by the change of light source are mainly chroma and hue-angle differences, while lightness differences () are very small (i.e., nearly horizontal arrows in Figure 6, and low values in Table 3), because we have considered light sources with the same luminosity (Y=100). From Figure 6, we can also note that the magnitudes and directions of color shifts are not uniform, the general trend being that color shifts increase with chroma and lightness, with the influence of a change in light source being lowest for the darkest and more ‘achromatic’ colors. Hue-angle differences are very small when we change from carbon arc to Xenon lamp (see Figure 6, left column, upper plot), as the SPDs of these two light sources in the visible range are nearly symmetrical (Figure 4). However, the UHP lamp shows a high amount of intensity in the short wavelength range, which, for example, makes the blue colors in frames 6 and 9 become even bluer (Figure 6, left column, middle and bottom plot). The directions of color shifts in Figure 6 are sometimes not uniform and difficult to interpret, but they are the consequence of different interactions between specific SPDs of light sources (Figure 4) and specific spectral transmittances (Figure 5).
As for the second question posed in the Introduction, Figure 7 indicates that colors under the carbon arc source (with similar results found for the Xenon and UHP sources) are spread over a relatively wide region of CIELAB color space, in comparison with the current gamut of surface object colors [17]. In particular, we can observe in Figure 7 that high chromatic colors close to the mentioned gamut were achieved in early cinema. However, there are no purple colors (i.e., hue-angles in the range 270°-360°) in Figure 7, as also shown by the plots in the left column of Figure 6. A possible interpretation for this may be to consider that purple colors are a combination of blue and red, the two extreme colors in the visible range, and here we have no frames with simultaneous high values of spectral transmittance in both regions, as illustrated in Figure 5.
We must emphasize that all of the results reported in the current paper are based on a reduced set of 46 samples from 13 frames from early films and 3 specific light sources (carbon arc, Xenon lamp, and UHP lamp). Complementary results using additional frames and other light sources may be useful for testing and generalizing the findings presented here. Note also that our current approach has neglected some important aspects which may be considered in future research like, for example, the measuring of spectral reflectances of the screens employed in cinemas, as projection onto a screen has always been the supreme manifestation of cinematography, and the digitization of a motion picture should seek to recreate this visual impression [28]. Observer metamerism is another important topic that we have not addressed in the current paper because we just assumed the CIE 1931 standard colorimetric observer [14]. Variability in the colors perceived by individual observers is currently a hot topic [29], and results for some digital film projectors with different primaries have been reported [30,31]. In our opinion, apart from mentioned limitations, the findings presented here may prove useful in light of the lack of quantitative data on early cinema colors.
Supplementary Materials
The following supporting information can be downloaded at the website of this paper posted on Preprints.or, The spectral power distributions of the 3 light sources considered and the spectral transmittances of the 46 measured regions are provided (380-780 nm, 1 nm steps).
Author Contributions
Conceptualization, M. Melgosa and D. Vázquez; methodology, D. Vázquez, P. Uceda, J. Rellán, M. Muñoz and M. Melgosa; software, M. Melgosa, A. Álvarez and I. Hernández; validation, M. Melgosa, M. del Egido and J. Rellán; formal analysis, M. Melgosa; investigation, D. Vázquez, A. Álvarez and M. Melgosa; resources, A. Álvarez; data curation, M. del Egido, J. Rellán, P. Uceda and M. Muñoz; writing—original draft preparation, D. Vázquez and M. Melgosa; writing—review and editing, M. del Egido, J. Rellán, P. Uceda and M. Muñoz; visualization, A. Álvarez; supervision, D. Vázquez; project administration, A. Álvarez and M. Melgosa; funding acquisition, A. Álvarez and M. Melgosa. All authors have read and agreed to the published version of the manuscript.
Funding
This research was funded by MICIU/AEI/10.13039/501100011033 and ERDF/EU, grant number PID2022-138031NB-I00, and by MICIU/AEI/10.13039/501100011033/FEDER, UE, grant number PID2022-138061OB-I00.
Data Availability Statement
The raw data supporting the conclusions of this article (i.e., spectral transmittance values of 46 samples and SPDs of 3 light sources considered) will be made available by the authors on request.
Acknowledgments
‘Museo del Cine Carlos Jiménez’ (Villarejo de Salvanés, Madrid, Spain, https://museodelcine.com/) allowed measurements of the SPD of an old carbon arc cinema projector. Carlos Jiménez, owner and director of ‘Museo del Cine Carlos Jiménez’, provided help and technical advice, as expert on the history of cinema: His work and dedication have made it possible to preserve old films for posterity. Santiago Mar (University of Valladolid, Spain), María del Mar Gandolfo (Signify, Madrid, Spain) and Michael Pointer (University of Leeds, UK) advised on SPDs of light sources for cinema. Ming Ronnier Luo (University of Zhejiang, Hangzhou, China) provided numerical data on the color gamut for surface object colors. Mr. Donald J. Murphy McVeigh revised English.
Conflicts of Interest
The authors declare no conflicts of interest.
References
- Prieto, B.; Ferrer, P.; Sanmartín, P.; Cárdenes, V.; Silva, B. Color characterization of roofing slates from the Iberian Peninsula for restoration purposes. J. Cult. Her. 2011, 12, 420-430. [CrossRef]
- Lungu, A.; Timar, M.C.; Beldean, E.C.; Georgescu, S.V.; Coşereanu, C. Adding Value to Maple (Acer pseudoplatanus) Wood Furniture Surfaces by Different Methods of Transposing Motifs from Textile Heritage. Coatings 2022, 12 (10), paper 1393. [CrossRef]
- Álvarez Fernández-Balbuena, A.; Gómez-Manzanares, A.; Martínez Antón J.C.; García Gómez-Tejedor, J.; Mayorga-Pinilla, S.; Durán Roque, H.; Vázquez Moliní D. High-Dynamic-Range Spectral Reflectance for the Segmentation of Paint Pigment: Application to Dalí’s Oil Painting Dos Figuras (1926). Sensors 2023, 23 (9), paper 4316. [CrossRef]
- Pogliani, P.; Pelosi, C.; Lanteri, L.; Bordi, G. Imaging Based Techniques Combined with Color Measurements for the Enhancement of Medieval Wall Paintings in the Framework of EHEM Project. J. Imaging 2024, 10 (7), paper 159. [CrossRef]
- Dai, Y.; Ju, F.; Wen, Y. Research on digital restoration and innovative utilization of Taohuawu woodblock New Year prints based on edge detection and color clustering. Appl. Sci. 2025, 15 (16), paper 9081. [CrossRef]
- Campagnari, C.; Plutino, A. From Dyes to Digital: A Scientific Reconstructions of Early Colors. Archiving Conference 2025, 22 (1), 191-196.
- Rizzi, A.; Berolo, A.J.; Bonanomi, C.; Gadia, D. Unsupervised digital movie restoration with spatial models of color. Multimed. Tools Appl. 2016, 75, 3747-3765. [CrossRef]
- Fang, M.; Song, Y.; Bai, X.; Ren, Y.; Liu, S. A Method for Coloring Low-resolution Black and White Old Movies through Object Understanding. In Proceedings of the 31st Chinese Control and Decision Conference, Nanchang, China, 3-5 June 2019, pages 5944-5949. https://ieeexplore.ieee.org/document/8833380 (accessed on 7 October 2025).
- P. Chae-rim, K. Jae-hoon; C. Seok-je. Improving colorization through denoiser with MLP. Journal of Advanced Marine Engineering and Technology 2022, 46, 85-92. [CrossRef]
- Plutino, A. Film and digital media: Open issues and novel approaches for digital color film restoration. In Proceeding Archiving 2021, pages 11-14. Society for Imaging Science and Technology, 2022.
- Flueckiger, B.; Op den Kamp, C.; Pfluger, D. A material-based approach to the digitization of early film colours. In The Colour Fantastic: Chromatic Worlds of Silent Cinema, pp. 237-259. Framing Films (2018).
- Fossati, G.; Jackson, V.; Lameris, B. et al. The Colour Fantastic: Chromatic Worlds of Silent Cinema. Series: Framing Film. Amsterdam University Press, 2018. https://www.jstor.org/stable/j.ctv233pg1 (accessed on 7 October 2025).
- Fairchild, M.D. Color Appearance Models, 3rd Edition. Wiley, 2013. ISBN: 978-1-119-96703-3.
- CIE 015:2018. Colorimetry, 4th Edition. CIE Central Bureau: Vienna, 2018.
- Melgosa, M.; Ruiz-López, J.; Li, C.; García, P.A.; Della Bona, A.; Pérez, M.M. Color inconstancy of natural teeth measured under white light-emitting diode illuminants. Dent. Mater. 2020, 36 (12), 1680-1690 (2020). [CrossRef]
- Martínez-Domingo, M.A.; Melgosa, M.; Okajima, K.; Medina, V.J.; Collado-Montero, F.J. Spectral image processing for museum lighting using CIE LED illuminants. Sensors 2019, 19 (24), paper 5400. [CrossRef]
- Xu, L.; Song, Z.; Luo, M.R.; Li, C. Construction of the real surface color gamut. Color Res. Appl. (Early View, 10 pages) 2025. [CrossRef]
- Aleksandersen, D. A short history of projection. News and Views, 27 June 2019. https://newsandviews.dataton.com/a-short-history-of-projection (accessed on 7 October 2025).
- Aleksandersen, D. Projection light sources: From arc to laser. News and Views, 5 July 2019. https://newsandviews.dataton.com/projection-light-sources-from-arc-to-laser (accessed on 7 October 2025).
- Zhou, T.; Yuan, T.; Wei, S.; He, H.; Yang, Q. Temperature and composition of AC arc plasma of medium voltage distribution networks in the air. J. Phys. D: Appl. Phys. 2022, 55 (24), paper 245201. [CrossRef]
- Hamamatsu Photonics K.K., Japan. Super-Quiet Xenon lamp L2273. Catalog No. TLS 1016E07 September 2025. https://www.hamamatsu.com/content/dam/hamamatsu-photonics/sites/documents/99_SALES_LIBRARY/etd/Xe-HgXe_TLS1016E.pdf (accessed on 7 October 2025).
- Rohatgi, A. WebPlotDigitizer. https://apps.automeris.io/wpd/ (accessed on 7 October 2025).
- Philips. https://www.signify.com/global/brands/uhp (accessed on 7 October 2025).
- CIE 224:2017. CIE 2017 Colour Fidelity Index for accurate scientific use. CIE Central Bureau: Vienna, 2017.
- CIE 248:2022. The CIE 2016 Colour Appearance Model for Colour Management Systems: CIECAM16. CIE Central Bureau: Vienna, 2022.
- Stokes, M. Brill, M.H. Efficient Computations of . Color Res. Appl. 1992, 17 (6), 410-411.
- Huang, M.; Cui, G.; Melgosa, M.; Sánchez-Marañón, M.; Li, C.; Luo, M.R.; Liu, H. Power functions improving the performance of color-difference formulas. Opt. Express 2015, 23 (1), 597-610. [CrossRef]
- Trumpy, G.; Flueckiger, B. Chromatic Callier effect and its repercussions on the digitization of early film colors. J. Imaging Sci. Technol. 2019, 63 (1), paper 010506. [CrossRef]
- Stockman, A.; Rider, A.T. Formulae for generating standard and individual human cone spectral sensitivities. Color Res. Appl. 2023, 48 (6), 818-840. [CrossRef]
- Trumpy, G.; Andersen, C.F.; Farup, I.; Elezabi, O. Mapping quantitative observer metamerism of displays. J. Imaging 2023, 9 (10), paper 227. [CrossRef]
- Ploumis, S.; Boitard, R.; Ballestad, A. ; Damberg, G.; Nasiopoulos P. Metameric failure assessment and reduction between RGB and laser phosphor projectors. J. Soc. Inf. Display. 2022, 30 (4), 292-308. [CrossRef]
Figure 1.
Images of the 13 frames from early films considered in this paper (see Table 1). We have added the small numbered circles in the frames to indicate the specific regions where spectral transmittances were measured (see main text). The colors in this Figure are only approximate.
Figure 1.
Images of the 13 frames from early films considered in this paper (see Table 1). We have added the small numbered circles in the frames to indicate the specific regions where spectral transmittances were measured (see main text). The colors in this Figure are only approximate.
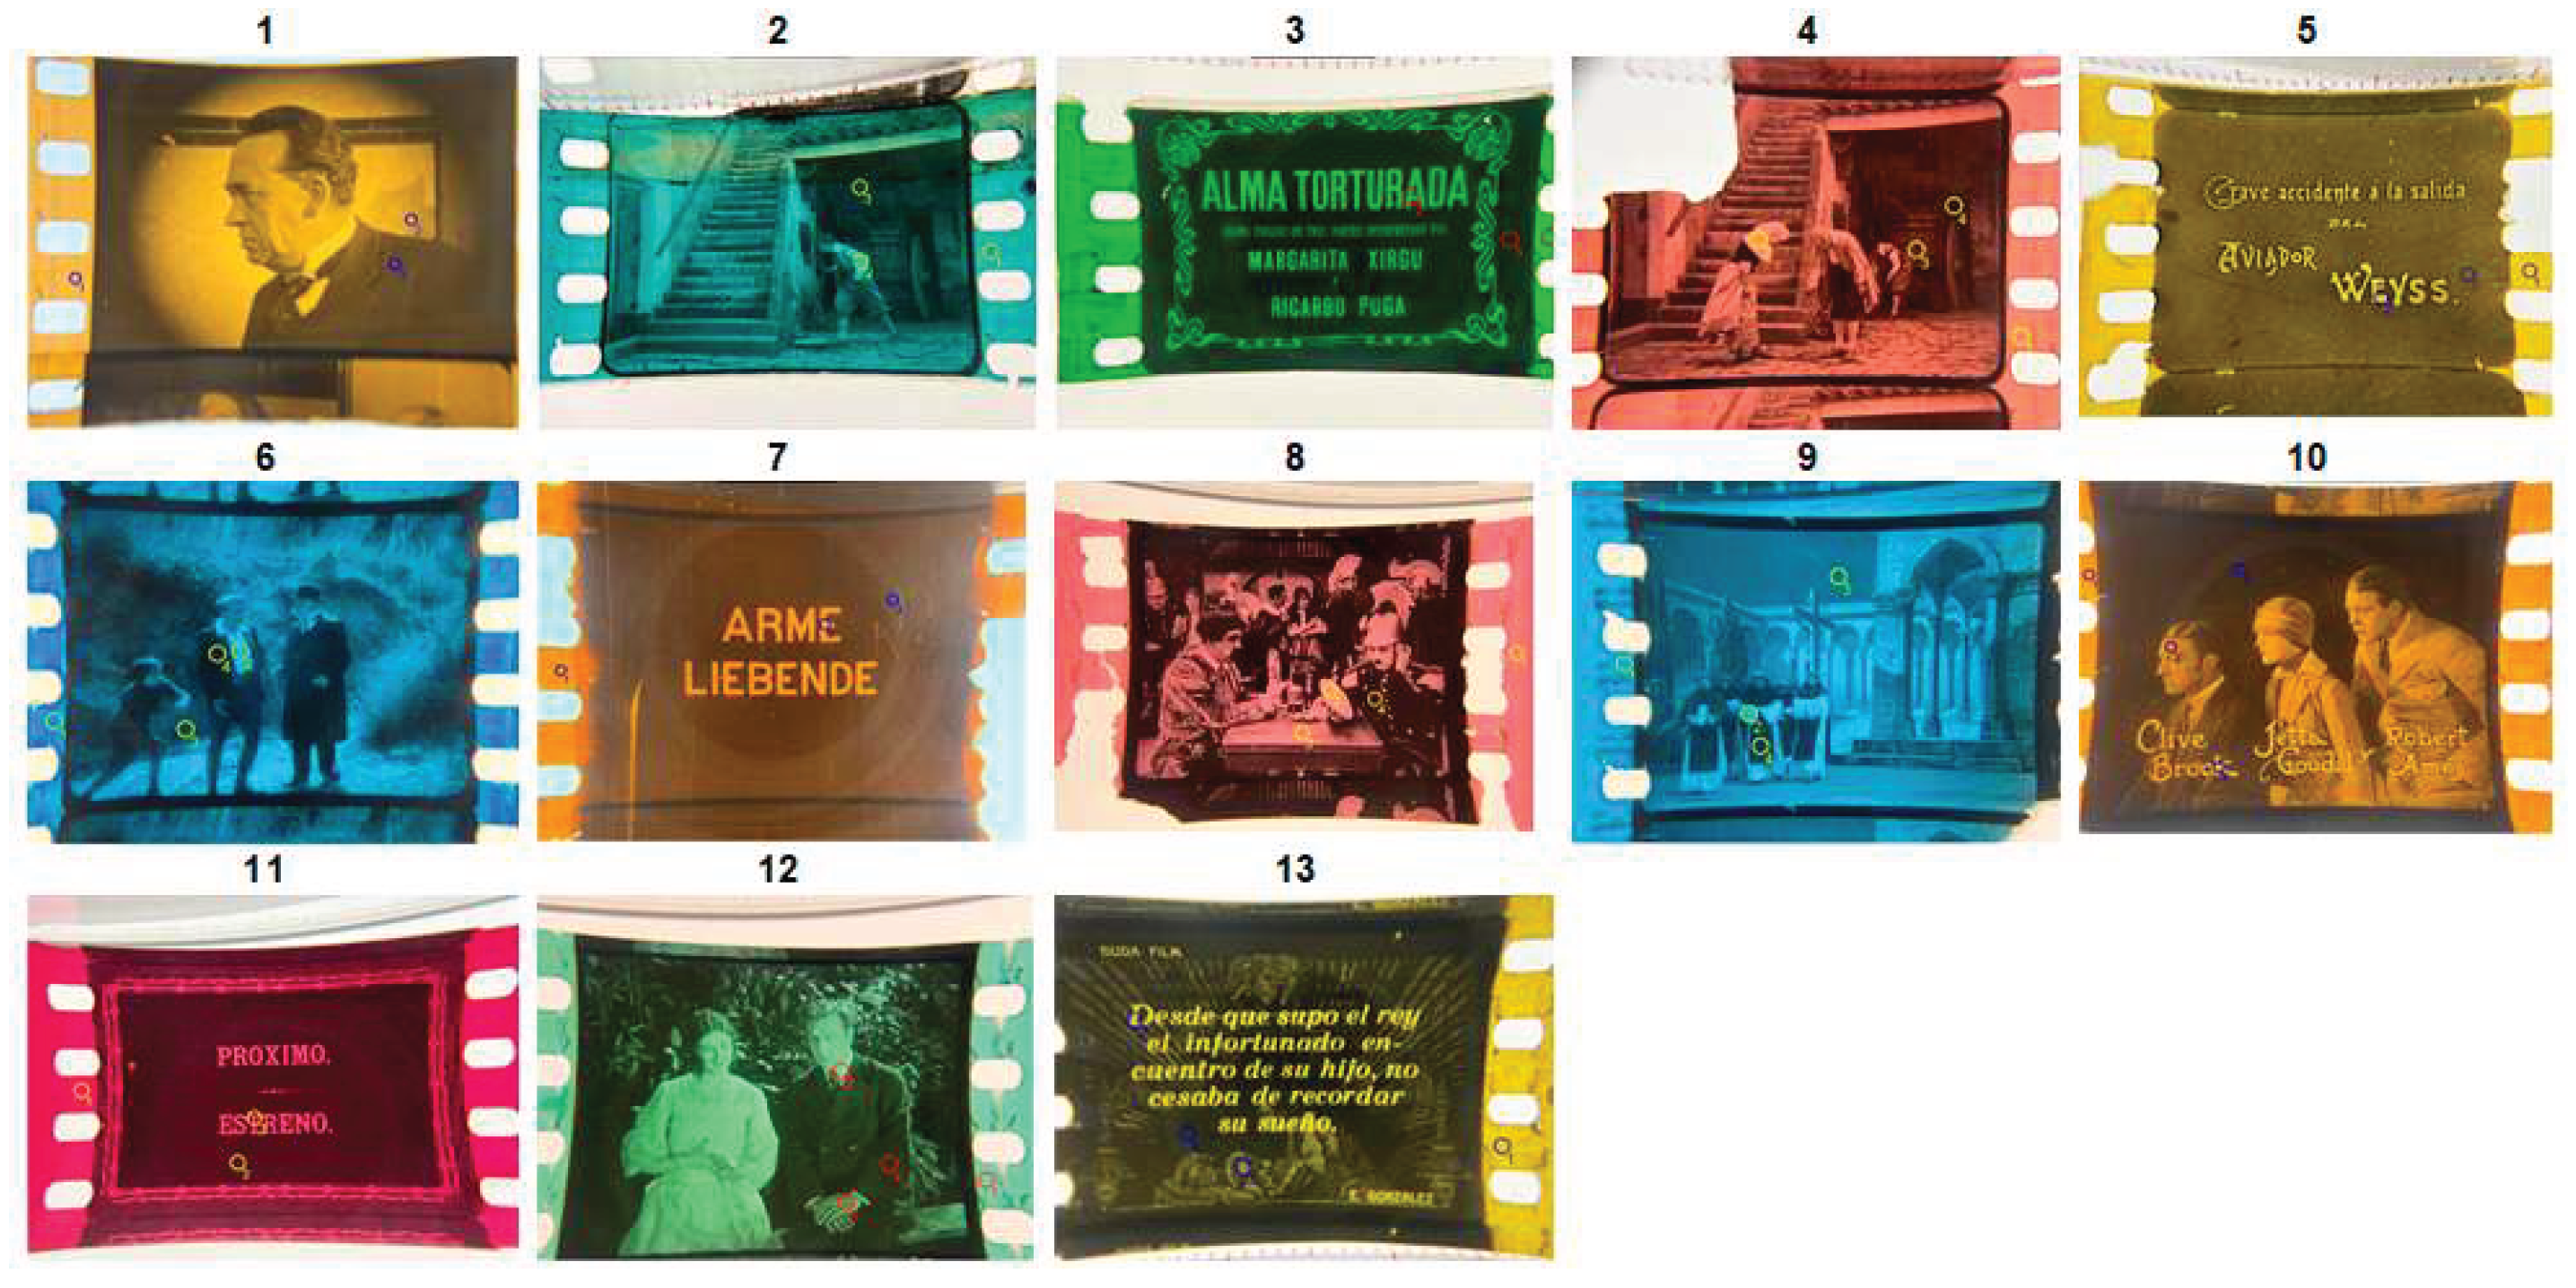
Figure 2.
Top view of the experimental device for the experimental measurement of spectral transmittances (left), with a detail of the frame holder (right). 1. light source; 2. frame holder; 3. beam splitter; 4. head of the SpectraScan®PR-655 spectroradiometer; 5. camera for viewing the specific region of the frame to be measured by the spectroradiometer.
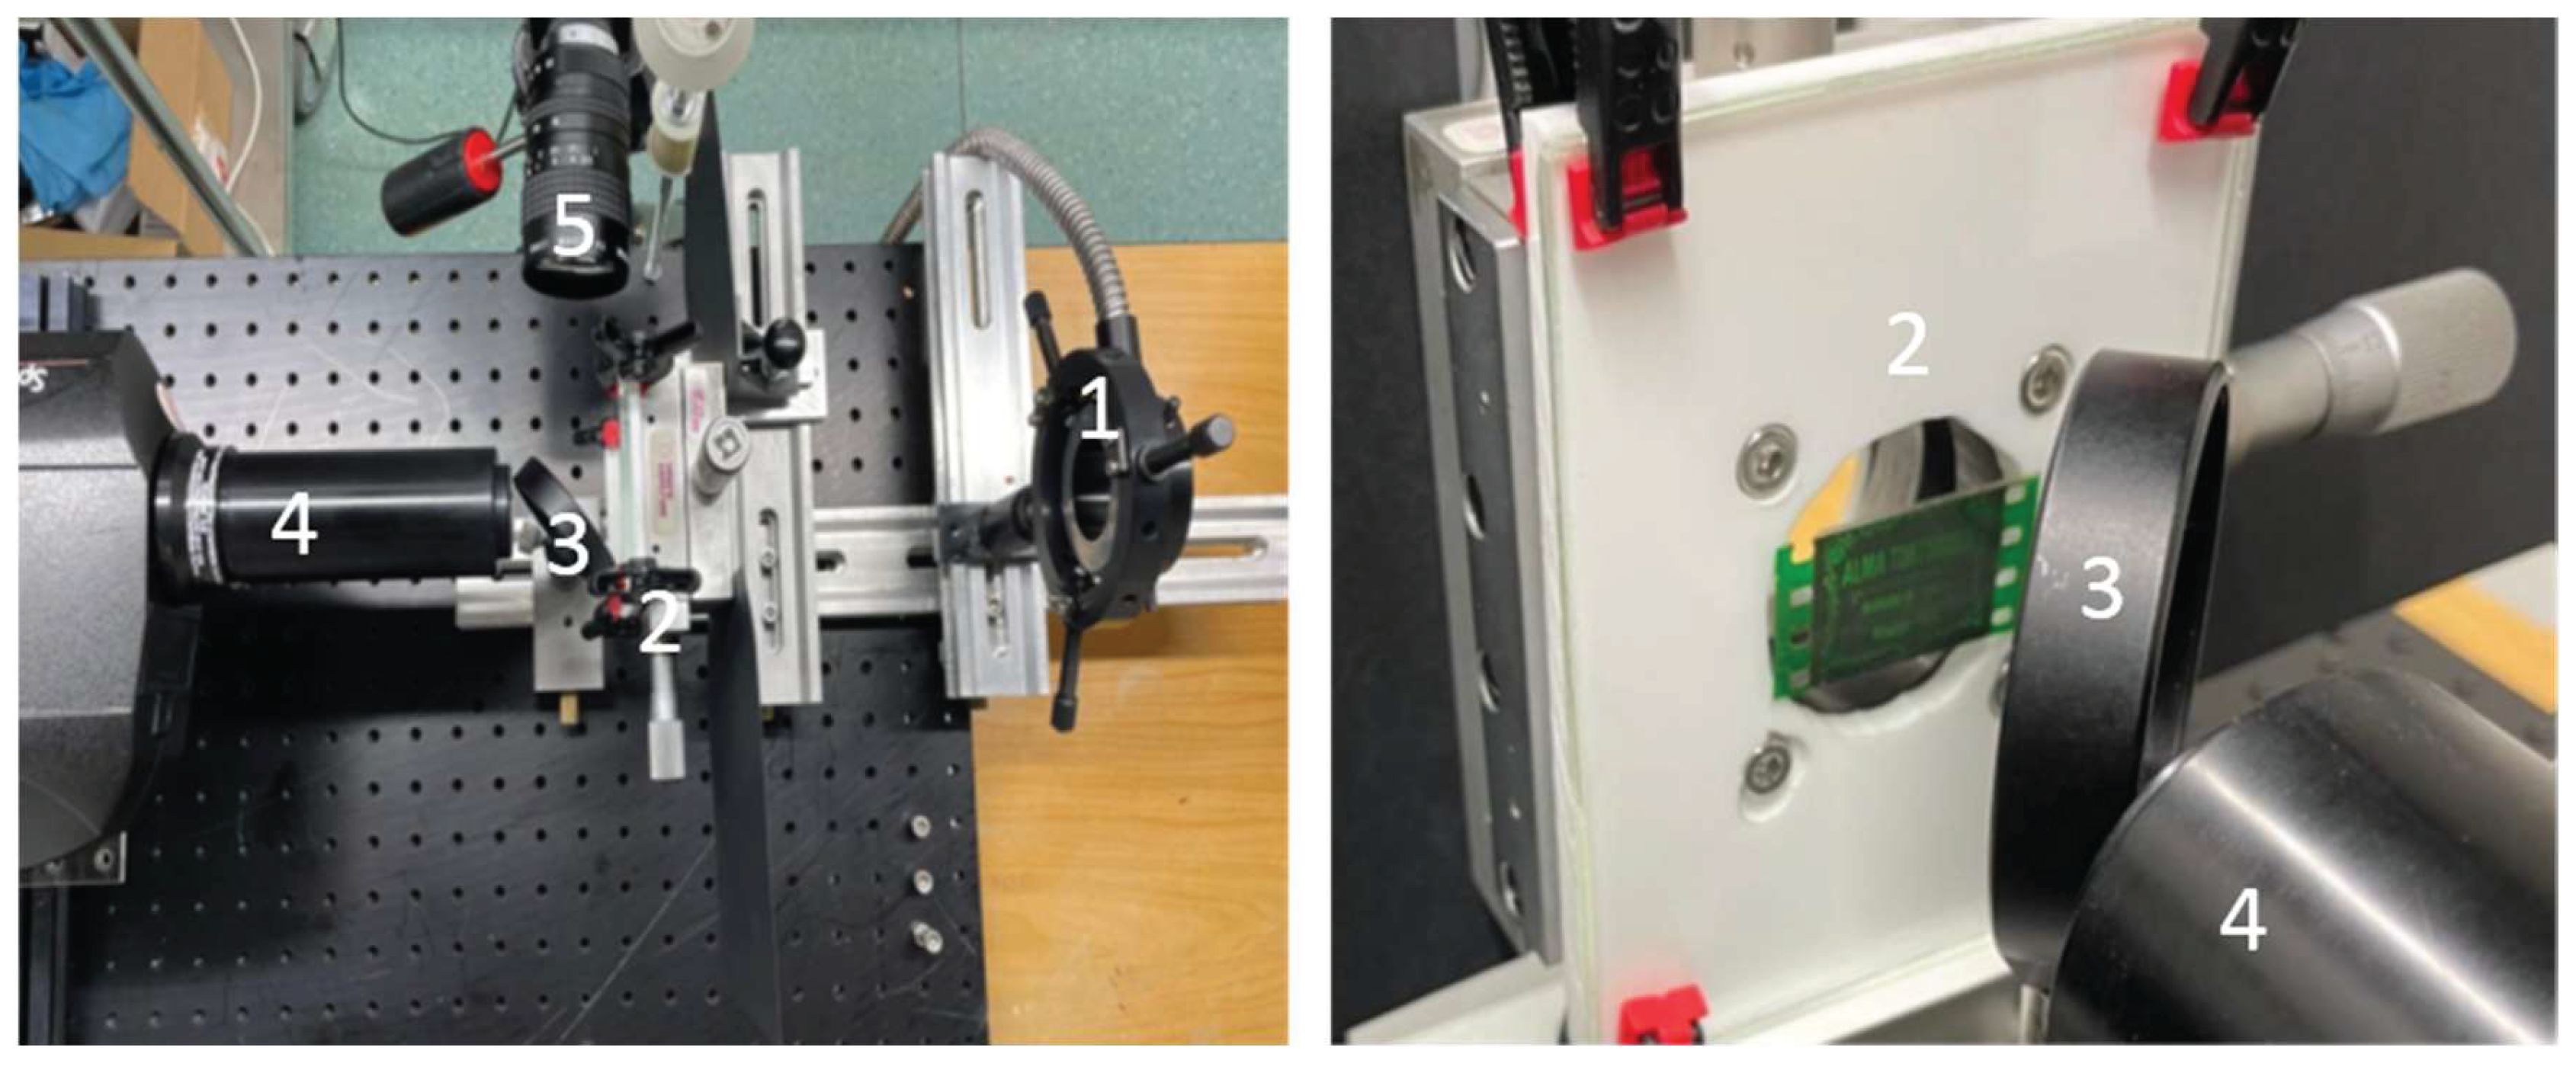
Figure 3.
(A) View of a 35 mm cinema projector manufactured by the Societé des Etablissements Gaumont, 57 Rue Saint Roch, Paris, in 1913; (B) lighting cabinet of the projector; (C) concave mirror and carbon arc emitting light. Images from ‘Museo del Cine Carlos Jiménez’ (Villarejo de Salvanés, Madrid, Spain), https://museodelcine.com/.
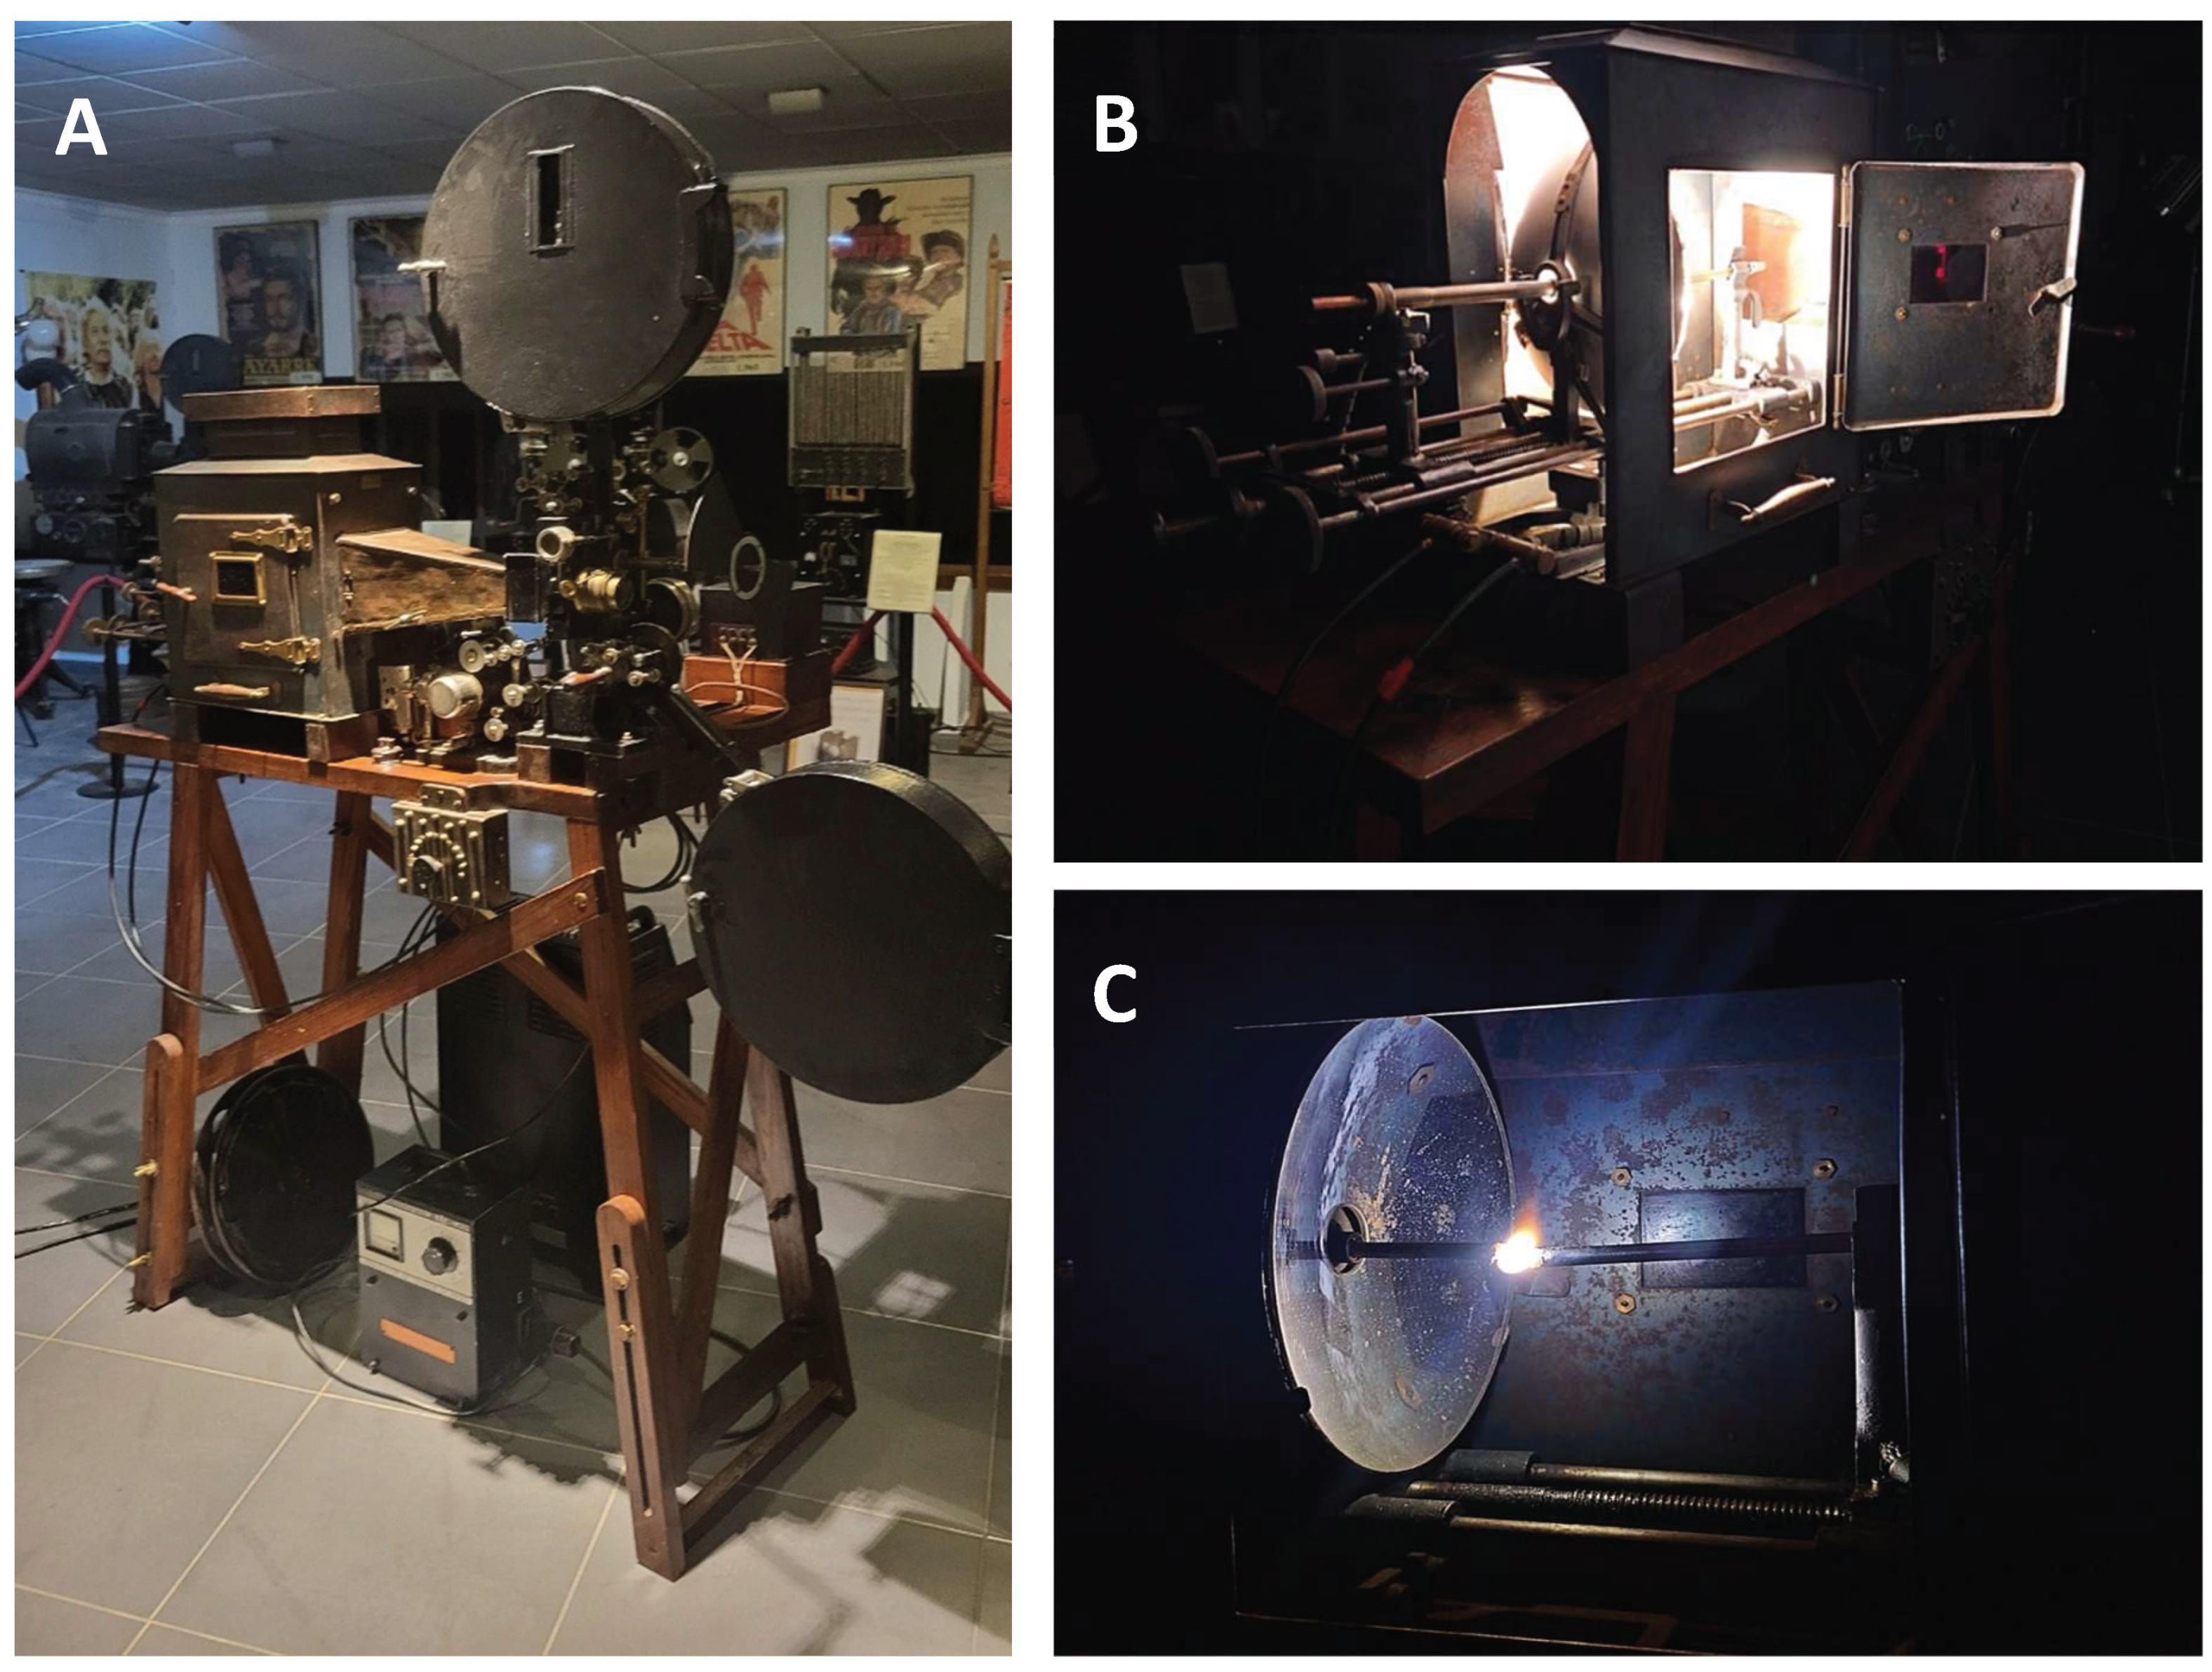
Figure 4.
Relative spectral power distributions (SPDs) for the three light sources considered in this paper, after normalization (Y=100).
Figure 4.
Relative spectral power distributions (SPDs) for the three light sources considered in this paper, after normalization (Y=100).
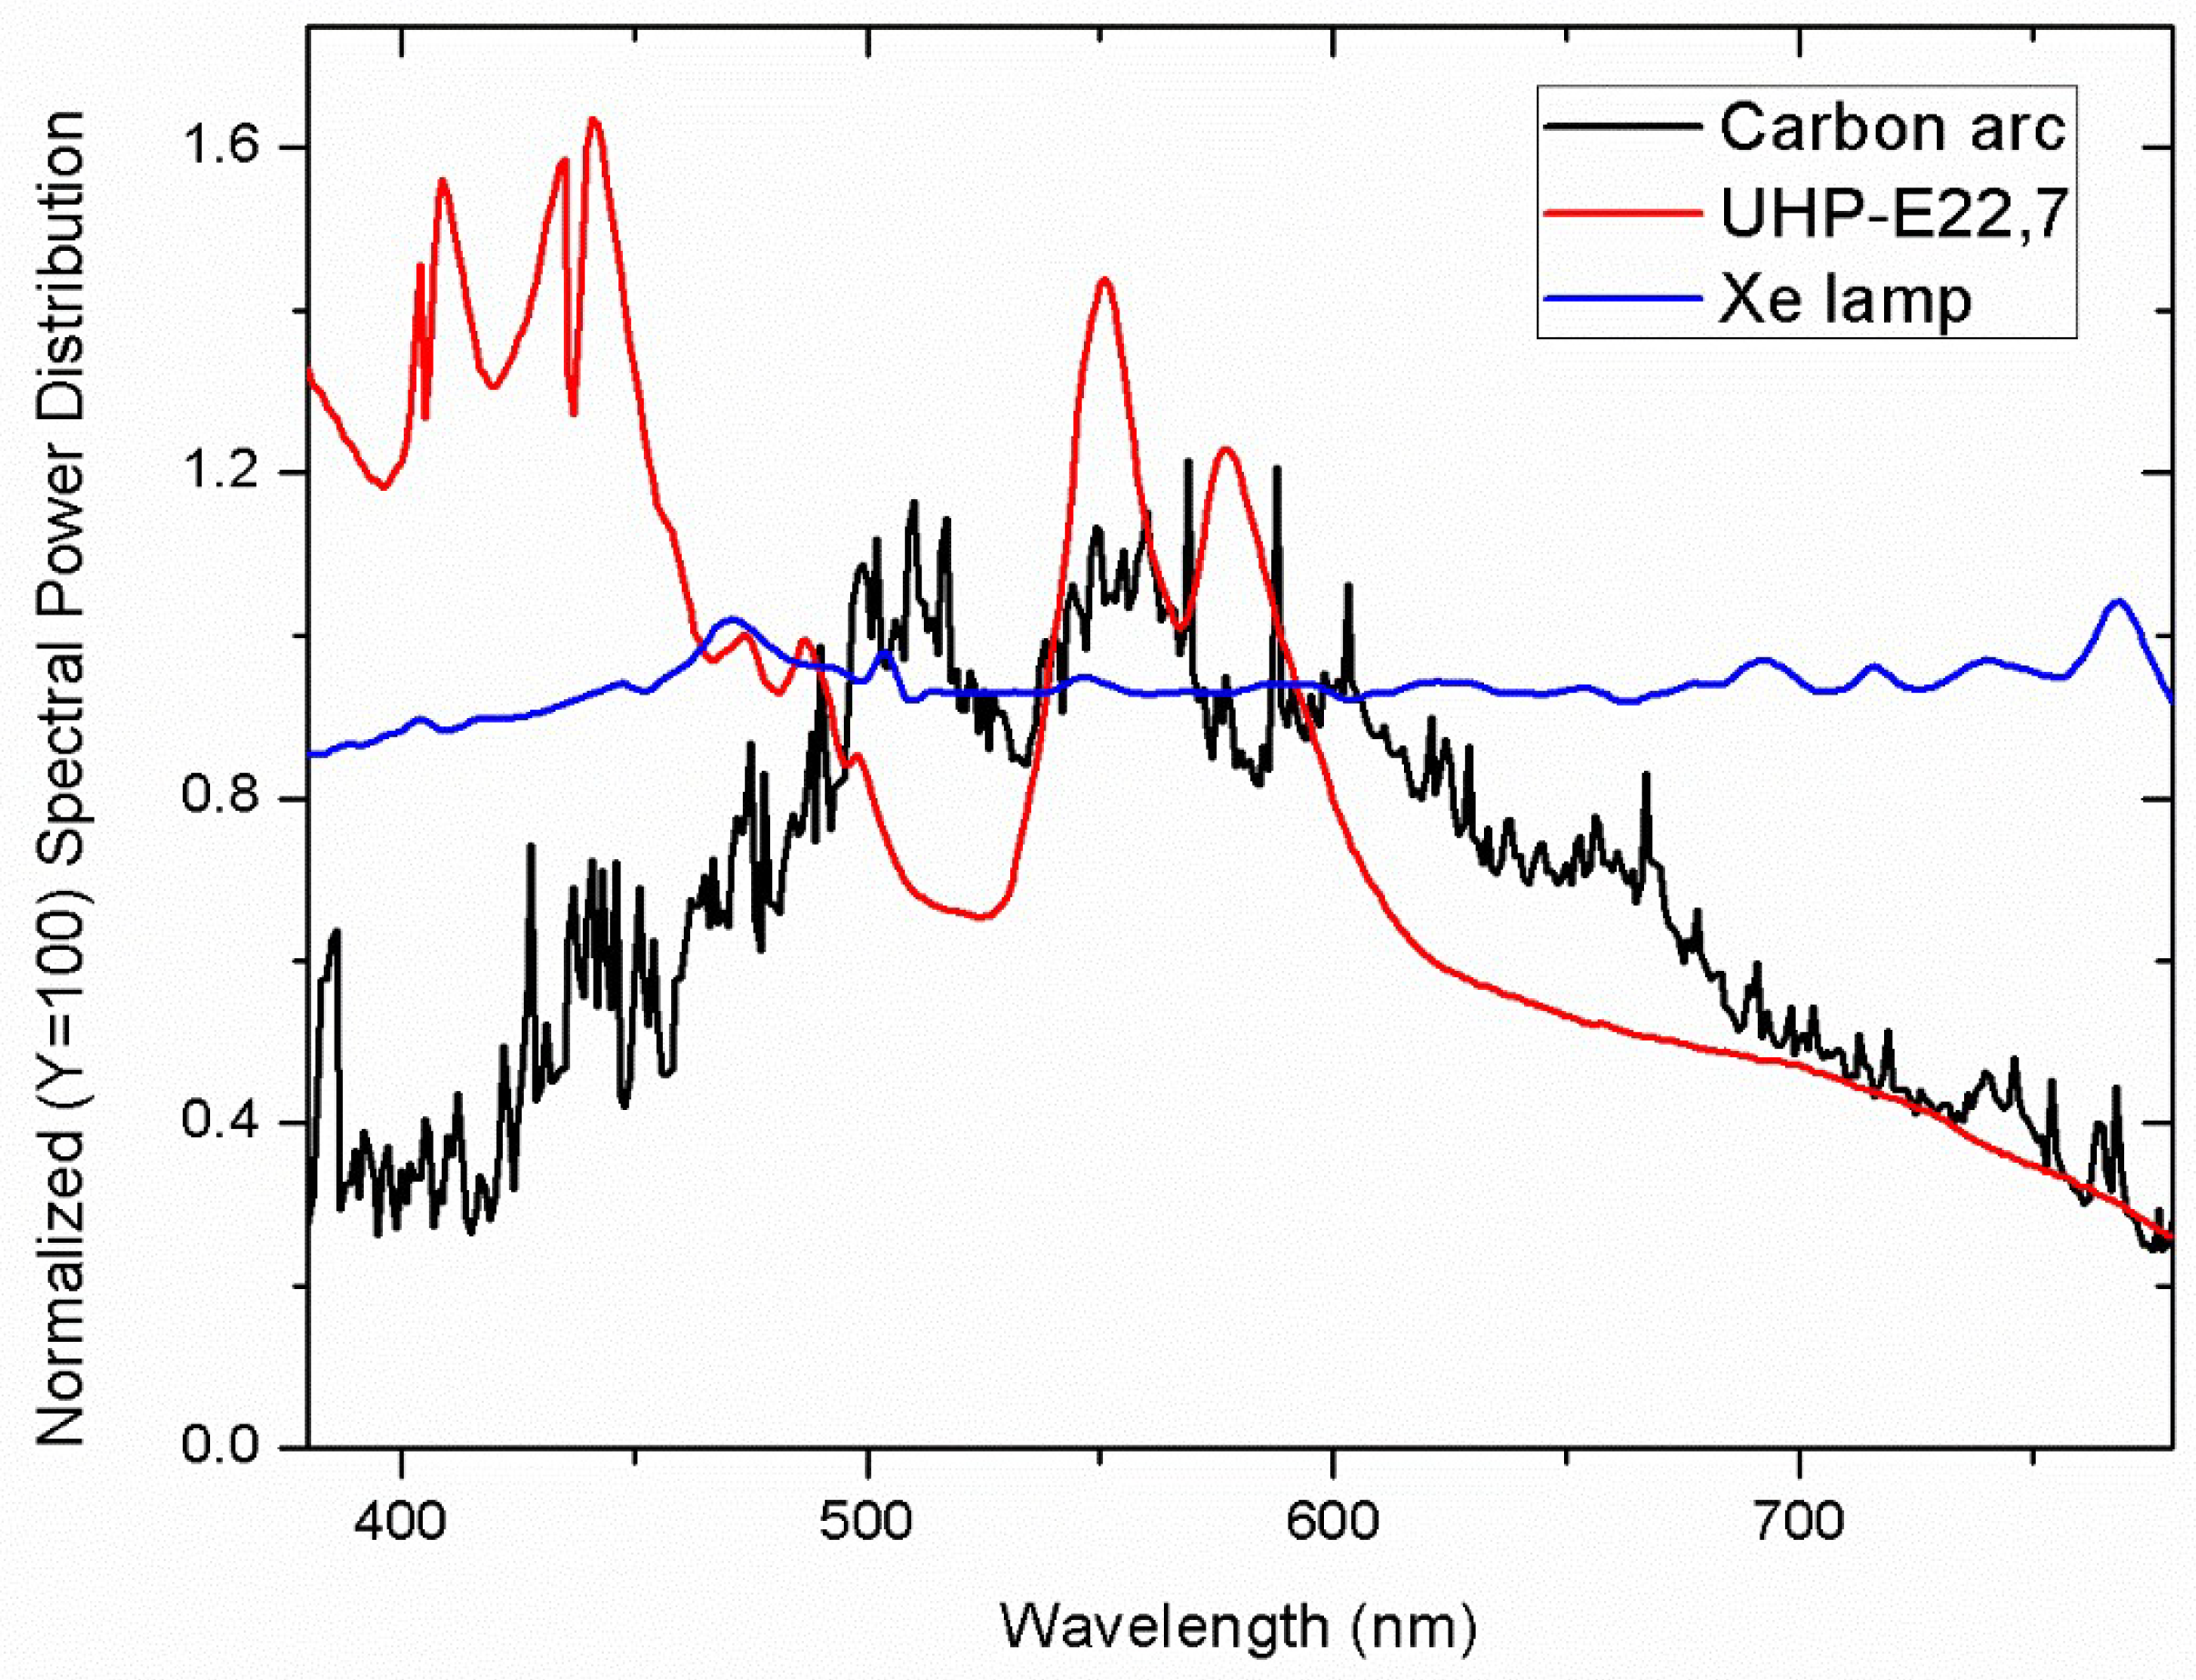
Figure 5.
Spectral transmittances for regions between perforations in the 13 frames. The colors of the curves try to approach those in Figure 1.
Figure 5.
Spectral transmittances for regions between perforations in the 13 frames. The colors of the curves try to approach those in Figure 1.
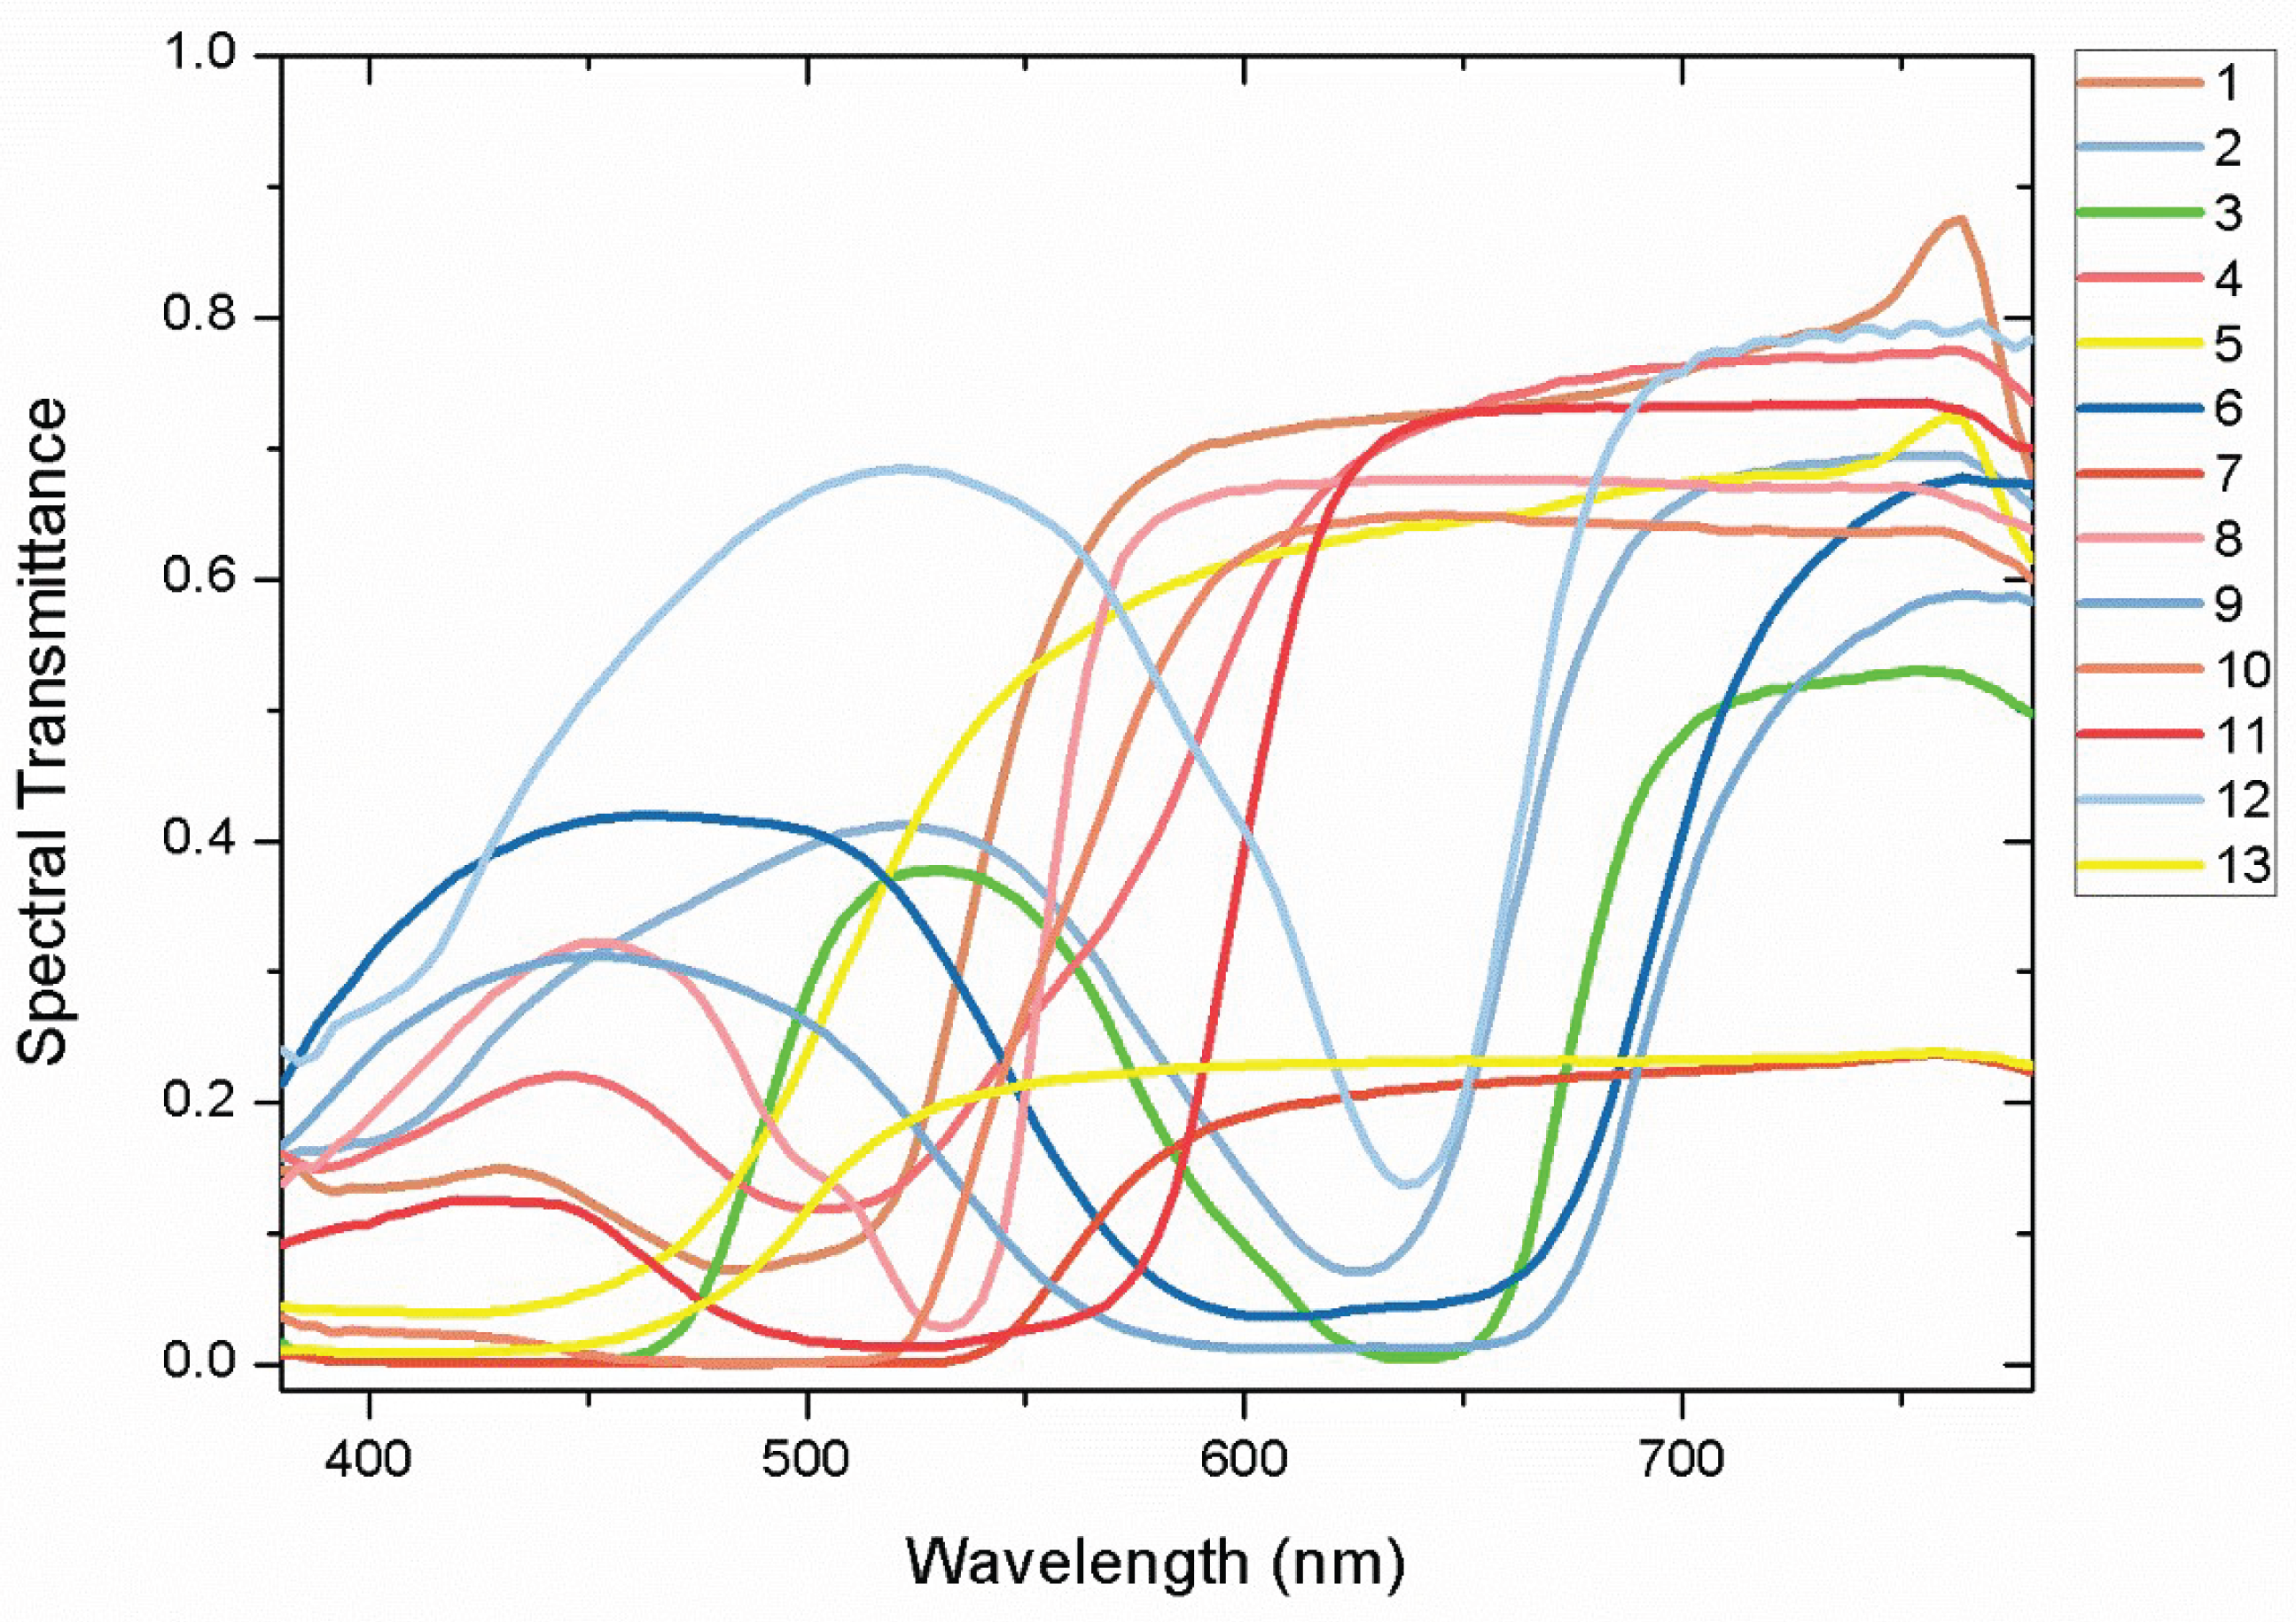
Figure 6.
Color shifts in 46 samples in CIELAB (left column) and (right column) planes, considering the change from carbon arc to Xenon lamp (first row), carbon arc to UHP lamp (second row), and Xenon lamp to UHP lamp (third row). The numbers in some arrows indicate the results for colors in the regions between perforations of the frames in Figure 1 and Figure 5.

Figure 7.
The curves in this plot correspond to the “proposed gamut” of 102,801 surface object colors in CIELAB color space [17], with hue-angles covering ±15°. The dots, colored similarly to the corresponding curves, indicate the colors of the 46 samples (Figure 1) under the carbon arc source.
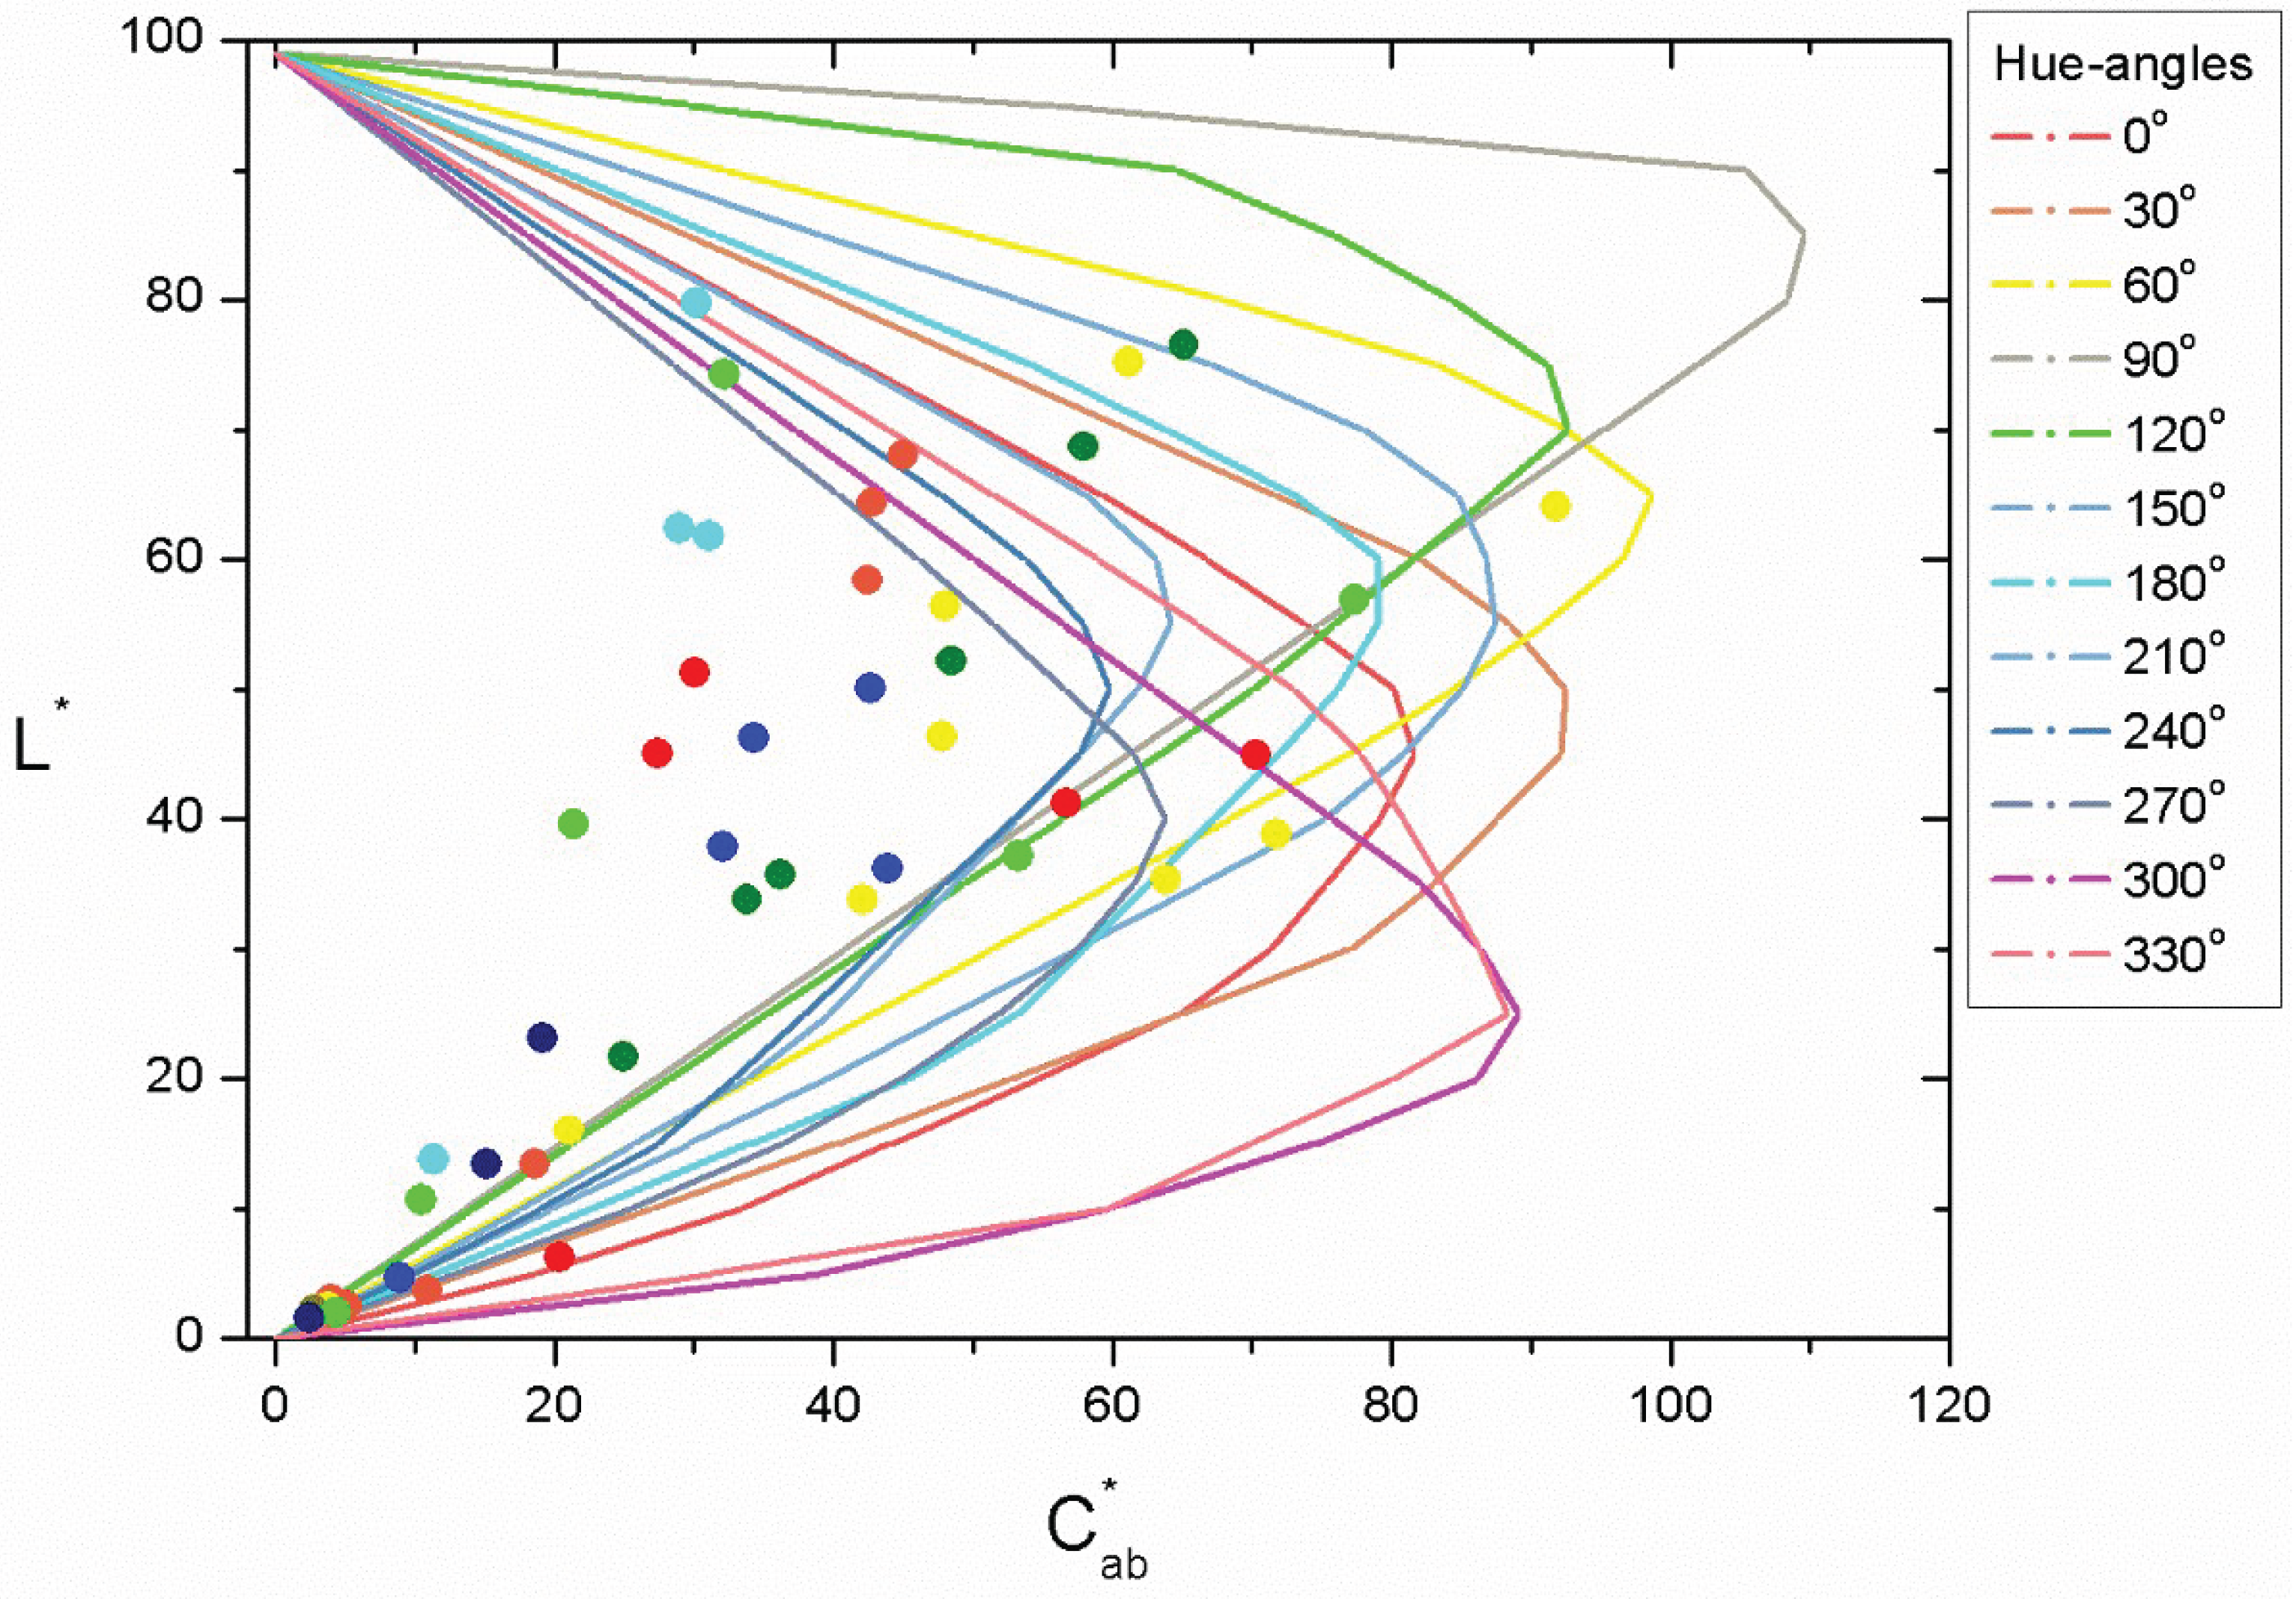

Table 1.
Basic information on the 13 frames from the National Film Archive of Spain considered in the current paper (Figure 1).
Table 1.
Basic information on the 13 frames from the National Film Archive of Spain considered in the current paper (Figure 1).
| # | Title | Year | Producer | Director/s |
|---|---|---|---|---|
| 1 | La terrible lección | 1927 | Comité Ejecutivo Antivenéreo | F. Delgado |
| 2 | El alcalde de Zalamea | 1914 | Barcinógrafo | A. Gual, J. Solá |
| 3 | Alma torturada | 1917 | Barcinógrafo | M. Murià |
| 4 | El alcalde de Zalamea | 1914 | Barcinógrafo | A. Gual, J. Solá |
| 5 | Unknown | 1910-20 | Eladio Royán’s donation | Unknown |
| 6 | Las máscaras negras | 1919 | Studio Films | J. M. Codina |
| 7 | Le pied de mouton | 1908 | Pathé Frères | A. Capellani |
| 8 | A Burlesque on Carmen | 1915 | Essanay Film Manufacturing Co. | C. Chaplin |
| 9 | Las máscaras negras | 1919 | Studio Films | J. M. Codina |
| 10 | Three Faces East | 1926 | Cinema Corporation of America | R. Julian |
| 11 | Unknown | 1910-20 | Eladio Royán’s donation | Unknown |
| 12 | Unknown | 1910-20 | Eladio Royán’s donation | Unknown |
| 13 | Unknown | 1910-20 | Eladio Royán’s donation | Unknown |
Table 2.
Basic information for the three light sources considered (Figure 4).
Table 2.
Basic information for the three light sources considered (Figure 4).
| Light sources | CCT (K) | X | ||||
|---|---|---|---|---|---|---|
| Carbon arc | 4917 | +0.0168 | 93.0 | 89.58 | 100.00 | 65.25 |
| Xe lamp | 5639 | -0.0044 | 97.0 | 99.87 | 100.00 | 101.00 |
| UHP lamp | 7584 | -0.0044 | 81.1 | 99.40 | 100.00 | 130.66 |
Table 3.
Average and standard deviation (S.D.) of CIELAB color differences and their percentage components (lightness, chroma, and hue) for the 46 samples under three pairs of light sources.
Table 3.
Average and standard deviation (S.D.) of CIELAB color differences and their percentage components (lightness, chroma, and hue) for the 46 samples under three pairs of light sources.
| Pairs of light sources | (Average ± S.D.) | |||
|---|---|---|---|---|
| Carbon arc - Xe lamp | 2.4 ± 2.4 | 4 | 88 | 8 |
| Carbon arc - UHP | 6.8 ± 4.6 | 1 | 46 | 53 |
| Xe lamp - UHP | 6.5 ± 3.9 | 1 | 45 | 54 |
Disclaimer/Publisher’s Note: The statements, opinions and data contained in all publications are solely those of the individual author(s) and contributor(s) and not of MDPI and/or the editor(s). MDPI and/or the editor(s) disclaim responsibility for any injury to people or property resulting from any ideas, methods, instructions or products referred to in the content. |
© 2025 by the authors. Licensee MDPI, Basel, Switzerland. This article is an open access article distributed under the terms and conditions of the Creative Commons Attribution (CC BY) license (http://creativecommons.org/licenses/by/4.0/).
Copyright: This open access article is published under a Creative Commons CC BY 4.0 license, which permit the free download, distribution, and reuse, provided that the author and preprint are cited in any reuse.


