Submitted:
20 October 2025
Posted:
22 October 2025
You are already at the latest version
Abstract
Rapid urbanization in developing megacities like Lagos, Nigeria has led to surging waste generation and overstretched collection systems. Inefficient routes, traffic congestion, and infrastructure deficits undermine timely waste collection, resulting in excessive vehicle mileage, high fuel costs, and environmental pollution. This study models an optimized waste collection network for Lagos’ Lekki-Epe region by introducing a strategically located waste transfer station and optimized routing. The Authors in this paper collected and analyzed eight months of waste vehicle movement data from Lagos and developed a simulation using Visual Basic for Applications and the Google Maps API to compare scenarios with and without a transfer station. Four scenarios were tested, examining factors such as a 20-minute route delay threshold, increased transfer truck capacity, and off-peak collection timing. The optimal transfer station location was found to be approximately 45 km along the Lekki-Epe corridor from the landfill, which reduced total collection vehicle travel time by about 42.6%. This corresponds to an annual reduction of roughly 363,283 km in travel distance, yielding an estimated decrease of approximately 653.9 tonnes of CO₂ emissions per year. Cost-wise, the coordinated use of a transfer station is projected to lower fuel use and vehicle wear, translating into significant operational savings for private waste contractors. Introducing a transfer station could also modestly reduce urban traffic congestion by removing many refuse trucks from long-haul routes. The implementation of optimally placed transfer stations combined with route optimization can substantially improve collection efficiency, lower greenhouse gas emissions, and reduce costs in Lagos waste management system. These findings provide a model for other rapidly urbanizing cities seeking sustainable waste infrastructure improvements.Keywords: Municipal solid waste (MSW); Transfer station siting; Routing optimization; Google Maps Directions API; Excel VBA simulation; Travel time and distance reduction; greenhouse gas emissions; Operational cost savings; Public–private partnerships (PSP).
Keywords:
Municipal solid waste (MSW)
; transfer station siting
; routing optimization
; google maps directions API
; Excel VBA simulation
; travel time and distance reduction
; greenhouse gas emissions
; operational cost savings
; public–private partnerships (PSP)
1. Introduction
Municipal solid waste management is a critical challenge for rapidly growing cities in the developing world. As urban populations expand and living standards rise, waste generation increases exponentially (Kaza et al., 2018). Lagos, the largest city in Nigeria with over 20 million residents, exemplifies this crisis. It produces an estimated 13,000 tonnes of solid waste per day, yet struggles with inadequate waste collection and disposal infrastructure. The current system relies on a limited number of distant landfills and an uncoordinated fleet of collection trucks, leading to inefficient routes and excessive travel times. Vehicles often spend hours in traffic to reach dumpsites, causing high fuel consumption, frequent breakdowns, and delays in service. These inefficiencies exacerbate environmental pollution (through vehicle emissions and illegal dumping) and public health risks in Lagos’ dense urban areas (Lagos State Government, 2017; Agboje et al., 2014).
Past reforms in Lagos, including public-private partnerships with Private Sector Participants (PSPs) for waste collection, have yielded only modest improvements in operational performance. High operating costs, traffic congestion, and lack of transfer facilities continue to hinder efficient waste transport (Aliu et al., 2014; Agboje et al., 2014). Transfer stations, which are intermediary facilities where smaller collection trucks offload waste to larger long-haul trucks, are a proven strategy in developed countries to improve efficiency and reduce costs (Guerrero, Maas & Hogland, 2013; Ahmed & Ali, 2006). By consolidating loads and shortening collection routes, transfer stations can cut total driving distance, fuel usage, and turnaround time. They also reduce wear on city streets and vehicles, and minimize greenhouse gas (GHG) emissions from waste transport (Forouhar & Hristovski, 2012; Li et al., 2011). However, this approach has not been systematically applied in Lagos or similar Sub-Saharan African cities, where data on waste flows and routing remain scarce.
Research Aim: This paper explores how introducing a strategically located transfer station and optimized routing model would impact waste collection efficiency, vehicle travel distances, CO₂ emissions, and costs in Lagos. The Study focused on the Lekki-Epe axis – a rapidly developing region with numerous Waste Collection Zones (WCZs) served by the Epe landfill – as a case study. The goal is to determine if a transfer station can significantly reduce the total distance and time that collection trucks travel, thereby lowering emissions and operational costs. Building on literature that shows optimized transfer station placement can reduce transport routes by up to 20% (Zhou et al., 2017) and GHG emissions by about 30% (Saharidis et al., 2018), the study developed a simulation model tailored to Lagos conditions. By testing multiple scenarios (varying route rules, vehicle capacities, and timing), it seek to identify the optimal strategy that balances efficiency gains with practical constraints. This study contributes a data-driven analysis to guide infrastructure planning for Lagos waste management, demonstrating how modern routing models and transfer station integration could alleviate urban waste transport challenges. It offers insights applicable to other megacities in developing regions facing similar waste logistics issues.
2. Methods
2.1. Study Area and Data Collection
The study area covers the Lekki-Epe region of Lagos, a long corridor served by the Epe landfill. The study first identified Waste Collection Zones (WCZs) in this region based on Lagos Waste Management Authority (LAWMA) records and its derived field data. A total of 29 WCZs were delineated across the Lekki-Epe axis, representing distinct neighborhoods or districts from Lagos Island in the west to Epe in the far east. Each WCZ generates waste collected by PSP operators and transported either directly to the Epe landfill or potentially to a future transfer station. Figure 1 illustrates the layout of the study area, including the locations of the 29 WCZs and the road network along which a transfer station might be sited.
Over an eight-month period (late 2018 to early 2019), detailed records of waste truck movements into Epe landfill were collected. These data included the origin WCZ of each incoming load, the date/time of arrival, and the quantity of waste. Analysis of this dataset revealed that after a temporary spike due to other landfill closures, the Epe landfill received a steady average of 1085 vehicle trips per month from the Lekki-Epe region. Table 1 below summarizes the average number of trips per month originating from each WCZ (the trip frequency reflects both population density and commercial activity in each zone). Notably, Ajah and Victoria Island (VI) zones had the highest collection truck trips per month, indicating large waste volumes and long haul distances, whereas remote areas like the Dangote Refinery and Akodo had minimal trips. This baseline underscores the burden placed on PSP trucks serving far-flung zones – e.g. Lagos Island is 60 km from Epe landfill, meaning a single round-trip can take several hours in traffic.
This baseline confirms that a large volume of waste collection traffic is traveling long distances to the landfill. The Authors of the study hypothesized that inserting a transfer station along the route would allow many trucks to offload closer to their collection zones, significantly cutting travel distance and time.
2.2. Transfer Station Scenarios
The study evaluated the feasibility and impact of a transfer station by considering 14 potential sites along the Lekki-Epe Expressway, labeled TS-1 through TS-14. These candidate locations were spaced approximately 5 km apart along the corridor, covering a range from close to the Epe landfill (TS-1 at 0 km from landfill) to the far west near Lagos Island (TS-14 at ~65 km from landfill). A 5 km spacing was chosen as a balance between resolution and manageability – a finer grid (e.g. 1 km intervals) would greatly increase computational complexity with diminishing returns in precision. In practice, transfer stations in urban planning are often sited a few kilometers apart to efficiently cover large service areas without unnecessary redundancy. The spacing also reflects that any actual facility would need a viable parcel of land slightly off the main road, rather than exactly on every possible kilometer mark. Figure 2 illustrates the concept: potential transfer station sites (TS1–TS14) are marked along the highway at 5 km intervals, providing options for the model to evaluate.
Using these locations, several simulation scenarios was formulated to model different operational strategies:
- Baseline (No Transfer Station): All collection trucks haul waste directly to Epe landfill (current state). Total travel time and distance for this case establishes the benchmark (in the study data, 2115 hours/month of truck travel, corresponding to 101,439 km/month across all vehicles).
- Scenario 1 – Nearest Facility: A transfer station is introduced. Rule: Each collection truck (refuse collection vehicle, RCV) will tip its load at the transfer station if that station is closer (in travel time) than driving to the landfill; otherwise it continues to the landfill. At the transfer station, waste is consolidated into larger trucks for transport to Epe landfill. A simulation was done for each candidate TS location (0 km, 5 km, 10 km, … 65 km from Epe) and identify which placement yields minimal total travel time for the whole system. This scenario assumes transfer station operations incur negligible extra delay beyond travel times.
- Scenario 2 – 20-Minute Delay Threshold: This scenario refines Scenario 1 by recognizing that even if a transfer station is slightly closer in distance, using it might incur some processing delay (queueing, loading) compared to direct landfill tipping. The Authors of this study model a rule where if the travel time to the transfer station is not at least 20 minutes faster than going to the landfill, the truck will bypass the station and go directly to Epe. In other words, the transfer station is used only when it offers a significant time savings (>20 min) over the direct route. This aims to prevent unnecessary stops at the transfer station for marginal gains. The Authors then chose 20 minutes as a reasonable buffer to reflect potential waiting/turnaround time at a transfer facility.
- Scenario 3 – Increased Transfer Truck Capacity: Building on Scenario 2’s 20-minute rule, the study examines the effect of using larger-capacity haul trucks from the transfer station to the landfill. The standard assumption was a 30-tonne payload for transfer trailers, but Nigeria’s regulations allow heavier trucks (up to about 50 tonnes GVW) on highways (Oyekanmi and Ejem, 2022). The study simulated an upgraded capacity of 35 tonnes per transfer load to see if fewer trips to the landfill (due to larger loads) yield additional efficiency. This scenario tests a practical consideration: deploying larger trucks can reduce the number of long-haul trips, but only if local infrastructure (roads, transfer station design) can handle them.
- Scenario 4 – Evening Operations: This scenario returns to the base assumptions (30-tonne trucks, no delay threshold as in Scenario 1) but changes the time of day of waste transport. Instead of assuming collections occur in the daytime peak traffic hours, the study simulated all routes with travel times representative of an off-peak evening period (The study used 18:00 as a proxy input to Google’s traffic model). The question is whether running collection and transfer at night (when roads are less congested) significantly alters optimal routing or travel times. In many cities, night-time waste collection is faster due to low traffic, so this scenario checks if a transfer station is as beneficial under those conditions.
For each scenario and each potential transfer station position (0 to 65 km from landfill), the model computes the total hours of travel for all refuse collection vehicles and, where applicable, the additional travel by transfer trucks. The optimal placement is identified by the minimum total system travel time. It is expected that as the transfer station moves farther from the landfill (and closer to the dense urban zones), total travel time will first decrease (since more trucks have shorter trips) and then eventually increase if the station is placed too far (causing even the nearer zones to drive longer to reach it). This trade-off forms a U-shaped curve of travel time versus station location distance.
Key outputs measured for each scenario include: (1) total RCV hours per month, (2) total transfer truck hours (if any), (3) combined total hours and the percentage reduction compared to the baseline, (4) the number of RCV trips routed to the transfer station vs directly to landfill, and (5) the aggregate distance traveled by all vehicles. The study also estimated fuel and emission impacts by converting time savings to distance and then to CO₂ equivalents, using standard emission factors (discussed later under Environmental context).
2.3. Simulation Model Implementation
The study developed a custom simulation model in Microsoft Excel VBA (Visual Basic for Applications), integrating with the Google Maps Directions API for real-time travel data. This allowed the authors of this study to automate the retrieval of driving time and distance between numerous origin-destination pairs. The model operates in two main stages:
- Time-of-Travel Matrix Calculation: Using the Google Directions API, the study computed the round-trip travel time for a collection truck from each WCZ to either the landfill or a given transfer station. Each WCZ was represented by a central coordinate (centroid) – effectively a representative location within that zone. For each WCZ and each candidate TS location, the API provided the driving time (in seconds) from the WCZ centroid to the TS (and back), and similarly to the landfill. This produced a matrix of travel times (Table 2) with dimensions [29 WCZs × 14 TS locations], plus the direct-to-landfill time as the 0 km case. The study also separately recorded the travel time from each TS location to the landfill (Table 3). These matrices form the inputs for the simulation stage. (Note:) The study made API calls during both morning and evening to capture Scenario 4 differences. To ensure accuracy, all locations (WCZ centroids, TS sites, landfill) were geocoded by their latitude/longitude coordinates in the API queries.
- Monthly Route Simulation: With the travel time matrix prepared, the simulation function then allocated waste trips to routes over a notional one-month period. For each WCZ’s average trips per month (from Table 1), the model applied the scenario rules to decide how many of those trips would go to landfill directly vs to the transfer station. In Scenario 1, for example, all trips from a given WCZ would go via whichever option (TS or landfill) had the shorter one-way time for that WCZ. In Scenario 2, a trip would only go via TS if that saved >20 min over landfill; otherwise it was counted as a direct landfill trip. These decisions effectively partition the total trips of each WCZ between two route types. The total RCV travel time per month is then computed by summing (trips via landfill × landfill round-trip time) + (trips via TS × TS round-trip time). If a TS is used, the study then calculate how many transfer trailer trips to landfill result from those RCV deliveries. For each TS position tested, the monthly waste volume routed through the station is known (e.g. if 800 out of 1085 trips use the TS, and each RCV carries 10.6 tonnes on average, that volume is aggregated). It was assumed that a fully loaded transfer truck can carry 30 tonnes (or 35 tonnes in Scenario 3). The model divides the total TS waste volume by the truck capacity to determine the number of outbound hauls to landfill. The transfer haul time is simply the TS-to-landfill travel time (from Table 3) multiplied by round trips and trips per month. Finally, the model adds the transfer haul time to the RCV time to get combined total system travel time for that scenario and TS location. This entire simulation is repeated for each potential TS location (0 km, 5 km, ..., 65 km), and the output is a set of total times (and distances) for each.
The Authors of the study then coded the above logic into a VBA macro that loops through WCZs and station locations, making API calls and performing the routing calculations. The use of Excel/VBA provided a transparent way to store input data (zones, distances, times) and review outputs in tables and charts. While modern programming languages or GIS tools could also be used, VBA was sufficient and allowed easy linking of results to the study collected data spreadsheets. An excerpt of the algorithm structure is illustrated in Figure 3, which provides a flowchart of the simulation process – from querying travel times to summing monthly route totals under scenario rules.
Assumptions: A few assumptions were made to simplify the modelling: (1) Each WCZ’s waste is collected uniformly over the month (the spatial distribution within a zone is not modelled in detail, just one centroid per zone). (2) All collection trucks (RCVs) are homogeneous in capacity (10 tonnes per load on average based on landfill data) and all transfer haul trucks are homogeneous (30 or 35 tonne capacity). (3) The transfer station, if used, has sufficient capacity to handle incoming waste without long queues (aside from the generic 20-minute threshold in Scenario 2, no explicit modelling of on-site delay was done). (4) Road conditions and traffic patterns are adequately captured by Google’s API for the representative times chosen (morning peak vs evening). (5) The environmental impact (fuel use, emissions) is directly proportional to distance traveled, using published emission factors for heavy vehicles. These assumptions are reasonable for a high-level optimization study, though in practice additional factors like varying truck speeds, driver behavior, or station unloading rates could further influence outcomes.
2.4. Validation
To ensure the model’s validity, there was a cross-checking of its outputs in limiting cases: For Scenario 1 with TS at 0 km (essentially at the landfill), the model should route everything to the landfill, reproducing the baseline travel time. It did (e.g. 2115 hours/month as expected). For TS at extreme distance (65 km, near Lagos Island), the model routed nearly all zones to the TS (since it’s close to the city) and only the far-east zones like Epe town directly to landfill, which gave a travel time slightly higher than the optimal due to over-extension. Intermediate distances produced a clear minimum total time around 45 km from landfill, which was detailed in the Results. The continuity and smooth change in results across TS positions gave confidence that the simulation logic was working consistently. Additionally, sample route times from the API (e.g. Lagos Island to Epe vs to a mid-point) were manually verified on Google Maps to ensure accuracy. All references used for input data and assumptions (e.g. truck emission factors, legal weights) are cited in the relevant sections.
3. Results
3.1. Optimal Transfer Station Location and Travel Time Reduction
Across all scenarios, the simulations consistently identified an optimal zone for transfer station placement around the 40–50 km mark from Epe landfill. This corresponds geographically to the vicinity of Abijo or Lakowe along the Lekki-Epe Expressway – roughly the midpoint between the farthest collection areas in Lagos metropolis and the Epe disposal site. Table 2 provides a summary of the total travel time outcomes for Scenarios 1–4 at the optimal position (45 km from landfill) versus the no-transfer baseline.
In the Baseline, RCVs collectively spent about 2115 hours per month (roughly 70.5 hours per day in total) traveling to and from Epe landfill. This is the equivalent of several dozen trucks each being on the road for many hours daily just for waste hauling. With a transfer station at the optimal 45 km point under Scenario 1, the model shows total RCV travel dropping to 1087 hours, plus about 219.8 hours by transfer trailers ferrying consolidated waste to the landfill, summing to 1306.8 hours. This is a 38.2% reduction in combined travel time relative to baseline. The optimum occurs at 45 km because nearer to the city, more distant WCZs benefit, but if the station is too close to Lagos (beyond 50 km), even intermediate zones start incurring extra distance to loop back to the station. The study’s result that 45 km is best means essentially a location in the Lekki corridor that equally balances the incoming and outgoing hauls.
In Scenario 2, applying the 20-minute delay rule slightly changed the dynamics: a few zone trips that would have gone to the station under Scenario 1 were instead sent directly to landfill because the time savings were marginal. This is reflected in a small increase in RCV hours (1135 vs 1087) but a decrease in transfer truck hours (155 vs 220) at optimum, since slightly less waste goes through the station. The combined time 1289.8 hours at 45 km is actually a bit lower than Scenario 1, yielding a 39.0% reduction from baseline. In other words, excluding trips with minor time differences improved efficiency, as it prevented the transfer station from handling loads that didn’t truly benefit from it. The optimal station location remained 45 km, and the minimum time curve was very similar in shape to Scenario 1.
Scenario 3 produced the most dramatic improvement. By increasing the transfer truck capacity to 35 tonnes, the number of long-haul trips to landfill is reduced (since each transfer truck can carry more waste). At the 45 km station, transfer haul hours dropped to 124.4, because fewer trips were needed to move the same tonnage, while RCV hours stayed about the same (~1090) as Scenario 1. The combined travel time was 1214.0 hours, a 42.6% reduction versus baseline – the highest achieved among all scenarios. This result confirms that using larger-capacity vehicles for the main haul leg can substantially boost the benefits of a transfer station. Notably, the optimal position was still around 45 km; Scenario 3’s curve also had a minimum at that location but with a deeper reduction (Figure 4 illustrates the travel time vs. station location for Scenarios 1–3, showing the consistent optimum and the progressively lower minima from Scenarios 1 to 3).
(In Scenario 3, the model indicates that roughly 8,088 tonnes of waste per month would flow through the station at optimum. With 35 t trucks, that implies ~231 transfer trips per month, or about 7.7 trips per day, compared to 270 trips/month if using 30 t trucks. This accounts for the 42.6% vs 39% time savings.)
Finally, Scenario 4 – simulating evening operations – yielded a combined time of 1303.3 hours at the 45 km station, almost identical to Scenario 1 (38.3% reduction vs baseline). Interestingly, the optimal location in the evening scenario was again 45 km and the percentage savings did not significantly increase. This suggests that while absolute travel times were lower at night for both landfill and transfer routes, the relative advantage of the transfer station remained about the same. In Lagos, even evening travel can be slow, and the station provides similar proportional benefits. In fact, the difference between Scenario 1 and 4 was under 1% in savings, indicating that time-of-day congestion is not the primary limiting factor for waste collection efficiency – distance is. Thus, transferring waste closer to source is beneficial regardless of traffic conditions.
In summary, all scenarios confirmed that placing a transfer station roughly mid-way on the Lekki-Epe route can save on the order of 800–900 hours of truck travel per month, equivalent to 33–38 fewer truck-hours per day citywide. Scenario 3 demonstrated that operational tweaks, like higher-capacity trucks, could push the savings above 900 hours (42.6%). Even a conservative approach (Scenario 2) still saved 825 hours (39%). These time savings translate directly into cost and environmental benefits, which is examined next.
3.2. Impact on Vehicle Distance, Emissions, and Costs
A core outcome of reduced travel time is reduced distance traveled by the fleet. Using Google’s distance outputs and the Scenario 1D variant (which calculated distances instead of times for the optimal case), the study found that the introduction of a 45 km transfer station would cut the total distance driven by waste collection vehicles by about 43,267 km per month (a 42% decrease), compared to the status quo. This equates to roughly 519,200 km fewer truck-kilometers per year on Lagos roads. In terms of fuel consumption and greenhouse gases, the implications are significant. If a typical refuse truck emits around 1.16 kg of CO₂ per km (the UK Department for Business, Energy & Industrial Strategy conversion factor for a heavy diesel truck; BEIS, 2024), then a 519,000 km reduction would avoid about 602 tonnes of CO₂ emissions annually. Some studies suggest even higher emission factors (up to 1.8 kg/km for stop-and-go urban refuse trucks; Giora et al., 2020), which would put the savings closer to 935 tonnes CO₂ per year. To be conservative, using the lower official factor, on the order of 600–650 tonnes CO₂ can be eliminated each year by the optimized system. This is roughly equivalent to the annual greenhouse emissions of 130+ passenger cars or the electricity use of 100 average homes, underlining the environmental benefit.
Moreover, fewer kilometers traveled means direct cost savings to the operators. Fuel costs would drop proportionally with distance. For example, if it is assumed that an average of 0.4 liters of diesel per km for a loaded waste truck in traffic, then 519,000 km less per year saves 207,600 liters of diesel. At current local diesel prices, that could save on the order of ₦150–200 million (hundreds of thousands of USD) annually in fuel expenses. In Scenario 3, where time savings reached 42.6%, the annual distance reduction would be even greater (the model extension suggests on the order of 580,000 km/year saved), amplifying fuel savings. PSP operators would also benefit from decreased vehicle maintenance costs: with trucks driving far less, there is reduced frequency of oil changes, tire replacements, brake wear, and general repairs. The wear-and-tear on vehicles is a major expense for waste companies – shorter routes mean longer vehicle lifespan and lower maintenance overhead. The results of this study specifically highlight that high-frequency long routes like Ajah and VI (Victoria Island), which currently account for the largest share of travel time, would see dramatic reductions when their waste is diverted through the transfer station (these farthest zones would almost always use the station, cutting their individual haul distance by up to 50–60%). This concentrated reduction in the most onerous routes is where a large portion of fuel and maintenance savings arise.
From the perspective of the Lagos state government and LAWMA, establishing a transfer station entails some capital and operational costs, but findings of this study suggest these can be offset. A basic transfer station (with minimal infrastructure) for the volumes in question could cost around £1–2 million to construct (Hogg, 2006; Kaza et al., 2018) and has operating costs on the order of €8 per tonne processed. For the Lekki-Epe region, approximately 8,000–9,000 tonnes per month might flow through the station, implying monthly operating costs of roughly €64–72k (plus amortized capital costs). The fuel and labor savings for PSPs, however, are substantial: by cutting around 40% of driving time, PSPs could redirect driver labor to collecting more waste per day (increasing productivity) or reduce overtime payments. Labor efficiency gains mean crews spend less time stuck in traffic and more time on collection service within neighborhoods. If PSPs can collect waste from more clients in the same amount of time (thanks to shorter dumping trips), this could improve revenue or allow servicing previously underserved areas without needing more trucks.
One cautionary note from the results is the issue of “leakage” or illegal dumping. The model assumes all trucks that save time will dutifully use that extra time for legitimate collection. In reality, if PSP operators suddenly find their dump trips taking half the time, there is a risk (noted anecdotally by stakeholders) that some might attempt to dispose of waste unofficially to avoid any fees at the transfer station. Enforcement by LAWMA would be necessary to ensure that the time savings translate to efficiency and not misconduct. This could involve manifest checks or GPS tracking of truck routes.
3.3. Example of Route Allocation Patterns
To illustrate how the optimized model reallocates routes, consider two example WCZs from Scenario 1: Abijo vs. Lagos Island. Abijo is relatively close to Epe landfill, whereas Lagos Island is the farthest major zone. The simulation done in the study found that for Abijo, the fastest option switched from landfill to transfer station only when the station was about 30 km or more from Epe (i.e. closer to Abijo). The optimal station for Abijo specifically was around 30 km. In contrast, for Lagos Island, any introduction of a transfer station at 5 km or beyond provided benefit, and Lagos Island’s waste always went to the transfer station in all scenarios (since even the nearest possible station vastly reduces its haul distance). At the system optimum of 45 km, most mid-range zones like Ajah, Victoria Island, Jakande etc. all use the station, whereas the very closest zones to Epe (like Epe town itself or Ibeju-Lekki) still go directly to landfill. This selective routing is exactly what the model was designed to determine. Under Scenario 2’s 20-min rule, a few border cases (zones that are roughly equidistant) bypass the station – for instance, a zone that is say 10 minutes closer to the station might not use it if that falls under the 20-min threshold. But the net effect on totals was minor, as seen earlier.
3.4. Traffic Congestion and Service Improvement
By reducing the need for dozens of collection trucks to drive into central Lagos each day, the transfer station offers city-wide traffic relief. Those trucks would instead offload at the edge of the urban area (Lekki-Epe fringe) and turn back to collect another load, rather than congesting the highways into the city. The roughly 500,000+ km/year of heavy truck traffic removed includes many trips through densely populated corridors. This has ancillary benefits: less congestion can improve overall traffic flow and reduce travel time uncertainty for the remaining necessary trips. In Scenario 4 (evening operation), while it was found that the relative benefit is unchanged, it’s plausible that if more waste runs are shifted to off-peak, daytime road congestion could ease. Urban planners often advocate for night-time waste collection for this reason. The findings of this study indicate that implementing a transfer station does not negate the benefit of off-peak operation; in fact, both strategies together could be complementary – e.g., using the transfer station primarily during the night hours when it can process continuous streams of trucks quickly.
From a service delivery standpoint, PSPs being able to complete trips faster means they can potentially collect waste from customers more frequently or cover a larger area with the same fleet size. Lagos has struggled with some neighborhoods not getting regular waste pickup due to truck shortages and long turnaround times. A 40% reduction in cycle time per trip could translate to a near-doubling of service frequency in ideal cases (if each truck can do, say, 3 trips to landfill per day now, it might do 5–6 shorter trips to the transfer station). This would require careful coordination, but it addresses a key Sustainable Development Goal (SDG 11) concern: improving municipal services and reducing uncollected waste on streets (Ramos et al., 2018). By reallocating time saved, the city can mitigate illegal dumping and the associated public health issues, moving closer to a clean environment.
4. Discussion
The results confirm that introducing a transfer station can substantially optimize Lagos’ waste collection system, yielding multi-faceted benefits. In line with studies from other cities, the study observed major gains in both operational efficiency and environmental performance when waste routes are reconfigured through transfer hubs (Wu et al., 2018; Zhou et al., 2017). The optimal station location (around 45 km from the landfill, in the Lekki peninsula area) effectively shifts the tipping point closer to waste sources, echoing the concept that waste should be bulked near generation points to avoid long individual hauls (Guerrero et al., 2013). This strategy is common in developed nations but underutilized in African megacities.
Efficiency and Cost Implications: A nearly 40–43% reduction in total travel time for collection trucks is an impressive improvement. It indicates that almost half of the current transportation effort is wasted on unnecessary distance due to the lack of intermediate infrastructure. By cutting this out, Lagos’ PSP operators could see large cost savings. These come not only from fuel and maintenance reductions, as quantified earlier, but also from possibly needing fewer trucks on the road. If each truck can do more rounds per day, the same amount of waste can be handled with a smaller fleet or with less overtime. This could alleviate financial pressures on PSP firms, which in prior assessments have cited high running costs as a barrier to effective service (Aliu et al., 2014). The savings could be redirected into better waste collection equipment or expanding coverage to underserved communities.
However, the financial feasibility of the transfer station itself must be considered. The study rough cost estimates (capital £1–2 million, operating €8/ton) need verification in the local context. Land acquisition in Lagos is expensive, and a well-designed transfer station might require more investment if modern compaction or handling equipment is included. The World Bank’s What a Waste 2.0 report notes that simple transfer stations in developing countries can be built for as low as \$500k, but sophisticated ones cost more. Assuming the higher end, the annualized cost might run into a few hundred million naira. Mechanisms to fund this – whether through government budget, a public-private partnership, or a modest tipping fee charged to PSPs – will determine uptake. If PSPs are charged a fee to use the station, it must be set low enough that it’s offset by their savings (so they have incentive to participate). Otherwise, they might resist or try to circumvent the system.
Environmental and Public Health Benefits: Removing 600+ tonnes of CO₂ emissions per year is a meaningful climate action at the city scale. It contributes to Nigeria’s commitments under the Paris Agreement by curbing one source of urban emissions. Additionally, shorter trips for trucks mean lower local air pollution (diesel trucks emit particulate matter and NOx), which improves air quality along the congested corridors of Lagos. Fewer trucks traveling through the city center reduces noise pollution and road damage as well. The co-benefit of congestion reduction can indirectly cut emissions from other vehicles that would otherwise be idling behind slow-moving waste trucks.
Importantly, more efficient waste collection means less uncollected waste piling up. Currently, due to long turnaround times, some waste might remain on streets if trucks can’t complete routes on schedule. Improving the logistics can raise collection rates, which in turn reduces open dumping and burning of waste – major issues that cause flooding (from drain blockage) and health hazards. The study focus was on transport optimization, but this should be seen in the broader context of moving Lagos toward an integrated solid waste management system (ABRELPE & ISWA, 2013). Transfer stations are one piece of infrastructure that enable other steps like recycling or waste-to-energy, since they centralize waste streams.
Sensitivity and Limitations: While the scenarios covered various operational tweaks, there are additional factors not explicitly modelled. For instance, what if the transfer station itself incurs a significant processing delay (beyond 20 minutes)? If, say, trucks queue for an hour at the station during peak times, the benefits would erode. In practice, careful design (multiple unloading bays, efficient scheduling) is needed to avoid bottlenecks at the station (Saharidis et al., 2018 emphasized optimizing station operations is as vital as the location). Another factor is driver behavior and compliance. The study assumed all drivers adhere to the optimal routing choice. Enforcement and training would be required to realize these efficiency gains – e.g. drivers might need to be compelled to use the station via policy, because individually they might prefer the “faster” perceived route even if only marginally so. LAWMA’s regulatory role is crucial here.
The study also assumed uniform truck capacity and waste generation. In reality, some PSP trucks are smaller, and waste generation can spike on certain days or seasons. A robust system would incorporate dynamic routing – for example, if a particular day’s waste is more, sending extra trucks via transfer could avoid overwhelming the landfill directly. The study static monthly average approach can be expanded into a dynamic simulation or optimization model to handle daily variations, possibly using integer programming for routing (which other studies have done for waste collection routing; e.g. Rızvanoğlu et al., 2020). Nevertheless, the consistent results across scenarios give confidence in the direction and scale of improvements.
Comparative Perspective: The efficiency gains found (40%) are in line with global experiences where transfer stations yield 25–45% reductions in hauling distances for far-end service areas (Zhou et al., 2017; Alhassan & Mohammed, 2017). It underscores that Lagos is not fundamentally different – the same engineering logic applies. What sets Lagos apart is the extreme traffic congestion, which might suggest even higher relative benefits for off-peak operation or more stations in the future. For example, one could envision not just a single station at 45 km, but perhaps two smaller ones covering different clusters of WCZs, if economically justified. The model could be extended to evaluate multiple stations, though that becomes a more complex optimization problem (a location-allocation problem for multiple facilities).
Finally, the success of such an optimized system would depend on integrating it with Lagos’ broader waste strategy. The city has attempted reforms (e.g. the Visionscape initiative in 2018) which faltered partly due to infrastructure gaps (Proshare Nigeria, 2018). The research carried out in this study provides concrete data backing the case for infrastructure investment in transfer stations. It also quantifies benefits that can be used to communicate to policymakers and the public – e.g. “this one facility can eliminate 600 tonnes of CO₂ and save millions annually.” These are compelling figures for sustainable development advocacy. Additionally, demonstrating cost savings and efficiency might open avenues for private investment or international development funding to build the station, as it aligns with climate mitigation and urban improvement goals.
5. Conclusions
This study has demonstrated through simulation that optimizing waste collection routes with a strategically placed transfer station can dramatically improve efficiency in Lagos’ waste management system. Focusing on the Lekki-Epe corridor, where collection trucks currently travel up to 60+ km one-way to the landfill, the study showed that inserting a transfer facility about 45 km from the landfill could reduce total vehicle travel time by over 40%. The ripple effects of this optimization are far-reaching:
- Operational Efficiency: Collection trucks would spend significantly less time on highways and more time in communities, enabling higher service frequency or the same service with fewer resources. An optimal routing system could address some of Lagos’ service delivery gaps by freeing up capacity in the PSP fleet.
- Cost Savings: The reduction in driving distance (hundreds of thousands of km per year) translates directly into fuel savings and lower maintenance costs. Over the long term, these savings can offset the capital and running costs of the transfer station, especially if managed well. The economic analysis suggests a strong case for the government and private operators to collaborate on such a facility, potentially through a PPP model where savings are shared.
- Environmental Benefits: By cutting out redundant trips, the model prevents on the order of 600–900 tonnes of CO₂ emissions annually. This is a notable contribution to reducing the city’s carbon footprint. Local air pollutants and noise from heavy trucks would also diminish, contributing to better living conditions along major transport routes. This intervention thus supports Lagos’ environmental sustainability targets and global climate action efforts.
- Traffic and Urban Impact: Fewer waste trucks on the road for long-haul journeys means reduced congestion on key arterials. The positive externalities include faster commute times for others and less road damage. Moreover, a transfer station creates an opportunity to professionalize waste handling – waste can be processed, sorted, or compacted at the station, which is difficult to do at chaotic landfill tipping faces.
In implementing these findings, certain considerations must be addressed. The location at 45 km from Epe should be evaluated on-the-ground for land availability, community acceptance (as a transfer station may face NIMBY opposition if near residential areas), and connectivity to the road network. Ensuring that the facility design can handle peak inflows without delay will be critical to achieving the model’s predicted time savings. Additionally, a clear operational plan and possibly regulatory measures will be needed so that all or most PSP operators utilize the station appropriately. Introducing an optimized routing system may also require training drivers and dispatchers, as well as equipping trucks with simple tracking to monitor compliance and performance.
This work is one of the first quantitative assessments of transfer station introduction in a West African city using real data and modern routing algorithms. As such, it provides a template for other developing cities grappling with similar challenges. Cities like Nairobi, Accra, or Addis Ababa, with expanding urban footprints and distant landfills, could replicate this methodology – first gathering baseline haul data, then simulating transfer point scenarios to guide infrastructure decisions. The magnitude of benefits for Lagos suggests that many fast-growing cities are leaving huge efficiency gains “on the table” under their current waste logistics models.
Future Research: Building on these findings, further research could explore multi-facility optimization – for instance, if Lagos were to build two or three transfer stations, where should they be and how would waste zones be allocated among them? Another avenue is to incorporate dynamic routing: using real-time traffic data to route trucks to either the transfer station or landfill on a trip-by-trip basis (perhaps some days a direct haul is better if traffic is unusually light). Additionally, the impact on PSP economics and behavior warrants study – how to structure incentives so that private collectors embrace the new system. Finally, coupling this transport optimization with improvements in waste segregation and recycling at the transfer station could compound benefits by reducing landfill volumes. In conclusion, optimizing waste collection through well-placed transfer stations is a viable and impactful solution for Lagos, offering a path to a more efficient, sustainable, and livable city.
References
- Abah, S.O. and Ohimain, E.I. (2011) ‘Healthcare waste management in Nigeria: A case study’, Journal of Public Health and Epidemiology, 3(3), pp. 99–110.
- ABRELPE and ISWA (2013) Solid Waste: Guidelines for Successful Planning. International Solid Waste Association, p. 52.
- Agboje, I.O., Adeoti, A.I. and Oyedepo, S.O. (2014) ‘Performance assessment of solid waste management following private partnership operations in Lagos State, Nigeria’, Journal of Waste Management, 2014, pp. 1–8. [CrossRef]
- Ahmed, S.A. and Ali, S.M. (2006) ‘People as partners: Facilitating people’s participation in public-private partnerships for solid waste management’, Habitat International, 30(4), pp. 781–796. [CrossRef]
- Alhassan, H. and Mohammed, T.I. (2017) ‘Operational cost optimization for solid waste collection’, International Journal of Waste Resources, 7(1), 1000275.
- Aliu, I.R., Adeyemi, O.E. and Adebayo, A. (2014) ‘Municipal household solid waste collection strategies in an African megacity: Analysis of public-private partnership performance in Lagos’, Waste Management & Research, 32(9_suppl), pp. 67–78. [CrossRef]
- Baird, J. and Olaoye, A. (2025) *An evaluation of landfill data in Lagos State, Nigeria, towards assessing the potential impact of the adoption of transfer stations*. PhD thesis. Glasgow Caledonian University.
- Department for Business, Energy & Industrial Strategy (BEIS) (2024) Greenhouse gas reporting: Conversion factors 2024. (Provides CO₂ emission factors for various vehicles; used for 1.16 kg CO₂/km for HGV).
- Forouhar, A. and Hristovski, K.D. (2012) ‘Methods of solid waste disposal and management in developing countries’, Journal of Waste Management, 2012, Article ID 629159. [CrossRef]
- Giora, E., Asaf, K. and Shechter, Y. (2020) ‘Carbon footprint of urban waste collection: Case of a megacity’, Waste Management, 102, pp. 503–511.
- Guerrero, L.A., Maas, G. and Hogland, W. (2013) ‘Solid waste management challenges for cities in developing countries’, Waste Management, 33(1), pp. 220–232. [CrossRef]
- Hogg, D. (2006) Cost-Benefit Analysis of Options for Managing Biodegradable Municipal Waste. Report to the European Commission.
- Kaza, S., Yao, L., Bhada-Tata, P. and Van Woerden, F. (2018) What a Waste 2.0: A Global Snapshot of Solid Waste Management to 2050. Washington, DC: World Bank Publications.
- Lagos State Government (2017) ‘Solid waste reform will improve the socio-economic conditions of Lagos residents – Commissioner’. Lagos.gov Press Release, April 18, 2017. Available at: (Accessed 15 March 2024).
- Oyekanmi, O. and Ejem, E. (2022) ‘Navigating the haul: Evaluating vehicle load regulations for waste transport in Nigeria’, Journal of Transportation and Logistics, 5(2), pp. 88–97.
- Proshare Nigeria (2018) ‘Lagos State Government and the Visionscape deal’. Proshareng.com News, 18 April 2018. Available at: (Accessed 18 April 2024).
- Ramos, T.R.P., Gomes, M.I. and Barbosa-Póvoa, A.P. (2018) ‘The smart waste collection routing problem: Alternative operational management approaches’, Expert Systems with Applications, 95, pp. 79–91. [CrossRef]
- Saharidis, G.K.D., Dimitropoulos, C. and Skordilis, E. (2018) ‘Optimal design of municipal solid waste transfer stations for reducing greenhouse gas emissions’, Environmental Engineering and Management Journal, 17(5), pp. 1105–1114.
- World Bank (2018) ‘Global waste to grow by 70 percent by 2050 unless urgent action is taken: World Bank report’. Press Release, September 20, 2018. Available at: .
- Wu, X., Zhou, Y., Zhang, B. and Chen, X. (2018) ‘Multi-objective optimization model for waste transfer station location and capacity planning in urban areas’, Waste Management, 78, pp. 911–921. [CrossRef]
- Yao, J., Leung, J., Lai, K.K. and Ng, S. (2015) ‘Discrete event simulation optimization for waste collection operations’, Proceedings of the 2015 Winter Simulation Conference, pp. 1575–1586.
- Yao, L., Kazuya, O., Lu, F. and Bhada-Tata, P. (2016) ‘Predictive models for municipal solid waste generation and optimal facility location’, Proceedings of the International Conference on Waste Technology, pp. 55–62.
- Zhou, L., Gong, Y., Hu, S. and Zha, H. (2017) ‘Cost-benefit analysis of urban waste transfer station placement’, Procedia CIRP, 61, pp. 662–667. [CrossRef]
Figure 1.
shows the 29 Waste Collection Zones across the modelling area (Source: Google Maps/Author).
Figure 1.
shows the 29 Waste Collection Zones across the modelling area (Source: Google Maps/Author).
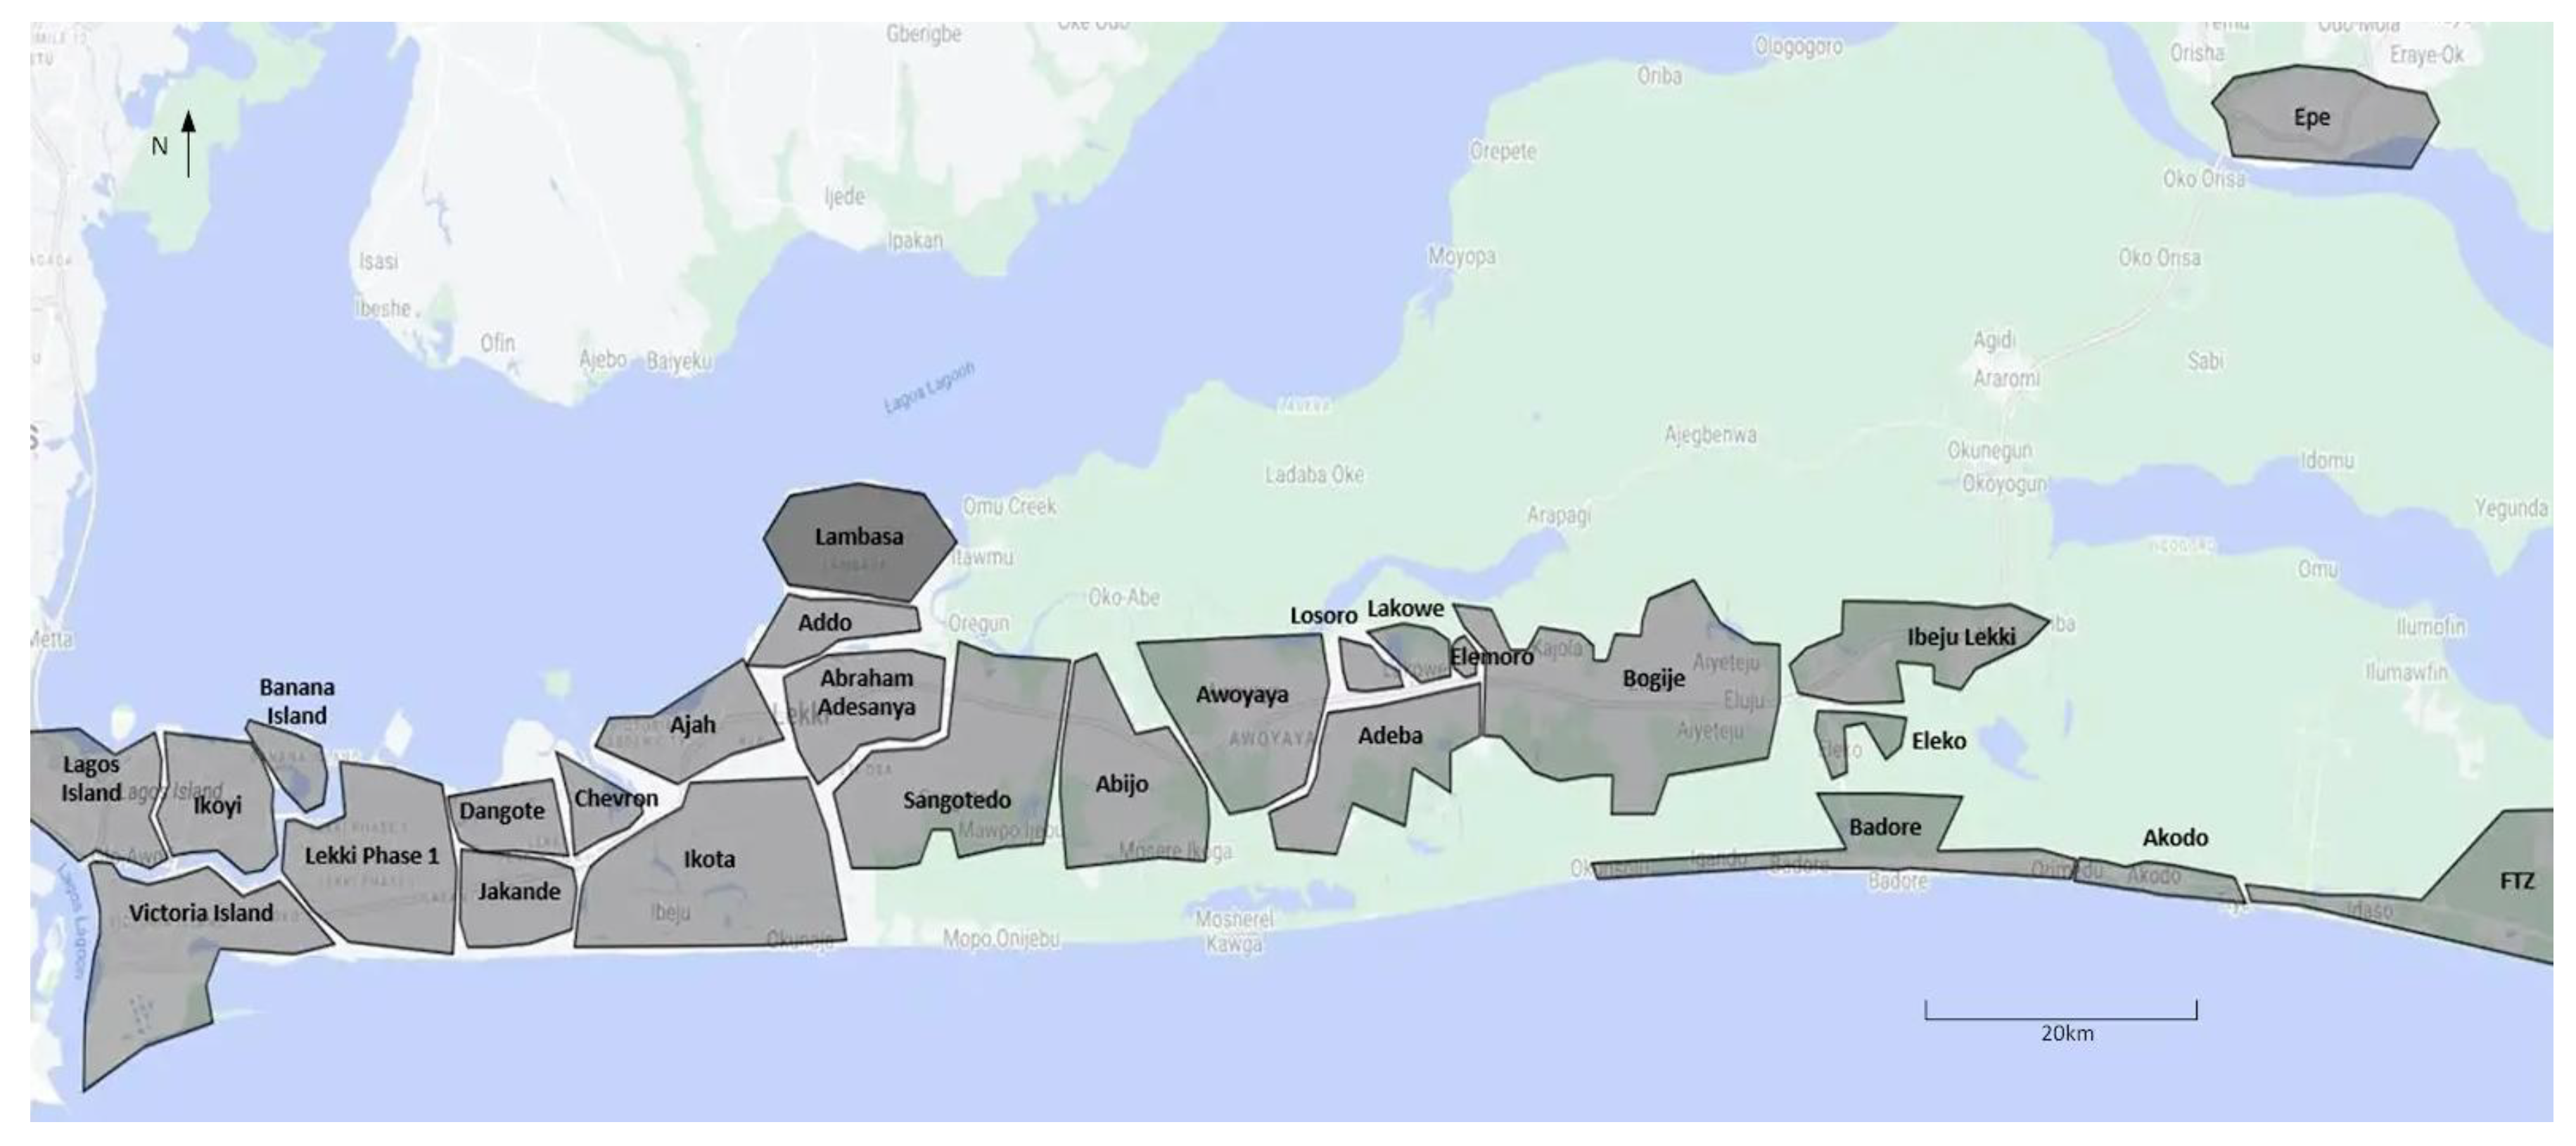
Figure 2.
The Potential Locations for the Transfer Stations across a 5 km radius along the Lekki Epe Expressway (Source: Google Maps/Author).
Figure 2.
The Potential Locations for the Transfer Stations across a 5 km radius along the Lekki Epe Expressway (Source: Google Maps/Author).
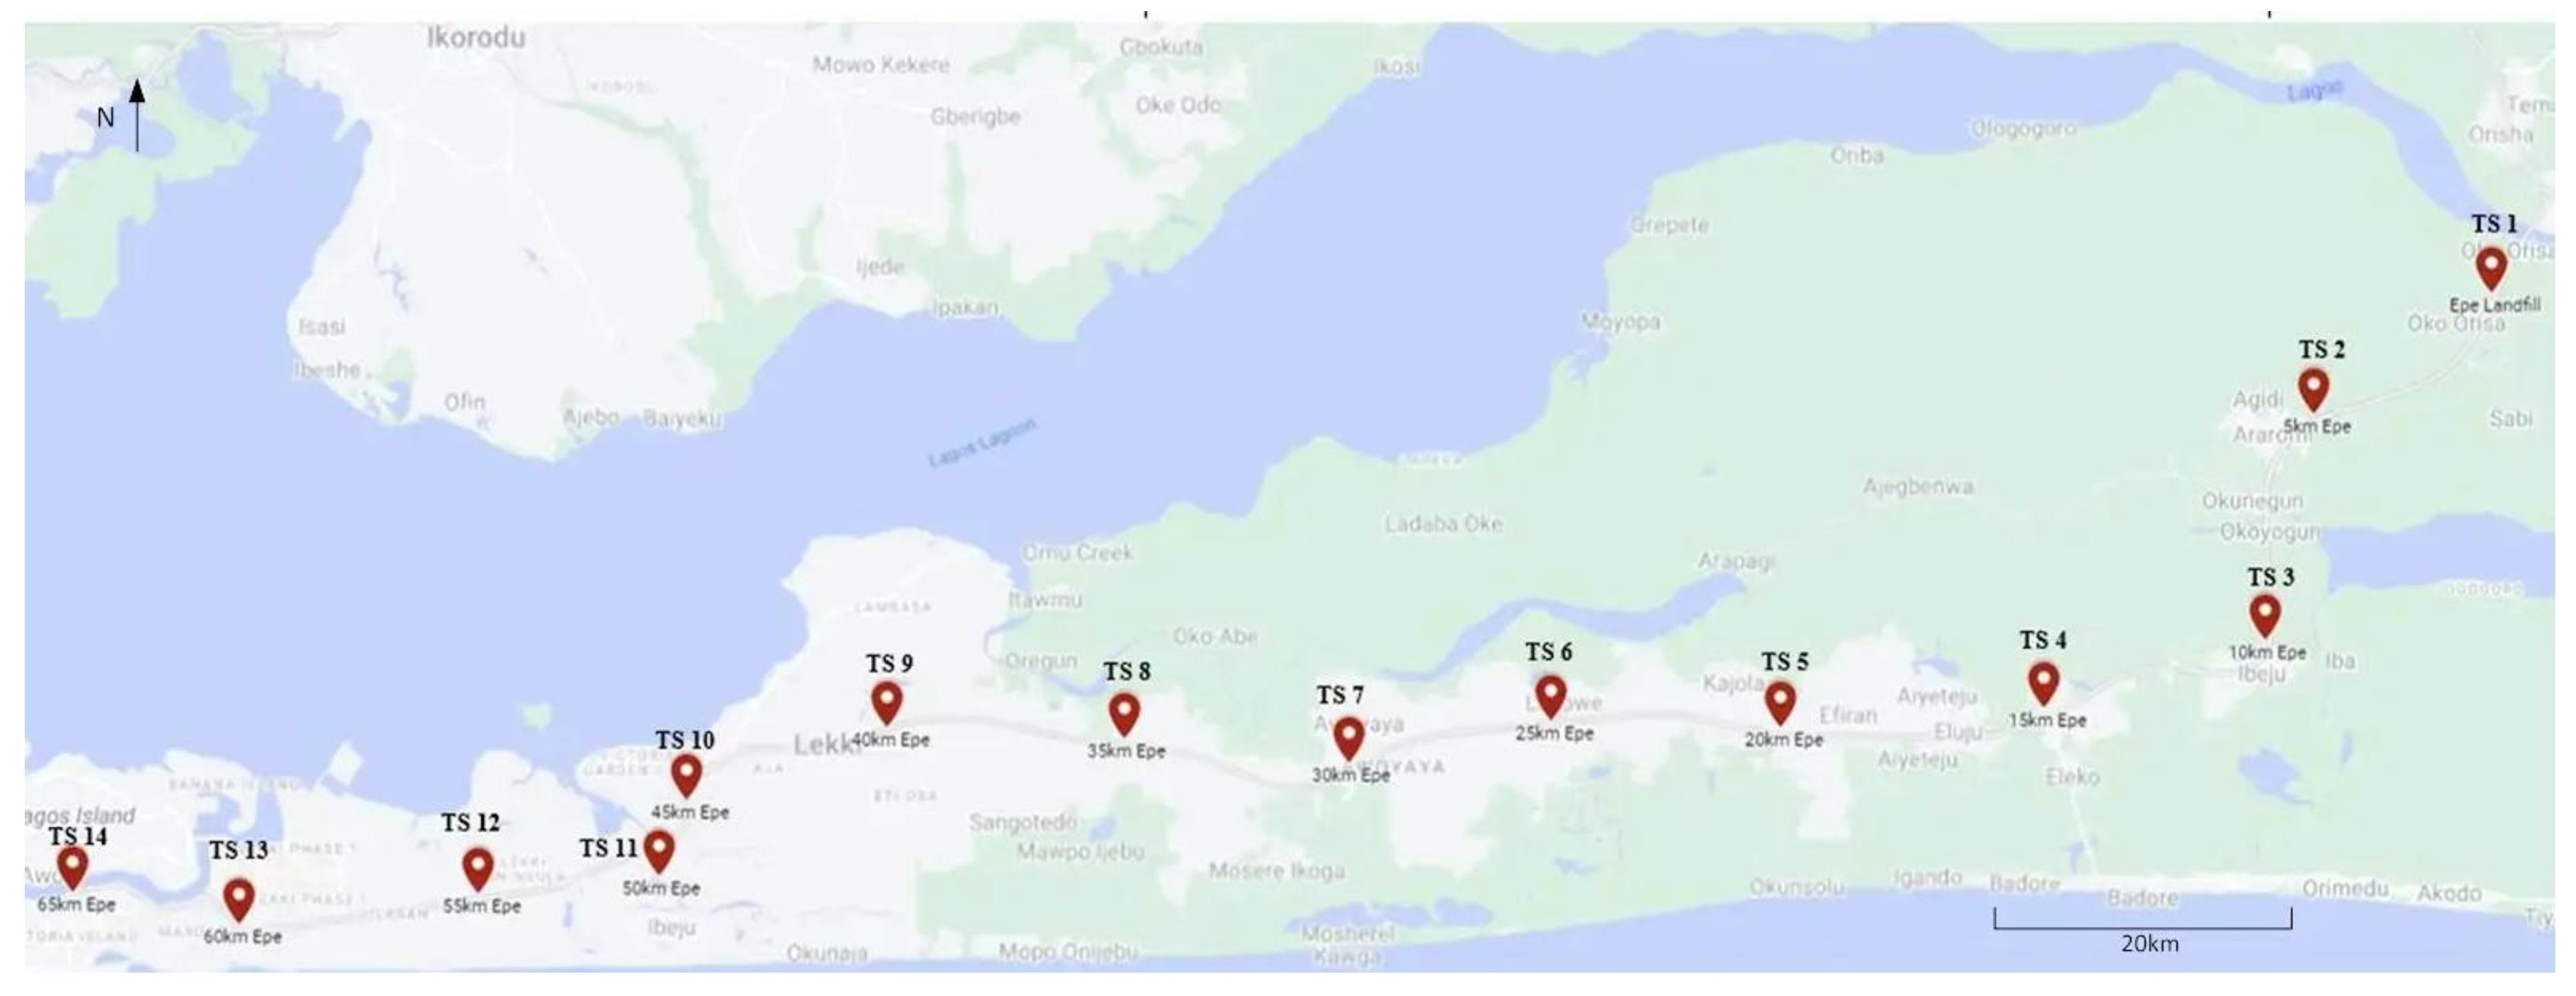
Figure 3.
Flowchart illustrating the time of travel function (Source: Author).
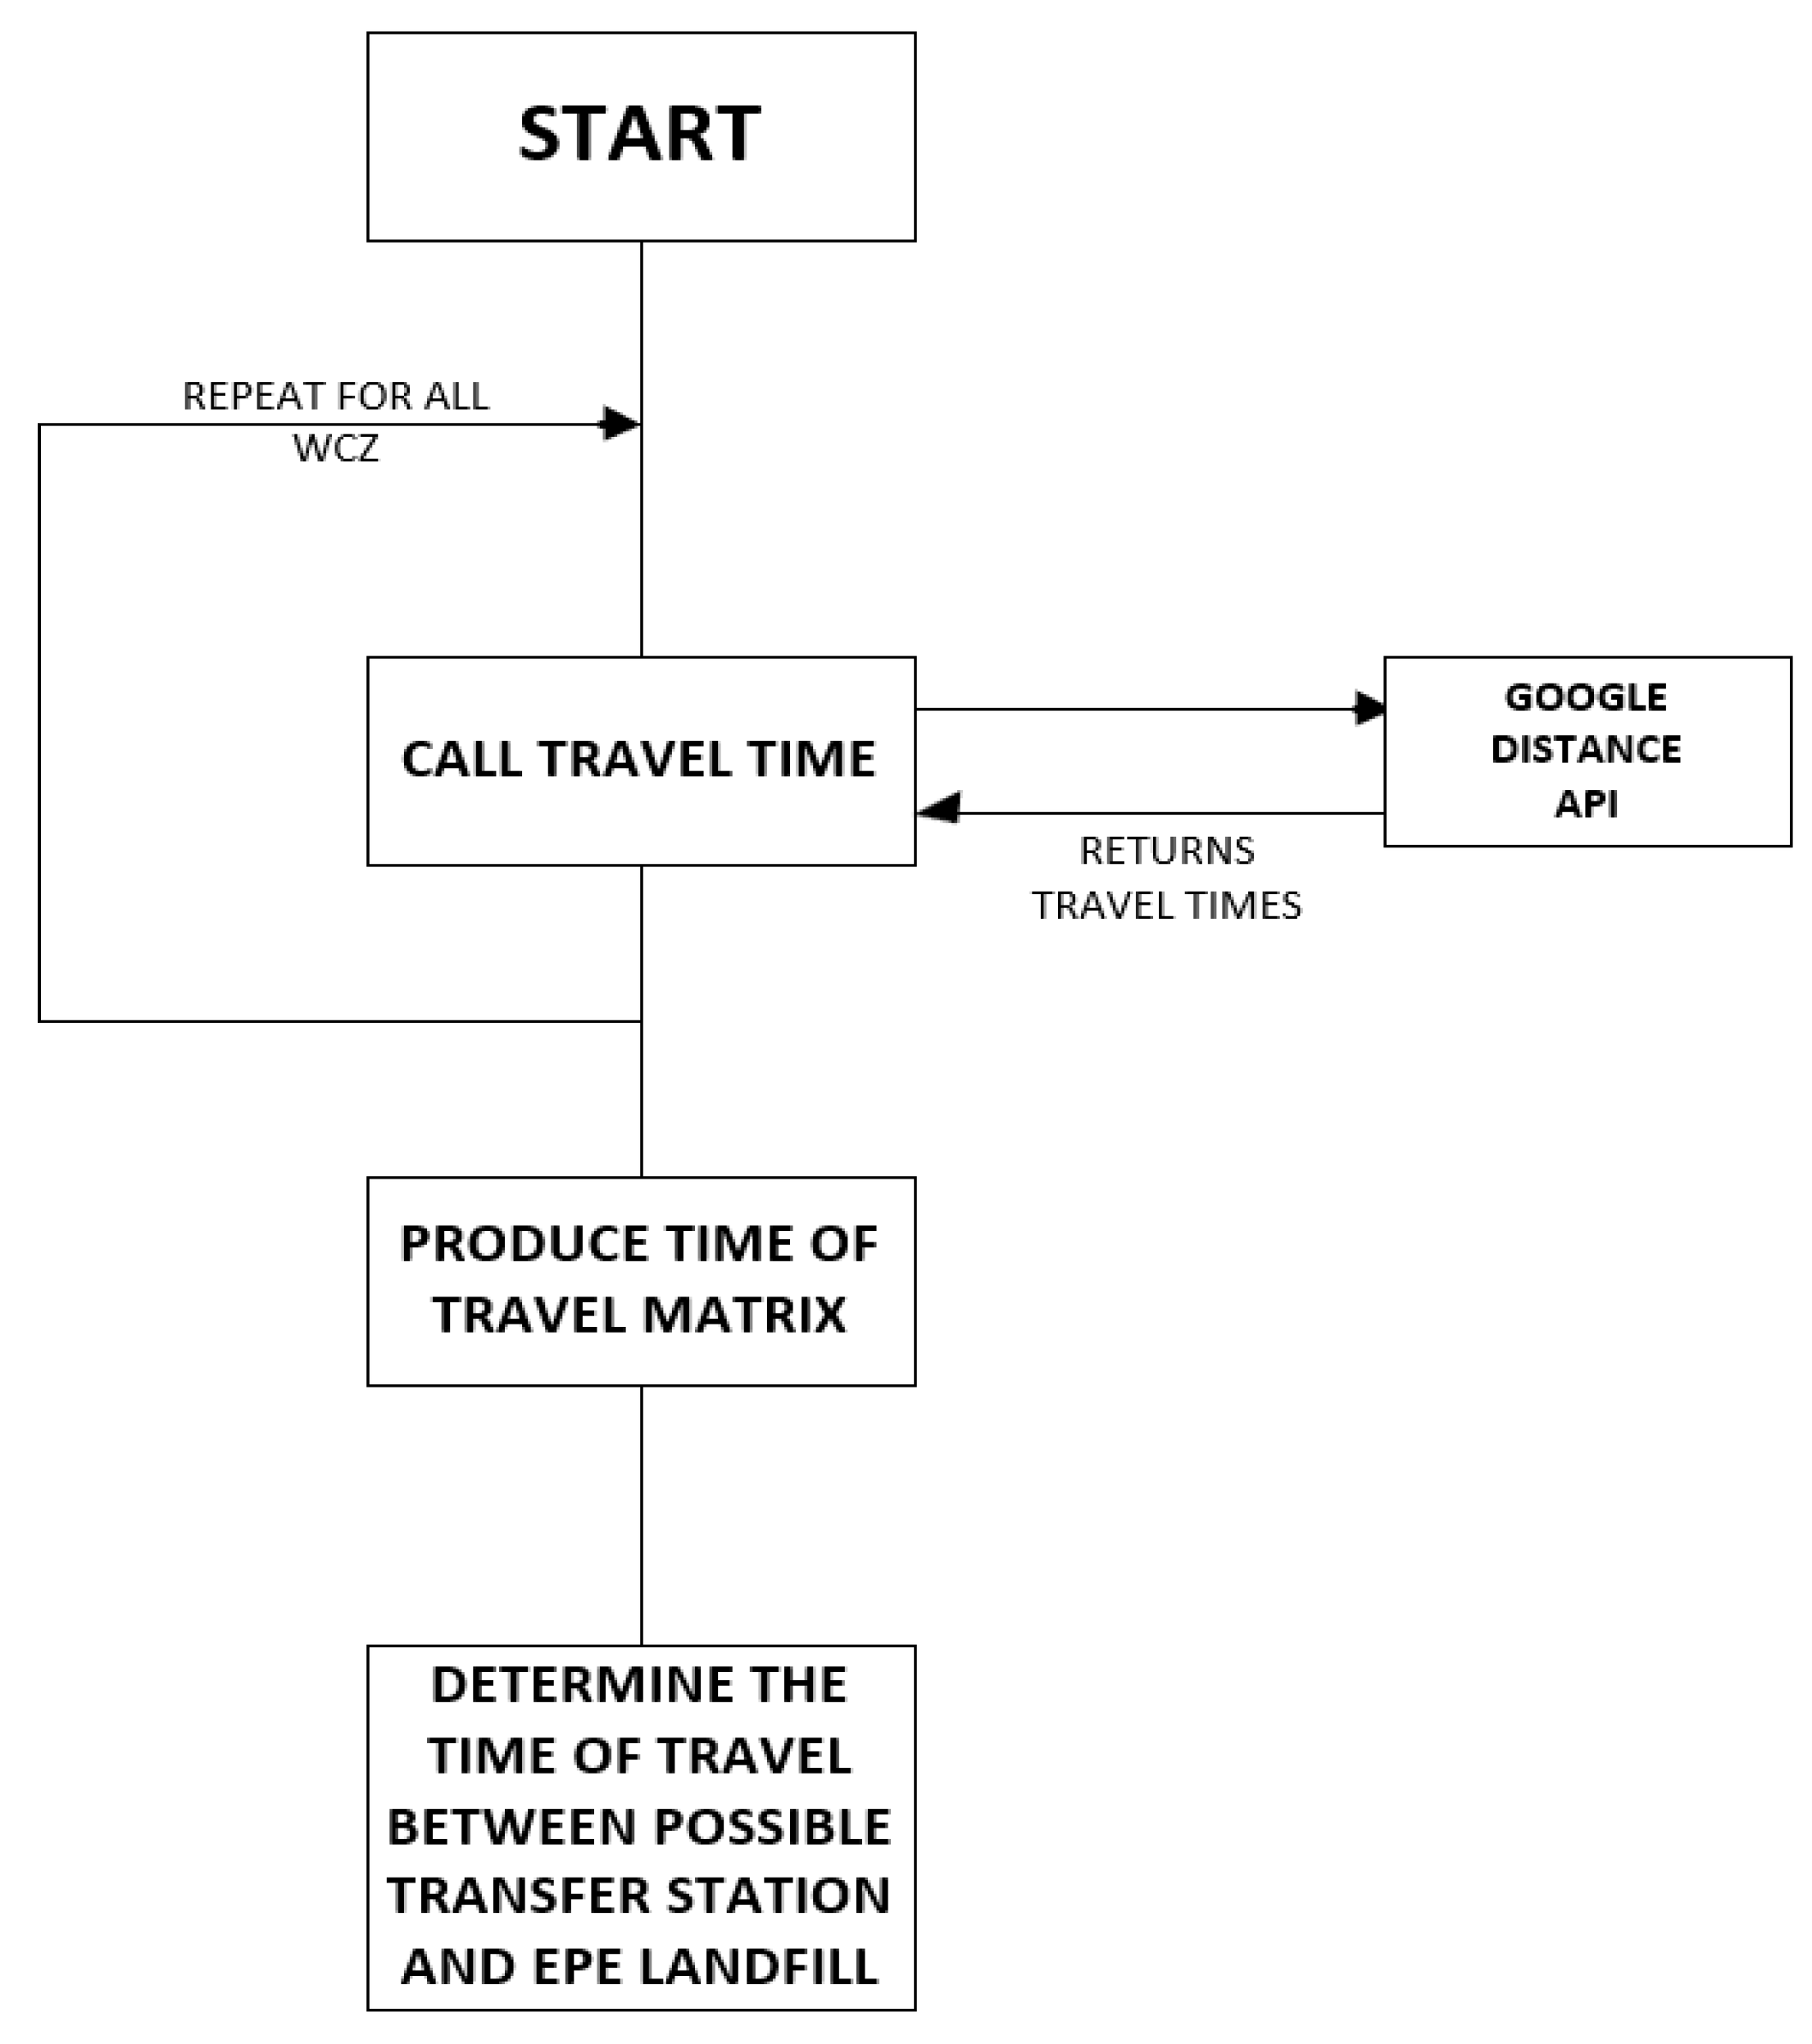

Table 1.
Average monthly collection vehicle trips from key WCZs to Epe landfill (baseline data).
| Waste Collection Zone (WCZ) | Avg. Trips/Month | Waste Collection Zone (WCZ) | Avg. Trips/Month |
| Ajah (urban mainland) | 217 | Awoyaya | 23 |
| Victoria Island (VI) | 208 | Chevron Drive area | 54 |
| Lagos Island (city core) | 28 | Ikoyi | 22 |
| Badore (Eti-Osa) | 101 | Sangotedo | 41 |
| Jakande (Lekki) | 62 | Ikota | 27 |
| Banana Island | 9 | Lakowe | 3 |
| Abijo | 7 | Langbasa | 6 |
| Abraham Adesanya | 8 | Ibeju-Lekki | 28 |
| Addo Road (Ajah) | 7 | Epe town | 72 |
| Lekki Phase 1 | 27 | Free Trade Zone (FTZ) | 36 |
| Bogije | 30 | Eleko | 13 |
| Adeba Road | 4 | Dangote Refinery | 1 |
| Elemoro | 4 | Akodo (Ibeju-Lekki) | 1 |
| Total (all 29 WCZs) | = 1085 |
Table 2.
Monthly travel time of waste collection vehicles (RCVs) and transfer haul vehicles under each scenario at optimal transfer station placement (45 km from landfill), and percentage improvement over baseline.
Table 2.
Monthly travel time of waste collection vehicles (RCVs) and transfer haul vehicles under each scenario at optimal transfer station placement (45 km from landfill), and percentage improvement over baseline.
| Scenario | Total RCV Hours (month) | Transfer Truck Hours (month) | Combined Hours | Reduction vs Baseline |
| Baseline (no station) | 2115.2 | – | 2115.2 | – (reference) |
| Scenario 1: Nearest option | 1087.0 | 219.8 | 1306.8 | −38.2% |
| Scenario 2: +20 min threshold | 1135.0 | 154.8 | 1289.8 | −39.0% |
| Scenario 3: +Higher capacity | 1089.6 | 124.4 | 1214.0 | −42.6% |
| Scenario 4: Evening travel | 1156.4 | 146.9 | 1303.3 | −38.3% |
Disclaimer/Publisher’s Note: The statements, opinions and data contained in all publications are solely those of the individual author(s) and contributor(s) and not of MDPI and/or the editor(s). MDPI and/or the editor(s) disclaim responsibility for any injury to people or property resulting from any ideas, methods, instructions or products referred to in the content. |
© 2025 by the authors. Licensee MDPI, Basel, Switzerland. This article is an open access article distributed under the terms and conditions of the Creative Commons Attribution (CC BY) license (http://creativecommons.org/licenses/by/4.0/).
Copyright: This open access article is published under a Creative Commons CC BY 4.0 license, which permit the free download, distribution, and reuse, provided that the author and preprint are cited in any reuse.


