Submitted:
20 October 2025
Posted:
21 October 2025
You are already at the latest version
Abstract
Lagos, Nigeria faces critical challenges in municipal solid waste management due to rapid urbanization and rising waste generation. This study presents an analysis of waste collection data over an eight-month period from six major landfills in Lagos State to evaluate current operational performance. Findings reveal that Lagos generates approximately 13,000 tonnes of waste daily, yet only about one-third of this waste is officially collected and disposed at the monitored sites. On average, 170 waste collection vehicles visit each landfill per day, traveling a combined total of about 3,200 km daily. Up to 60% of total route time is spent idle in traffic congestion due to inefficient routing. Private Sector Participation (PSP) operators, coordinated by the Lagos Waste Management Agency (LAWMA), play a substantial role in waste collection. However, data indicate highly uneven contributions and vehicle utilization rates among PSP firms. The largest operator (LAWMA/Visionscape) accounted for 15% of all trips, while over 45% of smaller PSPs made fewer than 100 trips in eight months, pointing to under-utilized fleet capacity. Temporal analysis shows significant drops in collection activity on Sundays and overnight, with peaks at midday on weekdays. These patterns, along with infrastructure deficits and traffic delays, underscore systemic inefficiencies in the current waste collection system. The study highlights the need for strategic interventions such as optimized routing, expanded collection coverage, and the introduction of transfer stations to reduce travel distances, alleviate congestion, and improve overall efficiency. Policy implications include strengthening LAWMA’s oversight of PSP operations, incentivizing higher fleet utilization, and integrating informal waste collectors to capture unserved waste streams. The insights from this Lagos case study offer a data-driven foundation for planning more sustainable urban waste management systems in developing megacities.
Keywords:
municipal solid waste
; Lagos
; landfill data
; private sector participation
; route inefficiency
; urban waste management
Introduction
Municipal solid waste management is a growing concern in rapidly urbanizing cities of the developing world. As populations and incomes rise, waste generation has surged globally from 1.3 billion tonnes in 2012 to a projected 2.2 billion tonnes by 2025. Developing countries face acute challenges due to limited infrastructure and resources, leading to overflowing landfills, pollution, and public health risks. Effective waste management in these contexts requires optimizing collection and disposal systems despite financial and logistical constraints (Guerrero et al., 2013; Ali et al., 2023).
Lagos State in Nigeria exemplifies these challenges. Home to over 21 million residents and generating about 13,000 tonnes of solid waste per day (Lagos State Government, 2017), Lagos’s waste management system struggles to keep pace with demand. The Lagos State Waste Management Agency (LAWMA), a public-sector body, oversees waste collection by licensing dozens of private sector participants (PSPs) to operate waste collection zones. Despite this framework, inefficient service coverage and infrastructural deficits persist. LAWMA, which also directly manages some collection, has been unable to fully contain the waste problem. Ineffective collection has driven many residents to rely on informal waste pickers and illegal dump sites, leading to indiscriminate dumping in canals and open areas (Bassey, 2017). Traffic congestion in Lagos further exacerbates the challenge – refuse trucks are frequently stuck on congested roads, reducing their productivity and increasing operational costs. The cumulative effect is an overwhelmed system where only an estimated 32% of waste generated in the city ends up in official landfills (World Bank, 2018; World Population Review, 2017), with the remainder unmanaged or handled by informal means.
In this context, a detailed analysis of Lagos’s waste collection and landfill usage can identify critical inefficiencies and areas for improvement. This paper focuses on evaluating the current waste collection system in Lagos through analysis of empirical data from six key landfills. The study examined waste generation and disposal rates, the performance of PSP operators, vehicle movement patterns, and landfill accessibility issues. Key research questions include:
- Waste Flow Coverage: What do the data reveal about the volume of waste handled by the formal system relative to total estimated waste generation?
- PSP Distribution and Timing: How are waste collection trips distributed among various PSP operators and across time (daily/weekly patterns)?
- Operational Inefficiencies: What are the primary inefficiencies – such as underutilized vehicles, traffic delays, or uneven service coverage – that impact operational performance?
By addressing these questions, The study aims to pinpoint shortcomings in the current system and lay the groundwork for potential interventions (discussed in the Conclusion) that could enhance efficiency and sustainability.
Methods
Data Collection
An eight-month field survey was conducted to capture comprehensive data on waste transport into Lagos’s landfill sites. Six principal landfills were selected based on their coverage of the metropolitan area and importance in the waste management network: Olusosun, Solous, Abule-Egba, Epe, Igando, and Ikorodu. These sites span various parts of Lagos State. For reference, Figure 1 shows a map of Lagos State highlighting the locations of these six landfills.
Data collection spanned from mid-2018 to early 2019. At each landfill, on-site recorders or weighbridge systems (where available) logged incoming waste deliveries. The recorded parameters included: vehicle identification (or PSP company), date and time of entry, origin (waste collection zone or local government area), waste tonnage (for Epe landfill, which had a functional weighbridge), and other notes on delays or incidents. Table 1 summarizes the dataset fields collected and the data volume.
Data integrity was addressed by cleaning and cross-verification. An initial raw dataset of over 100,000 records was obtained, which after removing duplicates and obvious errors (e.g., impossible timestamps, mis-entered site names) resulted in 99,784 valid trip records for analysis. Minor inconsistencies in PSP naming were standardized to unify entries belonging to the same company. For Epe landfill, weight data allowed calibration of an average truck payload (10.6 tonnes/vehicle), which was applied to other sites (lacking weighbridges) to estimate tonnages for comparative analysis. The final dataset provides a granular view of waste movement into the six landfills over the study period.
Analysis Approach
The analysis focused on both system-wide metrics and disaggregated patterns:
- Waste Throughput and Coverage: The study estimated the total annualized waste delivered to the six landfills and compared it to Lagos’s theoretical waste generation (World Bank, 2018). Using Epe’s measured payloads (mean 10.6 tonnes per vehicle), it was extrapolated tonnage for all recorded trips. This yielded approximately 1.41 million tonnes/year handled by the six sites, which is only about 32% of the 4.38 million tonnes annual waste generation expected for a 20+ million population at 0.6 kg/person/day. This metric gauges the gap between formal waste collection and city-wide waste production.
- PSP Operator Performance: Each trip record was tagged by PSP (including LAWMA, which also operates trucks). The study tallied total trips per operator over the 8-month period to identify major contributors and smaller players. Key statistics such as the number of active vehicles per PSP and average trips per vehicle per month were computed from the records (supplemented by PSP fleet data). PSPs were then ranked by total landfill deliveries to evaluate their relative share in the system.
- Temporal Patterns: The dataset was analyzed for temporal distribution of waste deliveries. The study aggregated trips by month, by day of week, and by hour of day. In particular, The Author plotted total trips per month (Figure 2), average daily trips by day of the week (Figure 3), and hourly landfill arrival frequencies (Figure 4) for visual clarity. This uncovered seasonal or monthly fluctuations (e.g., whether certain months saw consistently higher or lower landfill usage), weekly activity cycles (workdays vs. weekends), and daily operational hours.
- Traffic and Distance Analysis: Using Google Maps travel time estimates for each origin-destination pair (waste collection zone to landfill) under typical traffic conditions, it approximated travel distances and times for each trip. Summing these provided an estimate of total vehicle-kilometers traveled per day by collection trucks and the proportion of time lost to congestion. The estimate of ~3,200 km traveled daily across all trucks – with substantial delays – was cross-checked against known traffic conditions on key routes. Additionally, landfill accessibility issues (such as road quality or on-site queues) noted qualitatively during data collection were compiled to contextualize anomalies in trip times.
- Inefficiency Indicators: Several proxy indicators for inefficiency were computed: for example, the fraction of trucks making very few trips (to identify underutilized vehicles), variance in trips per day to each landfill (to see if capacity is imbalanced), and instances of rerouting due to disruptions (e.g., when Olusosun landfill was temporarily closed due to a fire, and waste flows shifted to other sites).
The analysis was performed using spreadsheet tools for data processing and visualization. Where applicable, statistical summaries (mean, median, percentile distributions of trips or travel times) are reported to characterize the system’s performance. The results below synthesize these findings, focusing on the most policy-relevant insights regarding waste flow through Lagos’s landfills and the operational shortcomings observed.
Results
Waste Generation vs. Disposal at Landfills
Over the study period, the six monitored landfills received a total of ~88,000 waste truck visits, which extrapolates to roughly 133,000 trips per year under current conditions. Given the measured average load of about 10.6 tonnes per truck (from Epe’s weighbridge data), this equates to an annual disposed tonnage of approximately 1.4 million tonnes at these sites. In contrast, Lagos’s population and typical waste generation rates suggest over 4 million tonnes of waste produced per year citywide (World Bank, 2018; World Population Review, 2017). Thus, only about 32% of Lagos’s waste is captured by the formal landfill system. The remaining two-thirds is either handled by other minor dumpsites, managed informally (recycled or scavenged), or unfortunately left uncollected and often dumped illegally (Bassey, 2017). This glaring disparity highlights a substantial coverage gap: a large fraction of waste is not making it to sanctioned disposal facilities. It underpins the severity of the waste management problem in Lagos, even though landfills are receiving large volumes, an even greater amount of waste accumulates in the environment due to inadequate collection coverage.
In terms of landfill share, Olusosun (the largest site, centrally located) would normally receive the highest waste volume per day, but its temporary closure in late 2018 (due to a fire incident) caused noticeable dips in overall disposal. During the Olusosun downtime, other sites like Solous saw slight increases as trucks were rerouted to compensate (Anestina et al., 2014). Overall, April 2019 recorded the peak monthly landfill input in the dataset, while November 2018 was the lowest (partly because of Olusosun’s reduced operation). These fluctuations suggest that seasonal effects (e.g., holidays in December or weather impacts) were less significant than operational disruptions in influencing waste throughput (Figure 2).
Private Sector Participation (PSP) and Vehicle Utilization
Waste collection in Lagos is highly decentralized among hundreds of PSP operators, but a few major players dominate the activity. Across the 8-month data, over 420 distinct PSP entities were recorded as making trips to the landfills. However, the distribution of trips is heavily skewed. The top 10 PSP firms account for a large share of all landfill visits, while many smaller PSPs contributed only sporadically. The largest single operator was LAWMA/Visionscape – a hybrid public-private entity which alone contributed about 15% of total vehicle movements in the period (LAWMA, 2019). LAWMA’s dominant share reflects its dual role as regulator and active service provider, stepping in especially after Visionscape’s exit (Visionscape, briefly contracted to overhaul Lagos waste management, ceased operations during the study; its fleet and routes were largely absorbed by LAWMA). The next-largest private firms, such as Waste Point, Excellens, and Bauh Bon, each made on the order of 1,000–1,500 trips over eight months (roughly 5% or less of the total each). In contrast, 192 out of 424 PSPs made 100 or fewer trips in the period – effectively, these smaller operators collected only sporadic amounts of waste. Many are likely small contractors serving limited neighborhoods or functioning irregularly.
The inequality of workload among PSPs also manifests in vehicle utilization efficiency. The dataset and PSP registry indicate about 1,300 active refuse collection vehicles (RCVs) in Lagos (LAWMA, 2019). However, many vehicles were barely used; for example, dozens of trucks recorded fewer than 10 trips in 8 months (suggesting a segment of the fleet lies idle). Among the active ones, the study calculated each PSP’s average trips per vehicle per month. The best-performing operators achieved around 20–30 trips per vehicle per month, equivalent to near-daily use on weekdays. For instance, firms like Excellens and Bauh Bon averaged 26–29 trips/vehicle/month, indicating their trucks were running almost every workday. On the other hand, many PSPs had ratios in the low teens, and the overall mean was only ~15 trips/vehicle/month (roughly 3–4 trips per week per truck). This points to underutilization of a significant portion of the fleet – many trucks are spending a lot of time parked or under maintenance rather than collecting waste.
Figure 5.
The major PSP operators and the total number of landfill visits each made over the eight-month period (Source: Author).
Figure 5.
The major PSP operators and the total number of landfill visits each made over the eight-month period (Source: Author).
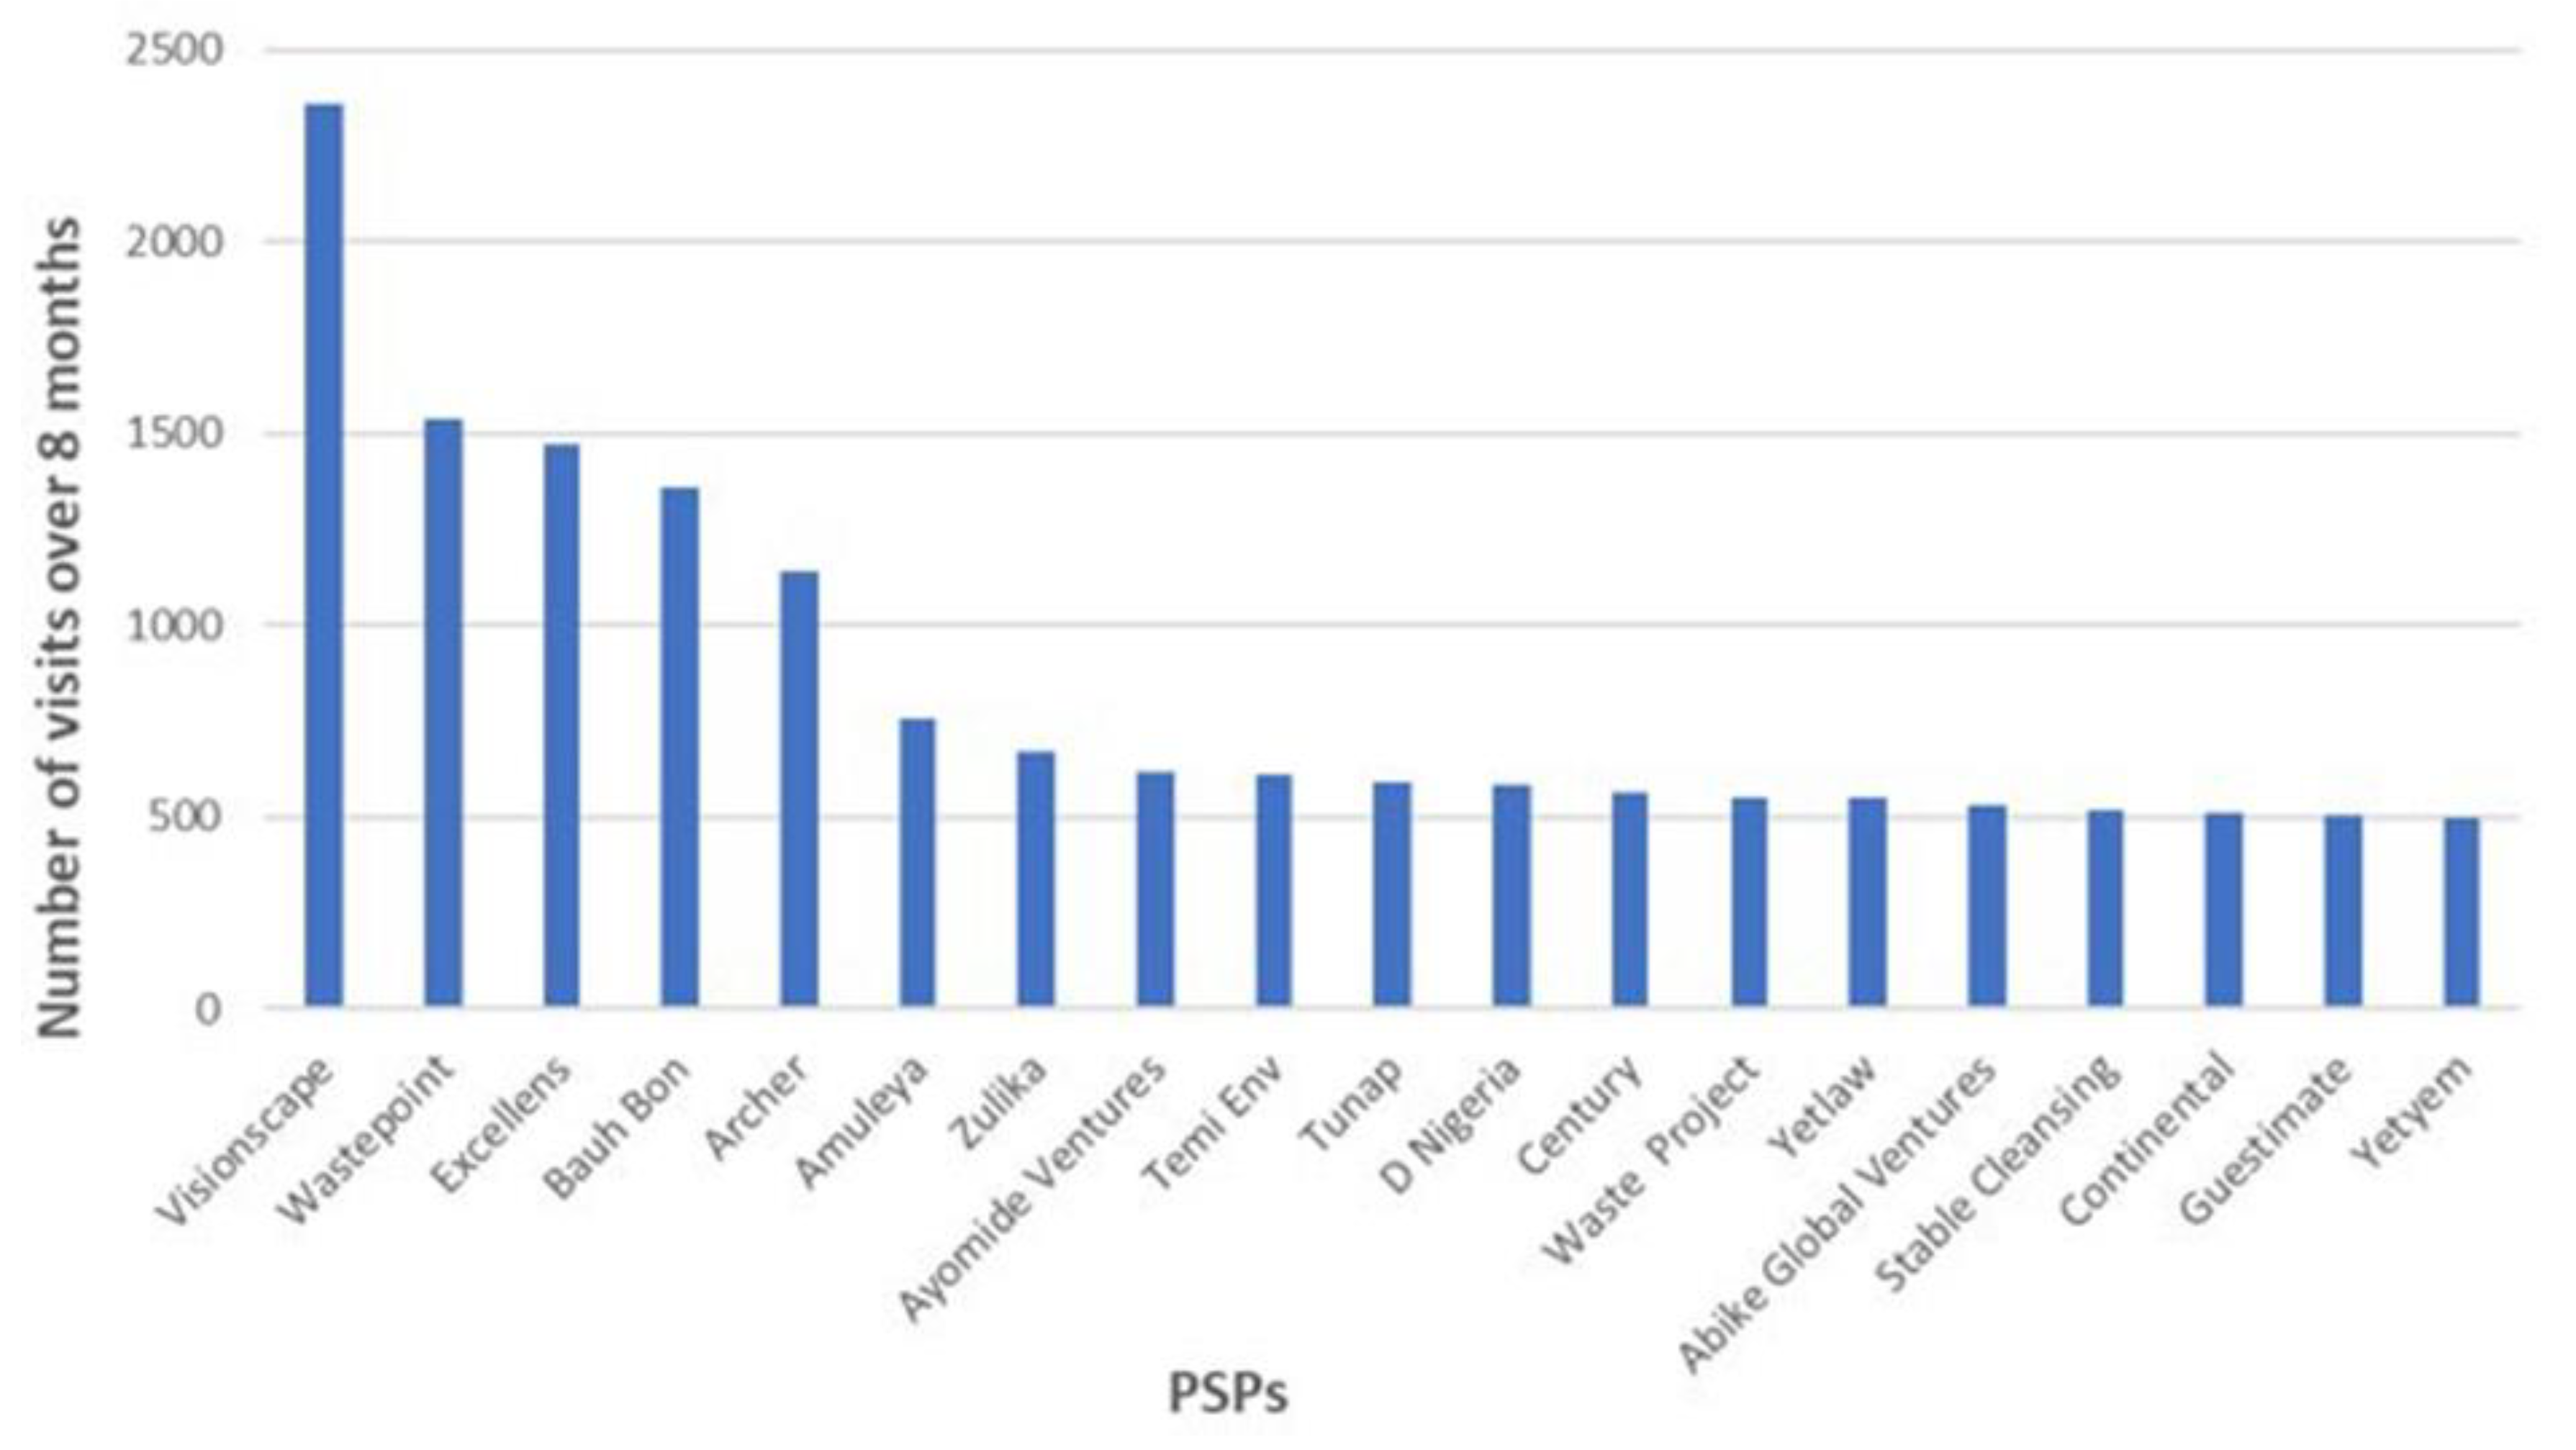
The graph ranks the top waste collection providers by total trips to any landfill. (LAWMA, including the absorbed Visionscape operations, is excluded for scale; it made 10,185 trips in the period, dwarfing all others.) Among private companies, Waste Point, Excellens, Bauh Bon, and Archer were leading, each with on the order of 500–1500 trips. In contrast, many licensed PSPs had minimal activity. Top performers approached 20–25 trips per vehicle per month, whereas several mid-tier and smaller PSPs operated well below capacity. This disparity suggests significant inefficiencies and resource underuse among the numerous smaller contractors.
Notably, LAWMA’s heavy involvement is a double-edged sword. While it provides crucial capacity and stepped in to cover gaps after a private operator’s failure, it also means the system relies heavily on a single entity – which poses a risk if that entity faces financial or operational strain. The episode with Visionscape’s short-lived operation underscores this fragility: after Visionscape’s exit, some areas experienced temporary service disruption until LAWMA reallocated resources. This incident reveals that without robust contingency plans, the collapse of a major PSP can leave significant portions of the city unserved.
Temporal and Spatial Patterns
Weekly Cycle: Analysis of trips by day of week shows that collection activity occurs every day but is significantly reduced on Sundays. Over the 8-month period, Tuesdays averaged the highest number of landfill visits (around 13,128 total Tuesday trips across all sites), whereas Sundays had the lowest (approximately 5,443 trips). In other words, Sunday’s volume is roughly 60% lower than the mid-week peak. This aligns with typical work routines – PSP crews likely operate at full capacity from Monday through Saturday, with only limited service on Sundays. Figure 6 illustrates the average daily trips for each day of the week, combining all landfills. The sharp drop on Sunday suggests latent capacity: if some Sunday collections were increased, it could offload pressure from extremely busy weekdays like Tuesday. However, cultural norms (a day of rest) and cost considerations (overtime pay) currently limit Sunday operations. Notably, this pattern holds true for waste volumes as well; the estimated tonnage disposed is similarly lower on Sundays compared to other days (see Figure 3).
Daily Timing: Waste trucks in Lagos begin operations early and continue into the night. Landfill entry records show activity virtually 24 hours a day, though nights are much quieter. Across all sites, midday (around 12:00–1:00 PM) is the busiest period, with a pronounced peak in arrivals. After the morning build-up, activity stays relatively high through the afternoon and then tapers off in the evening. Very few trips occur during the late night and pre-dawn hours (roughly 11:00 PM to 4:00 AM see minimal activity). Figure 7 shows the distribution of landfill trips by time of day (aggregated hourly for all landfills). The midday peak may reflect coordinated scheduling – many collection routes aim to finish by noon, or perhaps traffic conditions are somewhat more favorable around lunch hours. Conversely, the lowest activity between midnight and 5:00 AM is expected due to a combination of factors: most interim community dump points (if any) are closed, crew work shifts end, and night-time driving carries safety risks. The fact that some waste disposal does occur overnight (albeit limited) is notable; it may indicate that a subset of operators run late shifts to avoid traffic or to service commercial clients after hours. The continuous nature of operations underscores that Lagos never fully stops moving waste, even though capacity dips at certain times.
Monthly Trends: Over the study horizon (mid-2018 into early 2019), the data did not reveal a strong seasonal trend in waste quantities, aside from the disruptions noted above. Monthly totals across all landfills fluctuated within a limited range. April 2019 was the busiest month for landfill trips, and November 2018 the quietest, but November’s low was largely due to Olusosun landfill’s partial closure (zero waste received in October 2018 and very little in November) for maintenance after the March 2018 fire. Excluding that anomaly, the remaining months showed relatively steady waste inflows, suggesting that waste generation in Lagos is fairly consistent year-round with little variation due to seasons. Holiday periods like late December might have slightly lower formal collections (some PSP staff on break, or households generating less waste when traveling), but the data resolution was not fine enough to conclusively tie specific minor dips to holidays.
Landfill Utilization Differences: Each of the six landfills serves distinct areas of the city. The data showed that Olusosun, Solous, and Igando (all serving densely populated mainland urban areas) consistently had the highest number of daily visits – often on the order of 180–200 vehicles per day each under normal conditions. Epe and Badagry (far-flung sites on the metropolitan edges) saw far fewer trucks per day (typically 60–100), since they are distant and serve less populated zones or only specific PSPs. Ikorodu was intermediate between these extremes. Lower traffic at certain landfills like Badagry might indicate under-served areas or a preference of PSPs to avoid a distant site except when necessary, potentially leading to inequities in service (waste from far-west LGAs might be illegally dumped rather than hauled all the way to Badagry). When Olusosun closed, the strain on other sites was noticeable – Solous and Igando saw temporary increases, but overall collection dropped, implying limited redundancy in the system. The variation in landfill usage suggests that proximity and accessibility significantly influence where PSPs dump their loads. Most trucks appear to choose the nearest available landfill to minimize travel time, which is logical given fuel costs and traffic. However, this behavior can overload the central sites while peripheral sites remain under-utilized.
Transportation and Congestion Impacts
Perhaps the most striking finding is the extent of travel and delay imposed by Lagos’s geography and traffic on the waste collection process. Each collection truck on average travels tens of kilometers per round trip from its service area to the landfill and back. Summing across the city, the total distance driven by all collection vehicles was estimated at approximately 3,200 km per day. This immense daily mileage equates to over 1.1 million km per year – highlighting not only high operational costs (fuel, maintenance) but also the substantial carbon footprint of waste transport. Indeed, these diesel-fueled trucks contribute significantly to emissions and air pollution. More concerning is how inefficient much of this travel is: field observations and Google Maps API estimates concur that trucks commonly spend well over half of their journey time sitting in traffic jams. Peak-hour gridlock on major haul routes (e.g., the Apapa-Oshodi Expressway or 3rd Mainland Bridge) can prolong a trip dramatically. The dataset’s timestamps indicate that a one-way trip that might be ~30 km and normally 1 hour with free-flow traffic could take 2+ hours during Lagos rush hours.
Such delays effectively reduce the number of trips a truck can complete in a day. If congestion were lower, many trucks could perhaps fit in an extra landfill run per day, increasing effective collection capacity. The routing is also inefficient in many cases: with no transfer stations, trucks from far areas (e.g., Lagos Island or Lekki) must drive all the way to distant landfills like Epe or Olusosun. Some PSPs serving remote zones had extraordinarily long routes (over 60 km one-way). The absence of intermediate dump points or transfer facilities forces every vehicle – even small ones – to complete the entire haul to the landfill. This not only wastes time but causes heavy wear on vehicles and high fuel consumption. The data showed, for example, that trucks serving Lagos Island (the dense downtown area separated by lagoon) had among the longest cycle times and often got stuck in city-center traffic, contributing disproportionately to the delay statistics. These inefficiencies manifest as high operational costs for PSPs (fuel, vehicle maintenance) and, by extension, higher service costs for the city. It is little surprise that collection fees in Lagos are high and some areas remain unserved – servicing distant neighborhoods is logistically arduous and expensive under the current system.
Observed Inefficiencies and Systemic Challenges
Combining the above results, several inefficiencies in Lagos’s waste collection system become evident:
- Under-collection and Informal Leakage: With only 32% of waste reaching official disposal, a huge portion remains unaccounted for. This points to insufficient collection coverage (many households are not served by any PSP) and a reliance on informal waste handling. It represents lost opportunities for resource recovery and significant environmental leakage (open dumping and burning of waste).
- Uncoordinated PSP Operations: The fragmentation among hundreds of PSPs leads to inconsistent service quality. Some neighborhoods may have multiple small PSPs, none of whom achieve scale or efficiency, while other areas have just one capable operator. The lack of coordination can result in overlapping routes or conversely entire zones being neglected. The variation in trips per vehicle (ranging roughly from 12 to 30 per month) suggests that standardizing and optimizing route assignments could enable fewer trucks to serve the same waste demand more efficiently.
- Vehicle Underutilization: A considerable portion of the fleet is under-used – many trucks made only a handful of trips. Whether due to maintenance downtime, fuel/cost constraints, or poor management, this indicates capital investment that is not yielding returns. Improving fleet utilization (e.g., through better maintenance programs, leasing or reallocating idle trucks to busier PSPs, or consolidating very small PSP operations) could raise overall system efficiency.
- Temporal Imbalances: The strong weekly and daily peaks (busy Tuesdays, and midday rush hours) mean that resources – trucks and manpower – are strained at certain times and under-utilized at others. Encouraging off-peak operations (for instance, more evening or Sunday collections) could distribute the workload more evenly. This might require policy nudges or incentives for PSPs to operate in traditionally off hours, but it could relieve peak-time pressure.
- Geographical Imbalances: Certain areas (especially distant suburbs) appear under-served, and their nearest landfills are underutilized, while central landfills face pressure. This imbalance causes some trucks to drive excessive distances to just a few major landfills, worsening congestion there. A more balanced allocation of waste to disposal sites – for example, by developing additional facilities or strategically located transfer stations in high-need areas which could reduce travel distances and spread the load more evenly across disposal sites.
- Traffic Congestion and Lack of Transfer Infrastructure: The current practice of point-to-point hauling from source to landfill is clearly inefficient in a congested metropolis. Without any transfer stations in the city, even small collection trucks must travel all the way to the landfill. A transfer station located within the city could allow smaller trucks to offload closer to their collection zones, and larger trucks or trailers could then haul consolidated loads to distant landfills. This would cut down the number of vehicles on the road for long trips and the total kilometers driven. Without such infrastructure, Lagos’s waste logistics will remain sluggish, costly, and congestion-prone.
- Operational Resilience: The Olusosun landfill fire and the Visionscape episode exposed how a disruption can cripple the system. There is a lack of spare capacity or robust backup plans when a major landfill is offline or a major collector pulls out. Building redundancy – whether through additional landfill sites, emergency dump sites, or flexible contracts that allow rapid re-routing of waste – is essential to avoid citywide waste pile-ups during such events.
Discussion
The analysis provides a data-driven diagnosis of Lagos’s municipal waste collection challenges. Many findings resonate with known issues in other developing megacities’ waste systems: inadequate coverage, traffic-induced inefficiency, and the complexity of managing numerous small private contractors (Imam et al., 2008). What Lagos’s case particularly underscores is the critical role of logistics in waste management performance. The sheer time and distance spent by collection vehicles highlight that waste management is also a transportation problem. In policy terms, this suggests that solutions must go beyond just procuring more trucks or hiring more PSPs – they must address route optimization, traffic management, and infrastructure.
One immediate implication is the potential value of introducing transfer stations within Lagos’s urban area. The results show that currently a truck servicing, say, Lagos Island might travel 60–70 km roundtrip to dump at Epe landfill, spending hours in traffic. A transfer station located midway (for example, in the Lekki corridor) could cut that travel distance dramatically. Indeed, the data revealed clear evidence of excess travel: for many waste collection zones, beyond a certain distance, the travel hours per day per truck ballooned, hinting at inefficiencies that a well-placed transfer point could alleviate. Cities like Cairo and São Paulo have successfully employed transfer stations to streamline waste logistics; Lagos could follow suit, albeit with careful consideration of land availability and community acceptance for those facilities (Ramos et al., 2013).
Another area for improvement is optimizing PSP management. The wide disparity in performance among PSPs suggests that capacity-building and stricter regulation could help. LAWMA might enforce minimum service standards (for example, a minimum number of trips or tonnage collected per month for each PSP, to ensure they actively serve their zones) and reallocate or consolidate service areas where tiny operators are failing. Essentially, fewer, more capable contractors might serve the city more effectively than hundreds of micro-contracts. Such consolidation has precedent – cities like Nairobi and Accra, for instance, have explored franchising systems where one competent firm is responsible for a large zone under oversight, rather than many fragmented small providers (Anestina et al., 2014). Lagos itself attempted a similar idea with the ill-fated Visionscape experiment (a single concession for the whole city), which failed due to execution issues, but a more carefully managed middle-ground approach could be considered.
Improved route planning and scheduling could also yield gains. With data on where waste comes from and at what times, LAWMA and the PSPs could coordinate to avoid all trucks heading to the landfill during the same midday peak. Night-time collection could be expanded in commercial districts where traffic is lower at night, for example. The finding that midday is the busiest period while late night is underutilized suggests an opportunity to level the load by shifting some operations to off-peak hours. Of course, challenges like worker safety and community noise concerns at night must be addressed, but many global cities do employ night shifts for waste collection in busy areas to great effect.
The environmental and public health stakes of improving this system are high. Currently, the uncollected waste (68% of daily generation) likely ends up in drainage channels, informal dumps, or burned openly – all of which cause flooding, disease, and pollution (Bassey, 2017). Enhancing collection coverage (by increasing PSP reach into underserved areas or integrating informal waste pickers into the formal system) could drastically reduce these hazards. Moreover, the efficiency improvements (less redundant driving, optimized routes) would cut fuel use and vehicle emissions. This climate co-benefit is significant and aligns with broader sustainability goals for cities. Reducing the time trucks spend in traffic also means less air pollution from heavy vehicles idling on Lagos roads, improving air quality for residents.
A key institutional insight is that LAWMA’s dual role as operator and regulator can be both an asset and a weakness. While it allows quick action (LAWMA can directly deploy its own trucks when PSPs falter), it can also blur accountability. The Visionscape saga, where a private initiative faltered and LAWMA took over its assets, indicates that the governance of PSP contracts needs to be strengthened. Transparent performance metrics and contingency bonds in contracts might ensure that private operators deliver promised services – or else face immediate replacement without service interruption. Additionally, community engagement and public awareness are necessary complements to operational fixes. If citizens understand the importance of using formal collection services (instead of dumping waste illegally), and if they hold service providers accountable for regular pickups, the system’s effectiveness can improve.
Finally, this study demonstrates the value of empirical data in diagnosing waste management issues. By leveraging actual trip records and Geo location based analysis, the study moved beyond anecdotes to quantify the problem – for example, putting a number on “how much waste isn’t collected” or “how much time is wasted in traffic.” These metrics can serve as baselines to track progress. As Lagos or other cities implement reforms (new routes, transfer stations, different PSP structures), repeating such data collection and analysis will be vital to measure improvements. The approach here can be seen as part of developing a smarter, data-informed waste management strategy, aligning with the global push for smart-city solutions in infrastructure management.
Conclusion
The evaluation of Lagos State’s landfill data offers a revealing snapshot of the city’s current waste collection performance and its shortcomings. The study found that while tens of thousands of tonnes of waste are collected and landfilled each month, this represents only a fraction (32%) of the waste actually generated by the population. Inefficiencies pervade the system: fragmented PSP operations, underutilized trucks, congested travel routes, and uneven service distribution all contribute to a suboptimal outcome where large amounts of waste still accumulate in the environment. Key conclusions from this study include:
- Operational Inefficiency: Lagos’s waste collection is hampered by uncoordinated routing and lengthy haul distances. Collection vehicles collectively travel over 3,000 km daily, much of it in gridlock, resulting in severe productivity losses. Many trucks manage only a few trips per week, indicating substantial scope for better route and schedule optimization.
- PSP Performance and Policy: The private-sector-led model has delivered mixed results. A few large operators handle the bulk of waste, whereas numerous small PSPs contribute marginally. This imbalance calls for policy recalibration possibly consolidating service zones, enforcing performance standards, and supporting capable operators to expand coverage. Strengthening LAWMA’s regulatory oversight and establishing contingency plans for PSP failures are essential to avoid service disruptions.
- Infrastructure Gaps: The absence of transfer stations or intermediate processing facilities forces an inefficient “all-the-way-to-landfill” approach. The study findings strongly support introducing transfer stations at strategic locations to dramatically cut transport times and costs. This step, alongside improving road access to landfills, could yield a significant reduction in total collection travel time with proportionate savings in fuel and emissions.
- Environmental and Health Implications: The large quantity of uncollected waste implies continued environmental degradation. Enhancing the formal waste collection system will directly benefit public health by reducing illegal dumping and open burning. Furthermore, efficiency gains in collection (e.g., reduced redundant mileage) translate to lower greenhouse gas emissions and cleaner air in the city.
In conclusion, Lagos stands at a crossroads where continued urban growth will only intensify its waste challenges. The data-driven insights from this study make a compelling case for reforming the waste collection architecture through smarter route planning, investment in transfer and recycling infrastructure, and more effective public-private collaboration. These changes can transform Lagos’s waste management from its currently strained state to a more resilient, sustainable system. While the focus here has been on diagnosing problems, the next step is implementing solutions. In a companion Paper 2, The Authors delve into a modeling exercise evaluating specific interventions (notably the deployment of transfer stations and optimized routing algorithms) and quantify their potential impact on Lagos’s waste collection efficiency, cost, and emissions. Together, these studies aim to support policymakers and stakeholders in taking informed steps toward a cleaner and more livable Lagos.
References
- Ali, M., Chen, L., & Ibrahim, R. (2023). Addressing financial constraints and clarifying institutional roles in waste management. Journal of Environmental Management, 215(4), 345–359. Discusses the importance of clear institutional roles and adequate funding in waste services.
- Anestina, A. I., Nzeadibe, T. C., & Okonkwo, E. E. (2014). Performance assessment of solid waste management following private partnership operations in Lagos State. Journal of Waste Management, 2014, 868072. Examines PSP-based waste management in Lagos and its outcomes, providing background on LAWMA–PSP dynamics.
- Bassey, N. (2017). Illegal Dumping in Lagos. EnviroNews. Notes widespread use of cart-pushers and illegal dumps due to collection gaps.
- Guerrero, L. A., Maas, G., & Hogland, W. (2013). Solid waste management challenges for cities in developing countries. Waste Management, 33(1), 220–232. Highlights factors such as financial constraints and lack of planning in developing-world waste systems. [CrossRef]
- Imam, A., Mohammed, B., Wilson, D. C., & Cheeseman, C. R. (2008). Solid waste management in Abuja, Nigeria. Waste Management, 28(2), 468–472. Documents waste management challenges in Abuja, with similar issues of insufficient collection infrastructure and funding constraints. [CrossRef]
- Kaza, S., Yao, L., Bhada-Tata, P., & Van Woerden, F. (2018). What a Waste 2.0: A Global Snapshot of Solid Waste Management to 2050. Washington, DC: World Bank. Provides global waste generation projections and context for waste challenges in developing cities.
- Lagos State Government. (2017). Press Release: Lagos generates 13,000 tonnes of waste daily. (Official estimate of Lagos’s daily waste generation, contextualizing the scale of the challenge.).
- Lagos Waste Management Authority (LAWMA). (2019). Internal records on PSP operations. Indicates approximately 1,300 collection vehicles in Lagos and PSP performance statistics.
- Ramos, T. R. P., Gomes, M. I., & Barbosa-Póvoa, A. P. (2013). Optimization of municipal solid waste collection routes for minimum fuel consumption. Waste Management, 33(4), 785–792. Underlines route planning as key to cost reduction and efficiency, demonstrating benefits of optimized routing.
- World Bank. (2018). Press Release: Global waste to grow by 70% by 2050 unless urgent action is taken. Details the anticipated increase to 2.2 billion tonnes of waste by 2025 and the urgency of improving waste management systems globally.
- World Population Review. (2017). Lagos population estimated at 21 million. Provides context for the megacity scale of Lagos’s population and related waste generation.
Figure 1.
Map of Lagos State highlighting the location of the six principal landfills studied (Source: Google Maps/Author). This map illustrates the distribution of major waste disposal sites across the state.
Figure 1.
Map of Lagos State highlighting the location of the six principal landfills studied (Source: Google Maps/Author). This map illustrates the distribution of major waste disposal sites across the state.
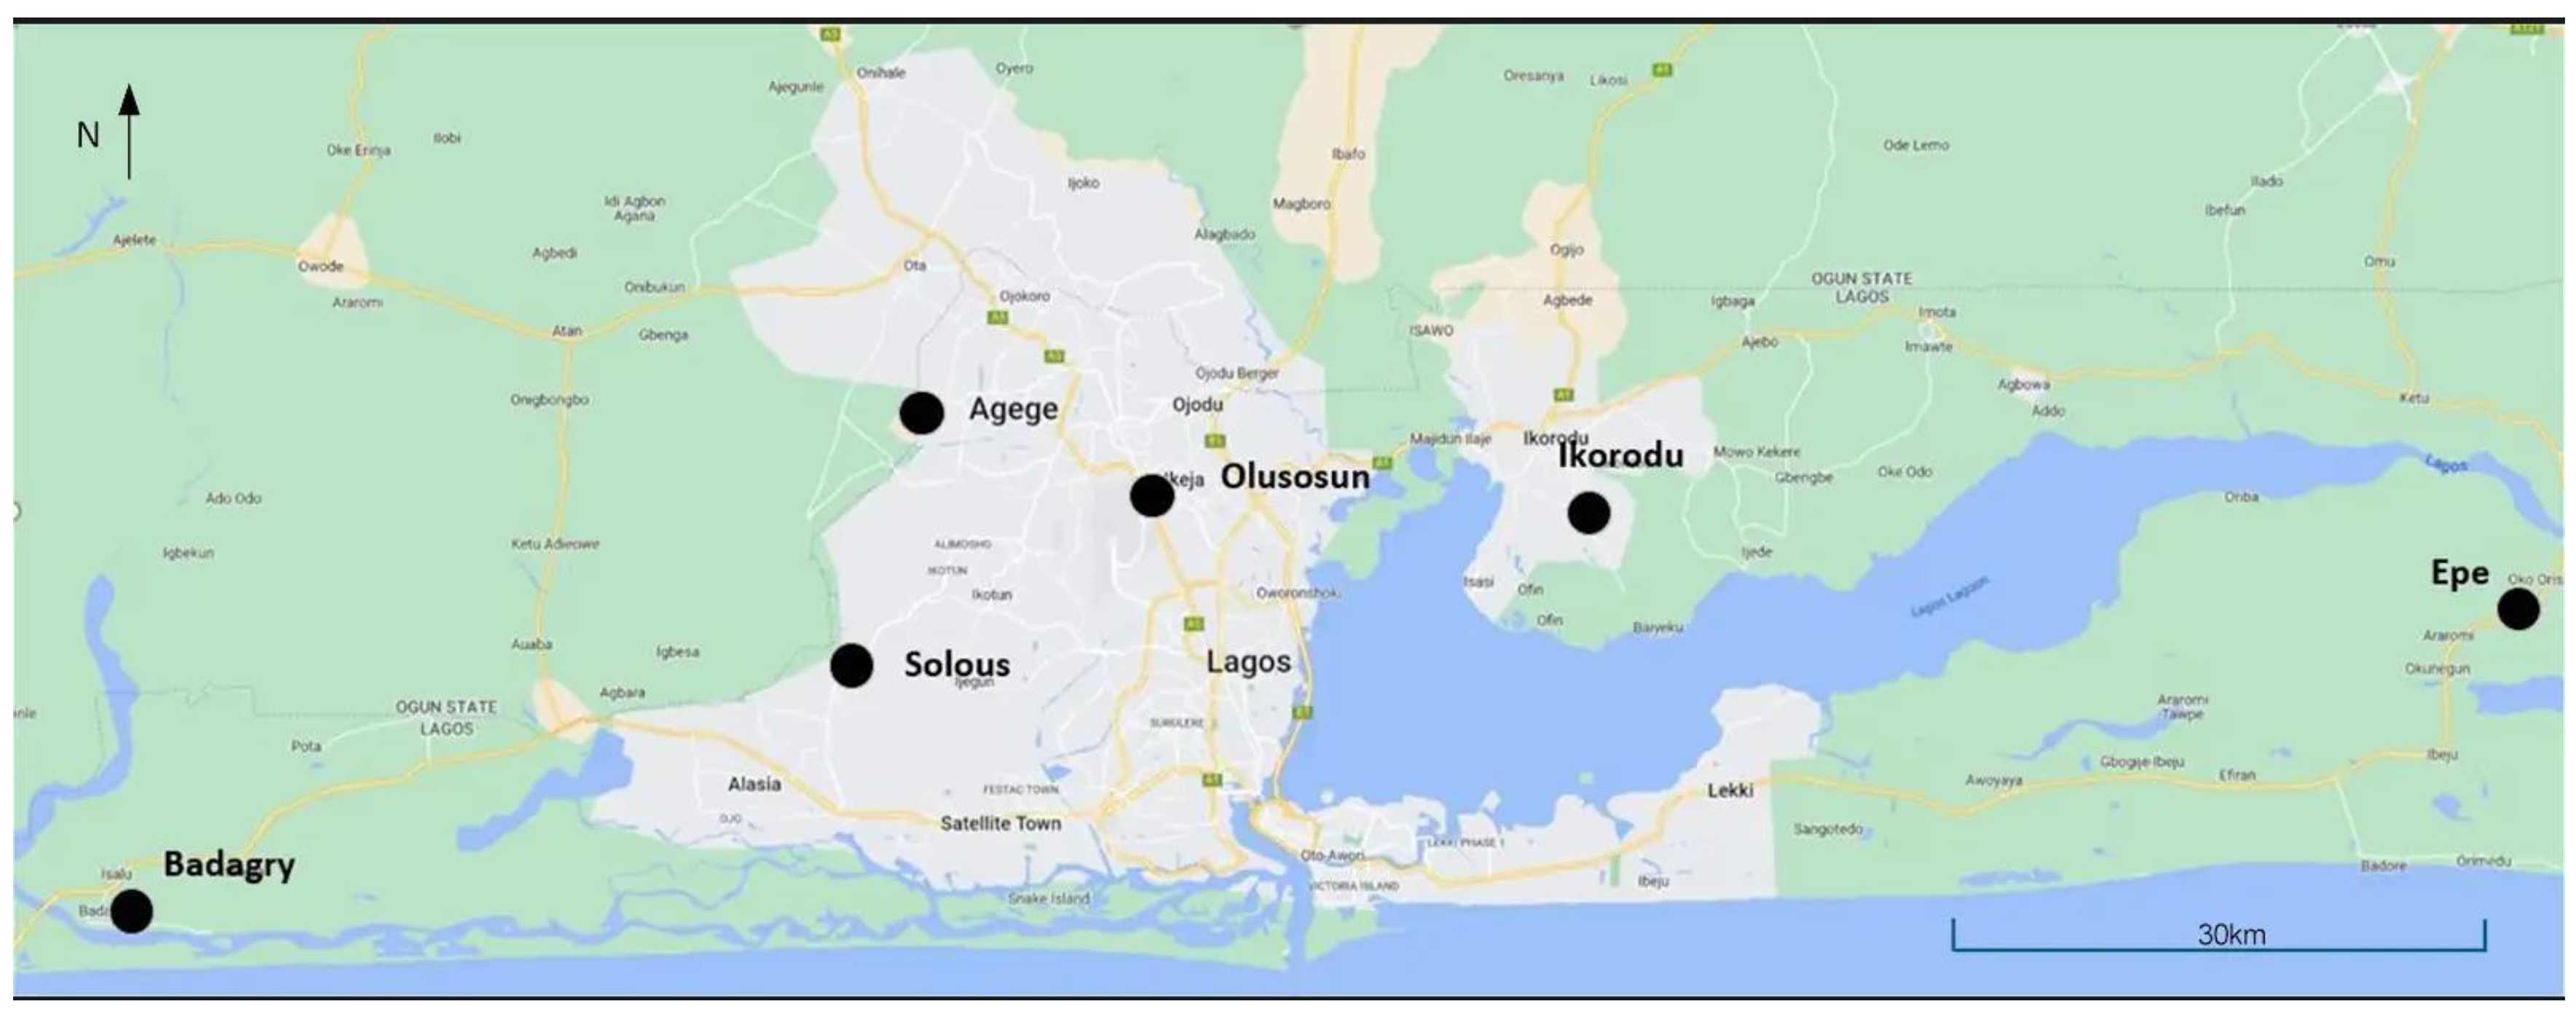
Figure 2.
Graph showing the number of trips taken in each month across the six landfills (September 2018–April 2019). The data indicate variation in landfill usage over the study period, with the highest overall activity observed in April 2019 and the lowest in late 2018.
Figure 2.
Graph showing the number of trips taken in each month across the six landfills (September 2018–April 2019). The data indicate variation in landfill usage over the study period, with the highest overall activity observed in April 2019 and the lowest in late 2018.
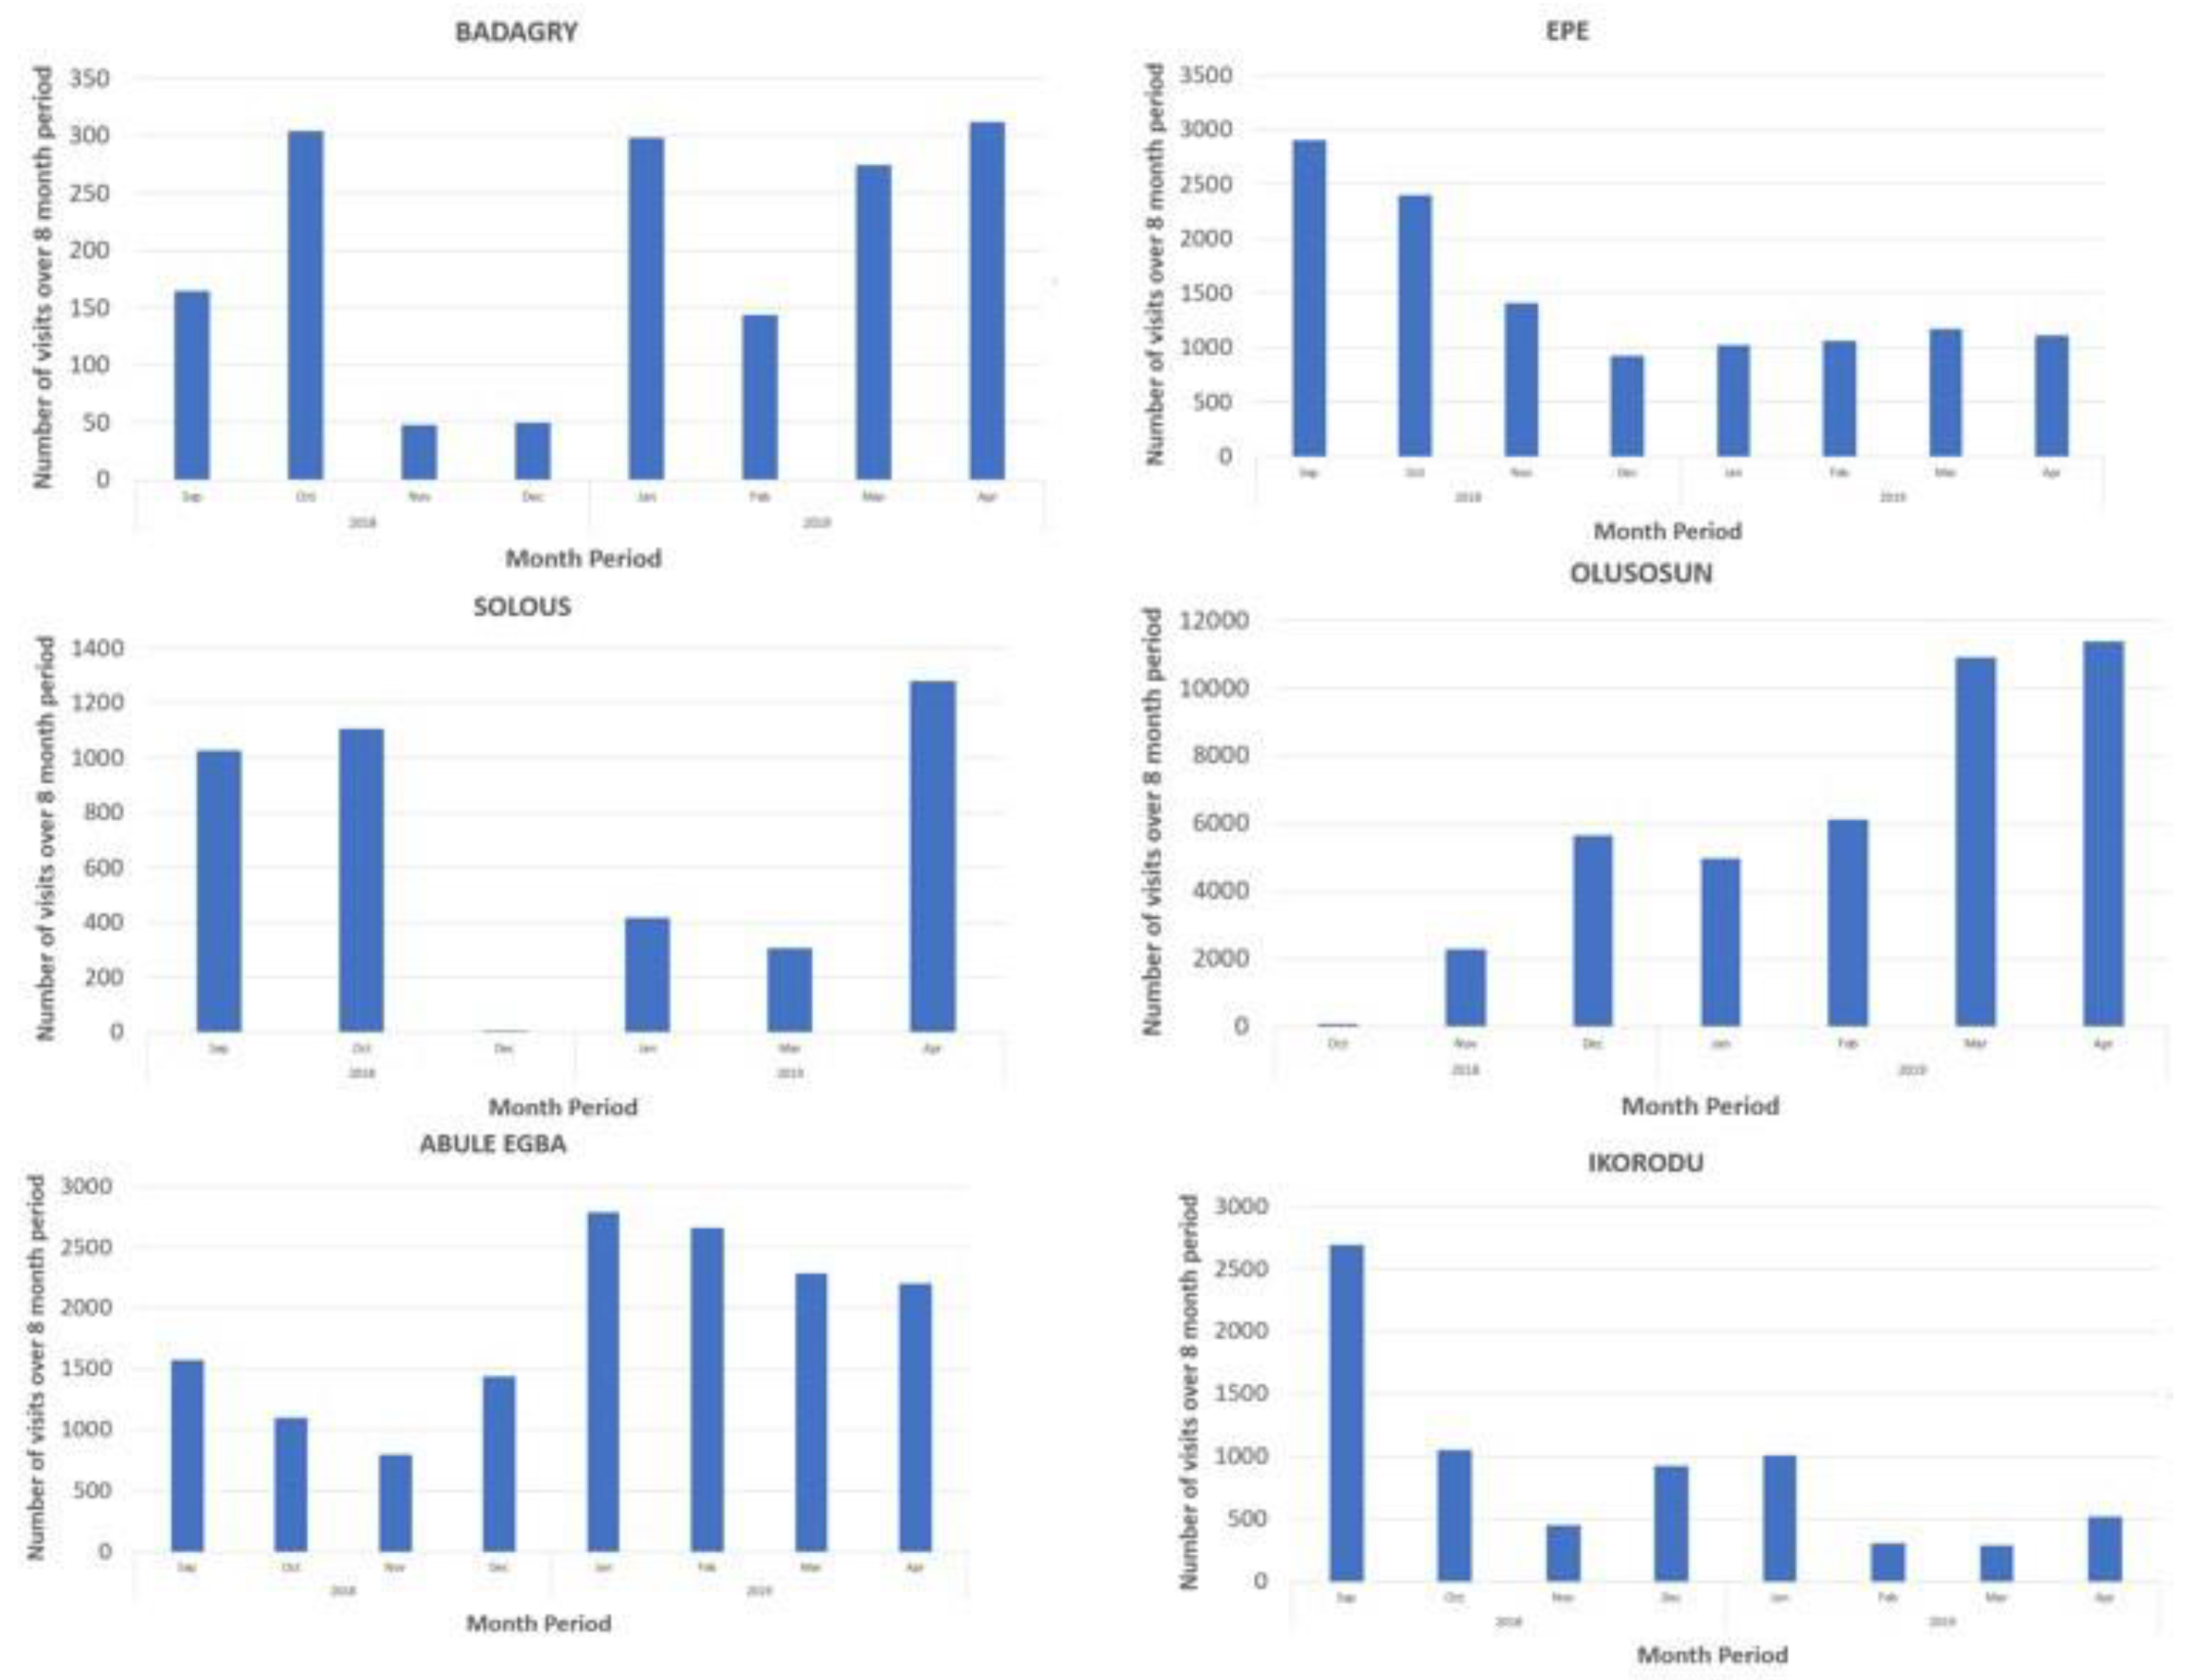
Figure 3.
Graph comparing the estimated total waste deposited at the six landfills by day of the week (aggregated over the 8-month period). Waste disposal activity is substantially lower on Sundays compared to weekdays.
Figure 3.
Graph comparing the estimated total waste deposited at the six landfills by day of the week (aggregated over the 8-month period). Waste disposal activity is substantially lower on Sundays compared to weekdays.
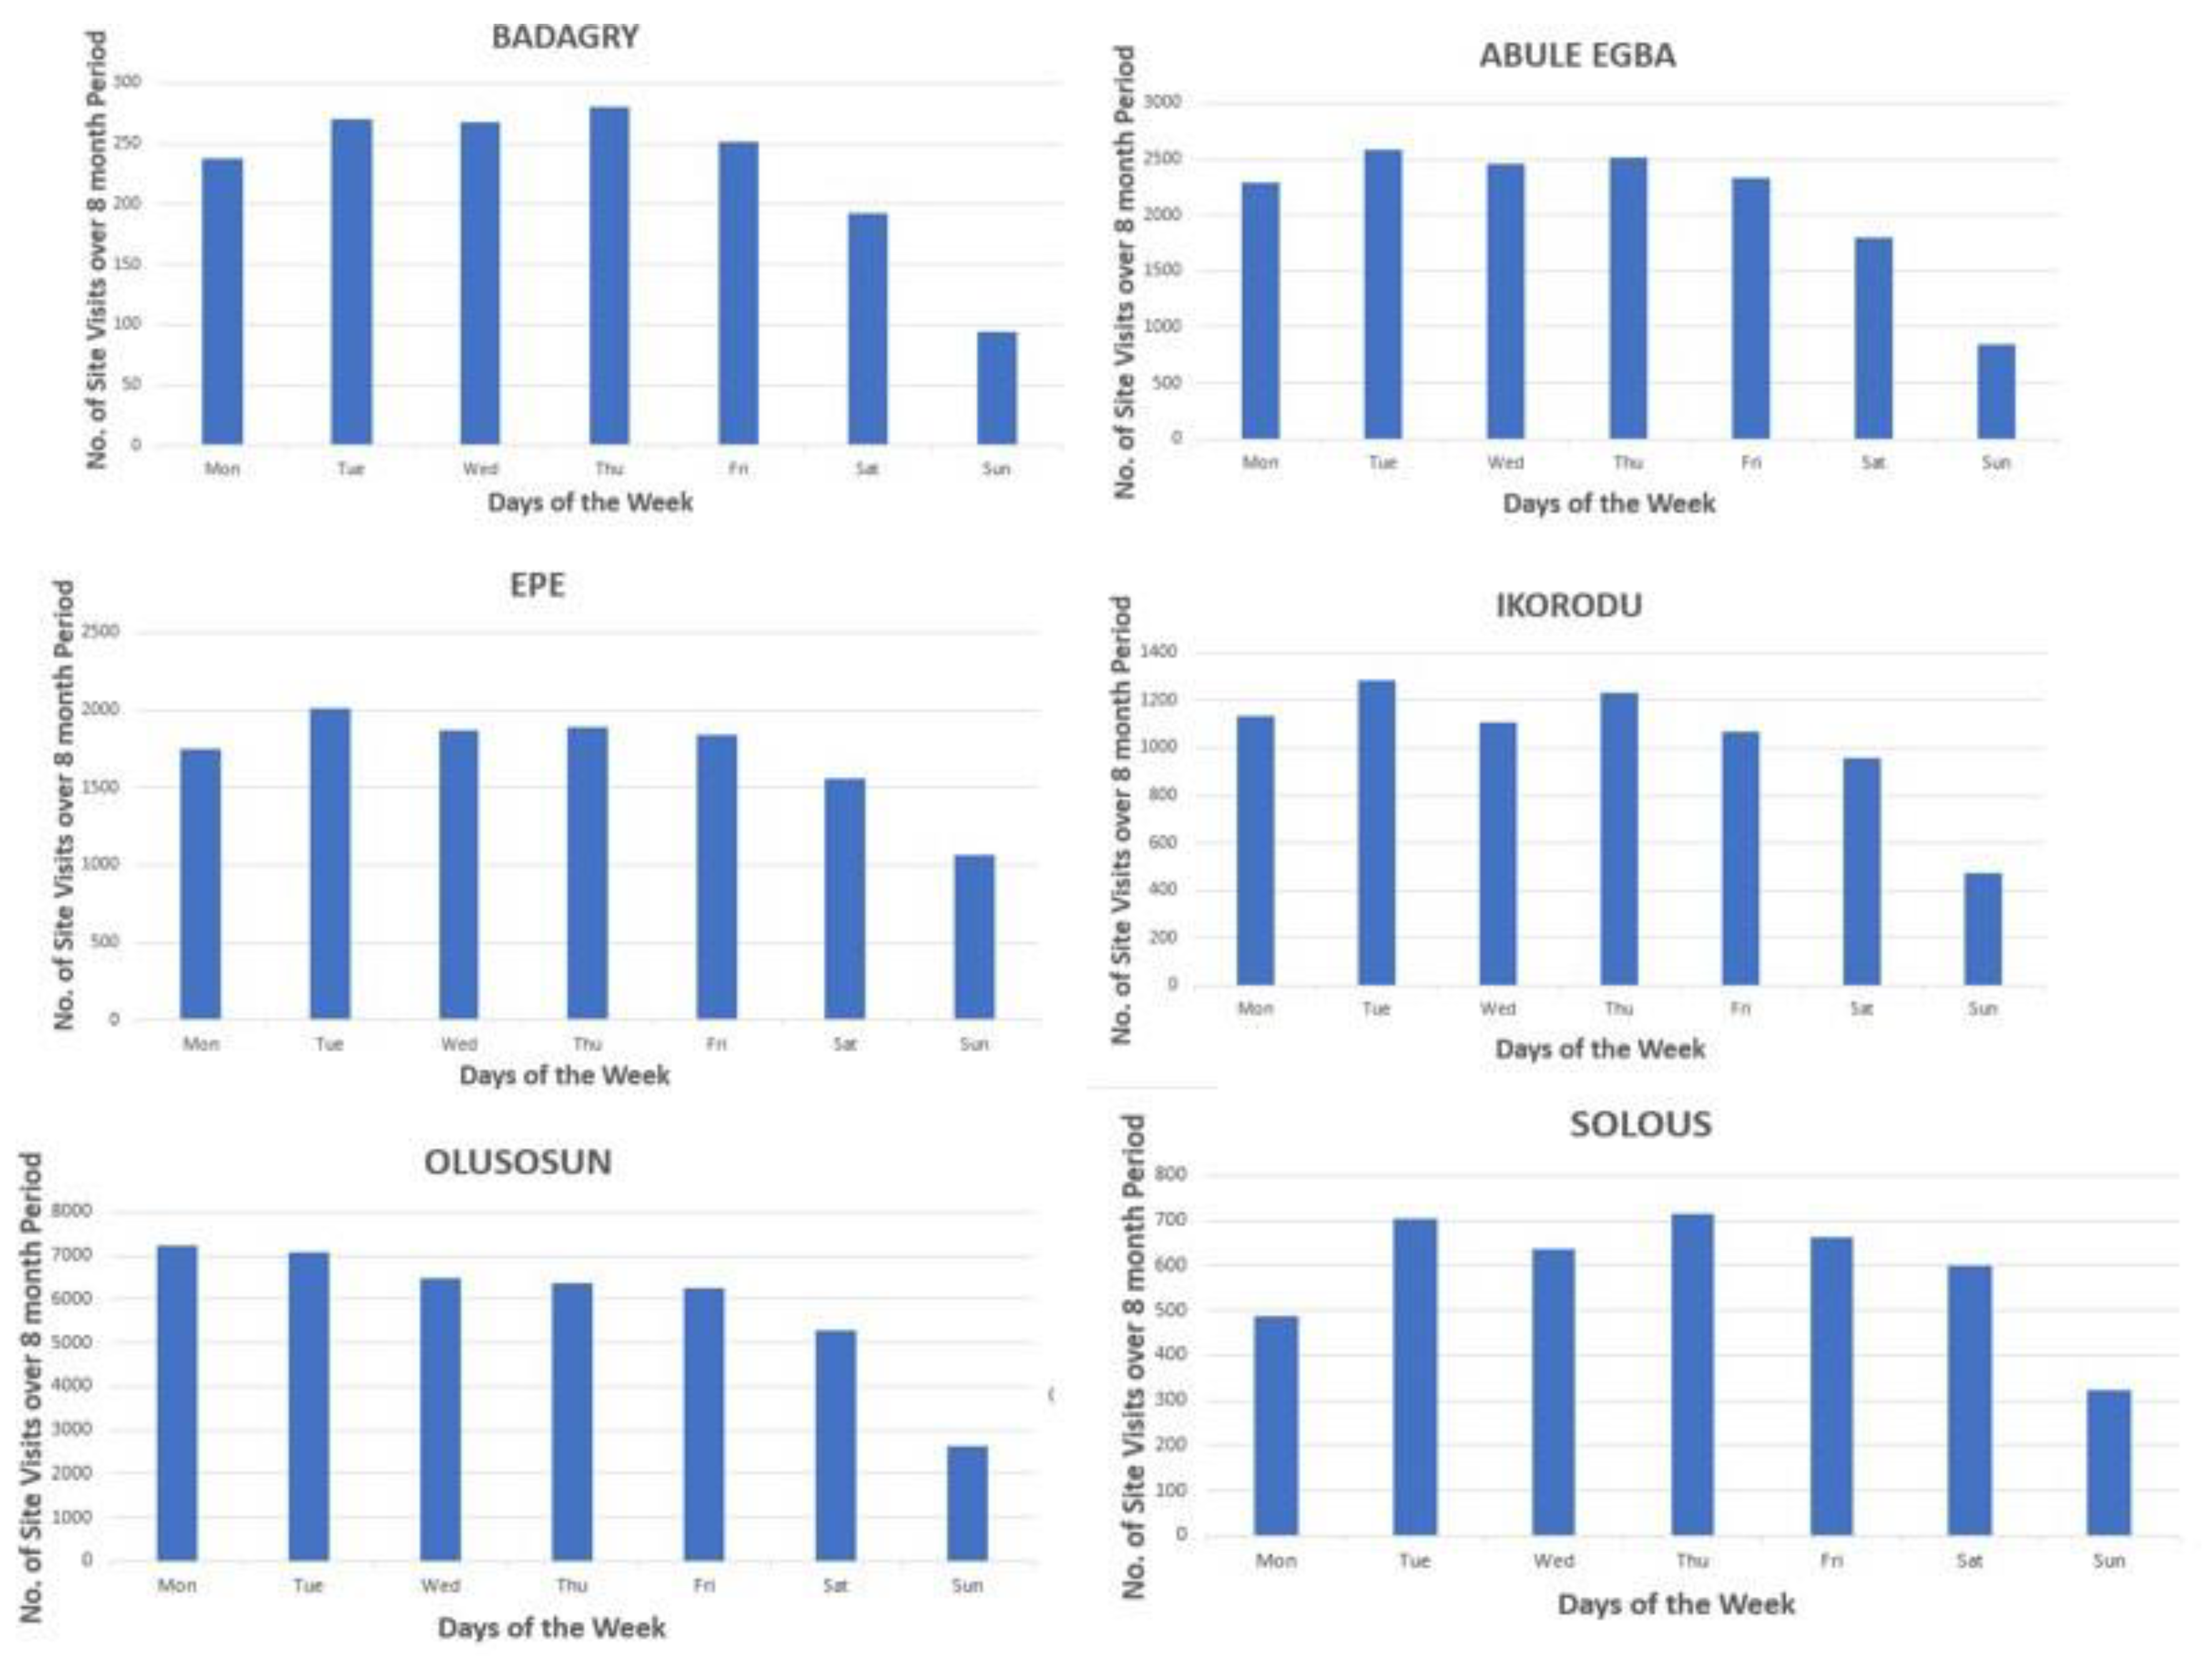
Figure 4.
Graph showing the distribution of waste collection vehicle arrivals by time of day across the six landfills (aggregated). It highlights a pronounced midday peak in truck arrivals and minimal activity during late-night hours.
Figure 4.
Graph showing the distribution of waste collection vehicle arrivals by time of day across the six landfills (aggregated). It highlights a pronounced midday peak in truck arrivals and minimal activity during late-night hours.
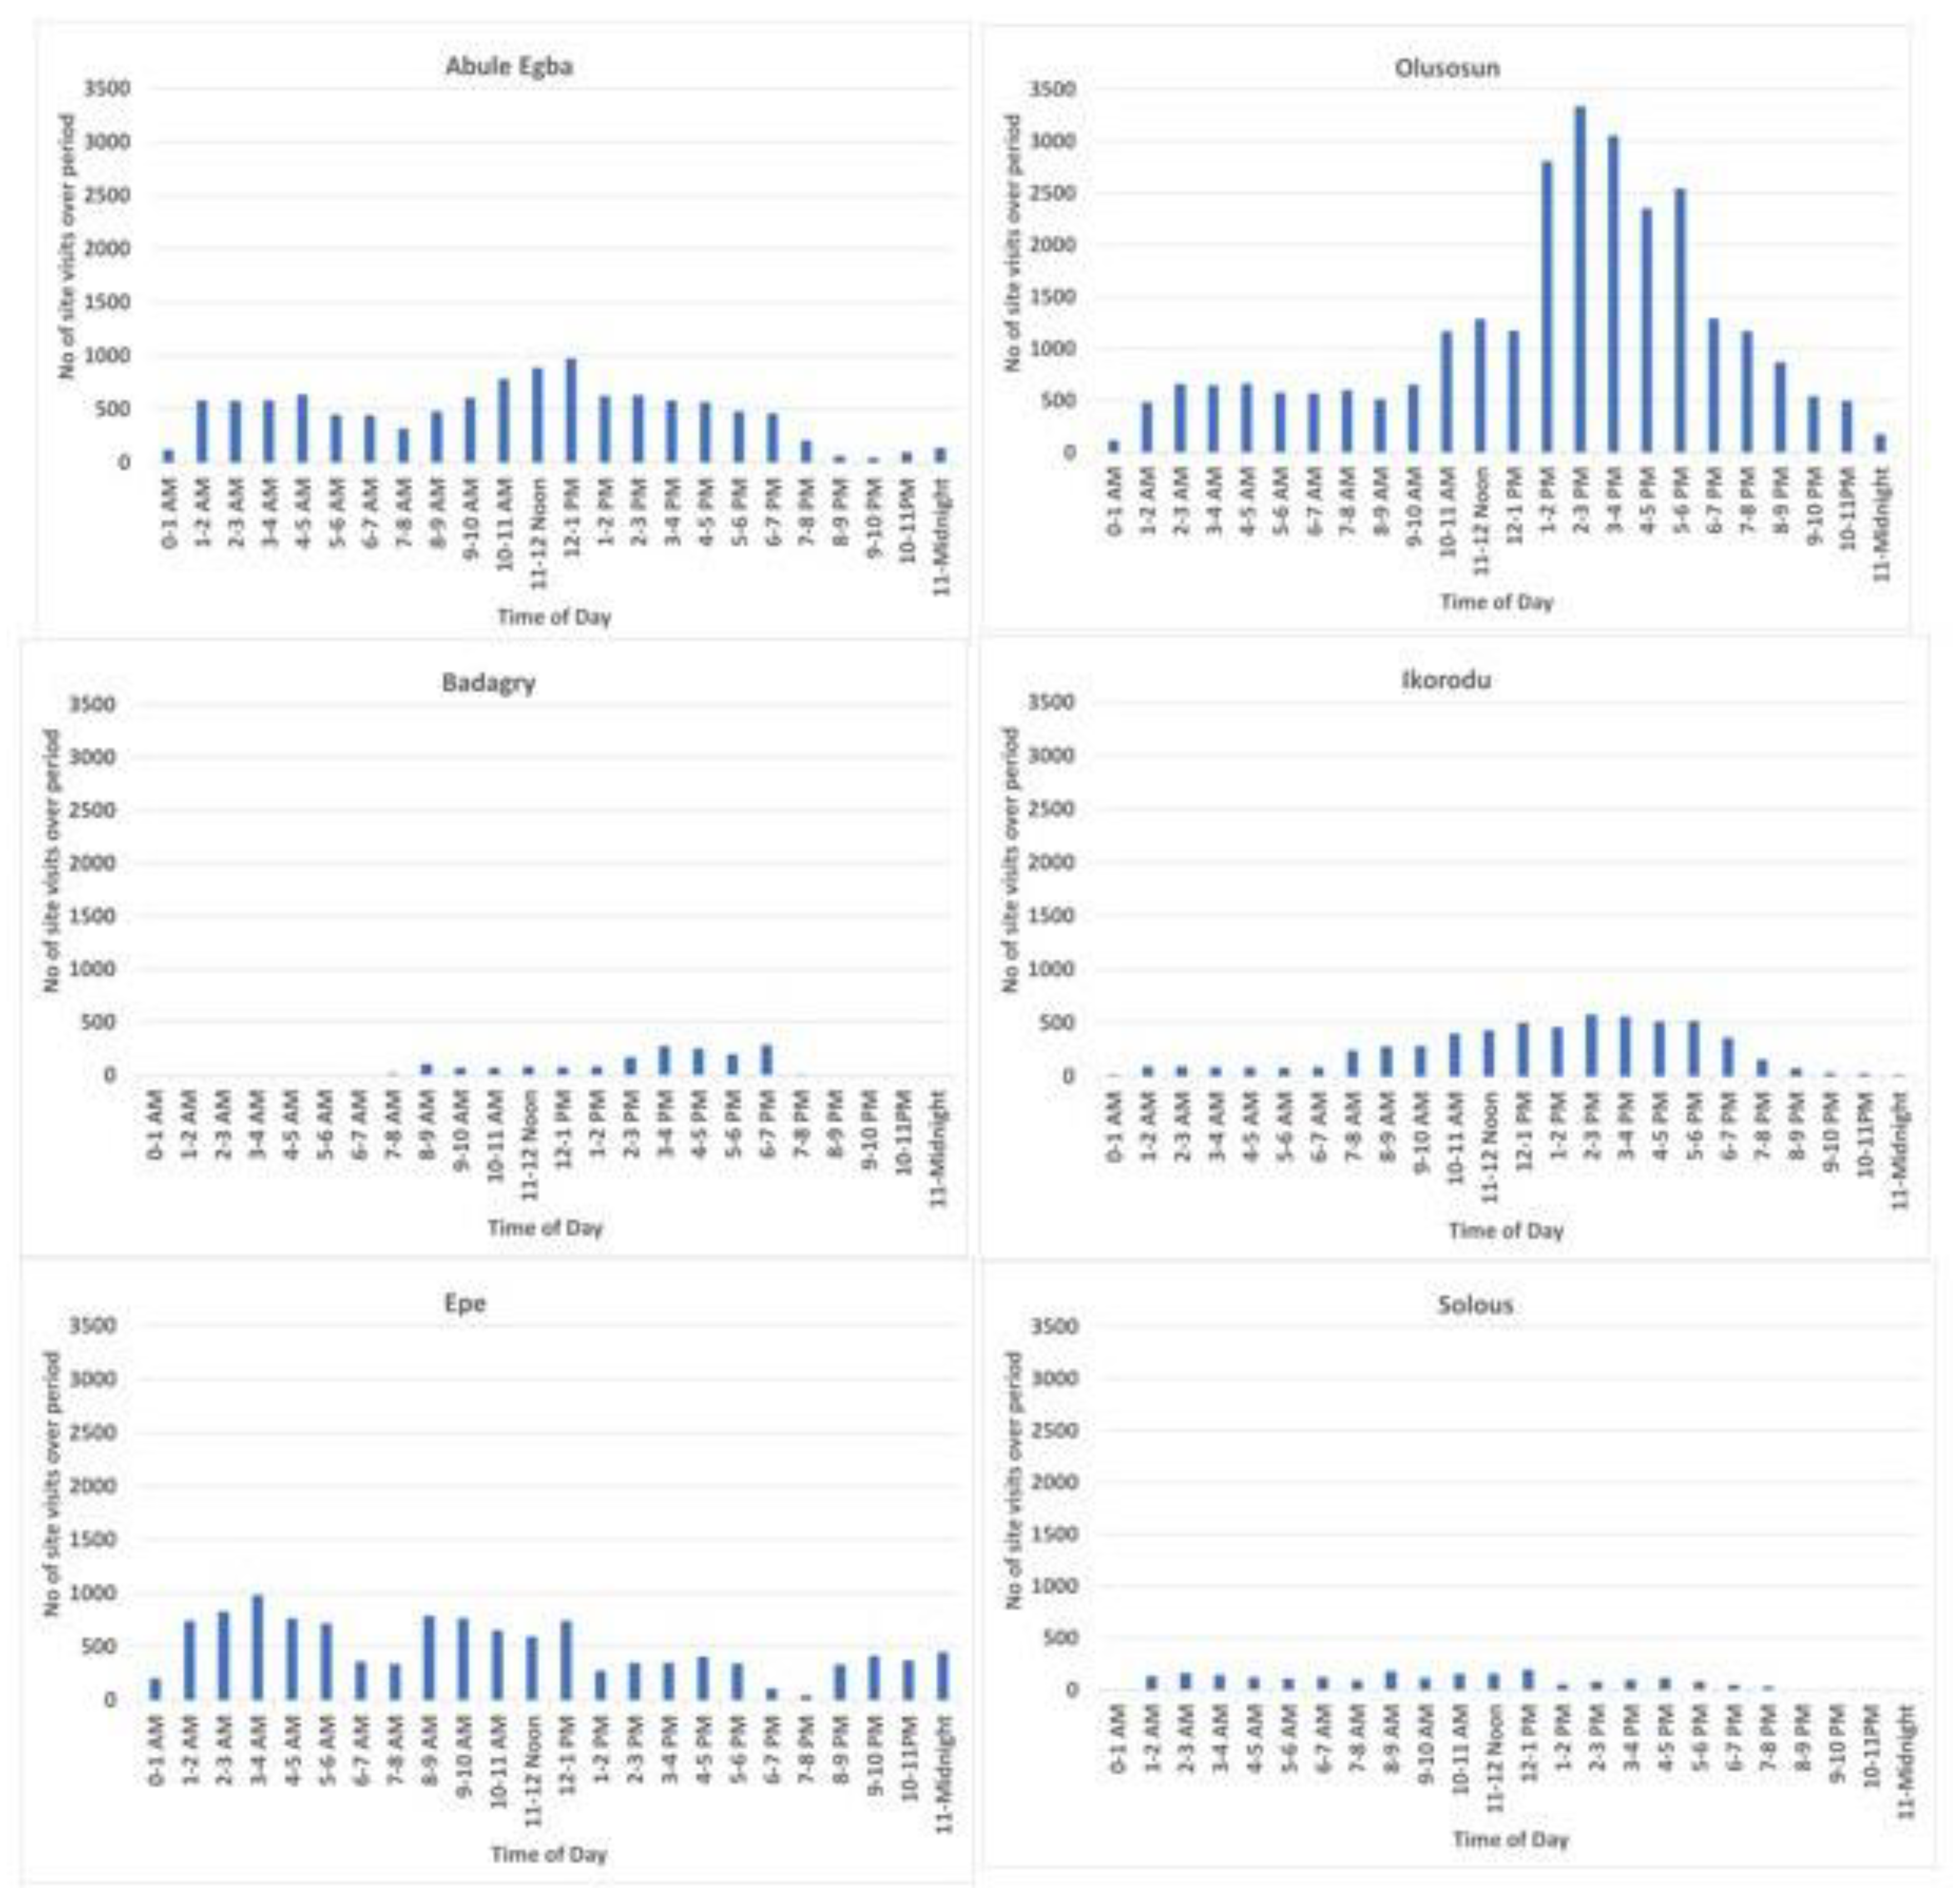
Figure 6.
Comparison of the number of waste collection trips to the six landfills by day of the week (Source: Author). The combined total trips per day (stacked by landfill) highlights how Sunday collection activity is markedly lower than on weekdays, with Tuesday seeing the highest volume of trips.
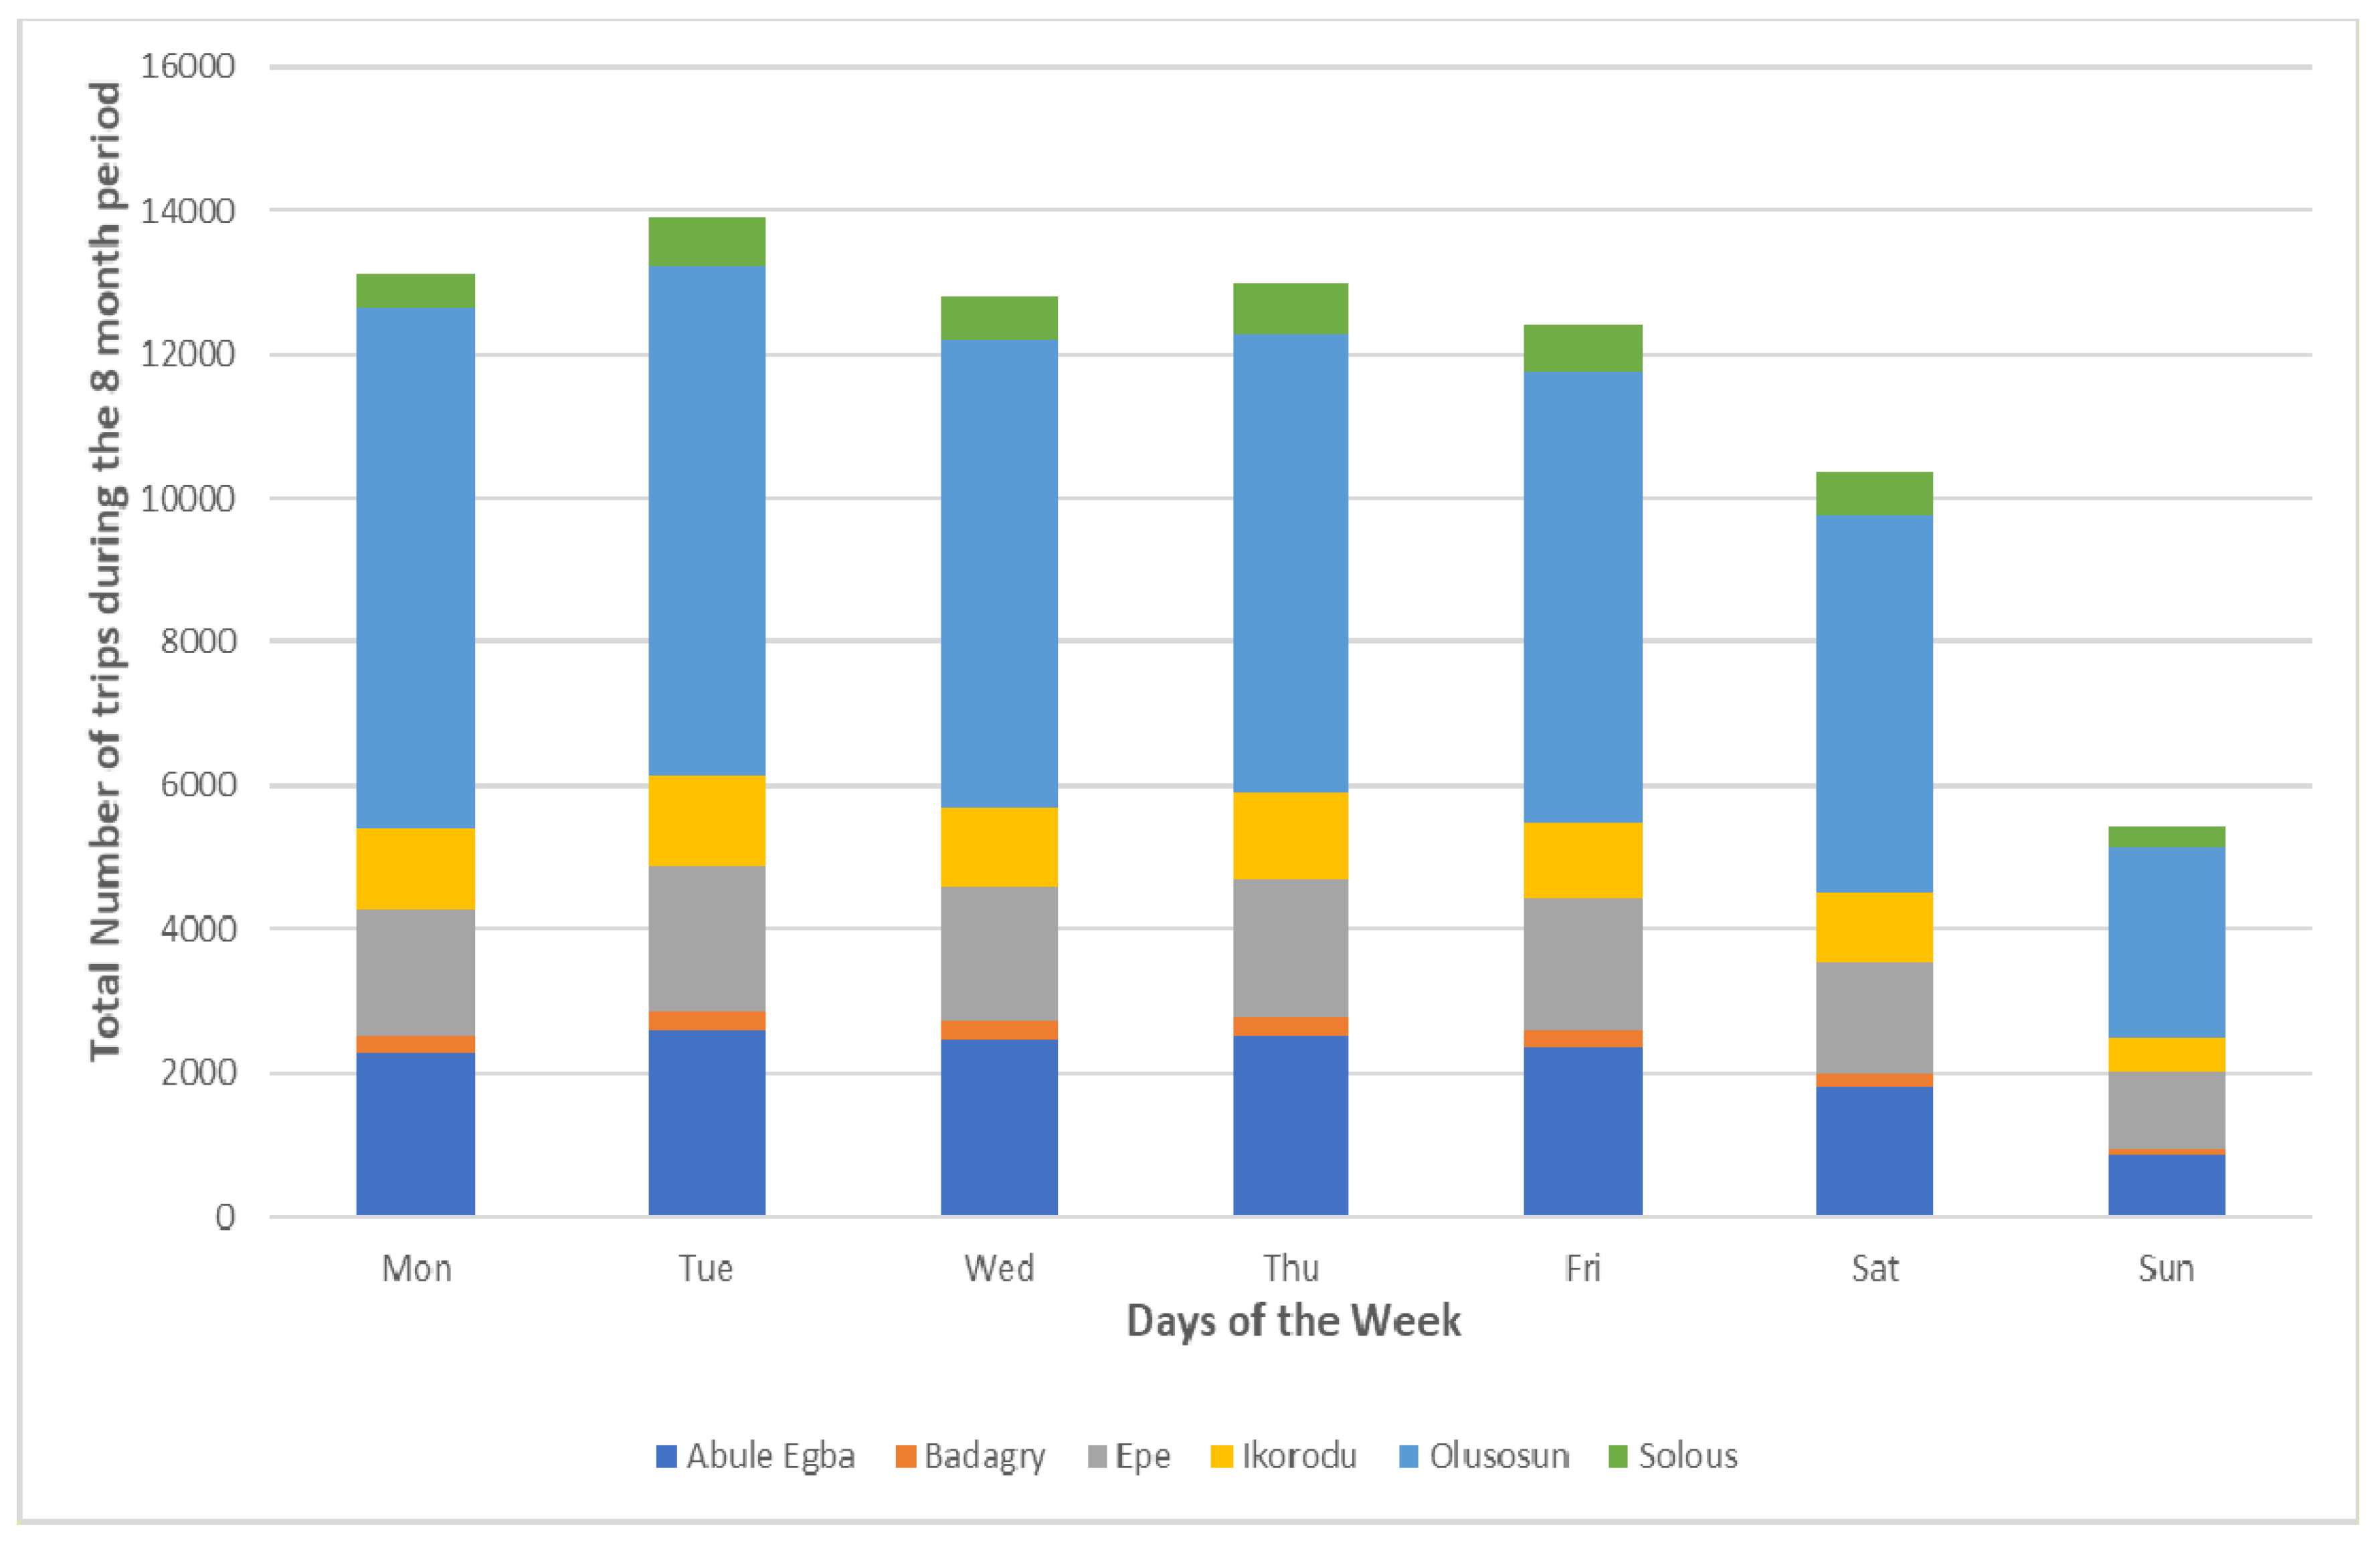
Figure 7.
Distribution of waste collection trips to the six landfills by time of day (hourly aggregated) over the study period (Source: Author). Landfill deliveries ramp up in the morning and reach a peak around midday (12 noon), then decline into the late evening. Very few trips occur during the late-night hours (after 11:00 PM), reflecting reduced operations during those times.
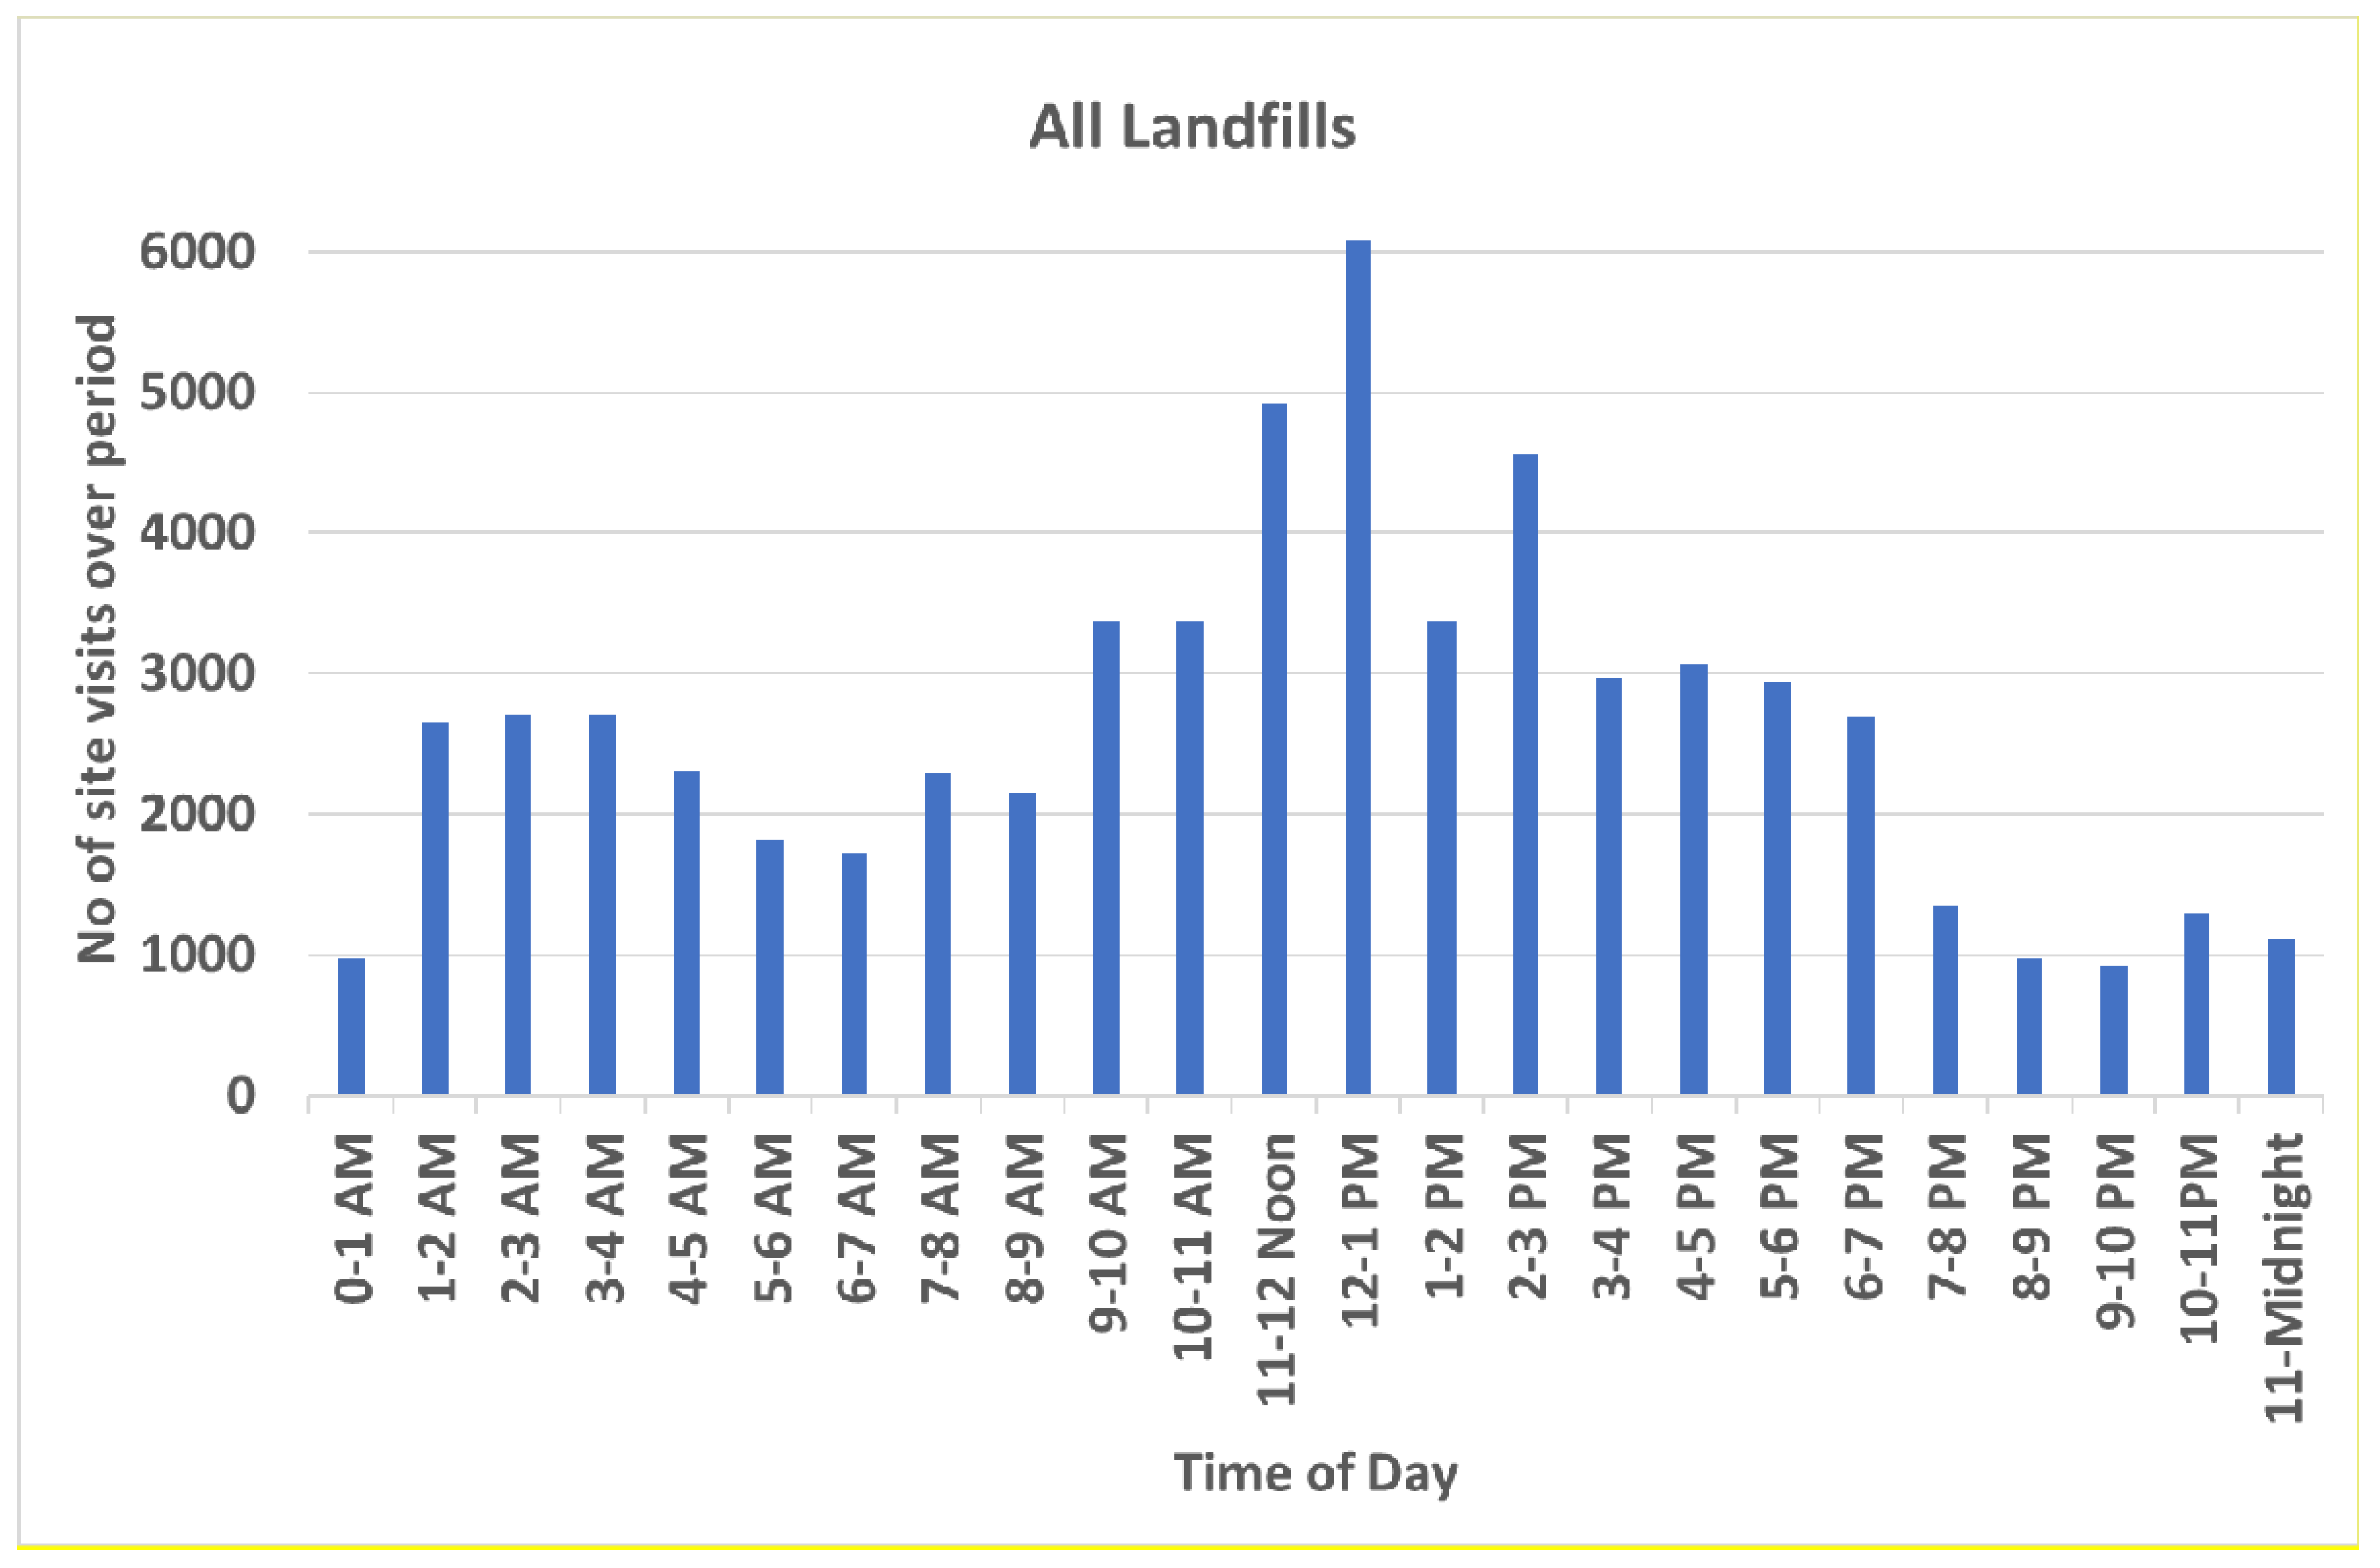

Table 1.
Key parameters of landfill data collected (all sites, 8-month period).
| Parameter | Description | Notes |
|---|---|---|
| Date/Time of entry | Timestamp of vehicle arrival at landfill | Continuous daily recording |
| Vehicle ID / PSP Operator | Unique truck ID or company name (PSP) | Links trip to specific contractor |
| Waste Collection Zone (WCZ) | City zone or LGA origin of waste load | 29 zones defined across Lagos |
| Landfill site | Name of landfill (Olusosun, Epe, etc.) | All 6 major sites covered |
| Waste volume/weight | Load size in tonnes (where measured) | Only Epe had weighbridge (tonnage recorded) |
| Trip distance (est.) | Approx. one-way distance from origin to landfill | Estimated via Google Maps API |
| Travel time (est.) | Approx. one-way travel duration for trip | Estimated via Google Maps (peak/off-peak) |
| Queuing delay notes | Qualitative notes if truck experienced delays on-site | e.g., waiting due to congestion at landfill |
Disclaimer/Publisher’s Note: The statements, opinions and data contained in all publications are solely those of the individual author(s) and contributor(s) and not of MDPI and/or the editor(s). MDPI and/or the editor(s) disclaim responsibility for any injury to people or property resulting from any ideas, methods, instructions or products referred to in the content. |
© 2025 by the authors. Licensee MDPI, Basel, Switzerland. This article is an open access article distributed under the terms and conditions of the Creative Commons Attribution (CC BY) license (http://creativecommons.org/licenses/by/4.0/).
Copyright: This open access article is published under a Creative Commons CC BY 4.0 license, which permit the free download, distribution, and reuse, provided that the author and preprint are cited in any reuse.


