
Submitted:
18 October 2025
Posted:
21 October 2025
You are already at the latest version
Abstract
The Luilu sector, located in the Katangan Copperbelt (southeastern DR Congo), has expe-rienced intensified extractive activities over several decades. While this dynamic contrib-utes to national economic growth, it generates environmental and social impacts that re-main insufficiently documented, particularly regarding landscape structure and resili-ence. This study examines changes in land cover and spatial organization between 1990 and 2024 under increasing anthropogenic pressures. The methodology combines a mul-ti-temporal cartographic approach with landscape ecology indices (composition, frag-mentation, connectivity, spatial complexity) applied to satellite imagery. The analysis re-veals a significant decline in natural formations, notably Miombo woodlands (from 50.83% to 38.89%), correlated with the rapid expansion of agricultural (from 4.25% to 13.41%) and urban areas (from 0.64% to 5.05%), primarily driven by shifting cultivation and urbanization. Ecological indices indicate growing instability, increased fragmenta-tion, and reduced ecosystem resilience. The largest patch index shows a reduction in for-est dominance (29.62% to 24.34%), while fractal analysis highlights rapid, disorganized, and spatially complex urban expansion. These dynamics reflect a rapid, unplanned landscape reconfiguration, undermining ecological connectivity and reinforcing regional socio-environmental vulnerability. The study underscores the need to integrate landscape dynamics into local land management policies in order to balance mining development, food security, and ecosystem conservation.
Keywords:
anthropogenic pressure
; landscape ecology
; fragmentation
; Miombo
; remote sensing
; ecological connectivity
1. Introduction
At the global scale, terrestrial landscapes are undergoing rapid and profound transformations driven by increasing anthropogenic pressures, particularly urbanization, intensive agriculture, mining and forestry activities, and infrastructure development [1,2,3]. These dynamics alter the composition and configuration of habitats, leading to accelerated fragmentation, reduced ecological connectivity, and biodiversity loss [4,5]. In this context, land-use change—especially the conversion of natural vegetation into agricultural, urban, or industrial areas—represents one of the most tangible indicators of territorial reorganization [6,7,8,9,10].
In Central Africa, the Democratic Republic of Congo (DR Congo) strikingly illustrates this trend. Between 2010 and 2020, the country experienced an estimated annual forest loss of over 500,000 hectares, placing the DR Congo among the most affected nations globally [11]. This phenomenon impacts not only dense humid forests but also the Miombo woodlands, which account for approximately 23% of the national forest area [12] and play a critical ecological role in water regulation [13], carbon storage [14], and the livelihoods of local communities [15,16].
In the southeastern part of the country, particularly within the Katanga Copperbelt, anthropogenic pressures are intensified by the coexistence of intensive mining activities, expanding agriculture, and rapid urbanization [17]. Extractive hubs such as Kolwezi, Likasi, and Lubumbashi concentrate socio-economic dynamics that profoundly reshape landscapes [17,18]. These processes drive territorial reorganization characterized by the creation of clearings, forest cover degradation, and increased deforested areas [12].
The Luilu sector, located in Lualaba Province, provides a particularly representative example of these dynamics. Dominated by Miombo woodlands, this area is subjected to multiple disturbances, including charcoal production, slash-and-burn agriculture, artisanal and industrial mining, and informal urbanization [19]. The provincial capital, Kolwezi, exemplifies demographic and land pressure: its population grew from a few tens of thousands to nearly one million in less than a decade [20]. This demographic boom, combined with high unemployment rates, promotes often unregulated exploitation of forest resources, increasing landscape fragmentation [18]. In rural areas, extensive farming practices and overexploitation of specific tree species (e.g., Pterocarpus tinctorius) compromise the ecological resilience of the Miombo woodlands [21].
Despite the magnitude of these transformations, fine-scale landscape dynamics remain insufficiently documented [19]. Most existing studies adopt regional or sectoral approaches, often focusing exclusively on forest or mining dynamics, and rely on long temporal intervals, which limit their ability to detect early or rapid changes. They also rarely integrate the spatial, ecological, and structural dimensions of landscape reorganization [17,18,19]. By contrast, this study leverages high-temporal-resolution analysis, enabling the detection and quantification of rapid and early-stage land cover changes across the Luilu sector. In this context, remote sensing and landscape ecology tools are particularly relevant. Remote sensing provides homogeneous, comparable time series that allow the analysis of forest cover dynamics over several decades, even in regions where field inventories are scarce or discontinuous [22,23,24]. Landscape ecology, on the other hand, offers spatial metrics (e.g., Simpson’s diversity index, fractal dimension, dissection rate) that go beyond simple deforestation monitoring to evaluate landscape structure, connectivity, and ecological resilience [25,26]. Combining these approaches enables assessment not only of the magnitude of changes but also of their ecological and functional implications.
By integrating diachronic Landsat image analysis (1990–2024) with landscape ecology metrics, this study provides an innovative perspective on Miombo transformation trajectories and their consequences for landscape functional integrity. This dual approach, rarely applied at the local scale in the region, allows identification of fragmentation mechanisms, evaluation of land-use class stability, and estimation of the capacity of forest ecosystems to withstand disturbances under strong land and extractive pressures. The central hypothesis is that anthropogenic pressures in the Luilu sector lead to increasing ecological fragmentation, instability of land-use classes, and loss of landscape functional coherence, thereby compromising the ability of Miombo ecosystems to maintain their ecological functions.
2. Materials and Methods
2.1. Study Area
The study was conducted in the Luilu sector (7,644.88 km²; 24.894°–25.961° E; 10.176°–11.181° S), within the Mutshatsha territory, Lualaba Province, in southeastern DR Congo (Figure 1). Located in the Katanga Copperbelt at an altitude of 1,200–1,300 m, this area is strategic due to the high density of copper-cobalt deposits and the ecological pressures associated with extractive activities. The climate is subtropical humid with a dry winter (Cwa) and locally tropical savanna (Aw) [27], receiving 1,000–1,400 mm of annual rainfall with mean temperatures ranging from 17 to 25 °C. These conditions influence the phenology of the Miombo, the dominant vegetation type alongside dry forests (Muhulu), gallery forests (Mushitu), savannas, and marshy grasslands [28,29]. Soils are predominantly Ferralsols, highly weathered, nutrient-poor, and prone to erosion in the absence of vegetation cover [28,30].
Anthropogenic dynamics are reflected in rapid urbanization, slash-and-burn agriculture, charcoal production, and both artisanal and industrial mining [19]. These pressures drive deforestation, Miombo fragmentation, and soil degradation. Increasing land artificialization, including roads, mining infrastructure, and urban neighborhoods, alters hydrological regimes and exacerbates the ecological vulnerability of an area where the balance between climate, soils, and vegetation is already fragile.
2.2. Acquisition and Processing of Satellite Data
2.2.1. Source of Satellite Data
The Luilu sector was delineated using satellite images acquired at five dates representative of major recent politico-economic stages in the DR Congo: 1990 (beginning of the democratization process), 1998 (prior to the liberalization of the mining sector), 2010 (following the global economic crisis and mining liberalization), 2014 (the year preceding the provincial reorganization), and 2024 (current landscape conditions). Images were selected between late May and late August, corresponding to the dry season, to ensure better comparability and spectral consistency of vegetation cover [31].
The data were obtained from Landsat 5 Thematic Mapper (TM) and Landsat 8 OLI_TIRS sensors, both providing a 30 m spatial resolution. Images were downloaded from the USGS website (http://landsat.usgs.gov) and processed using the Google Earth Engine (GEE) platform, which combines a large catalog of public datasets with an optimized infrastructure for parallel processing of image time series [32]. The use of GEE also offers the advantage of accessing images that have already undergone standard-level corrections, ensuring the reliability of spatial and temporal analyses [33].
2.2.2. Preprocessing of Satellite Images
After import into Google Earth Engine (GEE), the Landsat Collection 2 images were radiometrically corrected to compensate for atmospheric, topographic, and instrumental effects [19]. The applyScaleFactors function was used to convert raw values into usable physical units: optical bands were recalibrated using a factor of 0.0000275 with a subtraction of 0.2, while thermal bands were corrected with a factor of 0.00341802 and an addition of 149.0 [32].
A systematic map() processing generated corrected bands for the entire collection, and the median composite was used to produce a clipped image for the study area (clip()) [34]. Pixels contaminated by clouds were removed using the cloud mask provided by the QA_PIXEL indicator [35]. Finally, the images were mosaicked, reprojected to the WGS84/UTM zone 35S coordinate system (EPSG:32735), and bilinearly resampled to harmonize spatial resolution and ensure continuity suitable for landscape dynamics analysis and land-use change assessment [36].
2.2.3. Selection of Training Areas
A false-color composite was generated using the MIR, NIR, red, and green bands, with minimum and maximum values of 0 and 0.3 and a gamma of 2, to optimize the interpretation of vegetation cover [37]. This combination exploits distinctive spectral properties: NIR, strongly reflected by chlorophyll, highlights dense vegetation; red indicates chlorophyll absorption; and green reflects the health of the vegetation cover [38].
Training areas were defined through visual interpretation of the composites, supplemented with GPS field data, aerial photographs, and annotations using Open Foris Collect Earth [39]. To ensure comparability between periods, training sites were selected from pixels that remained stable over time [40]. The selection aimed to maximize intra-class homogeneity and minimize mixed-pixel effects, prioritizing areas large enough to capture the internal variability of each class [41,42]. This rigorous approach enhanced the reliability of training data for classification.
A field campaign conducted from May to August allowed identification and georeferencing of land-use classes according to the typology of Malaisse [28] and Campbell et al. [43]: forest, shrub savanna, grassland, agriculture, built-up areas, bare soil, and water. In total, 82 points were collected for intact forest, 64 for shrub savanna, 58 for grassland, and 22 for agricultural areas. The number of samples was adjusted based on class representativeness, area, and temporal stability [12].
The classes are defined as follows:
- Forest: mixed formations with a sparse herbaceous layer under a 15–20 m canopy, including dry dense forest, gallery forests, and Miombo woodland dominated by Brachystegia, Julbernardia, and Isoberlina [43].
- Shrub savanna: shrub and tree formations, often resulting from Miombo degradation or the evolution of grass savannas; their expansion generally indicates anthropogenic influence [28].
- Grassland: steppe and herbaceous savannas, either natural or anthropogenic, whose extent also reflects human pressures [28].
- Agriculture: cultivated plots, either in rotation or fallow [44].
- Bare soil and built-up areas: bare or rocky soils, roads, settlements, and mining sites, particularly around Kolwezi.
- Water: rivers, lakes, and ponds.
2.2.4. Supervised Classification
Landsat imagery was classified using false-color composites in combination with the Random Forest (RF) algorithm, selected for its proven robustness in handling complex and heterogeneous multispectral data. RF is particularly effective in modeling nonlinear relationships among spectral bands, which are typical in the fragmented and dynamic landscapes of the Luilu sector [35,45]. As a tree-based ensemble model, RF is resilient to data noise and can capture complex interactions between spectral variables, thereby ensuring stable and reproducible classifications in diverse ecological contexts.
Specific spectral bands were selected to optimize land-cover discrimination: near-infrared (NIR) and shortwave infrared (SWIR) bands were used to enhance vegetation and soil contrast, while visible bands (red, green, blue) facilitated the detection of anthropogenic features. False-color composites (e.g., SWIR-NIR-Red) were generated to improve visual separability of classes during training polygon delineation.
To ensure the robustness and representativeness of the training dataset, a total of 1,200 polygons were manually delineated across the study area, with a minimum of 150 samples per land-use class. This approach captures the spectral variability within each class and reduces bias caused by spatial heterogeneity. The dataset was randomly split into 70% for model training and 30% for validation, consistent with standard practices in remote sensing to reduce overfitting and ensure reliable performance assessment.
Model hyperparameters were optimized with Mtry = 2 and 100 trees, balancing predictive accuracy and the risk of overfitting. This configuration allows RF to faithfully represent intra-class spectral variability while maintaining resilience against mixed pixels and heterogeneous areas [35]. The sensitivity of RF to hyperparameter selection was considered, and preliminary tests ensured stable performance across multiple runs.
Classification accuracy was quantitatively assessed using confusion matrices, from which overall accuracy, user’s accuracy, and producer’s accuracy were computed [46,47]. User’s accuracy reflects the proportion of correctly classified pixels relative to all pixels assigned to a given class, with low values indicating overestimation of that class. Producer’s accuracy represents the proportion of true features correctly identified by the classification, with low values signaling underrepresentation [47]. These metrics provide a rigorous evaluation of model performance and highlight potential spectral confusions among land-use classes, enabling ecologically meaningful interpretation of the results.
2.2.5. Landscape Dynamics Analysis
The landscape analysis provides a quantitative framework to test the central hypothesis that anthropogenic pressures in the Luilu sector lead to increased ecological fragmentation, instability of land-use classes, and reduced landscape functional coherence, ultimately compromising the ecological integrity of Miombo ecosystems. By characterizing spatial configuration with structural metrics such as mean patch area (ā), total area (a), number of patches (n), largest patch index (D), and mean fractal dimension (Df) [48], the study captures key aspects of habitat fragmentation, dominance, connectivity, and morphological complexity. These metrics directly inform the assessment of ecological fragmentation, one of the core components of the hypothesis.
Similarly, the evaluation of landscape composition through transition matrices quantifies spatio-temporal flows between land-use classes [17], allowing the calculation of the Landscape Stability Index (LSI) [49] and Periodic Deforestation Rate (PDR) [50]. LSI serves as a direct measure of class stability and resilience, while PDR reflects anthropogenic pressure on natural ecosystems, providing empirical evidence to test whether human activities are driving instability in land-use classes.
The identification of spatial transformation processes via the decision-tree method of Bogaert et al. [51], based on n, a, and cumulative perimeter (p), further differentiates anthropogenic dynamics (aggregation, expansion, displacement) from natural processes (attrition, perforation, shrinkage, deformation, dissection, fragmentation). Applying a threshold of t = 0.75 to distinguish dissection from fragmentation [52] enables precise detection of human-driven structural changes, which is central to evaluating whether functional landscape coherence is being disrupted.
Finally, the use of Simpson’s Diversity Index (SIDI) and Evenness Index (SIEI) [53] provides complementary insights into class richness and spatial distribution, highlighting potential losses in landscape heterogeneity and ecosystem function. Together, these multi-scale spatial metrics and indices form an integrated analytical framework that directly tests the hypothesis by linking anthropogenic pressures to measurable changes in ecological fragmentation, land-use stability, and landscape functional integrity in the Miombo ecosystems of the Luilu sector.
3. Results
3.1. Land-Use Mapping
Supervised classification of Landsat imagery in the Luilu sector using the Random Forest algorithm yielded overall accuracies between 83% and 93%, with Kappa coefficients ranging from 0.78 to 0.91, demonstrating the statistical robustness and reliability of the results in line with established remote sensing standards [47,54]. User’s and producer’s accuracies indicate very high classification reliability for water bodies (>98%), forests (>95%), and built-up areas (>88%). In contrast, grasslands and agricultural areas exhibited greater variability, reflecting their spatial heterogeneity and seasonal dynamics, which complicate spectral discrimination (Table 2). Analysis of the Landsat-derived maps from 1990 to 2024 (Figure 2) reveals a continuous decline in natural vegetation cover, predominantly replaced by agricultural, herbaceous, mining, and built-up areas, with particularly pronounced expansion in the northwest and southeast of the sector. The Miombo woodland, the region’s dominant vegetation type, experienced substantial area loss. The water class, which remained largely stable, was excluded from subsequent dynamic analyses. Overall, the Luilu landscape exhibits a clear transition toward anthropogenic land covers, accompanied by increasing fragmentation of forest habitats. This trend reflects intense human pressure on ecosystems, compromising their ecological resilience and elevating the risk of long-term environmental degradation.
3.2.1. Spatial Recomposition and Anthropization Dynamics
Forest exhibited gradual but continuous losses across all periods, with a portion of forested area converting to shrub savanna, grassland, and agriculture. For example, between 1990–1993, approximately 9.01% of forest transitioned to shrub savanna and 9.88% to agriculture, highlighting both secondary succession processes and human-induced clearance. Forest loss was most pronounced in the 2017–2021 interval, reflecting intensified anthropogenic pressure in recent decades. The persistence of a significant fraction of forest (e.g., 23.02% remaining forest in 2021–2024) indicates some areas retained ecological integrity, likely in less accessible or protected zones.
Shrub savanna experienced both gain and loss. Portions of forest and grassland converted into shrub savanna, reflecting natural succession or abandonment of agricultural fields. However, shrub savanna also transitioned to agriculture and bare soil, particularly in the periods 2010–2014 and 2021–2024, suggesting ongoing human exploitation. By 2021–2024, shrub savanna remained the most extensive class (40.02%), indicating its resilience but also its role as a transitional state under anthropogenic influence.
Grasslands displayed moderate stability, with substantial portions persisting (e.g., 2.88–4.35% per period) but also experiencing conversion to agriculture and shrub savanna. Seasonal land cover and shifting cultivation likely contributed to these patterns, as indicated by the recurring exchange with agricultural areas.
Agricultural areas showed steady increases, primarily at the expense of forest and shrub savanna. Early periods (1990–1998) indicate gradual expansion, while later periods (2014–2024) reflect accelerated growth, consistent with intensifying human activity and population pressures. Agriculture also shows internal stability, with a notable fraction persisting within each interval, suggesting established cropland areas.
This class experienced incremental growth, particularly in recent periods (2021–2024), mainly through conversion of shrub savanna and grassland. Although its total area remains relatively small, the consistent increase signals urbanization and mining-related disturbance, contributing to landscape fragmentation.
The transition matrix quantitatively confirms a shift from natural vegetation to human-modified landscapes, with forest loss, shrub savanna conversion, and agricultural expansion as dominant processes. These dynamics underline increasing ecological fragmentation, reduced resilience of Miombo woodlands, and growing susceptibility to long-term degradation.

Table 3.
Transition matrices (in %) showing land-use changes between 1990–1993, 1993–1998, 1998–2001, 2006–2010, 2010–2014, 2014–2017, 2017–2021, and 2021–2024 in the Luilu sector, based on supervised classification using the Random Forest algorithm. Bold values indicate the proportion of land-use that remained unchanged. 1% corresponds to 76.64488 km². Totals do not sum to 100% because the “water” class was excluded from the analyses.
| Period | From \ To | Forest | Shrub Savanna | Grassland | Agriculture | Bare Soil & Built-up | Total |
|---|---|---|---|---|---|---|---|
| 1990–1993 | Forest | 29.74 | 9.01 | 2.32 | 9.88 | 0.01 | 50.97 |
| Shrub Savanna | 2.49 | 12.58 | 4.27 | 5.52 | 0 | 24.86 | |
| Grassland | 0.91 | 3.07 | 4 | 7.27 | 0.11 | 15.34 | |
| Agriculture | 0.16 | 0.64 | 1.85 | 1.57 | 0.05 | 4.28 | |
| Bare Soil & Built-up | 0 | 0 | 0.07 | 0.03 | 0.56 | 0.65 | |
| 1993–1998 | Forest | 23.67 | 4.85 | 4.09 | 0.76 | 0.01 | 33.39 |
| Shrub Savanna | 8.84 | 11.07 | 4.17 | 1.23 | 0.11 | 25.42 | |
| Grassland | 1.24 | 5.83 | 3.52 | 1.27 | 0.69 | 12.55 | |
| Agriculture | 3.97 | 12.39 | 5.24 | 2.55 | 0.29 | 24.44 | |
| Bare Soil & Built-up | 0 | 0 | 0.03 | 0.01 | 0.68 | 0.72 | |
| 1998–2001 | Forest | 25.24 | 9.55 | 1.64 | 1.27 | 0 | 37.7 |
| Shrub Savanna | 8.01 | 12.54 | 6.88 | 6.65 | 0.07 | 34.15 | |
| Grassland | 2.16 | 6.24 | 4.33 | 4.29 | 0.12 | 17.15 | |
| Agriculture | 0.83 | 1.36 | 1.51 | 2.09 | 0.03 | 5.81 | |
| Bare Soil & Built-up | 0.01 | 0.04 | 0.4 | 0.69 | 0.64 | 1.79 | |
| 2001–2006 | Forest | 26.73 | 8.04 | 0.65 | 0.81 | 0.03 | 36.26 |
| Shrub Savanna | 10.16 | 16 | 1.84 | 1.81 | 0.11 | 29.92 | |
| Grassland | 1.16 | 6.65 | 3.29 | 3.32 | 0.36 | 14.78 | |
| Agriculture | 0.6 | 6.52 | 2.4 | 4.85 | 0.65 | 15.02 | |
| Bare Soil & Built-up | 0.05 | 0.03 | 0.05 | 0.08 | 0.65 | 0.87 | |
| 2006–2010 | Forest | 27.81 | 9.77 | 0.91 | 0.25 | 0.12 | 38.87 |
| Shrub Savanna | 4.68 | 25.11 | 5.65 | 1.75 | 0.07 | 37.25 | |
| Grassland | 0.13 | 4.07 | 1.95 | 1.93 | 0.13 | 8.21 | |
| Agriculture | 0.37 | 6.01 | 1.65 | 2.48 | 0.36 | 10.88 | |
| Bare Soil & Built-up | 0.03 | 0.24 | 0.19 | 0.45 | 1.01 | 1.92 | |
| 2010–2014 | Forest | 26.94 | 4.05 | 1.45 | 0.32 | 0.05 | 32.82 |
| Shrub Savanna | 11.36 | 19 | 6.2 | 7.92 | 0.45 | 44.93 | |
| Grassland | 1.05 | 4.85 | 2.04 | 2.09 | 0.2 | 10.24 | |
| Agriculture | 0.12 | 1.47 | 2.39 | 2.24 | 0.57 | 6.79 | |
| Bare Soil & Built-up | 0.04 | 0.03 | 0.13 | 0.12 | 1.16 | 1.48 | |
| 2014–2017 | Forest | 25.29 | 11.71 | 1.13 | 1.24 | 0.03 | 39.4 |
| Shrub Savanna | 1.85 | 18.89 | 4.83 | 3.72 | 0.07 | 29.36 | |
| Grassland | 0.93 | 3.48 | 4.13 | 3.31 | 0.33 | 12.19 | |
| Agriculture | 0.05 | 3.72 | 2.67 | 6.07 | 0.16 | 12.67 | |
| Bare Soil & Built-up | 0 | 0.04 | 0.36 | 0.51 | 1.55 | 2.45 | |
| 2017–2021 | Forest | 18.32 | 9.27 | 0.49 | 0.15 | 0.04 | 28.27 |
| Shrub Savanna | 7.7 | 22.23 | 4.75 | 3.15 | 0.2 | 38.02 | |
| Grassland | 0.6 | 4.27 | 4.35 | 3.41 | 0.61 | 13.24 | |
| Agriculture | 1.16 | 4.32 | 3.39 | 5.15 | 0.92 | 14.94 | |
| Bare Soil & Built-up | 0.04 | 0.03 | 0.2 | 0.13 | 1.75 | 2.15 | |
| 2021–2024 | Forest | 23.02 | 2.21 | 1.13 | 1.44 | 0.15 | 27.95 |
| Shrub Savanna | 14.56 | 15.34 | 4.85 | 4.88 | 0.39 | 40.02 | |
| Grassland | 0.84 | 5.27 | 2.88 | 3.28 | 0.91 | 13.18 | |
| Agriculture | 0.77 | 4.39 | 2.56 | 3.36 | 0.88 | 11.96 | |
| Bare Soil & Built-up | 0 | 0.04 | 0.08 | 0.64 | 2.73 | 3.49 |
3.2.2. Class Stability and Ecological Resiliences
The assessment of periodic stability indices (PSI) and their annual averages (ASI) (Table 4) reveals significant instability in land cover classes in Luilu, reflecting continuous spatial reorganization and intense territorial dynamics. These indices quantify the capacity of classes to maintain their area from one period to another: values greater than 1 indicate net expansion, whereas values below 1 indicate regression or conversion to other classes.
Anthropogenic classes—agriculture, shrub savanna, and bare/urban soils—mostly exhibit PSI > 1, confirming their role as recipients of areas derived from natural formations. Agriculture is characterized by high variability, with a peak expansion between 1990 and 1993 (PSI = 8.41) and a high ASI (0.65), reflecting rapid growth linked to shifting cultivation and the absence of land-use regulation. Shrub savanna, relatively stable (ASI = 0.31), functions as an ecological buffer, although it undergoes periodic fluctuations. Bare and urban soils show the most extreme instability, with PSI up to 27.50 and a maximum ASI (1.19), reflecting rapid expansion associated with urbanization and mining activities.
Conversely, natural formations such as grasslands and Miombo woodland exhibit PSI generally < 1, indicating a net loss of area. Grasslands, with an ASI of 0.27, appear particularly vulnerable to conversion, while Miombo woodland, despite occasional expansion episodes (PSI = 3.28 between 2021 and 2024), remains overall fragile (ASI = 0.33) under anthropogenic pressure. The landscape-wide stability index, ranging from 0.75 to 1.51 across periods (ASI = 0.31), confirms continuous territorial reorganization, with phases of intense conversion, notably between 1993 and 1998.
Overall, anthropization in the Luilu sector appears selective and intense, favoring open and exploited classes while weakening natural formations. These results highlight the urgency of integrated land management aimed at protecting the most vulnerable ecological formations and enhancing landscape resilience against the combined effects of agriculture, urbanization, and mining.
3.2.3. Evolution of Landscape Diversity in the Luilu Sector (1990–2024)
From 1990 to 1993, SIDI increased from 0.65 to 0.75 and SIEI from 0.58 to 0.80, suggesting an initial increase in landscape heterogeneity and more balanced class distribution, likely due to early human-induced fragmentation and emergence of new land covers (e.g., agriculture and built-up areas). Between 1993 and 2010, SIDI fluctuated downward to 0.67 and SIEI to 0.61, indicating reduced diversity and uneven distribution, possibly reflecting consolidation of dominant classes such as shrub savanna and agricultural land at the expense of forests and grasslands. From 2014 onwards, both SIDI (0.73–0.74) and SIEI (0.73–0.76) recovered and stabilized, suggesting a more heterogeneous but structurally fragmented landscape, where multiple land-use types coexist in relatively balanced proportions, albeit under persistent anthropogenic pressure. The SIDI and SIEI trends highlight a transition toward a moderately diverse but increasingly anthropogenically structured landscape, consistent with observed forest loss, agricultural expansion, and habitat fragmentation.
3.3. Structural Dynamics and Spatial Transformation Processes in Luilu (1990–2024)
3.3.1. Spatial Configuration of the Landscape
The analysis of structural metrics highlights contrasting trajectories between natural and anthropogenic land-use classes in the Luilu sector. Natural classes, including Miombo woodland, shrub savanna, and grassland, exhibit a high number of patches, indicative of strong fragmentation and spatial dispersion, while the mean patch area remains very low (<0.03 km²), confirming that natural habitats are increasingly subdivided into small, isolated units. Miombo woodland, despite retaining a relatively large total area, shows a steady decline in the largest patch index from 29.62% in 1990 to 24.34% in 2024, signaling progressive loss of connectivity and increased vulnerability to edge effects. Grasslands demonstrate a more severe structural collapse, with the largest patch index declining from 9.57% to 0.52%, reflecting extensive fragmentation and reduction of continuous habitat units. Shrub savanna exhibits greater temporal variability, peaking at a largest patch index of 23.62% in 2010, underscoring its role as a transitional class mediating landscape reorganization between natural and anthropogenic areas.
Anthropogenic classes, including agriculture and bare or urban soils, show sustained expansion. Agricultural patches increase sharply between 1993 and 1998, with rapid area growth and higher dominance before stabilizing in later periods. Bare and built-up areas follow a continuous upward trajectory, with patch aggregation leading to the largest patch reaching 46.87% in 2024, indicating the formation of dominant, continuous anthropogenic units. Both classes exhibit high fractal dimensions, reflecting complex, irregular morphologies typical of rapid and unplanned urban expansion and heterogeneous agricultural mosaics.
Overall, the Luilu landscape is increasingly polarized, with fragmented natural habitats coexisting alongside aggregated and morphologically complex anthropogenic areas. Declining patch connectivity and reduced mean patch areas in natural classes imply increasing susceptibility to ecological degradation, including loss of habitat for Miombo-dependent species, reduced gene flow, and heightened edge effects. Meanwhile, the expansion and morphological complexity of anthropogenic classes indicate intensifying human pressure, driving functional simplification of natural systems despite apparent landscape heterogeneity. The metrics collectively reflect a dynamic, anthropogenically driven landscape transformation in which natural ecosystems are progressively fragmented and anthropogenic patches dominate both area and structural complexity, compromising the ecological connectivity and resilience of the Miombo-dominated landscape.
Table 4.
Periodic Stability Index (PSI) and Annual Stability Index (ASI) of Land Cover Classes and Landscape in Luilu (1990–2024).
Table 4.
Periodic Stability Index (PSI) and Annual Stability Index (ASI) of Land Cover Classes and Landscape in Luilu (1990–2024).
| Period | Forest PSI | Forest ASI | Shrub Savanna PSI | Shrub Savanna ASI | Grassland PSI | Grassland ASI | Agriculture PSI | Agriculture ASI | Bare & Built PSI | Bare & Built ASI | Landscape PSI | Landscape ASI |
|---|---|---|---|---|---|---|---|---|---|---|---|---|
| 1990–1993 | 0.17 | 0.06 | 1.04 | 0.35 | 0.75 | 0.25 | 8.41 | 2.8 | 1.7 | 0.57 | 1.02 | 0.34 |
| 1993–1998 | 1.45 | 0.29 | 1.61 | 0.32 | 1.5 | 0.3 | 0.15 | 0.03 | 27.5 | 5.5 | 0.75 | 0.15 |
| 1998–2001 | 0.88 | 0.29 | 0.8 | 0.27 | 0.81 | 0.27 | 3.46 | 1.15 | 0.19 | 0.06 | 0.87 | 0.29 |
| 2001–2006 | 1.26 | 0.25 | 1.53 | 0.31 | 0.43 | 0.09 | 0.59 | 0.12 | 5.48 | 1.1 | 1.14 | 0.23 |
| 2006–2010 | 0.47 | 0.12 | 1.65 | 0.41 | 1.34 | 0.34 | 0.52 | 0.13 | 0.75 | 0.19 | 1.51 | 0.38 |
| 2010–2014 | 2.14 | 0.54 | 0.4 | 0.1 | 1.24 | 0.31 | 2.3 | 0.58 | 3.97 | 0.99 | 1.15 | 0.29 |
| 2014–2017 | 0.2 | 0.07 | 1.81 | 0.6 | 1.12 | 0.37 | 1.33 | 0.44 | 0.65 | 0.22 | 1.39 | 0.46 |
| 2017–2021 | 0.95 | 0.24 | 1.13 | 0.28 | 0.99 | 0.25 | 0.7 | 0.18 | 4.43 | 1.11 | 1.16 | 0.29 |
| 2021–2024 | 3.28 | 1.09 | 0.48 | 0.16 | 0.84 | 0.28 | 1.19 | 0.4 | 3.07 | 1.02 | 0.96 | 0.32 |
| Mean | 0.33 | 0.31 | 0.27 | 0.65 | 1.19 | 0.31 | ||||||
Table 5.
Simpson Diversity Index (SIDI) and Simpson Evenness Index (SIEI) of Luilu (1990–2024).
| Year | Simpson Diversity Index (SIDI) | Simpson Evenness Index (SIEI) |
|---|---|---|
| 1990 | 0.65 | 0.58 |
| 1993 | 0.75 | 0.8 |
| 1998 | 0.71 | 0.69 |
| 2001 | 0.74 | 0.76 |
| 2006 | 0.69 | 0.65 |
| 2010 | 0.67 | 0.61 |
| 2014 | 0.73 | 0.73 |
| 2017 | 0.74 | 0.76 |
| 2021 | 0.73 | 0.74 |
| 2024 | 0.74 | 0.76 |
3.3.2. Spatial Transformation Processes
Analysis of spatial transformation processes confirms the patterns observed in spatial configuration (Table 6). Between 1990 and 2001, Miombo woodland is primarily subjected to dissection (t = 0.92), indicating fragmentation without significant area loss. Shrub savanna experiences aggregation, while agricultural and built-up areas emerge through creation.
During 2001–2014, localized aggregation of Miombo woodland is observed, suggesting local regeneration events. In contrast, shrub savanna undergoes pronounced dissection (t = 0.98), and grasslands as well as agricultural areas are affected by suppression, indicating spatial retreat. Expansion of built-up and bare soil areas continues through creation.
Between 2014 and 2024, dissection extends to all vegetation formations: Miombo woodland (t = 0.76), shrub savanna (t = 0.93), and grassland (t = 0.94), confirming increased fragmentation of natural cover. Simultaneously, anthropogenic classes continue to expand through creation, consolidating territorial control and intensifying pressure on natural environments.
Thus, the structural dynamics of the Luilu landscape between 1990 and 2024 reveal advanced fragmentation of natural formations alongside spatial consolidation of anthropogenic classes. This territorial reorganization, driven by intensified human use and degradation of ecological coherence, underscores the need for integrated land management focused on preserving natural structures, maintaining ecological connectivity, and regulating land artificialization.
4. Discussion
4.1. Methodological Approach
Landsat imagery, with its 30 m spatial resolution, provides valuable opportunities for analyzing regional land-use dynamics [55,56]. However, this resolution limits the detection of small agricultural plots, fragmented urban areas, and patchy natural formations, potentially introducing biases in the estimation of fragmentation indices and the construction of transition matrices. To address these limitations, several preprocessing steps were implemented, including the filtering of isolated pixels, aggregation of adjacent patches, and cross-validation with both ground-based sampling and aerial photograph interpretation [57].
Within this framework, the RF algorithm was selected for its robustness to noisy data and class imbalances [58]. Model performance was further enhanced through careful calibration, the use of representative training datasets, and cross-validation, which minimized misclassification among spectrally similar land-cover classes [57]. To quantify landscape structure and temporal dynamics, a suite of landscape metrics—including ISP, ISA, SIDI, SIEI, and fragmentation indices—was applied. While these indicators effectively describe structural and compositional changes, they do not directly capture socio-economic or climatic drivers, which were integrated qualitatively based on local knowledge of agricultural practices, urbanization trends, and mining activities.
Although transition matrices provide a useful framework for quantifying land-use conversions, they are sensitive to classification errors and offer limited insight into underlying drivers. To mitigate these constraints, the methodology combined an optimized RF approach, the incorporation of auxiliary data, and long-term temporal analysis, enabling a more reliable representation of major land-use dynamics, including deforestation, agricultural expansion, and urban growth. Finally, the GEE platform facilitated access to Landsat time series and large-scale data processing [33], allowing efficient integration of auxiliary datasets and implementation of the Random Forest algorithm, thereby improving classification accuracy and the detection of spatio-temporal changes.
4.2. Spatial Dynamics and Landscape Recomposition in the Luilu Sector (1990–2024)
Analyses reveal a profound landscape transformation in the Luilu sector between 1990 and 2024, marked by a sharp decline in natural formations and continuous expansion of anthropogenic areas. Miombo woodlands decreased by 11.9 percentage points, and grasslands experienced an even more pronounced contraction, illustrating that land conversion dynamics are strongly driven by human pressures, particularly agriculture, urbanization, and mining activities. From a landscape ecology perspective, these changes highlight the interplay between patch dynamics, spatial contagion, and connectivity loss, whereby continuous natural habitats are subdivided into isolated patches embedded within a dominant anthropogenic matrix, altering ecological flows, edge effects, and resilience [62].
This landscape recomposition closely reflects political-economic trajectories in the DR Congo. State weakening and subsistence agriculture expansion since 1990 led to regression of natural formations, while the 1998 conflict and mining liberalization accelerated fragmentation through population displacement and increased local resource dependence. From 2010 onwards, economic recovery and foreign investment promoted aggregation of anthropogenic patches, enhancing spatial contagion and reinforcing the dominance of built-up and mining areas. Provincial restructuring in 2014 intensified land tenure conflicts, further polarizing landscapes between mining concessions and agricultural zones. By 2024, the cobalt boom drove rapid expansion of mining and urban areas, as reflected in high fractal dimensions and decreasing connectivity, underscoring how socio-economic drivers interact with landscape structure and function, consistent with broader Southern African savanna-forest mosaic patterns [59,60].
Apparent increases in landscape diversity and evenness indices (SIDI and SIEI) are misleading, as they primarily capture the spatial redistribution of anthropogenic classes rather than genuine ecological enrichment. Functional homogenization is evident as small natural patches proliferate (<0.03 km²) and connectivity declines, transforming landscapes from continuous forest matrices to fragmented mosaics, thereby reducing ecological resilience and increasing vulnerability of sensitive species [61,62]. Anthropogenic classes, conversely, aggregate into coherent clusters, reinforcing polarization between residual natural patches and human-modified areas. High fractal dimensions in built-up and mining zones reflect irregular, opportunistic expansion, characteristic of rapid, poorly planned land occupation [63]. These structural changes simplify plant communities, with sensitive Miombo species declining while pioneer and pyrophytic species dominate, homogenizing floristic composition and compromising key ecosystem services, including water regulation, carbon storage, and soil fertility [64].
Mining activities strongly drive these dynamics. Copper and cobalt extraction around Kolwezi promotes concession expansion, deforestation, and soil artificialization, with indirect impacts such as pollution, habitat degradation, and invasion by opportunistic species. Unplanned urbanization amplifies these effects by increasing interfaces between human settlements and natural habitats, reinforcing disorganized patch configurations [65,66]. The expansion of anthropogenic mosaics increases landscape susceptibility to fire and climatic extremes while exerting socio-economic pressures by reducing land for sustainable agriculture and straining local subsistence resources. Land tenure conflicts among farmers, mining companies, and communities further exacerbate these pressures [67].
The Luilu case exemplifies broader Southern African patterns, where forests and grasslands fragment under shifting cultivation, mining, and urbanization, while anthropogenic patches aggregate, increasing landscape morphological complexity and reducing connectivity [68,69,70]. Shrub savannas function as intermediate zones mediating disturbance flows but remain highly vulnerable [70]. Similar trends in Congolese cities, such as Butembo and Lubumbashi, illustrate the generality of these processes, producing irregular fractal patterns and functional simplification of landscapes [3,19,65,71,72].
Methodologically, this study offers novel insights by employing a high-temporal-resolution Landsat time series, with short inter-image intervals spanning 1990–2024, combined with Random Forest classification and quantitative landscape metrics. This fine temporal resolution allows the detection of rapid landscape changes, such as accelerated deforestation, agricultural expansion, or mining development, that may be missed in coarser time series. By integrating patch, connectivity, and fractal analyses, the approach captures key landscape ecology principles, including patch dynamics, spatial contagion, and resilience, while quantifying both structural and functional responses of ecosystems to anthropogenic pressures.
The Luilu landscape illustrates a transition to a human-dominated socio-ecological system, where increasing fragmentation, simplification of plant communities, and aggregation of anthropogenic patches reflect functional homogenization and reduced resilience. These dynamics align with theoretical perspectives in landscape ecology, highlighting the significance of patch dynamics, spatial contagion, and connectivity loss as mechanisms driving landscape restructuring, as discussed by Foley et al. (2005) and Hobbs et al. (2006). The findings underscore the urgent need for integrated management strategies that reconcile socio-economic development with ecological conservation to preserve connectivity, biodiversity, and essential ecosystem services over the long term.
4.3. Socio-Ecological Implications of the Findings for Conservation and Sustainable Management
The landscape dynamics observed in the Luilu sector between 1990 and 2024 reveal a profound territorial transformation, marked by regression of natural formations, expansion of anthropogenic classes, and increasing ecological fragmentation. Miombo woodlands and grasslands, though still present, are increasingly dissected and lose connectivity, compromising ecological resilience and essential ecosystem services such as hydrological regulation, soil protection, and carbon storage.
Fragmentation has shifted the landscape from a continuous forest matrix to isolated patches, reducing connectivity and ecosystem resilience. Integrated strategies, including protected areas, restoration, and ecological corridors, can maintain patch dynamics and functional connectivity. Similar approaches in Southern Africa—Zambia’s Kafue–Kavango corridors [73] and Serengeti–Ngorongoro migrations [74,75]—and participatory restoration in Maringa-Lopori-Wamba [76,77] demonstrate the effectiveness of combining conservation and local livelihood benefits. These interventions benefit from multi-level governance, engaging provincial authorities, local communities, and customary land managers to ensure coordinated protection and restoration.
Shrub savannas and agricultural lands have expanded and consolidated, reflecting intensified human use. Sustainable agricultural practices, agroforestry, and land-use planning can reduce forest conversion while enhancing productivity, as shown in the Zambian Copperbelt [70]. Such measures leverage spatial contagion dynamics to manage expansion and mitigate impacts on remaining natural habitats. Rapid urbanization and mining expansion form large, irregular patches, amplifying habitat fragmentation and reducing landscape permeability. Integrated urban planning, zoning, and green infrastructure, as applied in Lubumbashi [19], help contain disorderly expansion and preserve ecological functionality, with municipal planning offices and environmental agencies serving as key governance actors.
Analysis of landscape diversity (SIDI) and evenness (SIEI) indicates increased heterogeneity, reflecting redistribution in favor of anthropogenic classes rather than genuine ecological enrichment. While this may provide socio-economic opportunities, it coincides with functional homogenization and reduced ecosystem resilience. Maintaining ecological corridors and assisted natural regeneration is therefore essential to reconcile territorial development with conservation. Experiences in Zambia and the Congo Basin show that combining high-temporal-resolution monitoring, landscape ecology principles, and community engagement enhances adaptive capacity and limits irreversible ecosystem degradation [70,78].
The findings from Luilu underscore the importance of translating landscape dynamics into actionable strategies that reconcile ecological conservation with socio-economic development. Overall, the integration of high-temporal-resolution monitoring, landscape ecology principles, and participatory governance provides a framework for adaptive management, enabling policymakers and stakeholders in the DR Congo to anticipate and mitigate rapid land-use changes while enhancing landscape resilience and socio-ecological sustainability.
5. Conclusions
This study examined land cover dynamics in the Luilu sector over a 34-year period by combining long-term Landsat satellite imagery with quantitative landscape ecology tools, including patch, connectivity, and fractal analyses. The results demonstrate that intensified mining activities and agricultural expansion have driven significant spatial transformations: miombo woodlands, once dominant, declined by 22%, largely replaced by agricultural lands, shrub savannas, and built-up or bare soils. This pattern highlights the low ecological resilience of natural formations under sustained anthropogenic pressure.
The observed increases in landscape diversity and evenness indices indicate a more balanced redistribution of land cover classes; however, this is accompanied by greater fragmentation and morphological complexity, reflected in the dissection of natural habitats and aggregation of anthropogenic patches, particularly around urban and mining areas. These changes have clear implications for ecological connectivity, ecosystem service provision, and overall territorial functionality.
Methodologically, the study contributes novel insights through high-temporal-resolution monitoring, capturing both rapid and long-term landscape dynamics. The integration of patch, connectivity, and fractal metrics provides a framework for assessing structural and functional changes in socio-ecological landscapes, and the approach is reproducible using open-access Landsat data. Supplementary materials detailing classification procedures, training datasets, and metric calculations can further support transparency and reproducibility, in line with Geographies recommendations.
Although the 30 m spatial resolution limits detection of small-scale transformations and the lack of fine-grained socio-economic data constrains analysis of local drivers, the trends are robust enough to inform priority management strategies. These include habitat conservation, ecological restoration of degraded areas, and regulation of anthropogenic uses to preserve ecological resilience and support sustainable territorial development.
Finally, further research is needed to model future land cover trajectories, quantify impacts on ecosystem services such as carbon storage, hydrological regulation, and biodiversity, and better understand local land-use logics. Such work would provide a solid scientific basis for designing environmental policies adapted to the socio-ecological realities of the Luilu sector.
Author Contributions
M.K.B. and M.M.M.; Conceptualization, Formal analysis, Writing – original draft and Methodology, H.K.M., F.M., J.F.B. and E.K.L.M.; Writing – review & editing and Visualization, YUS.; Project administration, Funding acquisition and Supervision, J.B.; Project administration, Funding acquisition, Supervision and Validation. All authors have read and agreed to the published version of the manuscript.
Funding
This research was funded by VLIR-UOS (IUC-UNILU, grant number CD2021IUC04A104) and by ARES (Academy of Research and Higher Education) through the AMORSE project (2024–2026), Arborekol_Kolwezi. The APC was funded by VLIR-UOS and ARES.
Institutional Review Board Statement
Not applicable.
Informed Consent Statement
Not applicable.
Data Availability Statement
The authors confirm that all data supporting the findings of this study are available within the article.
Acknowledgments
The authors gratefully acknowledge the support of VLIR-UOS (IUC-UNILU, grant number CD2021IUC04A104) and ARES (Academy of Research and Higher Education) for its support in the AMORSE project (2024–2026), Arborekol_Kolwezi. We also thank the University of Lubumbashi (UNILU) for administrative and technical support, and the local communities of Luilu for their collaboration and provision of valuable knowledge regarding land cover practices.
Conflicts of Interest
The authors have no conflicts of interest to declare. All co-authors have reviewed and approved the contents of the manuscript, and there are no financial interests to report. We confirm that the submission represents original work and is not currently under review by any other publication.
References
- Fahrig, L. Effects of Habitat Fragmentation on Biodiversity. Annu. Rev. Ecol. Evol. Syst. 2003, 34, 487–515. [Google Scholar] [CrossRef]
- Yeo, K.; Tiho, S.; Ouattara, K.; Konate, S.; Kouakou, L.; Fofana, M. Impact de la fragmentation et de la pression humaine sur la relique forestière de l’Université d’Abobo-Adjamé (Côte d’Ivoire). J. Appl. Biosci. 2013, 61, 4551. [Google Scholar] [CrossRef]
- Khoji Muteya, H.; N’tambwe Nghonda, D.D.; Malaisse, F.; Bogaert, J.; Useni Sikuzani, Y. Mapping and quantifying deforestation in the Zambezi ecoregion of Central-Southern Africa: extent and spatial structure. Front. Remote Sens. 2025, 6, 1590591. [Google Scholar] [CrossRef]
- Lara-Pulido, J.A.; Guevara-Sanginés, A.; Arias Martelo, C. A meta-analysis of economic valuation of ecosystem services in Mexico. Ecosyst. Serv. 2018, 31, 126–141. [Google Scholar] [CrossRef]
- Orimoloye, I.R.; Ololade, O.O. Spatial evaluation of land-use dynamics in gold mining area using remote sensing and GIS technology. Int. J. Environ. Sci. Technol. 2020, 17, 4465–4480. [Google Scholar] [CrossRef]
- Bamba, I.; Barima, Y.S.S.; Bogaert, J. Influence de la densité de la population sur la structure spatiale d’un paysage forestier dans le bassin du Congo en R.D. Congo. Trop. Conserv. Sci. 2010, 3, 31–44. [Google Scholar] [CrossRef]
- Bogaert, J.; Bamba, I.; Koffi, K.J.; Sibomana, S.; Djibu, J.-P.K.; Champluvier, D.; Robbrecht, E.; De Cannière, C.; Visser, M.N. Fragmentation of Forest Landscapes in Central Africa: Causes, Consequences and Management. In Patterns and Processes in Forest Landscapes; Lafortezza, R., Sanesi, G., Chen, J., Crow, T.R., Eds.; Springer Netherlands: Dordrecht, The Netherlands, 2008; pp. 67–87. [Google Scholar] [CrossRef]
- Gillet, P.; Vermeulen, C.; Feintrenie, L.; Dessard, H.; Garcia, C. Quelles sont les causes de la déforestation dans le bassin du Congo? Synthèse bibliographique et études de cas. BASE 2016, 183–194. [Google Scholar] [CrossRef]
- Tchatchou, B.; Sonwa, D.J.; Ifo, S.; Tiani, A.M. Déforestation et dégradation des forêts dans le Bassin du Congo: État des lieux, causes actuelles et perspectives. CIFOR, 2015.
- Useni Sikuzani, Y.; Bogaert, J. The Evolution of Landscape Ecology in the Democratic Republic of the Congo (2005–2025): Scientific Advances, Methodological Challenges, and Future Directions. Earth 2025, 6, 97. [Google Scholar] [CrossRef]
- Pro, G.F.W.; Watcher, F.; Atlases, F. Global Forest Watch. Update, 2023.
- Cabala Kaleba, S.; Useni Sikuzani, Y.; Sambieni, K.R.; Bogaert, J.; Munyemba Kankumbi, F. Dynamique des écosystèmes forestiers de l'Arc Cuprifère Katangais en République Démocratique du Congo. I. Causes, transformations spatiales et ampleur. Tropicultura 2017, 35, 3. [Google Scholar]
- Assani, A.A.; Petit, F.; Mabille, G. Analyse des débits de la Warche aux barrages de Butgenbach et de Robertville. Bull. Soc. Géogr. Liège 1999.
- Muledi, J.I.; Momo, S.T.; Ploton, P.; Kamukenge, A.L.; Ibey, W.K.; Pamavesi, B.M.; … Barbier, N. Allometric Equations for Aboveground Biomass Estimation in Wet Miombo Forests of the Democratic Republic of the Congo Using Terrestrial LiDAR. Environments 2025, 12, 260. [Google Scholar] [CrossRef]
- N’tambwe Nghonda, D.-D.; Muteya, H.K.; Kashiki, B.K.W.N.; Sambiéni, K.R.; Malaisse, F.; Sikuzani, Y.U.; Kalenga, W.M.; Bogaert, J. Towards an Inclusive Approach to Forest Management: Highlight of the Perception and Participation of Local Communities in the Management of Miombo Woodlands around Lubumbashi (Haut-Katanga, D.R. Congo). Forests 2023, 14, 687. [Google Scholar] [CrossRef]
- N’tambwe Nghonda, D.-D.; Khoji Muteya, H.; Mpanda Mukenza, M.; Cabala Kaleba, S.; Malaisse, F.; Koy, J.K.; Masengo Kalenga, W.; Bogaert, J.; Useni Sikuzani, Y. Exploring the Role of Traditional Ecological Knowledge in Restoring and Managing Miombo Woodlands: A Case Study from the Lubumbashi Region, Democratic Republic of the Congo. Forests 2025, 16, 435. [Google Scholar] [CrossRef]
- Cabala Kaleba, S.; Useni Sikuzani, Y.; Mwana Yamba, A.; Munyemba Kankumbi, F.; Bogaert, J. Activités anthropiques et dynamique des écosystèmes forestiers dans les zones territoriales de l’Arc Cuprifère Katangais (RD Congo). Tropicultura 2022. [CrossRef]
- Muteya, H.K.; Nghonda, D.-D.N.; Malaisse, F.; Waselin, S.; Sambiéni, K.R.; Kaleba, S.C.; Kankumbi, F.M.; Bastin, J.-F.; Bogaert, J.; Sikuzani, Y.U. Quantification and Simulation of Landscape Anthropization around the Mining Agglomerations of Southeastern Katanga (DR Congo) between 1979 and 2090. Land 2022, 11, 850. [Google Scholar] [CrossRef]
- Useni Sikuzani, Y.; Mpanda Mukenza, M.; Kikuni Tchowa, J.; Kabamb Kanyimb, D.; Malaisse, F.; Bogaert, J. Hierarchical Analysis of Miombo Woodland Spatial Dynamics in Lualaba Province (Democratic Republic of the Congo), 1990–2024: Integrating Remote Sensing and Landscape Ecology Techniques. Remote Sens. 2024, 16, 3903. [Google Scholar] [CrossRef]
- Useni Sikuzani, Y.; Mpanda Mukenza, M.; Malaisse, F.; Bogaert, J. Investigating of spatial urban growth pattern and associated landscape dynamics in Congolese mining cities bordering Zambia from 1990 to 2023. Resources 2024, 13, 107. [Google Scholar] [CrossRef]
- Mukenza, M.M.; Muteya, H.K.; Nghonda, D.-D.N.; Sambiéni, K.R.; Malaisse, F.; Kaleba, S.C.; Bogaert, J.; Sikuzani, Y.U. Uncontrolled Exploitation of Pterocarpus tinctorius Welw. and Associated Landscape Dynamics in the Kasenga Territory: Case of the Rural Area of Kasomeno (DR Congo). Land 2022, 11, 1541. [Google Scholar] [CrossRef]
- Useni Sikuzani, Y.; Kipili Mwenya, I.; Khoji Muteya, H.; Malaisse, F.; Cabala Kaleba, S.; Bogaert, J. Anthropogenic pressures and spatio-temporal dynamics of forest ecosystems in the rural and border municipality of Kasenga (DRC). Landsc. Ecol. Eng. 2024, 20, 195–212. [Google Scholar] [CrossRef]
- Useni Sikuzani, Y.; Khoji Muteya, H.; Yona Mleci, J.; Mpanda Mukenza, M.; Malaisse, F.; Bogaert, J. The Restoration of Degraded Landscapes along the Urban–Rural Gradient of Lubumbashi City (Democratic Republic of the Congo) by Acacia auriculiformis Plantations: Their Spatial Dynamics and Impact on Plant Diversity. Ecologies 2024, 5, 25–41. [Google Scholar] [CrossRef]
- Huang, Y.; Chen, Z.X.; Tao, Y.U.; Huang, X.Z.; Gu, X.F. Agricultural remote sensing big data: Management and applications. J. Integr. Agric. 2018, 17, 1915–1931. [Google Scholar] [CrossRef]
- Tarantino, C.; Adamo, M.; Mairota, P. Remote sensing for conservation monitoring: Assessing protected areas, habitat extent, habitat condition, species diversity, and threats. Ecol. Indic. 2013, 33, 45–59. [Google Scholar] [CrossRef]
- Rawat, J.S.; Kumar, M. Monitoring land use/cover change using remote sensing and GIS techniques: A case study of Hawalbagh block, district Almora, Uttarakhand, India. Egypt. J. Remote Sens. Space Sci. 2015, 18, 77–84. [Google Scholar] [CrossRef]
- Frohn, R.C. Remote Sensing for Landscape Ecology: New Metric Indicators for Monitoring, Modeling, and Assessment of Ecosystems; CRC Press: Boca Raton, FL, USA, 2018; pp. 1–350. [Google Scholar]
- Crowley, M.A.; Cardille, J.A. Remote sensing’s recent and future contributions to landscape ecology. Curr. Landsc. Ecol. Rep. 2020, 5, 45–57. [Google Scholar] [CrossRef]
- Kottek, M.; Grieser, J.; Beck, C.; Rudolf, B.; Rubel, F. World Map of the Köppen-Geiger climate classification updated. Meteorol. Z. 2006, 15, 259–263. [Google Scholar] [CrossRef]
- Malaisse, F. How to Live and Survive in Zambezian Open Forest (Miombo Ecoregion); Les Presses Agronomiques de Gembloux: Gembloux, Belgium, 2010. [Google Scholar]
- Hamadi, A.; Borderies, P.; Albinet, C.; Koleck, T.; Villard, L.; Ho Tong Minh, D.; Le Toan, T.; Burban, B. Temporal Coherence of Tropical Forests at P-Band: Dry and Rainy Seasons. IEEE Geosci. Remote Sens. Lett. 2015, 12, 557–561. [Google Scholar] [CrossRef]
- Gorelick, N.; Hancher, M.; Dixon, M.; Ilyushchenko, S.; Thau, D.; Moore, R. Google Earth Engine: Planetary-scale geospatial analysis for everyone. Remote Sens. Environ. 2017, 202, 18–27. [Google Scholar] [CrossRef]
- Pflumm, L.; Kang, H.; Wilting, A.; Niedballa, J. GEE-PICX: Generating cloud-free Sentinel-2 and Landsat image composites and spectral indices for custom areas and time frames – a Google Earth Engine web application. Ecography 2025, 5, e07385. [Google Scholar] [CrossRef]
- Ermida, S.L.; Soares, P.; Mantas, V.; Göttsche, F.-M.; Trigo, I.F. Google Earth Engine Open-Source Code for Land Surface Temperature Estimation from the Landsat Series. Remote Sens. 2020, 12, 1471. [Google Scholar] [CrossRef]
- Phan, T.N.; Kuch, V.; Lehnert, L.W. Land Cover Classification using Google Earth Engine and Random Forest Classifier—The Role of Image Composition. Remote Sens. 2020, 12, 2411. [Google Scholar] [CrossRef]
- Ma, Y.; Song, J.; Zhang, Z. In-Memory Distributed Mosaicking for Large-Scale Remote Sensing Applications with Geo-Gridded Data Staging on Alluxio. Remote Sens. 2022, 14, 5987. [Google Scholar] [CrossRef]
- Senay, G.B.; Schauer, M.; Friedrichs, M.; Velpuri, N.M.; Singh, R.K. Satellite-based water use dynamics using historical Landsat data (1984–2014) in the southwestern United States. Remote Sens. Environ. 2017, 202, 98–112. [Google Scholar] [CrossRef]
- Desai, S.; Mattoo, M.; Deshpande, A.M.; Dey, A.; Akiwate, S. Vegetation Change Detection Through NDVI Analysis Using Landsat-8 Data. 2024 4th Int. Conf. Comput., Commun., Control & Inf. Technol. (C3IT) 2024, 1–6. [CrossRef]
- Udin, W.S.; Zahuri, Z.N. Land Use and Land Cover Detection by Different Classification Systems using Remotely Sensed Data of Kuala Tiga, Tanah Merah Kelantan, Malaysia. J. Trop. Resour. Sustain. Sci. 2017, 5, 145–151. [Google Scholar] [CrossRef]
- Sedona, R.; Paris, C.; Tian, L.; Riedel, M.; Cavallaro, G. An Automatic Approach for the Production of a Time Series of Consistent Land-Cover Maps Based on Long-Short Term Memory. IGARSS 2022 - 2022 IEEE Int. Geosci. Remote Sens. Symp. 2022, 203–206. [CrossRef]
- Tomaselli, V.; Veronico, G.; Sciandrello, S.; Blonda, P. How does the selection of landscape classification schemes affect the spatial pattern of natural landscapes?
- Lu, K.; Ma, Z.; Huo, P.; He, Z.; Zhang, H.; Zheng, X. Mixed Pixel Saturability Based Area Estimation Model on Remote Sensing Image. 2023 IEEE 6th Int. Conf. Pattern Recognit. Artif. Intell. (PRAI) 2023, 751–757. [Google Scholar] [CrossRef]
- Campbell, B.M.; Campbell, B. Center for International Forestry Research (Eds.). The Miombo in Transition: Woodlands and Welfare in Africa; Center for International Forestry Research: Bogor, Indonesia, 1996. [Google Scholar]
- Muteya, H.K.; Nghonda, D.-D.N.; Kalenda, F.M.; Strammer, H.; Kankumbi, F.M.; Malaisse, F.; Bastin, J.-F.; Sikuzani, Y.U.; Bogaert, J. Mapping and Quantification of Miombo Deforestation in the Lubumbashi Charcoal Production Basin (DR Congo): Spatial Extent and Changes between 1990 and 2022. Land 2023, 12, 1852. [Google Scholar] [CrossRef]
- Zhao, J.; Lee, C.-D.; Chen, G.; Zhang, J. Research on the Prediction Application of Multiple Classification Datasets Based on Random Forest Model. 2024 IEEE 6th Int. Conf. Power, Intell. Comput. Syst. (ICPICS) 2024, 156–161. [CrossRef]
- Çakir, G.; Sivrikaya, F.; Keleş, S. Forest cover change and fragmentation using Landsat data in Maçka State Forest Enterprise in Turkey. Environ. Monit. Assess. 2008, 137, 51–66. [Google Scholar] [CrossRef] [PubMed]
- Olofsson, P.; Foody, G.M.; Stehman, S.V.; Woodcock, C.E. Making better use of accuracy data in land change studies: Estimating accuracy and area and quantifying uncertainty using stratified estimation. Remote Sens. Environ. 2013, 129, 122–131. [Google Scholar] [CrossRef]
- Bogaert, J.; Barima, Y.S.S.; Ji, J.; Jiang, H.; Bamba, I.; Mongo, L.I.W.; Mama, A.; Nyssen, E.; Dahdouh-Guebas, F.; Koedam, N. A Methodological Framework to Quantify Anthropogenic Effects on Landscape Patterns. In Landscape Ecology in Asian Cultures; Hong, S.-K., Kim, J.-E., Wu, J., Nakagoshi, N., Eds.; Springer Japan: Tokyo, Japan, 2011; pp. 141–167. [Google Scholar] [CrossRef]
- Bogaert, J.; Ceulemans, R.; Salvador-Van Eysenrode, D. Decision Tree Algorithm for Detection of Spatial Processes in Landscape Transformation. Environ. Manage. 2004, 33, 62–73. [Google Scholar] [CrossRef] [PubMed]
- Musavandalo, C.M.; Sambieni, K.R.; Mweru, J.P.M.; Bastin, J.F.; Ndukura, C.S.; Nguba, T.B.; … Bogaert, J. Land cover dynamics in the northwestern Virunga landscape: An analysis of the past two decades in a dynamic economic and security context. Land 2024, 13, 566. [Google Scholar] [CrossRef]
- Bogaert, J.; Ceulemans, R.; Salvador-Van Eysenrode, D. Decision Tree Algorithm for Detection of Spatial Processes in Landscape Transformation. Environ. Manage. 2004, 33, 62–73. [Google Scholar] [CrossRef]
- De Haulleville, T.; Rakotondrasoa, O.L.; Rakoto Ratsimba, H.; Bastin, J.-F.; Brostaux, Y.; Verheggen, F.J.; Rajoelison, G.L.; Malaisse, F.; Poncelet, M.; Haubruge, É.; Beeckman, H.; Bogaert, J. Fourteen years of anthropization dynamics in the Uapaca bojeri Baill. Forest of Madagascar. Landsc. Ecol. Eng. 2018, 14, 135–146. [Google Scholar] [CrossRef]
- McGarigal, K.; Cushman, S.A. Comparative evaluation of experimental approaches to the study of habitat fragmentation effects. Ecol. Appl. 2002, 12, 335–345. [Google Scholar] [CrossRef]
- Mama, A.; Sinsin, B.; Cannière, C.D.; Bogaert, J. Anthropisation et dynamique des paysages en zone soudanienne au nord du Bénin, 2013.
- Thenkabail, P.S.; Teluguntla, P.G.; Xiong, J.; Oliphant, A.; Congalton, R.G.; Ozdogan, M.; … Foley, D. Global cropland-extent product at 30-m resolution (GCEP30) derived from Landsat satellite time-series data for the year 2015 using multiple machine-learning algorithms on Google Earth Engine cloud (No. 1868). US Geological Survey, 2021.
- Hussain, K.; Mehmood, K.; Anees, S.A.; Ding, Z.; Muhammad, S.; Badshah, T.; … Khan, W.R. Assessing forest fragmentation due to land use changes from 1992 to 2023: A spatio-temporal analysis using remote sensing data. Heliyon 2024, 10, 14. [Google Scholar] [CrossRef]
- Kumar, C.; Walton, G.; Santi, P.; Luza, C. Random Cross-Validation Produces Biased Assessment of Machine Learning Performance in Regional Landslide Susceptibility Prediction. Remote Sens. 2025, 17, 213. [Google Scholar]
- Mellor, A.; Boukir, S.; Haywood, A.; Jones, S. Exploring issues of training data imbalance and mislabelling on random forest performance for large area land cover classification using the ensemble margin. ISPRS J. Photogramm. Remote Sens. 2015, 105, 155–168. [Google Scholar] [CrossRef]
- McNicol, I.M.; Ryan, C.M.; Williams, M. How resilient are African woodlands to disturbance from shifting cultivation? Ecol. Appl. 2018, 28, 1645–1656. [Google Scholar] [CrossRef]
- Kalaba, F.K.; Quinn, C.H.; Dougill, A.J.; Vinya, R. Floristic composition, species diversity and carbon storage in charcoal and agriculture fallows and miombo woodland in Zambia. For. Ecol. Manage. 2013, 304, 99–109. [Google Scholar] [CrossRef]
- Ryan, C.M.; Pritchard, R.; McNicol, I.; Owen, M.; Fisher, J. Ecosystem services from southern African woodlands and their future under global change. Philos. Trans. R. Soc. B 2016, 371, 20150312. [Google Scholar] [CrossRef] [PubMed]
- Laurance, W.F.; et al. The fate of Amazonian forest fragments: A 32-year investigation. Biol. Conserv. 2011, 144, 56–67. [Google Scholar] [CrossRef]
- Anderson, J.E.; Rocliffe, S.; Haddaway, N.R.; Dunn, A.M. The role of mining in land use change in Africa: A systematic review. J. Clean. Prod. 2019, 231, 1224–1238. [Google Scholar] [CrossRef]
- Chidumayo, E.N. Forest degradation and recovery in a miombo woodland landscape in Zambia: 22 years of observations on permanent sample plots. For. Ecol. Manage. 2013, 291, 154–161. [Google Scholar] [CrossRef]
- Useni Sikuzani, Y.; Boisson, S.; Cabala Kaleba, S.; Nkuku Khonde, C.; Malaisse, F.; Halleux, J.M.; … Munyemba Kankumbi, F. Dynamique de l'occupation du sol autour des sites miniers le long du gradient urbain-rural de la ville de Lubumbashi, RD Congo. Biotechnol. Agron. Soc. Environ. 2020, 24, 1. [Google Scholar] [CrossRef]
- Mununga Katebe, F.; Raulier, P.; Colinet, G.; Ngoy Shutcha, M.; Mpundu Mubemba, M.; Jijakli, M.H. Assessment of heavy metal pollution of agricultural soil, irrigation water, and vegetables in and nearby the Cupriferous City of Lubumbashi,(Democratic Republic of the Congo). Agronomy 2023, 13, 357. [Google Scholar] [CrossRef]
- De Wasseige, C.; Flynn, J.; Louppe, D.; Hiol Hiol, F.; Mayaux, P. Les forêts du bassin du Congo-Etat des forêts 2013; Weyrich, 2014.
- Bourgeois, M.; Cossart, É.; Fressard, M. Mesurer et spatialiser la connectivité pour modéliser les changements des systèmes environnementaux. Approches comparées en écologie du paysage et en géomorphologie. Géomorphologie 2017, 23, 289–308. [Google Scholar]
- Decocq, G.; Dupouey, J.L.; Bergès, L. Dynamiques forestières à l'ère anthropocène: mise au point sémantique et proposition de définitions écologiques. Rev. For. Fr. 2021, 73, 21–52. [Google Scholar] [CrossRef]
- Ameja, L.G.; Ribeiro, N.; Sitoe, A.A.; Guillot, B. Regeneration and restoration status of Miombo woodland following land use land cover changes at the buffer zone of Gile National Park, Central Mozambique. Trees For. People 2022, 9, 100290. [Google Scholar]
- Simeon, K.; Alphonse, K.; Trésor, M.; Clément, T.; Thierry, A.S.; Aloïse, B.; Urbain, M.; Joel, L.; Ezéchiel, M.; Sylvestre, C. Land Use and Land Cover Change in the Urban Landscape of Butembo, Democratic Republic of the Congo (DRC). Int. J. Adv. Res. 2024, 7, 386–402. [Google Scholar] [CrossRef]
- Muimba-Kankolongo, A.; Banza Lubaba Nkulu, C.; Mwitwa, J.; Kampemba, F.M.; Mulele Nabuyanda, M. Impacts of trace metals pollution of water, food crops, and ambient air on population health in Zambia and the DR Congo. J. Environ. Public Health 2022, 2022, 4515115. [Google Scholar] [CrossRef]
- Lines, R.; Bormpoudakis, D.; Xofis, P.; Tzanopoulos, J. Modelling Multi-Species Connectivity at the Kafue-Zambezi Interface: Implications for Transboundary Carnivore Conservation. Sustainability 2021, 13, 12886. [Google Scholar] [CrossRef]
- Jones, T.; Bamford, A.J.; Ferrol-Schulte, D.; Hieronimo, P.; McWilliam, N.; Rovero, F. Vanishing wildlife corridors and options for restoration: a case study from Tanzania. Trop. Conserv. Sci. 2012, 5, 463–474. [Google Scholar] [CrossRef]
- Schleper, S. Pister les gnous: Médiation technologique entre humains et faune sauvage au Serengeti depuis les années 1950. In Protéger et détruire: Gouverner la nature sous les Tropiques; CNRS Editions: Paris, France, 2022; pp. 269–298. [Google Scholar]
- Nackoney, J.; Williams, D. Conservation prioritization and planning with limited wildlife data in a Congo Basin forest landscape: assessing human threats and vulnerability to land use change. J. Conserv. Plan. 2012, 8, 25–44. [Google Scholar]
- Mayifilua, J.; Mbula, D.; Muliele, J.C.; Ombeni, I. Maringa-Lopori-Wamba Landscape; Center for International Forestry Research, 2022.
- Vaglio, S.; Mauno, U.; Chiarelli, B. Application of Kyoto Protocol in the Conservation of Bonobos (Pan paniscus). Glob. Bioeth. 2007, 20, 53–63. [Google Scholar] [CrossRef]
Figure 1.
Location of the Luilu sector in Lualaba Province (DR Congo), including the mining city of Kolwezi and its 79 rural settlements. The sector is served by a network of national and provincial roads.
Figure 1.
Location of the Luilu sector in Lualaba Province (DR Congo), including the mining city of Kolwezi and its 79 rural settlements. The sector is served by a network of national and provincial roads.
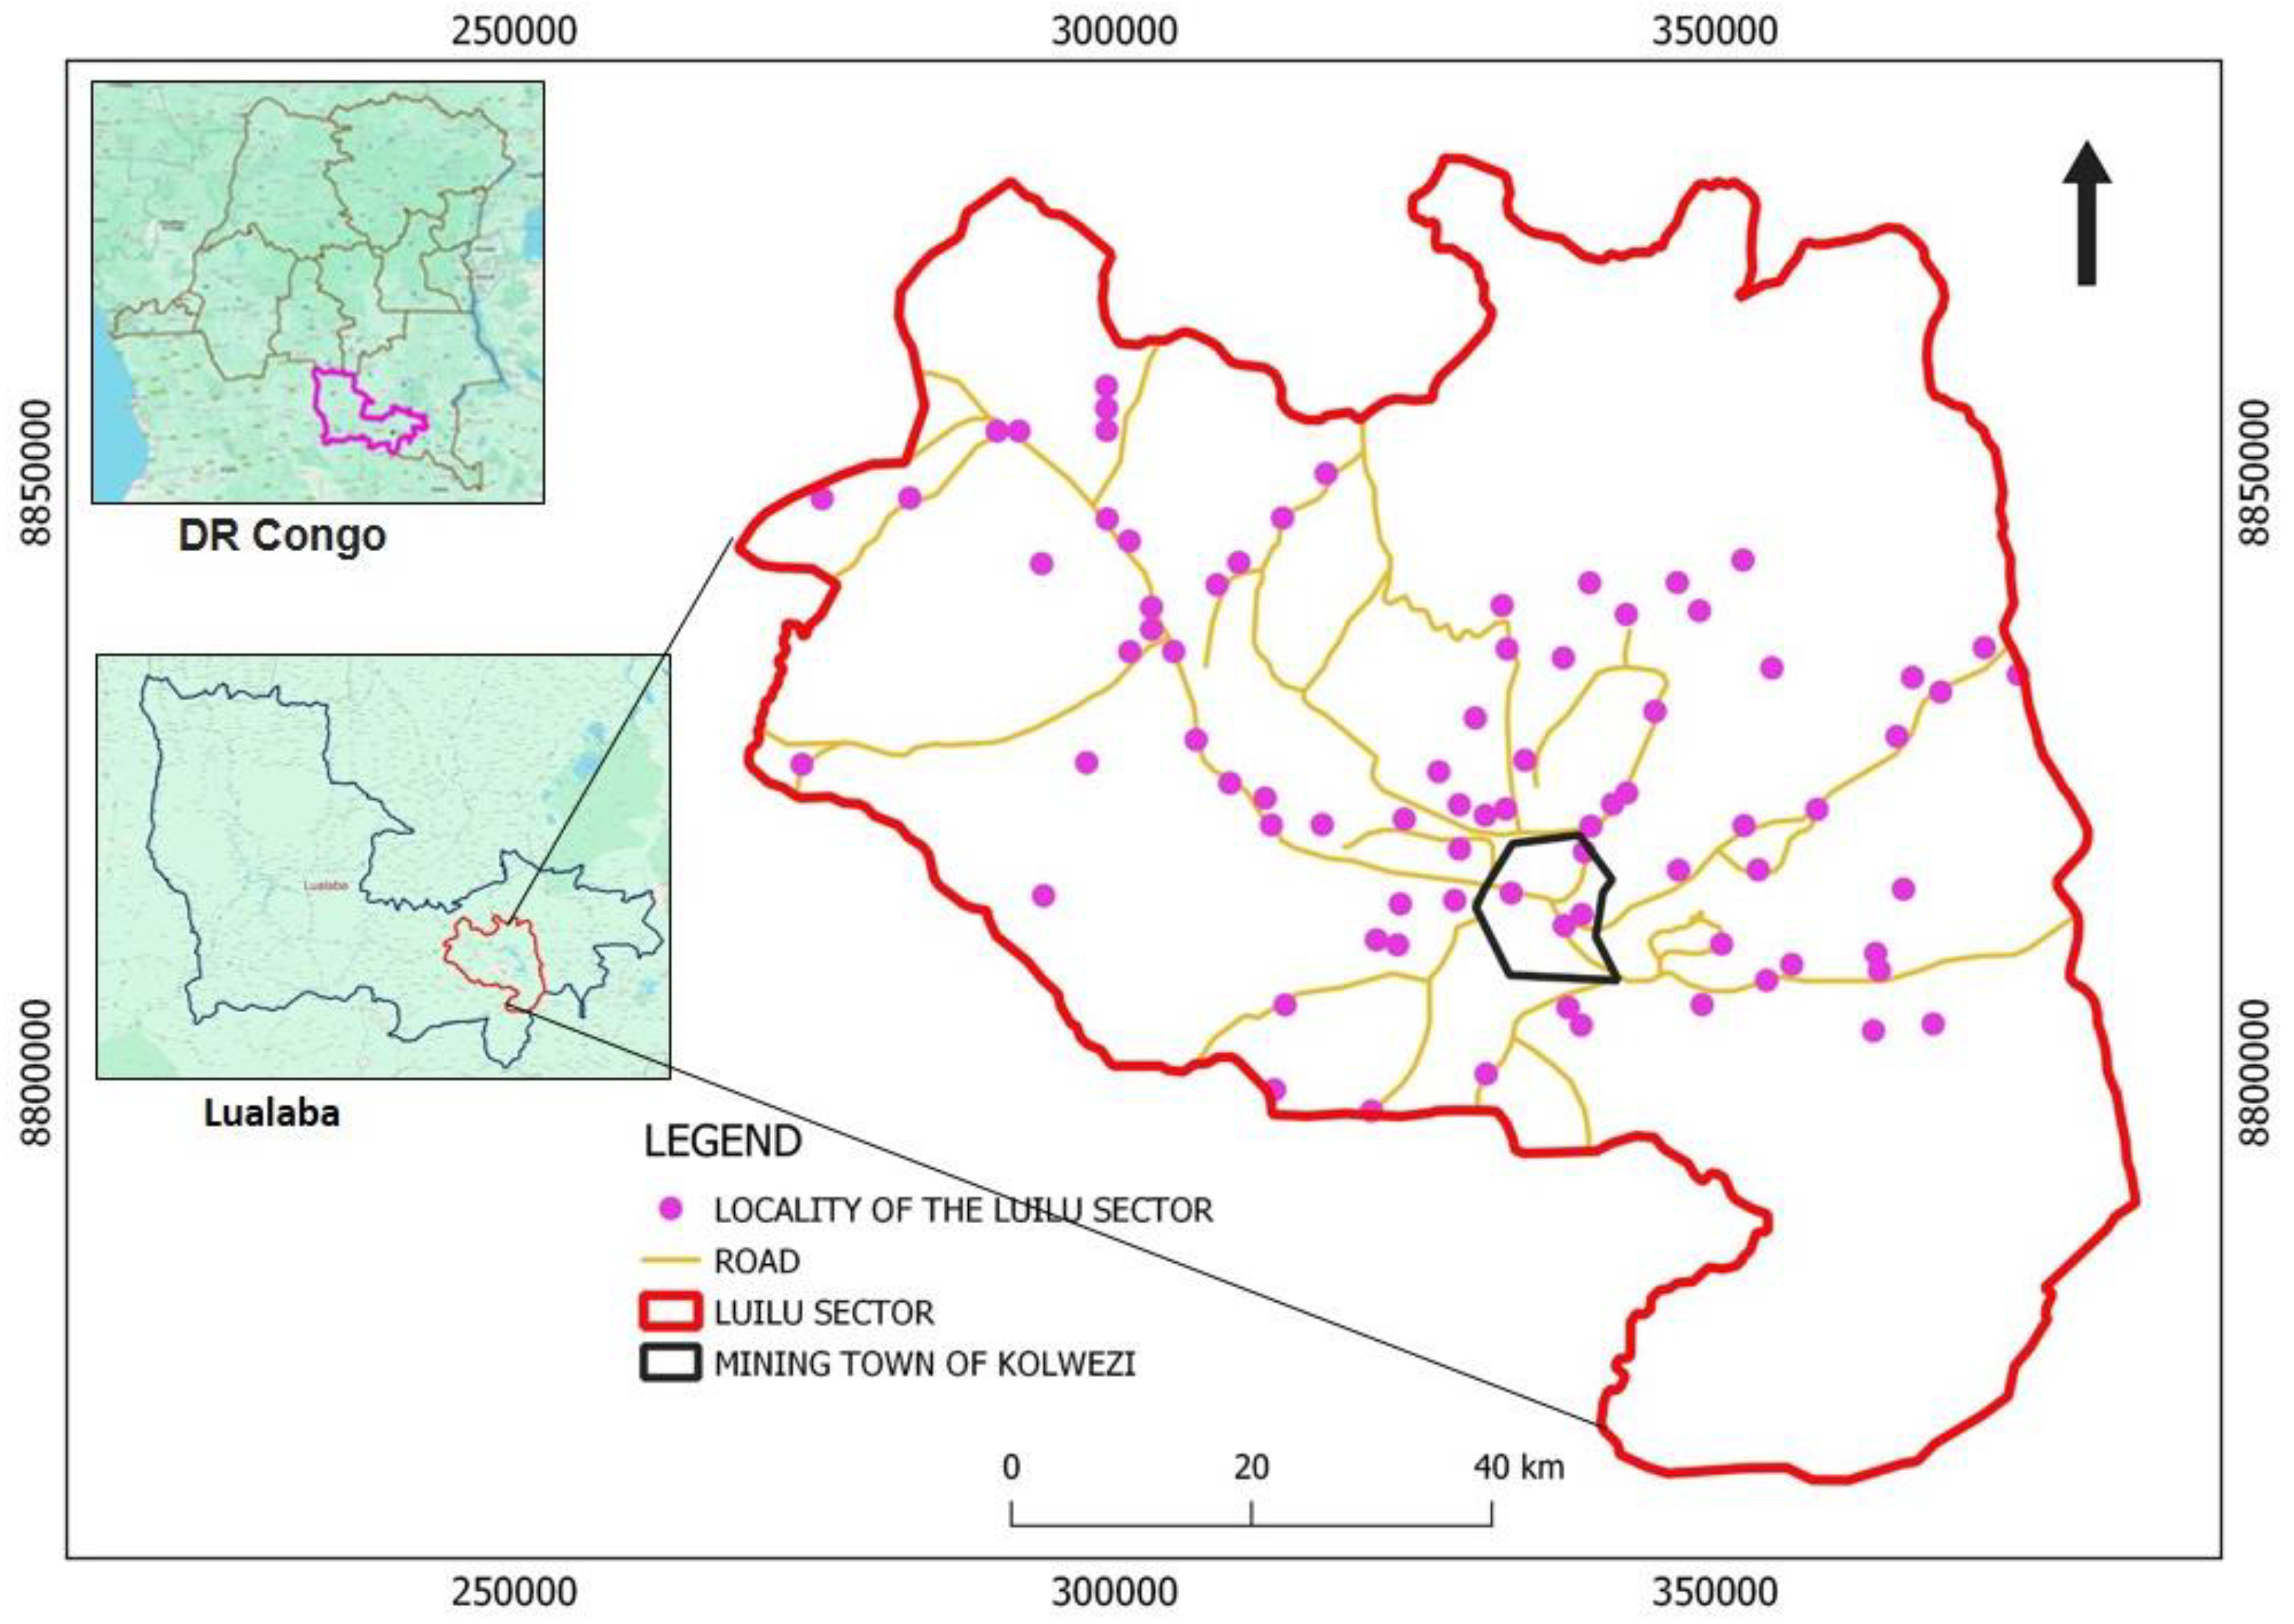
Figure 2.
Land-use maps of the study area for 1990, 1998, 2006, 2014, and 2024, based on Landsat image classification using the Random Forest algorithm. A decrease in Miombo woodland cover and an increase in agricultural land, built-up and bare soil areas, as well as shrub savanna, were observed. The years 1993, 2001, 2010, 2017, and 2021 are not shown in the figure.3.2. Landscape Composition and Stability in the Luilu Sector.
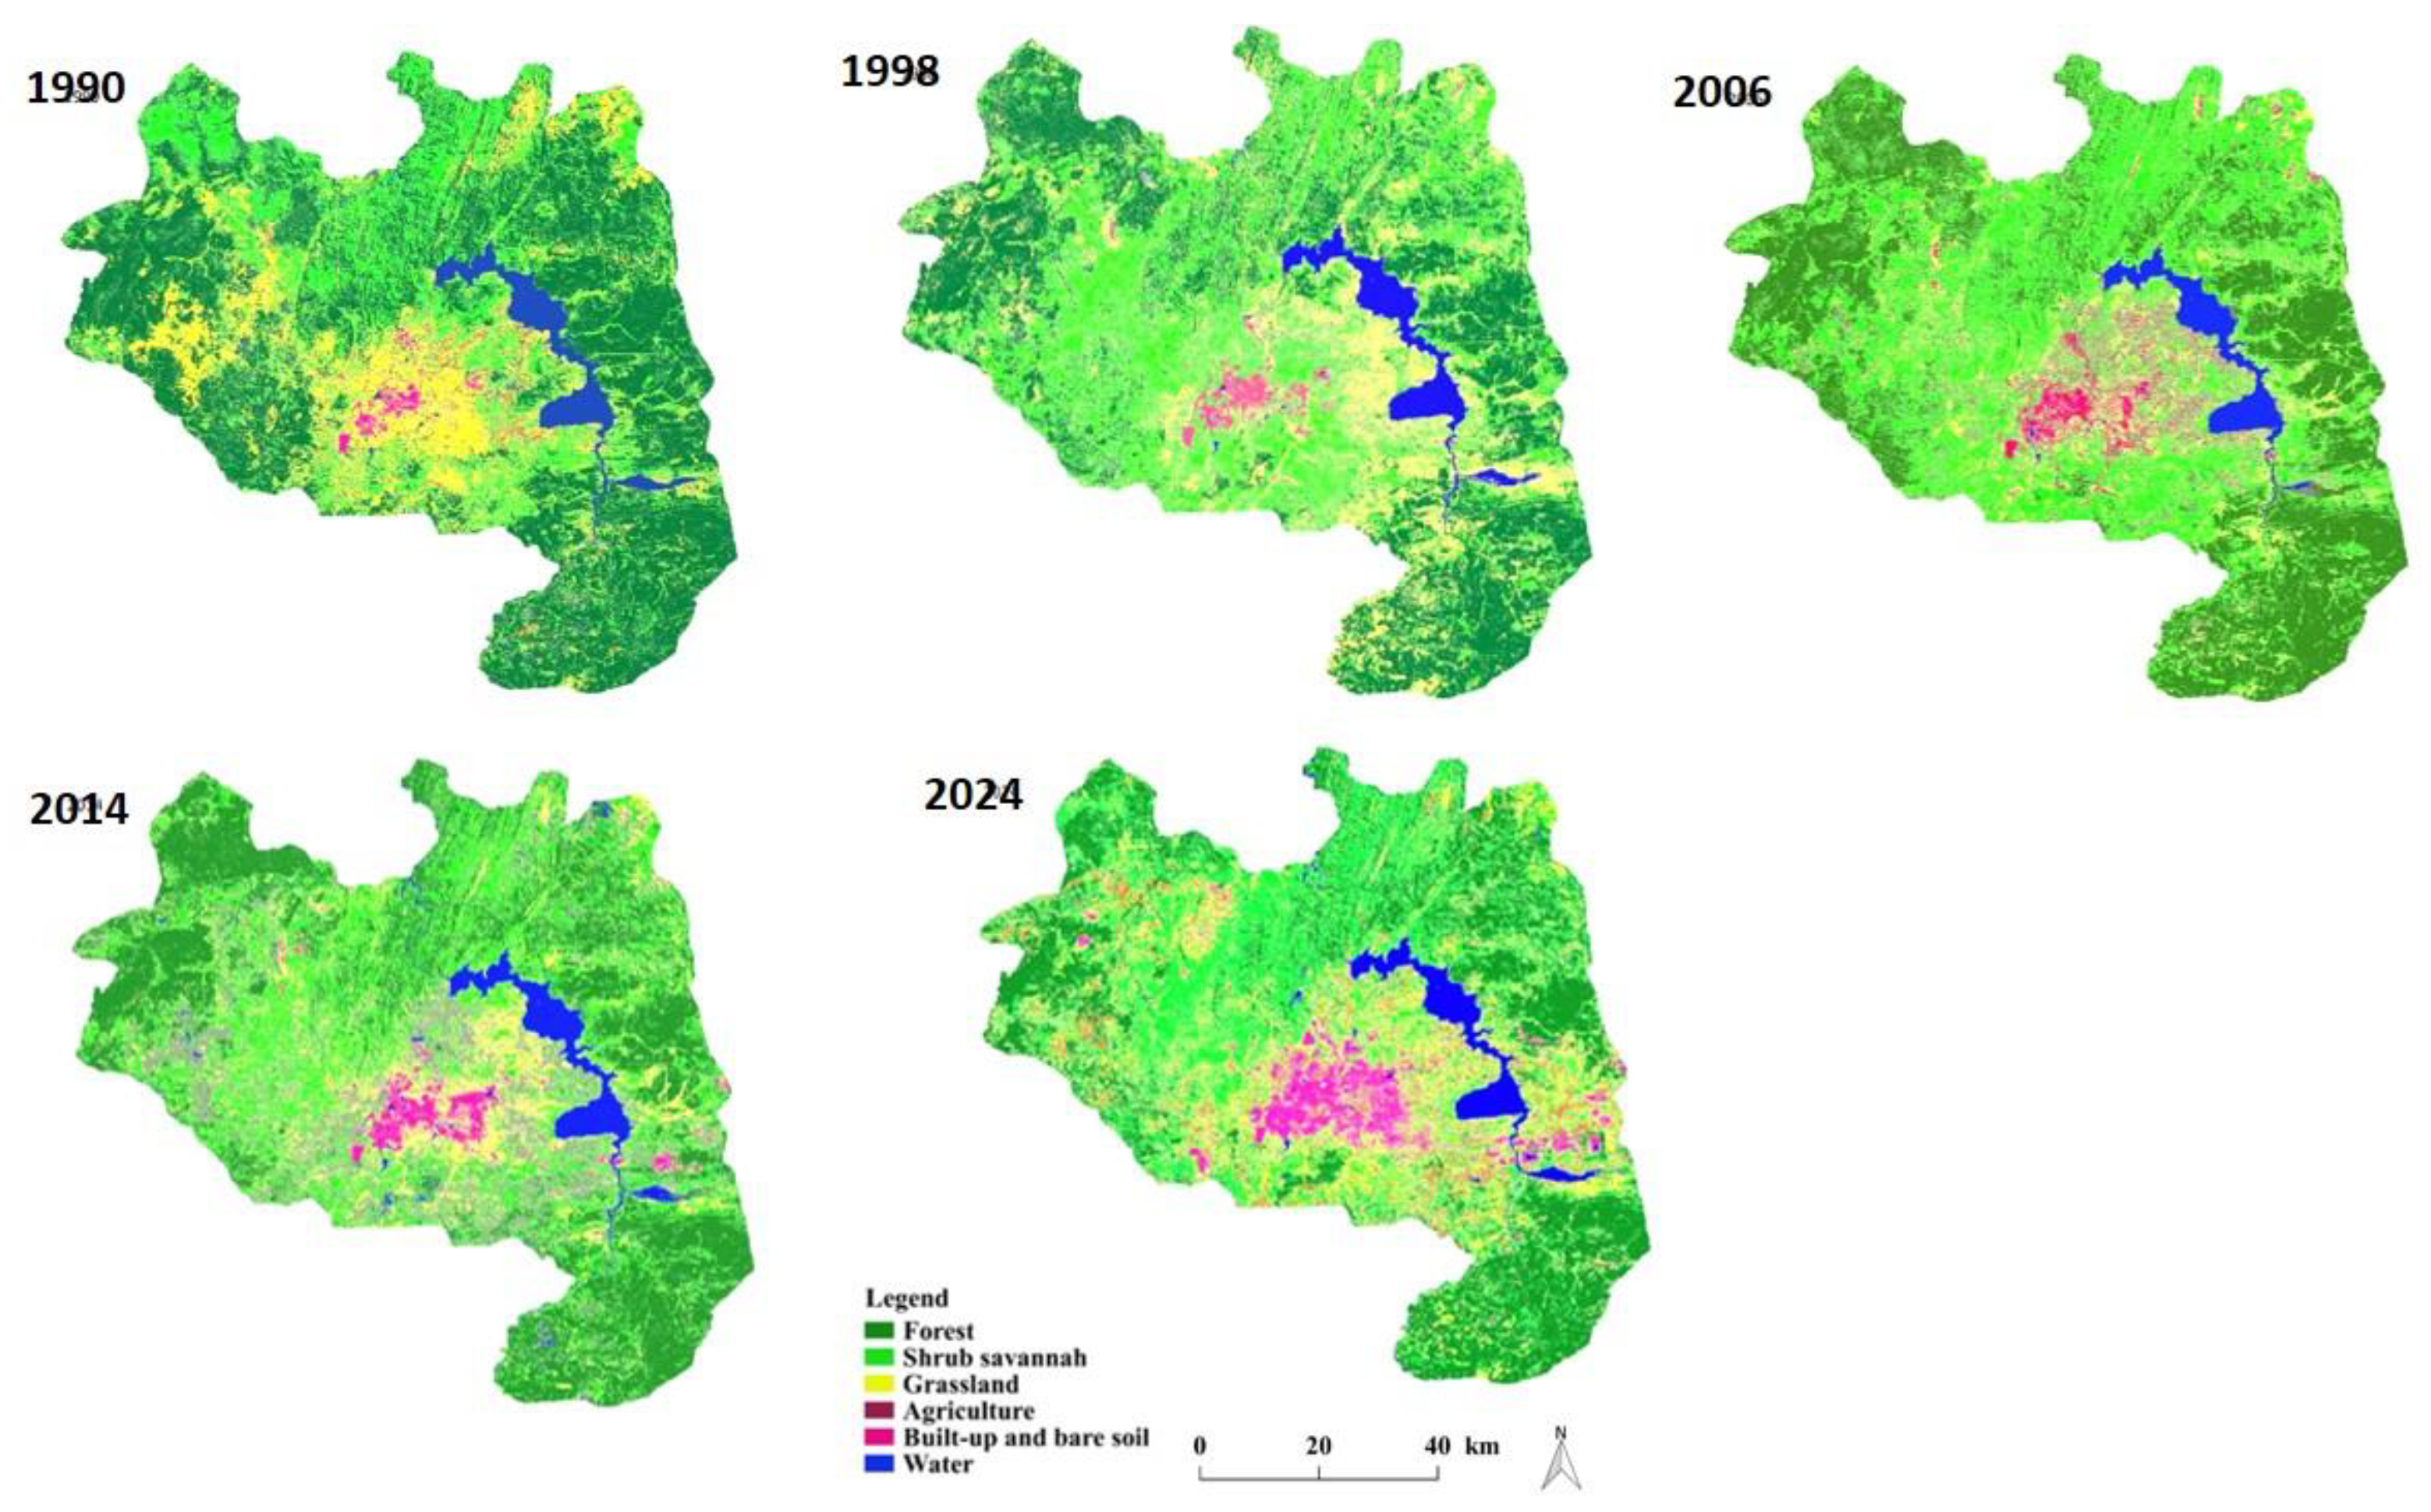
Table 2.
Accuracy assessment indices of supervised classifications of Landsat images (1990–2024) using the Random Forest algorithm. UA: User’s Accuracy; PA: Producer’s Accuracy.
Table 2.
Accuracy assessment indices of supervised classifications of Landsat images (1990–2024) using the Random Forest algorithm. UA: User’s Accuracy; PA: Producer’s Accuracy.
| Year | Forest UA | Forest PA | Shrub Savanna UA | Shrub Savanna PA | Grassland UA | Grassland PA | Agriculture UA | Agriculture PA | Built-up & Bare Soil UA | Built-up & Bare Soil PA | Water UA | Water PA | Overall Accuracy (%) | Kappa |
| 1990 | 91 | 100 | 94 | 94 | 78 | 70 | 71 | 71 | 100 | 100 | 100 | 100 | 93 | 91 |
| 1993 | 95 | 96 | 89 | 78 | 48 | 60 | 59 | 59 | 99 | 97 | 100 | 100 | 87 | 83 |
| 1998 | 67 | 95 | 78 | 66 | 73 | 80 | 89 | 47 | 96 | 99 | 100 | 100 | 86 | 82 |
| 2001 | 84 | 100 | 82 | 72 | 47 | 45 | 52 | 76 | 98 | 88 | 100 | 100 | 83 | 79 |
| 2006 | 84 | 100 | 79 | 69 | 57 | 60 | 56 | 59 | 86 | 94 | 100 | 97 | 84 | 80 |
| 2010 | 100 | 100 | 76 | 100 | 92 | 60 | 64 | 82 | 98 | 84 | 100 | 97 | 89 | 87 |
| 2014 | 75 | 100 | 74 | 72 | 53 | 45 | 71 | 59 | 94 | 93 | 97 | 100 | 83 | 78 |
| 2017 | 78 | 100 | 77 | 72 | 71 | 50 | 63 | 88 | 97 | 88 | 97 | 100 | 85 | 81 |
| 2021 | 81 | 100 | 79 | 81 | 56 | 50 | 56 | 53 | 100 | 97 | 100 | 97 | 86 | 82 |
| 2024 | 78 | 100 | 81 | 69 | 65 | 55 | 75 | 88 | 98 | 94 | 94 | 100 | 87 | 82 |
Table 6.
Spatial Structure Indices of the Luilu Landscape (1990–2024). Notation: n = number of patches; a = total class area (km²); ā= mean patch area (km²); D = largest patch index (%); Df(p) = fractal dimension and p-value of regression.
Table 6.
Spatial Structure Indices of the Luilu Landscape (1990–2024). Notation: n = number of patches; a = total class area (km²); ā= mean patch area (km²); D = largest patch index (%); Df(p) = fractal dimension and p-value of regression.
| Year | Index | Forest | Shrub Savanna | Grassland | Agriculture | Bare & Built | Water |
|---|---|---|---|---|---|---|---|
| 1990 | n | 111702 | 257212 | 235334 | 94265 | 1850 | 11489 |
| a | 2966.32 | 1867.66 | 1151.47 | 320.87 | 49.18 | 285.28 | |
| ā | 0.03 | 0.01 | 0 | 0 | 0.03 | 0.02 | |
| D | 29.62 | 2.66 | 9.57 | 0.72 | 30.75 | 81.26 | |
| Df(p) | 1.42(0.00) | 1.40(0.00) | 1.42(0.00) | 1.42(0.00) | 1.40(0.00) | 1.47(0.00) | |
| 1993 | n | 129801 | 334719 | 250210 | 216034 | 2590 | 4793 |
| a | 1946.77 | 1909.21 | 942.58 | 1832.91 | 55.18 | 238.54 | |
| ā | 0.01 | 0.01 | 0 | 0.01 | 0.02 | 0.05 | |
| D | 29.51 | 7.63 | 5.03 | 13.1 | 30.92 | 91.32 | |
| Df(p) | 1.42(0.00) | 1.42(0.00) | 1.45(0.00) | 1.42(0.00) | 1.50(0.00) | 1.52(0.00) | |
| 1998 | n | 156838 | 179298 | 198450 | 239031 | 10007 | 8617 |
| a | 2828.96 | 2560.83 | 1292.52 | 435.38 | 134.63 | 247.88 | |
| ā | 0.02 | 0.01 | 0.01 | 0 | 0.01 | 0.03 | |
| D | 19.97 | 13.78 | 2.85 | 0.16 | 43.4 | 82.6 | |
| Df(p) | 1.41(0.00) | 1.41(0.00) | 1.45(0.00) | 1.48(0.00) | 1.50(0.00) | 1.51(0.00) | |
| 2001 | n | 131569 | 251658 | 246762 | 125929 | 10534 | 1034 |
| a | 2719.76 | 2243.39 | 1108.43 | 1126.07 | 65.32 | 236.83 | |
| ā | 0.02 | 0.01 | 0 | 0.01 | 0.01 | 0.23 | |
| D | 23.6 | 5.27 | 2.75 | 12.83 | 18.92 | 95.24 | |
| Df(p) | 1.41(0.00) | 1.40(0.00) | 1.43(0.00) | 1.42(0.00) | 1.50(0.00) | 1.55(0.00) | |
| 2006 | n | 97820 | 174142 | 169684 | 156703 | 18776 | 705 |
| a | 2920.42 | 2793.83 | 616.76 | 816.97 | 147.39 | 204.49 | |
| ā | 0.03 | 0.02 | 0 | 0.01 | 0.01 | 0.29 | |
| D | 24.07 | 17.86 | 0.48 | 5.87 | 17.95 | 94.41 | |
| Df(p) | 1.43(0.00) | 1.41(0.00) | 1.44(0.00) | 1.43(0.00) | 1.49(0.00) | 1.47(0.00) | |
| 2010 | n | 77213 | 169674 | 140084 | 78906 | 12475 | 972 |
| a | 2479.07 | 3389.46 | 775.41 | 514.72 | 139.37 | 202.47 | |
| ā | 0.03 | 0.02 | 0.01 | 0.01 | 0.01 | 0.21 | |
| D | 15.44 | 23.62 | 0.72 | 6.22 | 22.25 | 92.16 | |
| Df(p) | 1.42(0.00) | 1.41(0.00) | 1.44(0.00) | 1.42(0.00) | 1.43(0.00) | 1.45(0.00) | |
| 2014 | n | 117902 | 186960 | 232705 | 110251 | 13082 | 9323 |
| a | 2964.21 | 2204.81 | 915.97 | 952.15 | 184.07 | 279.3 | |
| ā | 0.03 | 0.01 | 0 | 0.01 | 0.01 | 0.03 | |
| D | 22.38 | 4.57 | 2.33 | 6.18 | 51.79 | 75.64 | |
| Df(p) | 1.43(0.00) | 1.40(0.00) | 1.45(0.00) | 1.44(0.00) | 1.48(0.00) | 1.51(0.00) | |
| 2017 | n | 72279 | 152582 | 161123 | 83121 | 9753 | 7187 |
| a | 2121.22 | 2853.33 | 994.22 | 1123.81 | 163.79 | 244.14 | |
| ā | 0.03 | 0.02 | 0.01 | 0.01 | 0.02 | 0.03 | |
| D | 23.53 | 17.27 | 1.81 | 13.27 | 32.49 | 83.27 | |
| Df(p) | 1.43(0.00) | 1.43(0.00) | 1.43(0.00) | 1.43(0.00) | 1.48(0.00) | 1.47(0.00) | |
| 2021 | n | 142860 | 209388 | 209696 | 183891 | 12790 | 1771 |
| a | 2116.62 | 3013.03 | 993.22 | 900.54 | 263.63 | 213.45 | |
| ā | 0.01 | 0.01 | 0 | 0 | 0.02 | 0.12 | |
| D | 22.45 | 10.51 | 2.01 | 5.93 | 35.86 | 89.11 | |
| Df(p) | 1.43(0.00) | 1.40(0.00) | 1.44(0.00) | 1.42(0.00) | 1.46(0.00) | 1.51(0.00) | |
| 2024 | n | 121087 | 256435 | 287181 | 126465 | 41166 | 10818 |
| a | 2239.82 | 2043.84 | 863.63 | 1023.7 | 382.29 | 246.92 | |
| ā | 0.02 | 0.01 | 0 | 0.01 | 0.01 | 0.02 | |
| D | 24.34 | 6.18 | 0.52 | 2.61 | 46.87 | 76.48 | |
| Df(p) | 1.43(0.00) | 1.40(0.00) | 1.44(0.00) | 1.43(0.00) | 1.46(0.00) | 1.52(0.00) |
Disclaimer/Publisher’s Note: The statements, opinions and data contained in all publications are solely those of the individual author(s) and contributor(s) and not of MDPI and/or the editor(s). MDPI and/or the editor(s) disclaim responsibility for any injury to people or property resulting from any ideas, methods, instructions or products referred to in the content. |
© 2025 by the authors. Licensee MDPI, Basel, Switzerland. This article is an open access article distributed under the terms and conditions of the Creative Commons Attribution (CC BY) license (http://creativecommons.org/licenses/by/4.0/).
Copyright: This open access article is published under a Creative Commons CC BY 4.0 license, which permit the free download, distribution, and reuse, provided that the author and preprint are cited in any reuse.


