
Submitted:
20 October 2025
Posted:
21 October 2025
You are already at the latest version
Abstract
There are many studies showing an association between fitness and/or sporting skill and better cognitive performance than is seen for unfit/unskilled individuals. One mechanism proposed for these effects is increased neural plasticity, meaning better cognitive performance could be the result of a more trainable brain. Here, we investigated performance on a visual search task to see if there was a training benefit associated with fitness or sporting skill and to supplement previous findings for a motor learning task which showed better initial performance in sporting individuals but no learning-related differences. No significant benefit was associated with fitness or sporting skill either for task performance or task learning. The only significant difference was likely indicative of reduced non-specific learning in two of the three sport/exercise groups, possible due to prior improvement in these skills as a result of fitness or sporting skill. The findings suggest a need for specificity in selecting use of training when aiming to produce cognitive benefits. This would also benefit from better assessment of sport-specific and sport/fitness general effects on cognitive performance.
Keywords:
sport
; exercise
; cognition
; fitness
; visual search
Introduction
1.1. Background
It is of no doubt that engaging in physical activity is associated with a range of health benefits and this is of particular interest for populations such as older individuals (e.g., [1]). In recent decades there has been a significant increase in studies suggesting that such benefits may extend to the cognitive domain. While some older work looked at measures such as simple response times in different age groups of sporting and sedentary participants, notably showing that older individuals who partook in sporting/fitness activity performed much better than those older individuals who did not ([2]; see [3]) there are now many studies showing benefits for those who are fitter/engage in sports compared to those who do not, both for older and younger individuals.
For example, a recent study reported better cognitive performance, in terms of processing speed, working memory, executive function and attentional control associated with higher levels of moderate/vigorous physical activity in 65-80 year-old individuals [4]. As might be expected in light of the findings of Colcombe and Kramer [3] the most significant effects related to executive function/attentional control. Interestingly, in these findings it seems worth noting that effects of age and education were uniformly more significant for all cognitive measures and also that the effects, when looked at relative to the mean levels of active time, indicated more that “less activity is bad”, rather than “more activity is better”, although this may depend to some degree on the actual mean level of activity. In other words, if you had 20 minutes less activity than average the reduction in performance was more than the improvement in performance associated with having 20 minutes more activity than average. This could mean that physical activity might be neuroprotective, and so reduces the decrements in performance often seen with increasing age. As the authors mention, however, theirs was a cross-sectional study, so linking the levels of activity and cognitive performance in a causal manner is open to debate. This also means that higher levels of activity are associated with higher ‘cognitive health’ but it can’t be shown that the activity causes better cognitive performance.
This means consideration of effects in younger individuals is particularly important because it might be expected that if an effect was due to protection from deterioration then it would be less likely in younger individuals. An example related to this is a review conducted by Donnelly and colleagues [5], who covered studies looking at exercise and cognitive function in younger individuals (aged 5-13). They specifically mentioned the reliability of cross-sectional work showing fitter children performed better on cognitive measures but also, importantly, mention that there are studies with longitudinal effects of fitness on cognition.
Despite these findings, it is important to consider why the reported beneficial effects are seen and there are a number of possible reasons that are of interest. One example is that people with faster response times might be more likely to persist with a sport where quicker responding is thought to help with performance (but note that it is possible that what is thought the be beneficial and what is actually beneficial in a sport might not always be the same). The work more than twenty years ago carried out by Colcombe and Kramer in which they conducted a meta-analysis of studies to look at what cognitive processes, if any, were affected by aerobic fitness [3] was clear in reporting that aerobic training had beneficial effects on cognition in older individuals, and the largest benefit occurred for processes involving executive control. Importantly, they specifically say “it is unclear precisely what role cardiovascular fitness might play in instigating these changes” (where the changes they were referring to were those for cognitive performance). Better understanding of this is important when considering the use of a fitness-based ‘intervention’ with the specific aim of providing a benefit for cognition to improve the efficiency of any intervention and have a clearer idea of when such an intervention might be useful and when it might not, with the latter meaning alternative approaches should be considered instead. It is also important to clarify the degree of generality of any potential training benefit.
Interestingly, the lack of clear understanding of the role of fitness in producing cognitive benefits still seems to generally be the case. While a beneficial cognitive change seen for a specific sport can often be linked to aspects of the sport itself, such as the temporal preparation differences seen in tennis players [6], it remains unclear why an improvement in cardiovascular fitness results in cognitive benefits. One mechanism, proposed by Stimpson and colleagues [7] is that there is promotion of angiogenesis and cerebral circulation as a result of improved cardiovascular fitness. Briefly, they suggest that exercise, mostly of an aerobic nature, promotes cerebral angiogenesis (see [8,9]), likely relating to observed increases in cerebral circulation [10] and increase oxygenation in the brain [11]. This is thought to result in changes such that there is greater brain plasticity during or, of more relevance here and to many studies, following exercise.0
This all leads to the study reported here, which complements the previous work in which motor learning was investigated in relation to sport/fitness [12]. There, the sporting individuals performed better on the task at the start but there were not differences in terms of learning rates, neither for general or specific aspects of motor learning. Such learning does not, of course, involve executive function which has been shown to be one of the primary beneficiaries of increased fitness. Therefore, here, a visual search task was presented to individuals engaged in sport/fitness training to investigate whether (1) they showed any differences in task performance and (2) whether they showed any differences in the rate of improvement on task performance. This used a variant of the visual search task described by Kunar and colleagues [13]. The task here allowed measurement of improvement related to repetition of the arrangement of elements in a visual search array. The importance of the arrangement of the non-target elements in such arrays is contextual cueing, an effect that has been reliably seen in a number of studies (e.g., [14,15,16]). General task-related improvement could also be measured and any difference compared between groups. Use of this task is also relevant given the aforementioned tendency of benefits to be associated with executive function [3]. More specifically, a study by Peterson and colleagues [17] using a dual-task method found patterns of disruption to visual search performance that indicated the necessity of executive control for effective performance of this task.
1.2. Study Aims
We tested the hypothesis that improved fitness/sporting engagement is associated with cognitive benefits due to better trainability on a task. This used a visual search task that allowed both stimulus specific and non-specific learning to be measured on a task in which executive control is a factor.
2. Materials and Methods
2.1. Participants
62 participants took part in the study in total. All were recruited from National Central University, Taiwan. 38 of these participants engaged in sport/fitness training and 24 were sedentary (control) participants. Like the previous study by Guchait and Muggleton [12], the sporting individuals were runners (15 in total, 13 male, 12 female, mean age of 21.3 ± 0.50 years ± standard error) or baseball players (13 male, mean age 20.3 ± 0.78 years ± standard error). The control participants took part in no sport or exercise activities and 12 were male and 12 were female (mean age = 21.4 ± 0.81 years ± standard error). All were right-handed and all had either normal or corrected-to-normal vision and none had taken part in the previous study [12].
2.2. Ethical Approval and Consent
All tasks and procedures were explained to participants before they agreed to take part in the experiment and it was made clear that they would also be free to withdraw at any point during the study for any reason. Each participant who took part in the study gave written informed consent prior to participation. The study was carried out in accordance with the Declaration of Helsinki [18] and had been approved by the Ethics Review Committee of National Taiwan University (approval number: 202105EM017, June 2021).
2.3. Study Design
The visual-cognitive task (see Section 2.3.2) was designed such that performance could be compared between groups but, importantly, so changes in performance over time (i.e., learning) could be measured for individuals, thus allowing analysis both within and between groups. Task improvement could also be looked at in terms of stimulus specific learning and general learning on the task (see below for details of this).
2.3.1. Questionnaires
In addition to the groups characteristics (i.e., sport/physical activity engagement), further measures were collected from all participants who took part in the study. These were Perceived Functional Ability (PFA) and Physical Activity Rating (PA-R) [19]; the Revised Competitiveness Index (CI-R) [20]; the Stanford Sleepiness Scale [21,22]; the Pittsburgh Sleep Quality Index; the Revised Competitiveness Index (CI-R) [20]; and the International Physical Activity Questionnaires (IPAQ) [23]. The physical activity questionnaire scores also allowed estimation of each individual’s VO2max score, an indicator of the maximum rate of oxygen consumption and taken as an indicator of fitness levels. This used the equation:
the validity of which was shown by George and colleagues [19].
VO2max (in mL.kg-1.min-1) = 48.073 + (6.178 × gender) – (0.246 × age) – (0.619 × BMI) - (0.712 × PFA) + (0.671 × PA-R)
2.3.2. Visual Search Learning Task
The task used was based on that described by Kunar and colleagues [13], was presented at a distance of 57 cm on a 54.4 cm width computer visual display unit (VDU) and was programmed using PsychoPy [24]. Stimuli were constructed of a target, which was a letter T oriented either 90 degrees to the left or 90 degrees to the right, with each orientation present on an equal number of occasions, with there being eleven distractors which were the letter L rotated by 90, 180 or 270 degrees (such that there were three or four of each rotation). Stimulus arrays were constructed with elements (target/distractors) positioned within squares within a 6 x 6 grid array (not shown to the participants) such that there was no overlap for any elements, with 1.7 x 1.7-degree element size and offsets of each of up to 0.3 degrees of visual angle. All stimulus elements were white and were presented on a black background. Blocks of the task consisted of 32 trials and seven such blocks were presented to make up the training on the task. In these blocks there were four target locations, each associated with a specific arrangement of distractor stimuli, meaning participants were trained with 56 trials for each arrangement. For each participant, these were randomly generated during the first four trials of the task and then the arrangements were used for the remaining training trials. The final block was made up of 192 trials. 96 of these were the same as the training trials and the other 96 had targets in the same locations as during training but different configurations of the distractor arrangements.
Participants were instructed that they had to report the orientation of the single letter T that was presented in each trail of the task (see Figure 1 for an example trial). As mentioned above, this was always rotated 90 degrees to the left or to the right (with the latter being the case in Figure 1) and they had to indicate this rotation by means of a keypress, using the ‘z’ key for a leftward rotation and the ‘m’ key for a rightward rotation. Responses had to be made with the first finger of the left hand for ‘z’ and the first finger of the right hand for ‘m’. Participants were instructed to make their responses as quickly and accurately as possible. Following a response, the screen went blank before the next trial was presented.
2.4. Statistical Analysis
Performance analysis was carried out for response times and accuracy on the task. Only the outcomes of the response time analysis are reported because no significant effects were seen for any of the accuracy analyses, likely due to the generally high levels of performance, with few (or no) errors being made by participants in blocks of trials. For response time analysis, two participants (both in the male runner group) were excluded because their values lay more than three standard deviations from the mean of the values from all of the participants (both being higher than 2.2 seconds compared to values more typically being around 1 second). Only correct response times were analyzed. SPSS (details) was used for analysis, which employed two-way analysis of variance (ANOVA) for group (control, runner) x gender (male, female) analysis and one-way ANOVA for male groups (control, runner, baseball players). Where the assumption of homogeneity of variance was violated this is indicated. Partial eta squared values indicate effect sizes, with 0.01 indicating a small effect, 0.06 a moderate effect and 0.14 a large effect [25]. Post hoc comparisons, where needed, were independent sample t tests for 2-way ANOVA significances. For these, the statistical values listed are where the test used the assumption of equal variances (but for all cases where there was a significant difference this was also the case if equal variances were not assumed). Post hoc tests for male controls, runners and baseball players used the Dunnett t-test, with the controls selected as the control group.
3. Results
3.1. Participants
The characteristics and measures collected from the participants are illustrated in Table 1.
3.1.1. Age
For the ANOVA with factors of group (control and runner) and gender (male and female) there was no significant effect of group (F(1,45) = 0.021, p = 0.885), gender (F(1,45) = 0.248, p = 0.621) nor a significant interaction (F(1,45) = 0.312, p = 0.579). Similarly, for the ANOVA for male controls, runners, and baseball players there was no significant effect of group (F(2,35) = 0.528, p = 0.588).
3.1.2. BMI and VO2max
For the ANOVA for BMI with factors of group and gender there was no significant effect of group (F(1,45) = 0.192, p = 0.663), there was a significant effect for gender (F(1,45) = 4.580, p = 0.038, partial eta squared = 0.092) and no significant interaction (F(1,45) = 1.025, p = 0.317). The gender effect was due to a significantly higher BMI for males (t(47) = 2.129, p = 0.039).
For VO2max with factors of group and gender, there was a significant effect of group (F(1,45) = 42.972, p < 0.001, partial eta squared = 0.488), a significant effect of gender (F(1,45) = 57.166, p < 0.001, partial eta squared = 0.560) and a significant interaction (F(1,45) = 6.703, p = 0.013, partial eta squared = 0.130). The effect of group was significant (t(47) = 5.168, p < 0.001), being higher for runners than controls, and for gender approached significance (t(47) = 3.088, p = 0.088), being higher for males than females, consistent with the largest values being for male runners and the elevation being less the case for female runners.
For BMI for male controls, runners, and baseball players there was no significant effect of group (F(2,35) = 0.389, p = 0.681). For VO2max, there was a significant effect of group (F(2,35) = 18.121, p < 0.001, partial eta squared = 0.509). This was due to higher scores for runners than controls (mean difference = 10.008, p < 0.001) and higher scores for baseball players than controls (mean difference = 7.157, p < 0.001).
Note that for VO2max the Levene Test of Equality of Error Variances was violated when this was based on means (Levene Statistic(3,45) = 3.188, p = 0.033). While this means there is an increased likelihood of an error in statistical outcomes, this seem unlikely here given that the analysis shows higher VO2max values associated with sport/fitness (and the effects are highly significant).
3.1.3. Activity Ratings: Perceived Functional Ability (PFA), Physical Activity Rating (PA-R), and International Physical Activity Questionnaire (IPAQ) Scores
For the ANOVA with factors of group (control and runner) and gender (male and female) for PFA, ANOVA with factors of group (control and runner) and gender (male and female) there was a significant effect of group (F(1,45) = 38.088, p < 0.001) and of gender (F(1,45) = 17.018, p < 0.001) as well as a significant interaction (F(1,45) = 7.624, p = 0.008). PFAs were higher for runners than controls (t = 5.168, p < 0.001) and higher for males than females (t = 3.088, p = 0.003).
The ANOVA for PFA for male controls, runners and baseball players showed a significant effect (F(2,35) = 24.506, p < 0.001, partial eta squared = 0.583). This was due to runners having higher scores than controls (mean difference = 4.583, p < 0.001) and baseball players having higher scores than controls (mean difference = 3.968, p < 0.001).
For PA-R, ANOVA with factors of group (control and runner) and gender (male and female) showed a significant effect of group (F(1,45) = 66.007, p < 0.001), no effect of gender and no significant interaction. This significant effect was due to higher values for runners than controls (t = 8.075, p < 0.001).
The ANOVA for PA-R for male controls, runners and baseball players showed a significant effect (F(2,35) = 26.176, p < 0.001, partial eta squared = 0.583). Post hoc tests showed that values for runners were significantly higher than for controls (mean difference = 8.731, p < 0.001) and higher for baseball players than controls (mean difference = 5.577, p < 0.001).
For IPAQ scores, there was a significant effect for group for both vigorous (F(1) = 8.917, p = 0.005) and overall (F(1,45) = 8.243, p = 0.006) scores. There was no significant effect of gender nor a significant interaction. In both cases the significant effect was due to higher scores for runners than controls (vigorous: t = 3.058, p = 0.004; overall: t = 2.941, p – 0.005).
The ANOVA for IPAQ scored for male controls, runners and baseball players showed a significant effect for both vigorous (F(2,35) = 5.330, p = 0.010, partial eta squared = 0.233) and overall scores (F(2,35) = 3.810, p = 0.032, partial eta squared = 0.179). Both runners (mean difference = 1681, p = 0.013) and baseball players (mean difference = 1644, p = 0.015) had higher scores than controls for vigorous scores. For overall MET scores, the higher scores for runners compared to controls approached significant (mean difference = 2054, p = 0.051) and was significant for baseball players compared to controls (mean difference = 2247, p = 0.031).
3.1.4. Sleep-Related Scores: Stanford Sleepiness Scale and Pittsburgh Sleep Quality Index
For the Stanford Sleepiness Scale there was a significant effect of group for the ‘After’ score (F(1,45) = 9.110, p < 0.004), no effects for gender (both p > 0.05) and a significant interaction (F(1,45) = 4.772, p = 0.034). This was due to higher scores for controls than for runners (t = 2.873, p = 0.006).
This pattern was also seen for the ANOVA for male controls, runners, and baseball players with no effect for ‘Before’ but a significant effect for ‘After’ (F(2.35) = 4.535, p = 0.018, partial eta squared = 0.206).
For ‘After’ the Levene Test of Equality of Error Variances was violated when this was based on means (Levene Statistic(3,45) = 3.058, p = 0.038). Unlike the case for VO2max values, there were both no expectations for this measure, so caution should be used when interpreting this, even though the effect size counts as a large effect.
For the Pittsburgh sleep quality index, there were no effects of group for any of the measures (all p > 0.05), no effects of gender (all p > 0.05) and no significant interaction.
3.1.5. Competitiveness Scores
For group there was a significant effect for Enjoyment of Competition (F(1,45) = 12.881, p = 0.001) but no difference for the Contentiousness score (p > 0.05). There were no significant effects for gender (p > 0.05) and no significant interactions (p > 0.05). This main effect for Enjoyment of Competition was due to higher scores for runners than controls (t = 3.540, p = 0.001).
For the ANOVA for male controls, runners, and baseball players there was a significant effect for Enjoy Competition (F(2,35) = 4.359, p = 0.020, partial eta squared =0.199) but no significant effect for Contentiousness or the overall scores. This was found to be due to higher enjoyment for runners compared to controls (mean difference = 5.840, p = 0.024), whereas baseball players and controls did not significantly differ (p = 0.969).
3.2. Task Performance
3.2.1. Baseline and Learning-Related Response Times
This first analysis compared performance on the task for the first block of trials for each group. This is the sort of effect tested for in many studies looking at sport and cognition.
For each participant, the median response time was calculated for correct responses in first block of trials for the task. The data relating to this analysis is shown in Figure 2.
3.2.1.1. Overall Baseline Performance (Correct Response Times)
The data was first analyzed with an analysis of variance (ANOVA) with a factor of group (male controls, female controls, male runners, female runners, male baseball players). There was no significant effect of group (F(4,55) = 1.158, p = 0.339).
3.2.1.2. Baseline Performance with Factors of Sport and Gender
Data for the sedentary participants and runners was analyzed with a two-way ANOVA with factors of gender (male or female) and group (runner or control). This showed no main effect of sport (F(1,45) = 1.713, p = 0.198), gender (F(1,45) = 1.492, p = 0.229) nor a significant interaction (F(1,45) = 0.006, p = 0.936).
3.2.1.3. Baseline Performance with a Factor of Sport for Males
The data for all three groups, but just for the male participants (as there was no female baseball player group) was analyzed with a one-way ANOVA with a factor of group (controls, runners, baseball players). This showed no significant effect (F(2,35) = 1.434, p = 0.253).
3.2.2. Task Learning
Several analyses were conducted to look at the degree of learning on the task and patterns of improvement of performance. This was again conducted using analysis of variance and looked at (1) whether there was significant learning, (2) whether the learning was specific (i.e., for the repeated stimulus arrangements) or general (i.e., whether there was improvement for novel stimulus arrangements) and (3) whether there were any group differences for any patterns of learning that were seen. Learning measures for the groups are shown in Figure 3.
3.2.2.1. Performance Before and After Learning: Sport and Gender Effects
ANOVA was carried out for response times with factors of group (runners, controls), gender (male, female) and stage: block 1 (baseline performance, referred to as baseRTs below); final block with repeats of the learned trials (indicated as rptRTs below); and final block new trials (to see whether there was improvement not related to the specifically learned trials and indicated as newRTs below).
A significant effect was seen for the different RT conditions (F(2,86) = 120.789, p < 0.001, partial eta squared = 0.737). The other main effects were not significant (group F(1,45) = 1.872, p = 0.178); gender F(1, 43) = 0.668, p = 0.418) and no interaction was significant (stage x group F(2,86) = 0.971, p = 0.383; stage x gender F(2,86) = 2.306, p = 0.106; stage x group x gender F(2,86) = 0.329, p = 0.720).
The main effect of RT condition had a large effect size (see the partial eta squared value of 0.737, above) and RTs for each time-point (baseRTs, rptRTs and newRTs) were compared for the three possible pairings with paired t-tests and using the conservative Bonferonni correction for multiple comparisons.
BaseRTs differed significantly from both rptRTs (t(46) = 12.079, p < 0.001) and newRTs (t(46) = 9.051, p < 0.001). Additionally, rptRTs and newRTs differed significantly (t(46) = 12.044, p < 0.001). The Cohen’s D value for these comparisons was 0.9 or higher in each case, indicating all were large effects. This means baseline RTs were significantly higher than post-training new RTs which were, in turn, significantly higher than post-training repeat RTs.
3.2.2.2. Performance Before and After Learning: Effects of Sport in Males
A repeated measures ANOVA was used with a within-subjects factor of stage (baseRTs, rptRTs, newRTs) and a between-subject factors of group (control, running, baseball). This showed a significant effect for stage (F(2,66) = 97.704, p < 0.001, partial eta-squared = 0.748) but no significant effect for group (F(2,33) = 1.195, p = 0.315) nor a significant interaction for stage and group (F(4,66) = 1.716, p = 0.157).
The stage was large (partial eta-squared = 0.748) and RTs were subsequently compared for each time point (baseRTs, rptRTs and newRTs) with paired t-tests and correction for multiple comparisons, as above.
BaseRTs differed significantly from rptRTs (t(35) = 11.111, p < 0.001) and newRTs (t(35) = 7.583, p < 0.001). RptRTs also differed significantly from newRTs (t(35) = 11.198, p < 0.001). All Cohen’s D effect sizes were larger than 0.9, again indicating that these were large effects.
3.2.2.3. Summary of Baseline and Learning Response Time Analyses
There were significant differences in response times on the task, with these being highest at the start of training, lower for the trials presented following training, and lower for the repeated trials than the new trials following training.
3.2.3. Analysis of Learning Types: Non-Specific and Specific Learning
This analysis was carried out on the size of the learning effects seen for the task. This was calculated for, first, non-specific learning (i.e., improvement in performance not linked to specific stimuli arrangements) and was the response times in the first block (baseRTs) minus response times in for the new trials in the final block (newRTs). Second, the specific learning measure was calculated for each participant, with this representing improved performance related to the repeated stimulus presentation. This was the responses times on the final block for the new trials (newRTs) minus the repeated trials (rptRTs). This data is shown in Figure 4. Analysis of this data was conduction in a similar manner to that previously described. In other words, the effects of group and gender were analyzed for all of the running and control participants then the effects of group were analyzed for male running, baseball and control participants.
3.2.3.1. Specific and Non-Specific Learning for Sport and Gender
Non-specific and specific learning amounts (measures by RT differences) with factors of group (control and runners) and gender (male and female) were analyzed using an ANOVA. There was no significant effect of group for either measure (non-specific F(1, 43) = 1.208, p = 0.278; specific F(1,43) = 0.002, p = 0.964). For gender, there was no significant effect for specific learning (F(1,43) = 1.450, p = 0.235) but the effect approached significance for non-specific learning (F(1,43) = 3.466, p = 0.069, partial eta squared = 0.075). No group x gender interaction was seen for either measure (non-specific: F(1,43) = 0.496, p = 0.485; specific: F(1,43) = 0.214, p = 0.646).
3.2.3.2. Effects Associated with Sport on Specific and Non-Specific Learning in Males
ANOVA was carried out with a factor of group (control, running, baseball) for non-specific and specific learning for male participants. There was no significant effect of group on non-specific learning (F(2, 33) = 2.362, p = 0.110) nor any significant effect on specific learning (F(2, 33) = 1.664, p = 0.205).
3.2.4. Analysis of Patterns of Learning: Differences Between Non-Specific and Specific Learning
For the final type of analysis, the pattern of the non-specific learning and specific learning was examined by analyzing the differences between these for the different groups. This allowed analysis of any changes in the relationship of these two measures. This measure is also shown in Figure 4.
3.2.4.1. Effects of Sport and Gender on Specific and Non-Specific Learning Differences
This analysis was carried out on the difference between non-specific learning RT values and specific learning RT values (i.e., non-specific learning RT – specific learning RT) using ANOVA with factors of group (running, control) and gender (male, female).
There was a significant effect of gender (F(1,43) = 5.484, p = 0.024, partial eta squared = 0.113), but no effect of group (F(1,43) = 1.272, p = 0.266), nor a significant interaction (F(1,43) = 0.790, p = 0.379).
Post-hoc comparison t-tests showed that, for the control participants, there was no significant difference between genders (t(22) = 0.923, p = 0.366) whereas there was a significant difference for runners (t(21) = 2.664, p = 0.015). This reflected a lower value in female runners, indicative, given the outcomes of the previous analyses, of a reduced difference between the two types of learning.
3.2.4.2. Effects of Sport on the Difference Between Learning Amounts for Male Participants
This looked at effects on the difference between non-specific learning and specific learning with a factor of group (running, baseball, control) for males.
A significant effect of sport was seen (F(2, 33) = 3.427, p = 0.044, partial eta squared = 0.172). Post-hoc comparison using Dunnett’s test with the control group set as the control showed no significant difference for runners compared to controls (p = 0.983) but there was a significant difference for baseball players compared to controls (p = 0.047). Note, a similar post hoc analysis in the previous analysis of specific and non-specific learning showed that the difference approached significance for baseball players compared to controls (p = 0.096) for non-specific learning but was not significant for specific learning (p = 0.287).
3.2.4.3. Patterns of Differences Summary
Significant differences were seen here for female runners and male baseball players, with, in both cases, there being a reduction in the differences between non-specific and specific learning on the visual search task. The patterns of data, statistics, and visual inspection of the data (see Figure 3 and Figure 4) are all consistent with this being due to lower levels of non-specific learning in these individuals.
4. Discussion
The hypothesis that sporting engagement or fitness improves cognitive performance by modulating learning was tested by presenting blocks of a visual search task (suggested to have an executive function component [17]) to runners, baseball players, and non-active control participants. Participants were compared for initial task performance and also for amount of learning across the repeated presentation of the task, in which the arrangement of stimulus elements was consistent during training. A final block allowed learning to be divided into that specific to arrangements of the stimuli and non-specific task-related improvement by use of trials with the repeated arrangements used during training and trials with novel arrangement of the elements in the stimuli.
There were no significant differences between groups for baseline performance on the task, but significant improvements were seen following training on the task, with this indicated by reduced response time (accuracy was consistently high throughout). This was the case for participants as a whole, but also for each individual group. This meant there was an overall learning effect for participants when considered together, as well as learning effects in each sport group, for both genders, and in control participants. Additionally, improvements were significant for both training measures, i.e., the training benefits of repetition of search elements (specific training) and the non-specific benefits on task performance, with the latter indicated by improved performance for novel search arrays.
Interestingly, there were no differences indicative of better learning of the task as a result of sport/fitness. This was indicated by a lack of significant difference in both specific and non-specific learning. It is also not the case that there was any trend for differences being in a direction suggestive of such an effect despite the lack of significant effects with these looking, if anything, like lower learning in the sports groups. The only significant difference seen was for a reduction in the difference between non-specific and specific learning for female runners and the male baseball players, a pattern suggestive of less non-specific learning in these two groups. There leads to two questions. First, what might this effect for two of the sports group mean and second, what might be the reason for it being seen in two groups but not one other?
In the case of the first question, results here suggest there is no general benefit in terms of either initial performance or rate of improvement of performance on a new task as a result of fitness/sport engagement. It may be that the possibility of reduced non-specific learning (albeit this inferred from the analysis) is informative. As this is opposite in direction to an effect that would have been in line with the hypothesis that sport/fitness leads to improved performance due to increased neural plasticity/greater trainability [7], it is again consistent with trainability not being generally improvable as a result of sport/fitness. It may be, however, that there is either transferrable benefits from trained sport/fitness skill that generalizes to aspects of other tasks or sport/fitness did cause some trainability-related changes but these resulted in training at some time in the past after sport/fitness training started. This also means there is a question of why there was no initial difference in task performance for the sporting groups compared to control participants. This could have been because the non-specific differences alone were insufficient for a significant performance difference to be seen. This seemingly contrasts with the previous study by Guchait and Muggleton [12], in which better performance on a motor learning task was associated with sport/fitness, but no learning differences were seen. It may be that the weighting was more on non-specific skills in the used motor task and this was enough to result in performance differences but the parts that were improved during practice were different and did not differ between groups. This means consideration of the nature of what affects performance, what can improve, and the time-scale of that improvement should be further considered.
The second question relating to why one of the sport groups (male runners) showed no differences to control participants for any task analysis is somewhat more difficult to answer, leading to possible explanations that are more speculative. It could be that there was a larger variability in performance in male controls so, if this is indicative of performance in the task used here in males more generally, sport/fitness-related effects on this were not enough for a significant effect to be seen. Alternatively, it could be that there were differences in the training in the male runners compared to the female runners. While there were higher fitness levels seen for runners of both genders there could have been different loading on other more cognitive aspects of training in the groups. One example for this could be the complexity of the running environment. For example, running on a track is simpler than running on roads or cross-country running. If there was a systematic difference in this, then there could be resultant differences between the groups. It could mean that there was a difference in trainability due to running for both groups but this was mostly during exercise so a track athlete would gain little due to the simplicity of the environment, whereas a road runner might gain more due to the complexity of the environment and a need to track more information while running. This could also agree with some of the effects seen with investigation of effects on cognition in a short time frame after ‘acute’ application of exercise (see [26]). Another reason could be, if both groups engage in road running, there is less need to worry about personal safety when running as a male whereas this can be more of a consideration for female runners, depending on where/when they run, again meaning different cognitive loading. This can also mean that male runners may be more likely to run alone while female runners are less likely to do this, meaning there are differences between the groups for typical training environments. While these are all speculative explanations, they are consistent with a need for better characterization of participants in experiments and broader consideration of factors that might meaningfully impact data and interpretation of findings.
There is the question of what the findings here, along with the previous motor learning investigation [12], means for (1) understanding of the nature of the effects of sport/fitness on cognition and (2) consideration of using sport/fitness as a beneficial cognitive intervention? These could be summarized as:
- Sport/fitness training is not associate with improvement of learning of tasks (either motor or cognitive) in a non-specific manner.
- Sport/fitness training does seem to be associated with better levels of some aspects of task performance and these seem to be less specific, maybe having resulted either directly from sport training or as a consequence of better learning of these due to sport training.
- These effects were not seen here for all sporting individuals. This may mean the environment, context, nature, and social environment of training is important for any additional benefits, such as on cognition, to be seen.
Further investigation of all of these points would clearly be both of interest and helpful when considering using sport or fitness with the specific aim of improving cognition. Much of this might also relate to what learned processes can transfer to effects on cognitive processes of interest. For example, when looking at transfer between cognitive tasks, visual search learning can be stimulus specific. This means that when learning is carried out for specific visual search stimuli, this learning can be specific to the stimuli learned and other task-related properties [27]. Interestingly, learning on a visuo-perceptual task with moving stimuli has been shown to result in benefits for a sport skill measure previously [28].
Additionally, and importantly, better ‘quantification’ of what it is about a sport or fitness training that leads to more general or transferrable benefits would be useful. This should also look at characteristics of individuals who show more benefits, a point is increasingly acknowledged as being of importance in psychology studies in general. In other words, while effects might be seen at a group level, they will differ for different individuals and whether factors predict this is important information.
5. Conclusions
No significant differences were seen in performance of a visual search task for individuals who were fitter and/or engaged in sport, nor was there any indication of improved learning rates for these groups. Patterns of task specific and task non-specific learning suggest some skills may be better in individuals who engage in sport/fitness but the aspects of training and the generalizable skills that are affected (and why) would benefit from more investigation. This would help in choosing exercise to use when trying to improve specific cognitive processes and, maybe more importantly, also help to know which aspects of the exercise are most important for the desired benefits.
Author Contributions
Conceptualization, AG and NGM.; methodology, AG ,YHZ and NGM.; software, NGM.; validation, AG, CYC, YZH and NGM.; formal analysis, AG and NGM.; investigation, AG and YHZ.; resources, NGM.; data curation, AG and YHZ.; writing—original draft preparation, NGM.; writing—review and editing, CYC, AG.; visualization, NGM.; supervision, CYC, NGM.; project administration, NGM.; funding acquisition, CYC, NGM. All authors have read and agreed to the published version of the manuscript.
Funding
This study was funded by the National Science and Technology Council (NSTC), Taiwan (grant numbers: 113-2410-H-194-086, 114-2410-H-194-088 to CYC, 110-2410-H-008-040-MY3, 114-2410-H-008-063-MY2 to NGM).
Institutional Review Board Statement
The study was conducted in accordance with the Declaration of Helsinki, and approved by the Institutional Review Board (or Ethics Committee) of National Taiwan University (protocol code 202105EM017, date of approval June 2021).
Informed Consent Statement
Informed consent was obtained from all subjects involved in the study.
Data Availability Statement
Data will be made available on request.
Conflicts of Interest
The authors declare no conflicts of interest. The funders had no role in the design of the study; in the collection, analyses, or interpretation of data; in the writing of the manuscript; or in the decision to publish the results.
References
- Galloza J.; Castillo B.; Micheo W. Benefits of Exercise in the Older Population. Phys Med Rehabil Clin N Am. 2017 Nov;28(4):659-669. [CrossRef]
- Spirduso, W.W.; Clifford, P. Replication of age and physical activity effects on reaction and movement time. J Gerontol. 1978, 33(1), 26-30. [CrossRef]
- Colcombe, S.; Kramer, A.F.. Fitness effects on the cognitive function of older adults: a meta-analytic study. Psychol Sci. 2003, 14(2), 125-30. [CrossRef]
- Collins, A.M.; Mellow, M.L.; Smith, A.E.; Wan, L.; Gothe, N.P.; Fanning, J.; Jakicic, J.M.; Kang, C.; Grove, G.; Huang, H.; Oberlin, L.E.; Migueles, J.H.; Kamboh, M.I.; Kramer, A.F.; Hillman, C.H.; Vidoni, E.D.; Burns, J.M.; McAuley, E.; Erickson, K.I. 24-Hour time use and cognitive performance in late adulthood: results from the Investigating Gains in Neurocognition in an Intervention Trial of Exercise (IGNITE) study. Age Ageing. 2025, 54(4), afaf072. [CrossRef]
- Donnelly, J.E.; Hillman, C.H.; Castelli, D.; Etnier, J.L.; Lee, S.; Tomporowski, P.; Lambourne, K.; Szabo-Reed, A.N. Physical Activity, Fitness, Cognitive Function, and Academic Achievement in Children: A Systematic Review. Med Sci Sports Exerc. 2016, 48(6), 1197-222. [CrossRef]
- Wang, C.H.; Chang, C.C.; Liang, Y.M.; Shih, C.M.; Muggleton, N.G.; Juan, C.H. Temporal preparation in athletes: a comparison of tennis players and swimmers with sedentary controls. J Mot Behav. 2013, 45(1), 55-63. [CrossRef]
- Stimpson, N.J.; Davison, G.; Javadi, A.-H. Joggin’ the noggin: towards a physiological understanding of exercise-induced cognitive benefits. Neurosci. Biobehav. Rev. [CrossRef]
- Kleim, J.A.; Cooper, N.R.; VandenBerg, P.M. Exercise induces angiogenesis but does not alter movement representations within rat motor cortex. Brain Res. 2003, 934, 1–6.
- Swain, R.A.; Harris, A.B.; Wiener, E.C.; Dutka, M.V.; Morris, H.D.; Theien, B.E. et al. Prolonged exercise induces angiogenesis and increases cerebral blood volume in primary motor cortex of the rat. Neuroscience 2003, 117, 1037–1046.
- Pereira, A.C.; Huddleston, D.E.; Brickman, A.M.; Sosunov, A.A.; Hen, R.; et al. An in vivo correlate of exercise-induced neurogenesis in the adult dentate gyrus. Proc. Natl. Acad. Sci. U. S. A. 2007, 104, 5638–5643. [CrossRef]
- Dupuy, O.; Gauthier ,C.J.; Fraser, S.A.; Desjardins-Crèpeau, L.; Desjardins, M.; et al. Higher levels of cardiovascular fitness are associated with better executive function and prefrontal oxygenation in younger and older women. Front. Hum. Neurosci. 2015, 9, 66. [CrossRef]
- Guchait, A.; Muggleton, N.G. Investigating mechanisms of sport-related cognitive improvement using measures of motor learning. Prog Brain Res. 2024, 283, 305-325. [CrossRef]
- Kunar, M.A.; John, R.; Sweetman, H. A configural dominant account of contextual cueing: Configural cues are stronger than colour cues. Q J Exp Psychol. 2014, 67(7), 1366-82. [CrossRef]
- Chun, M.M. Contextual cueing of visual attention. Trends in Cognitive Science, 2000, 4, 170–178.
- Jiang, Y.; Leung, A.W. Implicit learning of ignored visual context. Psychonomic Bulletin & Review, 2005, 12(1), 100–106.
- Kunar, M.A.; Flusberg, S.J.; Horowitz, T.S.; Wolfe, J.M. Does contextual cueing guide the deployment of attention? Journal of Experimental Psychology: Human Perception and Performance, 2007, 33,816–828.
- Peterson, M.S.; Beck, M.R.; Wong, J.H. Effects of executive functioning on visual search. Journal of Vision, 2006, 6(6),1106, 1106a. [CrossRef]
- World Medical Association. Declaration of Helsinki. Recommendations Guiding Medical Doctors in Biomedical Research Involving Human Subjects. Med. J. Aust. 1976, 1, 206–20.
- George, J.D.; Stone, W.J.; Burkett, L.N. Non-exercise VO2max estimation for physically active college students. Med. Sci. Sports Exerc. 1997, 29(3), 415–423.
- Smither, R.D.; Houston, J.M., The nature of competitiveness: the development and validation of the competitiveness index. Educ. Psychol. Meas. 1992, 52(2), 407–418. [CrossRef]
- MacLean, A.W.; Fekken, G.C.; Saskin, P.; Knowles, J.B., Psychometric evaluation of the Stanford Sleepiness Scale. J. Sleep Res. 1992, 1(1), 35–39. [CrossRef]
- Shahid, A.; Wilkinson, K.; Marcu, S.; Shapiro, C.M. Stanford sleepiness scale (SSS). In STOP, THAT and One Hundred Other Sleep Scales; Shahid, A.; Wilkinson, K.; Marcu, S.; Shapiro, C., Eds.; Springer, New York, NY. 2011. [CrossRef]
- Craig, C.L.; Marshall, A.L.; Sjöström, M.; Bauman, A.E.; Booth, M.L.; Ainsworth, B.E.; Pratt, M.; Ekelund, U.; Yngve, A.; Sallis, J.F.; Oja, P. International physical activity questionnaire: 12-country reliability and validity. Med. Sci. Sports Exerc. 2003, 35(8), 1381–1395. [CrossRef]
- Peirce, J.W.; Gray, J.R.; Simpson, S.; MacAskill, M.R.; Höchenberger, R.; Sogo, H.; Kastman, E.; Lindeløv, J. PsychoPy2: experiments in behavior made easy. Behavior Research Methods 2019, 10.3758/s13428-018-01193-y.
- Cohen, J. A Power Primer. Psychol. Bull. 1992, 112, 155–159.
- McSween, M.P.; Coombes, J.S.; MacKay, C.P.; Rodriguez, A.D.; Erickson, K.I.; Copland, D.A.; McMahon, K.L. The Immediate Effects of Acute Aerobic Exercise on Cognition in Healthy Older Adults: A Systematic Review. Sports Med. 2019, 49(1), 67-82. [CrossRef]
- Ellison, A.; Walsh, V. Perceptual learning in visual search: some evidence of specificities. Vision Res. 1998, 38(3), 333-45. [CrossRef]
- Zhou, Y.; Chen, C.T.; Muggleton, N.G. The effects of visual training on sports skill in volleyball players. Prog Brain Res. 2020, 253, 201-227. [CrossRef]
Figure 1.
An example of a search array for a trial from the task presented to participants. The target was a horizontally oriented letter ‘T’ rotated 90 degrees to the left or right of upright (with the target in the example being a right-rotated ‘T’). Distractors were the letter ‘L’ oriented 90, 180 or 270 degrees clockwise from the normal orientation of the letter.
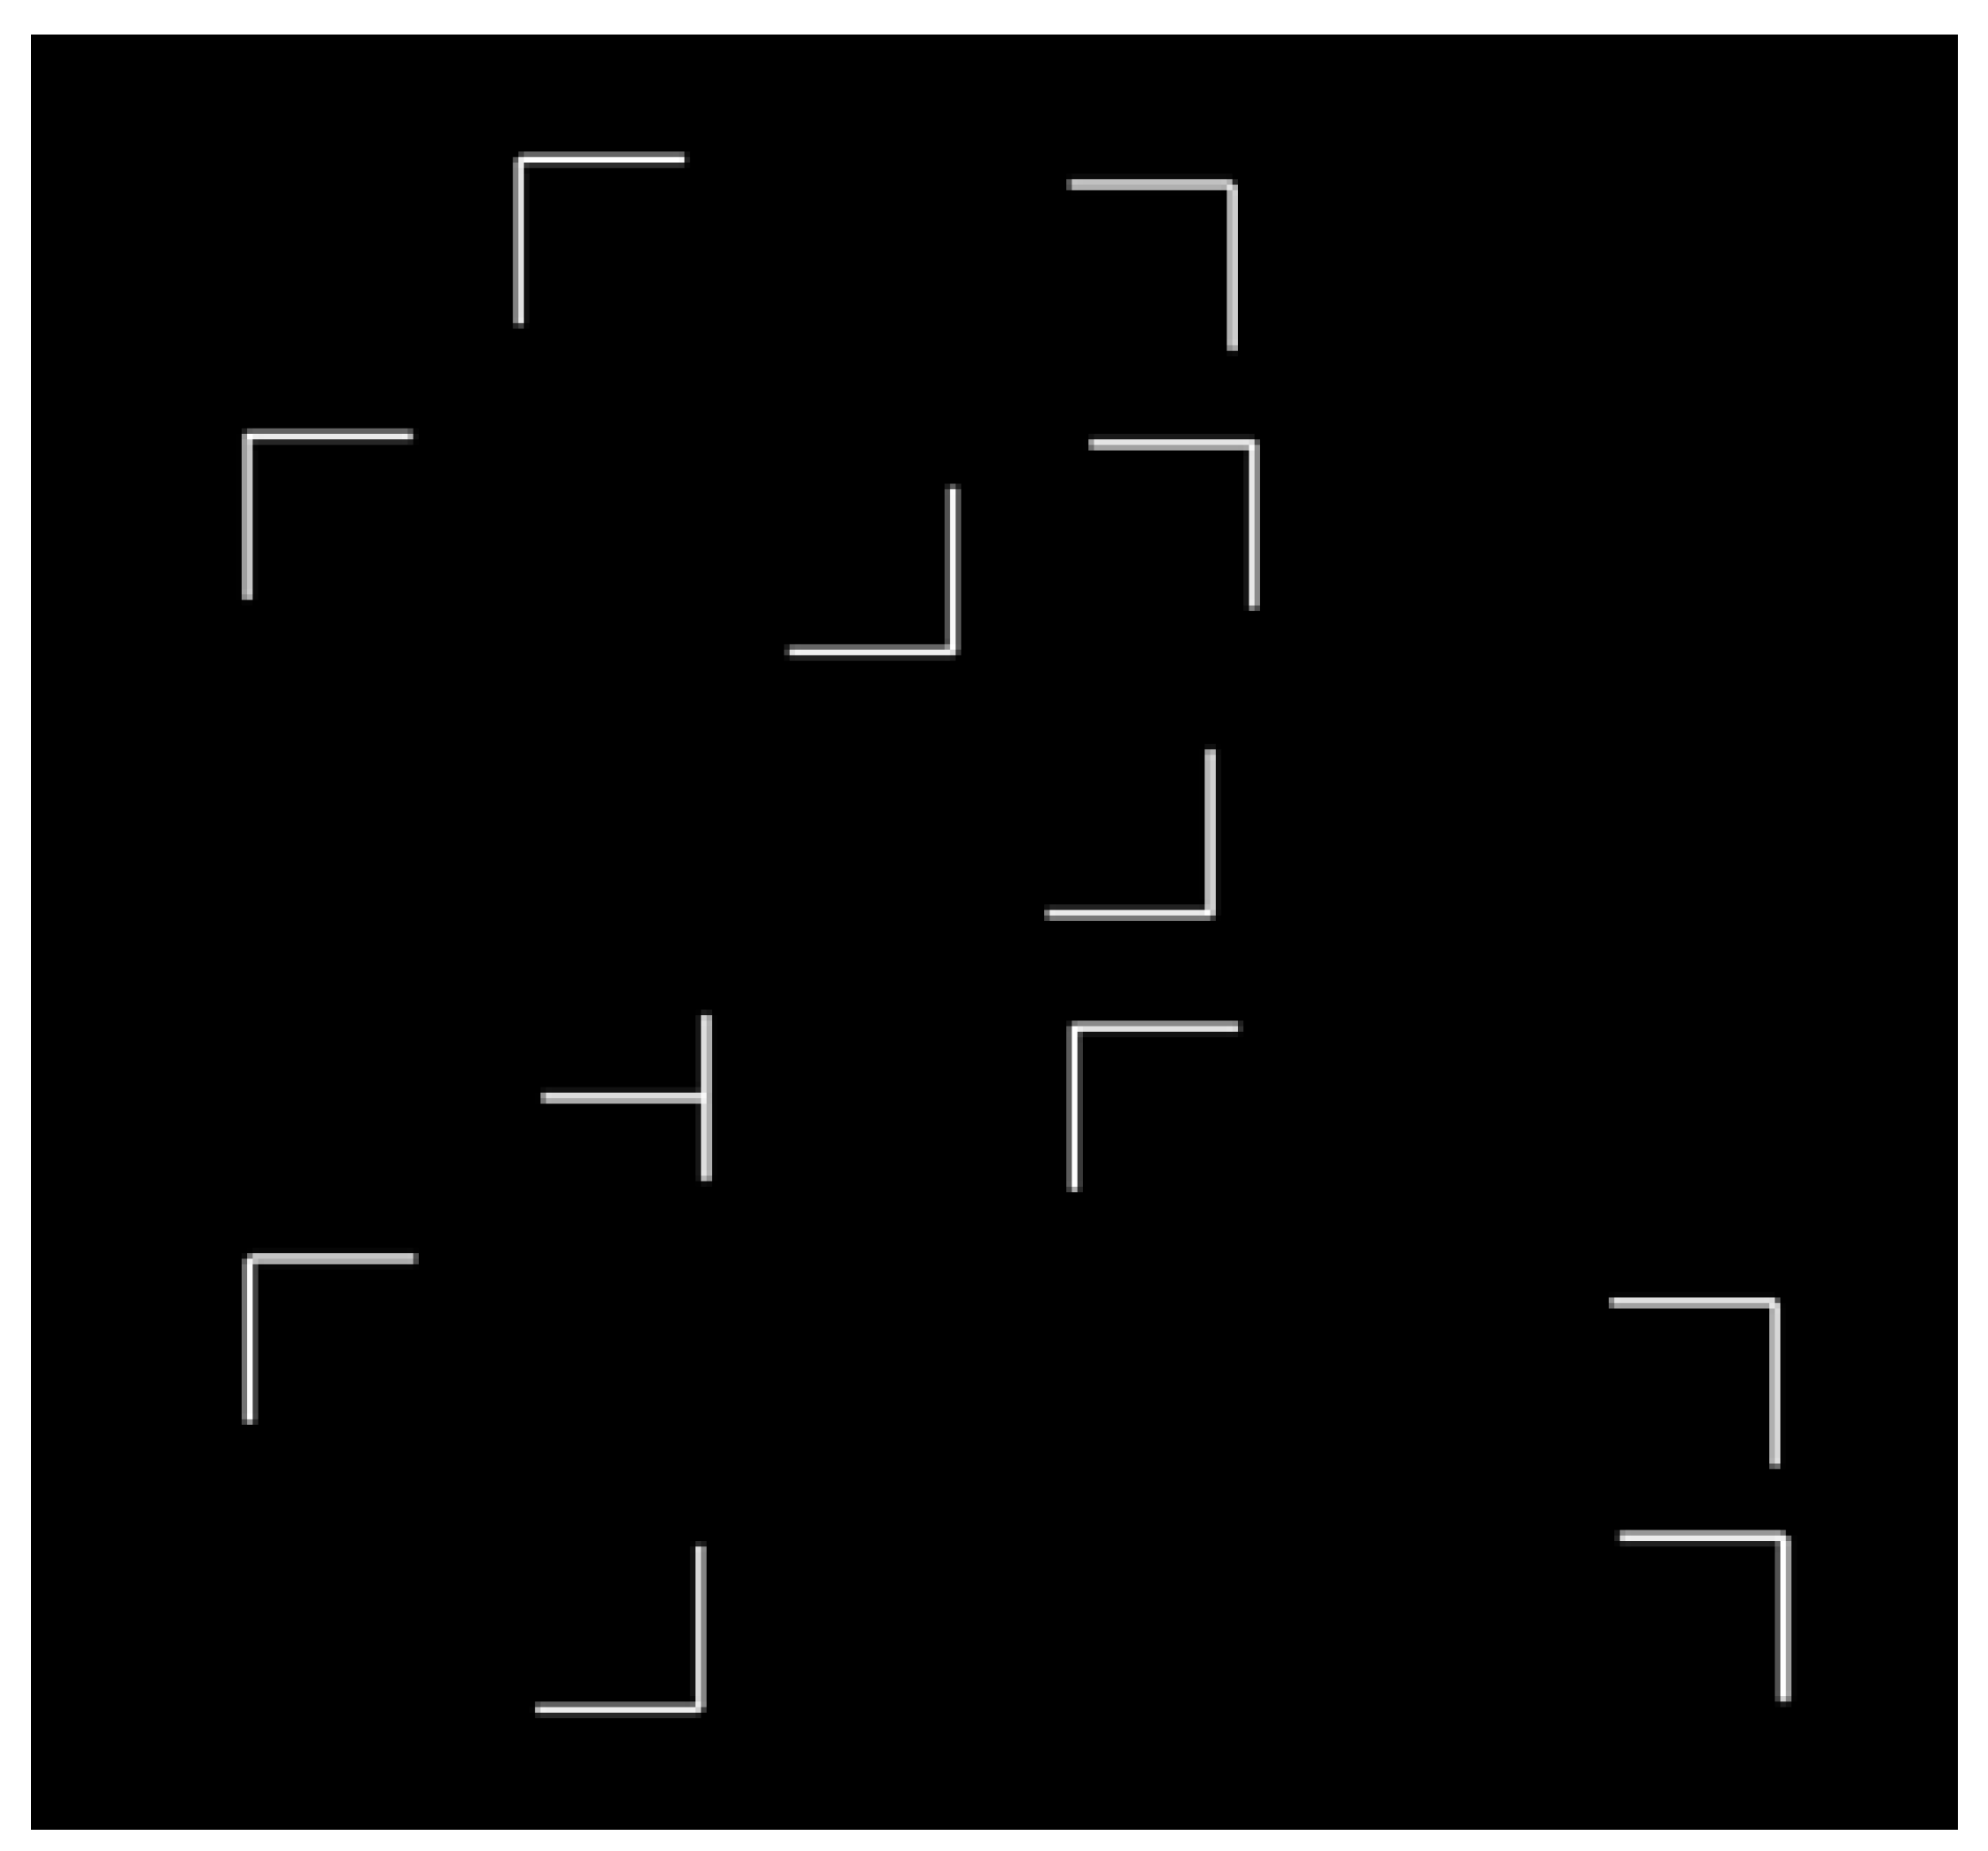
Figure 2.
Performance of the participants on the visual search task illustrates as mean response times for correct trials for each group in seconds. Error bars indicate standard errors of the mean.
Figure 2.
Performance of the participants on the visual search task illustrates as mean response times for correct trials for each group in seconds. Error bars indicate standard errors of the mean.
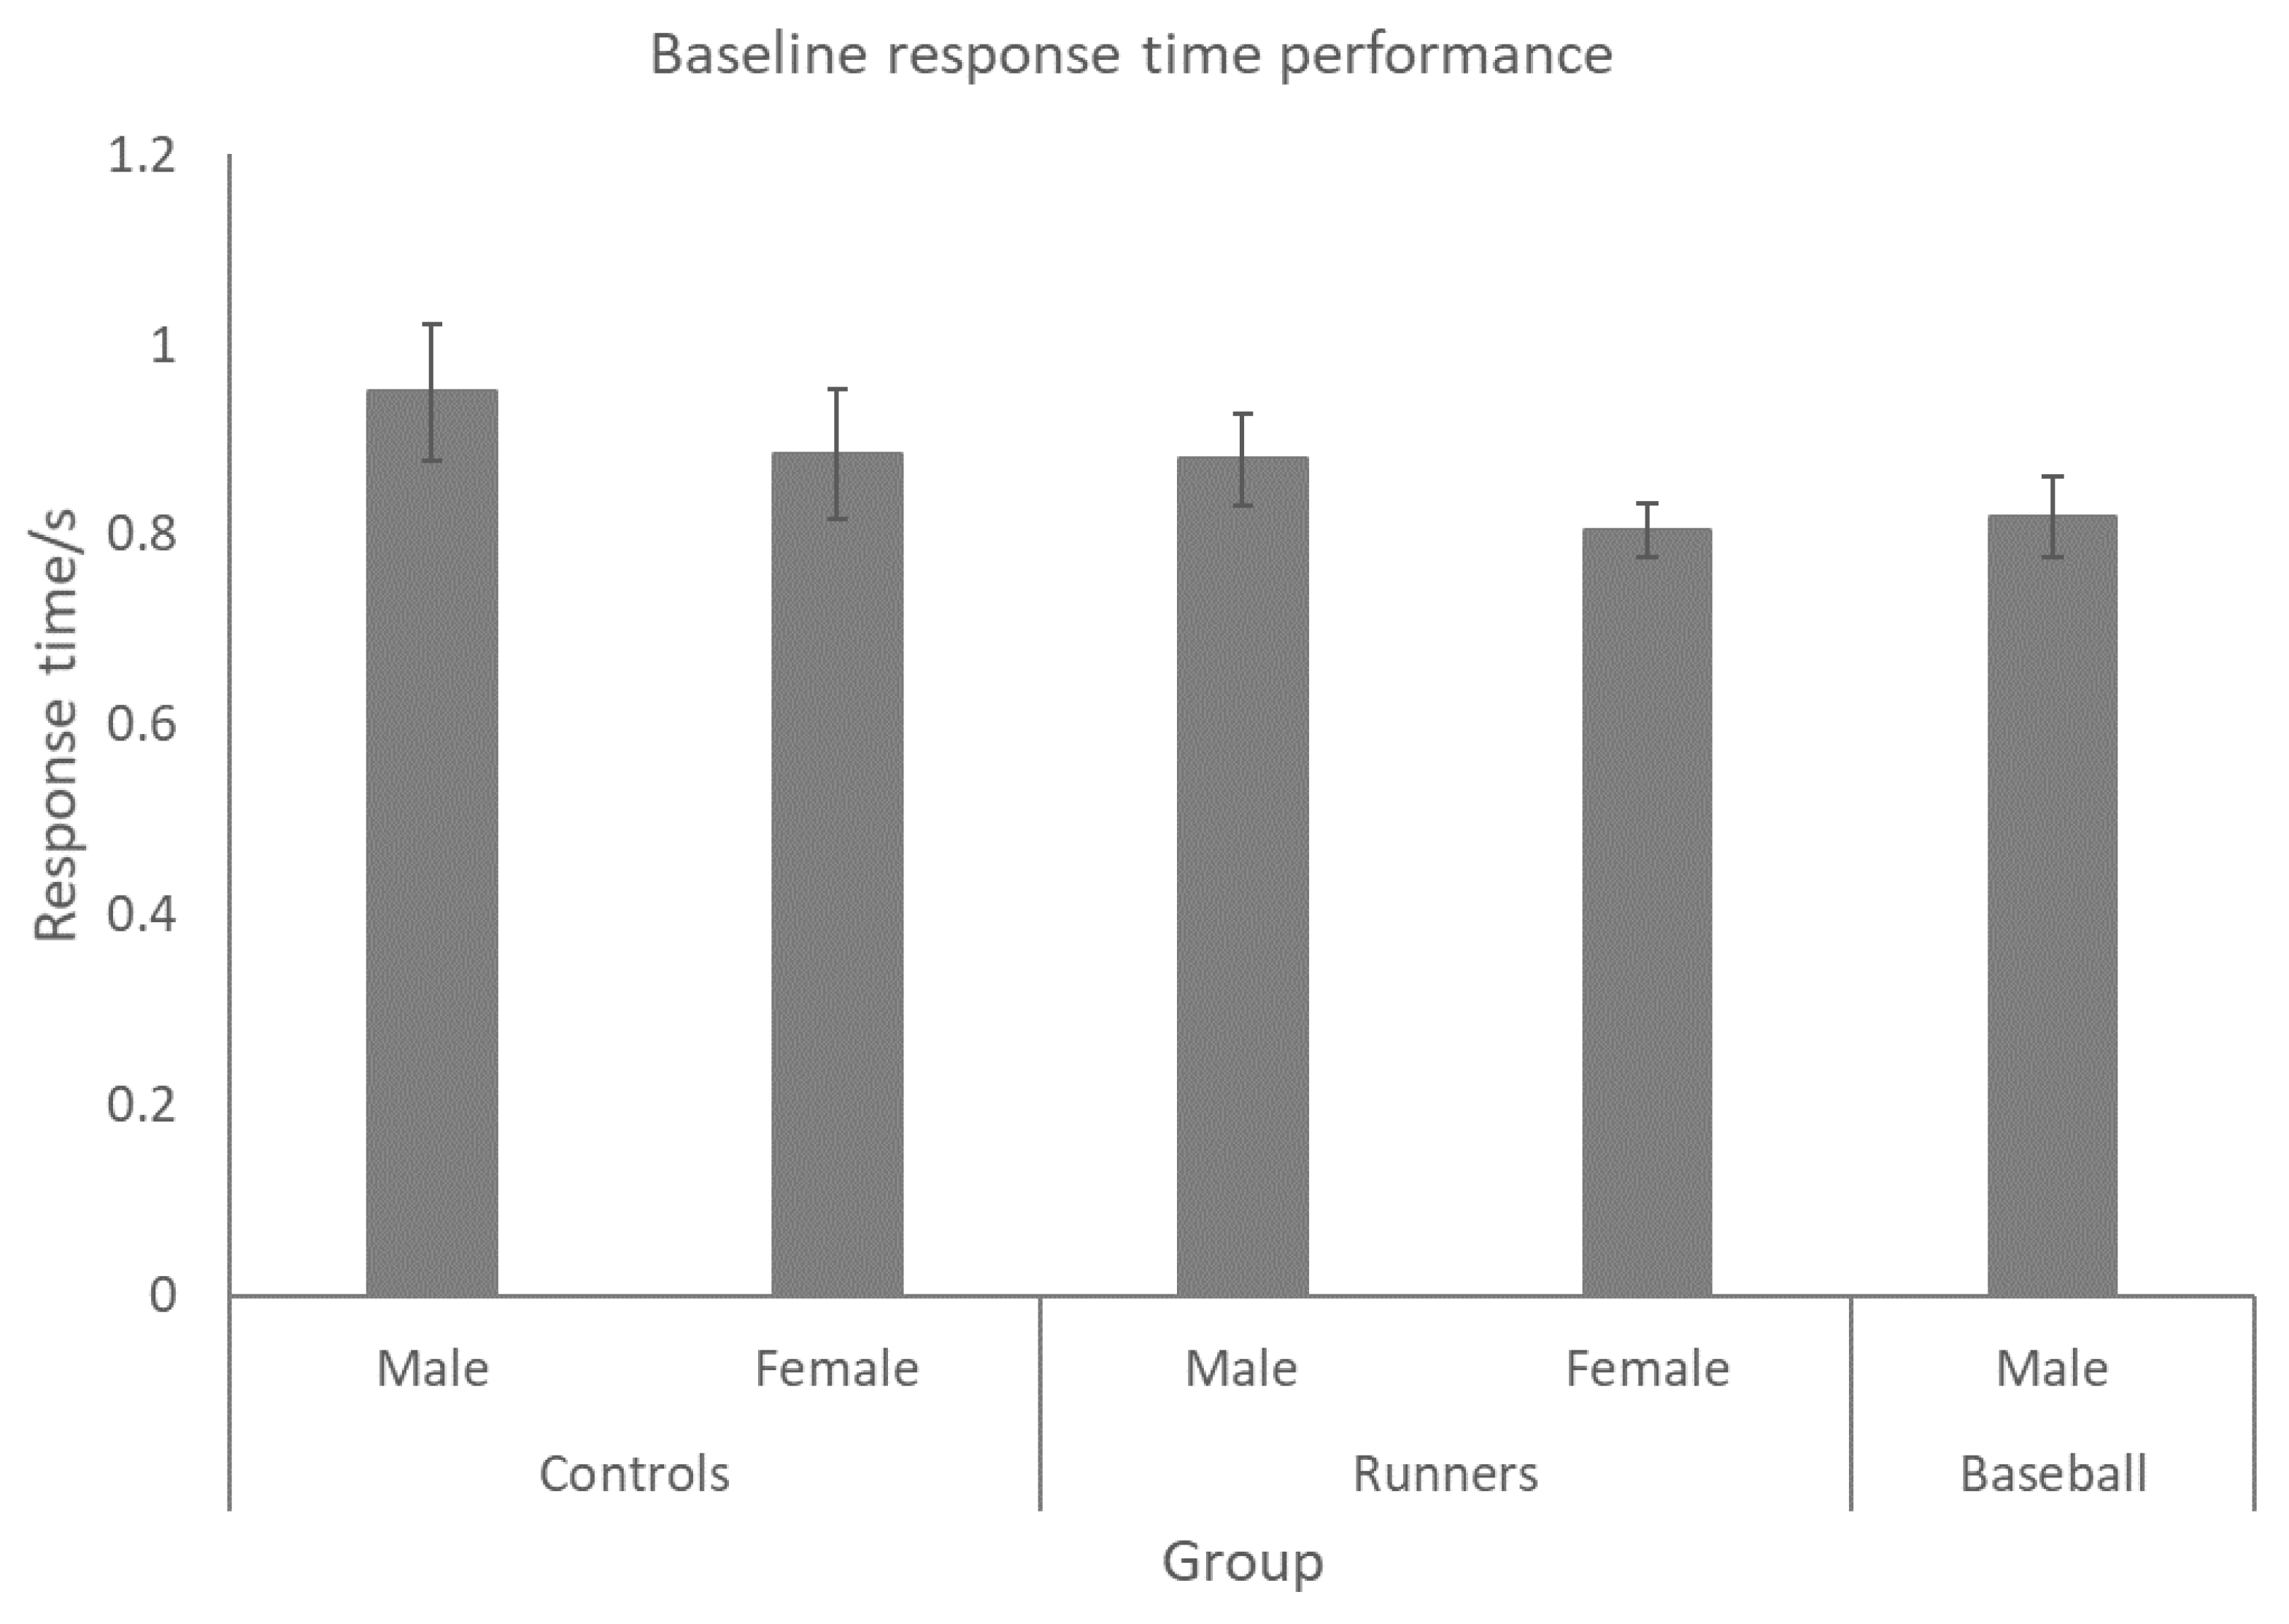
Figure 3.
Amount of learning either specific to the stimulus arrangements (indicated as ‘Specific’ in the diagram) or non-specific learning, indicative of improvement in performance not linked to specific stimulus arrangements.
Figure 3.
Amount of learning either specific to the stimulus arrangements (indicated as ‘Specific’ in the diagram) or non-specific learning, indicative of improvement in performance not linked to specific stimulus arrangements.
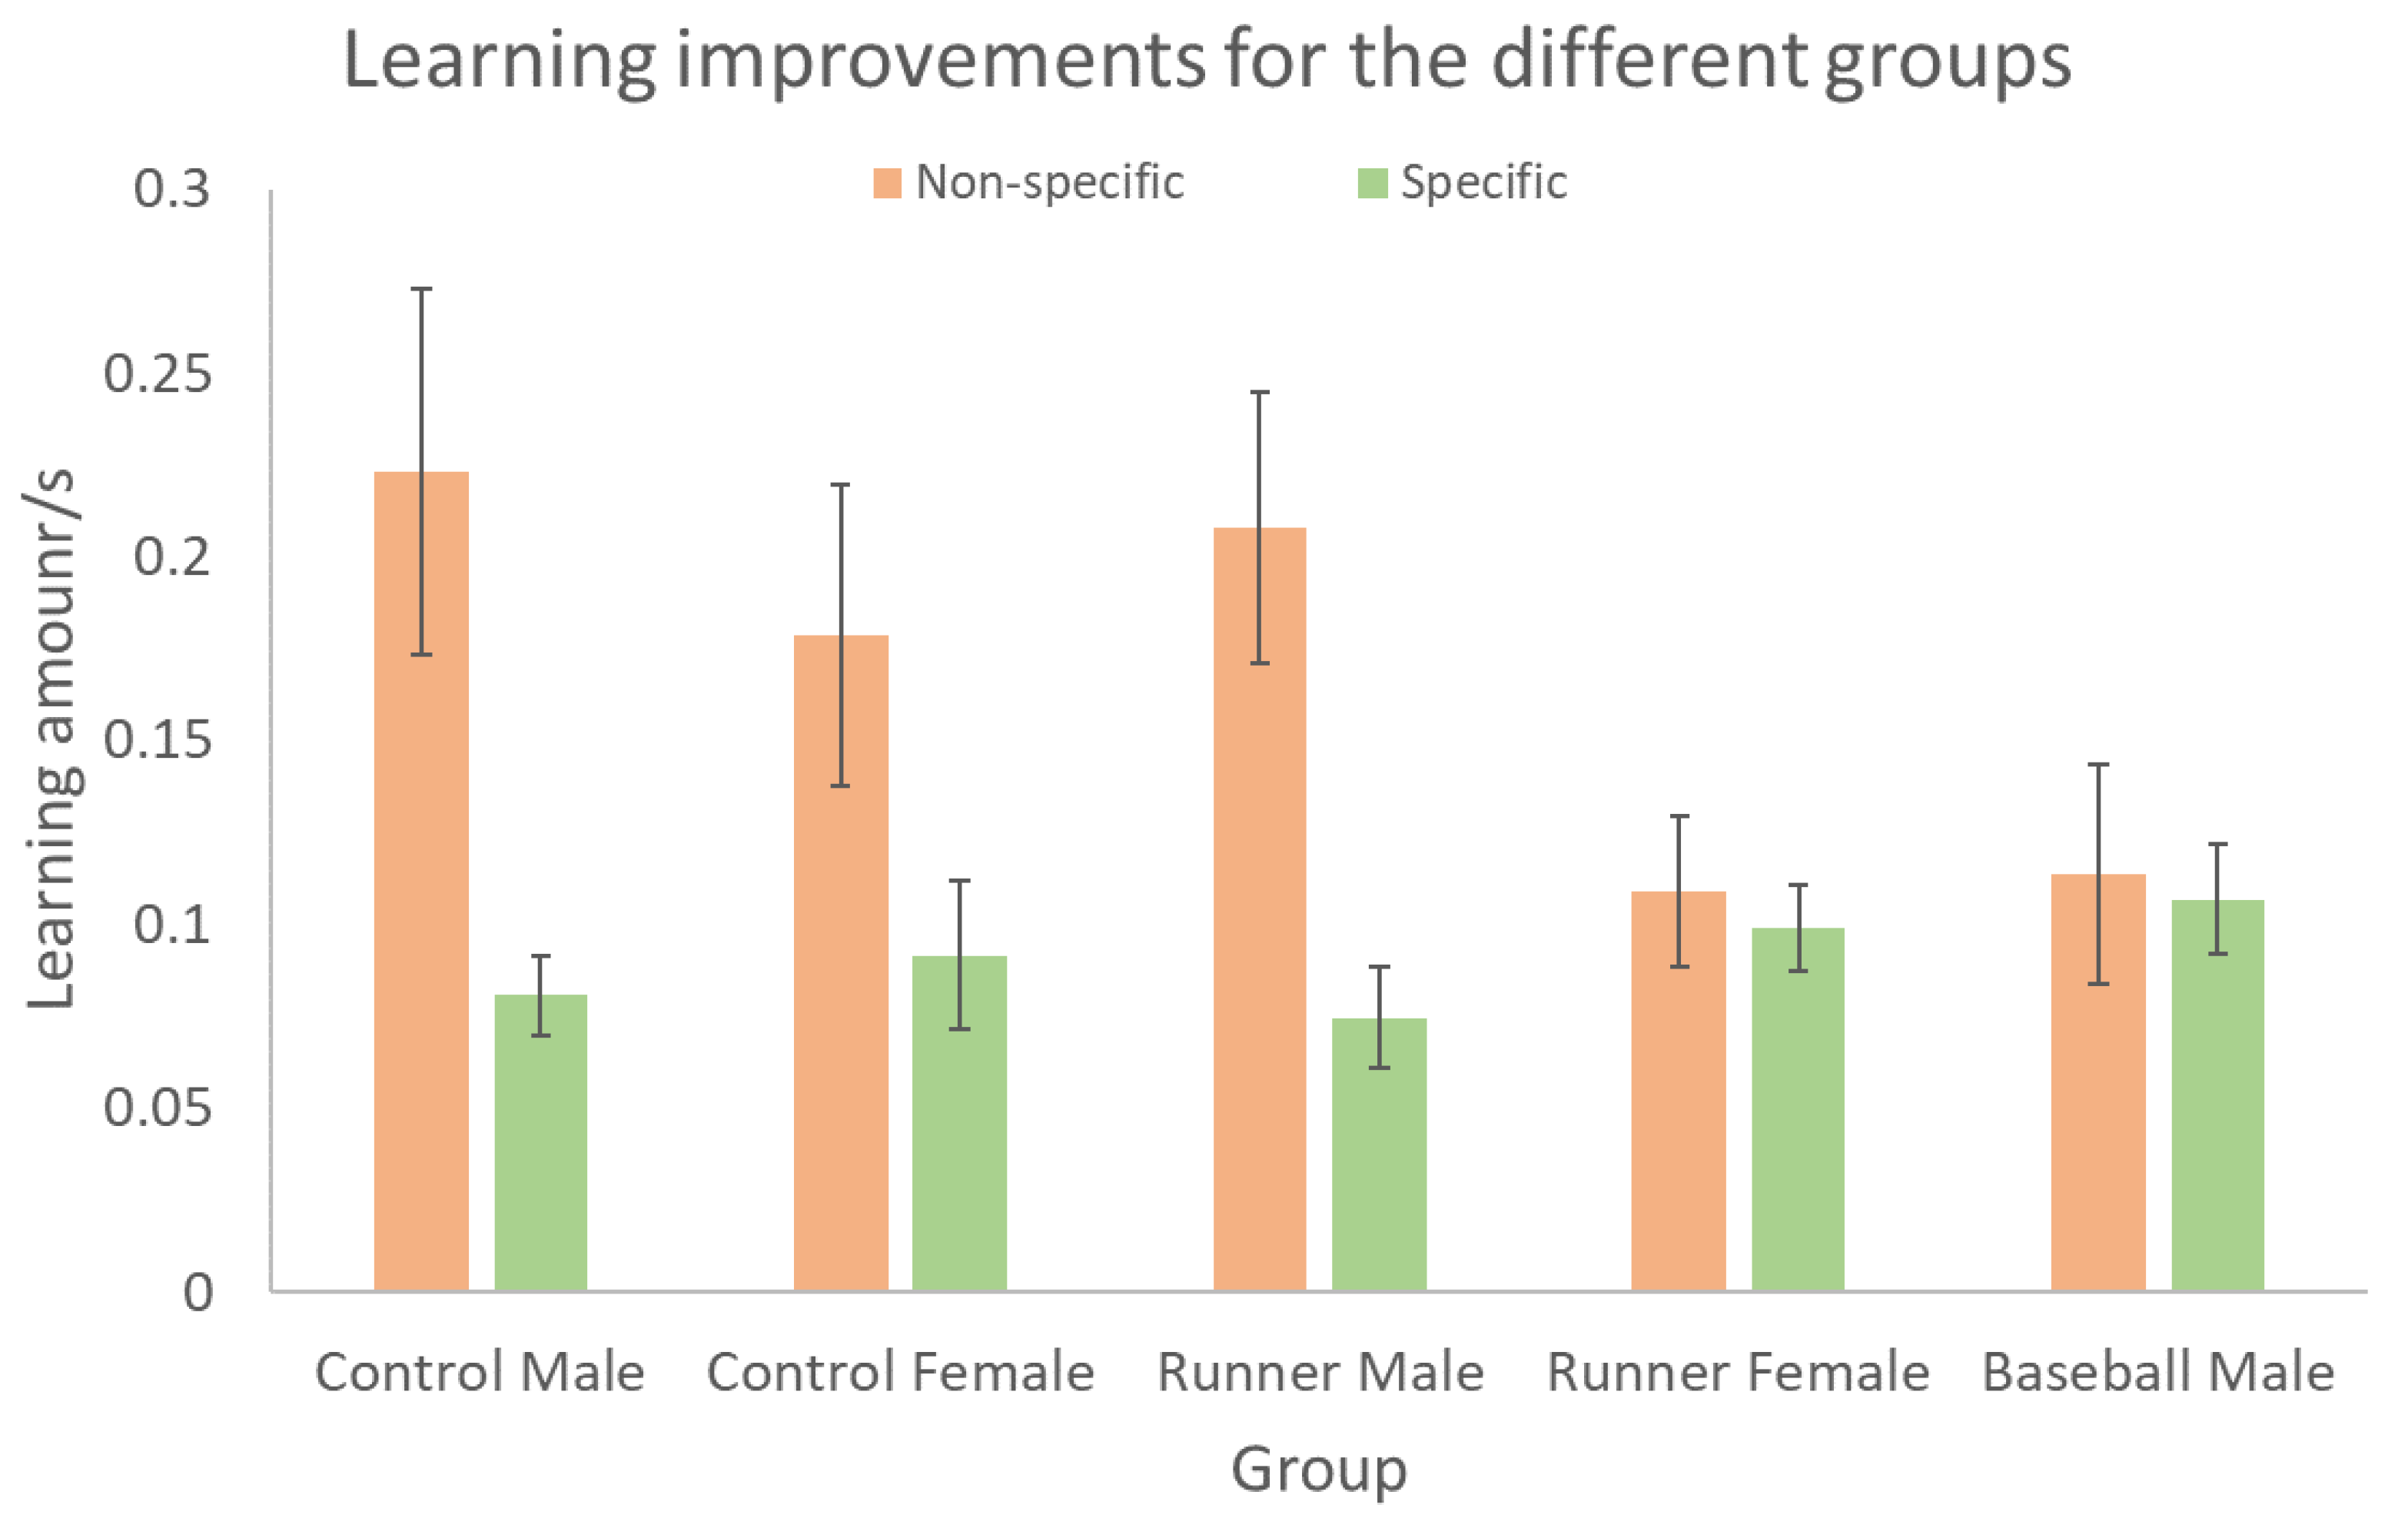
Figure 4.
Differences between non-specific and specific learning for each of the groups. These patterns are a consequence of lower amounts of non-specific learning in the female runners and the baseball players.
Figure 4.
Differences between non-specific and specific learning for each of the groups. These patterns are a consequence of lower amounts of non-specific learning in the female runners and the baseball players.
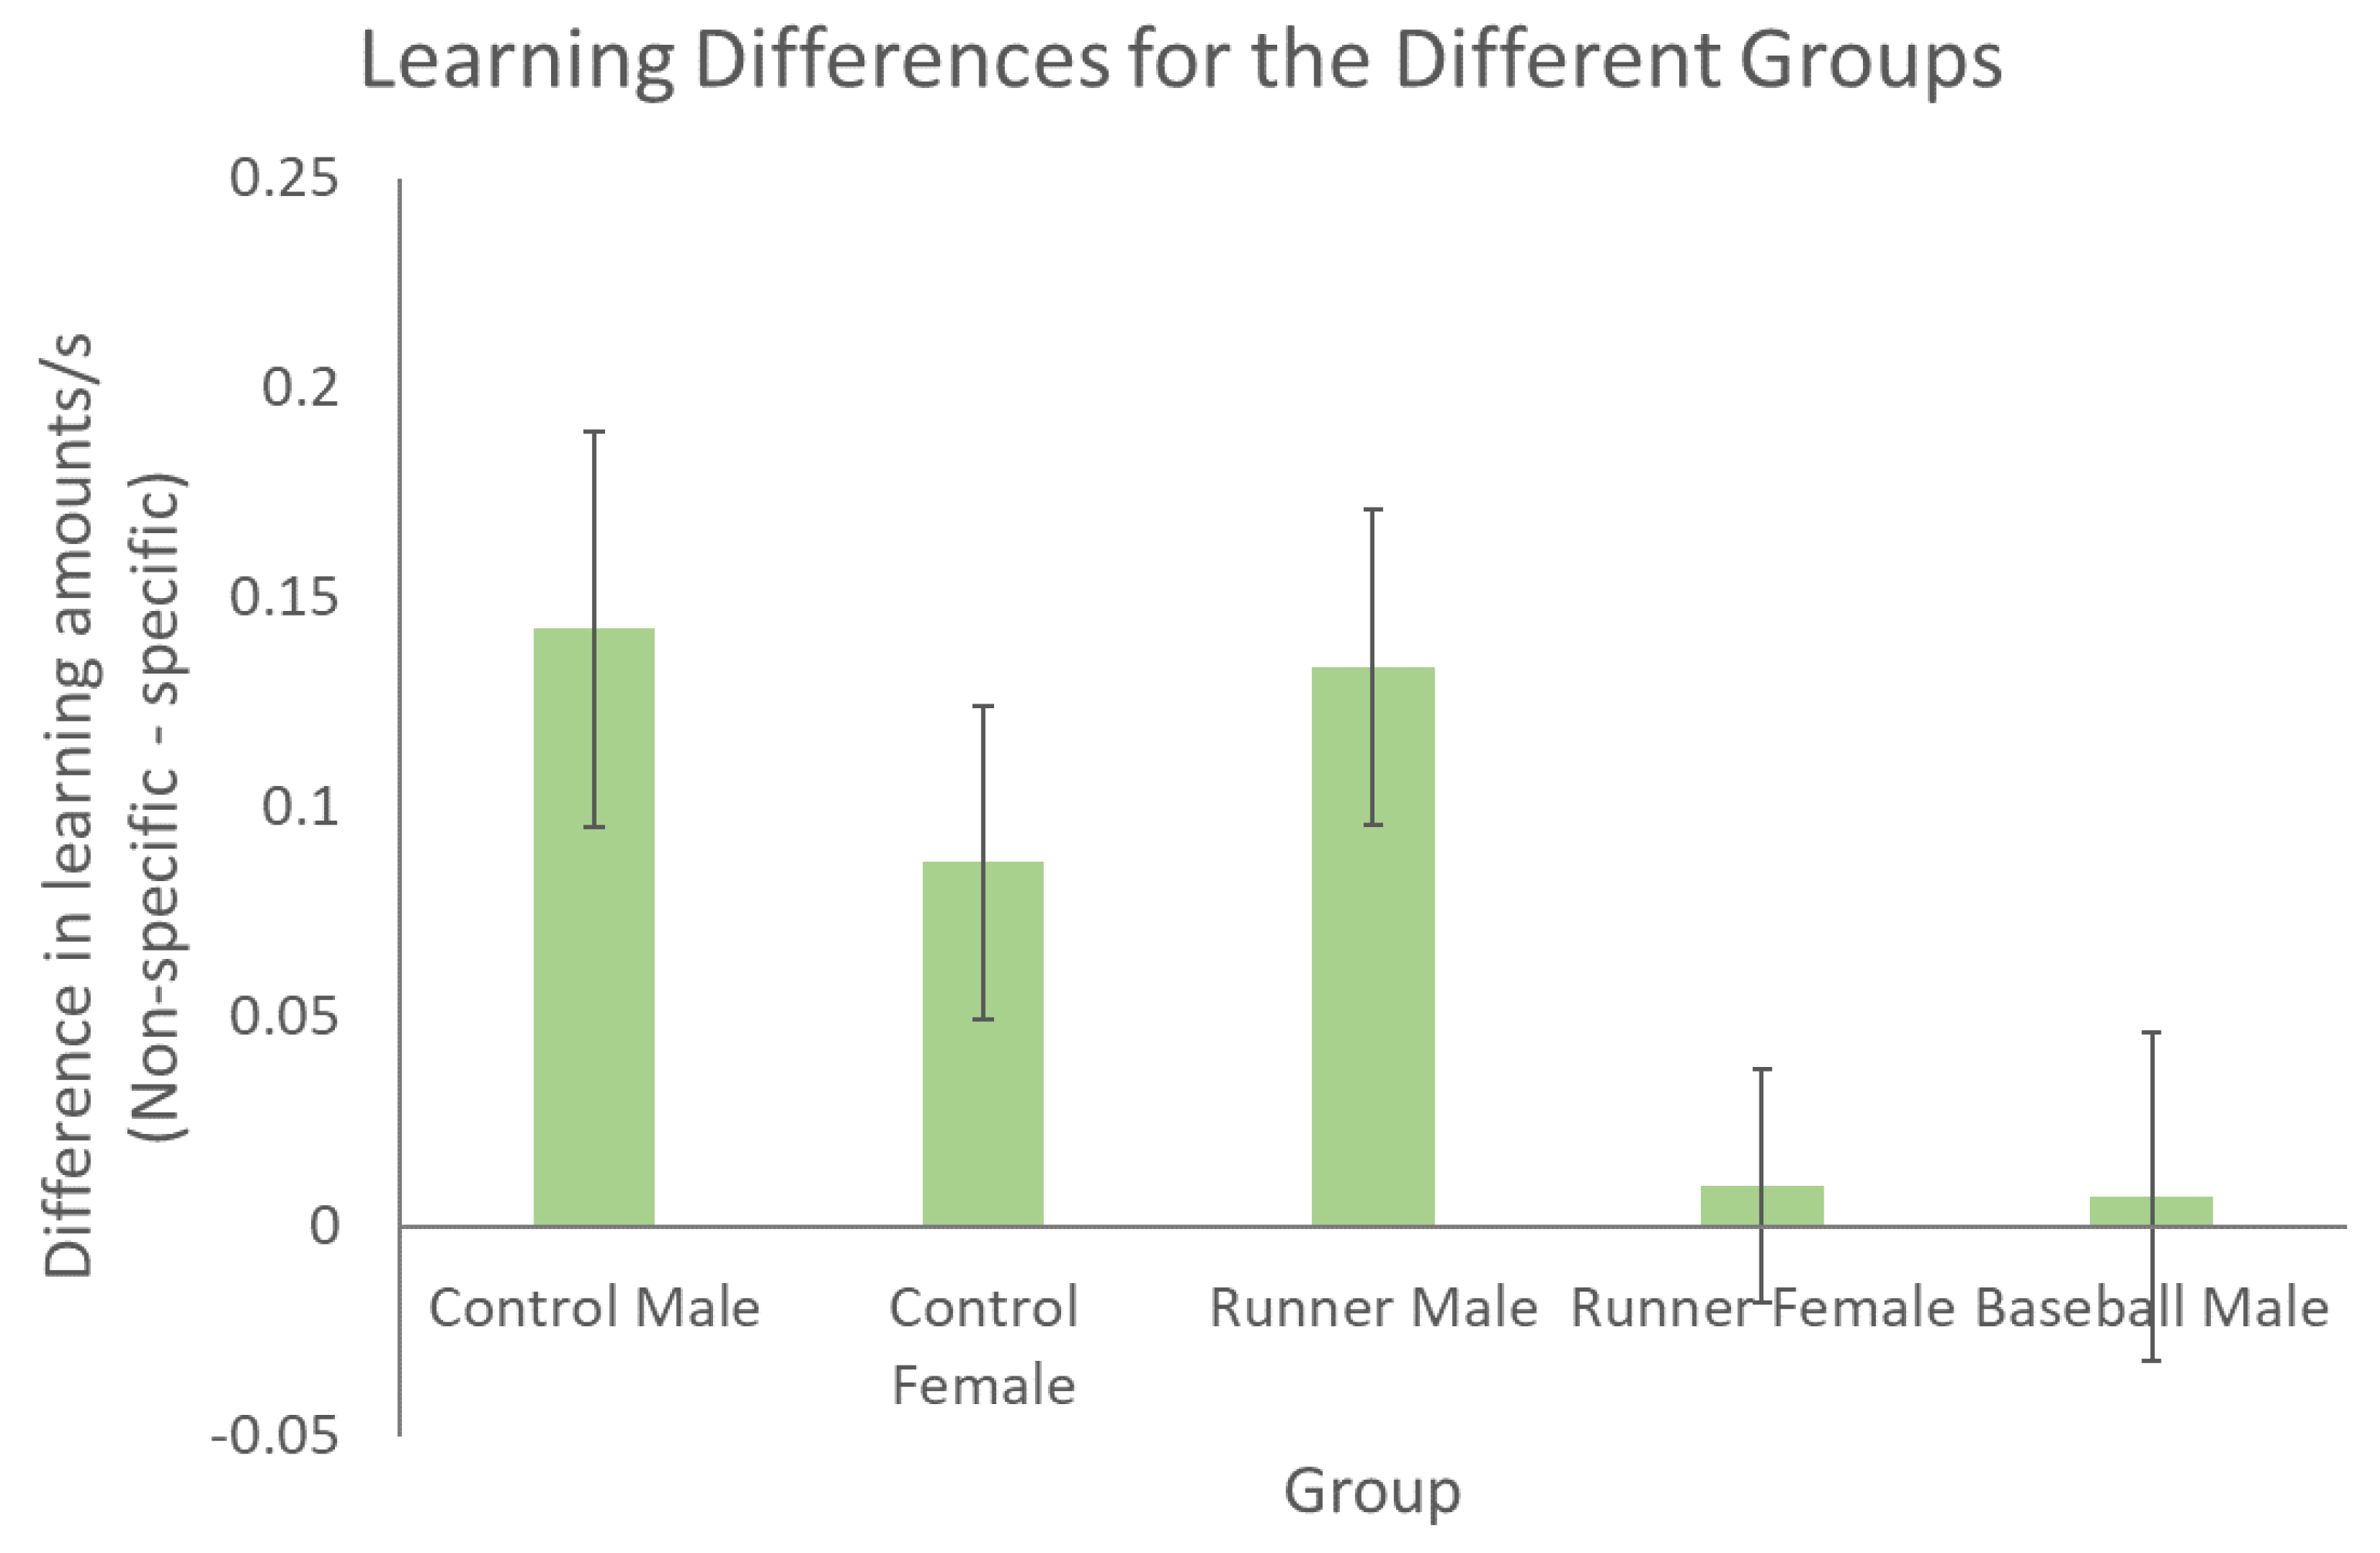

Table 1.
Characteristics of the participants in the experiment.
| Group Gender Number |
Control Male 12 |
Control Female 13 |
Runner Male 13 |
Runner Female 12 |
Baseball Male 13 |
|
|---|---|---|---|---|---|---|
| Age | 20.92 | 21.92 | 21.31 | 21.25 | 20.31 | |
| Weight(kg) | 69.15 | 52.11 | 68.38 | 52.42 | 65.82 | |
| Height(m) | 1.73 | 1.60 | 1.77 | 1.59 | 1.71 | |
| BMI | 23.11 | 20.26 | 21.80 | 20.78 | 22.50 | |
| VO2max (mL·kg-¹·min-¹) | 45.32 | 39.88 | 55.33 | 44.22 | 52.48 | |
| Perceived Functional Ability | PFA | 12.50 | 11.17 | 21.23 | 14.50 | 18.08 |
| Physical Activity Rating | PA-R | 2.42 | 2.67 | 7.00 | 5.83 | 6.38 |
| Revised Competitiveness Index | Enjoyment of Competition Scale | 30.08 | 26.92 | 35.92 | 32.67 | 30.54 |
| (CI-R) | Contentiousness Scale | 12.50 | 12.33 | 12.85 | 13.17 | 12.77 |
| Competitiveness | 42.58 | 39.25 | 48.77 | 45.83 | 43.31 | |
| Stanford Sleepiness Scale | Before Experiment | 2.17 | 2.08 | 1.77 | 1.92 | 2.15 |
| After Experiment | 2.08 | 2.75 | 1.92 | 1.75 | 2.77 | |
| Pittsburgh Sleep Quality Index | Subjective sleep quality | 1.33 | 0.75 | 0.92 | 0.75 | 1.38 |
| Sleep latency | 1.17 | 1.25 | 0.92 | 1.00 | 1.31 | |
| Sleep duration | 0.92 | 0.67 | 0.92 | 0.50 | 0.92 | |
| Sleep efficiency | 0.33 | 0.08 | 0.23 | 0.08 | 0.38 | |
| Sleep disturbance | 1.00 | 1.00 | 0.92 | 1.00 | 1.08 | |
| Use of sleep medication | 0.00 | 0.00 | 0.00 | 0.08 | 0.00 | |
| Daytime dysfunction | 1.00 | 1.33 | 0.77 | 0.92 | 1.15 | |
| Global PSQI Score | 5.75 | 5.08 | 4.69 | 4.33 | 6.23 | |
| IPAQ: Walking | Walking MET-min/week | 936.42 | 882.75 | 849.15 | 1077.75 | 845.38 |
| IPAQ: Moderate | Moderate MET-min/week | 653.33 | 516.67 | 1113.85 | 670.00 | 1347.69 |
| IPAQ: Vigorous | Vigorous MET-min/week | 386.67 | 486.67 | 2067.69 | 1806.67 | 2030.77 |
| Total | MET-min/week | 1976.42 | 1886.08 | 4030.69 | 3554.42 | 4223.85 |
Disclaimer/Publisher’s Note: The statements, opinions and data contained in all publications are solely those of the individual author(s) and contributor(s) and not of MDPI and/or the editor(s). MDPI and/or the editor(s) disclaim responsibility for any injury to people or property resulting from any ideas, methods, instructions or products referred to in the content. |
© 2025 by the authors. Licensee MDPI, Basel, Switzerland. This article is an open access article distributed under the terms and conditions of the Creative Commons Attribution (CC BY) license (https://creativecommons.org/licenses/by/4.0/).
Copyright: This open access article is published under a Creative Commons CC BY 4.0 license, which permit the free download, distribution, and reuse, provided that the author and preprint are cited in any reuse.


