
Submitted:
19 October 2025
Posted:
20 October 2025
You are already at the latest version
Abstract
Background: Multiple Sclerosis (MS) is a chronic neurological disease that commonly affects women during their reproductive years, influencing fertility and family planning decisions. This study explores the psychological, social, and medical factors associated with reproductive choices in women with MS. Objectives: To identify factors influencing reproductive choices in women with MS and assess the role of psychological, social, and disease-related variables in fertility decision. Methods: A cross-sectional study was conducted among 103 women diagnosed with MS, recruited from specialized clinics and support groups. Participants completed validated questionnaires assessing social support, psychological well-being, relationship dynamics, reproductive motivation, and quality of life. Binary logistic regression was performed to identify independent predictors of childbearing. Results: Women with relapsing-remitting MS (73.9%) were significantly more likely to have children than those with progressive forms (p = 0.001), while those using fingolimod (100%) remained childless (p = 0.008). Higher mental health scores (p = 0.035) and fatalistic motivation (p = 0.005) were associated with childbearing, while increased health-related concerns (p = 0.006) were more prevalent among mothers. Marital status (p = 0.001) was a significant factor, with all unmarried women being childless. However, logistic regression analysis did not identify any single independent predictor of childbearing (p > 0.05), suggesting that reproductive decisions are influenced by multiple interrelated factors rather than a single dominant variable. Conclusions: This study highlights the complex interplay of disease progression, psychological resilience, and treatment choices in reproductive decisions among women with MS. Findings emphasize the need for individualized reproductive counseling, considering both medical and psychosocial factors. Future research should incorporate longitudinal studies to better understand the evolving reproductive trajectories of women with MS.
Keywords:
multiple sclerosis
; fertility
; parenthood motivation
; psychological factors
; reproductive decision-making
1. Introduction
Multiple sclerosis (MS) is a chronic neurological disease that affects both physical and cognitive functions, potentially influencing fertility and pregnancy outcomes [1,2]. MS is more prevalent among women than men, particularly during reproductive years, with its onset typically occurring between the ages of 20 and 40 [3]. Approximately 2.8 million people worldwide have been diagnosed with MS, with 1 million cases in Europe alone [4]. In Greece, approximately 13,000 individuals are affected by the disease, with the initial symptoms appearing between the third and fifth decades of life [5].
The disease's impact, combined with side effects from medical treatments, can significantly alter reproductive health and decision-making in affected individuals [6,7]. Recent advancements in medical treatments have enabled many women with chronic illnesses and disabilities to conceive and experience motherhood [8]. Although research indicates that pregnancy is generally safe for women with MS and does not negatively affect neonatal outcomes, studies suggest a higher prevalence of voluntary childlessness and pregnancy terminations among MS patients [9,10]. Given that MS is often diagnosed during reproductive years and predominantly affects women, decision-making regarding family planning becomes a critical concern for this population.
Women with MS face numerous concerns that influence their decision to pursue pregnancy [11]. Historically, particularly in the early 20th century, women with MS were often discouraged from childbearing due to concerns that pregnancy might exacerbate the disease [12]. However, contemporary research highlights shifting perceptions and experiences. A study in New Zealand reported that women with MS expressed significant concerns about pregnancy [13], while research in Australia emphasized the need for fertility and parenting considerations to be integrated into MS care [14]. Data from the US indicates that women with MS and their partners often viewed childbearing as an irresponsible decision due to uncertainties surrounding disease progression [15].
This study aims to explore the factors influencing fertility and family planning decisions in individuals with MS, assess psychological resilience, and propose strategies for personalized perinatal obstetric care. Addressing these concerns through targeted interventions may empower MS patients to make informed reproductive choices without unnecessary constraints imposed by their condition.
2. Materials and Methods
This cross-sectional observational study aimed to explore factors influencing fertility and family planning decisions among women diagnosed with MS, conducted from June 1 to December 31, 2024.
Participants were women aged 18–50 with a diagnosis of MS within the past three years, in an early disease stage, cognitively intact, not on antidepressants, and in a stable relationship. Eligible participants were either childless or had one child under age three. Exclusion criteria included progressive MS, major psychiatric disorders affecting cognition, or use of medications known to impair fertility. Recruitment occurred through the Medically Assisted Reproduction Unit (MARU), the Gynecological and Neurology Clinics of the Naval Hospital of Athens (NHA), and the Greek Multiple Sclerosis Society (GMSS).
Data were collected using a structured self-administered questionnaire (Supplementary File 1), comprising:
a) Demographics & Reproductive History – Age, education, employment, marital status, children, pregnancies, fertility treatments; b) Chronic Disease History – MS duration, type, comorbidities, and medication use; c) Oslo Social Support Scale (OSSS-3) – Assesses social support across three dimensions (validated in Greek) [16,17].
d) Dyadic Adjustment Scale – Evaluates relationship quality (Greek version validated) [18,19,20]; e) CES-D – Measures depressive symptoms over the past week (Greek version validated) [21,22]; f) Big Five Personality Inventory (BFI) – Assesses five personality traits (Greek version validated) [23,24]; g) MSQOL-54 – Evaluates quality of life in MS patients across 12 dimensions plus 2 standalone items (Greek version used) [25,26]; h) Motivation for Parenthood Questionnaire (PM2) – Captures four motivational subtypes: altruistic, fatalistic, narcissistic, and instrumental (Greek validation completed with forward-backward translation, pilot testing, EFA/CFA, and high reliability: ICC = 0.80, CFI = 0.93, TLI = 0.91, RMSEA = 0.05, χ²/df = 2.19) [27]; i) Positivity Scale – An 8-item measure of positive outlook (Greek adaptation and validation included forward-backward translation, pilot testing, and psychometric analysis: Cronbach’s α = 0.86, ICC = 0.82, CFI = 0.94, TLI = 0.92, RMSEA = 0.048) [28].
A formal application seeking approval for the research plan and methodology was submitted to the scientific council of the University of West Attica Ethics Committee, ensuring compliance with the General Data Protection Regulation (GDPR) guidelines [95813/18-10-2023]. Participants received questionnaires along with an informative brochure highlighting the voluntary nature of their participation in the study. Their personal information and responses were handled with the utmost confidentiality and anonymity, and all collected data were deleted after the survey. Participants were also informed of their right to withdraw from the research at any time and were provided with comprehensive information about the study's objectives and aims.
Acknowledging the time-intensive nature of completing the questionnaires, participants were given the option to fill them out either immediately or outside the hospital setting. Completed questionnaires were returned to the researchers during subsequent in-person appointments. The first author provided instructions on completing the questionnaires, emphasizing the importance of spontaneous and honest responses to ensure accurate data collection.
Analyses were performed in SPSS v26. Normality was assessed via the Kolmogorov-Smirnov test. Means and SDs described continuous variables; frequencies described categorical data. Independent t-tests, ANOVA, chi-square, and Fisher’s exact test were used for group comparisons. Pearson’s r examined correlations. Internal consistency of scales was evaluated using Cronbach’s α. EFA and CFA were conducted to assess the structure of questionnaires. Test-retest reliability was examined via ICC. Binary logistic regression explored predictors of fertility-related decisions, with significance set at p < 0.05.
3. Results
The sample included 103 women with a mean age of 38.05 years (SD = 7.01). Table 1 presents detailed demographic data, Table 2 summarizes obstetric-gynecological data, and Table 3 summarizes the history of chronic disease.
3.1. OSLO Social Support Scale (OSSS-3)
The OSSS-3 scores ranged from 4 to 10 (mean = 5.89, SD = 1.32), with a Cronbach’s alpha of 0.73, indicating acceptable reliability. Supplementary Table 2 presents detailed OSSS-3 responses.
3.2. Dyadic Adjustment Scale (DAS)
Total DAS scores ranged from 54 to 96 (mean = 68.12, SD = 5.51; α = 0.70). Subscale scores and reliabilities were as follows (Supplementary Table 3): Dyadic Consensus: 8–46 (mean = 20.89, SD = 5.12; α = 0.80); Dyadic Satisfaction: 23–37 (mean = 28.40, SD = 2.11; α = 0.76); Dyadic Cohesion: 7–20 (mean = 15.26, SD = 2.19; α = 0.74) and Affectional Expression: 0–8 (mean = 3.56, SD = 1.33; α = 0.70).
Supplementary Table 4 presents full DAS responses.
3.3. Center for Epidemiological Studies – Depression Scale (CES-D)
CES-D scores ranged from 12 to 32, with a mean of 20.27 and a standard deviation of 3.95. The internal consistency of the scale was acceptable, with a Cronbach’s alpha of 0.73 (Supplementary Table 5).
Responses to the CES-D are presented in Supplementary Table 6.
3.4. Big Five Inventory (BFI)
The overall BFI scale demonstrated satisfactory reliability with a Cronbach’s alpha of 0.74. The subscales also showed good internal consistency: Extraversion (α = 0.76), Agreeableness (α = 0.77), Conscientiousness (α = 0.78), Neuroticism (α = 0.79), and Openness (α = 0.71). Detailed reliability metrics are shown in Supplementary Table 7.
Supplementary Table 8 presents detailed BFI responses.
3.5. Multiple Sclerosis Quality of Life (MSQOL-54)
The MSQOL-54 includes 12 dimensions and 2 standalone items, yielding summary scores for physical and mental health. Descriptive statistics for each subscale showed acceptable to excellent internal consistency, with Cronbach’s alpha values ranging from 0.70 to 0.91. Physical Function (α = 0.87) had a mean score of 43.12 (SD = 16.31), while the lowest mean was seen in Role Limitations Due to Physical Problems (mean = 13.24, SD = 22.45; α = 0.70). Cognitive Function scored relatively high (mean = 75.20, SD = 17.38; α = 0.73), as did Social Function (mean = 61.89, SD = 14.70; α = 0.70). Emotional Well-being, Pain, Energy, and Sexual Function domains showed moderate mean scores and satisfactory internal consistency. Individual item analysis revealed a mean of 40.93 (SD = 15.25) for Change in Health and 49.30 (SD = 22.29) for Satisfaction with Sexual Function. The Physical Health Composite Score ranged from 11.96 to 66.01 (mean = 39.83, SD = 9.99), and the Mental Health Composite Score ranged from 13.30 to 88.86 (mean = 52.83, SD = 14.23). Supplementary Table 9 provides participants’ responses to MSQOL-54.
3.6. Motivation for Parenthood Questionnaire (PM2)
Scores on the PM2 subscales were as follows: Altruistic Motivation ranged from 29 to 47 (mean = 37.89, SD = 4.31), Fatalistic Motivation from 40 to 53 (mean = 46.19, SD = 3.67), Narcissistic Motivation from 36 to 51 (mean = 44.81, SD = 3.25), and Instrumental Motivation from 46 to 57 (mean = 51.73, SD = 3.12), the latter showing the highest average.
Supplementary Table 10 presents the full breakdown of first-choice responses for each question.
3.7. Positivity Scale
Scores on the Positivity Scale ranged from 15.00 to 36.00, with a mean of 22.82 and a standard deviation of 3.71. The scale demonstrated satisfactory internal consistency (Cronbach’s α; see Supplementary Table 11). Supplementary Table 12 summarizes participants’ responses to the Positivity Scale.
3.8. Investigation of Factors Related to Having Children or Attempting to Have Children
3.8.1. Factors Associated with Having Childrena
Age was significantly higher among women with children (mean = 39.75, SD = 5.72) compared to those without (mean = 35.56, SD = 8.67; p = 0.017). Mental Functioning (MSQOL-54) was significantly better in women with children (mean = 56.74, SD = 12.35) than those without (mean = 50.87, SD = 14.01; p = 0.035). Health Worries were also higher among mothers (mean = 57.14, SD = 16.93) compared to non-mothers (mean = 44.06, SD = 23.08; p = 0.006). Fatalistic Motivation was more pronounced in women with children (mean = 47.86, SD = 2.92) than in those without (mean = 44.08, SD = 3.50; p = 0.005). Marital Status showed a strong association (p = 0.001); 84% of married women had children, while all unmarried women were childless. MS Progression Type was also significant (p = 0.001); all women with chronic/progressive MS were childless, whereas 73.9% with relapsing/remitting MS had children. Beta Interferon use was associated with childbearing (p = 0.003); 78.1% of women receiving this treatment had children. Fingolimod use was negatively associated (p = 0.008); all women on fingolimod (n = 4) were childless.
3.8.2. Factors Associated with Number of Children
Age increased with parity: mean age was 35.56 (no children), 37.72 (one child), and 43.48 (two children); p = 0.001. Mental Functioning improved with number of children: 50.87 (none), 54.66 (one), and 60.48 (two); p = 0.021. Health Perceptions were more positive in women with two children (mean = 38.00, SD = 18.92) than in those with none or one (means = 26.71 and 28.66 respectively; p = 0.003). Health Worries increased with child number (means = 44.06, 55.11, and 60.80 for none, one, and two children respectively; p = 0.004). Fatalistic Motivation peaked in women with one child (mean = 48.77, SD = 2.48), compared to those with none (44.08) or two children (46.50); p = 0.009.
Marital Status again showed significance (p = 0.001), with most married women having one or two children, while all unmarried women were childless. Years Since Diagnosis influenced childbearing: a longer disease duration was associated with higher rates of childlessness (p = 0.044). MS Progression Type mattered (p = 0.005); no woman with chronic/progressive MS had children, while those with relapsing/remitting MS had higher parity. Beta Interferon use was positively associated with higher parity (p = 0.006), and fingolimod use was again negatively associated, with all users being childless (p = 0.011).
Table 6 provides a summary of the association between the number of children and various parameters.
3.8.3. Investigation of Factors Related to the Attempt to Have a Child Among Childless
Women who have attempted to have children score significantly lower on the Affectional Expression Scale compared to those who have not attempted (p = 0.030). Marital status is significantly associated with the attempt to have children, with married women being more likely to have attempted compared to unmarried women (p = 0.048).
Table 7 provides a summary of the association between the attempt to have a child among childless participants and various parameters.
Next, an analysis was conducted to determine whether any of these factors were independently associated with the attempt to have children (Table 8).
The Affectional Expression Scale has a statistically significant, negative, and independent association with the attempt to have children among childless participants (p = 0.047, OR = 0.427).
3.9. Investigation of Factors Related to Motivations for Having Children
Altruistic motivation for parenthood was significantly associated with educational attainment (p = 0.044). Figure 1 illustrates these differences, highlighting the particularly high scores among doctoral degree holders.
The time since MS diagnosis was also significantly associated with altruistic motivation (p = 0.040).
3.10. Correlations Among Motivation for Parenthood Scale (PM2) Factors
Altruistic motivation is strongly and negatively correlated with fatalistic motivation (r = -0.697, p < 0.001) and moderately negatively correlated with instrumental/utilitarian motivation (r = -0.420, p = 0.033). Narcissistic motivation is moderately and negatively correlated with instrumental/utilitarian motivation (r = -0.394, p = 0.046).
3.11. Correlations Between Motivation for Parenthood Scale (PM2) Factors and Psychosocial Variables
Altruistic motivation is moderately and negatively correlated with the total score of the Dyadic Adjustment Scale (r = -0.461, p = 0.016), the Dyadic Consensus Scale (r = -0.435, p = 0.023), and the Dyadic Cohesion Scale (r = -0.440, p = 0.022). Conversely, fatalistic motivation is moderately and positively correlated with the total score of the Dyadic Adjustment Scale (r = 0.504, p = 0.007), the Dyadic Consensus Scale (r = 0.486, p = 0.010), and the Dyadic Cohesion Scale (r = 0.560, p = 0.002).
3.12. Correlations Between Motivation for Parenthood Scale (PM2) Factors and Quality of Life (MSQOL-54)
Fatalistic motivation is moderately and positively correlated with various quality-of-life dimensions, including Physical Functioning (r = 0.412, p = 0.033), Pain (r = 0.388, p = 0.046), Energy (r = 0.433, p = 0.024), Social Functioning (r = 0.465, p = 0.019), Cognitive Functioning (r = 0.528, p = 0.005), Health Worries (r = 0.422, p = 0.028), Physical Health Score (r = 0.554, p = 0.004), and Mental Health Score (r = 0.403, p = 0.037).
Table 10 provides a summary of the correlations between the Motivation for Parenthood Scale (PM2) factors and other continuous parameters.
4. Discussion
This study examined factors influencing reproductive decisions in women with MS. Women with children were significantly older, had better mental functioning, and reported more health concerns than those without. Fatalistic motivation emerged as a significant factor, suggesting that women who view childbearing as a natural or inevitable life event are more likely to have children, despite concerns related to MS. Marital status strongly influenced childbearing, with all unmarried women remaining childless. Disease course also played a role—relapsing-remitting MS was associated with higher childbirth rates, while the chronic/progressive form was not.
Treatment-related findings indicated that women receiving beta interferons were more likely to have children, whereas fingolimod use was negatively associated with childbirth. Among childless women, those who had tried to conceive reported lower scores in affectional expression and were more likely to be married. Higher educational attainment was linked to stronger altruistic motivations for parenthood, and a more recent MS diagnosis was also associated with higher altruistic motivation. Furthermore, fatalistic motivation was positively correlated with quality of life scores.
These results support existing research showing that MS-related concerns often shape reproductive decisions. Prior studies have reported increased voluntary childlessness due to fears of disease worsening or treatment effects [29,30,31,32,33,34]. For instance, a large European survey found that 56% of pwMS acknowledged MS influenced their family planning, and 14% decided against having children due to related concerns [29]. Other studies highlight uncertainty about motherhood [30], avoidance of pregnancy post-diagnosis [31], discouragement by healthcare professionals [32], and fears related to genetics and parenting capacity [33,34]. Our findings are consistent with these trends.
The observed link between higher education and altruistic motivation may reflect a greater emphasis on child well-being and prosocial values among more educated women. Similarly, the association between recent diagnosis and altruistic motivation might indicate a phase of life reevaluation, where nurturing roles become more meaningful. The correlation between fatalistic beliefs and a better quality of life may suggest that acceptance and reduced cognitive distress contribute to psychological resilience in the context of MS.
These findings highlight the need to integrate fertility counseling into MS care, especially early in the disease course. Tailored support should address concerns about disease progression, treatment interruptions, and quality of life [35]. Given the importance of mental well-being in reproductive decisions, psychosocial support and counseling could be especially beneficial. Moreover, occupational therapists can contribute to developing adaptive parenting strategies36. An interdisciplinary approach involving neurologists, gynecologists, psychologists, and occupational therapists is essential. Structured fertility education programs tailored to MS-specific concerns—fatigue, mobility, and medication management—are recommended [36].
The study’s strengths include the validation of the PM2 and Positivity Scale in Greek, offering robust psychometric properties via EFA and CFA. It addresses an underexplored topic using multidimensional assessment tools and a diverse recruitment strategy, enhancing generalizability. Clinically, it identifies both modifiable and fixed factors relevant to fertility decisions in women with MS.
The cross-sectional design inherently limits the ability to infer causality. Selection bias may be present, as the sample was obtained from clinics and support groups. With a moderate sample size (n = 103), there is a risk of not detecting subtle effects within subgroups, and the use of self-reported data may introduce recall or social desirability biases. Moreover, the study did not track pregnancy outcomes or consider partner perspectives, both of which are vital for a thorough understanding.
Longitudinal research is needed to explore how reproductive decisions change over time. Future studies should assess the effects of newer MS treatments on fertility, and qualitative research could provide more profound insights into patient perspectives and decision-making processes.
5. Conclusions
This study highlights key factors influencing fertility decisions in women with MS, including age, marital status, disease progression, and psychological factors. Women with relapsing-remitting MS and those on beta interferons were more likely to have children, whereas those on fingolimod remained childless. Higher mental health scores, fatalistic motivation, and positive health perceptions were associated with childbearing, while greater health-related distress was more common among mothers. Despite its cross-sectional design, these findings underscore the need for personalized reproductive counseling and further longitudinal research to assess long-term reproductive and psychological outcomes in women with MS.
Supplementary Materials
The following supporting information can be downloaded at the website of this paper posted on Preprints.org.
Author Contributions
Study concept and design were done by An.S. and P.D. Data acquisition and analysis were contributed by P.D., S.T., V.J., K.G., Ai.S., N.P., A.O., A.L. Manuscript was drafted by P.D. and An.S. Intellectual content and manuscript editing were done by P.D., K.G., A.L., S.T., A.O., V.J., and An.S. Guarantor was An.S.
Institutional Review Board Statement
“The study was conducted in accordance with the Declaration of Helsinki, and the protocol was approved by the University of West Attica Ethics Committee (approval code: 95813) on 18/10/2023.”
Informed Consent Statement
Informed consent was obtained from all subjects involved in the study.
Data Availability Statement
The dataset used and analyzed during this study is available from the corresponding author on reasonable request.
Acknowledgments
During the preparation of this work, AI tool Chat GPT was used to improve the readability and language of the manuscript, and subsequently, the authors revised and edited the content produced by the AI tool as necessary, taking full responsibility for the ultimate content of the present manuscript
Abbreviations
The following abbreviations are used in this manuscript:
| MS | Multiple Sclerosis |
| MARU | Medically Assisted Reproduction Unit |
| NHA | Gynecological and Neurology Clinics of the Naval Hospital of Athens |
| GMSS | Greek Multiple Sclerosis Society |
| OSSS | Oslo Social Support Scale |
| DAS | Dyadic Adjustment Scale |
| PM2 | Motivation for Parenthood Questionnaire |
| PS | Positivity Scale |
| CI | Confidence Interval |
| MSQO | Multiples Sclerosis Quality of Life |
| BFI | Big Five Personality Inventory |
| OR | Odds ratio |
| SE | standard error |
References
- Kobelt, G.; Eriksson, J.; Phillips, G.; Berg, J. The burden of multiple sclerosis 2015: Methods of data collection, assessment and analysis of costs, quality of life and symptoms. Mult. Scler. J. 2017, 23, 4–16. [Google Scholar] [CrossRef] [PubMed]
- Lassmann, H. Multiple Sclerosis Pathology. Cold Spring Harb. Perspect. Med. 2018, 8, a028936. [Google Scholar] [CrossRef] [PubMed]
- Izadi, S.; Nikseresht, A.; Sharifian, M.; Sahraian, M.A.; Jahromi, A.H.; Aghighi, M.; Heidary, A. Significant Increase in the Prevalence of Multiple Sclerosis in Iran in 2011. 2014, 39, 152–15.
- Dehghan-Nayeri, N.; Khakbazan, Z.; Ghafoori, F.; Nabavi, S.M. Sexual dysfunction levels in iranian women suffering from multiple sclerosis. Mult. Scler. Relat. Disord. 2017, 12, 49–53. [Google Scholar] [CrossRef] [PubMed]
- Payne, D.; McPherson, K.M. Becoming mothers. Multiple sclerosis and motherhood: A qualitative study. Disabil. Rehabilitation 2009, 32, 629–638. [Google Scholar] [CrossRef]
- Bartnik, P.; Wielgoś, A.; Kacperczyk-Bartnik, J.; Szymusik, I.; Podlecka-Piętowska, A.; Zakrzewska-Pniewska, B.; Wielgoś, M. Evaluation of reproductive health in female patients with multiple sclerosis in Polish population. J. Clin. Neurosci. 2018, 53, 117–121. [Google Scholar] [CrossRef]
- Nabavi, S.; Sangelaji, B. Cognitive dysfunction in multiple sclerosis: Usually forgotten in the clinical assessment of MS patients. J. Res. Med Sci. 2015, 20, 533–4. [Google Scholar] [CrossRef]
- Lawler, D.; Begley, C.; Lalor, J. (Re)constructing Myself: the process of transition to motherhood for women with a disability. J. Adv. Nurs. 2015, 71, 1672–1683. [Google Scholar] [CrossRef]
- Pozzilli, C.; Pugliatti, M. An overview of pregnancy-related issues in patients with multiple sclerosis. Eur. J. Neurol. 2015, 22, 34–39. [Google Scholar] [CrossRef]
- Vukusic, S.; Marignier, R. Multiple sclerosis and pregnancy in the 'treatment era'. Nat. Rev. Neurol. 2015, 11, 280–289. [Google Scholar] [CrossRef]
- Prunty, M.; Sharpe, L.; Butow, P.; Fulcher, G. The motherhood choice: Themes arising in the decision-making process for women with multiple sclerosis. Mult. Scler. J. 2008, 14, 701–704. [Google Scholar] [CrossRef]
- Smeltzer, S.C. Reproductive Decision Making in Women with Multiple Sclerosis. J. Neurosci. Nurs. 2002, 34, 145–157. [Google Scholar] [CrossRef]
- Pebdani, R.N.; Johnson, K.L.; Amtmann, D.; Bamer, A.M.; Wundes, A. Experiences and Perspectives of Pregnancy in Women with Multiple Sclerosis. Sex. Disabil. 2014, 33, 47–52. [Google Scholar] [CrossRef]
- Prunty, M.C.; Sharpe, L.; Butow, P.; Fulcher, G. The motherhood choice: A decision aid for women with multiple sclerosis. Patient Educ. Couns. 2008, 71, 108–115. [Google Scholar] [CrossRef] [PubMed]
- Willson, C.L.; Tetley, J.; Lloyd, C.; Uccelli, M.M.; MacKian, S. The impact of multiple sclerosis on the identity of mothers in Italy. Disabil. Rehabilitation 2017, 40, 1456–1467. [Google Scholar] [CrossRef] [PubMed]
- Kocalevent, R.-D.; Berg, L.; Beutel, M.E.; Hinz, A.; Zenger, M.; Härter, M.; Nater, U.; Brähler, E. Social support in the general population: standardization of the Oslo social support scale (OSSS-3). BMC Psychol. 2018, 6, 1–8. [Google Scholar] [CrossRef]
- Lianos P, Velissaropoulos C, Desylla T, Sofianou AP, Nikolopoulou ML, Athanasiou, V. Prosocial skills and adolescents’ response to trauma: the role of social support and parental behavior from a psychoanalytic perspective. International Journal of Psychoanalysis and Education: Subject, Action & Society. 2023 Jun 29;3(1).
- Spanier, G.B. Measuring Dyadic Adjustment: New Scales for Assessing the Quality of Marriage and Similar Dyads. J. Marriage Fam. 1976, 38, 15. [Google Scholar] [CrossRef]
- Petrogiannis KG. Psychological development at 18 months of age as a function of child care experience in Greece (Doctoral dissertation, University of Wales. Cardiff).
- Stamatiou, E., Papaligoura, Z. Postnatal depression in Greek mothers: The impact of stressful life events, social support and marital relationship. Psychology: the Journal of the Hellenic Psychological Society. 2010;17(2):215-29.
- Radloff LS. The CES-D scale: A self-report depression scale for research in the general population. Applied psychological measurement. 1977;1(3):385-401.
- Fountoulakis, K.; Iacovides, A.; Kleanthous, S.; Samolis, S.; Kaprinis, S.G.; Sitzoglou, K.; Kaprinis, G.S.; Bech, P. Reliability, Validity and Psychometric Properties of the Greek Translation of the Center for Epidemiological Studies-Depression (CES-D) Scale. BMC Psychiatry 2001, 1, 3–3. [Google Scholar] [CrossRef]
- Benet-Martínez, V. , John OP. Los Cinco Grandes across cultures and ethnic groups: Multitrait-multimethod analyses of the Big Five in Spanish and English. J. Personal. Soc. Psychology. 1998, 75, 729. [Google Scholar] [CrossRef]
- Saucier, G.; Georgiades, S.; Tsaousis, I.; Goldberg, L.R. The Factor Structure of Greek Personality Adjectives. J. Pers. Soc. Psychol. 2005, 88, 856–875. [Google Scholar] [CrossRef]
- Vickrey, B.G.; Hays, R.D.; Harooni, R.; Myers, L.W.; Ellison, G.W. A health-related quality of life measure for multiple sclerosis. Qual. Life Res. 1995, 4, 187–206. [Google Scholar] [CrossRef]
- Kapina, V. The working ability of patients suffering from multiple sclerosis: correlation of clinical, psychological and neuroradiological parameters [dissertation on the internet]. Thessaloniki: Aristotle University of Thessaloniki; 2009 [cited 2025 Feb 15]. Available from: https://www.didaktorika.gr/eadd/handle/10442/19450.
- Rabin, A.I.; Greene, R.J. Assessing Motivation for Parenthood. J. Psychol. 1968, 69, 39–46. [Google Scholar] [CrossRef] [PubMed]
- Caprara GV, Alessandri G, Eisenberg N, Kupfer A, Steca P, Caprara MG, Yamaguchi S, Fukuzawa A, Abela, J. The positivity scale. Psychol Assess 2012;24(3):701-12.
- Bonavita, S.; Lavorgna, L.; Worton, H.; Russell, S.; Jack, D. Family Planning Decision Making in People With Multiple Sclerosis. Front. Neurol. 2021, 12. [Google Scholar] [CrossRef] [PubMed]
- Sponiar, M.; Sharpe, L.; Butow, P.; Fulcher, G. Reproductive Choices of Women With Multiple Sclerosis. Int. J. MS Care 2007, 9, 9–12. [Google Scholar] [CrossRef]
- Kelly EE, Engel C, Pearsall R, Brenton JN, Bove, R., Oh, U., Goldman MD. Multiple Sclerosis and Family Planning: A Survey Study of the Patient Experience. Neurology: Clinical Practice. 2024 Feb;14(1):e200222.
- Lavorgna, L.; Esposito, S.; Lanzillo, R.; Sparaco, M.; Ippolito, D.; Cocco, E.; Fenu, G.; Borriello, G.; De Mercanti, S.; Frau, J.; et al. Factors interfering with parenthood decision-making in an Italian sample of people with multiple sclerosis: an exploratory online survey. J. Neurol. 2019, 266, 707–716. [Google Scholar] [CrossRef]
- Alwan, S.; Yee, I.; Dybalski, M.; Guimond, C.; Dwosh, E.; Greenwood, T.; Butler, R.; Sadovnick, A. Reproductive decision making after the diagnosis of multiple sclerosis (MS). Mult. Scler. J. 2012, 19, 351–358. [Google Scholar] [CrossRef]
- Moberg, J.Y.; Laursen, B.; Thygesen, L.C.; Magyari, M. Reproductive history of the Danish multiple sclerosis population: A register-based study. Mult. Scler. J. 2019, 26, 902–911. [Google Scholar] [CrossRef]
- Honey, A.; Peterson, J.; O'Mara, V.; McGrath, M. Occupational Therapy for Parenting: Perspectives of Parents With Physical Disability. Occup. Ther. Int. 2024, 2024, 4854903. [Google Scholar] [CrossRef]
- Rider, J.V.; Selim, J. Supporting the Role of Parenting for People With Multiple Sclerosis: A Guide for Clinicians. Arch. Phys. Med. Rehabilitation 2022, 103, 1891–1894. [Google Scholar] [CrossRef]
Figure 1.
Statistically significant differences in the mean altruistic motivation score, with Doctoral degree holders showing the highest values.
Figure 1.
Statistically significant differences in the mean altruistic motivation score, with Doctoral degree holders showing the highest values.
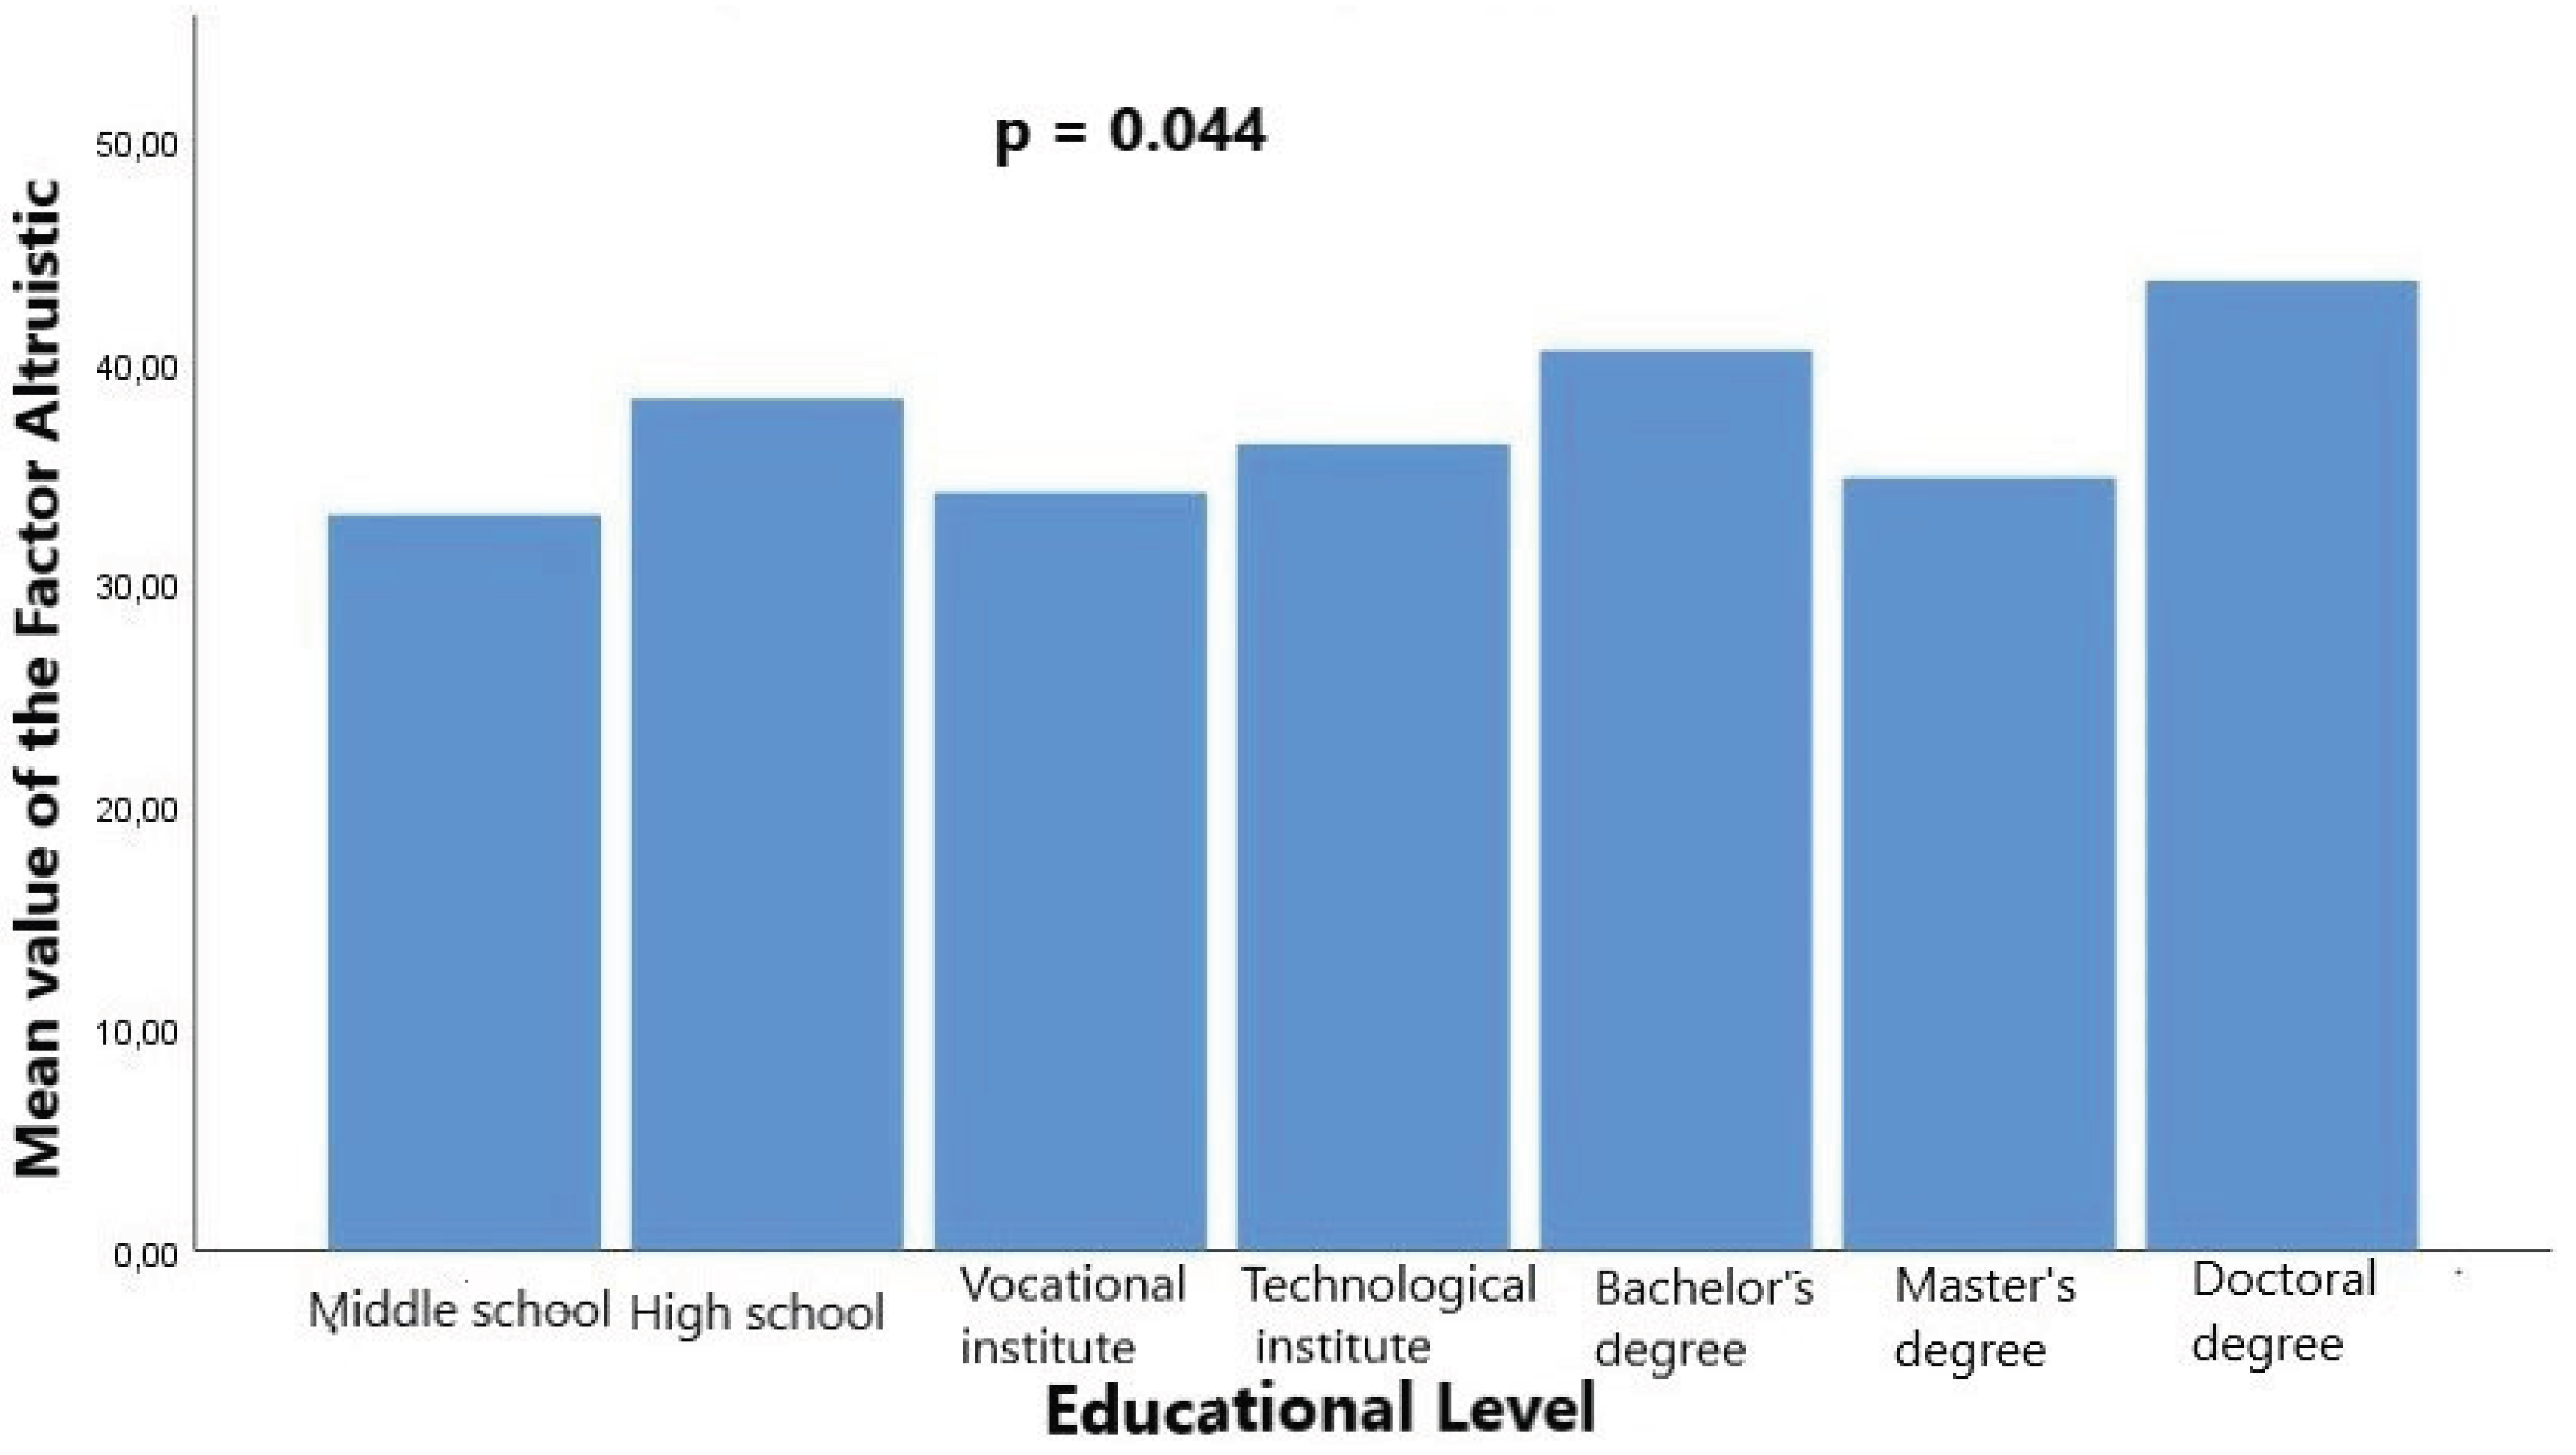

Table 1.
Demographic Characteristics of Participants.
| Parameter | Mean | Standard deviation |
| Age (years) | 38.05 | 7.01 |
| Nationality | N | % |
| Greek | 99 | 96.1 |
| Other | 4 | 3.9 |
| Educational Level | ||
| Primary School | 0 | 0 |
| Middle School | 2 | 1.9 |
| High School | 29 | 28.2 |
| Vocational Institute | 8 | 7.8 |
| Technological Educational Institute | 29 | 28.2 |
| Bachelor’s Degree | 26 | 25.2 |
| Master’s Degree | 7 | 6.8 |
| Doctoral Degree | 2 | 1.9 |
| Marital Status | ||
| Married | 81 | 79.4 |
| Unmarried | 16 | 15.7 |
| Divorced | 4 | 3.9 |
| Widowed | 0 | 0 |
| Civil Partnership | 1 | 1.0 |
| Age (years) | 38.05 | 7.01 |
Table 2.
Obstetric-Gynecological History.
| Parameter | N | % |
| Number of children | ||
| 0 | 32 | 31.1 |
| 1 | 46 | 44.7 |
| 2 | 25 | 24.3 |
| Conception method | ||
| Natural conception | 49 | 69.0 |
| IVF | 21 | 29.6 |
| Intrauterine insemination | 1 | 1.4 |
| Mode of delivery | ||
| Did not give birth | 32 | 31.1 |
| Vaginal ≥37 weeks with epidural | 3 | 2.9 |
| Vaginal <37 weeks with epidural | 1 | 1.0 |
| Vaginal ≥37 weeks without epidural | 18 | 17.5 |
| Vaginal <37 weeks without epidural | 12 | 11.7 |
| Cesarean ≥37 weeks | 17 | 16.5 |
| Cesarean <37 weeks | 20 | 19.4 |
| Attempted conception | ||
| No | 19 | 59.4 |
| Yes | 13 | 40.6 |
| Infertility factors | ||
| None | 33 | 50.8 |
| Tubal | 15 | 23.1 |
| Ovarian | 5 | 7.7 |
| Age-related | 1 | 1.5 |
| Male | 6 | 9.2 |
| Unexplained | 5 | 7.7 |
| Number of spontaneous abortions | ||
| 0 | 86 | 86.9 |
| 1 | 8 | 8.1 |
| 2 | 5 | 5.1 |
| Number of elective abortions | ||
| 0 | 91 | 93.8 |
| 1 | 5 | 5.2 |
| 2 | 1 | 1.0 |
Table 3.
Chronic Disease History.
| Parameter | Ν | % |
| Chronic mental illness | ||
| No | 103 | 100 |
| Yes | 0 | 0 |
| Years diagnosed with Multiple Sclerosis | ||
| <1 | 6 | 6.0 |
| 1 | 5 | 5.0 |
| 2 | 25 | 25.0 |
| 3 | 50 | 50.0 |
| >3 | 14 | 14.0 |
| Disease progression category | ||
| Benign | 4 | 4.0 |
| Relapsing-remitting | 88 | 88.0 |
| Relapsing-progressive | 2 | 2.0 |
| Chronic-progressive | 6 | 6.0 |
| Treatment | ||
| Corticosteroids | 8 | 7.8 |
| Beta interferons | 73 | 70.9 |
| Glatiramer acetate | 5 | 4.9 |
| Fingolimod | 4 | 3.9 |
| Mitoxantrone | 2 | 1.9 |
Table 4.
Chronic Disease History.
| Parameter | Having children | |||
| No | Yes | p | ||
| Mean value (standard deviation) | ||||
| Age (years) | 35.56 (8.67) | 39.75 (5.72) | 0.017 | |
| OSSS-3 | 6.06 (1.50) | 5.80 (1.22) | 0.367 | |
| Dyadic Adjustment Scale (overall score) | 67.54 (5.96) | 68.38 (5.32) | 0.485 | |
| Dyadic Consensus Scale | 20.22 (5.54) | 21.18 (4.94) | 0.388 | |
| Dyadic Satisfaction Scale | 28.35 (1.90) | 28.42 (2.21) | 0.883 | |
| Dyadic Cohesion Scale | 15.61 (2.20) | 15.11 (2.18) | 0.292 | |
| Affectional Expression Scale | 3.35 (1.25) | 3.66 (1.37) | 0.289 | |
| CES-D score | 20.58 (3.53) | 20.14 (4.13) | 0.608 | |
| BFI- Extraversion | 22.48 (3.11) | 22.87 (3.51) | 0.596 | |
| BFI- Agreeableness | 30.96 (3.03) | 31.78 (3.24) | 0.234 | |
| BFI- Conscientiousness | 29.70 (4.72) | 30.53 (4.18) | 0.380 | |
| BFI- Neuroticism | 25.77 (4.69) | 24.46 (3.52) | 0.123 | |
| BFI- Openness | 32.83 (4.68) | 31.64 (4.15) | 0.204 | |
| BFI- Overall score | 141.77 (9.62) | 141.30 (9.82) | 0.826 | |
| MSQOL-54- Physical Function | 43.22 (19.64) | 43.07 (14.75) | 0.965 | |
| MSQOL-54- Role Limitations Due to Physical Problems | 11.71 (25.38) | 13.92 (21.12) | 0.647 | |
| MSQOL-54- Role Limitations Due to Emotional Problems | 23.95 (27.08) | 27.61 (26.60) | 0.523 | |
| MSQOL-54-Pain | 46.04 (18.98) | 43.64 (10.19) | 0.409 | |
| MSQOL-54-Social Function | 50.87 (14.01) | 56.74 (12.35) | 0.035 | |
| MSQOL-54- Energy | 38.50 (12.84) | 41.94 (12.15) | 0.195 | |
| MSQOL-54- Health Perceptions | 26.71 (12.08) | 32.00 (13.97) | 0.068 | |
| MSQOL-54- Social Function | 57.77 (18.03) | 63.76 (12.61) | 0.108 | |
| MSQOL-54- Cognitive Function | 71.25 (21.28) | 77.00 (15.09) | 0.175 | |
| MSQOL-54-Health Distress | 44.06 (23.08) | 57.14 (16.93) | 0.006 | |
| MSQOL-54-Sexual Function | 49.48 (29.26) | 44.88 (22.36) | 0.434 | |
| MSQOL-54-Overall Quality of Life | 62.23 (16.79) | 67.49 (10.91) | 0.112 | |
| MSQOL-54-Physical Health Score | 37.51 (13.36) | 40.85 (7.98) | 0.219 | |
| MSQOL-54-Mental Health Score | 48.56 (16.76) | 54.78 (12.56) | 0.067 | |
| Positivity Scale score | 23.59 (4.24) | 22.46 (3.40) | 0.154 | |
| PM2-Altruistic | 39.16 (3.58) | 36.86 (4.67) | 0.173 | |
| PM2-Fatalistic | 44.08 (3.50) | 47.86 (2.92) | 0.005 | |
| PM2-Narcissistic | 45.83 (1.94) | 44.00 (3.87) | 0.148 | |
| PM2-Instrumental | 51.81 (3.57) | 51.66 (2.87) | 0.906 | |
| Educational Level | N (%) | N (%) | 0.778 | |
| Middle School | 1 (50) | 1 (50) | ||
| High School | 7 (24.1) | 22 (75.9) | ||
| Vocational Institute | 3 (37.5) | 5 (62.5) | ||
| Technological Educational Institute | 10 (34.5) | 19 (65.5) | ||
| Bachelor’s Degree | 9 (34.6) | 17 (65.4) | ||
| Master’s Degree | 1 (14.3) | 6 (85.7) | ||
| Doctoral Degree | 1 (50) | 1 (50) | ||
| Marital Status | 0.001 | |||
| Married | 13 (16) | 68 (84) | ||
| Unmarried | 16 (100) | 0 (0) | ||
| Divorced | 2 (50) | 2 (50) | ||
| Civil Partnership | 1 (100) | 0 (0) | ||
| Years diagnosed with MS | 0.129 | |||
| <1 | 3 (50) | 3 (50) | ||
| 1 | 2 (40) | 3 (60) | ||
| 2 | 7 (28) | 18 (72) | ||
| 3 | 12 (24) | 38 (76) | ||
| >3 | 8 (51.7) | 6 (42.9) | ||
| Disease progression category | 0.001 | |||
| Benign | 2 (50) | 2 (50) | ||
| Relapsing-remitting | 23 (26.1) | 65 (73.9) | ||
| Relapsing-progressive | 1 (50) | 1 (50) | ||
| Chronic-progressive | 6 (100) | 0 (0) | ||
| Corticosteroids | 0.251 | |||
| No | 28 (29.5) | 67 (70.5) | ||
| Yes | 4 (50) | 4 (50) | ||
| Beta Interferons | 0.003 | |||
| No | 16 (53.3) | 14 (46.7) | ||
| Yes | 16 (21.9) | 57 (78.1) | ||
| Glatiramer acetate | 0.172 | |||
| No | 29 (29.6) | 69 (70.4) | ||
| Yes | 3 (60) | 2 (40) | ||
| Fingolimod | 0.008 | |||
| No | 28 (28.3) | 71 (71.7) | ||
| Yes | 4 (100) | 0 (0) | ||
| Mitoxantrone | 0.094 | |||
| No | 30 (29.7) | 71 (70.3) | ||
| Yes | 2 (100) | 0 (0) | ||
Table 5.
Logistic regression for identifying an independent factor associated with having children.
| Parameter | B | S.E. | p | OR | 95% C.I. for OR | |
| Lower | Upper | |||||
| Age | -0.022 | 0.283 | 0.937 | 0.978 | 0.561 | 1.704 |
| Marital status | -2.201 | 1.301 | 0.091 | 0.111 | 0.009 | 1.418 |
| Category pf disease progression | -1.232 | 1.808 | 0.496 | 0.292 | 0.008 | 10.086 |
| Beta interferons | 1.356 | 2.744 | 0.621 | 3.880 | 0.018 | 83.827 |
| MSQOL-54- Emotional well-being | 0.047 | 0.136 | 0.730 | 1.048 | 0.803 | 1.367 |
| MSQOL-54-Health distress | 0.058 | 0.165 | 0.727 | 1.059 | 0.767 | 1.463 |
| PM2-Fatalistic | 0.468 | 0.381 | 0.219 | 1.597 | 0.757 | 3.368 |
Table 6.
Logistic regression for identifying an independent factor associated with having children.
| Parameter | Number of children | ||||
| 0 | 1 | 2 | p | ||
| Mean value (standard deviation) | |||||
| Age (years) | 35.56 (8.67) | 37.72 (5.02) | 43.48 (5.1) | 0.001 | |
| OSSS-3 | 6.06 (1.50) | 5.70 (1.06) | 6.00 (1.47) | 0.457 | |
| Dyadic Adjustment Scale (overall score) | 67.54 (5.96) | 67.93 (6.11) | 69.20 (3.39) | 0.515 | |
| Dyadic Consensus Scale | 20.22 (5.54) | 21.00 (5.46) | 21.52 (3.87) | 0.636 | |
| Dyadic Satisfaction Scale | 28.35 (1.90) | 28.39 (2.39) | 28.48 (1.87) | 0.976 | |
| Dyadic Cohesion Scale | 15.61 (2.20) | 15.02 (2.16) | 15.28 (2.26) | 0.279 | |
| Affectional Expression Scale | 3.35 (1.25) | 3.52 (1.36) | 3.92 (1.38) | 0.514 | |
| CES-D score | 20.58 (3.53) | 20.32 (4.15) | 19.80 (4.16) | 0.762 | |
| BFI- Extraversion | 22.48 (3.11) | 23.17 (3.68) | 22.32 (3.15) | 0.572 | |
| BFI- Agreeableness | 30.96 (3.03) | 32.32 (2.95) | 30.80 (3.57) | 0.075 | |
| BFI- Conscientiousness | 29.70 (4.72) | 30.43 (3.52) | 30.72 (5.25) | 0.659 | |
| BFI- Neuroticism | 25.77 (4.69) | 24.56 (4.01) | 24.28 (2.44) | 0.254 | |
| BFI- Openness | 32.83 (4.68) | 31.45 (4.28) | 32.00 (3.96) | 0.394 | |
| BFI- Overall score | 141.77 (9.62) | 141.95 (8.82) | 140.12 (11.54) | 0.735 | |
| MSQOL-54- Physical Function | 43.22 (19.64) | 42.44 (12.64) | 44.20 (18.18) | 0.912 | |
| MSQOL-54- Role Limitations Due to Physical Problems | 11.71 (25.38) | 13.33 (20.36) | 15.00 (22.82) | 0.862 | |
| MSQOL-54- Role Limitations Due to Emotional Problems | 23.95 (27.08) | 29.62 (25.84) | 24.00 (28.08) | 0.573 | |
| MSQOL-54-Pain | 46.04 (18.98) | 43.07 (10.46) | 44.66 (9.81) | 0.638 | |
| MSQOL-54-Social Function | 50.87 (14.01) | 54.66 (12.12) | 60.48 (12.12) | 0.021 | |
| MSQOL-54- Energy | 38.50 (12.84) | 42.04 (12.04) | 41.76 (12.60) | 0.432 | |
| MSQOL-54- Health Perceptions | 26.71 (12.08) | 28.66 (8.88) | 38.00 (18.92) | 0.003 | |
| MSQOL-54- Social Function | 57.77 (18.03) | 62.59 (12.24) | 65.94 (13.27) | 0.122 | |
| MSQOL-54- Cognitive Function | 71.25 (21.28) | 76.22 (17.32) | 78.40 (10.07) | 0.267 | |
| MSQOL-54-Health Distress | 44.06 (23.08) | 55.11 (19.11) | 60.80 (11.51) | 0.004 | |
| MSQOL-54-Sexual Function | 49.48 (29.26) | 42.60 (23.52) | 48.99 (19.90) | 0.403 | |
| MSQOL-54-Overall Quality of Life | 62.23 (16.79) | 6591 (10.63) | 70.33 (11.04) | 0.070 | |
| MSQOL-54-Physical Health Score | 37.51 (13.63) | 39.64 (8.78) | 43.10 (5.75) | 0.132 | |
| MSQOL-54-Mental Health Score | 48.56 (16.76) | 53.97 (13.63) | 56.23 (10.47) | 0.100 | |
| Positivity Scale score | 23.59 (4.24) | 22.58 (3.23) | 22.24 (3.76) | 0.338 | |
| PM2-Altruistic | 39.16 (3.58) | 36.66 (5.52) | 37.16 (3.48) | 0.393 | |
| PM2-Fatalistic | 44.08 (3.50) | 48.77 (2.48) | 46.50 (3.20) | 0.009 | |
| PM2-Narcissistic | 45.83 (1.94) | 42.88 (4.16) | 45.66 (2.94) | 0.088 | |
| PM2-Instrumental | 51.81 (3.57) | 52.11 (3.51) | 51.00 (1.54) | 0.803 | |
| Educational Level | 0.079 | ||||
| Middle School | 1 (50) | 0 (0) | 1 (50) | ||
| High School | 7 (24.1) | 9 (31) | 13 (44.8) | ||
| Vocational Institute | 3 (37.5) | 5 (62.5) | 0 (0) | ||
| Technological Educational Institute | 10 (34.5) | 12 (41.4) | 7 (24.1) | ||
| Bachelor’s Degree | 9 (34.6) | 15 (57.7) | 2 (7.7) | ||
| Master’s Degree | 1 (14.3) | 4 (57.1) | 2 (28.6) | ||
| Doctoral Degree | 1 (50) | 1 (50) | 0 (0) | ||
| Marital Status | 0.001 | ||||
| Married | 13 (16) | 43 (53.1) | 25 (30.9) | ||
| Unmarried | 16 (100) | 0 (0) | 0 (0) | ||
| Divorced | 2 (50) | 2 (50) | 0 (0) | ||
| Civil Partnership | 1 (100) | 0 (0) | 0 (0) | ||
| Years diagnosed with MS | 0.044 | ||||
| <1 | 3 (50) | 2 (33.3) | 1 (16.7) | ||
| 1 | 2 (40) | 3 (60) | 0 (0) | ||
| 2 | 7 (28) | 16 (64) | 2 (8) | ||
| 3 | 12 (24) | 21 (42) | 17 (34) | ||
| >3 | 8 (57.1) | 3 (21.4) | 3 (21.4) | ||
| Disease progression category | 0.005 | ||||
| Benign | 2 (50) | 1 (25) | 1 (25) | ||
| Relapsing-remitting | 23 (26.1) | 43 (48.9) | 22 (25) | ||
| Relapsing-progressive | 1 (50) | 1 (50) | 0 (0) | ||
| Chronic-progressive | 6 (100) | 0 (0) | 0 (0) | ||
| Corticosteroids | 0.200 | ||||
| No | 28 (29.5) | 42 (44.2) | 25 (26.3) | ||
| Yes | 4 (50) | 4 (50) | 0 (0) | ||
| Beta Interferons | 0.006 | ||||
| No | 16 (53.3) | 11 (36.7) | 3 (10) | ||
| Yes | 16 (21.9) | 35 (47.9) | 22 (30.1) | ||
| Glatiramer acetate | 0.312 | ||||
| No | 29 (29.6) | 44 (44.9) | 25 (25.5) | ||
| Yes | 3 (60) | 2 (40) | 0 (0) | ||
| Fingolimod | 0.011 | ||||
| No | 28 (28.3) | 46 (46.5) | 25 (25.3) | ||
| Yes | 4 (100) | 0 (0) | 0 (0) | ||
| Mitoxantrone | 0.152 | ||||
| No | 30 (29.7) | 46 (45.5) | 25 (24.8) | ||
| Yes | 2 (100) | 0 (0) | 0 (0) | ||
Table 9.
Association between the factors of the Motivation for Parenthood Scale (PM2) and various categorical parameters.
Table 9.
Association between the factors of the Motivation for Parenthood Scale (PM2) and various categorical parameters.
| Factors of Motivation for Parenthood (PM2) | Educational Level | p | ||||||||
| Middle school | High school | Vocational training diploma | Technical university degree | Bachelor’s degree | Master’s degree | Doctoral degree | ||||
| Altruistic | 33.00 (-) | 38.20 (2.86) | 34.00 (2.82) | 36.16 (3.06) | 40.37 (3.50) | 34.66 (6.65) | 43.50 (2.12) | 0.044 | ||
| Fatalistic | 51.00 (-) | 44.80 (1.64) | 50.50 (0.70) | 45.50 (4.27) | 45.12 (3.04) | 49.00 (4.58) | 45.00 (5.65) | 0.230 | ||
| Narcissistic | 45.00 (-) | 46.20 (3.11) | 41.50 (3.53) | 46.33 (2.06) | 44.25 (2.86) | 45.00 (2.00) | 42.00 (8.48) | 0.444 | ||
| Instrumental | 51.00 (-) | 51.40 (2.96) | 54.50 (0.70) | 52.50 (3.56) | 51.14 (3.67) | 52.00 (1.73) | 49.50 (4.94) | 0.808 | ||
| Marital status | p | |||||||||
| Married | Unmarried | Divorced | Civil partnership | |||||||
| Altruistic | 36.62 (4.41) | 40.40 (2.07) | 38.50 (4.94) | 45.00 (-) | 0.211 | |||||
| Fatalistic | 47.31 (3.28) | 43.20 (3.56) | 46.00 (4.24) | 41.00 (-) | 0.128 | |||||
| Narcissistic | 44.50 (3.07) | 45.20 (2.38) | 41.50 (7.77) | 48.00 (-) | 0.343 | |||||
| Instrumental | 52.06 (3.06) | 51.60 (2.88) | 54.50 (2.12) |
46 (-) | 0.183 | |||||
| Years diagnosed with Multiple Sclerosis | p | |||||||||
| <1 | 1 | 2 | 3 | >3 | ||||||
| Altruistic | 39.20 (3.27) | 46.00 (1.41) | 37.00 (3.74) | 36.00 (4.34) | 37.80 (3.49) | 0.040 | ||||
| Fatalistic | 44.40 (3.78) | 43.50 (3.53) | 47.40 (2.88) | 46.75 (3.95) | 46.40 (4.15) | 0.592 | ||||
| Narcissistic | 45.80 (3.11) | 44.50 (4.94) | 43.80 (5.35) | 44.75 (2.25) | 44.80 (3.49) | 0.939 | ||||
| Instrumental | 51.40 (2.60) | 46.00 (0.00) | 52.40 (3.50) | 52.87 (2.41) | 52.50 (3.69) | 0.083 | ||||
| Category of disease progression | ||||||||||
| Benign | Relapsing/remitting | Relapsing/progressive | Chronic/progressive | p | ||||||
| Altruistic | 41.00 (1.41) | 37.60 (4.64) | 39.00 (4.24) | 38.00 (-) | 0.771 | |||||
| Fatalistic | 42.50 (2.12) | 46.30 (3.71) | 46.50 (4.94) | 48.00 (-) | 0.542 | |||||
| Narcissistic | 43.50 (0.70) | 44.95 (3.44) | 43.00 (5.65) | 47.00 (-) | 0.747 | |||||
| Instrumental | 53.00 (2.82) | 51.75 (3.27) | 51.50 (4.94) - |
- | 0.873 | |||||
| Corticosteroids | p | |||||||||
| No | Yes | |||||||||
| Altruistic | 37.80 (3.89) | 38.16 (5.98) | 0.862 | |||||||
| Fatalistic | 46.42 (3.26) | 45.33 (5.12) | 0.530 | |||||||
| Narcissistic | 44.61 (3.41) | 45.50 (2.73) | 0.568 | |||||||
| Instrumental | 51.80 (3.10) | 51.50 (3.44) | 0.841 | |||||||
| Beta interferons | p | |||||||||
| No | Yes | |||||||||
| Altruistic | 37.44 (3.98) | 38.77 (5.01) | 0.459 | |||||||
| Fatalistic | 46.22 (3.87) | 46.11 (3.44) | 0.943 | |||||||
| Narcissistic | 45.22 (2.60) | 44.00 (4.33) | 0.367 | |||||||
| Instrumental | 51.70 (3.19) | 51.77 (3.15) | 0.957 | |||||||
| Glatiramer acetate | p | |||||||||
| No | Yes | |||||||||
| Altruistic | 37.37 (4.10) | 42.00 (4.35) | 0.079 | |||||||
| Fatalistic | 46.33 (3.72) | 45.00 (3.60) | 0.563 | |||||||
| Narcissistic | 45.00 (3.34) | 43.33 (2.08) | 0.413 | |||||||
| Instrumental | 52.00 (2.89) | 49.66 (4.72) | 0.230 | |||||||
Table 10.
Correlations between the Motivation for Parenthood Scale (PM2) factors and other continuous parameters.
Table 10.
Correlations between the Motivation for Parenthood Scale (PM2) factors and other continuous parameters.
| Other parameters | Factors of Motivation for Parenthood (PM2) | ||||
| Altruistic | Fatalistic | Narcissistic | Instrumental | ||
| Altruistic | Pearson Correlation | 1 | -0.697 | -0.199 | -0.420 |
| p | 0.000 | 0.318 | 0.033 | ||
| Fatalistic | Pearson Correlation | -0.697 | 1 | -0.246 | 0.058 |
| p | 0.001 | 0.217 | 0.779 | ||
| Narcissistic | Pearson Correlation | -0.199 | -0.246 | 1 | -0.394 |
| p | 0.318 | 0.217 | 0.046 | ||
| Instrumental | Pearson Correlation | -0.420 | 0.058 | -0.394 | 1 |
| p | 0.033 | 0.779 | 0.046 | ||
| Age (years) | Pearson Correlation | -0.321 | 0.311 | -0.061 | -0.154 |
| p | 0.103 | 0.114 | 0.762 | 0.454 | |
| OSSS-3 | Pearson Correlation | -0.179 | 0.229 | -0.053 | 0.060 |
| p | 0.392 | 0.271 | 0.800 | 0.781 | |
| Dyadic Adjustment Scale (overall score) | Pearson Correlation | -0.461 | 0.504 | -0.058 | 0.113 |
| p | 0.016 | 0.007 | 0.775 | 0.583 | |
| Dyadic Consensus Scale | Pearson Correlation | -0.435 | 0.486 | -0.149 | 0.171 |
| p | 0.023 | 0.010 | 0.459 | 0.405 | |
| Dyadic Satisfaction Scale | Pearson Correlation | 0.044 | 0.043 | 0.093 | -0.208 |
| p | 0.829 | 0.833 | 0.643 | 0.309 | |
| Dyadic Cohesion Scale | Pearson Correlation | -0.440 | 0.560 | -0.352 | 0.262 |
| p | 0.022 | 0.002 | 0.072 | 0.196 | |
| Affectional Expression Scale | Pearson Correlation | 0.068 | -0.215 | 0.302 | -0.071 |
| p | 0.738 | 0.281 | 0.126 | 0.730 | |
| CES-D score | Pearson Correlation | 0,199 | 0.006 | -0.123 | -0.185 |
| p | 0.320 | 0.978 | 0.540 | 0.365 | |
| BFI- Extraversion | Pearson Correlation | 0.380 | -0.238 | -0.106 | -0.186 |
| p | 0.050 | 0.232 | 0.598 | 0.364 | |
| BFI- Agreeableness | Pearson Correlation | 0.264 | -0.156 | 0.020 | -0.209 |
| p | 0.182 | 0.437 | 0.921 | 0.305 | |
| BFI- Conscientiousness | Pearson Correlation | 0.450 | -0.272 | -0.235 | -0.189 |
| p | 0.019 | 0.169 | 0.239 | 0.354 | |
| BFI- Neuroticism | Pearson Correlation | -0.154 | -0.033 | 0.245 | 0.116 |
| p | 0.444 | 0.868 | 0.219 | 0.571 | |
| BFI-Openness | Pearson Correlation | 0.284 | -0.201 | 0.087 | -0.188 |
| p | 0.151 | 0.315 | 0.667 | 0.359 | |
| BFI- Overall score | Pearson Correlation | 0.463 | -0.341 | 0.000 | -0.240 |
| p | 0.015 | 0.082 | 0.998 | 0.237 | |
| MSQOL-54- Physical function | Pearson Correlation | -0.324 | 0.412 | 0.047 | -0.121 |
| p | 0.099 | 0.033 | 0.815 | 0.557 | |
| MSQOL-54- Role Limitations due to physical problems | Pearson Correlation | -0.146 | 0.189 | 0.022 | -0.122 |
| p | 0.467 | 0.344 | 0.912 | 0.554 | |
| MSQOL-54- Role Limitations due to emotional problems | Pearson Correlation | -0.185 | 0.273 | -0.021 | -0.073 |
| p | 0.354 | 0.168 | 0.918 | 0.723 | |
| MSQOL-54-Pain | Pearson Correlation | -0.230 | 0.388 | 0.131 | -0.294 |
| p | 0.248 | 0.046 | 0.516 | 0.145 | |
| MSQOL-54-Emotional well-being | Pearson Correlation | -0.147 | 0.289 | -0.216 | 0.120 |
| p | 0.466 | 0.143 | 0.278 | 0.559 | |
| MSQOL-54- Energy | Pearson Correlation | -0.199 | 0.433 | -0.109 | -0.135 |
| p | 0.319 | 0.024 | 0.589 | 0.512 | |
| MSQOL-54- Health perceptions | Pearson Correlation | 0.165 | -0.001 | -0.139 | -0.118 |
| p | 0.410 | 0.995 | 0.490 | 0.567 | |
| MSQOL-54- Social function | Pearson Correlation | -0.299 | 0.465 | -0.051 | -0.021 |
| p | 0.146 | 0.019 | 0.809 | 0.924 | |
| MSQOL-54- Cognitive function | Pearson Correlation | -0.309 | 0.528 | -0.243 | 0.114 |
| p | 0.117 | 0.005 | 0.222 | 0.578 | |
| MSQOL-54-Health distress | Pearson Correlation | -0.197 | 0.422 | -0.306 | 0.140 |
| p | 0.326 | 0.028 | 0.120 | 0.494 | |
| MSQOL-54-Sexual function | Pearson Correlation | -0.002 | 0.076 | -0.158 | 0.099 |
| p | 0.991 | 0.705 | 0.432 | 0.630 | |
| MSQOL-54-Overall quality of life | Pearson Correlation | -0.139 | 0.222 | -0.047 | 0.001 |
| p | 0.490 | 0.265 | 0.817 | 0.996 | |
| MSQOL-54-Physical health score | Pearson Correlation | -0.313 | 0.554 | -0.141 | -0.051 |
| p | 0.127 | 0.004 | 0.502 | 0.814 | |
| MSQOL-54-Mental health score | Pearson Correlation | -0.232 | 0.403 | -0.174 | 0.047 |
| p | 0.244 | 0.037 | 0.384 | 0.820 | |
| Positivity Scale Score | Pearson Correlation | 0.090 | -0.005 | -0.102 | 0.021 |
| p | 0.655 | 0.978 | 0.613 | 0.918 | |
Disclaimer/Publisher’s Note: The statements, opinions and data contained in all publications are solely those of the individual author(s) and contributor(s) and not of MDPI and/or the editor(s). MDPI and/or the editor(s) disclaim responsibility for any injury to people or property resulting from any ideas, methods, instructions or products referred to in the content. |
© 2025 by the authors. Licensee MDPI, Basel, Switzerland. This article is an open access article distributed under the terms and conditions of the Creative Commons Attribution (CC BY) license (http://creativecommons.org/licenses/by/4.0/).
Copyright: This open access article is published under a Creative Commons CC BY 4.0 license, which permit the free download, distribution, and reuse, provided that the author and preprint are cited in any reuse.


