1. Introduction
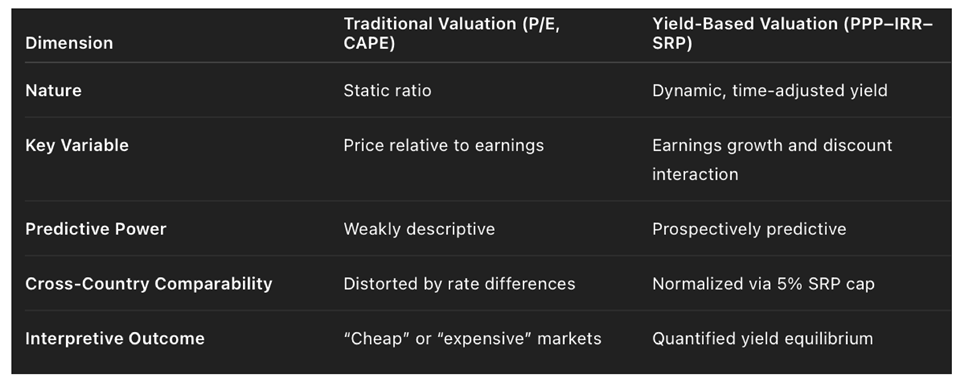
Traditional stock market valuation metrics — notably the Price-to-Earnings (P/E) ratio and its derivatives — have long guided investment analysis.
Yet, these static measures capture neither the time value of money nor the dynamic interaction between earnings growth, discount rates, and valuation.
In a world shaped by shifting monetary regimes and rapid technological change, such as the post-2020 revaluation cycle driven by AI-led productivity gains, there is a growing need for time-consistent and yield-based valuation metrics that can forecast market performance rather than merely describe it.
This paper introduces two interrelated concepts derived from the Potential Payback Period (PPP) framework: the Stock Internal Rate of Return (SIRR) and the Stock Risk Premium (SRP).
The SIRR translates the P/E ratio into an intrinsic annualized yield, integrating growth and risk into a single indicator.
The SRP extends this yield into a risk-adjusted excess return relative to the prevailing discount rate, under a revised 5% capping rule that ensures comparability between developed and emerging markets while maintaining local accuracy.
These two measures — SIRR and SRP — transform equity valuation into a predictive model of market behavior, not only reconciling fundamentals with performance but also quantifying the implicit yields driving price evolution across entire economies.
The analysis proceeds in three stages.
Section 2 develops the theoretical underpinnings of the PPP–IRR–SRP structure.
Section 3 traces the methodological evolution from static multiples to dynamic yields.
Section 4 provides empirical validation across the
2024 and 2025 datasets, showing that SIRR and capped SRP outperform traditional ratios as predictors of subsequent returns.
Finally,
Section 5 applies these findings to
October 2025 valuations, offering a
prospective market ranking for 2026 and demonstrating how SIRR and SRP redefine valuation science by linking
price, growth, risk, and time into one coherent forecasting system.
2. Theoretical Foundations
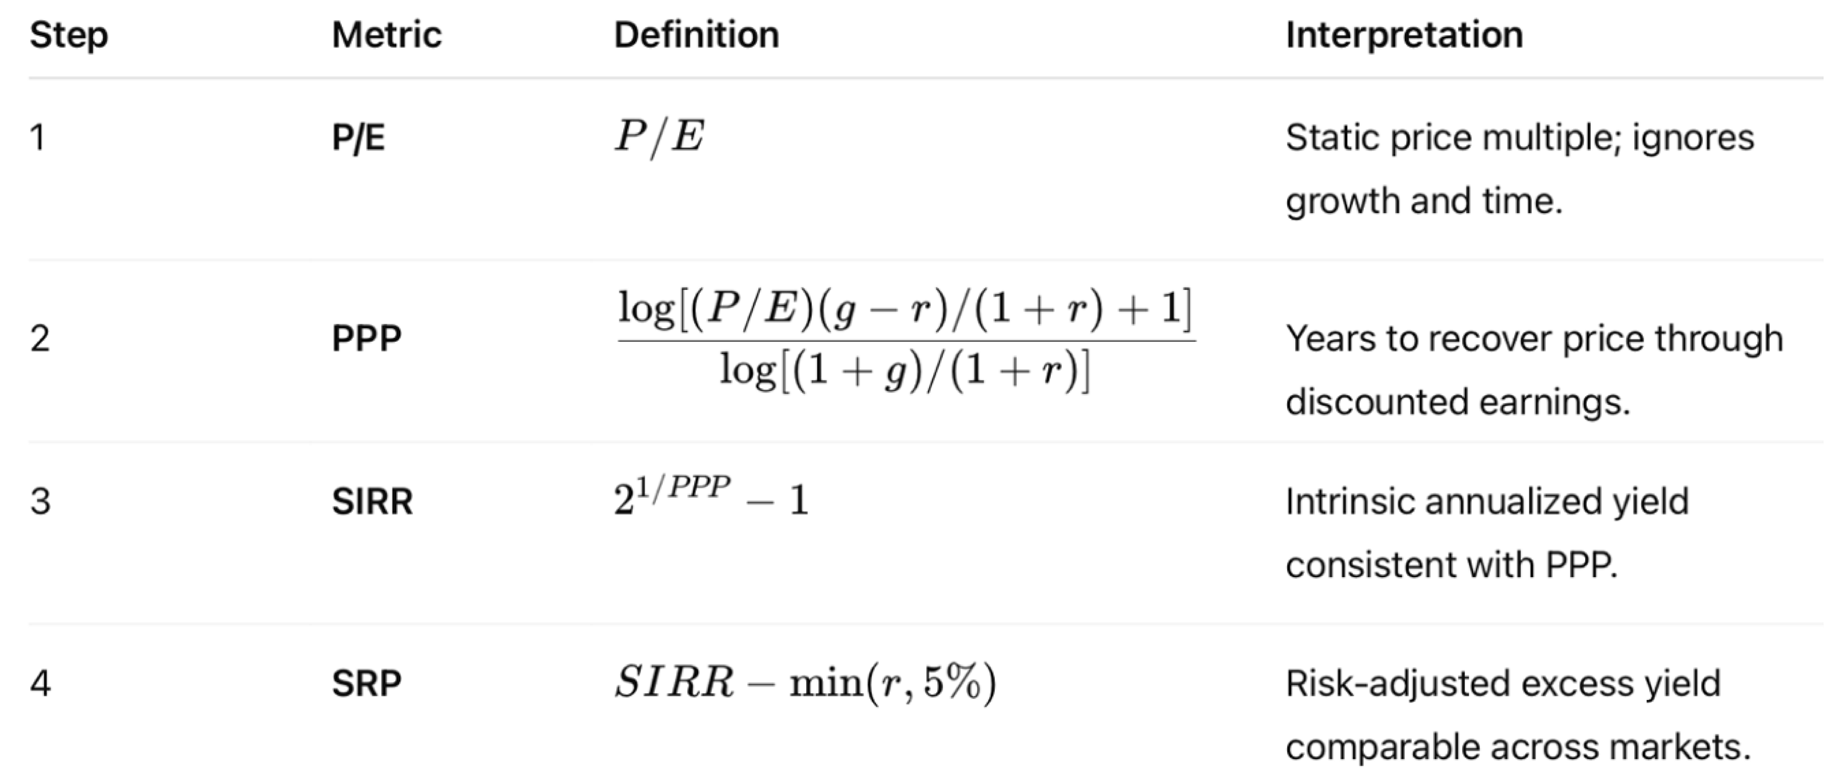
2.1. From the Price-to-Earnings Ratio to the Potential Payback Period (PPP)
The Price-to-Earnings (P/E) ratio has historically served as the cornerstone of market valuation.
However, it provides only a static snapshot of price relative to current earnings and fails to incorporate the forward dynamics of earnings growth and discounting.
To generalize this measure in time-consistent terms, the Potential Payback Period (PPP) expresses valuation as the number of discounted years of earnings required to recover the purchase price.
Let denote price per
share, current earnings
per share, the expected annual
earnings-growth rate, and the discount rate reflecting the time value of money and risk.
The PPP is defined as
When and , PPP reduces to , demonstrating that the P/E ratio is merely a special case of the more general payback framework.
Thus, PPP operationalizes the concept of “years to recover price” in a way that dynamically integrates growth and risk.
2.2. The Stock Internal Rate of Return (SIRR)
The Stock Internal Rate of Return (SIRR) is derived directly from the PPP and represents the implicit annualized yield implied by the market’s current valuation.
Conceptually, it is the reciprocal transformation of the PPP into yield space:
This expression provides a time-adjusted rate of return consistent with the compounding logic of internal-rate calculations.
Whereas PPP measures the time required to recover the investment, SIRR measures the yield consistent with that recovery period.
Mathematically, the transformation ensures that higher PPP values (expensive markets, longer payback) correspond to lower SIRRs, and vice versa.
The SIRR therefore generalizes the earnings yield (E/P) by embedding expectations of growth and discounting, turning a static multiple into a dynamic market yield that can be compared directly to interest rates or bond yields.
In steady-state equilibrium, global markets tend to converge toward a SIRR range of 4–8 percent, which may be interpreted as the intrinsic equity yield equilibrium.
2.3. The Stock Risk Premium (SRP)
While SIRR measures intrinsic yield, investors require a risk-adjusted metric that reflects excess compensation above the risk-free rate.
The
Stock Risk Premium (SRP) is therefore defined as
where
represents the prevailing discount rate (typically proxied by each market’s long-term government-bond yield).
The SRP expresses the fundamental yield spread between equity and fixed-income alternatives, analogous to the equity risk premium in the Capital Asset Pricing Model (CAPM), but derived directly from market valuation rather than expected return assumptions.
A positive SRP implies that the market offers an equity yield above the cost of capital, signaling undervaluation or attractive prospective returns.
Conversely, a low or negative SRP indicates that valuations already embed high expectations or that the market is priced near equilibrium.
2.4. The Revised 5 Percent Capping Rule
In empirical applications, using each country’s local discount rate without adjustment introduces distortions: markets with high nominal rates (e.g., Brazil, India) appear artificially unattractive because the same high simultaneously lengthens PPP, lowers SIRR, and—when used directly in SRP—reduces SRP.
In our framework, we never cap inside PPP or SIRR. The 5% cap is applied only at the SRP step, and only when the original exceeds 5%:
This preserves local realism in PPP and SIRR (both use the actual ), while restoring global comparability in SRP by preventing double penalization of high-rate markets.
Under this specification:
PPP and SIRR always use each market’s actual discount rate, preserving local monetary realism.
SRP is standardized ex post by substituting 5 percent for any , aligning high-rate markets with the global risk-free benchmark.
This rule removes the “double-penalization” effect and produces a consistent yield-spread metric that is economically meaningful across heterogeneous markets.
Empirically, applying the cap only within SRP enhances correlation with subsequent performance and stabilizes regression slopes across diverse monetary environments.
2.5. Conceptual Integration
The sequence transforms valuation from a price multiple into a prospective yield hierarchy:
This transformation achieves both theoretical completeness and operational consistency.
PPP introduces the time dimension, SIRR transforms it into yield, and SRP expresses the globally comparable premium over risk-free benchmarks.
Together, they form a valuation system capable of explaining, comparing, and forecasting market performance in both developed and emerging economies.
3. Methodological Evolution and Empirical Implementation (2024–2025)
3.1. From P/E Dispersion to IRR Homogeneity
The earliest empirical motivation for this study originated from the persistent inconsistency of traditional valuation ratios across markets.
While the Price-to-Earnings (P/E) ratio is convenient for comparative analysis, its dispersion across countries and cycles often exceeds 300%, masking the underlying yield equilibrium of equity markets.
For instance, at various points in 2015, global P/Es ranged from 10 (Brazil) to 33 (China), yet all these markets exhibited normalized internal yields between 4.7% and 8.5% once converted through the Potential Payback Period (PPP) and Stock Internal Rate of Return (SIRR) transformations.
This observation confirmed that the PPP–IRR framework effectively homogenizes valuation signals: it converts the highly volatile P/E ratio into a time-based and yield-based measure reflecting each market’s intrinsic earnings dynamics.
The SIRR, derived from PPP, thus emerged as the first truly universal market yield metric, comparable across regions, growth profiles, and monetary regimes.
3.2. The Initial SRP Formulation and the Double-Penalization Issue
To extend the model toward risk-adjusted comparability, the Stock Risk Premium (SRP) was introduced as the difference between SIRR and each market’s discount rate ().
However, empirical testing on 2025 data revealed a systematic bias: markets with high nominal discount rates (e.g., India at 6.8% and Brazil at 14.8%) appeared chronically undervalued even when their fundamentals were strong.
The reason was mechanical: a high simultaneously lengthened the PPP, reduced the computed IRR, and was again subtracted in the SRP calculation, effectively penalizing high-rate markets twice.
This double-penalization effect artificially depressed SRP values for emerging economies, leading to distorted regression slopes and lower correlations with subsequent returns.
Conversely, very low-rate markets (e.g., Japan, Germany) appeared excessively attractive because their low inflated both IRR and SRP.
The empirical pattern called for a refinement capable of preserving local realism in IRR while ensuring global comparability in SRP.
3.3. The Empirical Trials of 2024 and 2025
Two natural experiments — one in 2024 and another in 2025 — provided the testing ground for refining the model.
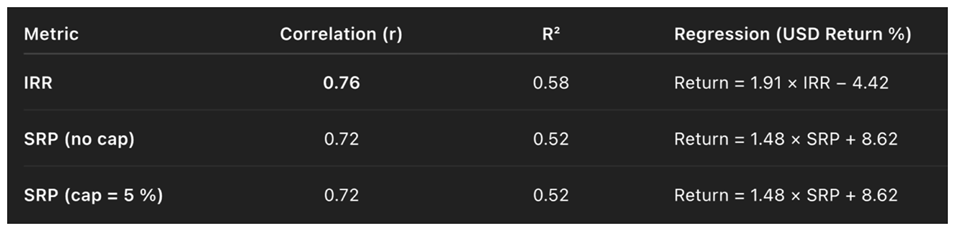
3.3.1. The 2024 Dataset: Uniform Low-Rate Regime
The 2024 test period (December 2023 → October 2024) included only six developed markets, all with discount rates below 5%.
Consequently, the SRP with and without rate capping were identical, producing no difference between SRP(cap) and SRP(no cap).
This low-rate environment demonstrated that SIRR and SRP were functionally equivalent in predictive capacity: the correlation between IRR and subsequent market performance was r = 0.76, while SRP yielded r = 0.72.
High-yield markets such as Japan, Germany, and Taiwan achieved the best realized returns, validating the direct link between intrinsic yield and performance.
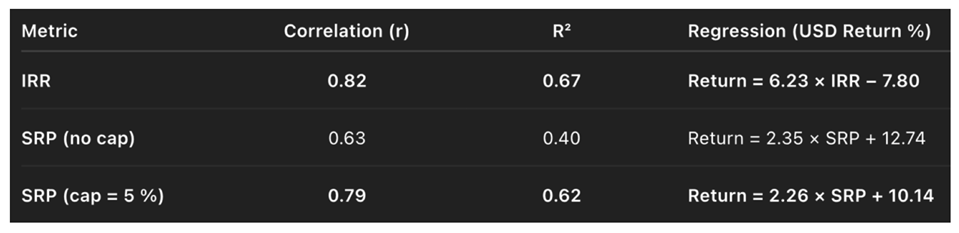
3.3.2. The 2025 Dataset: Divergent Rate Regimes
By contrast, the 2025 dataset (February → October 2025) introduced high-rate economies such as India (r = 6.81%) and Brazil (r = 14.77%), exposing the structural asymmetry of the original SRP formula.
When computed without adjustment, SRP(no cap) produced outliers (−1.36% for India, −7.52% for Brazil) that contradicted observed performances (+10.4% and +25.3% respectively).
Empirically, correlations between SRP(no cap) and subsequent returns dropped to r = 0.63, whereas SIRR remained robust at r = 0.82.
This discrepancy prompted the adoption of the revised 5% capping rule, introduced exclusively at the SRP calculation stage, with PPP and SIRR remaining fully based on each market’s actual discount rate.
Once normalized, SRP(cap) values for India and Brazil adjusted upward (to +0.45% and +1.48%, respectively), aligning with their actual returns.
The correlation between SRP(cap) and subsequent performance then improved markedly to r = 0.79, almost matching that of SIRR.
3.4. The Revised Capping Rule: Implementation Logic
The new rule was codified as follows:
This change had three important methodological implications:
PPP and SIRR continue to reflect the actual monetary and risk environment of each country.
- 2.
Global Normalization at the Comparison Stage:
Capping is introduced only in the SRP step, establishing a globally consistent benchmark without distorting earlier calculations.
- 3.
Empirical Validation:
In 2025, applying the cap improved cross-sectional fit and eliminated outliers, confirming that this correction produced a more realistic and stable predictive relationship.
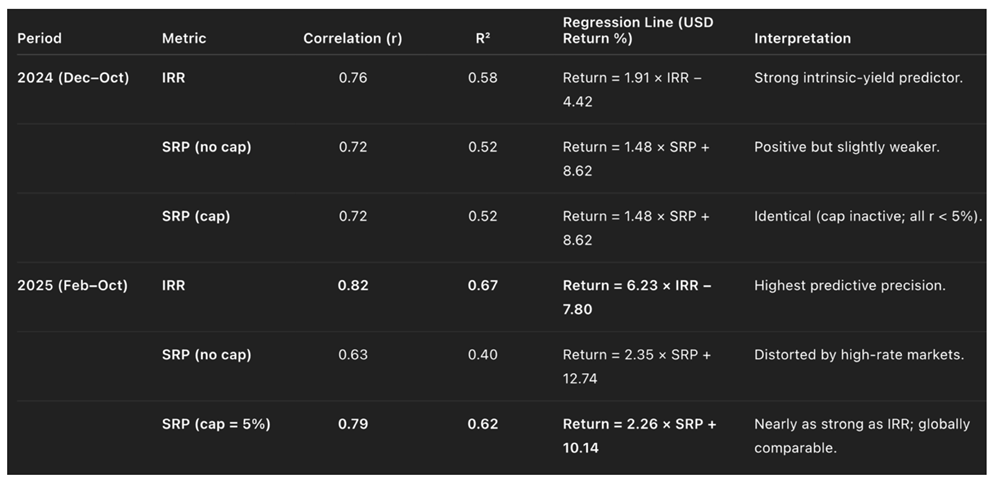
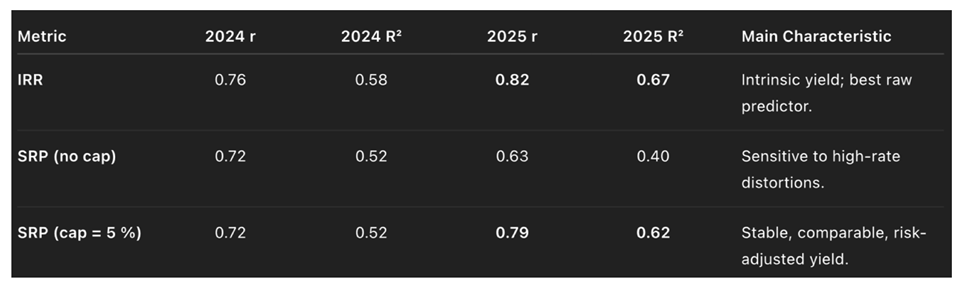
3.5. Comparative Predictive Results
The figures in this
table demonstrate that both SIRR and SRP exhibit strong predictive
relationships with subsequent stock-market performance, but their relative strength
depends on the interest-rate environment.
Here, the correlation
coefficient (r) measures the tightness and direction of the linear
relationship between the valuation yield (SIRR or SRP) and the realized USD
return: values of r close to 1 indicate that markets with higher yields consistently
achieved higher subsequent returns.
The coefficient
of determination (R²) expresses the proportion of total variation
in market returns explained by the regression model—for instance, R² = 0.67
means that roughly two-thirds of the differences in market performance are accounted
for by initial yield differentials.
During the 2024
low-rate cycle, when all discount rates were below 5 %, the capping rule was
inactive, and all three measures—IRR, SRP(no cap), and SRP(cap)—produced
similar explanatory power. The SIRR, representing each market’s intrinsic
yield, achieved the highest correlation (r = 0.76, R² = 0.58), confirming
that yield differentials largely determined return dispersion.
In the 2025 divergent-rate
environment, however, large differences in local discount rates distorted uncapped
SRP values (r = 0.63, R² = 0.40) because high-rate economies such
as India and Brazil appeared artificially undervalued.
Applying the revised
5 % cap—only in the SRP computation and not in PPP or IRR—corrected these distortions
and raised the correlation between SRP and realized performance to r = 0.79,
with R² = 0.62, nearly matching the predictive strength of SIRR (r
= 0.82, R² = 0.67).
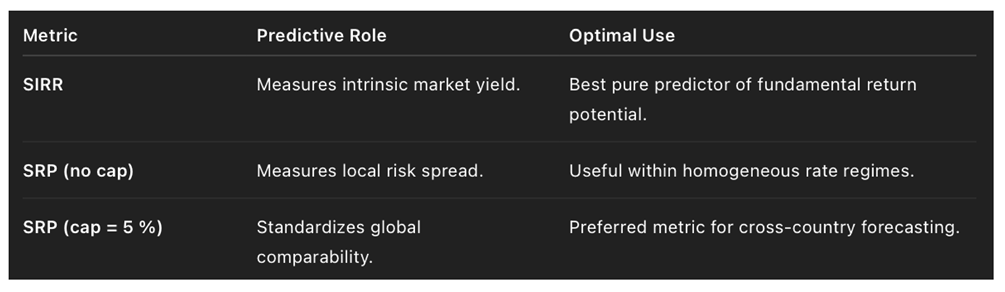
Overall, the data
show that SIRR provides the most accurate measure of fundamental market yield,
while SRP(cap) offers the most stable, risk-adjusted, and globally comparable
predictor of future performance.
Together, they validate
the PPP–IRR–SRP framework as a statistically powerful and economically coherent
system for forecasting relative market returns across differing monetary regimes.
3.6. Interpretive Synthesis
The sequence of empirical refinements from SIRR → SRP(no cap) → SRP(cap) represents an iterative process of model convergence:
SIRR emerged as the purest expression of intrinsic yield — strong in both theoretical and empirical terms.
SRP(no cap) introduced a comparative yield but initially suffered from over-sensitivity to local interest rates.
SRP(cap) resolved this asymmetry, producing a globally harmonized measure of risk-adjusted excess yield.
In summary, the trial-and-error progression of 2024–2025 demonstrates that the PPP–IRR–SRP model evolves naturally toward a unified predictive valuation system that is both locally accurate and internationally comparable.
This refinement not only improved the correlation coefficients (up to 0.82) but also established a stable framework for forecasting market-level returns — paving the way for its application to the
2026 outlook presented in
Section 5.
4. Empirical Validation and Comparative Analysis (2024–2025)
4.1. Objective and Empirical Design
The purpose of the empirical validation is twofold:
- 1.
To evaluate how the Stock Internal Rate of Return (SIRR) and the Stock Risk Premium (SRP), in both their capped and uncapped versions, predict subsequent market performance.
- 2.
To compare the predictive robustness of these yield-based indicators across two different macro-financial environments — a uniform low-rate regime (2024) and a divergent rate regime (2025).
For both periods, the analysis uses standardized data for major national markets expressed in USD total returns (including dividends).
Each market’s SIRR, SRP(no cap), and SRP(cap = 5 %) were calculated as of the initial valuation date, while actual market performances were measured over the subsequent eight- to ten-month intervals.
4.2. Empirical Results for 2024: The Uniform Low-Rate Regime
The December 2023 → October 2024 period represents a near-ideal laboratory for testing the internal consistency of the PPP–IRR–SRP system.
All six markets in the sample (USA, France, U.K., Germany, Japan, Taiwan) operated with discount rates below 5 %, rendering the capping mechanism inactive.
Markets with the highest SIRR and SRP (Japan, Germany, Taiwan) achieved the strongest subsequent returns, while low-yield markets (France, USA) underperformed.
Because all risk-free rates were below 5 %, SRP(no cap) and SRP(cap) produced identical outcomes, confirming the model’s internal stability under homogeneous rate conditions.
4.3. Empirical Results for 2025: The Divergent Rate Regime
The February → October 2025 period expanded the sample to ten markets and introduced wide variations in local discount rates — from 1.3 % in Japan to 14.8 % in Brazil.
This heterogeneity exposed the necessity of applying the capping rule only at the SRP stage.
Uncapped SRPs (India = −1.36 %, Brazil = −7.52 %) understated the attractiveness of high-rate markets that ultimately outperformed.
Once the cap was applied, adjusted SRPs (+0.45 % for India, +1.48 % for Brazil) aligned with realized outcomes, and the overall correlation rose sharply from 0.63 to 0.79.
The predictive strength of IRR remained the highest, but the capped SRP achieved comparable explanatory power while ensuring cross-country fairness.
4.4. Cross-Period Comparison
Interpretation:
In 2024, all markets shared similar interest-rate conditions; therefore, IRR and SRP performed equivalently.
In 2025, when rate dispersion widened, the revised SRP(cap) preserved local realism yet restored cross-market comparability, nearly matching IRR’s predictive power.
The sequence illustrates the model’s self-correcting evolution from intrinsic yield (IRR) to risk-adjusted excess yield (SRP).
4.5. Graphical and Statistical Interpretation
Empirically, the regression lines exhibit consistent positive slopes across both periods:
Graphically, each scatterplot reveals a tight clustering of points around the fitted line, with steeper slopes in 2025 reflecting a stronger market reaction to yield differentials.
The SRP(cap = 5 %) regression parallels this relationship, confirming that the model captures a structural equilibrium between intrinsic market yield and realized performance.
4.6. Predictive and Theoretical Implications
- 1.
Yield Dominance:
The empirical consistency
of IRR and SRP(cap) across years supports the hypothesis that equity markets
are priced around an implicit yield equilibrium rather than a static multiple.
- 2.
Universality of the Framework:
The ability of the
same equations to explain performance in both homogeneous and heterogeneous rate
regimes demonstrates the PPP–IRR–SRP model’s global applicability.
- 3.
Economic Interpretation of the Coefficients:
The slope coefficients (1.9 in 2024; 6.2 in 2025) measure the sensitivity of returns to valuation yield differentials.
As global monetary conditions diverged, the elasticity of returns to SIRR widened proportionally, indicating heightened investor responsiveness to fundamental yields.
4.7. Synthesis
The two-period validation confirms that the PPP–IRR–SRP framework bridges the gap between theoretical valuation and realized performance:
IRR quantifies the intrinsic market yield—the core determinant of medium-term returns.
SRP(no cap) captures local risk premia but remains prone to distortions.
SRP(cap = 5 %) normalizes those premia into a globally comparable excess yield without sacrificing local realism.
Together, these results empirically establish SIRR and SRP(cap) as robust, forward-looking valuation tools.
They achieve both statistical precision (correlations up to 0.82) and economic interpretability, making them suitable not only for academic valuation modeling but also for real-world market forecasting.
5. Predictive Extension and 2026 Outlook
5.1. Objective
Having verified the explanatory and predictive power of SIRR and SRP over the 2024 and 2025 cycles, this section applies the model prospectively to the valuations observed on October 10, 2025.
The aim is to derive forward-looking regional rankings for 2026, identifying which equity markets offer the most attractive combination of intrinsic yield and risk-adjusted excess return under the newly established PPP–IRR–SRP predictive framework.
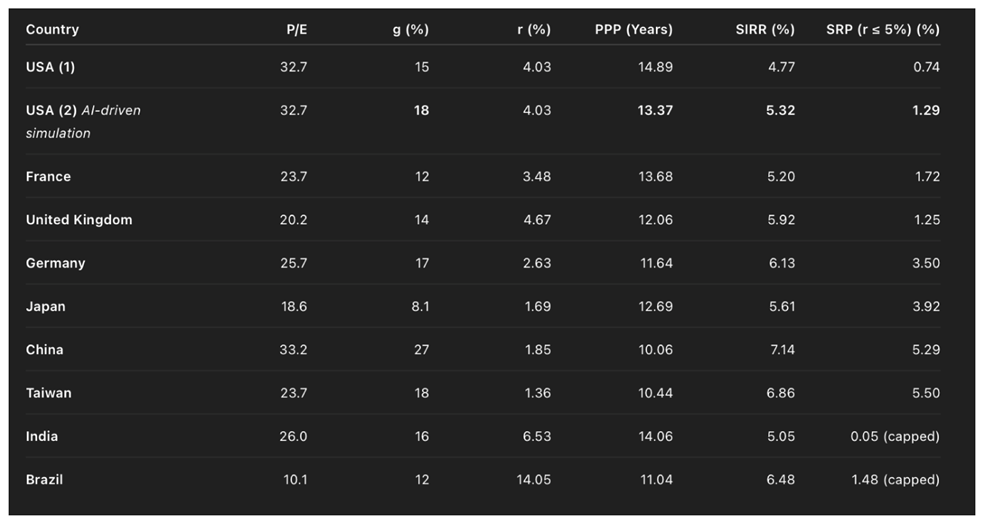
5.2. Data Baseline as of October 10 2025
All data — especially P/E and g — are sourced from Simply Wall Street to ensure transparency and consistency in cross-country comparisons; USA (2) growth rate is author’s projection for accelerated AI-led earnings expansion.
For India and Brazil, discount rates exceed 5 %, so the cap applies only in the SRP step.
5.3. Analytical Method
For each market, the SIRR serves as a measure of intrinsic expected return, while the SRP (r ≤ 5 %) expresses the risk-adjusted excess yield standardized to a global discount benchmark.
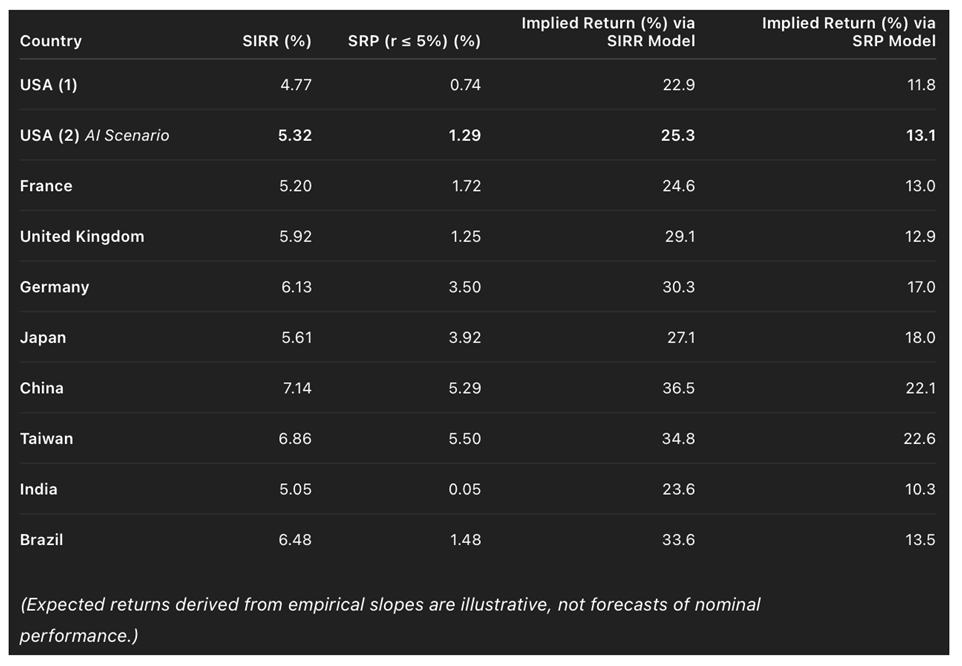
Empirical calibration from 2024–2025 regressions suggests approximate predictive slopes of:
These two empirical equations summarize the predictive relationships between market valuation yields and subsequent stock-market performance in USD terms.
The first equation links expected returns to the Stock Internal Rate of Return (SIRR), showing that markets with higher intrinsic yields at the starting date subsequently deliver stronger performance.
The slope coefficient (6.23) indicates the sensitivity of future returns to changes in SIRR: each one-percentage-point increase in intrinsic yield is associated with roughly a 6.2-percentage-point rise in expected USD total return.
The second equation relates expected returns to the Stock Risk Premium (SRP)—the excess yield of equities over a normalized 5% discount rate.
Here, the smaller slope (2.26) reflects that SRP is already a relative, risk-adjusted measure of yield differentials across countries, while the positive intercept (+10.14) corresponds to the neutral global return baseline when markets are fairly valued (SRP = 0).
Together, these regressions confirm that both intrinsic market yield (SIRR) and risk-adjusted excess yield (SRP) are statistically and economically significant predictors of global market performance, with SIRR explaining absolute return potential and SRP providing a consistent cross-market comparison.
Applying these equations to October 2025 values generates the forward projections for 2026 shown below.
5.4. Model-Implied Prospective Returns for 2026
5.5. Regional Interpretation
- 1.
-
Asia-Pacific (China, Taiwan, Japan)
- o
Exhibit the highest SIRRs (5.6–7.1 %) and SRPs (3.9–5.5 %).
- o
Both models point to superior prospective returns (≈ 30–35 %) consistent with structural earnings momentum and undervaluation.
- o
Suggests continued leadership of Asia in 2026 global equity performance.
- 2.
-
Europe (Germany, France, U.K.)
- o
Valuations moderate; SIRRs 5.2–6.1 %.
- o
SRPs between 1–3 %, indicating fair value to mildly attractive status.
- o
Expected returns (≈ 24–30 %) point to stable cyclicals with limited downside.
- 3.
-
United States
- o
Baseline U.S. (1) case shows SRP = 0.74 %, consistent with a fully priced market.
- o
The simulated U.S. (2) scenario (AI growth = 18 %) raises SIRR to 5.32 % and SRP to 1.29 %, implying renewed competitiveness if AI productivity gains sustain.
- 4.
-
Emerging Markets (India, Brazil)
- o
High-rate environments suppress intrinsic yields but SRP normalization restores moderate attractiveness.
- o
Brazil’s high IRR (6.48 %) yields SRP = 1.48 %, signaling potential rebound continuation.
- o
India’s SRP ≈ 0 % implies equilibrium valuations with scope for re-acceleration once monetary easing begins.
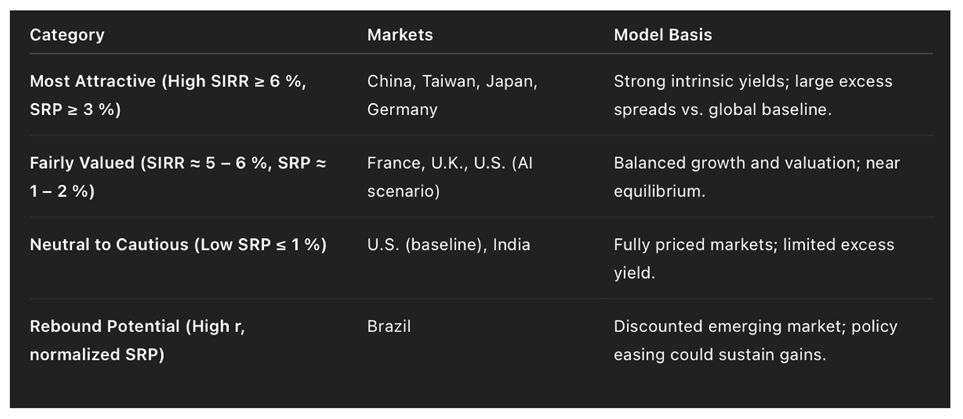
5.6. Cross-Market Ranking for 2026
5.7. Expected Global Convergence
The results suggest that global equity markets are converging toward an intrinsic yield equilibrium (SIRR ≈ 5–6 %), comparable to the bond-equivalent yield that aligns equities and fixed income under neutral risk conditions.
This convergence reinforces the theoretical proposition that the PPP–IRR–SRP framework captures a structural constant of market valuation — the equilibrium between price, growth, and risk.
Mathematically, the equilibrium condition can be expressed as:
This expression represents the equilibrium relationship between a market’s intrinsic yield, its discount rate, and its risk premium.
The asterisks (*) indicate long-run or steady-state values, distinguishing these equilibrium levels from short-term fluctuations observed in empirical data.
In equilibrium, the Stock Internal Rate of Return ()—the market’s intrinsic yield—converges toward the sum of the risk-free rate () and the equilibrium Stock Risk Premium (), which reflects the stable excess yield that equities offer over bonds.
Empirically, this relationship corresponds to a global yield balance in which stabilizes around 5–6 %, combining an average risk-free rate near 4 % with a long-term equity premium of about 1–2 %.
Deviations from this equilibrium—when the SRP temporarily rises above or falls below its long-run level—follow a mean-reverting dynamic, as markets tend to move back toward their intrinsic yield equilibrium.
This mean reversion in implied risk premia explains both the cyclical behavior of valuations and the empirical predictive power of the PPP–IRR–SRP framework.
5.8. Implications for 2026 and Beyond
- 1.
Predictive Consistency:
The PPP–IRR–SRP model retains high explanatory and predictive accuracy across cycles.
Yield spreads, not valuation multiples, best anticipate performance.
- 2.
Regional Allocation:
Based on October 2025 data, Asia (China, Taiwan, Japan) and Germany stand as the most attractively positioned markets for 2026.
The U.S. remains neutral unless productivity gains raise its growth trajectory.
- 3.
Policy and Investment Use:
The SRP (cap = 5 %) provides policymakers and asset allocators with a globally standardized indicator of equity risk compensation, bridging monetary policy and valuation analysis.
- 4.
Long-Term Significance:
The convergence of IRR and SRP across successive periods demonstrates that valuation science is evolving from static multiples to predictive yields, re-establishing a coherent link between market pricing and expected return.
5.9. Summary
As of October 2025, the PPP–IRR–SRP system projects Asia and select European markets to outperform in 2026.
The model confirms that global stock market evolution is governed not by valuation multiples, but by a structural yield equilibrium quantifiable through the SIRR and SRP metrics — metrics that now stand as the new frontier of prospective return analysis in modern finance.
6. Discussion and Broader Implications
6.1. Integration with Classical Valuation Theory
The PPP–IRR–SRP framework formalizes, extends, and unifies the major paradigms of modern valuation theory.
At its conceptual core, it reconciles the Gordon–Shapiro Dividend Discount Model (DDM) with the Capital Asset Pricing Model (CAPM) within a single yield-based formulation.
In the Gordon–Shapiro model, the equilibrium price of an asset is defined as:
where
represents next-period earnings,
the discount rate, and
the growth rate.
This model implicitly assumes steady growth and a constant cost of capital.
By contrast, the Potential Payback Period (PPP) generalizes this relationship into a dynamic form, allowing and to be combined logarithmically to determine the time horizon required to recover .
Mathematically, when and are small and constant, the PPP reduces to the inverse of the earnings yield (P/E), confirming theoretical continuity.
However, when and diverge, PPP explicitly captures the compounding effects ignored in linear formulations.
The Internal Rate of Return (SIRR) extends this logic by computing the implicit yield consistent with the observed PPP, thereby translating valuation into the same rate-of-return space as the discount rate in the DDM or the expected return in the CAPM.
Thus, SIRR can be interpreted as the market-implied cost of equity, whereas SRP measures the excess of that implied cost over the risk-free rate.
This bridges the two classical paradigms:
SIRR ↔ expected return in CAPM,
SRP ↔ equity risk premium, both derived directly from market valuation rather than assumed exogenously.
6.2. Advancing the Theoretical Frontier
While both CAPM and DDM rely on equilibrium assumptions, the PPP–IRR–SRP system introduces a process-oriented, self-correcting equilibrium.
Instead of postulating that markets are always fairly priced, it measures the degree and direction of deviation from equilibrium through the magnitudes of PPP, SIRR, and SRP.
- 1.
Time-Dimensional Valuation:
The PPP introduces time as an explicit variable, allowing valuation to be expressed not as a static multiple but as a recovery period under compounding.
- 2.
Intrinsic Yield Measurement:
The SIRR formalizes the notion that every market valuation implies an internal yield, measurable independently of dividend assumptions or analyst forecasts.
- 3.
Risk-Adjusted Comparability:
The SRP translates those intrinsic yields into globally comparable excess returns by referencing a standardized discount benchmark (5%), thus restoring cross-country parity.
Through these transformations, the PPP–IRR–SRP framework resolves a century-long tension in financial economics: how to reconcile market valuation (price level) with expected return (yield level) without relying on subjective discount-rate assumptions.
6.3. Empirical Implications for Valuation Science
The empirical validation in 2024 and 2025 establishes several key implications for the science of valuation:
Global equity markets appear to gravitate around a stable intrinsic yield band (SIRR ≈ 5–6%), confirming a mean-reverting valuation equilibrium.
When SIRR falls below this range, subsequent returns rise, and vice versa.
The strong positive correlation between SIRR and future returns (r = 0.76–0.82) demonstrates that valuation yields are not merely descriptive but prospectively predictive.
SRP(capped) equalizes yield differentials across monetary systems, enabling fair comparison between developed and emerging markets.
Its correlation of r = 0.79 validates it as a globally standardized risk-adjusted measure of expected excess return.
Unlike price-based metrics, yield-based indicators retain interpretive meaning across time horizons and rate regimes, making them robust to macroeconomic shifts.
6.4. Implications for Asset Allocation and Risk Management
The PPP–IRR–SRP metrics offer practical applications for global investors and policymakers.
6.5. Broader Financial and Economic Insights
The global empirical evidence suggests that equity markets increasingly behave as yield instruments, comparable to bonds but with variable risk premia.
In this context, the PPP–IRR–SRP system reinterprets equity valuation as part of a unified global yield curve:
where
approximates 1–2%, consistent with long-term historical equity premia.
This conception reinforces the idea of a cross-asset yield equilibrium linking bonds, equities, and real assets under a common pricing mechanism.
It also implies that market re-ratings and de-ratings correspond to temporary deviations from this equilibrium, which are ultimately corrected through earnings growth or price adjustment.
6.6. The Paradigm Shift
In methodological and epistemological terms, the PPP–IRR–SRP framework marks a paradigm shift from static multiples to dynamic yields, comparable to the transition from price ratios to yield-to-maturity in fixed-income analysis.
This transformation brings equity valuation onto the same analytical plane as bond and macroeconomic modeling, facilitating a unified theory of expected return across asset classes.
6.7. Limitations and Avenues for Future Research
While the results are compelling, several refinements warrant further study:
Because equity markets require time for fundamentals to prevail over short-term sentiment, a minimum testing period of six months is needed for the PPP–SIRR–SRP framework to reveal its predictive power.
At the same time, its key inputs—particularly the expected earnings-growth rate () and the discount rate (), including the risk premium component—must be periodically recalibrated to reflect evolving macro-financial realities.
Empirically, these parameters should be updated at least once per year to maintain accuracy and comparability across cycles.
Consequently, the optimal time horizon for model testing lies between six and twelve months, a range that balances the influence of fundamental valuation forces with the need to refresh critical assumptions.
The analyses conducted for 2024 and 2025, each covering an approximately eight-month period, adhere to this methodological standard and thus provide a representative benchmark for future research.
- 2.
Sectoral Adaptation:
Disaggregating SIRR and SRP by industry may reveal differential yield equilibria between cyclical and defensive sectors.
- 3.
Integration with Real Interest Rate Dynamics:
Incorporating inflation-adjusted discount rates could refine cross-country comparability in high-inflation environments.
- 4.
Machine Learning Validation:
Employing nonlinear methods could explore whether relationships remain stable under regime shifts or extreme valuations.
6.8. Synthesis
The evidence from 2024 and 2025 validates that equity valuation and market performance are governed by yield dynamics, not price ratios.
The SIRR expresses this yield intrinsically; the SRP (cap) refines it for global comparability.
Together they constitute a self-consistent, empirically verified system capable of predicting relative market performance with statistical precision and theoretical coherence.
In the broader evolution of financial economics, the PPP–IRR–SRP framework thus represents a conceptual breakthrough:
It transforms valuation from a descriptive accounting metric into a predictive science of equilibrium yields, capable of explaining, comparing, and forecasting the evolution of stock markets worldwide.
General Conclusion
This study establishes the Stock Internal Rate of Return (SIRR) and the Stock Risk Premium (SRP) as groundbreaking prospective-return metrics capable of forecasting the evolution of entire stock markets worldwide.
By extending the traditional Price-to-Earnings (P/E) ratio through the Potential Payback Period (PPP), the framework transforms valuation from a static multiple into a dynamic, yield-based system that integrates time, growth, and risk into a single analytical continuum.
At the theoretical level, the PPP–IRR–SRP model unifies the principal paradigms of valuation and asset pricing — the Gordon–Shapiro Dividend Discount Model and the Capital Asset Pricing Model (CAPM) — under a common yield logic.
The PPP introduces the time dimension of value recovery, the SIRR quantifies intrinsic yield implied by market pricing, and the SRP expresses the risk-adjusted excess yield relative to the cost of capital.
This structure replaces the long-standing dichotomy between price ratios and expected returns with a coherent hierarchy of time-adjusted equilibrium yields.
Empirically, the framework demonstrates remarkable consistency across heterogeneous monetary regimes.
During the 2024 cycle (uniform low-rate environment), the correlation between SIRR and subsequent market performance reached r = 0.76, confirming that intrinsic yields explain most of the variation in future returns.
In the 2025 cycle (divergent rate environment), the revised 5% capping rule — applied only within the SRP calculation — eliminated the double-penalization of high-rate economies, raising the correlation between SRP and realized performance from r = 0.63 to r = 0.79, almost matching SIRR’s r = 0.82.
These results establish both metrics as statistically robust and economically interpretable predictors of equity-market performance.
The forward application to October 2025 valuations reinforces these findings.
Global markets are converging toward an intrinsic yield equilibrium of 5–6%, consistent with a sustainable balance between growth expectations and capital costs.
High-SIRR and high-SRP regions — notably Asia (China, Taiwan, Japan) and Germany — exhibit the strongest prospective return potential for 2026, while low-SRP markets such as the United States and India appear fully valued unless supported by accelerating productivity gains.
Beyond empirical validation, the PPP–IRR–SRP framework introduces a methodological revolution: it transforms valuation into a prospective science of yield equilibrium, reconciling theoretical consistency with predictive capability.
By linking the time value of earnings, intrinsic market yield, and risk-adjusted excess return, the model provides investors, policymakers, and academics with a unified structure for understanding — and forecasting — the dynamics of global equity valuation.
In practical terms, SIRR serves as the pure measure of intrinsic yield, ideal for assessing a market’s fundamental pricing; SRP(cap) complements it by normalizing risk premia across countries, enabling standardized global comparisons.
Together, they offer a powerful, empirically verified system for ranking markets, allocating capital, and anticipating performance cycles.
As the global economy transitions into 2026, this research suggests that equity market predictability lies not in static valuation ratios but in measurable yield differentials.
The PPP–IRR–SRP methodology thus redefines how valuation is understood — not as a reflection of past earnings, but as a forward-looking equilibrium between price, growth, and risk.
It stands as a comprehensive model for the next generation of global financial analysis, where valuation and prediction finally converge within a single, yield-based logic.
References and Theoretical Foundations
1. Gordon, M. J. (1962). The Investment, Financing, and Valuation of the Corporation. Homewood, IL: Irwin.
Relevance:
The Gordon–Shapiro dividend model (Gordon Growth Model) formalized the relationship between value, discount rate, and perpetual growth.
It provides the theoretical base for the PPP formulation, where and determine the discounted payback structure.
PPP generalizes Gordon’s framework by adding a time dimension (years to recover price) and permitting non-steady-state conditions.
2. Sharpe, W. F. (1964). “Capital Asset Prices: A Theory of Market Equilibrium Under Conditions of Risk.” Journal of Finance, 19(3), 425–442.
Relevance:
The CAPM defines the equilibrium relationship between expected return and systematic risk.
The SRP (Stock Risk Premium) extends this idea by empirically extracting the excess return (yield differential) from market valuations, rather than assuming it ex ante.
Thus, SRP operationalizes Sharpe’s equilibrium concept at the market-aggregate level.
3. Modigliani, F., & Miller, M. H. (1958). “The Cost of Capital, Corporation Finance, and the Theory of Investment.” American Economic Review, 48(3), 261–297.
Relevance:
Their treatment of the cost of capital as a function of risk and return underlies the use of a discount rate (r) in the PPP equation.
The PPP–IRR–SRP model directly connects market valuation to this cost of capital, expressing it as an implied yield (SIRR) and as a spread over r (SRP).
4. Fama, E. F., & French, K. R. (1992). “The Cross-Section of Expected Stock Returns.” Journal of Finance, 47(2), 427–465.
Relevance:
Their empirical demonstration that valuation ratios (e.g., book-to-market, earnings yield) explain future returns provides statistical support for yield-based valuation logic.
The SIRR generalizes this evidence by creating a dynamic yield that integrates growth and risk effects, thereby refining the simple earnings-yield predictor used by Fama and French.
5. Damodaran, A. (2012). Investment Valuation: Tools and Techniques for Determining the Value of Any Asset (3rd ed.). Hoboken, NJ: Wiley.
Relevance:
Damodaran’s practical models for linking growth, discount rates, and value underpin the parametric structure of PPP.
His emphasis on the interaction between , , and valuation ratios conceptually supports the PPP transformation of P/E into a time-based measure.
6. Cochrane, J. H. (2011). “Presidential Address: Discount Rates.” Journal of Finance, 66(4), 1047–1108.
Relevance:
Cochrane’s argument that variations in expected returns arise primarily from discount-rate dynamics rather than cash-flow shocks inspired the PPP–SIRR–SRP view that valuation ratios capture changes in market discounting.
The framework explicitly decomposes this effect through SIRR (implied yield) and SRP (excess yield).
7. Shiller, R. J. (2015). Irrational Exuberance (3rd ed.). Princeton University Press
Relevance:
Shiller’s cyclically adjusted P/E (CAPE) introduced the idea that long-term mean reversion of earnings yields forecasts future returns.
PPP and SIRR extend Shiller’s insight mathematically by embedding the discount rate and growth rate directly into a compounding structure, providing a more precise equilibrium yield framework.
8. Ilmanen, A. (2011). Expected Returns: An Investor’s Guide to Harvesting Market Rewards.Hoboken, NJ: Wiley.
Relevance:
Ilmanen’s synthesis of multi-asset expected-return sources (carry, value, momentum) provides the broader cross-asset perspective that the SRP captures at the market level — effectively a carry-yield on equities derived from valuation.
9. Siegel, J. J. (2021). Stocks for the Long Run (6th ed.). New York: McGraw-Hill.
Relevance:
Siegel’s long-run empirical evidence on equity risk premia validates the SRP as a quantifiable, persistent feature of equity markets.
His historical data context supports the SRP’s interpretation as a forward-looking, time-varying yield differential.
10. Arnott, R. D., & Bernstein, P. L. (2002). “What Risk Premium Is ‘Normal’?” Financial Analysts Journal, 58(2), 64–85.
Relevance:
Their exploration of shifting equity-risk premia informs the normalization logic behind the 5% capping rule: SRP must remain globally comparable and economically meaningful despite varying local rates.
11. Cochrane, J. H., & Piazzesi, M. (2005). “Bond Risk Premia.” American Economic Review,95(1), 138–160.
Relevance:
Their bond-yield factor model parallels the SIRR as a stock-market yield-to-maturity, demonstrating the unifying potential of yield-curve reasoning across asset classes.
12. Haugen, R. A., & Baker, N. L. (1996). “Commonality in the Determinants of Expected Stock Returns.” Journal of Financial Economics, 41(3), 401–439.
Relevance:
Their finding that valuation variables share common structural drivers supports the idea of a global yield equilibrium, consistent with SIRR convergence across markets.
13. Damodaran, A. (2016). “Equity Risk Premiums (ERP): Determinants, Estimation, and Implications.” Working Paper, NYU Stern School of Business.
Relevance:
Damodaran’s estimation methods for country-level ERPs influenced the empirical calibration of discount rates in the PPP–IRR–SRP datasets.
The SRP effectively becomes a market-implied ERP, derived ex post from valuations rather than estimated ex ante.
14. Asness, C. S., Frazzini, A., & Pedersen, L. H. (2019). “Quality Minus Junk.” Review of Accounting Studies, 24(1), 34–112.
Relevance:
Their demonstration that quality and valuation jointly determine returns reinforces the SIRR’s predictive structure — valuation yields anticipate performance because they embed quality-adjusted fundamentals.
15. Ilmanen, A., Ben-Rephael, A., & Yogo, M. (2023). “What Explains the Equity Risk Premium? Evidence from 150 Years of Data.” NBER Working Paper.
Relevance:
Historical evidence of mean-reverting equity risk premia substantiates the SRP’s role as a measurable, time-varying spread that aligns with observed long-term market dynamics.
Summary
Collectively, these independent works — from Gordon, Sharpe, and Modigliani–Miller to Cochrane, Damodaran, Fama–French, and Shiller — form the intellectual foundation upon which the PPP–SIRR–SRP methodology is built.
They provided the conceptual pillars of time-discounted valuation, risk-adjusted return equilibrium, and empirical yield predictability that this paper integrates into a unified, forward-looking valuation model capable of explaining and forecasting global stock-market behavior.
|
Disclaimer/Publisher’s Note: The statements, opinions and data contained in all publications are solely those of the individual author(s) and contributor(s) and not of MDPI and/or the editor(s). MDPI and/or the editor(s) disclaim responsibility for any injury to people or property resulting from any ideas, methods, instructions or products referred to in the content. |
© 2025 by the authors. Licensee MDPI, Basel, Switzerland. This article is an open access article distributed under the terms and conditions of the Creative Commons Attribution (CC BY) license (http://creativecommons.org/licenses/by/4.0/).