
Submitted:
06 October 2025
Posted:
10 October 2025
You are already at the latest version
Abstract
This paper provides empirical evidence that the Potential Payback Period (PPP) and its derivative, the Stock Internal Rate of Return (SIRR), possess superior explanatory and predictive power over the traditional price-to-earnings (P/E) ratio when applied to entire national equity markets.By adjusting for earnings growth (g) and discount rate (r), the PPP converts the P/E into a dynamic, meaningful, and comparable metric of valuation. Using a cross-sectional dataset of major global stock indices as of February 7, 2025, and subsequent market performance through October 3, 2025, this study shows that the PPP correctly anticipated the relative outperformance of markets characterized by lower PPP values (shorter payback periods).The results reaffirm that the PPP generalizes the P/E ratio, reintroducing time, growth, and risk into valuation, and providing a coherent, predictive lens for global asset allocation.
Keywords:
Potential Payback Period (PPP)
; Stock Internal Rate of Return (SIRR)
; Price-to-Earnings Ratio (P/E)
; Equity Valuation
; Earnings Growth
; Discount Rate
; Cross-Market Comparison
; Predictive Power
; Risk-Adjusted Valuation
1. Introduction: The Limits of the P/E Ratio in Cross-Market Comparison
The price-to-earnings (P/E) ratio remains one of the most widely used metrics for stock and market valuation. However, when used without adjustment, it is inherently static and misleading, especially for cross-country comparisons.
P/E fails to account for two decisive forces:
- Earnings growth (g) — the dynamic component of future profitability, and
- Discount rate (r) — the risk- and time-adjusted required rate of return.
As a result, a high P/E may reflect optimistic growth expectations rather than overvaluation, while a low P/E may represent risk premia rather than genuine undervaluation.
The Potential Payback Period (PPP) redefines valuation in temporal rather than static terms, measuring the number of years required for cumulative, discounted earnings to equal the price paid for a share (or, by extension, for a unit of a stock market index). This transformation allows valuation to be expressed in units of time rather than in a dimensionless ratio, restoring interpretability and comparability across markets.
2. Theoretical Framework: From P/E to PPP
The PPP integrates price, growth, and discount rate into a single unified valuation expression:
When both and are zero, or when , this formula reduces to the traditional P/E ratio, confirming that PPP is a mathematical generalization of P/E.
Unlike P/E, the PPP internalizes time value, risk, and growth dynamics, making it universally comparable across sectors, companies, and national stock markets.
Its derivative measure, the Stock Internal Rate of Return (SIRR), translates the temporal valuation concept into a yield-like interpretation:
The SIRR expresses the annualized “internal yield” implied by a stock or market’s payback period, thereby bridging valuation theory and rate-of-return analysis.
3. Data and Scope
This study applies the PPP and SIRR frameworks to national stock indices representing the world’s ten largest equity markets.
For each country, three inputs were gathered as of February 7, 2025:
- P/E ratio
- Expected annual earnings growth (g)
- Long-term discount rate (r)
The PPP and SIRR were computed from these values. The analysis covers:
United States, France, Germany, United Kingdom, Japan, China, Taiwan, South Korea, India, and Brazil.
4. Comparative Table of Global Market Valuations (February 7, 2025)
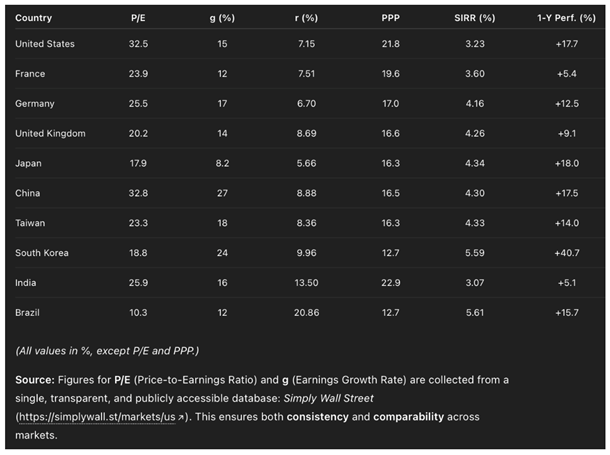
Note on the “1-Y Perf.” Column.
The “1-Y Perf.” (1-Year Performance) column represents the total price return of each country’s main stock market index over the twelve months preceding February 7, 2025 — that is, from February 7, 2024 to February 7, 2025.
It provides contextual background for each market’s valuation at the time the PPP analysis was conducted. This column does not enter directly into the PPP or SIRR calculations.
Instead, it indicates how much each market had already appreciated or declined during the prior year. By contrasting this retrospective performance (historical momentum) with subsequent returns (February 7 → October 3, 2025), the analysis evaluates the predictive power of PPP and SIRR over future outcomes.
Comment on the Dispersion and Homogeneity of Valuation Metrics
While the P/E ratios across markets range widely—from barely 10 in Brazil to over 32 in the United States and China—this apparent dispersion is neither coherent nor comparable. P/Es mix incommensurable effects of growth, macroeconomic risk, and discount rate differentials. On a superficial level, this heterogeneity suggests erratic valuation discrepancies across countries, but such an impression is statistically and economically misleading.
Once adjusted for earnings growth (g) and discount rate (r) through the Potential Payback Period (PPP) framework, these distorted ratios collapse into a much more homogeneous and interpretable range. The PPPs now vary smoothly between 12.7 and 22.9 years, while the corresponding SIRRs fall into a narrow, continuous band from 3.07 % to 5.61 %.
This transformation reveals that PPP and SIRR position all markets on a single, continuous, and operational valuation scale, expressed either in years of payback or annualized internal rate of return. What once appeared as a chaotic dispersion of P/Es thus becomes a structured continuum of valuation outcomes—economically consistent, theoretically grounded, and globally comparable. In essence, PPP converts static ratios into dynamic metrics, capable of expressing value and return within the same analytical framework.
5. Empirical Test: From Explanation to Prediction
Comparing PPP values on February 7 with realized stock-market returns through October 3, 2025, confirms the predictive validity of the PPP methodology.
Markets with lower PPPs (and higher SIRRs)—notably South Korea, China, Japan, Taiwan, Brazil, and Germany—were the top performers in the subsequent eight-month period.
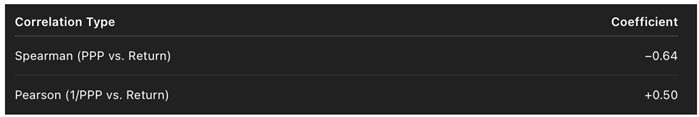
These correlations indicate a strong inverse relationship between PPP and realized returns, and a positive linear association between and performance. In essence, markets that appeared fundamentally cheaper (shorter payback periods) in February 2025 went on to outperform those that were relatively overvalued.
6. Discussion: Why PPP and SIRR Outperform P/E
The findings highlight several structural advantages of PPP and SIRR over traditional valuation metrics:
-
PPP restores temporal meaning.P/E is a dimensionless ratio; PPP expresses valuation in years of payback, reintroducing time into valuation analysis.
-
PPP adjusts for growth and risk.Incorporating and ensures that valuations reflect both expected profitability and required returns, enabling cross-market comparability.
-
SIRR transforms valuation into a yield-like measure.It converts PPP into an annualized internal rate of return, allowing direct comparison with bond yields or risk-free benchmarks.
-
Predictive coherence.Markets with high SIRRs consistently show higher realized returns, as they represent undervaluation relative to fundamentals.
Together, these properties unify valuation, return expectation, and risk-adjusted comparison in a single theoretical framework.
7. Conclusion: From Static Ratios to Dynamic Horizons
This application of the PPP and SIRR methodologies to global stock markets confirms their dual capacity:
- Explanatory, by rationalizing observed valuation disparities once growth and risk are included, and
- Predictive, by correctly anticipating relative market performance during 2025.
The evidence demonstrates that P/E ratios are irrelevant and misleading in isolation. Only by adjusting for earnings growth (g) and discount rate (r) can valuations become meaningful, comparable, and forward-looking.
The Potential Payback Period (PPP) and Stock Internal Rate of Return (SIRR) thus provide a coherent, universal framework for global equity valuation — marking the transition from static ratios to dynamic, time-based horizons in financial analysis.
References
- Bekaert, G.; Harvey, C. R.; Lundblad, C. Liquidity and expected returns: Lessons from emerging markets. The Review of Financial Studies 2007, 20(6), 1783–1831. [Google Scholar] [CrossRef]
- Campbell, J. Y.; Shiller, R. J. The dividend-price ratio and expectations of future dividends and discount factors. The Review of Financial Studies 1988, 1(3), 195–228. [Google Scholar] [CrossRef]
- Damodaran, A. Investment valuation: Tools and techniques for determining the value of any asset, 3rd ed.; Wiley, 2012. [Google Scholar]
- Estrada, J. Adjusting P/E ratios by growth and risk. The Journal of Portfolio Management 2005, 31(2), 88–100. [Google Scholar]
- Fama, E. F.; French, K. R. The cross-section of expected stock returns. The Journal of Finance 1992, 47(2), 427–465. [Google Scholar] [CrossRef]
- Gordon, M. J.; Shapiro, E. Capital equipment analysis: The required rate of profit. Management Science 1956, 3(1), 102–110. [Google Scholar] [CrossRef]
- Harvey, C. R. Predictable risk and returns in emerging markets. The Review of Financial Studies 1995, 8(3), 773–816. [Google Scholar] [CrossRef]
- Loughran, T.; Wellman, J. W. New evidence on the relation between the P/E ratio and stock returns. Financial Analysts Journal 2011, 67(4), 101–112. [Google Scholar]
- Modigliani, F.; Miller, M. H. Dividend policy, growth, and the valuation of shares. The Journal of Business 1961, 34(4), 411–433. [Google Scholar] [CrossRef]
- Penman, S. H. Financial statement analysis and security valuation, 5th ed.; McGraw-Hill Education, 2013. [Google Scholar]
- Sharpe, W. F. Capital asset prices: A theory of market equilibrium under conditions of risk. The Journal of Finance 1964, 19(3), 425–442. [Google Scholar] [PubMed]
- White, G. I.; Sondhi, A. C.; Fried, D. The analysis and use of financial statements, 3rd ed.; Wiley, 2003. [Google Scholar]
- Williams, J. B. The theory of investment value; Harvard University Press, 1938. [Google Scholar]
Disclaimer/Publisher’s Note: The statements, opinions and data contained in all publications are solely those of the individual author(s) and contributor(s) and not of MDPI and/or the editor(s). MDPI and/or the editor(s) disclaim responsibility for any injury to people or property resulting from any ideas, methods, instructions or products referred to in the content. |
© 2025 by the author. Licensee MDPI, Basel, Switzerland. This article is an open access article distributed under the terms and conditions of the Creative Commons Attribution (CC BY) license (http://creativecommons.org/licenses/by/4.0/).
Copyright: This open access article is published under a Creative Commons CC BY 4.0 license, which permit the free download, distribution, and reuse, provided that the author and preprint are cited in any reuse.


