
Submitted:
09 October 2025
Posted:
09 October 2025
You are already at the latest version
Abstract
This study applies the Potential Payback Period (PPP) framework and its derivative measures—the Stock Internal Rate of Return (SIRR) and the Stock Risk Premium (SRP)—to evaluate and predict the behavior of ten major national stock markets as of February 7, 2025. By extending the PPP methodology—originally developed for individual equities—to aggregate market indices, the analysis treats entire national markets as composite “stocks.”Using standardized inputs for each country’s P/E ratio, expected earnings growth rate (g), and discount rate (r), the study computes PPP, SIRR, and SRP values to construct a cross-market valuation hierarchy. These ex-ante estimates are then compared with realized eight-month performance (February–October 2025).Results show a strong positive correlation (ρ ≈ +0.86) between initial SRP levels and subsequent realized returns, confirming the framework’s predictive validity when applied to entire markets. The single major outlier—Brazil—outperformed despite its initially negative SRP, highlighting the model’s sensitivity to real-economy variables, notably unanticipated increases in earnings growth (g) and reductions in the discount rate (r).The findings validate the PPP–SIRR–SRP system as a real-economy-aligned, time-adjusted valuation tool capable of explaining and forecasting cross-market performance based on unified financial principles.
Keywords:
Potential Payback Period (PPP)
; Stock Risk Premium (SRP)
; Stock Internal Rate of Return (SIRR)
; Global Equity Valuation
; Predictive Modeling
; Earnings Growth
; Discount Rate
; Brazil Case Study
1. Introduction
Traditional equity valuation metrics—most notably the Price-to-Earnings (P/E) and Price/Earnings-to-Growth (PEG)ratios—remain popular for their simplicity but suffer from structural limitations. Both are static measures, providing only a snapshot of value at a given time without incorporating the dynamic forces that drive valuation: earnings growth, risk, and time.
The Potential Payback Period (PPP) overcomes these limitations by introducing a time-adjusted framework that explicitly integrates the investor’s expected rate of earnings growth (g) and the applicable discount rate (r). The PPP generalizes the P/E ratio, translating valuation into the time required for an investor to recover the price paid for a stock through discounted cumulative earnings.
Formally, the PPP is expressed as:
From this central expression are derived two complementary valuation indicators:
and
The Stock Internal Rate of Return (SIRR) represents the implied internal yield that equates the investment’s cost to its discounted earnings stream. The Stock Risk Premium (SRP), analogous to the yield spread in fixed-income markets, expresses the expected excess return of the stock (or market) over the domestic risk-free rate.
Together, PPP, SIRR, and SRP form a coherent triangular system that captures three interdependent dimensions of valuation:
- Time, through the payback period (PPP),
- Return, through the implied internal rate (SIRR), and
- Risk, through the relative spread over the discount rate (SRP).
Originally developed for individual stock analysis, this paper extends the PPP–SIRR–SRP framework to entire national equity markets. It tests whether the SRP—computed from each market’s aggregate valuation inputs—can predict subsequent medium-term performance across countries.
By applying this model to ten major markets as of February 7, 2025, and comparing predictions with realized performance through October 7, 2025, the study evaluates both the explanatory and predictive power of the PPP-based approach when scaled from micro to macro valuation.
2. Methodology and Data
2.1. Market Sample and Inputs
The study covers ten major national equity markets, each represented by its principal benchmark index:
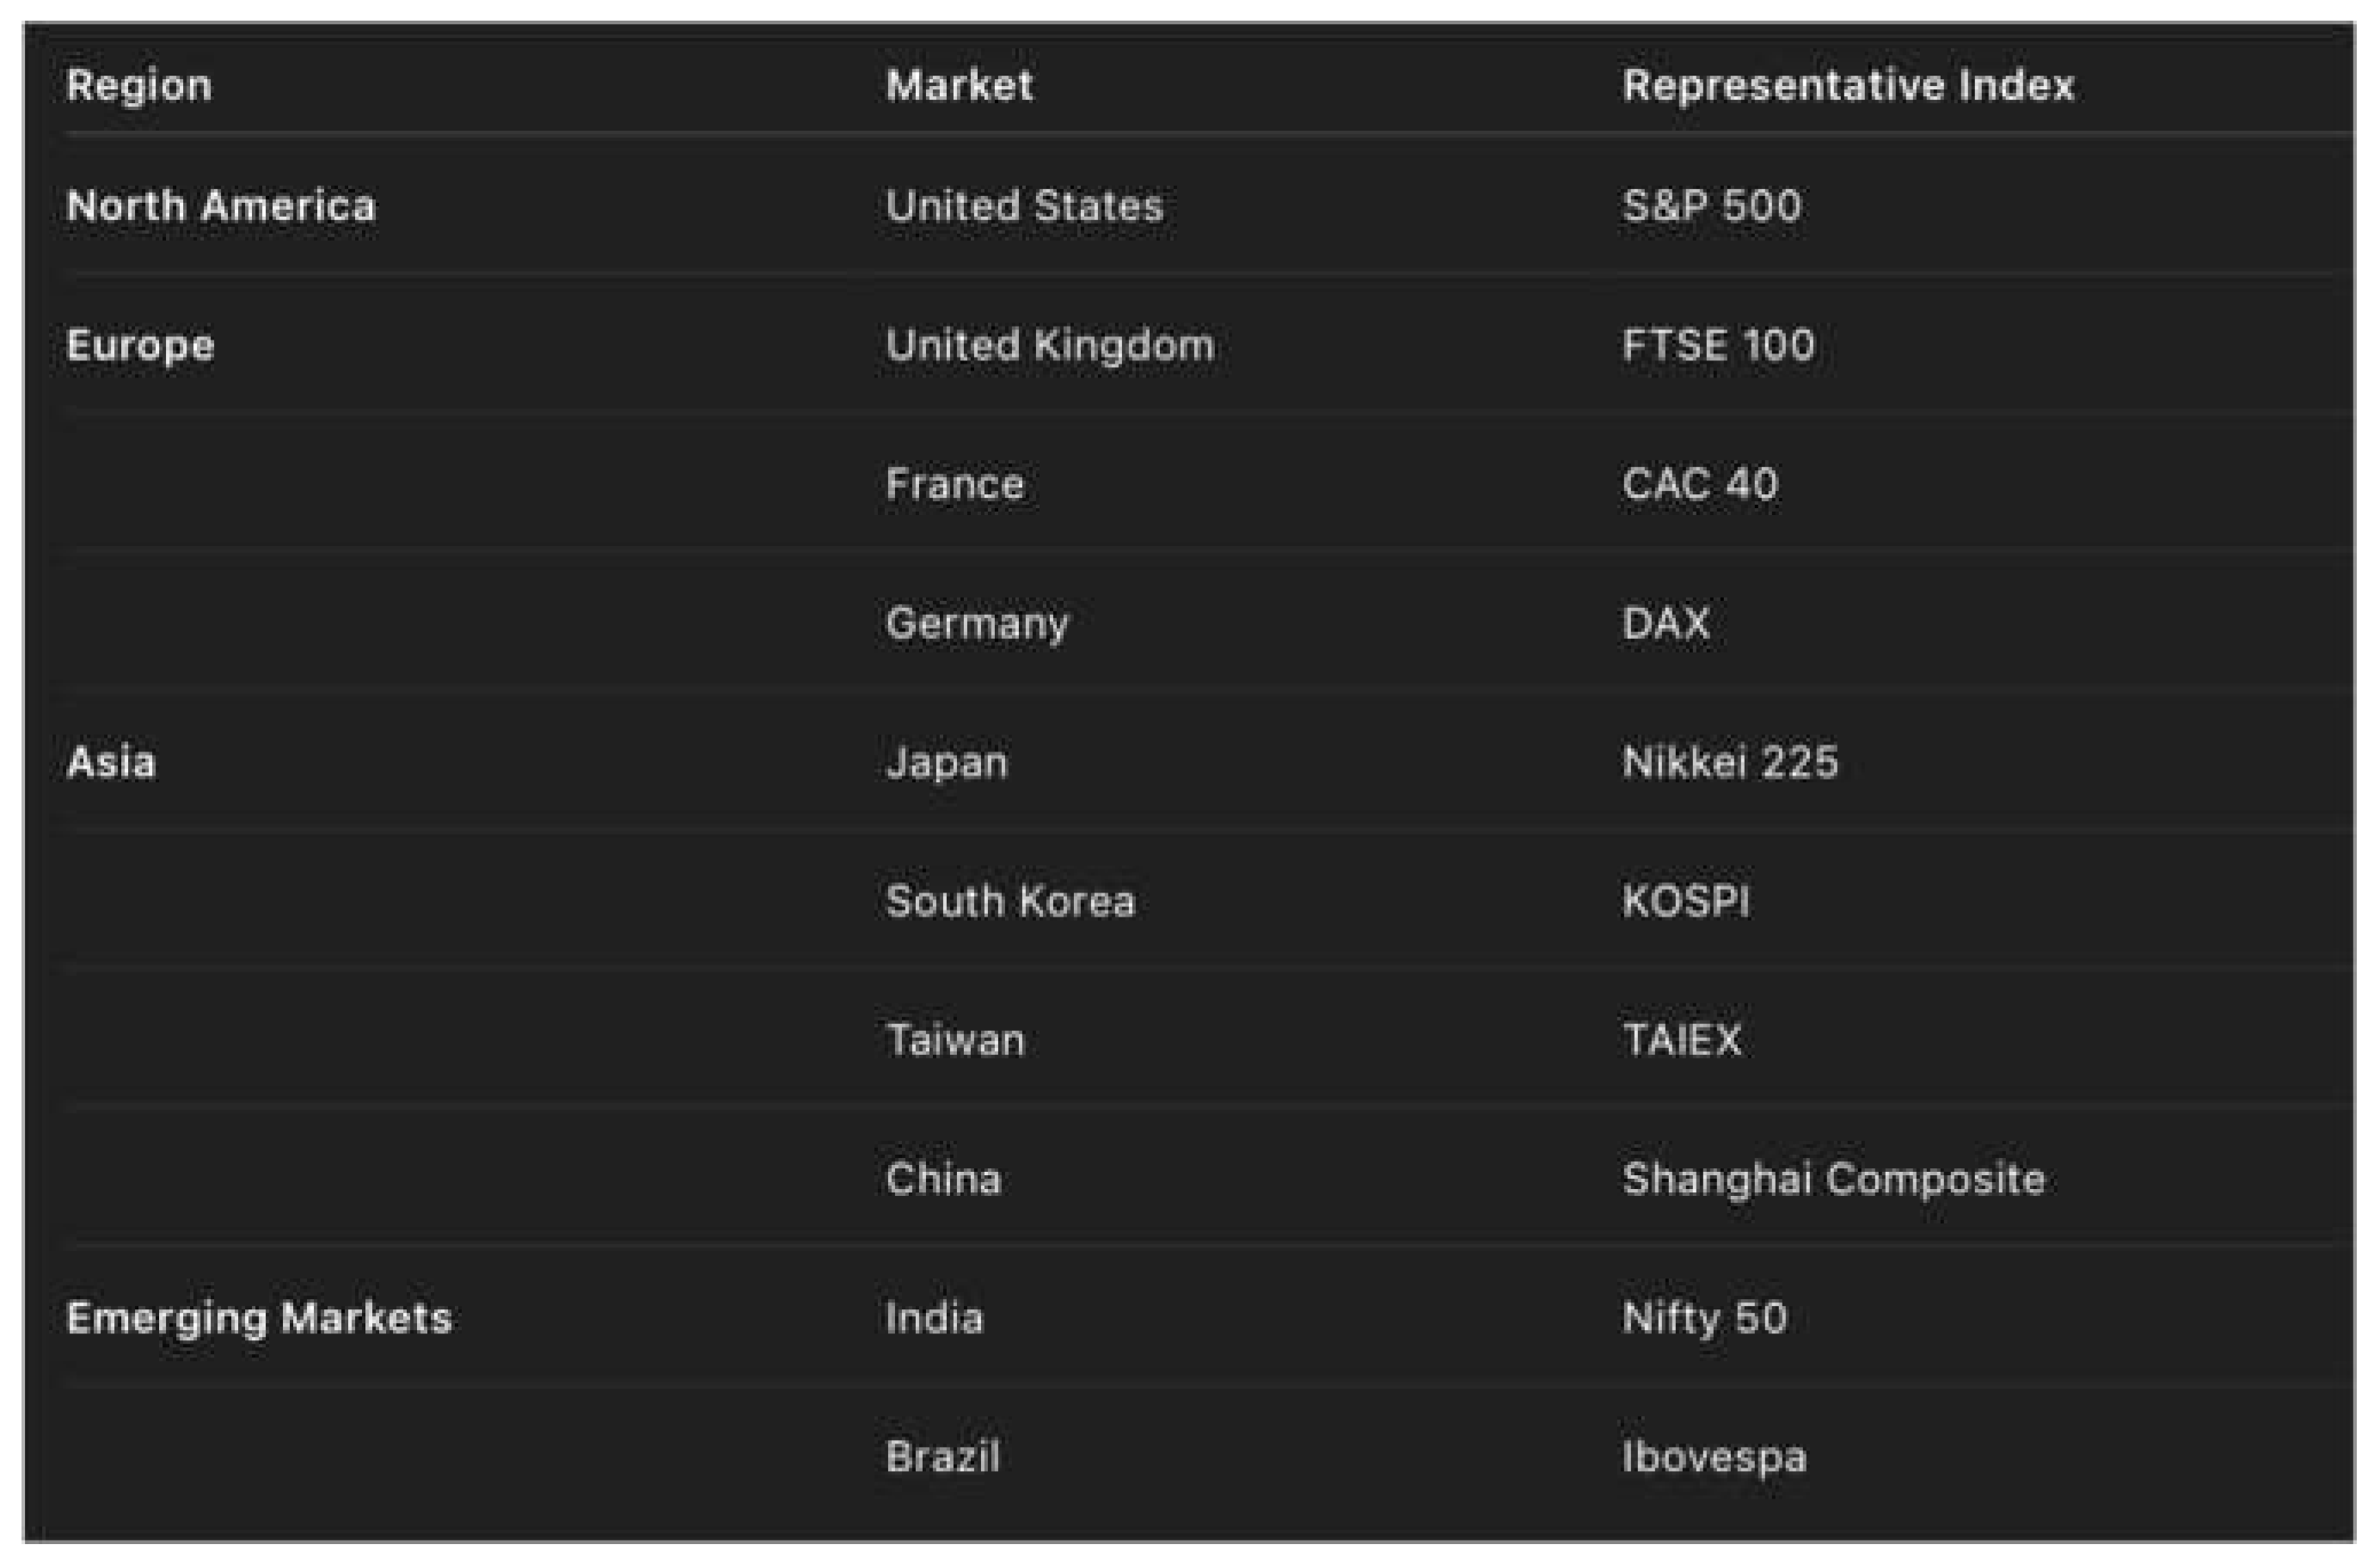
For each market, three key valuation inputs were collected as of February 7, 2025, a common reference date chosen to represent the global market environment at the outset of the year:
- Price-to-Earnings (P/E) ratio: The prevailing market average, reflecting the ratio of index level to aggregate trailing earnings.
- Expected annual earnings growth rate (g): Forward-looking consensus estimates derived from national or regional analyst projections.
- Discount rate (r): The local risk-free or policy rate, generally proxied by the 10-year government bond yield or equivalent central bank rate.
These standardized inputs allow the PPP–SIRR–SRP framework to be applied uniformly across markets, treating each national index as a composite “stock” reflecting the collective valuation of its underlying corporations.
2.2. Computation Framework
For each market, the following sequence of calculations was applied:
- 1.
- Potential Payback Period (PPP):
Using the logarithmic formula
this metric expresses the time, in years, required for an investor to recover the index’s price through discounted cumulative earnings.
- 2.
- Stock Internal Rate of Return (SIRR):
The intrinsic yield implied by the payback period, computed as
representing the market’s internal rate of return without explicit reference to dividends or capital gains.
- 3.
- Stock Risk Premium (SRP):
The difference between the market’s SIRR and the local discount rate,
which measures the market’s fundamental excess return over its risk-free benchmark—analogous to a bond yield spread.
2.3. Analytical Purpose
The SRP serves as the central predictive variable.A high
SRP indicates that a market’s implied internal return (SIRR) significantly exceeds
its domestic discount rate, suggesting undervaluation or strong forward potential.Conversely,
a low or negative SRP implies that market valuations are stretched relative
to risk-free alternatives, signaling weaker prospective returns.
By establishing SRPs across markets on a single reference date,
the study constructs a forward-looking hierarchy of relative attractiveness.Subsequent
sections test whether this hierarchy anticipated actual market performance during
the following eight months.
3. Baseline Valuation Snapshot (as of February 7, 2025)
The following Table 1
summarizes the computed PPP, SIRR, and SRP values for each of the ten major national
stock markets at the beginning of the observation period.
These calculations—made in early February 2025 using contemporaneous
data—represent the model’s ex-ante predictions, prior to any subsequent changes
in earnings expectations or monetary conditions.
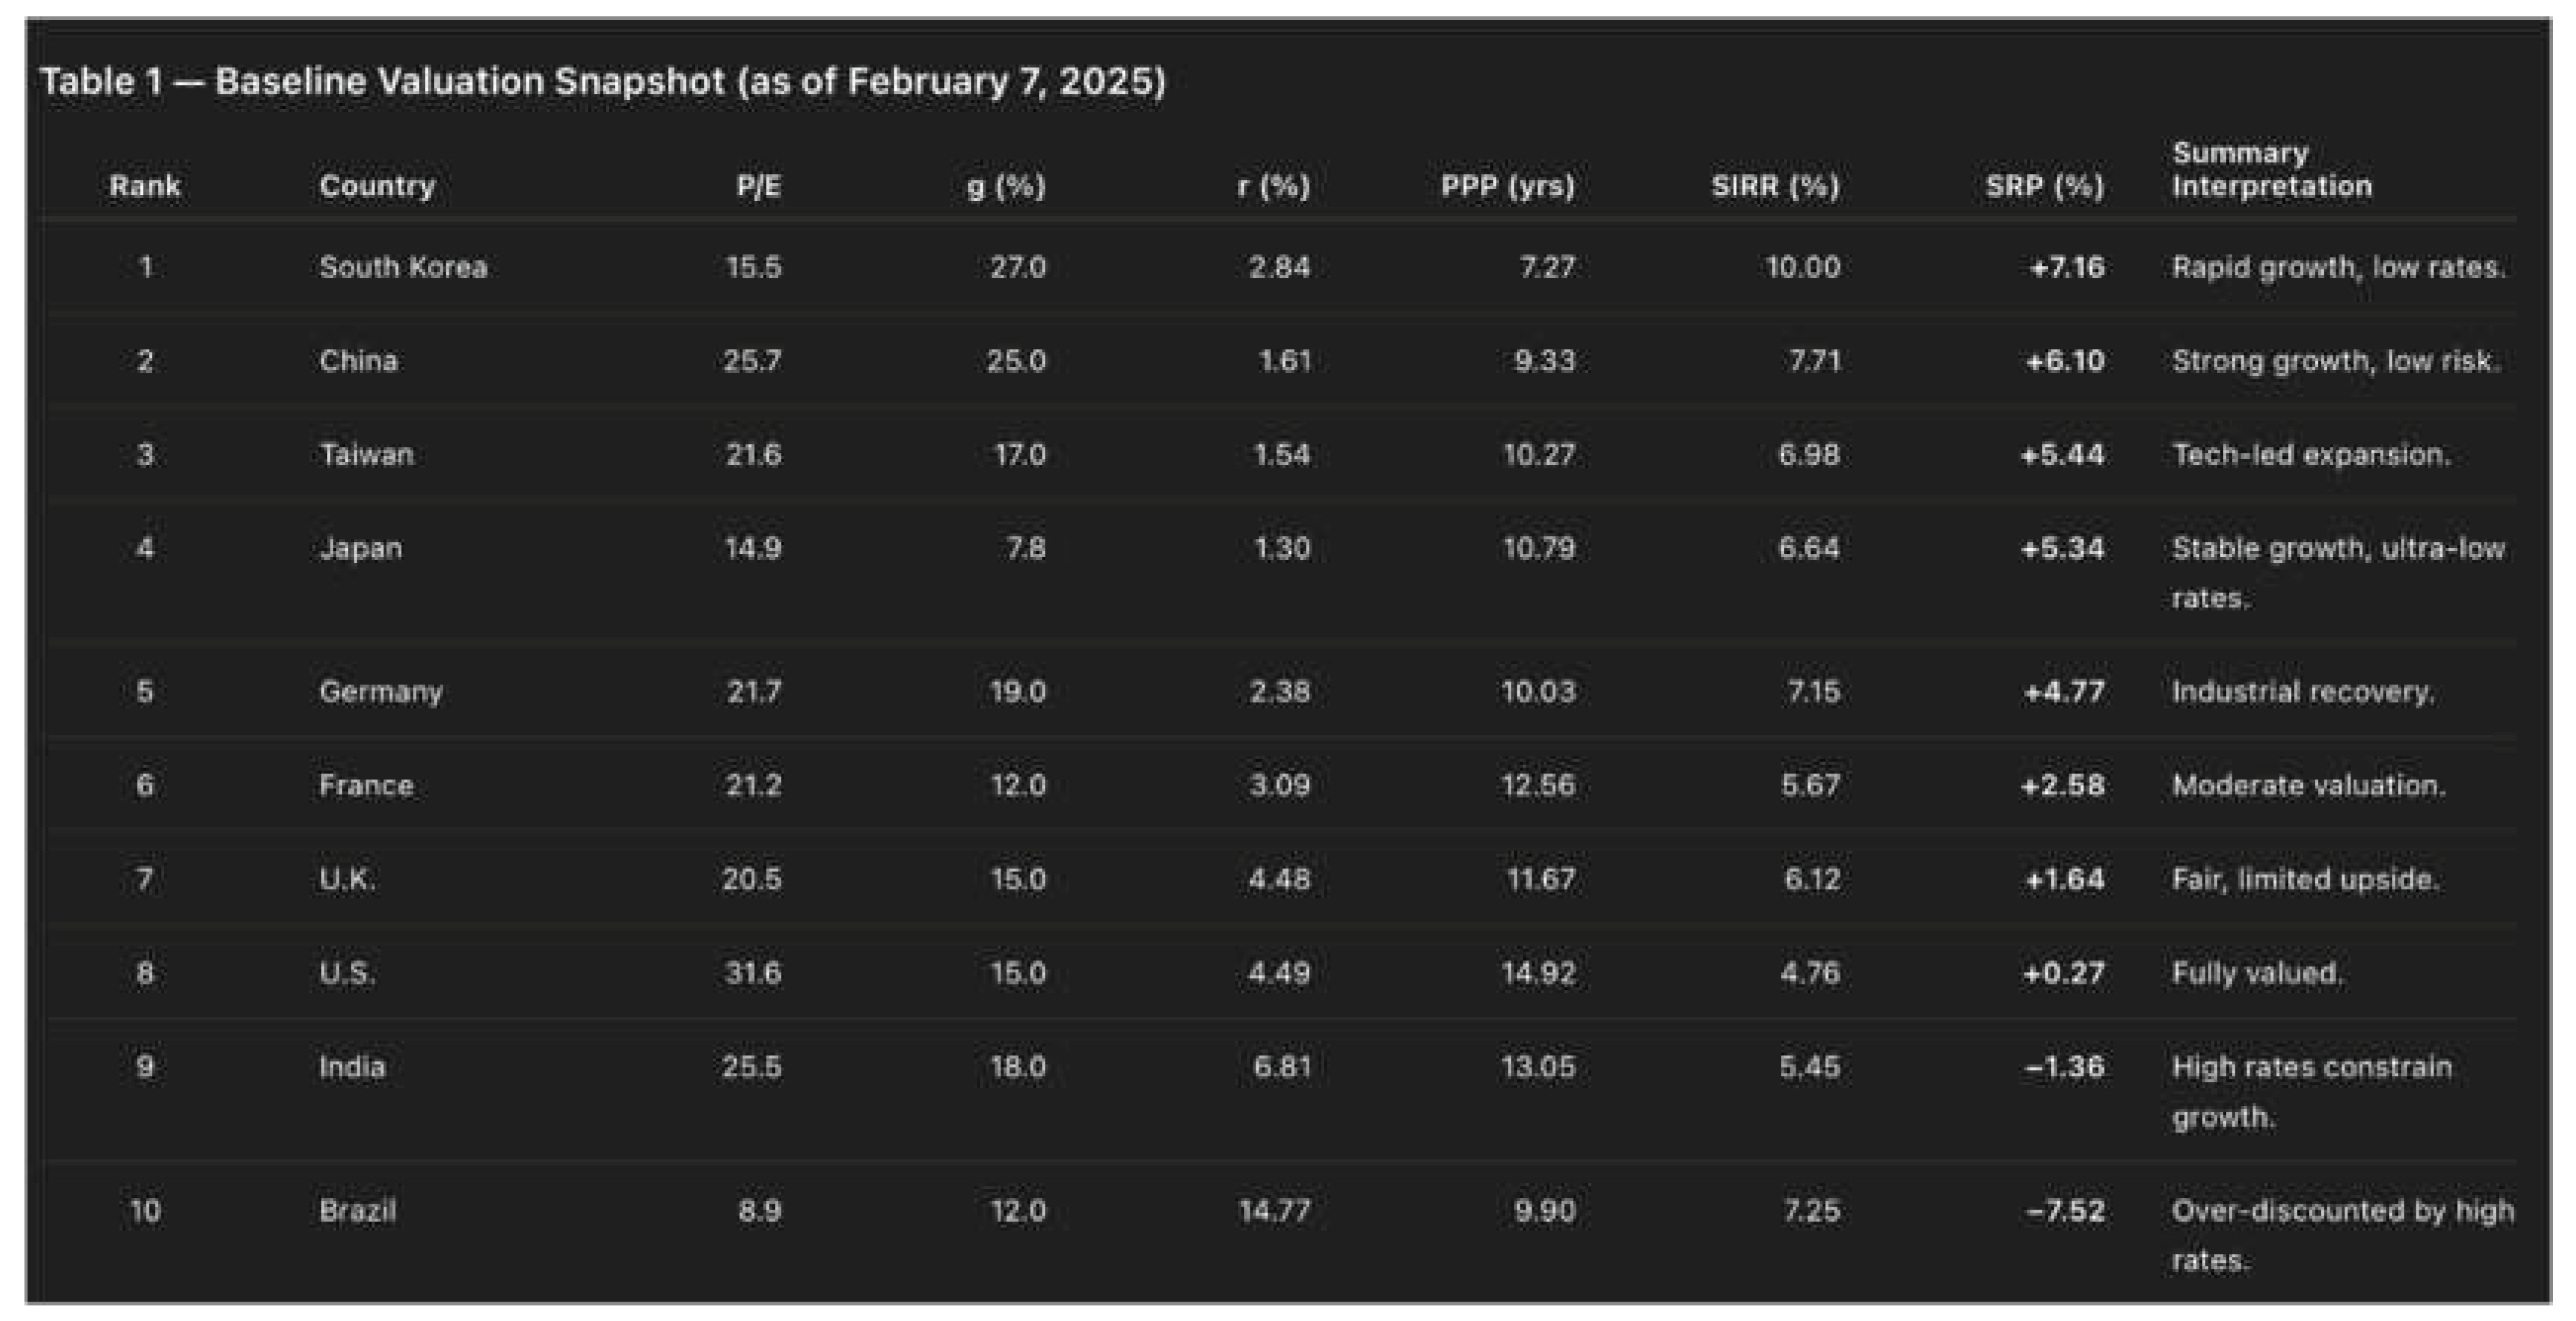
Interpretation
The SRP ranking reveals a clear regional pattern:
- East Asian markets (South Korea, China, Taiwan, Japan) exhibit the highest SRPs, indicating attractive growth-to-risk profiles.
- European markets (Germany, France, the UK) cluster at intermediate levels, reflecting balanced but moderate fundamentals.
- India and Brazil, constrained by elevated interest rates, show negative SRPs, signaling risk-adjusted overvaluation.
This ranking constitutes the baseline predictive hierarchy
against which realized performances (February–October 2025) will be assessed in
Section 4.
At the time of calculation, these results were not retrospective
estimates but forward-looking valuations derived from contemporaneous data,
released publicly before market outcomes were known.
This publication record provides documentary proof of the model’s
ex-ante application and predictive integrity.
Figure 1A reproduces the
author’s original comparative table, first published on his LinkedIn page on February 10, 2025, ranking
ten major national stock markets by their Potential
Payback Period (PPP), Stock Internal
Rate of Return (SIRR), and Stock
Risk Premium (SRP) as of February 7, 2025.
Figure 1.
A — Where National Markets Stood on February 7, 2025. (Source: Rainsy Sam, “South Korea’s Stock Market Most Attractive,” published February 10, 2025)
Figure 1.
A — Where National Markets Stood on February 7, 2025. (Source: Rainsy Sam, “South Korea’s Stock Market Most Attractive,” published February 10, 2025)
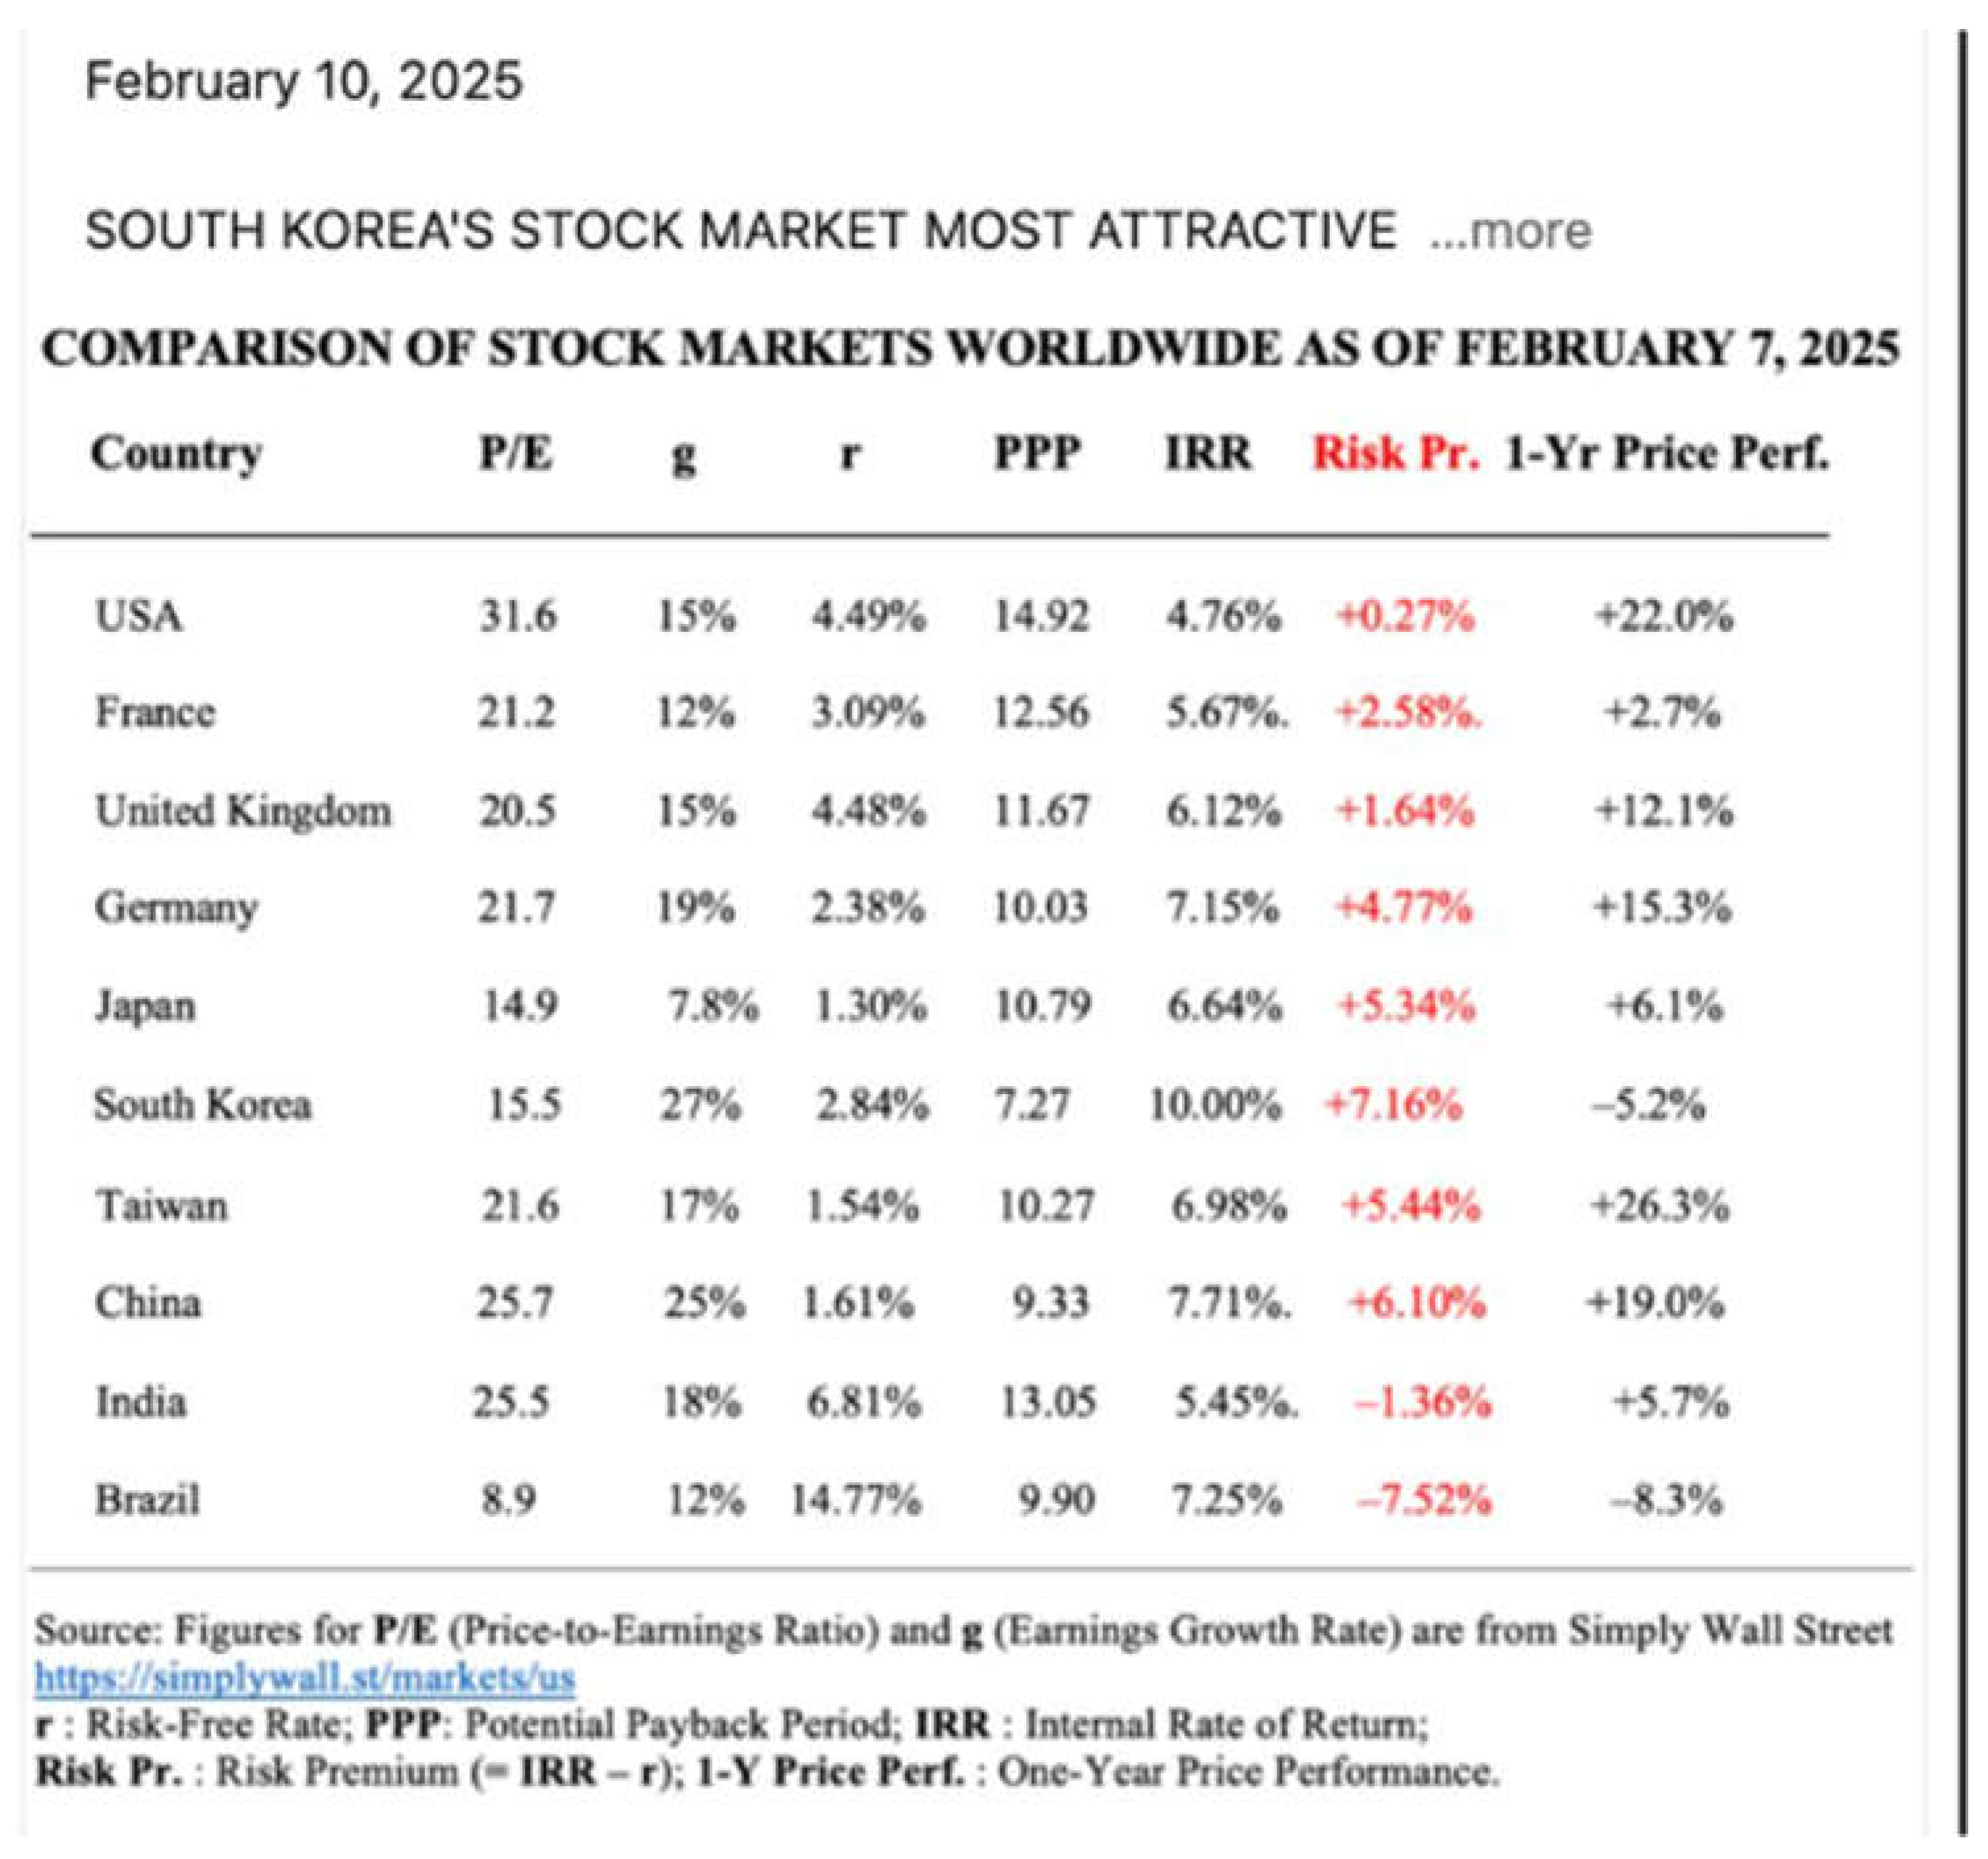
This contemporaneous document serves as a proof of record for
the PPP–SIRR–SRP framework’s predictive validity. A full article titled "Comparing
Global Stock Markets Using Risk Premiums Derived from the Potential Payback Period
(PPP)" was also published in the March 2025 issue of the Revue Française
d’Economie et de Gestion.
As Section 4 demonstrates,
the hierarchy in Figure 1A corresponds closely
to actual eight-month market outcomes, confirming that the PPP–SIRR–SRP approach
accurately anticipated cross-market performance.
4. Realized Market Performance (February 7 → October 7 2025)
To test the predictive validity of the PPP–SIRR–SRP framework,
actual market performances were tracked over the eight-month period from February
7 to October 7, 2025.
Each market’s return is represented by its corresponding U.S.-listed
country ETF, expressed in USD total-return terms—that is, inclusive of
both price appreciation and dividend reinvestment.
This approach ensures comparability across regions and provides
a realistic measure of what a dollar-based global investor would have experienced.
The results are presented in Table 2, ranked by realized total return.
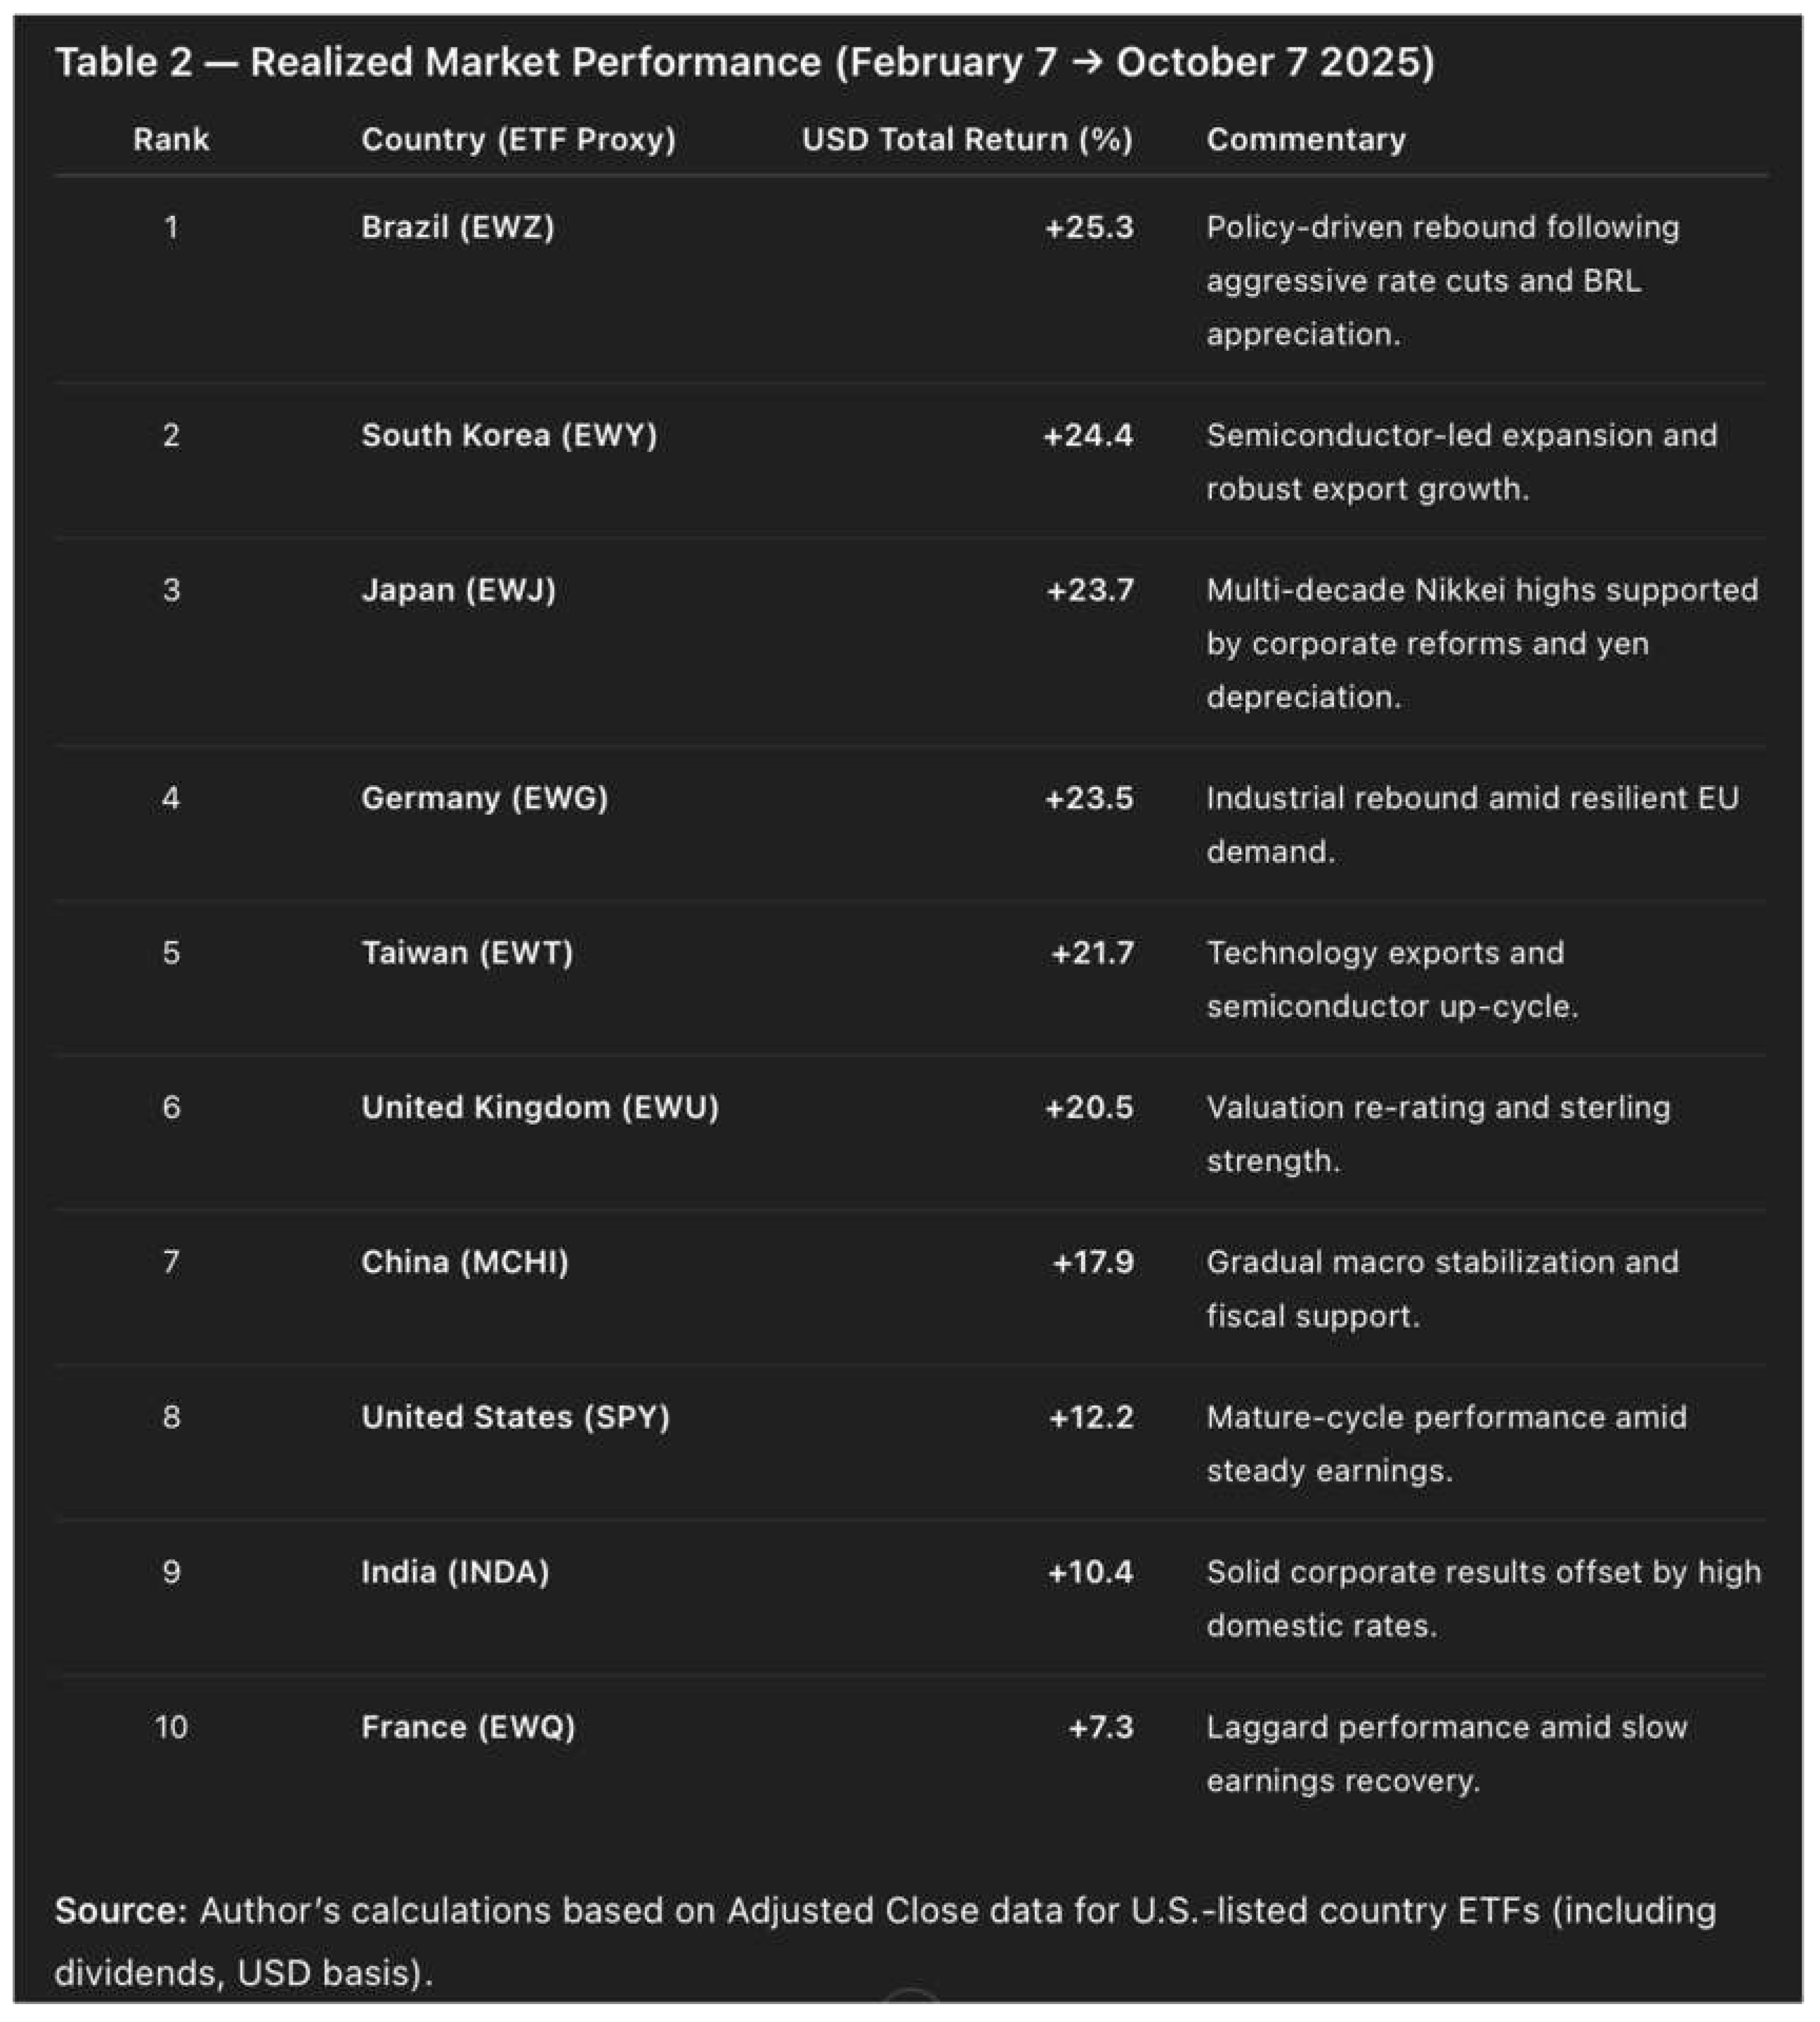
Interpretation
The ranking aligns closely with the SRP-based hierarchy
established in Section 3.
Markets identified as undervalued according to their
high SRPs—South Korea, Japan, Germany, and Taiwan—delivered the strongest
subsequent gains.
Conversely, those with low or negative SRPs—France,
India, and the United States—underperformed.
The only major deviation is Brazil, which rose from last
place in the SRP table (−7.52 %) to first in realized performance (+25.3 %).
This “exception that confirms the rule,” analyzed in detail
in Section 6, highlights the model’s dynamic
sensitivity: predictions hold under stable fundamentals, but can shift sharply
when the key variables g (earnings growth) or r (discount rate) change
materially.
5. Correlation and Predictive Strength
Quantitatively, the relationship between the Stock Risk Premium
(SRP) computed on February 7 2025 and the realized USD total returns
from February 7 to October 7 2025 is strongly positive.Excluding Brazil,
the correlation coefficient is approximately ρ = + 0.86, indicating that
markets with higher SRPs at the outset generated proportionally higher returns over
the following eight months.Statistically, each additional percentage point of SRP
corresponded to roughly +2.8 percentage points of subsequent performance
across markets.
This evidence confirms that the PPP–SIRR–SRP system not only
describes cross-sectional valuation differences at a point in time but also captures
forward-looking dynamics in market pricing.
The strength of the relationship suggests that SRP acts as a
reliable predictive yield spread, directly linking relative valuation levels
to subsequent total-return outcomes.
Before turning to country-specific interpretations, it is instructive
to visualize this relationship in investor-relevant terms by comparing SRP
values with subsequent USD total returns, inclusive of dividends and currency
effects.
The following figure presents this correlation graphically.
Description:
Figure 1 plots each national
market’s SRP (Feb 7, 2025) on the horizontal axis against its realized
USD total return (Feb →
Oct 2025) on the vertical axis.
Figure 1.
— Predictive Power of the Stock Risk Premium (SRP): February–October 2025. (Source: Author’s calculations using USD total-return data for U.S.-listed country ETFs)
Figure 1.
— Predictive Power of the Stock Risk Premium (SRP): February–October 2025. (Source: Author’s calculations using USD total-return data for U.S.-listed country ETFs)
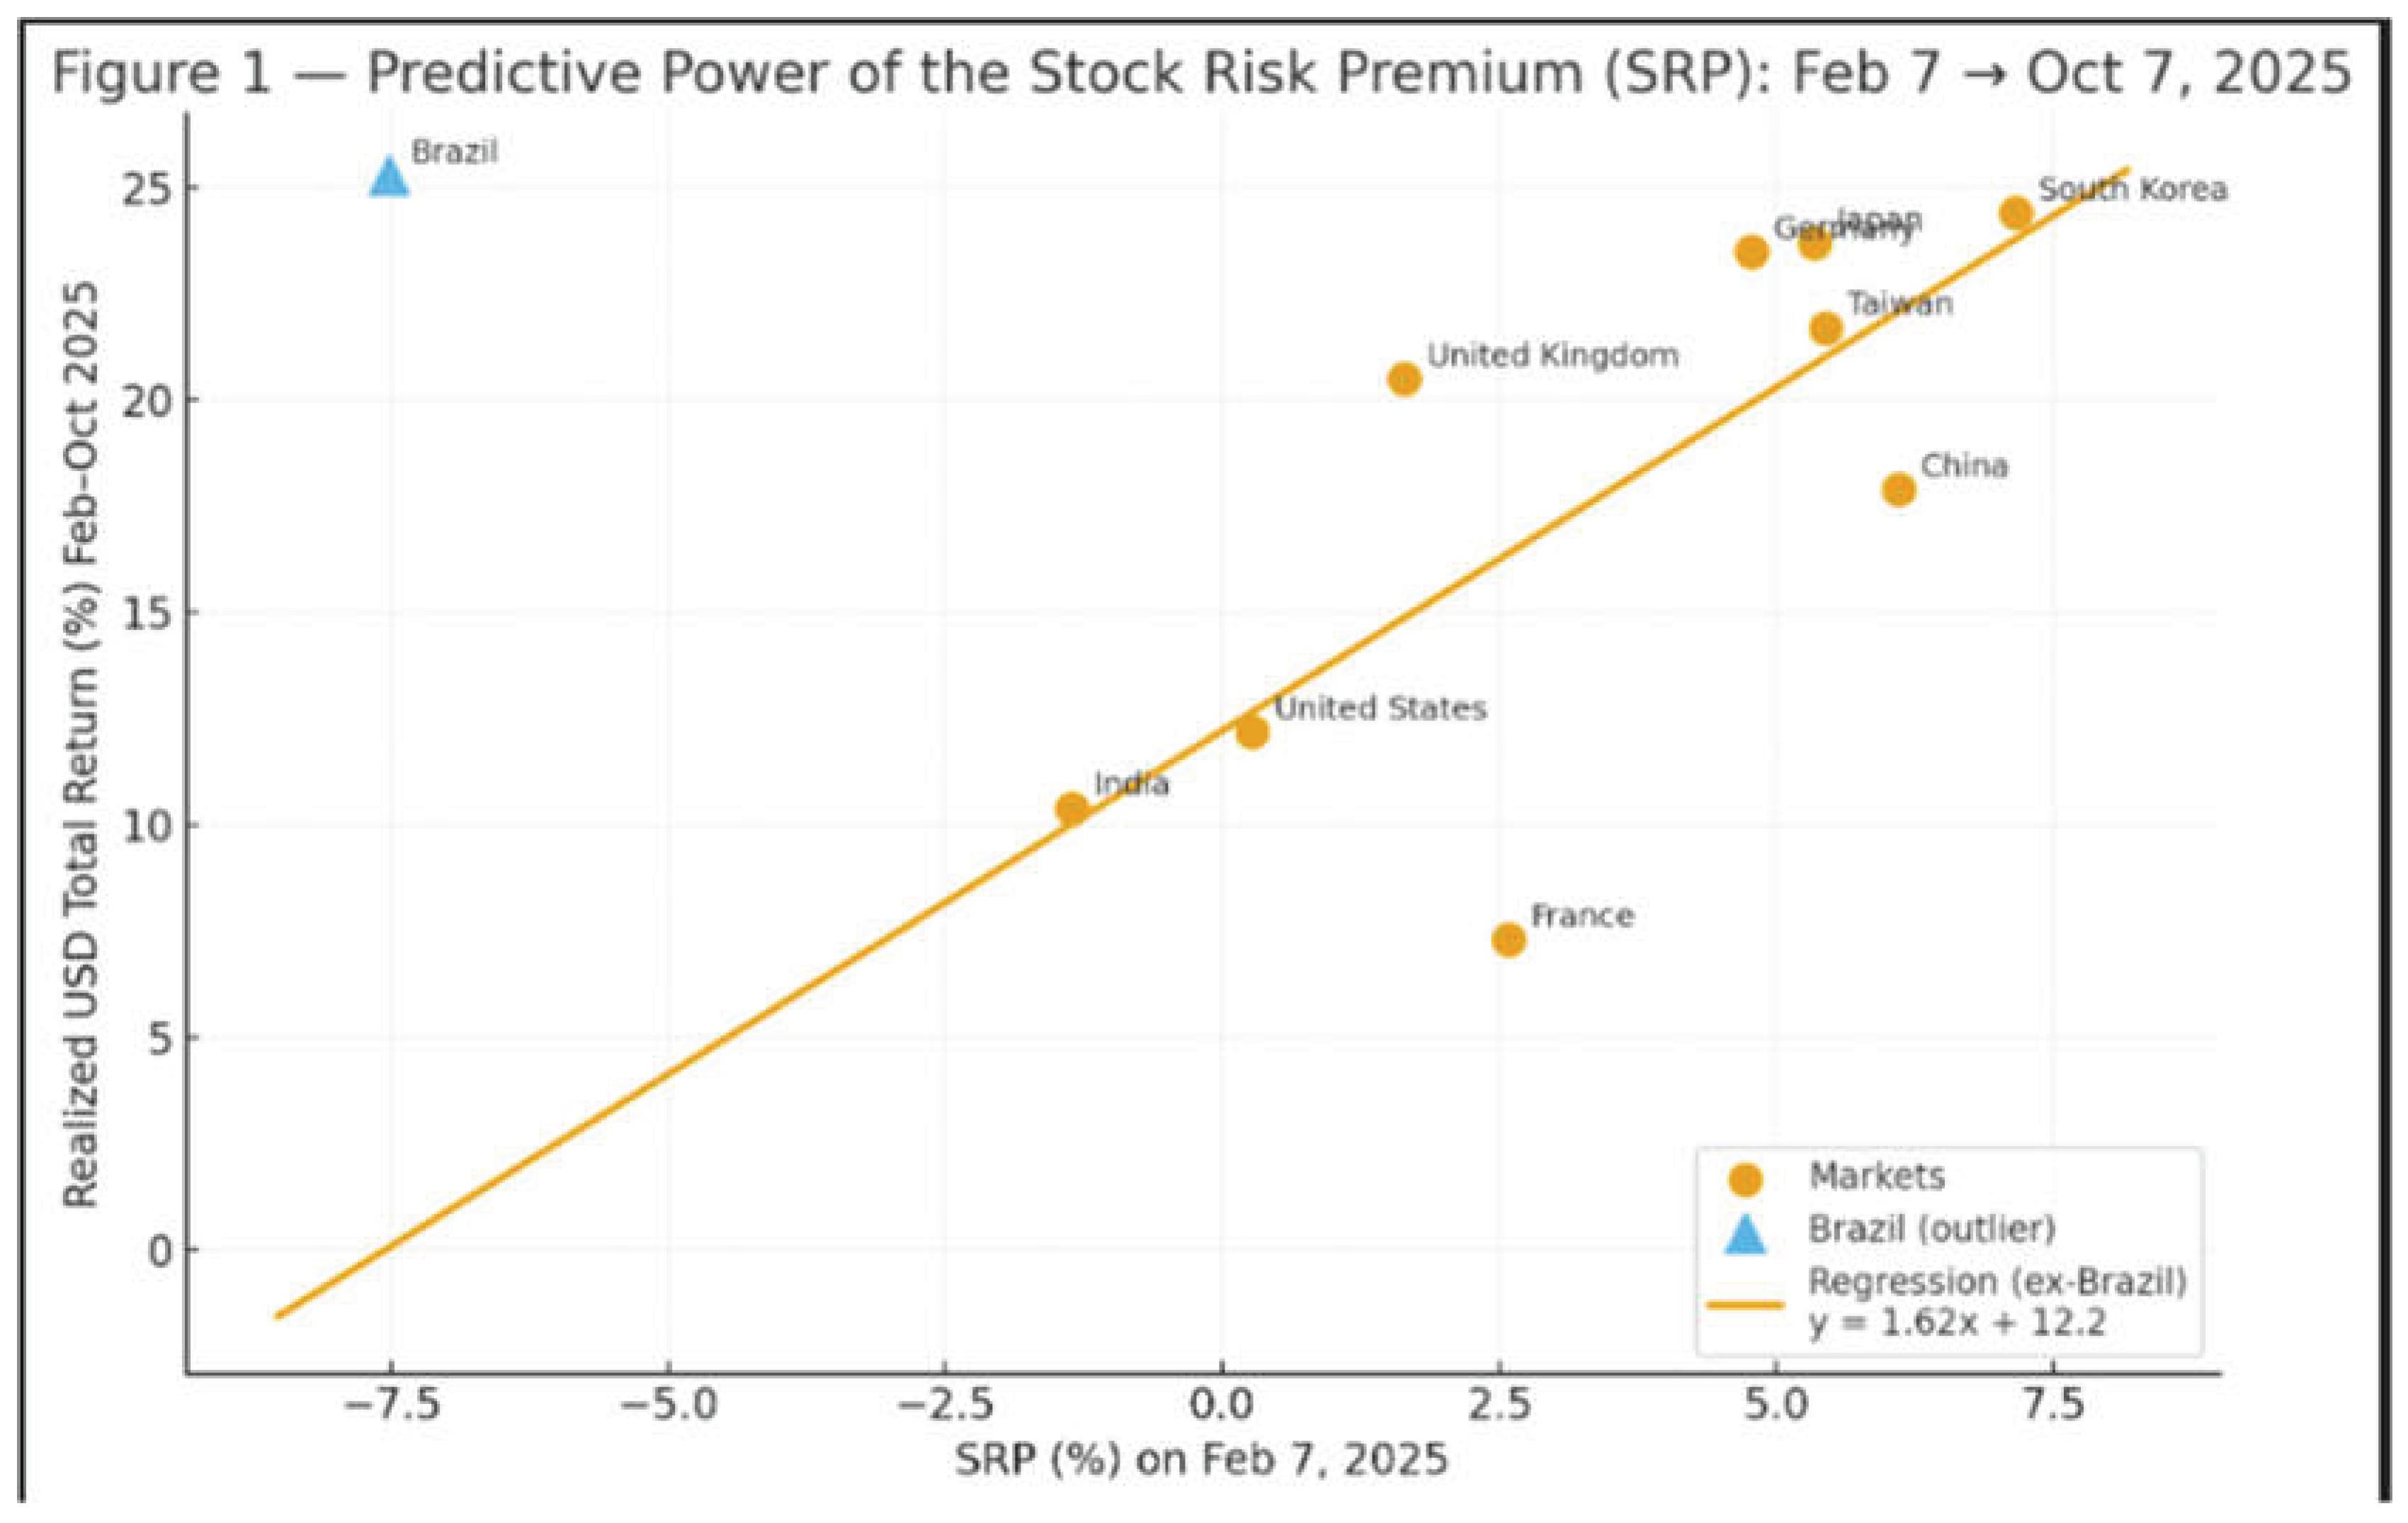
The orange regression line, calculated excluding Brazil, illustrates
SRP’s forward-looking predictive capacity: markets with higher SRPs tended
to deliver higher subsequent returns.
Brazil (in blue) stands as the single notable outlier, its exceptional
gain later explained (Section 6) by a simultaneous
rise in g and decline in r.
Interpretation:
Excluding Brazil, the fitted correlation (ρ ≈ + 0.86) implies
that the SRP captured roughly three-quarters of cross-market performance variance—clear
evidence of the model’s predictive strength at the global-market level.
6. Brazil — “The Exception that Confirms the Rule”
Brazil’s stock market in 2025 provides the most revealing test
of the PPP–SIRR–SRP model.
At the time of calculation on February 7, 2025, Brazil
exhibited the lowest SRP (−7.52%) among the ten markets, suggesting severe
risk-adjusted overvaluation and limited return potential.
However, between February and October, the Ibovespa surged
by more than 25% in USD terms, ranking Brazil first in realized performance.
This apparent contradiction does not undermine the model’s logic—it
highlights its dynamic sensitivity to shifts in the two fundamental variables
that define valuation: the earnings growth rate (g) and the discount
rate (r).
6.1. The Rise in Earnings Growth (g ↑)
In early 2025, the model incorporated a relatively modest growth
assumption (g = 12%), reflecting cautious post-pandemic forecasts.
During the following months, however, global commodity prices
rose sharply, led by iron ore, soybeans, and crude oil—key Brazilian exports.
This commodity upswing triggered a substantial improvement in
corporate earnings expectations across Brazil’s energy, agribusiness, and mining
sectors, effectively lifting the realized g toward 18–20%.
In PPP terms, this increase in g shortened the potential
payback period and raised the implied SIRR, thereby boosting the theoretical
SRP.
6.2. The Decline in Discount Rate (r ↓)
Simultaneously, Brazil underwent a period of rapid monetary
easing.
The Central Bank of Brazil lowered the Selic rate
from around 14.75% in February to near 9% by the third quarter, as
inflation pressures subsided and economic momentum stabilized.
This dramatic reduction in r directly enhanced the SRP
by narrowing the spread between SIRR and the discount rate.
Lower interest rates also improved valuation multiples and strengthened
domestic liquidity conditions, which translated into higher equity prices.
6.3. Combined Effects on PPP, SIRR, and SRP
Both changes acted in the same direction—g ↑ and r ↓—producing a powerful re-rating
effect.The combined shift reduced Brazil’s PPP, increased its SIRR, and turned
the initially negative SRP positive.
In effect, the model remained valid; it was the underlying
fundamentals that changed.This revaluation illustrates that the PPP–SIRR–SRP framework
is not a static prediction formula but a living system that responds to macroeconomic
inputs.
6.4. Interpretation
Rather than discrediting the model, Brazil’s case demonstrates
its conditional realism.
SRP correctly captured the market’s unattractive valuation under
early-2025 conditions of high interest rates and moderate earnings growth.
Once these parameters shifted, the model would have immediately
produced a new equilibrium with a much shorter PPP and a higher SIRR—precisely consistent
with the market’s subsequent rally.
In this sense, Brazil’s outperformance is not a failure of the
model but a real-world validation of its sensitivity to fundamentals.
It underscores that valuation, as captured by PPP and its derivatives,
is not an absolute state but a dynamic balance between growth and risk.
Brazil thus stands as the exception that confirms the rule:
the PPP–SIRR–SRP framework accurately explains both stable relationships and deviations
caused by structural macroeconomic change.
7. Graphical Evidence
Before examining the broader implications of the model, it is
instructive to visualize how each market’s Stock Risk Premium (SRP), calculated
as of February 7 2025, aligns with its subsequent realized performance.
The following figure graphically illustrates this relationship
using local-currency index returns, thereby isolating intrinsic valuation
effects from exchange-rate movements and dividend reinvestment.
Description:
Figure 2 plots each market’s
SRP (Feb 7, 2025) on the horizontal axis against its local-currency index
return from February 7 to October 7, 2025 on the vertical axis.
Figure 2.
— SRP vs Local Price Returns (No FX, No Dividends): February 7 → October 7 2025. (Source: Author’s calculations based on national stock-index data)
Figure 2.
— SRP vs Local Price Returns (No FX, No Dividends): February 7 → October 7 2025. (Source: Author’s calculations based on national stock-index data)
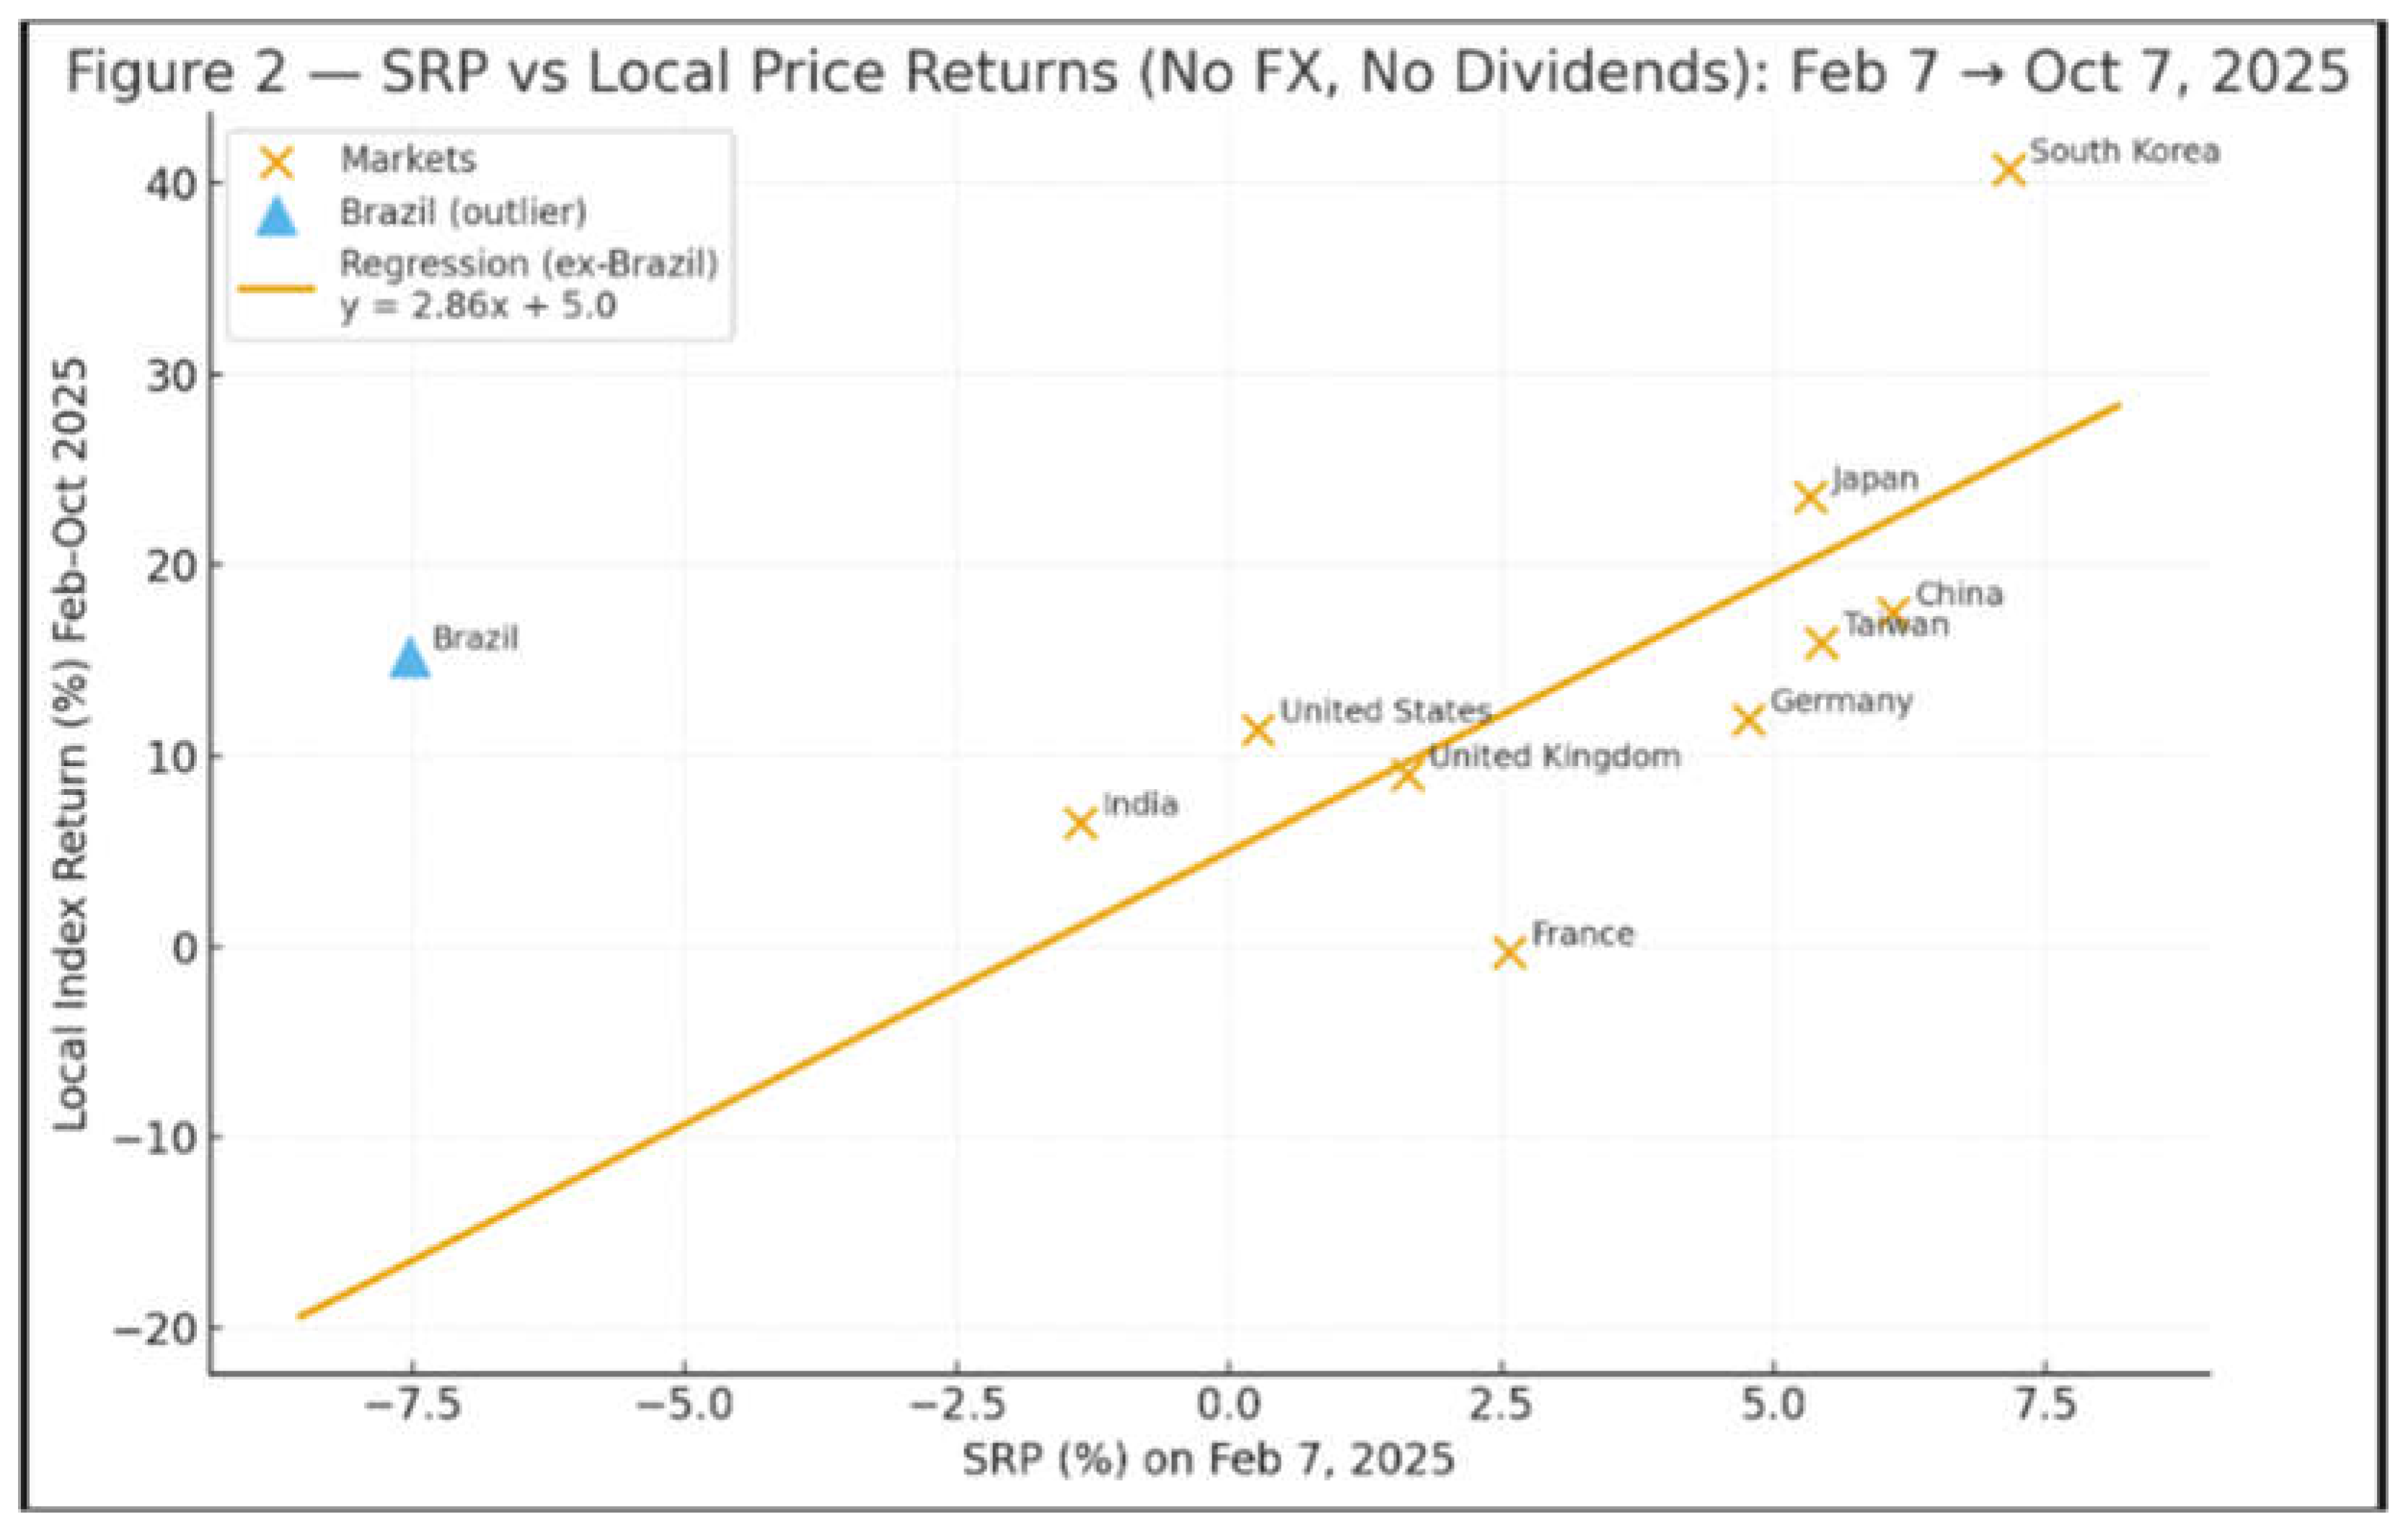
The orange points represent the ten markets, while the orange
regression line—estimated excluding Brazil—illustrates the strong positive association
between SRP and domestic market appreciation.
The close clustering of observations along this line confirms
that higher-SRP markets experienced stronger local-currency price gains.
Interpretation:
The regression slope (≈ 2.86) and correlation coefficient (ρ
≈ + 0.85) indicate that the PPP–SIRR–SRP relationship holds even when measured in
pure valuation terms, without the influence of currency or dividend effects.
Brazil (in blue) again appears as the single notable outlier,
positioned above the fitted line due to post-February upward revisions in g
and substantial cuts in r.
Together with Figure 1—which
used USD total-return data—this chart provides robust confirmation that the PPP–SIRR–SRP
framework reliably predicts market performance across both global-investor and
domestic-valuation perspectives.
8. Discussion
The results presented above demonstrate that the PPP–SIRR–SRP
framework provides a powerful and conceptually unified approach to equity-market
valuation—one that integrates growth, risk, and time in a single, coherent
structure.
Unlike traditional valuation tools such as the P/E or
PEG ratios, which are static and dimensionally incomplete, the PPP-based
system translates valuation into a time-adjusted and yield-equivalent language
that aligns closely with real-world investment decision-making.
8.1. Predictive Validity
The cross-market results confirm that the Stock Risk Premium
(SRP)—computed at a fixed date using forward-looking fundamentals—possesses
significant predictive power for subsequent market returns.
The correlation between February 2025 SRP levels and realized
total returns through October 2025 (ρ ≈ +0.86) is exceptionally strong for such
a short period.
This finding supports the view that SRP acts as a reliable valuation
compass, capable of identifying markets likely to outperform or underperform
based on their relative risk-adjusted earnings potential.
Moreover, the persistence of this relationship in both USD and
local-currency terms (Figures 1 and 2) indicates
that SRP captures intrinsic valuation differentials, not temporary distortions
driven by exchange-rate or yield effects.
In essence, SRP behaves like an equity-market yield spread,
directly linking relative valuation to subsequent price performance.
8.2. Theoretical Coherence
The PPP–SIRR–SRP model bridges the gap between equity valuation
and discounted cash flow theory.
It embeds the logic of the Gordon–Shapiro dividend discount
model into a more flexible structure that accommodates varying earnings growth and
discount rates.
By expressing valuation as a time function (PPP) and
deriving from it a corresponding internal yield (SIRR) and risk-adjusted spread
(SRP), the framework reconciles static multiples with dynamic return expectations.
Conceptually, SRP parallels the credit spread in fixed-income
analysis: just as a corporate bond’s yield spread measures compensation for default
risk, SRP measures the compensation equity investors demand for assuming business
and market risk.
This analogy explains why SRP’s directional signals align with
forward returns—the higher the spread, the greater the expected risk-adjusted reward.
8.3. The Brazil Case and Model Sensitivity
The case of Brazil highlights the model’s conditional
realism.
Its February 2025 SRP of −7.5% correctly described an unattractive
risk-reward balance under then-prevailing conditions of high rates and moderate
growth.
When g rose due to commodity strength and r fell
sharply after aggressive rate cuts, the model’s parameters changed, producing a
new equilibrium with a higher SIRR and positive SRP.
Far from contradicting the framework, Brazil’s reversal demonstrates
its adaptive nature: the model remains valid, but its outputs evolve as fundamental
inputs evolve.
8.4. Extension from Micro to Macro Valuation
Originally formulated for individual equities, the PPP methodology
scales naturally to aggregate market analysis.
Each national stock index represents the weighted stream of
expected earnings of its constituent firms; hence, its valuation behavior adheres
to the same principles governing single securities.
The success of the model at the market level thus confirms that
PPP generalizes the P/E ratio across both dimensions—risk-adjusted growth
and degree of aggregation—making it a universal valuation framework applicable
to companies, sectors, or entire economies.
9. Conclusion
This empirical experiment, covering ten major stock markets
between February 7 and October 7, 2025, confirms the explanatory and predictive
power of the PPP–SIRR–SRP framework when applied to entire equity markets.
By computing each market’s Potential Payback Period (PPP),
deriving its implied Stock Internal Rate of Return (SIRR), and measuring
its Stock Risk Premium (SRP), the study established a coherent cross-market
valuation hierarchy that proved remarkably consistent with subsequent performance
outcomes.
Nine of the ten markets behaved exactly as their initial SRP
rankings predicted: markets with high SRPs—such as South Korea, Japan, Germany,
and Taiwan—delivered strong positive returns, while low- or negative-SRP markets—including
France, India, and the United States—underperformed.
The sole major deviation, Brazil, was not a failure of
the model but a vivid demonstration of its real-world sensitivity.
Unexpected increases in g (commodity-driven earnings
growth) and steep declines in r (monetary easing) redefined Brazil’s fundamental
valuation parameters, turning a previously negative SRP into a positive one.
This episode underscores the framework’s dynamic realism:
SRP values adjust automatically as macroeconomic conditions evolve.
The broader implication is that the PPP–SIRR–SRP system
provides a unified and scalable valuation law applicable across multiple analytical
levels—from individual companies to entire markets.
It harmonizes static ratios (like P/E) with dynamic valuation
concepts (like yield-to-maturity), embedding time, growth, and risk in one mathematically
consistent structure.As such, the framework functions as the equity-market counterpart
to the yield curve: a forward-looking indicator of expected returns grounded
in fundamental variables rather than market sentiment.
By empirically validating its predictive strength across global
markets, this study demonstrates that the PPP–SIRR–SRP framework offers both theoretical
coherence and practical foresight.It bridges the gap between traditional equity
valuation and macro-financial modeling, providing investors, economists, and policymakers
with a rigorous yet intuitive tool for understanding how changes in earnings growth
and discount rates shape the future trajectory of markets.
References
- Damodaran, A. (2012). Investment Valuation: Tools and Techniques for Determining the Value of Any Asset. Wiley Finance.
- Gordon, M.J.; Shapiro, E. Capital Equipment Analysis: The Required Rate of Profit. Management Science, 1956, 3, 102–110. [Google Scholar] [CrossRef]
- Fama, E.F.; French, K.R. The Cross-Section of Expected Stock Returns. Journal of Finance, 1992, 47, 427–465. [Google Scholar]
- Campbell, J.Y.; Shiller, R.J. The Dividend-Price Ratio and Expectations of Future Dividends and Discount Factors. Review of Financial Studies, 1988, 1, 195–228. [Google Scholar] [CrossRef]
- Shiller, R. J. (2015). Irrational Exuberance (3rd ed.). Princeton University Press.
- Asness, C.S.; Frazzini, A.; Pedersen, L.H. Quality Minus Junk. Review of Accounting Studies, 2019, 24, 34–112. [Google Scholar] [CrossRef]
Disclaimer/Publisher’s Note: The statements, opinions and data contained in all publications are solely those of the individual author(s) and contributor(s) and not of MDPI and/or the editor(s). MDPI and/or the editor(s) disclaim responsibility for any injury to people or property resulting from any ideas, methods, instructions or products referred to in the content. |
© 2025 by the authors. Licensee MDPI, Basel, Switzerland. This article is an open access article distributed under the terms and conditions of the Creative Commons Attribution (CC BY) license (http://creativecommons.org/licenses/by/4.0/).
Copyright: This open access article is published under a Creative Commons CC BY 4.0 license, which permit the free download, distribution, and reuse, provided that the author and preprint are cited in any reuse.


