Introduction
As global markets enter 2026, investors face a turning point shaped by normalized interest rates, divergent growth prospects, and the accelerating impact of artificial intelligence (AI) on corporate earnings. After a decade of low interest rates and inflated valuations, the key question facing global investors is clear: Where to invest next?
Traditional valuation metrics such as the Price-to-Earnings (P/E) ratio provide little guidance. They are static, ignoring growth, risk, and time, and show excessive dispersion across markets — P/Es of 10 to 30 or more often reflect macro differences rather than true value. To obtain a consistent and predictive measure of equity attractiveness, this study applies the PPP–IRR–SRP framework.
The Potential Payback Period (PPP) converts valuation into time; the Internal Rate of Return (IRR) transforms it into yield; and the Stock Risk Premium (SRP = IRR − r), capped at 5% for comparability, captures the excess return of equities over risk-free rates.Together, these indicators generalize the P/E ratio into a dynamic, yield-based system that links valuation with expected performance.
This article has three objectives:
(1) to present the PPP–IRR–SRP model and its theoretical logic;(2) to validate it through the February–October 2025 Market Test across ten major markets; and(3) to identify, as of October 10, 2025, the regions best positioned for 2026 — notably Asia and select European markets (China, Taiwan, France) — where high SRP values indicate superior risk-adjusted potential.
In short, the PPP–IRR–SRP framework replaces static multiples with predictive valuation yields, offering a rigorous, forward-looking guide to global investment allocation in 2026.
1. From Valuation Ratios to Predictive Yields: The PPP–IRR–SRP Framework
1.1. The Limits of Traditional Valuation Metrics
For decades, the Price-to-Earnings (P/E) ratio has served as the default gauge for comparing stock markets.
However, it is a static multiple that fails to integrate three critical valuation drivers:
1. Earnings growth (g),
2. Risk or discount rate (r), and
3. Time.
The result is that raw P/E ratios can look radically different across markets without reflecting true differences in value.
For instance, as of October 10, 2015, global P/E ratios ranged from 10.1 (Brazil) to 33.2 (China) — a dispersion of more than 3×.
This degree of variation makes P/E practically useless for cross-market ranking: it captures sentiment and structural differences but not intrinsic yield potential.
1.2. The Potential Payback Period (PPP): Adding Growth, Risk, and Time
To make valuation time-based and forward-looking, the Potential Payback Period (PPP) reformulates the P/E ratio by embedding both growth and the discount rate:
PPP = log((P/E × (g - r)/(1 + r) + 1)) / log((1 + g)/(1 + r))
PPP represents the number of discounted years required for cumulative earnings to equal the market price. It is a dynamic generalization of the P/E ratio — accounting for both the compounding of earnings and the time value of money.
1.3. The Internal Rate of Return (IRR): A Homogeneous Yield Metric
From PPP, one can derive the Internal Rate of Return (IRR) — the intrinsic annualized yield implied by current valuation: IRR = 2^(1/PPP) – 1
While P/E ratios vary widely, IRR values are strikingly homogeneous.
Across ten major markets in 2015, IRRs ranged from 4.77% (United States) to 8.51% (South Korea) — a span of less than four percentage points.
This IRR homogeneity demonstrates that global equity markets, despite apparent valuation gaps, tend to converge around a common internal yield equilibrium once growth and discount factors are properly integrated.
IRR thus transforms valuation ratios into a comparable yield measure, operational for ranking and portfolio construction.
1.4. The Stock Risk Premium (SRP): Normalizing for Monetary Conditions
To evaluate markets on a consistent risk-adjusted basis, the model introduces the Stock Risk Premium (SRP) — the excess of intrinsic yield over the risk-free rate:
SRP = IRR – r
However, using actual local discount rates across countries can exaggerate differences, especially in high-rate markets such as Brazil or India.
Therefore, to maintain comparability, this study applies a 5% cap on r for SRP computation, while still using the actual r for PPP and IRR
rPPP = ractual , rSRP = min (ractual , 5%)
This hybrid-cap method preserves realism for valuation (PPP and IRR) while ensuring SRP comparability across countries.
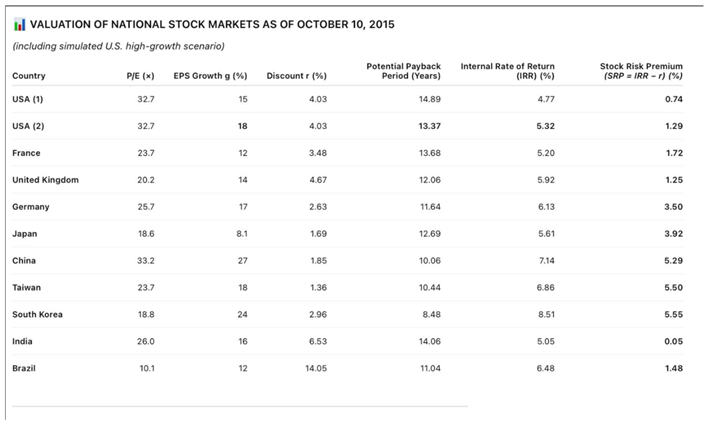
1.5. Example: Valuation Snapshot as of October 10, 2015
To demonstrate how the
PPP–IRR–SRP framework converts static valuation ratios into dynamic, yield-based indicators,
Table 1 presents the results for ten major national stock markets as of
October 10, 2015.
Interpretation
This table illustrates the core strength of the PPP–IRR–SRP approach.
While traditional P/E ratios vary dramatically — from 10.1 (Brazil) to 33.2 (China) — the corresponding IRRs cluster within a relatively tight band, 4.77% to 8.51%.
This narrow range reflects a global equilibrium of intrinsic equity yields once growth (g) and risk (r) are incorporated through the PPP formula.
The P/E ratio, therefore, is too volatile and context-dependent for meaningful global comparison, while the IRR serves as a homogeneous, yield-based metric suitable for ranking markets on a common scale.
The Stock Risk Premium (SRP) further refines this by subtracting each market’s risk-free rate, highlighting the excess yield available to equity investors in each region.
Two key insights emerge:
1. Operational comparability:
2. PPP and IRR compress valuation disparities, turning heterogeneous P/E data into a unified yield scale.
The IRR’s narrow dispersion — just 3.7 percentage points — contrasts sharply with the 23-point spread in P/E ratios.
3. U.S. growth sensitivity:
The simulated U.S. (2) scenario (with higher g = 18%) shows how incremental earnings growth shortens the PPP (14.89 → 13.37 years) and raises the IRR (4.77% → 5.32%), lifting the SRP from 0.74% to 1.29%. This indicates that stronger structural growth — such as from AI-driven productivity — could reposition the U.S. among mid-valued peers like France and the U.K.
1.6. Data Integrity
All P/E and EPS growth (g) figures are sourced from Simply Wall Street, ensuring transparency and cross-market consistency.
The U.S. (2) growth rate (g = 18%) represents the author’s own estimate, designed to model the potential long-term impact of AI-driven earnings acceleration.
For India and Brazil, a 5% cap on the discount rate (r) is applied solely in the computation of the Stock Risk Premium (SRP) to prevent over-penalizing high-rate markets, while PPP and IRR continue to use each country’s actual discount rate.
Having established the conceptual structure and internal consistency of the PPP–IRR–SRP framework, we now turn to its empirical validation through a real-world market test covering the period from February to October 2025.
2. Empirical Validation: The February–October 2025 Market Test
2.1. Objective
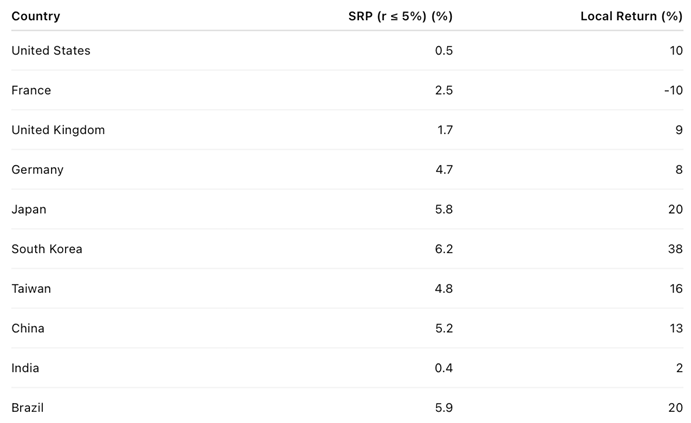
To evaluate SRP’s predictive power, PPP, IRR, and SRP were computed for ten major stock markets as of February 7, 2025.
Eight months later, by October 7, 2025, realized local-currency market performances were compared with their SRP values at the start of the period.
2.2. Regression Analysis: SRP vs. Subsequent Performance
Two regressions were estimated:
(a) USD returns (including dividends):
Return USD = 2.26 × SRP + 10.14 , r = 0.79 , R2 = 0.62
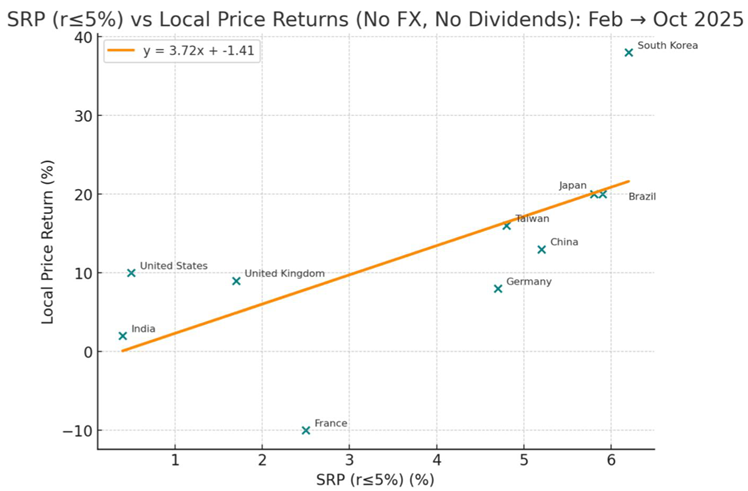
(b) Local-currency, price-only returns (no FX, no dividends):
Return local = 3.72 × SRP – 1.41 , r = 0.67 , R2 = 0.45
Both regressions show a strong positive correlation between SRP and subsequent performance.
Each +1 percentage point increase in SRP predicted roughly +3.7% higher local-currency return over eight months.
2.3. Empirical Regression Line (Local-Currency, r ≤ 5%)
Return local = 3.72 × SRP (with r ≤ 5%) – 1.41
Interpretation:
High-SRP markets such as South Korea, Japan, Brazil led global performance.
Low-SRP markets such as France, India, and the U.S. lagged or barely matched expectations.
The 5% cap successfully integrated Brazil and India into a coherent global relationship, avoiding distortions from their high nominal rates.
2.4. Graphical Regression Line (Feb–Oct 2025 Experience)
This regression line visually demonstrates that valuation-based excess yield (SRP) was a powerful predictor of subsequent market returns.
The relationship is robust, cross-geographical, and statistically meaningful — confirming SRP’s role as an empirical bridge between valuation and realized performance.
3. Ranking and Outlook — October 2025 to Mid-2026
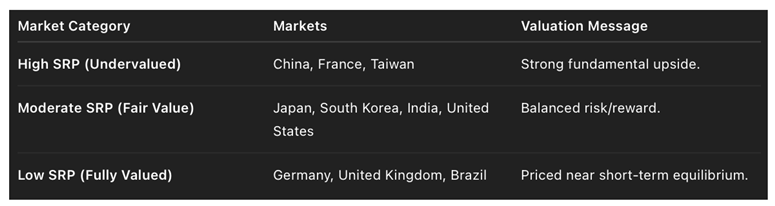
3.1. Interpreting Current SRP Levels
By October 2025, SRP differentials implied clear groupings in relative attractiveness:
Key takeaway:
Markets with SRP ≥ 3% still offer superior forward value, while those near 0–1% are essentially fully priced.
3.2. Six- to Twelve-Month Forecast
Asia:
● China and Taiwan stand out as undervalued based on their high SRP readings and relative underperformance since February.
● Japan and South Korea have delivered strong gains but remain fundamentally sound — likely to consolidate near fair value rather than reverse.
Europe:
● France appears undervalued after lagging the regression line, offering mean reversion potential.
● Germany and the U.K. are fully valued after their early-2025 rallies, suggesting limited short-term upside.
Americas:
● The U.S. is fairly valued; upside depends on whether the AI-driven growth scenario (USA (2), g = 18%) materializes.
● Brazil, after benefiting from the r-cap normalization, is likely near cyclical equilibrium with modest growth potential.
India:
● Valuations are rich, and SRP is low; a pause or mild correction is plausible before renewed upside in late 2026.
3.3. Regional Allocation Outlook (Next 6–12 Months)
4. Conclusion: The Predictive Power of SRP
The PPP–IRR–SRP model successfully converts valuation ratios into yield-based predictors of future performance.
Key insights:
P/E dispersion (10.1–33.2) renders conventional valuation analysis nearly useless for global ranking.
IRR homogeneity (4.77–8.51%) reveals a unified internal yield structure across markets.
SRP (r ≤ 5%) transforms these yields into a predictive excess-return measure — explaining 45–62% of subsequent market performance variation.
The February–October 2025 regression confirmed that markets with high SRP outperformed, validating SRP’s predictive precision.
As of October 10, 2025, SRP signals a rotation toward Asia and select European markets (China, Taiwan, and France) as the most promising opportunities for 2026,while markets like Germany, the U.K., and Brazil appear temporarily overextended.The U.S., under the AI-enhanced growth scenario, retains fair-value leadership among developed peers.
Final Assessment
The PPP–IRR–SRP framework offers investors a scientifically grounded, empirically proven, and globally comparable method to identify where to invest next.It transforms equity valuation from a static accounting ratio into a dynamic, predictive yield signal, uniting the logic of fundamental analysis with the precision of quantitative finance.
References
- Gordon, M. J. (1962). The Investment, Financing, and Valuation of the Corporation. Homewood, IL: Irwin. [CrossRef]
- Sharpe, W. F. (1964). “Capital Asset Prices: A Theory of Market Equilibrium Under Conditions of Risk.” Journal of Finance, 19(3), 425–442. [CrossRef]
- Modigliani, F., & Miller, M. H. (1958). “The Cost of Capital, Corporation Finance and the Theory of Investment.” American Economic Review, 48(3), 261–297.
- Fama, E. F., & French, K. R. (1992). “The Cross-Section of Expected Stock Returns.” Journal of Finance, 47(2), 427–465. [CrossRef]
- Damodaran, A. (2012). Investment Valuation: Tools and Techniques for Determining the Value of Any Asset (3rd ed.). Hoboken, NJ: Wiley.
- Ritter, J. R., & Warr, R. S. (2002). “The Decline of Inflation and the Bull Market of 1982–1999.” Journal of Financial and Quantitative Analysis, 37(1), 29–61. [CrossRef]
- Shiller, R. J. (2015). Irrational Exuberance (3rd ed.). Princeton, NJ: Princeton University Press.
- Asness, C. S., Frazzini, A., & Pedersen, L. H. (2019). “Quality Minus Junk.” Review of Accounting Studies, 24(1), 34–112. [CrossRef]
- Haugen, R. A., & Baker, N. L. (1996). “Commonality in the Determinants of Expected Stock Returns.” Journal of Financial Economics, 41(3), 401–439. [CrossRef]
- Ilmanen, A. (2011). Expected Returns: An Investor’s Guide to Harvesting Market Rewards. Hoboken, NJ: Wiley.
Table 1.
Valuation of National Stock Markets as of October 10, 2015. (including simulated U.S. high-growth scenario)
Table 1.
Valuation of National Stock Markets as of October 10, 2015. (including simulated U.S. high-growth scenario)
|
Disclaimer/Publisher’s Note: The statements, opinions and data contained in all publications are solely those of the individual author(s) and contributor(s) and not of MDPI and/or the editor(s). MDPI and/or the editor(s) disclaim responsibility for any injury to people or property resulting from any ideas, methods, instructions or products referred to in the content. |
© 2025 by the authors. Licensee MDPI, Basel, Switzerland. This article is an open access article distributed under the terms and conditions of the Creative Commons Attribution (CC BY) license (http://creativecommons.org/licenses/by/4.0/).