Submitted:
15 October 2025
Posted:
16 October 2025
You are already at the latest version
Abstract
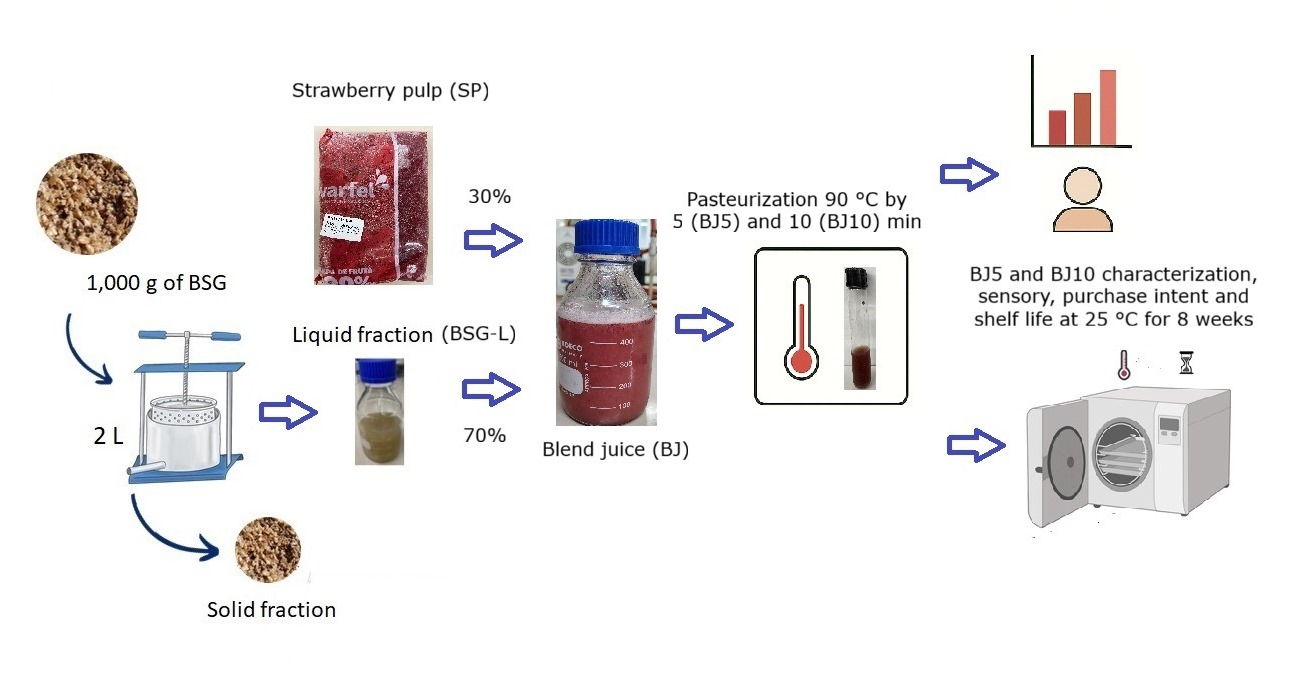
Brewer’s spent grain (BSG), a by-product of the brewing industry with 70–80% moisture, produces a liquid fraction during dewatering that can be combined with strawberry pulp (SP) to create a new food product. This study evaluated the use of BSG liquid fraction as a dilution medium for SP to develop a novel blend juice (BJ) and assess its shelf life after pasteurization. The optimal formulation consisted of 70% BSG liquid fraction and 30% SP, pasteurized at 95 °C for 5 min (BJ5) and 10 min (BJ10), and stored for 8 weeks at 25 °C. Pasteurization caused no significant (p > 0.05) changes in moisture, color, chemical composition, microbiological quality, or sensory properties. Both BJ5 and BJ10 showed sensory attributes, overall acceptance, and purchase intent comparable to two commercial Chilean blend juices. During storage, color, chemical, and microbiological parameters remained stable, though moisture, soluble solids, pH, and total polyphenol content were significantly affected (p < 0.05). Both pasteurization conditions ensured microbiological stability throughout the 8-week period. Overall, the pasteurized BSG–strawberry blend juice demonstrated good preservation, sensory quality, and consumer acceptance, suggesting strong potential as a sustainable and appealing product for the food and gastronomy industries.
Keywords:
Brewers’ spent grain
; dewatering
; liquor
; thermal treatment
; sensory juice
Highlights
The liquid fraction from BSG can be used to formulate a novel blend juice.
SP contributes with its physical and chemical properties to create a novel blend of juice.
Pasteurization enables the preservation of BSG–strawberry blend juice.
BSG–strawberry blend juice presents natural sugars.
Sensory of BSG–SP blend juice is comparable to commercial Chilean blend juices.
1. Introduction
Brewer’s spent grain (BSG) is a by-product of brewery industry, composed of husks of barley malt grain and its annual worldwide production is around 37 million tons, usually discarded or used for animal feed [1,2,3].
BSG is rich on dietary fiber and protein, but contain others important nutrients and bioactive compounds, such as lipids, starch, sugars, minerals, vitamins and polyphenolic compounds [1,2,4].
With a moisture content of 70–80%, BSG often undergoes dewatering to stabilize the solid fraction [5,6,7,8]. The resulting liquid fraction has shown potential for various applications, including the development of plant-based yogurt alternatives [9] and serving as a fermentation medium [10,11].
Finley et al. [5] obtained 42.1% of press water, which contained 3% solids, when wet BSG (from malt and corn) was dewatered using a Type 3A Davenport press. El-Shafey et al. [6] reported a decrease in the moisture of BSG cakes from 80 to 51% by filtration stage with hot-water squeezing, and finally to 20–30% with the application of vacuum over hot-squeezed cakes. Using a similar method, Machado et al. [7] were able to remove up to 95% of the water present in the BSG, decreasing its moisture content from 75 to 15%. Bjerregaard et al. [12] used a new type of continuous rotary drum press to produce a liquid filtrate that comprised 50% of the hot BSG mass. BSG treated without and with ultrasound and subsequently pressed with manual press of a 2 L stainless steel container, yielded 47.2 and 53.7 mL of liquid fraction per 100 g of BSG, respectively, and the BSG moisture decreased from 72.4-71.2 to 59.8-59.1% [8]. Akermann et al. [10] reported a yield of ∼17.6 kg of liquid fraction (liquor) per ∼34 kg of wet BSG, whose moisture content decreased from ∼75 to ∼65 wt%. The disposal or use of the liquid fraction of BSG should be studied to avoid adverse environmental effects [3,8].
The composition of BSG liquor obtained by a friction press (ENOL OP 20, Wein GmbH), from Wheat bock, Wheat, and Helles brewing recipe, includes sugars, protein, amino acids and minerals [10]. According to Shetty et al. [11], the liquid of BSG, produced using a rotary drum press equipped with a 300-μm filter, contained ca 12 g L-1 of fermentable (maltose and glucose) and unfermentable (raffinose and maltodextrin) sugars, besides a small amount of lactic acid (1.2 g L-1), acetic acid, and citric acid. Madsen et al. [9], using a filtration machine, obtained a 100 µm liquid fraction from BSG that was blended with a commercial unsweetened soy drink in a ratio of 20:80, and was chemically characterized by the presence of sugars, mannitol, pectin, acids, and ethanol, which was used to develop a product similar to yogurt. The main sugars found in the water extract of BSG were D-erythrose, fructose, D-tagatofuranose, xylose, glucopyranose, maltose, D-turanose, and cellobiose [13].
Strawberry pulp is a popular ingredient used in juices, yogurts, jams, jellies, and bakery products due to its bioactive compounds and sensory characteristics, primarily its color and aroma components [14,15,16]. Blends of different juices, pulp, puree or extracts, including those obtained from strawberry, have been studied for changes in their physical, chemical and sensory characteristics and to became more attractive to consumers that seek for bioactive compounds [17,18,19,20,21].
Recently, two processes for brewer’s spent grain into powders have been proposed, using pressing to physically separate the liquid and solid fractions for potential use in food applications [8]. Building on this concept, we considered that the liquid fraction obtained from BSG dewatering, when combined with strawberry pulp, could contribute to its physical and chemical properties to create a novel blend juice that can be effectively preserved through pasteurization. The objective of this study was to evaluate the use of the BSG liquid fraction as a dilution medium for strawberry pulp to produce a new blend juice and to assess its shelf-life stability following pasteurization.
2. Materials and Methods
2.1. BSG Liquid Fraction, Strawberry Pulp and Blend Juice
The wet BSG, with a moisture content of 72.4% weight base, was generously provided by Birrell Ltda., a craft brewery located in Villarrica, Chile, in the Araucanía Region. The BSG was portioned into 1,010 g samples, packaged in Ziploc® bags (26.8 × 27.3 cm, Racine, WI, USA), and immediately frozen at −18 °C. The additional 10 g in each sample was allocated for moisture measurement in each of the experimental replicates after the BSG was thawed. This step was taken to ensure the accuracy of the measurements required for the study. Each bag was thawed in a refrigerator for 24 h at a temperature of 4–5 °C. Once thawed, the BSG was pressing in a manual press equipped with a 2 L stainless steel container and a mechanical screw. In each repetition, 1,000 g of wet original BSG was pressed to produce two fractions: liquid and solid. The BSG liquid fraction (BSG-LF) was stored in Schott glass bottles and frozen at −18 °C [8].
The strawberry pulp (SP) was obtained as frozen product from Varfel (https://www.varfel.cl/), located in Temuco, Chile, which is a producer of natural and commercial frozen pulp from various fruits and vegetables.
Before to preparing the blend juice, both frozen components were thawed in a refrigerator for 24 h at a temperature of 4–5 °C.
The blend juice (BJ) was established during preliminary experiments to define the proportion of 70% BSG liquid fraction and 30% strawberry pulp.
2.2. Blend Juice Pasteurization
The pasteurization was performed using a 20 mL test screw cap tube (N° 9825, Pyrex®, México) with 10 mL of BJ. For this thermal treatment, a thermoregulated water bath equipment (WNB 14, Memmert, Germany) was used, fixed at a hot water temperature of 95 °C. The temperature of the bath water and juice blend during pasteurization was monitored with thermocouples (TM-906A, Lutron Electronic Enterprise Co., Taiwan) placed inside the bath equipment and in the center of the BJ volume in the test tube (at the central geometrical point), respectively. Heating of pasteurization was kept for 5 (BJ5) and 10 (BJ10) min. Afterwards, the blend juice in the test tube with a screw cap was cooled using a mixture of water and ice (~2°C), and the temperature of which was also monitored. Twenty-five tubes with blend juice were placed in a rack and used for each pasteurization at 5 and 10 min. Pasteurization temperature and time were selected based on the study by Xue et al. [22].
2.3. Shelf-Life of Pasteurized Blend Juice
After pasteurization, twenty tubes with screw cap containing each one 10 mL of blend juice of 70% BSG-LF – 30% SP, of each thermal treatment (5 and 10 min), were stored at 25 °C during eight weeks using a temperature-controlled chamber (Archiclima, Chile). At the end of the first, second, fourth and eighth weeks, moisture, color, chemical and microbiological characteristics were evaluated. The experiment was carried out in triplicate.
2.4. Analysis
2.4.1. Moisture Content
2.4.2. Instrumental Color
The instrumental color was measured using a Minolta Chromameter CR-200b colorimeter (Japan) with the CIE L*a*b* system, as described by Ruíz et al. [8] and Ihl et al. [24]. The instrument was first calibrated with a white standard tile (Y = 93.1, x = 0.3140, and y = 0.3212) under illuminant condition C (6774 K). The L* variable lightness index ranges in the scale from 0 for black to 100 for white. The a∗ scale measures the degree of red (+a*) or green (−a*) colors, and the b∗ scale measures the degree of yellow (+b*) or blue (−b*) colors.
For color measurement, each sample (20 mL) was homogeneously distributed in a 7 cm diameter Petri dish. Readings were taken by placing the instrument on the surface at five different points of each sample.
2.4.3. Soluble Solids
Samples were homogenized and measured with a refractometer (model 10430, Reichert-Jung, USA) as °Brix [27].
2.4.4. Reducing Sugar Content
The reducing sugar content was determined by the Miller method using 3,5-dinitrosalicylic acid (DNS) [13,28]. Previously, all samples were centrifuged at 10,000 rpm (10 min) using a centrifuge (GS-15, Beckman, USA). First, each supernatant sample was diluted to 1/150 with distilled water. Then 0.5 mL of the diluted sample and 1.5 mL of DNS reagent were added to a test tube. It was heated to 100 °C in a water bath for 5 min. Next, the test tube was chilled in an ice bath for 3 min. Finally, 7.5 mL of distilled water was added, and the absorbance was measured at 540 nm. The concentration of reducing sugar in the samples was estimated from the standard glucose curve, and the results were expressed as g per 100 g dry matter (d.m.).
2.4.5. pH
The pH was determined by direct immersing the electrode of a pH meter into the homogeneous mass. The pH meter was calibrated using buffered standards at pH levels of 4.01 and 7.00 [27].
2.4.6. Titratable Acidity (TA)
The TA was determined by potentiometric titration as described for Xue et al. [22]. To perform this analysis, a 5 mL sample was titrated with 1 mol L-1 sodium hydroxide solution until the pH reached 8.2 (±0.1). Subsequently, the TA content was calculated using Equation (2) and expressed in terms of citric acid equivalent.
where CNaOH is the concentration of sodium hydroxide (1 mol L-1), VNaOH is the volume of sodium hydroxide (mL), K is the conversion factor for citric acid (0.064) and W is the mass of the measured sample (g).
2.4.7. Total Polyphenol Content (TPC)
The Folin–Ciocalteau method was used for TPC determination. Samples were previously centrifuged at 10,864 x g (F0685 fixed-angle rotor for 10 min) using a centrifuge (GS-15, Beckman, USA). A 40-µL aliquot of each supernatant sample was mixed with distilled water (3.16 mL), added with 200 µL of Folin–Ciocalteau reagent, and, after 5 min, added with 600 µL of 20% Na2CO3 solution. Samples were kept at 20 °C for 120 min in the dark. The absorbance was measured at 765 nm using a spectrophotometer (Spectronic Genesys 10, Sweden), and the results were expressed as mg of gallic acid equivalents (GAE) per 100 g dry matter (d.m.) using a calibration curve [29].
2.4.8. Ascorbic Acid Content
Samples were previously centrifuged at 10,864 x g (F0685 fixed-angle rotor) for 10 min using a centrifuge (GS-15, Beckman, USA). Subsequently, the ascorbic acid reflectometric test strip (Merck, Germany) was immersed for 20 seconds in the supernatant, the liquid excess on test strip was removed, and the concentration was determined, introducing the strip for 10 seconds into Merck RQ Flex at 570/657 ± 10 nm [24]. The results were expressed as mg ascorbic acid per 100 g dry matter (d.m.).
2.4.9. Microbiology Determination
The aerobic mesophilic bacteria (AMB) and the yeast and mold (YM) were determined according to the Instituto de Salud Pública de Chile [30] and Choo et al. [31]. AMB count was examined using plate count agar (PCA), and YM counts were analysed using potato dextrose agar (PDA) with the addition of 10% tartaric acid. The PCA plate was incubated at 37 °C for 1-2 days, whereas the PDA plate was incubated at 25 °C for 3-5 days. Results were expressed as log colony-forming units (CFU) per mL of sample.
2.5. Sugar Characterization by HPLC
High-performance liquid chromatography (HPLC) analysis of sugars was conducted using a Shimadzu LC-20AT system (Kyoto, Japan) equipped with a refractive index detector (RID) and a Shim-pack GIST NH2 column (4.6 mm × 250 mm, 5 μm). Chromatographic separation was performed under isocratic conditions with a mobile phase of acetonitrile and water (75:25, v/v) at a flow rate of 1.0 mL/min. Prior to injection, all five samples (Table 3) were centrifuged, and the resulting supernatants were diluted 1:1 with the mobile phase. The samples were subsequently filtered through 0.22 µm membrane filters, and 20 µL aliquots were injected into the HPLC system in triplicate. The authentic standards of sugars used in the analysis were cellobiose, xylose, maltose, glucose, fructose, sucrose, raffinose, nystose, kestose, and turanose. Sugar identification was achieved by comparing sample retention times with those of authentic standards, and quantification was performed using calibration curves prepared from standard solutions.
2.6. Sensory Evaluation
It was performed according Lepaus et al. [32] and Cendrowski et al. [33] for blend juice prepared with 70% of BSG-LF and 30% of SP, before and after pasteurization, and two commercial blend juices. The samples were subjected to sensory evaluation by a group of 26 untrained panelists selected from staff and students of Chemical Engineering Department, Universidad de La Frontera, Temuco, Chile. The panelist rated the products based on a nine-point Hedonic score ranging from 1 (dislike extremely) to 9 (like extremely) for attributes color, appearance, consistency, aroma, taste, overall acceptance and purchase intent. Panelist received 30 mL of each sample in transparent plastic cups coded with three random digits, in random order. Participants also received a glass of water to clean their palates before each assessment.
2.7. Statistical Analysis
The data were subjected to analysis of variance for experiments described in 2.1., 2.2. and 2.3., which carried out in triplicate. For significant differences, Tukey’s honestly and t-Student post-hoc tests were applied to determine significant differences between means. Mean values were considered significantly different at p<0.05. Minitab® Statistical Software 21.0.3.1.0 (Chicago, USA) was used for data analysis.
3. Results and Discussion
3.1. Characterization of BSG Liquid Fraction, Strawberry Pulp and Blend Juice
Table 1 presents the characterization of BSG-LF, SP and BJ with respect to their moisture, color, chemical parameters, aerobic mesophilic bacteria count, and yeast and mold count. In general, the characteristics of BJ corresponded to a proportion of 70% and 30% of BSG-LF and SP, respectively.
The moisture content (Table 1) of the BSG-LF obtained by pressing in this study was 87.0% (w.b.). Although no previous reports were found on the moisture content of liquor or press water, Finley et al. [5] reported a ratio of 10,008 lb of water to 690 lb of solids after centrifugation of 10,698 lb of BSG press liquid, which corresponds to approximately 93.6% moisture. Bjerregaard et al. [12] reported dry weights of 9.45% and 10.3% in a liquid filtrate obtained from hot BSG by pressing using 100 and 300 μm pore size filters on a continuous rotary drum, respectively.
Color values L* (43.7), a* (0.2), and b* (12.9) of BSG-LF are similar or lower values than those informed by Ruíz et al. [8] for wet and press solid BSG, which were L* 44.1 and 45.0, a* 5.3 and 4.9, and b* 22.5 and 22.6, respectively. According to Adekunte et al. [26] classification, which considered ΔE > 3 as very different colors, the ΔE (13.2) of BSG-LF, determined using the BJ color parameters as a reference, indicates a strong change in color after blending BSG-LF with SP, as expected.
According to some studies [10,11,13], the liquid obtained from BSG for different methods included several sugars in its composition, which are represented in levels of soluble solid (13.5 °Brix) and reducing sugar (65.6 g 100 g-1 d.m.) determined for BSG-LF (Table 1 and Table 3).
The pH (6.26) of BSG-LF is slightly higher than the values (5.13 - 5.98) reported for Akermann et al. [10]for BSG liquor obtained by pressing from BSG, namely Wheat bock, Wheat, and Helles (Barley). The low titratable acidity (%) is in accordance with the small amount of lactic acid (1.2 g L-1), acetic acid, and citric acid reported by Shetty et al. [11].
The TPC in the BSG-LF (169.4 mg GAE 100 g-1 d.m.) shows that polyphenols present in wet BSG [1,2,4] are transferred to the liquid fraction by the pressing operation according to Ruíz et al. [8], who reported TPC of 304-305 mg GAE 100 g-1 d.m. for powder of BSG. Previously, the TPC of BSG was reported by Carciochi et al. [34] (2018), whose values ranged from 159 to 357 mg GAE 100 g-1 BSG d.m., and Meneses et al. [35] and Bonifácio-Lopes et al. [36], who determined 713 and 1300 mg GAE 100 g-1 BSG d.m., respectively. However, TPC values of BSG liquid or liquor have not been reported before. The Hibiscus sabdariffa extract, used to develop blends with different fruit juices, showed a phenolic content of 1,496 mg GAE 100 g-1 [37], which is 8.8 times higher than the TPC of BSG-LF. Defective coffee green beans and coffee silver skins as by-products, treated with 5 mL of 95% (v/v) methanol, showed a TPC of 2,722 and 536 mg GAE 100 g-1 d.m., respectively [38].
The method used to determine ascorbic acid can measure the range of 25-450 mg L-1; however, BSG-LF presented a value below 25 mg L-1, which is equivalent to a concentration less than 16,7 mg 100 g-1 d.m.
Aerobic mesophilic bacteria were present in 4.8 log CFU mL-1, which is within the AMB counts ranging from 2.58 to 6.12 log CFU g-1 of BSG immediately after lautering, reported by Robertson et al. [39]. They considered these values as microbiologically stable and within acceptable limits for food use. Pressing, described in 2.1. and, as noted by Ruíz et al. [8], could be an operation that contributes to transferring part of the AMB load from the original wet BSG obtained from the craft brewery to BSG-LF.
Characterization of strawberry pulp (Table 1) reveals a significantly lower moisture content (p < 0.05) compared to the value of BSG-LF; therefore, the latter allows the pulp to be diluted for consumption as juice. Strawberry juice presents a moisture of 91% according to Basiony et al. [40].
Color of concentrated and dried strawberry pulps have been reported with values of L* of 26.9, a* of 19.7 and b* of 7.3 [14] and L* of 22-38, a* of 19-22 and b* of 2-10 [16], respectively, which are similar to the color parameters determined in this work for SP. The ΔE (8.4) of SP, determined using the blend juice color parameters as a reference, evidences a strong change in color [26] after blending SP with BSG-LF.
Additionally, our results align with those reported by EL Moutaouakil et al. [41], who found pH levels ranging from 3.3 to 3.7 in several strawberry pulps, both before and after pasteurization. Regarding microbiological quality, our results agreed with the last-mentioned authors, who inform that after pasteurization (85°C/7.5min), the finished products do not contain microbiological agents such as total aerobic mesophilic flora, yeasts, molds, and enterobacteria. However, the solid soluble (29.1 °Brix) determined for the SP, which is a concentrated product, is 2.7 to 4.1 times higher than the values (7-11 °Brix) reported by the last-mentioned authors.
Typically, strawberry fruit, pulp and juice are sources of several acids, polyphenols, and ascorbic acid [15], compounds present in higher concentrations compared with BSG-LF.
Moisture content (82.4%) of BJ (Table 1), made with 70% of BSG-LF and 30% of SP, is below of the moisture ranging (85.9-88.2%) for several proportion blends of pumpkin juice with orange, carrot and lemon juices, which individual values of moisture were 91.4, 84.7, 89.0 and 89.8%, respectively [19]. The moisture content determined for our blend agrees with the proportion volume used in its formulation, and it is significantly different from the values of LB-BSG and SP.
Soluble solids of blend juice (17.2 °Brix) are higher than the total soluble solids of several pumpkin juice blends that range from 7 to 13.5 [19]; however, their pH values (5.03-5.71) are higher than that of the BJ (pH 4.28). Feng et al. [21] report values of total soluble solids of 7.8 °Brix, pH 3.38, total phenols of 877.69 mg GAE L-1, ascorbic acid content of 2.78 mg 100 mL-1, total aerobic bacteria of 4.19 log CFU mL-1, and YM of 4.21 log CFU mL-1 for blended strawberry–apple–lemon juice.
In general, the values of parameters present in Table 1 show that there are significant differences (p < 0.05) among BSG-LF, SP, and BJ. Although strawberry pulp is the smallest proportion in the blend juice formulation, both did not differ significantly (p > 0.05) for the parameters L*, b*, and pH, which would allow the BJ to be recognized as a strawberry product derivative.
3.2. Effect of Pasteurization on Blend Juice
Figure 1 and Figure 2 illustrate the temperature profiles of the blend juice during pasteurization and subsequent cooling. The measurements were recorded at the central geometric point of the sample contained in a 20 mL screw-cap test tube, as well as in the water of the thermoregulated bath. The heating phase was conducted for 5 and 10 min, followed by the cooling step.
As mentioned in the methodology, the water temperature of the thermoregulated bath equipment was fixed at 95 °C. When the rack with 20 tubes with screw cap, containing each one 10 mL of blend juice of 70% BSG-LF – 30% SP, was introduced in the bath water, the blend juice’s temperature increased, reaching the equilibrium with the water after 180 s at a temperature below 95 °C for both treatment pasteurization (Figure 1 and Figure 2). Xue et al. [22] reported a thermal pasteurization of 95 °C for 2 min that completely inactivated the total plate count, coliforms, yeast and mold in bayberry juice. Pasteurization treatment at Figure 1 shows that the temperature stabilization, at a range of 90-95 °C in the blend juice, was for 2 min (180 to 300 s). However, in Figure 2 the period of temperature stabilization was 7 min (180 to 600 s) for the same range of 90-95 °C. Radziejewska-Kubzdela [42] evaluated the effect of ultrasonic, thermal and enzymatic treatment on yield and content of bioactive compounds in strawberry mash using a batch heated up to a temperature of 80 °C for 15 min and then held for 5 min at this temperature. The mash heat was equivalent to other treatments for preservation of ascorbic acid, phenolic compounds and antioxidant activity, which in the last case was significantly higher than samples of untreated mash.
Table 2 presents the sugar content determined by HPLC before and after pasteurization of the blend juice obtained from a mixture of 70% BSG-LF and 30% SP.
The sugars identified in BSG-LF in this study have also been reported by others (Table 2). Glucose, maltose, and raffinose were detected in BSG liquid fraction in the study by Madsen et al. [9], while maltose and glucose were identified in the liquid of BSG by Shetty et al. [11].
The addition of strawberry pulp was responsible for increasing the reducing sugar content in BJ. Since the BSG-LF did not contain fructose and exhibited lower glucose levels, its combination with strawberry pulp enhanced the concentrations of these monosaccharides, which may improve the palatability and energy value of the beverage. On the other hand, the BSG liquid fraction showed higher levels of the disaccharide maltose, composed of two glucose units, and the trisaccharide raffinose, composed of galactose, fructose, and glucose. Complex carbohydrates may contribute to the prebiotic potential of the beverage, as they are less readily digested and can promote beneficial gut microbiota activity [43].
Table 3 shows the sensory evaluation, including acceptance and purchase intent, of BJ before and after pasteurization for 5 and 10 min at 95 °C. For comparison, two recognized Chilean commercial blend juices were included in this study; they were purchased at a supermarket in Temuco.

Table 3.
Sensory evaluation of the tested blend juice before and after pasteurization and two commercial fruit blend juices.
Table 3.
Sensory evaluation of the tested blend juice before and after pasteurization and two commercial fruit blend juices.
| Sample | Color | Appearance | Consistency | Aroma | Taste | Overall Acceptance |
Purchase Intent |
| BJ | 7.2 ± 1.3 a | 6.5 ± 1.4 a | 6.9 ± 1.1 a | 6.8 ± 1.4 a | 7.2 ± 1.5 a | 6.7 ± 1.5 a | 6.7 ± 1.5 a |
| BJ5 | 7.0 ± 1.5 a | 6.1 ± 1.8 a | 6.5 ± 1.4 a | 6.6 ± 1.6 a | 6.9 ± 1.6 ab | 6.7 ± 1.5 a | 6.5 ± 1.3 a |
| BJ10 | 6.7 ± 1.6 ab | 6.0 ± 2.0 a | 6.7 ± 1.3 a | 6.5 ± 1.4 a | 6.5 ± 1.2 ab | 6.6 ± 1.4 a | 6.2 ± 1.7 a |
| FS | 5.7 ± 1.7 b | 5.8 ± 1.6 a | 6.8 ± 1.6 a | 6.5 ± 1.6 a | 5.8 ± 1.8 b | 6.2 ± 1.8 a | 5.6 ± 2.3 a |
| AFE | 6.4 ± 2.0 ab | 6.2 ± 2.2 a | 6.8 ± 1.5 a | 6.2 ± 1.4 a | 6.3 ± 1.6 ab | 6.2 ± 1.7 a | 5.7 ± 2.1 a |
BJ: blend juice (70% BSG-LF - 30% SP) before pasteurization; BJ5 and BJ10: blend juice after pasteurization for 5 and 10 min at 95°C, respectively; FS: strawberry-cherry blend juice trademark Fundo Sofruco (https://www.larosasofruco.cl); AFE: apple-cherry blend juice trademark AFE (https://www.jugoafe.cl). In each column, different letters indicate significant differences by Tukey’s test at p < 0.05. Data are presented as mean ± standard deviation.
The panelists aged 20 to 62 years-old (mean age of 37.9 with 13.4 as standard deviation), with females and males in equal proportion, detected only a significant difference (p < 0.05) in color and taste attributes among all samples (Table 3). However, the pasteurization (BJ5 and BJ10) did not produce significant effect (p > 0.05) in all sensory attributes evaluated, overall acceptance and purchase intent respect to BJ. Our results show that the BJ5 and BJ10 sensory attributes are equivalent to those of two commercial blend juices (FS and AFE) sold throughout Chile.
The maintenance of sensory attributes (color, appearance, consistency, aroma, and taste) of BJ5 and BJ10 with respect to BJ as shown in Table 2, and physical and chemical characteristics presented in Table 4, agreed with the sugar composition. In contrast, Lepaus et al. [32] established a significant decrease (p < 0.05) in the evaluation of aroma, flavor, overall acceptance, and purchase intent by the panelists due to thermal treatment at 90 °C for 30 s in orange-carrot juice blend compared to the untreated one, associated with changes in aroma, flavor, and color compounds. A significant (α = 95%) effect was determined by Cendrowski et al. [33] on sensory preference (colour, aromatic odour, fruity odour, sweet taste, sour taste, tart taste, overall impression) of different mixed juices prepared with rose fruits (Rosa rugosa) and apple or strawberry, heat treated at 85 °C/15 min and then packed into 100 mL glass bottles. In our research, the panelists did not find a significant difference (p > 0.05) in sensory attributes (Table 3) among the pasteurized blend juices (BJ5 and BJ10), FS, and AFE, which are also thermally treated products
Table 4 presents the effects of pasteurization at 95 °C for 5 and 10 min on blend juice (70% BSG-LF and 30% SP) in terms of its moisture, color, chemical parameters, aerobic mesophilic bacteria count, and yeast and mold count. No relevant changes were observed in most parameters, and the AMB load was eliminated by both heat treatments (Figure 1 and Figure 2).
Moisture content (Table 4) of the blend juice decreased significantly (p < 0.05) after pasteurization (5 and 10 min). However, the level is still very high (81.9 and 81.7%, w.b.), which, together with the nutrient composition in blend juice, creates an optimal environment for the growth of spoilage microorganisms [22].
ΔE values (1.7 and 1.2), determined by comparing blend juices before and after pasteurization, showed medium and small differences in color, according to Adekunte et al. [26].
Soluble solids after the two conditions of pasteurization were higher (p < 0.05) than the value of blend juice before heat treatment, maybe due to the release of sugars and organic acids from the portion of pulp strawberry by breakdown of enzymes and temperature [31].
Only pH after pasteurization at 10 min decreased significantly (p < 0.05) compared to the value before submitting the blend juice to this thermal treatment. Choo et al. [31] and Xue et al. [22] did not observe significant changes in the quality of noni juice (90 °C for 1 min) and bayberry juice (95 °C for 2 min) after thermal pasteurization. This behavior aligns with the pasteurization of blended juice at 95 °C for 5 min, whose pH values did not differ significantly (p > 0.05) from those in its fresh condition.
Similar to BJ, Choo et al. [31] did not detect yeast and mold in fresh and pasteurized (90 °C for 1 min) noni juice.
3.3. Shelf Life of Pasteurized Blend Juice
Table 5 shows the evolution of shelf life at 25 °C of the BJ pasteurized at 95 °C for 5 and 10 min in terms of moisture, color, chemicals parameters, aerobic mesophilic bacteria count, and yeast and mold count. In general, the parameters evaluated remained stable up to 8 weeks, except for the total polyphenol content. Notably, AMB and YM stability was maintained during all period of storage.
Moisture content (Table 5) of blend juice pasteurized (5 and 10 min) decreased significantly (p < 0.05) during storage at 25 °C, however, for each storage day, it was similar between the two thermal treatments of blend juice. According to Choo et al. [31] for noni juice and Mandha et al. [44] for watermelon, pineapple and mango juice, high moisture content (81.7-80.7%) of the blend juice allows microbial growth and chemical reactions during storage, therefore, pasteurization at 80 °C for 1 to 15 min prevents microbial growth and preserves the juices.
The ΔE, determined by comparing blend juice immediately after pasteurization (5 and 10 min) and after each day of storage, showed values from 4.4 to 1.8, which is considered very and medium difference in color, according to Adekunte et al. [26]. The a* decreased significantly (p < 0.05) for both pasteurization times after two weeks of storage, which corresponds to the measure of red (+a*) hue.
Soluble solids increase significantly (p < 0.05) for blend juice pasteurized at 5 and 10 min during storage, which agrees with the evolution of total soluble solids in watermelon juice pasteurized at 80 ± 2 °C for 10 and 15 min, and stored at 4 °C for 14 days [44]. These authors mentioned a similar behavior for roselle-mango juices attributed to the hydrolysis of polysaccharides into monosaccharides during storage.
pH increased significantly (p < 0.05) for the blend juice pasteurized at 5 min during storage. In contrast, for BJ10, it remained stable, possibly due to the combined evolution of solid soluble and titratable acidity, which remained constant during storage.
The total polyphenol content was affected during storage, being significantly lower (p < 0.05) at the eighth week compared to the blend juice immediately after pasteurization at 95 °C by 5 and 5 min treatments. Phenol degradation was reported during storage of strawberry pulp and pasteurized watermelon juice for Gonçalves et al. [15] and Mandha et al. [44], respectively.
4. Conclusion
The blend juice formulated with a mixture of 70% BSG liquid fraction and 30% strawberry pulp, was pasteurized at 95 °C for 5 and 10 min and immediately cooled. It exhibited stable physicochemical, microbiological, and sensory properties. No significant differences (p > 0.05) were observed in moisture content, color, chemical composition, microbiological quality, or sensory attributes after thermal treatment. Furthermore, the sensory characteristics, overall acceptability, and purchase intent of BJ5 and BJ10 were comparable to those of two commercial Chilean blend juices (FS and AFE).
During storage at 25 °C for 8 weeks, BJ5 and BJ10 maintained their color, chemical, and microbiological stability; however, significant changes (p < 0.05) were observed in moisture content, soluble solids, pH, and total polyphenol content. Both formulations remained free from aerobic mesophilic bacteria, yeasts, and molds throughout storage, confirming the microbiological stability achieved under both pasteurization conditions.
Overall, the use of the brewer’s spent grain liquid fraction, obtained by pressing, as a dilution medium in combination with strawberry pulp enabled the development of a novel blend juice with an extended shelf life of up to 8 weeks at 25 °C. This product represents a promising innovation for the food and gastronomic industries, contributing to the valorization of brewery by-products and supporting the principles of a circular economy.
Author Contributions
Conceptualization, E.S.S.S., S.M.d.A. and V.A.N.M.; Methodology, V.A.N.M., P.S.M., C.d.S.M., H.L.S.S. and A.G.d.O.S.; Validation, V.A.N.M., B.B.D.V., A.I.P.A., P.S.M., C.d.S.M., H.L.S.S., C.A.V.O. and A.G.d.O.S.; Formal Analysis, V.A.N.M., B.B.D.V., A.I.P.A., P.S.M. and C.d.S.M.; Investigation, V.A.N.M., B.B.D.V., A.I.P.A., P.S.M., C.d.S.M., H.L.S.S., C.A.V.O. and A.G.d.O.S.; Resources, E.S.S.S. and S.M.d.A.; Data Curation, P.S.M., C.d.S.M. and A.G.d.O.S.; Writing—Original Draft Preparation, V.A.N.M., P.S.M., C.d.S.M., A.G.d.O.S. and E.S.S.S.; Writing—Review & Editing, P.S.M., C.d.S.M., A.G.d.O.S., C.A.V.O., S.M.d.A. and E.S.S.S.; Visualization, P.S.M., A.G.d.O.S., S.M.d.A. and E.S.S.S.; Supervision, S.M.d.A. and E.S.S.S.; Project Administration, P.S.M., S.M.d.A. and E.S.S.S.; Funding Acquisition, S.M.d.A. and E.S.S.S. All authors have read and agreed to the published version of the manuscript.
Funding
This study was funded by the Universidad de La Frontera, Project FAPESP-UFRO FPP22-0017 and Fundação de Amparo à Pesquisa do Estado de São Paulo, Project No 2022/09431-3.
Institutional Review Board Statement
Not applicable.
Informed Consent Statement
Not applicable.
Data Availability Statement
The original contributions presented in the study are included in the article, further inquiries can be directed to the corresponding authors.
Conflicts of Interest
The authors declare no conflict of interest, competing financial interests or personal relationships respect to work reported in this manuscript. The funders had no role in the design of the study; in the collection, analyses, or interpretation of data; in the writing of the manuscript; or in the decision to publish the results.
References
- Lynch, K.M.; Steffen, E.J.; Arendt, E.K. Brewers’ spent grain: A review with an emphasis on food and health. J. Inst. Brew. 2016, 122, 553–568. [CrossRef]
- Naibaho, J.; Korzeniowska, M.; Sitanggang, A.B.; Lu, Y.; Julianti, E. Brewers’ spent grain as a food ingredient: techno-processing properties, nutrition, acceptability, and market. Trends Food Sci. Technol. 2024, 152, 104685. [CrossRef]
- Ravanal, M.C.; Doussoulin, J.P.; Mougenot, B. Does sustainability matter in the global beer industry? Bibliometrics trends in recycling and the circular economy. Front. Sustain. Food Syst. 2024, 8, 1437910. [CrossRef]
- Verni, M.; Pontonio, E.; Krona, A.; Jacob, S.; Pinto, D.; Rinaldi, F.; Verardo, V.; Díaz-de-Cerio, E.; Coda, R.; Rizzello, C.G. Bioprocessing of brewers’ spent grain enhances its antioxidant activity: characterization of phenolic compounds and bioactive peptides. Front. Microbiol. 2020, 11, 1831. [CrossRef]
- Finley, J.W.; Walkera, C.E.; Hautala, E. Utilisation of press water from brewer’s spent grains. J. Sci. Food Agric. 1976, 27, 655–660. [CrossRef]
- El-Shafey, E.I.; Gameiro, M.L.F.; Correia, P.F.M.; De Carvalho, J.M.R. Dewatering of brewer’s spent grain using a membrane filter press: a pilot plant study. Sep. Sci. Technol. 2004, 39, 3237–3261. [CrossRef]
- Machado, R.M.; Rodrigues, R.A.D.; Henriques, C.M.C.; Gameiro, M.L.F.; Ismael, M.R.C.; Reis, M.T.A.; Freire, J.P.B.; Carvalho, J.M.R. Dewatering of brewer’s spent grain using an integrated membrane filter press with vacuum drying capabilities. Sep. Sci. Technol. 2016, 51, 692–700. [CrossRef]
- Ruíz, C.; Schalchli, H.; Melo, P.S.; Moreira, C.d.S.; Sartori, A.d.G.O.; de Alencar, S.M.; Scheuermann, E.S. Effect of physical separation with ultrasound application on brewers’ spent grain to obtain powders for potential application in foodstuffs. Foods 2024, 13, 300. [CrossRef]
- Madsen, S.K.; Priess, C.A.P.; Wätjen, S.; Øzmerih, M.A.; Mohammadifar, C.; Bang-Berthelsen, H. Development of a yoghurt alternative, based on plant-adapted lactic acid bacteria, soy drink and the liquid fraction of brewers' spent grain. FEMS Microbiol. Lett. 2021, 368, fnab093. [CrossRef]
- Akermann, A.; Weiermüller, J.; Christmann, J.; Guirande, L.; Glaser, G.; Knaus, A.; Ulber, R. Brewers’ spent grain liquor as a feedstock for lactate production with Lactobacillus delbrueckii subsp. lactis. Eng. Life Sci. 2019, 20, 168-180. [CrossRef]
- Shetty, R.; Petersen, F.R.; Podduturi, R.; Molina, G.E.S.; Wätjen, A.P.; Madsen, S.K.; Zioga, E.; Øzmerih, S.; Hobley, T.J.; Bang-Berthelsen, C.H. Fermentation of brewer's spent grain liquids to increase shelf life and give an organic acid enhanced ingredient. LWT–Food Sci. Technol. 2023, 182, 114911. [CrossRef]
- Bjerregaard, M.F.; Charalampidis, A.; Frøding, R.; Shetty, R.; Pastell, H.; Jacobsen, C.; Zhuang, S.; Pinelo, M.; Hansen, P.B.; Hobley, T.J. Processing of brewing by-products to give food ingredient streams. Eur. Food Res. Technol. 2018, 245, 545–558. [CrossRef]
- Herbst, G.; Hamerski, F.; Errico, M.; Corazza, M.L. Pressurized liquid extraction of brewer’s spent grain: kinetics and crude extracts characterization. J. Ind. Eng. Chem. 2021, 102, 370-383. [CrossRef]
- Lee, Y. C.; Lee S. H. Flavor quality of concentrated strawberry pulp with aroma recovery. J. Food Qual. 1992, 1992, 15321-332. [CrossRef]
- Gonçalves, G.A.S.; Resende, N.S.; Carvalho, E.E.N.; de Resende, J.V.; Vilas Boas, E.V. de B. Effect of pasteurisation and freezing method on bioactive compounds and antioxidant activity of strawberry pulp. Int. J. Food Sci. Nutr. 2017, 68, 682-694. [CrossRef]
- López-Ortiz, A.; Salgado, M.N.; Nair, P.K.; Balbuena, A.O.; Méndez-Lagunas, L. L.; Hernández-Díaz, W.N.; Guerrero, L.L. Improved preservation of the color and bioactive compounds in strawberry pulp dried under UV-Blue blocked solar radiation. Clean. Circ. Bioeconomy 2024, 9, 100112. [CrossRef]
- Jensen, G.S.; Wu, X.; Patterson, K.M.; Barnes, J.; Carter, S.G. In vitro and in vivo antioxidant and anti-inflammatory capacities of an antioxidant-rich fruit and berry juice blend. Results of a pilot and randomized, double-blinded, placebo-controlled, crossover study. J. Agric. Food Chem 2008, 56, 8326-8333. [CrossRef]
- Jensen, G.S.; Ager, D.M.; Redman, K.A.; Mitzner, M.A.; Benson, K.F. Pain reduction and improvement in range of motion after daily consumption of an açai (Euterpe oleracea Mart.) pulp-fortified polyphenolic-rich fruit and berry juice blend. J. Med. Food 2011, 14, 702-711. [CrossRef]
- Atef, A.M.; Nadir, A.S.; Mostafa, T.R. Studies on sheets properties made from juice and puree of pumpkin and some other fruit blends. J. Appl. Sci. Res. 2012, 8, 2632-2639.
- Salgado, J.M.; Ferreira, T.R.B.; Biazotto, F.O.; Dias, C.T.S. Increased antioxidant content in juice enriched with dried extract of pomegranate (Punica granatum) peel. Plant Foods Hum. Nutr. 2012, 67, 39–43. [CrossRef]
- Feng, X.; Zhou, Z.; Wang, X.; Bi, X.; Ma, Y. Comparison of high hydrostatic pressure, ultrasound, and heat treatments on the quality of strawberry–apple–lemon juice blend. Foods 2020, 9, 218. [CrossRef]
- Xue, L.; Zheng, Z.; Wu, Y.; Zhang, L.; Zhang, H.; Yang, N.; Xu, X.; Jin, Y.; Meng, M.; Wang, F. Induced electric field as alternative pasteurization to improve microbiological safety and quality of bayberry juice. Food Chem. 2025, 463, 141137. [CrossRef]
- Instituto de Salud Pública de Chile. Manual Métodos de Análisis Físico-químicos de Alimentos, Aguas y Suelo; Andros Ltda.: Santiago, 1998a; pp. 13–14.
- Ihl, M.; Aravena, L.; Scheuermann, E.; Uquiche, E.; Bifani, V. Effect of immersion solutions on shelf-life of minimally processed lettuce. LWT-Food Sci. Technol. 2003, 36, 591–599. [CrossRef]
- Pathare, P.B.; Opara, U.L.; Al-Said, F.A.J. Colour measurement and analysis in fresh and processed foods: A review. Food Bioprocess Technol. 2013, 6, 36–60. [CrossRef]
- Adekunte, A.; Tiwari, B.; Cullen, P.; Scannell, A.; O’Donnell, C. Effect of sonication on colour, ascorbic acid and yeast inactivation in tomato juice. Food Chem. 2010, 122, 500–507. [CrossRef]
- Scheuermann, E.; Ihl, M.; Beraud, L.; Quiroz, A.; Salvo, S.; Alfaro, S.; Bustos, R.O.; Seguel, I. Effects of packaging and preservation treatments on the shelf life of murtilla fruit (Ugni molinae Turcz) in cold storage. Packag. Technol. Sci. 2013, 27, 241–248. [CrossRef]
- Miller, G.L. Use of dinitrosalicylic acid reagent for determination of reducing sugar. Anal. Chem. 1959, 31, 426-428. [CrossRef]
- Pirce, F.; Vieira, T.M.F.S.; Augusto-Obara, T.R.; de Alencar, S.M.; Romero, F.; Scheuermann, E. Effects of convective drying assisted by ultrasound and osmotic solution on polyphenol, antioxidant and microstructure of murtilla (Ugni molinae Turcz) fruit. J. Food Sci. Technol. 2021, 58, 138–146. [CrossRef]
- Instituto de Salud Pública de Chile. Manual de Técnicas Microbiológicas para Alimentos y Aguas; Andros Ltda.; Santiago, Chile, 1998b; pp. 14–17.
- Choo, Y.X.; Teh, L.K.; Tan, C.X. Effects of sonication and thermal pasteurization on the nutritional, antioxidant, and microbial properties of noni juice. Molecules 2023, 28, 313. [CrossRef]
- Lepaus, B.M.; Santos, A.K.P.d.O.; Spaviero, A.F.; Daud, P.S.; de São José, J.F.B. Thermosonication of orange-carrot juice blend: overall quality during refrigerated storage, and sensory acceptance. Molecules 2023, 28, 2196. [CrossRef]
- Cendrowski, A.; Przybył, J.L.; Studnicki, M. Physicochemical characteristics, vitamin C, total polyphenols, antioxidant capacity, and sensory preference of mixed juices prepared with rose fruits (Rosa rugosa) and apple or strawberry. Appl. Sci. 2024, 14, 113. [CrossRef]
- Carciochi, R.A.; Sologubik, C.A.; Fernández, M.B.; Manrique, G.D.; D’Alessandro, L.G. Extraction of antioxidant phenolic compounds from brewer’s spent grain: optimization and kinetics modeling. Antioxidants 2018, 7, 45. [CrossRef]
- Meneses, N.G.T.; Martins, S.; Teixeira, J.A.; Mussatto, S.I. Influence of extraction solvents on the recovery of antioxidant phenolic compounds from brewer’s spent grains. Sep. Purif. Technol. 2013, 108, 152–158. [CrossRef]
- Bonifácio-Lopes, T.; Castro, L.M.G.; Vilas-Boas, A.; Campos, D.; Teixeira, J.A.; Pintado, M. Impact of gastrointestinal digestion simulation on brewer’s spent grain green extracts and their prebiotic activity. Food Res. Int. 2023, 165, 112515. [CrossRef]
- Ogundele, O.M.A.; Awolu, O.O.; Badejo, A.A.; Nwachukwu, I.D.; Fagbemi, T.N. Development of functional beverages from blends of Hibiscus sabdariffa extract and selected fruit juices for optimal antioxidant properties. Food Sci. Nutr. 2016, 4, 679–685. [CrossRef]
- Prandi, B.; Ferri, M.; Monari, S.; Zurlini, C.; Cigognini, I.; Verstringe, S.; Schaller, D.; Walter, M.; Navarini, L.; Tassoni, A.; Sforza, S.; Tedeschi, T. Extraction and chemical characterization of functional phenols and proteins from coffee (Coffea arabica) by-products. Biomolecules 2021, 11, 1571. [CrossRef]
- Robertson, J.A.; I'Anson, K.J.; Treimo, J.; Faulds, C.B.; Brocklehurst, T.F.; Eijsink, V.G.H.; Waldron, K.W. Profiling brewers’ spent grain for composition and microbial ecology at the site of production. LWT–Food Sci. Technol. 2010, 43, 890–896. [CrossRef]
- Basiony, M.; Saleh, A.; Hassabo, R.; AL-Fargah, A. The effect of using pomegranate and strawberry juices with red beet puree on the physicochemical, microbial and sensory properties of yoghurt. J. Food Meas. Charact. 2023, 17, 5024–5033. [CrossRef]
- EL Moutaouakil, S.; EL Madhi, Y.; Inekach, S.; Chauiyakh, O.; Nabil, Benzakour, A.; Ouhssine, M. Evaluation of the physicochemical and microbiological quality of strawberry pulp in a moroccan food industry company. RJPT. 2024, 17, 2505-2509.
- Radziejewska-Kubzdela, E. Effect of ultrasonic, thermal and enzymatic treatment of mash on yield and content of bioactive compounds in strawberry juice. Appl. Sci. 2023, 13, 4268. [CrossRef]
- Kanwal, F.; Ren, D.; Kanwal, W.; Ding, M.; Su, J.; Shang, X. The potential role of nondigestible raffinose family oligosaccharides as prebiotics. Glycobiology 2023, 33, 274–288. [CrossRef]
- Mandha, J.; Shumoy, H.; Matemu, A.O.; Raes, K. Characterization of fruit juices and effect of pasteurization and storage conditions on their microbial, physicochemical, and nutritional quality. Food Biosci. 2023, 51, 102335. [CrossRef]
Figure 1.
Temperature monitoring of the blend juice and bath water for pasteurization with a heating step of 5 min and subsequent cooling.
Figure 1.
Temperature monitoring of the blend juice and bath water for pasteurization with a heating step of 5 min and subsequent cooling.
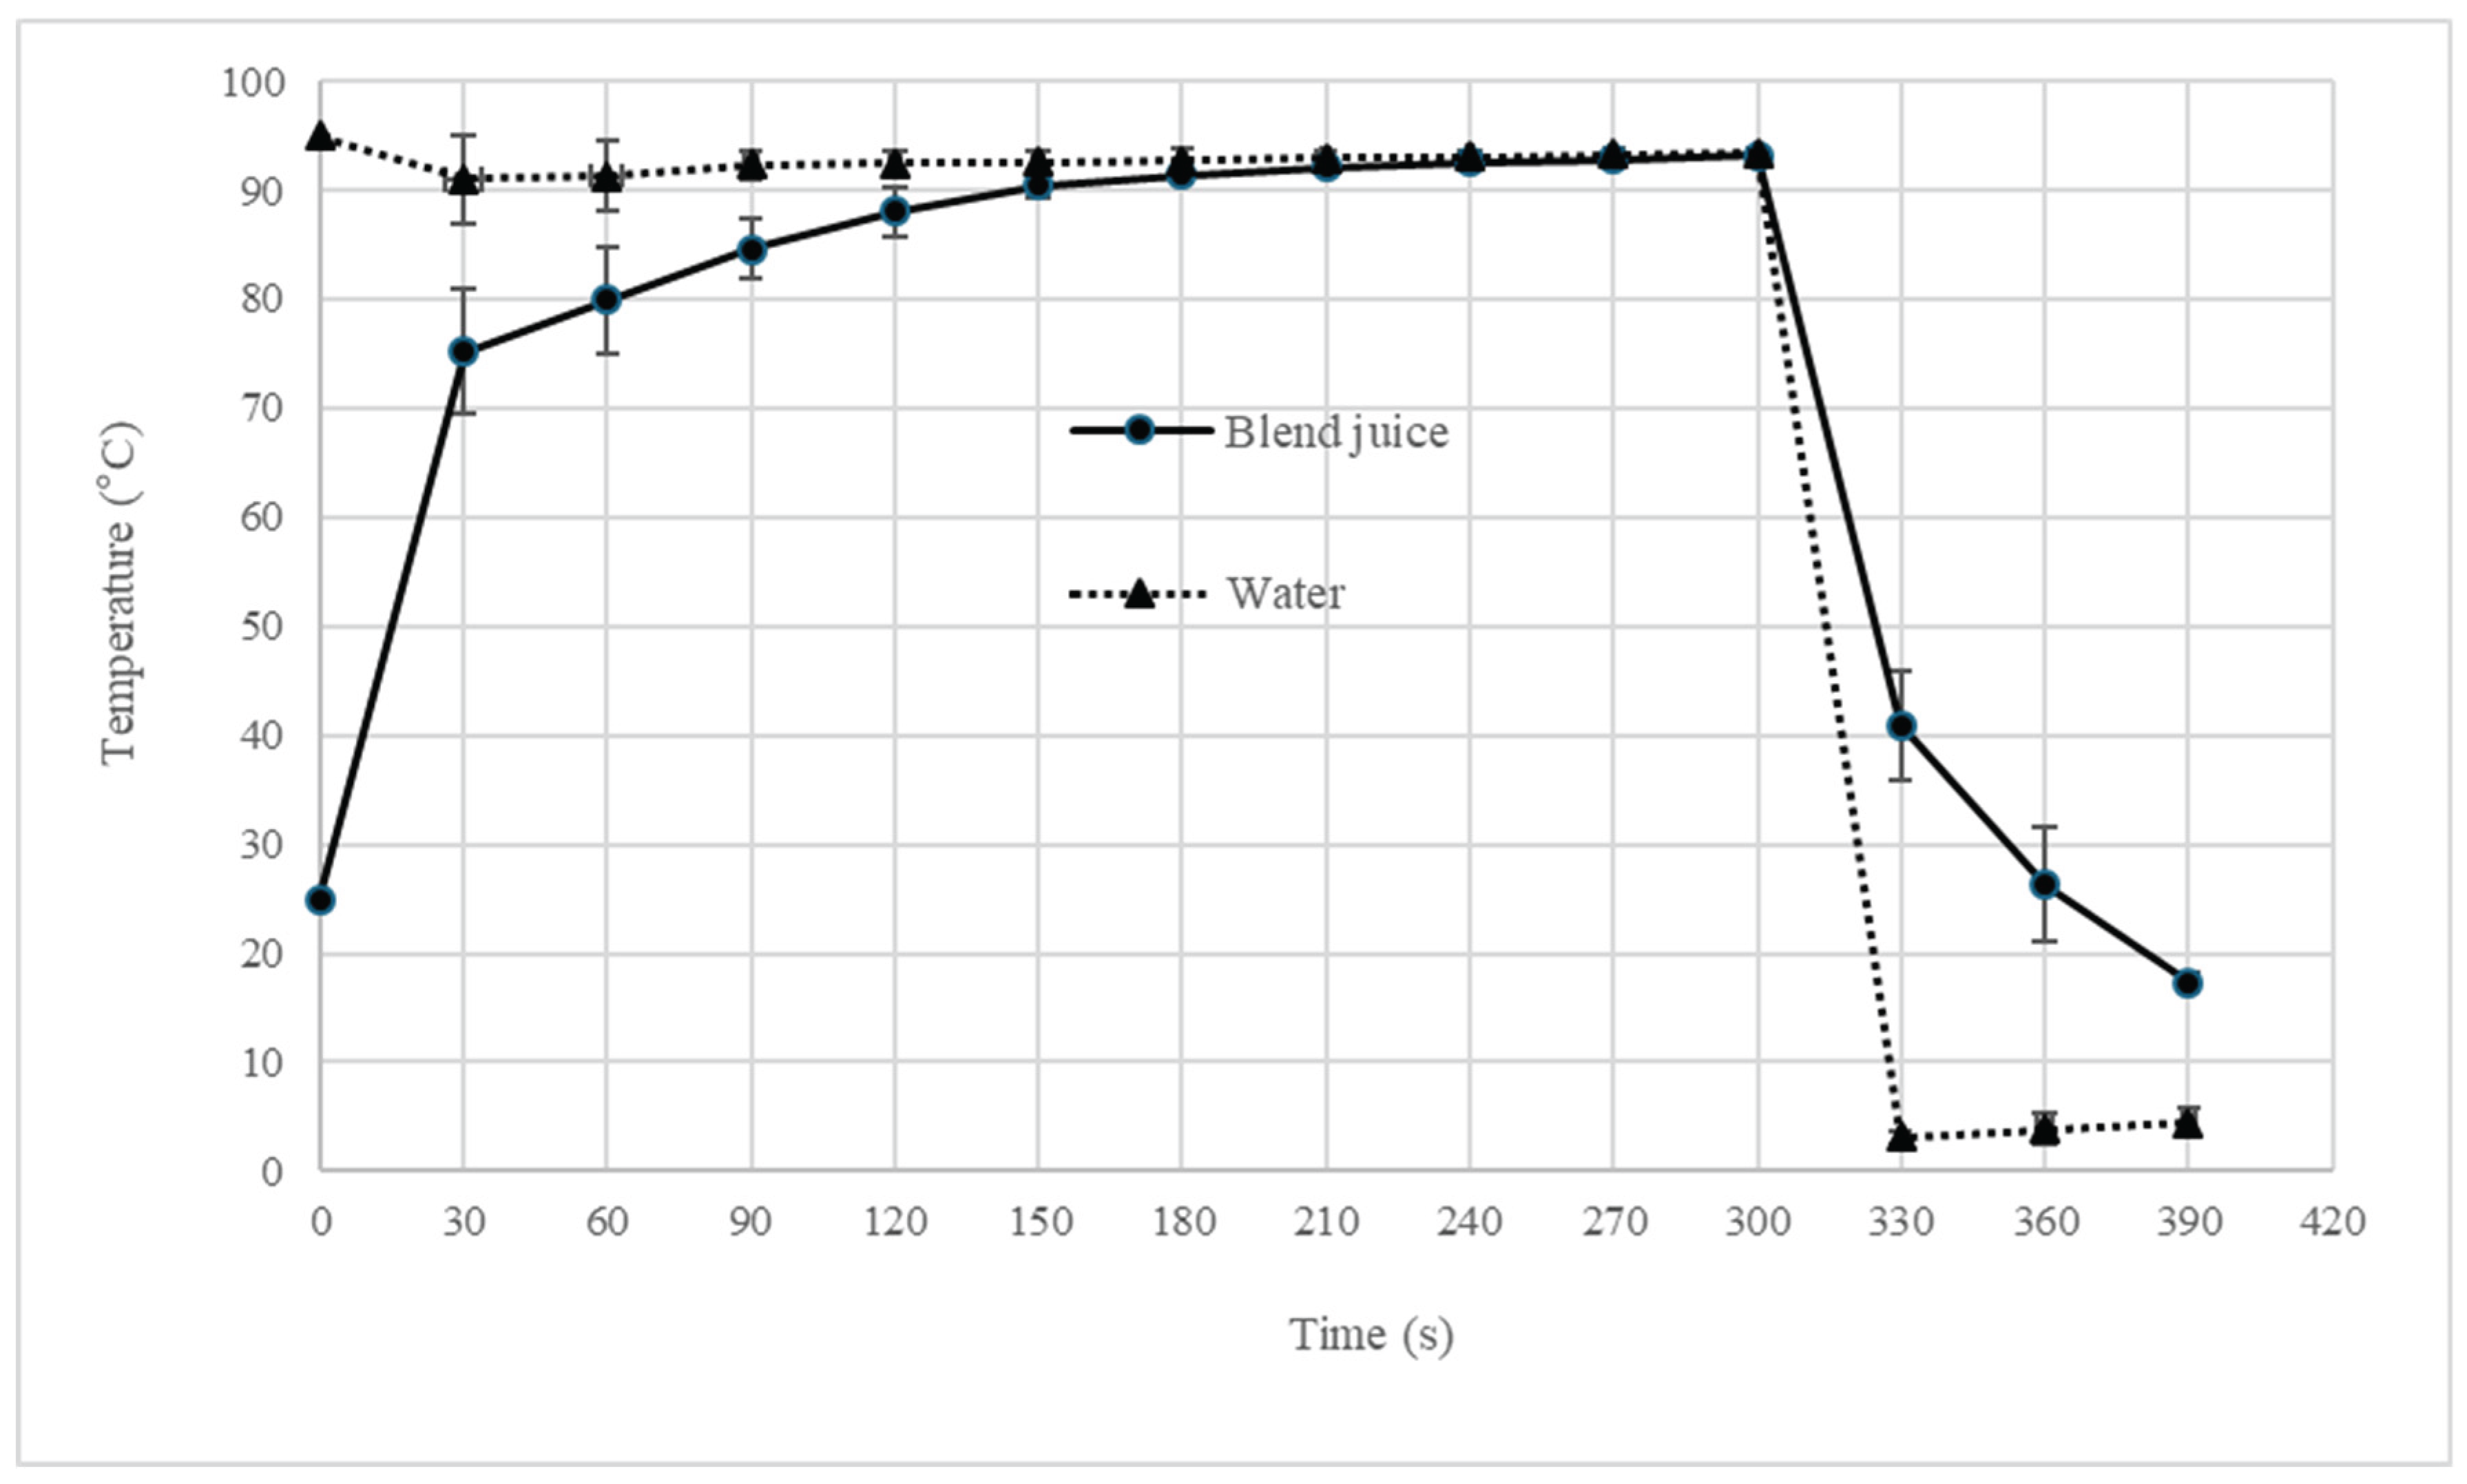
Figure 2.
Temperature monitoring of the blend juice and bath water for pasteurization with a heating step of 10 min and subsequent cooling.
Figure 2.
Temperature monitoring of the blend juice and bath water for pasteurization with a heating step of 10 min and subsequent cooling.
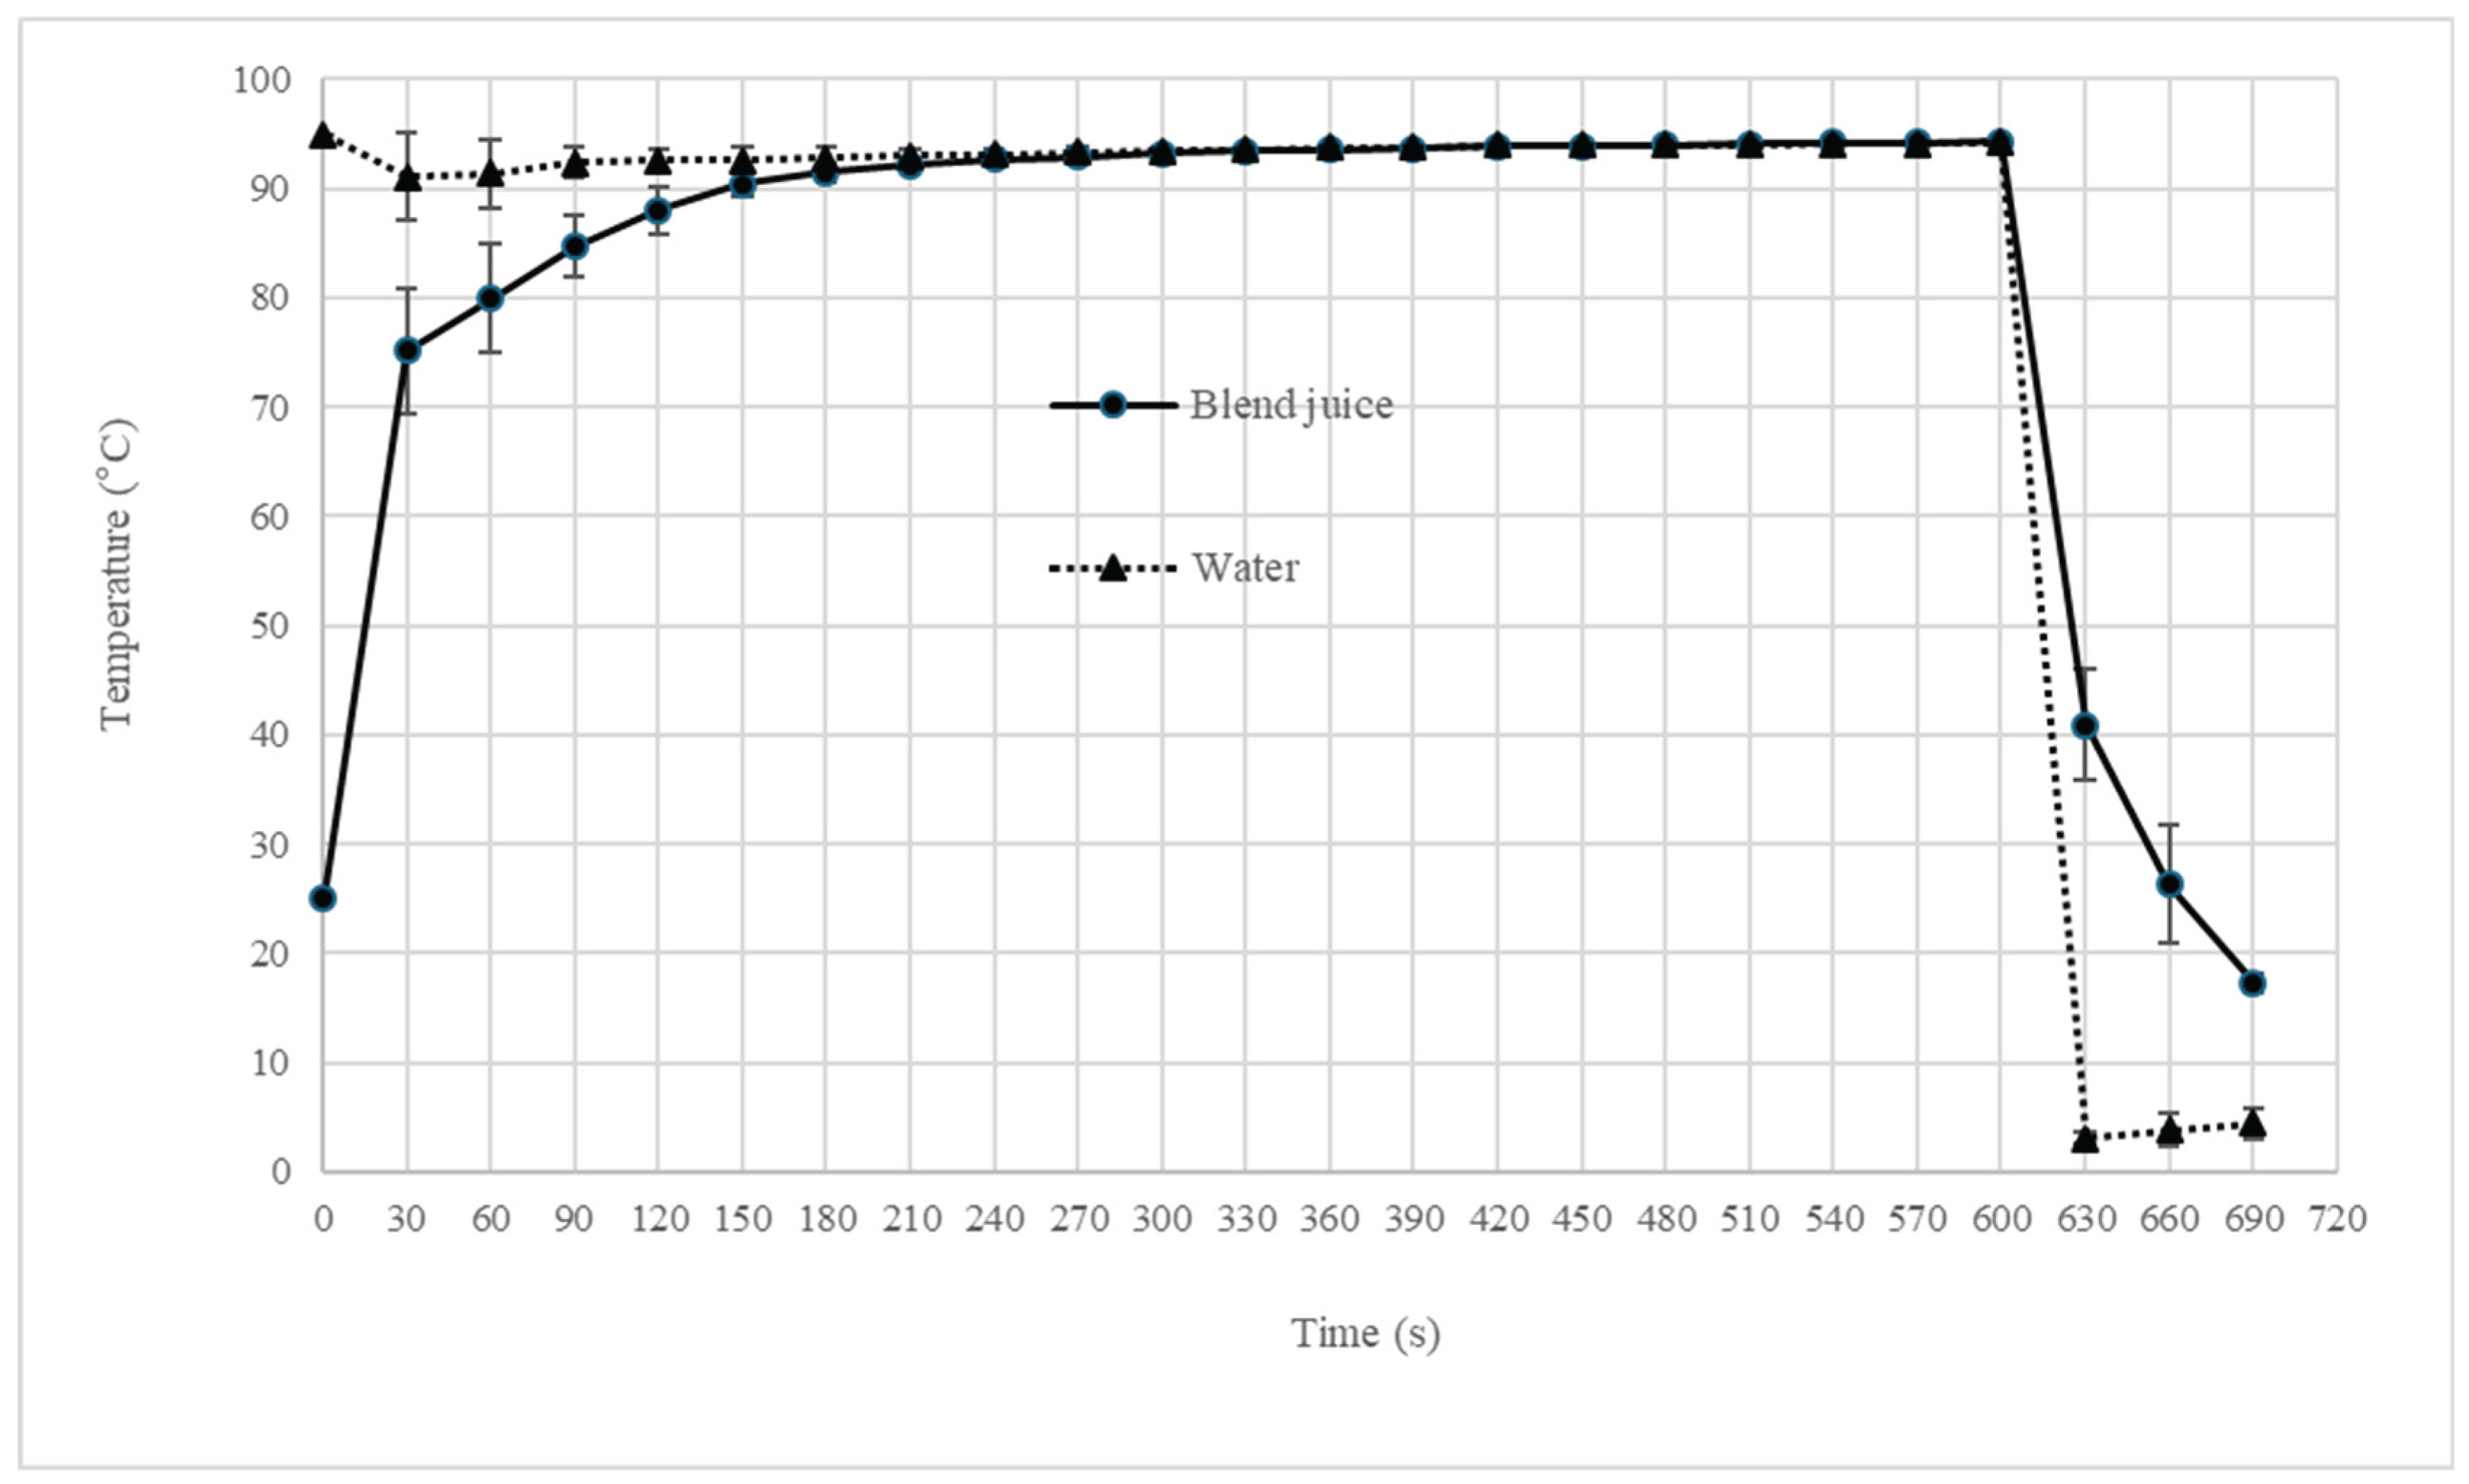
Table 1.
Moisture, color, chemical and microbiological characteristics of BSG liquid fraction, strawberry pulp and blend juice.
Table 1.
Moisture, color, chemical and microbiological characteristics of BSG liquid fraction, strawberry pulp and blend juice.
| Parameter | BSG-LF | SP | BJ |
| Moisture content (%, w.b.) | 87.0 ± 0.1 a | 69.2 ± 0.1 c | 82.4 ± 0.1 b |
| Color | |||
| L* | 43.7 ± 4.3 a | 30.1 ± 0.6 b | 34.4 ± 0.4 b |
| a* | 0.2 ± 0.3 c | 15.9 ± 0.8 a | 8.9 ± 0.1 b |
| b* | 12.9 ± 0.2 a | 11.4 ± 0.4 b | 10.6 ± 0.5 b |
| ΔE | 13.2 ± 2.9 a | 8.4 ± 0.4 a | - |
| Soluble solid (° Brix) | 13.5 ± 0.1 c | 29.1 ± 0.1 a | 17.2 ± 0.2 b |
| Reducing sugar (g 100 g-1 d.m.) | 65.6 ± 1.3 a | 20.9 ± 0.1 c | 47.4 ± 0.8 b |
| pH | 6.26 ± 0.09 a | 3.64 ± 0.16 c | 4.28 ± 0.03 c |
| Titratable acidity (%) | 0.065 ± 0.007 c | 0.663 ± 0.067 a | 0.243 ± 0.002 b |
| TPC (mg GAE 100 g-1 d.m.) |
169.4 ± 13.2 b | 256.6 ± 10.3 a | 181.2 ± 3.3 b |
| Ascorbic acid (mg 100 g-1 d.m.) | < 16,7 | 30.9 ± 3.2 a | 23.2 ± 1.5 b |
| Microbiology | |||
| AMB (log CFU mL-1) | 4.8 ± 0.1 a | Absent | 3.5 ± 0.0 b |
| YM (log CFU mL-1) | Absent | Absent | Absent |
BSG-LF: BSG liquid fraction; SP: Strawberry pulp; BJ: blend juice (70% BSG-LF - 30% SP) before pasteurization; w.b.: wet basis; d.m.: dry matter; AMB: aerobic mesophilic bacteria; YM: yeast and mold; CFU: colony forming unit. In each row, different letters indicate significant differences by Tukey’s test at p < 0.05 or by the t-Student test at p < 0.05 when two data were compared. Data are presented as mean ± standard deviation.
Table 2.
Sugar content (mg mL-1) in BSG liquid fraction, strawberry pulp and blend juice before and after pasteurization.
Table 2.
Sugar content (mg mL-1) in BSG liquid fraction, strawberry pulp and blend juice before and after pasteurization.
| Sample | Fructose | Glucose | Maltose | Raffinose |
| BSG-LF | n.d. | 12.16 ± 0.16 d | 61.83 ± 0.72 a | 17.14 ± 0.39 a |
| SP | 28.50 ± 0.76 a | 31.05 ± 1.12 a | n.d. | n.d. |
| BJ | 11.22 ± 0.70 b | 23.87 ± 0.54 b | 34.58 ± 1.06 b | 11.84 ± 1.20 b |
| BJ5 | 10.44 ± 0.42 b | 19.26 ± 0.46 c | 31.75 ± 0.96 c | 10.92 ± 0.86 b |
| BJ10 | 11.19 ± 0.64 b | 20.82 ± 1.02 c | 34.50 ± 1.68 b | 11.48 ± 0.61 b |
BSG-LF: BSG liquid fraction; SP: Strawberry pulp; BJ: blend juice (70% BSG-LF - 30% SP) before pasteurization; BJ5 and BJ10: blend juice after pasteurization for 5 and 10 min at 95°C, respectively; n.d.: not detected. In each column, different letters indicate significant differences by Tukey’s test at p < 0.05. Data are presented as mean ± standard deviation.
Table 4.
Moisture, color, chemical and microbiological characteristics of the blend juice before and after pasteurization.
Table 4.
Moisture, color, chemical and microbiological characteristics of the blend juice before and after pasteurization.
| Parameter | BJ | BJ5 | BJ10 |
| Moisture content (%, w.b.) | 82.4 ± 0.1 a | 81.9 ± 0.1 b | 81.7 ± 0.1 b |
| Color | |||
| L* | 34.4 ± 0.4 a | 33.5 ± 0.6 a | 33.9 ± 1.0 a |
| a* | 8.9 ± 0.1 a | 8.7 ± 0.6 a | 8.7 ± 0.7 a |
| b* | 10.6 ± 0.5 a | 9.4 ± 0.8 a | 9.9 ± 0.7 a |
| ΔE | - | 1.7 ± 0.5 a | 1.2 ± 0.3 a |
| Soluble solid (° Brix) | 17.2 ± 0.2 b | 17.7 ± 0.2 a | 18.0 ± 0.0 a |
| Reducing sugar (g 100 g-1 d.m.) | 47.4 ± 0.8 a | 48.9 ± 2.9 a | 49.4 ± 3.4 a |
| pH | 4.28 ± 0.03 a | 4.18 ± 0.02 ab | 4.14 ± 0.07 b |
| Titratable acidity (%) | 0.243 ± 0.002 a | 0.259 ± 0.031 a | 0.260 ± 0.030 a |
| TPC (mg GAE 100 g-1 d.m.) |
181.2 ± 3.3 ab | 172.8 ± 4.4 b | 186.8 ± 1.8 a |
| Ascorbic acid (mg 100 g-1 d.m.) | 23.2 ± 1.5 a | 27.9 ± 2.5 a | 26.7 ± 3.6 a |
| Microbiology | |||
| AMB (log CFU mL-1) | 3.5 ± 0.0 | Absent | Absent |
| YM (log CFU mL-1) | Absent | Absent | Absent |
BJ: blend juice (70% BSG-LF - 30% SP) before pasteurization; BJ5 and BJ10: blend juice after pasteurization for 5 and 10 min at 95°C, respectively; w.b.: wet basis; d.m.: dry matter; AMB: aerobic mesophilic bacteria; YM: yeast and mold; CFU: colony forming unit. In each row, different letters indicate significant differences by Tukey’s test at p < 0.05. Data are presented as mean ± standard deviation.
Table 5.
Shelf life at 25 °C of the blend juice after pasteurization at 90 °C by 5 and 10 min.
| Parameter | Immediately after pasteurized | Storage time at 25 °C (Week) | ||||
| 1 | 2 | 4 | 8 | |||
| Moisture content (%, w.b.) | BJ5 | 81.9 ± 0.1 aA | 81.6 ± 0.0 abA | 81.3 ± 0.2 bA | 81.7 ± 0.1 abA | 81.4 ± 0.2 bA |
| BJ10 | 81.7 ± 0.1 aA | 80.7 ± 0.2 cA | 80.9 ± 0.2 bcA | 81.4 ± 0.0 abA | 80.9 ± 0.0 bcA | |
| Color | ||||||
| L* | BJ5 | 33.5 ± 0.6 aA | 36.1 ± 2.6 aA | 34.3 ± 2.0 aA | 34.9 ± 1.7 aA | 34.6 ± 0.4 aA |
| BJ10 | 33.9 ± 1.0 bA | 37.3 ± 2.6 aA | 33.9 ± 0.7 bA | 33.6 ± 1.0 bA | 33.4 ± 0.6 bB | |
| a* | BJ5 | 8.7 ± 0.6 aA | 8.5 ± 0.5 aA | 7.3 ± 0.8 bA | 6.5 ± 0.5 bB | 6.8 ± 0.5 bA |
| BJ10 | 8.7 ± 0.7 abA | 9.0 ± 0.7 aA | 7.6 ± 0.5 bcA | 7.1 ± 0.4 cA | 7.1 ± 0.6 cA | |
| b* | BJ5 | 9.4 ± 0.8 aA | 10.5 ± 2.3 aA | 8.1 ± 0.5 aA | 9.7 ± 2.2 aA | 10.1 ± 1.6 aA |
| BJ10 | 9.9 ± 0.7 aA | 12.1 ± 2.6 aA | 9.3 ± 1.2 aA | 9.8 ± 1.7 aA | 9.8 ± 0.4 aA | |
| ΔE | BJ5 | - | 2.9 ± 2.5 aA | 2.7 ± 1.4 aA | 3.6 ± 2.1 aA | 3.2 ± 0.7 aA |
| BJ10 | - | 4.4 ± 2.6 aA | 1.8 ± 0.9 aA | 2.5 ± 0.7 aA | 2.0 ± 1.0 aA | |
| Soluble solid (° Brix) | BJ5 | 17.7 ± 0.2 bcA | 17.5 ± 0.0 cB | 18.0 ± 0.1 abB | 18.2 ± 0.3 aA | 18.3 ± 0.2 aB |
| BJ10 | 18.0 ± 0.0 dA | 19.1 ± 0.1 aA | 18.9 ± 0.1 bA | 18.5 ± 0.2 cA | 19.0 ± 0.1 abA | |
| Reductor sugar (g 100 g-1 d.m.) | BJ5 | 48.9 ± 2.9 aA | 46.2 ± 0.4 aA | 48.0 ± 5.2 aA | 49.1 ± 0.9 aA | 47.2 ± 0.7 aB |
| BJ10 | 49.4 ± 3.4 aA | 49.3 ± 3.4 aA | 42.4 ± 0.2 bA | 48.6 ± 1.7 aA | 49.4 ± 0.3 aA | |
| pH | BJ5 | 4.18 ± 0.02 bA | 4.07 ± 0.01 cB | 4.19 ± 0.01 bA | 4.17 ± 0.01 bB | 4.27 ± 0.01 aA |
| BJ10 | 4.14 ± 0.07 aA | 4.17 ± 0.01 aA | 4.17 ± 0.01 aA | 4.24 ± 0.01 aA | 4.27 ± 0.01 aA | |
| Titratable acidity (%) | BJ5 | 0.259 ± 0.031 aA | 0.254 ± 0.001 aA | 0.247 ± 0.001 aA | 0.242 ± 0.002 aA | 0.252 ± 0.001 aA |
| BJ10 | 0.260 ± 0.030 aA | 0.280 ± 0.001 aB | 0.246 ± 0.002 aA | 0.250 ± 0.000 aA | 0.251 ± 0.001 aA | |
| TPC (mg GAE 100 g-1 d.m.) |
BJ5 | 172.8 ± 4.4 aB | 170.0 ± 2.2 aB | 147.8 ± 0.3 bB | 149.0 ± 7.8 bB | 134.0 ± 3.7 cA |
| BJ10 | 186.8 ± 1.8 abA | 195.7 ± 5.1 aA | 160.1 ± 0.0 cA | 175.9 ± 7.5 bA | 136.2 ± 7.8 dA | |
| Ascorbic acid (mg100 g-1 d.m.) | BJ5 | 27.9 ± 2.5 aA | 23.5 ± 1.3 abA | 21.1 ± 0.9 bA | 22.9 ± 0.9 abA | 22.0 ± 1.5 abA |
| BJ10 | 26.7 ± 3.6 aA | 22.2 ± 1.2 aA | 23.1 ± 1.5 aA | 23.2 ± 0.6 aA | 21.4 ± 0.3 aA | |
| Microbiology | ||||||
| AMB (log CFU mL-1) | BJ5 | Absent | Absent | Absent | Absent | Absent |
| BJ10 | Absent | Absent | Absent | Absent | Absent | |
| YM (log CFU mL-1) | BJ5 | Absent | Absent | Absent | Absent | Absent |
| BJ10 | Absent | Absent | Absent | Absent | Absent | |
BJ5 and BJ10: blend juice after pasteurization for 5 and 10 min at 95°C, respectively; w.b.: wet basis; d.m.: dry matter; AMB: aerobic mesophilic bacteria; YM: yeast and mold; CFU: colony forming unit. For one parameter, in each column, different capital letters indicate significant differences determined by the t-Student test at p < 0.05, while different lowercase letters in each row indicate significant differences based on Tukey’s test at p < 0.05. Data are presented as mean ± standard deviation.
Disclaimer/Publisher’s Note: The statements, opinions and data contained in all publications are solely those of the individual author(s) and contributor(s) and not of MDPI and/or the editor(s). MDPI and/or the editor(s) disclaim responsibility for any injury to people or property resulting from any ideas, methods, instructions or products referred to in the content. |
© 2025 by the authors. Licensee MDPI, Basel, Switzerland. This article is an open access article distributed under the terms and conditions of the Creative Commons Attribution (CC BY) license (http://creativecommons.org/licenses/by/4.0/).
Copyright: This open access article is published under a Creative Commons CC BY 4.0 license, which permit the free download, distribution, and reuse, provided that the author and preprint are cited in any reuse.


