
Submitted:
14 October 2025
Posted:
15 October 2025
You are already at the latest version
Abstract
Brake discs are critical components of a train’s pneumatic braking system and require monthly preventive maintenance, including cleaning, measurement, and visual inspection. Visual inspections, guided by standards such as UNE-EN 14535-3 and the Faiveley Transport technical manual, involve assessing cracks classified by size and type (penetrating, incipient, superficial). This study presents an automated solution for crack detection and classification using thermal imaging and artificial intelligence. A low-cost Flir Lepton 3.1R thermal camera was used to identify cracks based on size and location. The proposed method integrates the YOLOv8m model with a U-Net (ResNet50 backbone) and a CNN for improved detection and segmentation. Compared to previous approaches using YOLOv4 or Mask-RCNN, this combination provides higher precision in identifying thermal cracks on railway brake discs. The process begins with thermal image acquisition and data augmentation through noise injection and geometric transformations, producing a robust dataset for training the neural networks. Experimental results demonstrate the feasibility of applying AI and thermal imaging for predictive maintenance, achieving a 97% detection accuracy. Furthermore, the study confirms that using higher-resolution thermal datasets enhances model performance, making this approach a cost-effective and reliable tool for automated brake disc inspection.
Keywords:
convolutional neural networks (CNNs)
; thermal imaging camera
; cracks
; brake disc
; Yolov8
; hollow wear
1. Introduction
In the heavy-duty vehicle industry, such as trucks, trains, and even airplanes, preventive maintenance includes essential tasks such as visual inspection. One of the critical aspects of these inspections is the detection of cracks in the brake discs. Traditional visual inspection methods have significant limitations, such as susceptibility to human error, lack of consistency, and the repetitive and tedious nature of work [1,2]. In response to these limitations, automating the inspection process emerges as an effective solution to optimize evaluation time and allow technical staff to focus on other maintenance tasks. However, to ensure accurate detection and determine which cracks are classified as acceptable or unacceptable, the first major challenge arises: the limited documentation and research regarding what qualifies as an unacceptable crack in brake discs. The only sources that provide a detailed classification of cracks by size and type are maintenance manuals from railway brake disc manufacturers. Currently, we rely on the Faiveley Transport manual “Axle-mounted brake disc WKS 640G-NB” [3] that defines penetrating cracks as unacceptable and, under certain conditions, also classifies incipient cracks as such (Figure 1). The penetrating cracks run across the entire inner and outer diameter of the brake disc, fully penetrating the cross section. Incipient cracks originate on the friction surface, either at the inner or outer edge of the friction ring, and locally penetrate that area. These are considered acceptable up to 70mm in length, although this limit may vary depending on the manufacturer or maintenance company. This regulatory gap poses a challenge to automating railway maintenance, as it prevents the establishment of objective intervention criteria. Therefore, this study adopts Faiveley Transport’s parameters, considering cracks longer than 80 mm as unacceptable. This criterion was directly implemented into the automatic classification system, enabling the model to distinguish between acceptable and unacceptable cracks based on thermal analysis. This integration helps overcome the lack of unified standards and allows maintenance decisions to be standardized through artificial intelligence.
Superficial cracks are also detailed, such as cracks in the friction surface that do not penetrate the side of the friction ring in the axial direction. In addition, they are allowed up to 70 mm and touch the outer edge, and if they are more than 10 mm from the edge (inner or outer) and measure less than half of the diameter b (Figure 2). As with incipient cracks, the value of 70 mm can vary, and this study will also work with permissible cracks of up to 80 mm.
First, the Yolov8 training model was selected, chosen after evaluating different object detection models. Wang [1] was able to detect areas affected by corrosion and cracks in the aerospace industry by combining computer vision and machine learning using the Mask R-CNN model. In their research, they managed to integrate visual inspection by technical personnel and augmented reality glasses when making the detection in real time. Similarly, for the metallurgical industry, Konovalenko [4] performs the detection of abrasions and scratches on metal surfaces with a database of 9385 in grayscale, using the ResNet152 training model. Wang [5], who used thermo graphic vision to detect five imperfections: upward deformation, black line, cracks, inclusion of gas bubbles and slag, and convolutional neural networks (CNN) were used to heat a sheet of metal with these deformations by passing it through hot rollers. Wang [6] and Liu [7] incorporate the use of the YoloV4 and SLF-Yolo models, respectively, both improved for the detection of defects, bumps, and cracks in metal surfaces. These investigations have evaluated previous Yolo models (You Only Look Once) that were discarded, since the proposed method exceeds the average average accuracy of previous models. Yu [8] takes a different approach, since, instead of using existing methods, he proposes a deep learning precision metal corrosion detector based on Deep Learning reaching an average accuracy of 84.96%, surpassing its investigated counterpart, Yolov3-tiny. Aboulhson [9] evaluates various detection models such as CNNs, FPN, and U-Net, incorporating "Explainable Artificial Intelligence" (XAI), which introduces a greater understanding of the decision-making processes of steel surface defect detection models. Zhang [10] uses the Yolov8-CM model, achieving an overall detection of 90% and crack detection of 74%, exceeding its previous counterparts (v4, v5, v7). Chen [11] performs the detection of defects in aluminum surfaces by proposing an improved algorithm based on the Yolov8n model, also comparing two databases: the "Tianchi aluminum profile surface defect dataset" (APDDD) and the GC10-DET and demonstrated that the proposed model improves the average accuracy by 6.6% and 7.7% respectively.
In this study, the FLIR Lepton 3.1R thermal camera was selected to acquire thermal images of brake discs with and without cracks, due to its low cost, 160 × 120 px resolution, and compatibility with the Raspberry Pi 5. This single-board computer was used as an embedded platform to load the trained neural network and run the classification system in the field. To validate the functionality of the model, a simulated railway environment was created using artificially heated car brake discs to replicate the heat generated by friction under real conditions. The thermal images obtained were used to train crack detection and segmentation models.
The methodology developed was divided into two main phases. In the first phase, a FLUKE PTi120 camera was used to acquire thermal images of a simulated brake disc. These images were processed, augmented, and used to train a base model with Yolov8, in order to preliminarily validate the feasibility of the thermal approach. In the second phase, new images were acquired using the FLIR Lepton 3.1R camera, allowing the creation of a larger and higher-quality dataset. These images were augmented and processed to train a Yolov8m model. Subsequently, the U-Net with ResNet50 architecture was trained on the same data set to perform semantic segmentation, and finally an additional CNN was integrated to classify the detected cracks by type. This hybrid architecture was evaluated using standard metrics and experimentally validated.
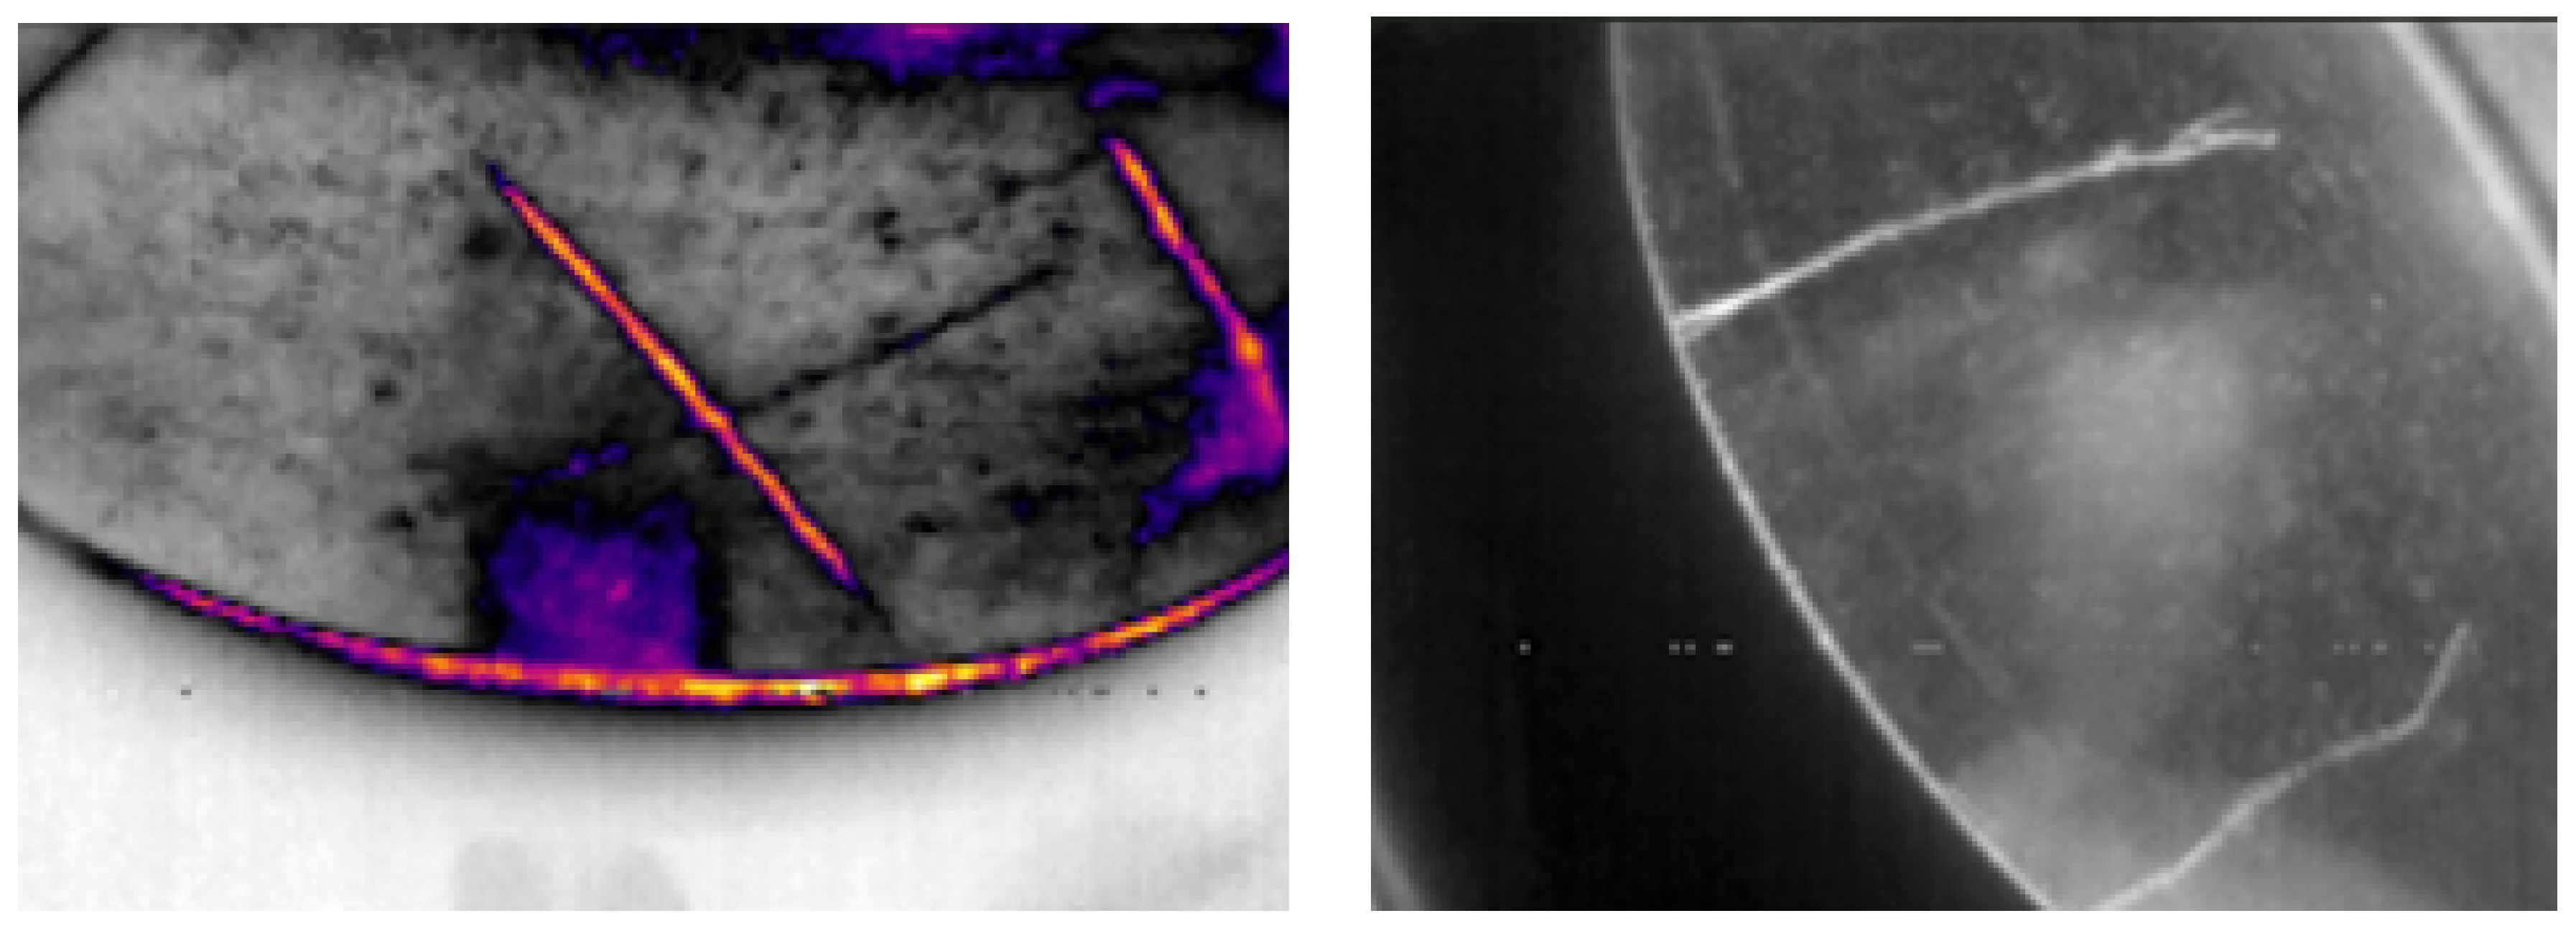
Figure 3.
Disc crack with combined vision (left) and grayscale (right). Own elaboration (2025)
This complete methodological workflow is summarized in Figure 4 and is further detailed in the following sections, including a comparative analysis between models and a discussion of the future applicability of the system in real railway environments.
2. Methodology
For the development of this study, experimental and simulation methods were used, organized in a sequence of four main stages: (A) Theoretical Justification, (B) Yolov8 Method: Data Augmentation and Initial Training Data augmentation and Initial Training, (C) Yolov8 medium and U-Net (ResNet50) method: Data acquisition and augmentation and (D) D. Yolov8 medium and U-Net (ResNet50) method: How it works.
2.1. Theoretical Justification
The use of thermal cameras for the inspection of the brake disc is based on the principle that, during braking, the friction between the brake pads and the disc generates a significant heat accumulation in the contact zones [12,13,14]. In urban trains, these areas can reach temperatures of up to 80°C. When this heat is not evenly distributed due to irregularities in wear, such as hollow movement or oblique movement, it can lead to thermal concentrations (hot spots), which are often more pronounced in areas where cracks are present, as these areas tend to accumulate and retain more heat than the surrounding material [15,16]. This contrast in temperature provides a thermal signature that can be captured with infrared imaging.
Studies have shown that it is not necessarily the maximum temperature, but the repeated thermal cycling, heating, and cooling during braking, that contributes to the development of material fatigue [17,18,19]. While this highlights the risk of crack formation, it also reinforces the value of thermal imaging as a non contact tool for early crack detection. For this reason, the FLIR Lepton 3.1R thermal camera was selected for this study, as it accurately captures the real thermal variations on the brake discs. Its 160 × 120 px resolution is adequate for identifying thermal discontinuities associated with superficial or incipient cracks. This thermal data is later used in a classification model based on convolutional neural networks, allowing the identification and risk assessment of each detected crack according to its location and thermal contrast.
In addition, environmental conditions have also been documented to influence the type and rate of wear. Zhong [19] demonstrated that irregular temperature variations caused by intermittent contact between the pad and the disc create rapidly repeating stresses that promote crack formation. Wang [20] observed that cracks tend to initiate at the oxidized grain boundaries, which can appear as localized hot spots. Ma [21] and Ding [22] found that humidity and extreme cold alter the pattern of brake wear, making it more prone to damage, especially during intermittent braking. Jiang [23] and Ghadimi [24] both emphasized the role of internal thermal stress in crack progression, which makes thermal contrast a relevant metric for detection. Finally, Li [25] emphasized that thermal analysis can be a key tool to anticipate such failures, recommending the use of infrared imaging as part of a predictive monitoring system in high-speed trains.
2.2. Yolov Method8: Data Augmentation and Initial Training
As a first step, a car brake disc was used to preliminarily validate the model’s performance. Fine cracks were created using a 3 mm drill bit. The disc was then heated with a hot plate that simulates the effect of brake pad´s friction, reaching temperatures between 70° C and 80°C. This setup was designed to replicate the train environment, and the thermal images (Figure 5) were captured using an initial Fluke PTi120 camera with a resolution of 120 × 90 px.
The captured thermal images were preprocessed before being used to train the YOLOv8 model. First, they went through the bicubic interpolation process, so the original image went from 120 x 90 px to 640 x 480 px, then data augmentation techniques were applied, including geometric transformations (rotations and scaling) and noise injection, with the aim of improving the model’s robustness. Subsequently, the images were subjected to histogram equalization to enhance the color contrast. In addition, the eight bit planes of each image were extracted, and new representations were reconstructed using the most significant bits. These were combined using logical OR operations to produce a ’cleaner’ version that highlights the main patterns while reducing low-intensity noise. Adaptive binarization was then performed using a Gaussian edge detection filter and a Laplacian filter, with their outputs inverted to emphasize relevant structures, such as fine cracks. Finally, contours were identified and filtered, discarding those with an area smaller than 5000 px but larger than 500 px, thereby retaining only regions with a significant probability of containing cracks. Figure 6 illustrates the processing steps applied to the images.
Once the pre-processing and segmentation steps were completed, a final dataset of 2,069 images was obtained. Using bounding boxes, the cracks were labeled, as shown in Figure 6. From this set, 1,654 images (80% of the dataset) were used to train the YOLOv8 model, and 415 images were used for validation. This preparation enabled the training of a robust system capable of accurately detecting cracks under controlled conditions, laying the groundwork for future implementation in real-world environments. Subsequently, the trained weights were loaded onto the Raspberry Pi 5.
Figure 7.
Labeling of leaked image cracks with "bounding box" for neural training. Own elaboration (2024)
Figure 7.
Labeling of leaked image cracks with "bounding box" for neural training. Own elaboration (2024)
Finally, by calculating the spatial resolution of the captured images, as shown in Equations (1) and (2), it was possible to estimate the actual size of the cracks in millimeters.
where:
- HFOV is the total width of the field of view in the plane of the object in degrees;
- VFOV is the total height of the field of view in the plane of the object in degrees;
- D the distance from the camera to the disk (mm);
- is the horizontal angle of the field of view in degrees;
- is the vertical angle of the field of view in degrees;
- is the conversion factor of degrees to radians.
The conversion from pixels to millimeters was based on the distance between the camera and the disc (D), along with the horizontal (HFOV) and vertical (VFOV) fields of view, allowing for an accurate estimation of the actual length of the detected cracks. This calculation was essential for implementing the 80 mm dimensional criterion established by Faiveley Transport. The cracks were then automatically classified into two categories: ’Admissible’ (displayed in green) and ’Inadmissible’ (in red), according to defined dimensional thresholds. This study focused on inadmissible cracks greater than 80 mm, as specified by the manufacturer Faiveley, as shown in Figure 8.
2.3. Yolov8 Medium and U-Net (ResNet50) Method: Data Acquisition and Augmentation
Once the previous model was validated, a new acquisition of thermal images was carried out using worn car brake discs, where some cracks were again manually introduced using the previously mentioned 3 mm drill bit. The images were captured using the FLIR Lepton 3.1R thermal camera, which has a resolution of 120 × 160 px. In this stage, two types of thermo graphical image formats were used in this stage. First, grayscale thermal images were captured, displaying raw temperature distributions in monochrome format. Second, a hybrid color map representation was applied: in this format, pixels above the average temperature of the image were highlighted using a heatmap color scale, while the remaining pixels were preserved in grayscale. This method aimed to enhance the visual contrast of thermal anomalies, such as cracks. Both types of images are shown in Figure 9.
However, in order to obtain a larger dataset for model training, several limitations were encountered, including the availability and source of images. This challenge has been noted in various previous studies, in which the NEU-DET data set has been used as a reference [26,27,28,29]. To address this issue, 500 photos were captured using the combined vision mode and another 500 using the grayscale mode. The captured images underwent an initial quality enhancement process using bicubic interpolation, increasing the original resolution from 120 × 160 px to 640 × 480 px without significantly compromising image detail. The next step involved labeling the cracks in the disc.
Once the labeling process of the 2,000 images was completed, data enhancement techniques were applied to enrich the data set and improve the model’s generalization capability. These techniques included noise injection, geometric transformations (rotations, scaling, and translations), and brightness and contrast adjustments. As a result, the dataset was expanded to a total of 27,000 images, of which 80% was used for training, while the remaining 20% were reserved for validation, all for Yolov8m training. Figure 10 illustrates the validation results obtained after training the model with this enhanced data set. And a detailed distribution of the data set is summarized in Table 1.
Finally, to train the U-Net with the ResNet50 architecture, the images of the original data set were used to generate semantic segmentation masks, where pixel values of 0 represented the background and 1 represented the crack. Instead of training with the full 640×480 px resolution masks, the masks were used to crop only the regions of interest, i.e., the cracks, resulting in smaller images focused solely on the defect area. To prevent overfitting and ensure training consistency, the Albumentations library was used to perform data augmentation techniques, including noise injection, geometric transformations, color and brightness adjustments, additionally, padding was applied to standardize the cropped images to a resolution of 256×256 px. This refined data set was then used to train both the U-Net (ResNet50) and an additional Convolutional Neural Network (CNN), which were integrated into a sequential architecture. In this structure, the output from the YOLOv8m model is first used to identify regions of interest, which are then passed to the U-Net (ResNet50) for precise segmentation, and finally processed by the CNN for crack classification. A key distinction of U-Net with the ResNet50 model is that it does not rely on bounding boxes, but instead uses semantic segmentation masks (Figure 11). This enabled a more precise crack location when used after YOLOv8m, allowing the system to accurately capture the shape, length, and boundaries of each detected crack by size (“Admissible” or “Inadmissible”).
2.4. Yolov8 Medium and U-Net Method: How It Works
The original U-Net architecture was modified to optimize its adaptation to the distinctive characteristics of the detected cracks. Specifically, the ResNet architecture was incorporated as a backbone to enhance feature extraction through more effective filter selection. Furthermore, the binary cross-entropy loss function (3) was replaced with a sigmoid activation function (4), and the max pooling process was adjusted by reducing the down-scaling factor to 2×2. This procedure is illustrated in detail in Figure 12. As a result of these modifications, the combination with the YOLOv8m model yielded a more accurate crack detection, enabling the identification of the exact shape and extent of each imperfection on the brake disc surface. This approach proved particularly beneficial for improving visual precision in inspection tasks.
where:
- x: Is the input value to the function (the output from the previous layer).
- e: Is the base of the natural logarithm.
- : Is the output of the sigmoid function, a value between 0 and 1.
- L: Is the calculated loss value.
- N: Is the number of samples (or pixels in the case of segmentation).
- : Is the true label for the i-th sample (0 or 1).
- : Is the predicted probability for the i-th sample by the model (a value between 0 and 1, typically the output of the sigmoid function).
- log: Represents the natural logarithm.
The U-Net architecture, augmented with a ResNet50 backbone, functions efficiently by combining robust feature extraction with precise spatial localization for semantic segmentation. The ResNet50 backbone acts as the encoder, progressively down-sampling the input image through its convolutional and residual blocks (stem, followed by Stages 1-4). This process allows it to extract a hierarchical set of increasingly abstract and deep features, crucial for recognizing complex patterns such as the subtle edges and textures of thermal cracks; the full process is presented in Fig. Figure 13. As stated, ResNet50’s strength lies in its capacity to capture these deep and relevant features even from early training stages, which is vital for detecting thin, low-contrast structures.
The decoder then meticulously reconstructs the segmentation mask through a series of up-sampling and convolutional layers. Critically, skip connections, a hallmark of the U-Net design transfer high-resolution feature maps directly from the encoder’s corresponding levels to the decoder. These concatenations enable the decoder to fuse the rich semantic context learned by ResNet50 with the finer-grained spatial details preserved from the earlier encoder stages. This fusion is key to achieving precise pixel-level localization. By integrating ResNet50, the U-Net is better equipped to capture the specific edges, shapes, and textures associated with thermal cracks, ultimately leading to more precise and reliable segmentation results by accurately delineating these defects.
To further enhance the refinement of the features within the encoder, the internal structure of the bottleneck block, illustrated in Figure 14, applies a sequence of convolutional, normalization, and activation operations. Specifically, it receives input from the final stage of the ResNet50 encoder with shape [B,2048,8,8], and immediately reduces the channel dimensionality through a 3×3 convolution (with stride 1 and padding 1), producing a more compact representation of size [B,1024,8,8]. This is followed by batch normalization and a ReLU activation, which function is demonstrated in Equation (5), to promote stable and nonlinear learning. Then a dropout layer is introduced to prevent overfitting. A second convolution with the same parameters reinforces feature abstraction, again followed by batch normalization, ReLU, and dropout. This bottleneck structure is crucial for efficiently learning deep, yet compact, representations, allowing the network to preserve relevant thermal crack features while reducing redundancy. The output of this module is then passed to the decoder for up-sampling and segmentation mask reconstruction.
where:
- x: Is the input to the neuron.
2.5. Yolov8 Medium and U-Net Method: How It Works
The YOLOv8m model was trained over 250 epochs with a learning rate of 0.0001, a batch size of 32, weight decay of 0.00001 and the Adam optimizer. Internally, the model uses SiLU as the main activation function in convolutional layers due to its smooth and non-linear properties, and sigmoid in the final layer to compute per-class probabilities. In some classification branches, softmax was also applied. An early stopping strategy with a patience of 25 epochs was used to prevent overfitting, and a fixed random seed of 0 was set to ensure consistent data splitting and reproducibility of the results. The model was trained using Google Collab with Tensor Core GPU NVIDIA A100 80GB VRAM.
The U-Net model with ResNet50 as backbone was trained with 150 epochs, using a learning rate of 0.0001 and a batch size of 12, consistent with YOLOv8m for compatibility. The final layer uses a sigmoid activation function, and the segmentation task was trained using binary cross-entropy loss, suitable for pixel-wise binary classification. To mitigate overfitting, dropout layers with a rate of 0.3 were included after convolutional blocks. Data augmentation was performed using the Albumentations library, incorporating geometric transformations (rotation, scaling, translation), noise injection, and brightness/contrast adjustments. No random seed was defined during training, which means the dataset splitting and augmentation processes may vary slightly between executions. For future replications, a fixed seed of 0 is recommended to ensure full reproducibility.
3. Results
To validate our research, we used the precision metrics (P), recall (R), and mean average precision (mAP), following their corresponding equations (6), (7), (8) and (9). Precision represents the percentage of correctly detected cracks by dividing true positives (TP) by the sum of true positives and false positives (FP). Recall indicates the percentage of actual cracks that were detected, taking into account false negatives (FN). Finally, the mean average precision (mAP) summarizes the model performance based on the relationship between Precision and Recall. A high mAP value indicates that the model maintains high accuracy in object detection tasks [2].
- TP: True Positives – correctly detected cracks;
- FP: False Positives – detections incorrectly classified as cracks;
- FN: False negatives – actual cracks that were not detected.
During the validation stage, consistent results were obtained in the detection of simulated cracks on car brake discs (simulation method). The tiny artificially generated cracks were correctly identified by the model even in cases with low thermal contrast, demonstrating the importance of the interpolation process and data augmentation techniques in enhancing the quality of the training set.
To quantitatively validate the system performance, a comparison was made between different approaches: the basic YOLOv8 model, the U-Net architecture used independently, and the proposed YOLOv8 medium model, which forms part of the final system. It should be noted that the developed Convolutional Neural Network (CNN) was not included in this comparison, as its role is focused solely on the post-detection classification of cracks, rather than on detection or segmentation.
These findings support the feasibility of implementing low-cost thermal cameras, such as the FLIR Lepton 3.1R, in combination with modern convolutional neural networks for predictive maintenance applications. Furthermore, the results confirm that a progressive training approach, starting with controlled simulations and later incorporating the full dataset, contributes significantly to the robustness and generalization of the model in real-world operating scenarios.
Figure 15 presents the normalized confusion matrix corresponding to the YOLOv8m model, which allows evaluating its performance by class. In this case, only two classes were considered: "crack" and "background." For the "crack" class, a recall of 0.98 was achieved, meaning the model correctly identified 98% of the actual cracks present in the images. Only 2% of the cracks were misclassified as background (false negatives), which is considered a low and desirable value for our detection model.
For the "background" class, perfect specificity was observed (TNR = 1.00), indicating that all regions without cracks were correctly classified as such. In other words, no false positives were detected for the "crack" class, which means that the model did not mistake background areas for defects, thereby minimizing false alarms. These results further demonstrate that the model is not only sensitive to real crack detection but also highly precise in background discrimination.
Figure 16 shows the F1 curve of the trained YOLOv8 medium model, which evaluates the balance between precision and recall as a function of the confidence threshold applied during detection. The blue line represents the overall behavior of the model, reaching a maximum F1-score of 0.97 at an optimal confidence threshold of 0.686. Moreover, the curve remains consistently high with an F1-score > 0.90 across a wide range of confidence values, from 0.2 to 0.9, demonstrating the model’s strong stability under varying levels of error tolerance. This suggests that the model maintains its performance without requiring critical adjustments to the decision thresholds.
The model’s performance during the 250 training epochs (Figure 17) shows both the evolution of the loss functions and the performance metrics. At the top, the training loss curves (train/box_loss, train/cls_loss, and train/dfl_loss) display a progressive and stable decrease, indicating that the model improves its ability to accurately locate cracks, classify their presence, and adjust the bounding box edges.
In parallel, the validation curves (val/box_loss, val/cls_loss, and val/dfl_loss) exhibit a similar downward trend, suggesting good generalization and the absence of significant overfitting. This convergence between training and validation supports that the model maintains stable performance when exposed to unseen data.
On the right-hand side of the figure, performance metrics are shown: precision, recall, mAP50, and mAP50-95. All of them display rapid growth during the initial epochs, followed by stabilization at high values, close to 1.0. The mAP50, which measures average precision at 50% intersection over union (IoU), reaches values near 1.0, indicating highly effective and reliable detection. Similarly, mAP50-95, a stricter metric than mAP50, also shows a sustained upward trend.
These results reinforce the evidence that the model not only correctly detects the presence of cracks but also delineates their contours with high precision, meeting the expected standards for automated railway inspection applications.
Regarding the performance of the U-Net (ResNet50) model during 150 training epochs (Figure 18). The training loss shows a steady decline, while the validation loss stabilizes and exhibits a slight increase after epoch 30, suggesting potential overfitting. Despite this, the validation metrics remain high: precision ( 0.90) and recall ( 0.85), both indicating strong segmentation capability. Additionally, the mean Intersection over Union (mIoU) ( 0.88) and Dice Score (>0.90) reflect a high degree of overlap between the predicted and ground truth masks of the cracks. The consistently high Dice Score demonstrates excellent spatial accuracy in segmentation, indicating that the model is able to accurately predict both the shape and location of the cracks.
As a basis for performance comparison, our proposed methodology was evaluated against several architectures: the basic YOLOv8 model, the medium variant YOLOv8m, a standard U-Net, a simplified U-Net with data augmentation and fine-tuning, and a U-Net with transfer learning using ResNet50 as backbone. The custom CNN model was excluded from this comparison, as it was designed exclusively for classification tasks and not for detection or segmentation. The results, summarized in Table 2, reveal a clear performance improvement across the models as the training approach and architecture complexity increased, particularly when using enhanced datasets captured with the FLIR Lepton 3.1R thermal camera.
Among the detection-based models, the YOLOv8m model demonstrated the best overall performance, achieving a precision of 98%, mAP50 of 99%, mAP50-95 of 89%, and recall of 97%. These values represent a substantial improvement over the basic YOLOv8 model, highlighting the benefits of higher-resolution data, more robust augmentation strategies, and appropriate model selection.
In addition to evaluating detection-based models, a detailed comparison was also carried out among different configurations of the U-Net architecture to assess their segmentation capabilities. Initially, a simplified version of the U-Net model was implemented, using its most basic configuration without any pretrained weights. This version struggled significantly in accurately segmenting the cracks, particularly due to the low thermal contrast and fine morphology of the defects. As a result, its performance remained limited, with a precision of 71%, recall of 75%, and a mean Intersection over Union (mIoU) of 0.61.
To improve these outcomes, a second approach was attempted using the same simplified U-Net architecture, but now integrating data augmentation techniques and fine-tuning. Specifically, the model was initialized with the pretrained weights obtained from the previous training, with the goal of enhancing its learning capacity from the augmented dataset. Although this method led to a noticeable performance improvement—reaching a precision of 79%, recall of 88%, and mIoU of 0.71—the segmentation accuracy was still not optimal for field application.
Finally, to address these limitations, a more advanced version of U-Net was developed using a ResNet50 backbone. This model was trained from scratch with transfer learning, allowing ResNet50 to act as a feature extractor and automatically select the most relevant filters for segmentation. This architectural enhancement enabled the model to generalize more effectively and extract higher-level spatial features from the input images. As a result, this version achieved the best performance among all U-Net configurations: 90% precision, 92% recall, and an mIoU of 0.83—demonstrating a significantly improved ability to accurately delineate cracks, even under challenging thermal conditions.
These progressive results clearly show that the segmentation quality is highly dependent on both the model architecture and training strategy. While the basic U-Net provided a useful baseline, incorporating fine-tuning and ultimately using a deep backbone like ResNet50 yielded much more robust and reliable segmentation, particularly critical for evaluating the morphology and severity of cracks in predictive maintenance applications.

Table 3.
Comparison between the simulated and experimental method
| Type | Train Loss | Val Loss | Precision | mAP50 | mAP50-95 | Recall | mIoU |
|---|---|---|---|---|---|---|---|
| Yolov8 | 0.45 | 0.53 | 0.85 | 0.69 | 0.65 | 0.68 | – |
| Yolov8m | 0.34 | 0.51 | 0.98 | 0.99 | 0.89 | 0.97 | – |
| U-Net | 0.24 | 0.39 | 0.71 | – | – | 0.75 | 0.61 |
| Simplified U-Net with data augmentation and fine tunning | 0.24 | 0.28 | 0.79 | – | – | 0.88 | 0.71 |
| U-Net Transfer Learning (Backbone ResNet50) | 0.18 | 0.14 | 0.90 | – | – | 0.92 | 0.83 |
| Final model (YOLOv8m and U-Net Transfer Learning (Backbone ResNet50)) | 0.003 | 0.03 | 0.90 | – | – | 0.86 | 0.89 |
It is important to note that the significant improvement in precision, mAP, and recall values cannot be attributed solely to the change in model architecture. In this second phase, improvements were made not only to the model but also to the data set itself. The quality and thermal resolution of the images were improved, the amount of data was increased through augmentation techniques, and more representative images of simulated conditions were incorporated. Therefore, this comparison reflects the combined impact of both factors, model architecture and data set quality, on the final performance of the system, highlighting the importance of a comprehensive approach to crack detection and classification tasks.
To achieve a robust and deployable solution, a final model was constructed by combining the detection capabilities of YOLOv8m with the high precision segmentation provided by the U-Net architecture enhanced with a ResNet50 backbone. This hybrid approach leverages the strengths of both models: YOLOv8m contributes an outstanding detection performance, while U-Net with transfer learning provides detailed segmentation with 90% precision, 92% recall, and a mean intersection over Union (mIoU) of 0.83. The integrated system achieves balanced performance with strong generalization, as reflected in the final evaluation metrics: a training loss of 0.003, validation loss of 0.03, 90% precision, 86% recall, and a mIoU of 0.89. These results confirm that the proposed model is well suited for real-world crack detection and segmentation tasks, enabling reliable identification and accurate delineation of structural defects under challenging thermal imaging conditions.
The combined operation of the YOLOv8 medium and U-Net (ResNet50) models can be observed in Figure 19, illustrating the integration of both architectures in the crack detection and segmentation process. In Step A, the original image captured by the thermal camera is shown. Then, in Step B, the YOLOv8m model detects the cracks and outlines their approximate locations on the brake disc surface using bounding boxes. In Step C, each detected region is automatically cropped and individually processed by the U-Net model, which performs precise segmentation of the cracks through a mask. Lastly, in Step D, the combined result is presented: the accurate detection of the two cracks present, along with their segmented representation, allowing for detailed visualization of their shape, length, and path.
Finally, Figure 20 illustrates the final implementation of the system, which includes the use of the infrared camera’s field of view (FOV) to estimate the real dimensions of the cracks. In this case, the FLIR Lepton 3.1R was placed at a distance of 3 cm from the brake disc, allowing accurate measurement of each crack’s length (L) and width (A) in millimeters. These values were extracted by converting pixel dimensions using the known FOV of the camera and the camera to object distance. The green outlines indicate the detected cracks that are classified as admissible, meaning their size is below the threshold established by Faiveley Transport (80 mm in length). This final step confirms the system’s capability not only to detect and segment cracks, but also to evaluate their dimensions with physical relevance for field applications.
4. Conclusions
The analysis of these results leads to the conclusion that the combined model—integrating both bounding box-based detection (YOLOv8m) and precise segmentation (U-Net (ResNet50)) offers a robust and adaptable solution. Furthermore, the system has proven capable of generalizing effectively without relying exclusively on environmental thermal conditions, which is crucial for its application in predictive railway maintenance under various operational scenarios.
One of the main limitations in applications of this nature is the scarcity of specific datasets for thermal cracks. Previous studies [30,31], have highlighted this gap, which hinders the performance of advanced models like YOLOv8 that require large volumes of data for effective generalization. In this study, a dataset of over 27000 images was generated, combining both synthetic and real data. This was a key factor in achieving high levels of precision and robustness in the model.
However, it is important to emphasize that the results cannot be attributed solely to dataset enhancement. Model architecture selection and the integration of different deep learning approaches also played a critical role. In particular, the combination of YOLOv8m and U-Net (ResNet50) takes advantage of the strengths of both models: YOLOv8m provides fast detection with high accuracy, while U-Net (ResNet50) delivers detailed segmentation of crack contours. This dual architecture outperforms individual approaches by offering both speed and morphological precision, improving the evaluation of the defect in terms of presence, shape, and severity. Therefore, the final system performance reflects the combined result of an optimized model and an improved dataset, demonstrating that a comprehensive approach is key to thermal crack detection and classification tasks.
Additionally, it was shown that image pre-processing plays a fundamental role in enhancing model performance. Binarization and noise reduction helped facilitate crack detection, as the preprocessed images were interpreted more effectively by the model during training. This improvement was clearly reflected in the comparative tables between results obtained in simulations and experimental tests.
The results also revealed that YOLOv8m consistently outperformed U-Net (ResNet50) in overall accuracy and detection stability, while U-Net (ResNet50) contributed value through its morphological segmentation precision. This synergy validates the hybrid approach used and suggests that combining architectures can be an effective strategy in critical applications where both speed and detail are required.
Moreover, the proposed methodology is not limited to railway brake disc analysis. By integrating a fast detection model like YOLOv8m with a segmentation model like U-Net (ResNet50), a versatile solution is proposed that could also be applied to other domains where crack detection is essential—such as structural components in aircraft, industrial pipelines, heavy machinery, or even weld inspection. Its adaptability demonstrates that the system is not only effective in the railway context but also has potential for implementation across various areas requiring reliable, automated surface defect inspection.
Finally, the model has shown its ability not only to detect cracks but also to classify them by size and estimate their severity based on the wear level of the disc. This classification capability represents a significant step toward the development of intelligent structural monitoring systems that, beyond fault identification, provide objective prioritization criteria for field intervention. As a next step, the system will be validated in a real railway environment by acquiring thermal images directly from operational train brake discs and evaluating its performance in the context of preventive maintenance. The complete system is expected to be integrated into a Raspberry Pi for real-time execution, allowing technicians to visualize detections on-site and generate automatic reports. This implementation will verify the model’s performance under real operational conditions and assess its impact on railway maintenance efficiency.
Author Contributions
Conceptualization, N.B.and J.A.; methodology, N.B.and J.A.; software, N.B.and J.A.; validation,N.B.and J.A., formal analysis, N.B.and J.A.; investigation, N.B.and J.A.; data curation, N.B.and J.A.; writing—original draft preparation, N.B.and J.A.; writing—review and editing, N.B.and J.A.; visualization, N.B.and J.A.; Supervision, J.R. and J.B.; project administration, J.R. and J.B. All authors have read and agreed to the published version of the manuscript.
Funding
This research received no external funding.
Data Availability Statement
Data are contained within the article.
Acknowledgments
The authors would like to thank the “Dirección de Investigación de la Universidad Peruana de Ciencias Aplicadas” for the support provided to carry out this research work through the UPC-EXPOST-2025-1 incentive.
Conflicts of Interest
The authors declare no conflicts of interest.
References
- Wang, S.; Zargar, S. A.; Yuan, F.-G. Augmented reality for enhanced visual inspection through knowledge-based deep learning. Structural Health Monitoring 2020, 19, 147592172097698. [CrossRef]
- Yang, F.; Huo, J.; Cheng, Z.; Chen, H.; Shi, Y. An Improved Mask R-CNN Micro-Crack Detection Model for the Surface of Metal Structural Parts. Sensors 2024, 24, 62. [CrossRef]
- Faiveley Transport Remscheid GmbH. Axle-mounted brake disc WKS 640G-NB: Technical Manual for the Service Personnel; Report V/H 05/111; Remscheid, Germany, February 2006.
- Konovalenko, I.; Maruschak, P.; Brevus, V.; Prentkovskis, O. Recognition of Scratches and Abrasions on Metal Surfaces Using a Classifier Based on a Convolutional Neural Network. Metals 2021, 11, 549. [CrossRef]
- Wang, D.; Xu, Y.; Duan, B.; Wang, Y.; Song, M.; Yu, H.; Liu, H. Intelligent Recognition Model of Hot Rolling Strip Edge Defects Based on Deep Learning. Metals 2021, 11, 223. [CrossRef]
- Wang, C.; Zhou, Z.; Chen, Z. An Enhanced YOLOv4 Model with Self-dependent Attentive Fusion and Component Randomized Mosaic Augmentation for Metal Surface Defect Detection. IEEE Access 2022, 10, 1. [CrossRef]
- Liu, Y.; Liu, Y.; Guo, X.; Ling, X.; Geng, Q. Metal surface defect detection using SLF-YOLO enhanced YOLOv8 model. Scientific Reports 2025, 15, 94936. [CrossRef]
- Yu, L.; Yang, E.; Luo, C.; Ren, P. AMCD: an accurate deep learning-based metallic corrosion detector for MAV-based real-time visual inspection. Journal of Ambient Intelligence and Humanized Computation 2021, 1–11. [CrossRef]
- Aboulhosn, Z.; Musamih, A.; Salah, K.; Jayaraman, R.; Omar, M.; Aung, Z. Detection of Manufacturing Defects in Steel Using Deep Learning with Explainable Artificial Intelligence. IEEE Access 2024, 12, 1. [CrossRef]
- Zhang, C.; Chen, X.; Liu, P.; He, B.; Li, W.; Song, T. Automated detection and segmentation of tunnel defects and objects using YOLOv8-CM. Tunnelling and Underground Space Technology 2024, 150, 105857. [CrossRef]
- Chen, S.; Zhou, F.; Gao, G.; Ge, X.; Wang, R. Unleashing breakthroughs in aluminum surface defect detection: Advancing precision with an optimized Yolov8n model. Digital Signal Processing 2025, 160, 105029. [CrossRef]
- BPW. Wear and damage characteristics on friction brakes; Wiehl, Germany, 2007.
- Li, H.; Xia, M.; Zheng, S.; Ding, J. Thermal Impact Analysis of Brake Discs Under Extreme Working Conditions of Trackless Trains Based on Virtual Testing. In Mechanical Design and Simulation: Exploring Innovations for the Future. MDS 2024; Pham, D.T., Lei, Y., Lou, Y., Eds.; Lecture Notes in Mechanical Engineering; Springer: Singapore, 2025; pp. 115. [CrossRef]
- Kiranbabu, S.; Landefeld, A.; Willidal, T.; Glushko, O.; Schnitzer, R. Insights into weld metal hot cracking of austenitic stainless steels: Atomistic characterization of crack surfaces. Applied Surface Science 2025, 706, 163580. [CrossRef]
- Xiao, Y.; Zhou, L.; Zhao, H.; Wang, T.; Du, J.; Shen, M. The Evolution of Brake Disc Materials for Trains: A Review. Coatings 2025, 15, 628. [CrossRef]
- Gigan, G.L. On improvement of cast iron brake discs for heavy vehicles: Laboratory experiments, material modelling and fatigue life assesement. PhD Thesis, Chalmers University of Technology, Department of Applied Mechanics, Gothenburg, Sweden, 2015.
- Walia, M.S. Mechanical braking systems for trains A study of temperatures, fatigue and wear by experiments and simulations. Doctoral Thesis, Chalmers University of Technology, Gothenburg, Sweden, 2019.
- Abdullah, M.F.; Khuzaimah, M.N.M.; Majid, M.S.A.; Wahab, N.A. Performance analysis of brake discs in trains. Jurnal Tribologi 2020, 25, 1–15.
- Zhong, W.; Yan, Q.; Li, Z.; Zhang, X.; Zhang, X. The crack initiation mechanism of steel disc when paired with Fe-PM pad for high-speed train braking. Engineering Failure Analysis 2024, 165, 108834. [CrossRef]
- Wang, J.; Chen, Y.; Zuo, L.; Zhao, H.; Ma, N. Evaluation of Thermal Fatigue Life and Crack Morphology in Brake Discs of Low-Alloy Steel for High-Speed Trains. Materials 2022, 15, 6837. [CrossRef]
- Ma, L.; Ding, S.; Zhang, C.; Zhang, M.; Shi, H. Study on the Wear Performance of Brake Materials for High-Speed Railway with Intermittent Braking under Low-Temperature Environment Conditions. Materials 2022, 15, 8763. [CrossRef]
- Ding, S.; Zhang, M.; Ou, Y.; Ma, L. Study on the Influence of Friction and Wear Properties of High-Speed Rail Brake Materials under Humidity Environment and Temperature Conditions. Materials 2023, 16, 1610. [CrossRef]
- Jiang, L.; Jiang, Y.; Yu, L.; Yang, H.; Li, Z.; Ding, Y. Thermo-Mechanical Coupling Analyses for Al Alloy Brake Discs with Al2O3-SiC(3D)/Al Alloy Composite Wear-Resisting Surface Layer for High-Speed Trains. Materials 2019, 12, 3155. [CrossRef]
- Ghadimi, B.; Kowsary, F.; Khorami, M. Thermal analysis of locomotive wheel-mounted brake disc. Applied Thermal Engineering 2013, 51, 948–952. [CrossRef]
- Jie, L.; Li, W.; Xiao-yan, W.; Zheng, H.; Xin, W.; Zi-yu, G.; Shi-min, W. Review on mechanism and key technologies for delaying thermal crack propagation of high-speed train brake discs. Journal of Traffic and Transportation Engineering 2024, 24, 26–42. [CrossRef]
- Zhu, G.; Qi, H.; Lv, K. DGYOLOv8: An Enhanced Model for Steel Surface Defect Detection Based on YOLOv8. Mathematics 2025, 13, 831. [CrossRef]
- Huang, Y.; Tan, W.; Li, L.; Wu, L. WFRE-YOLOv8s: A New Type of Defect Detector for Steel Surfaces. Coatings 2023, 13, 2011. [CrossRef]
- Liu, C.; Cheng, H. Steel Surface Defect Detection Based on YOLOv8-TLC. Applied Sciences 2024, 14, 9708. [CrossRef]
- Wei, Z. H.; Zhang, Y. J.; Wang, X. J.; Zhou, J. T.; Dou, F. Q.; Xia, Y. H. A Yolov8-Based Approach For Steel Plate Surface Defect Detection. Metallurgy 2024, 63.
- Dubey, P.; Miller, S.; Günay, E. E.; Jackman, J.; Kremer, G. E.; Kremer, P. A. You Only Look Once v5 and Multi-Template Matching for Small-Crack Defect Detection on Metal Surfaces. Automation 2025, 6, 16. [CrossRef]
- Lv, X.; Duan, F.; Jiang, J.-j.; Fu, X.; Gan, L. Deep Metallic Surface Defect Detection: The New Benchmark and Detection Network. Sensors 2020, 20, 1562. [CrossRef]
Figure 1.
Penetrating crack (left) and incipient crack (right). Own elaboration (2025)
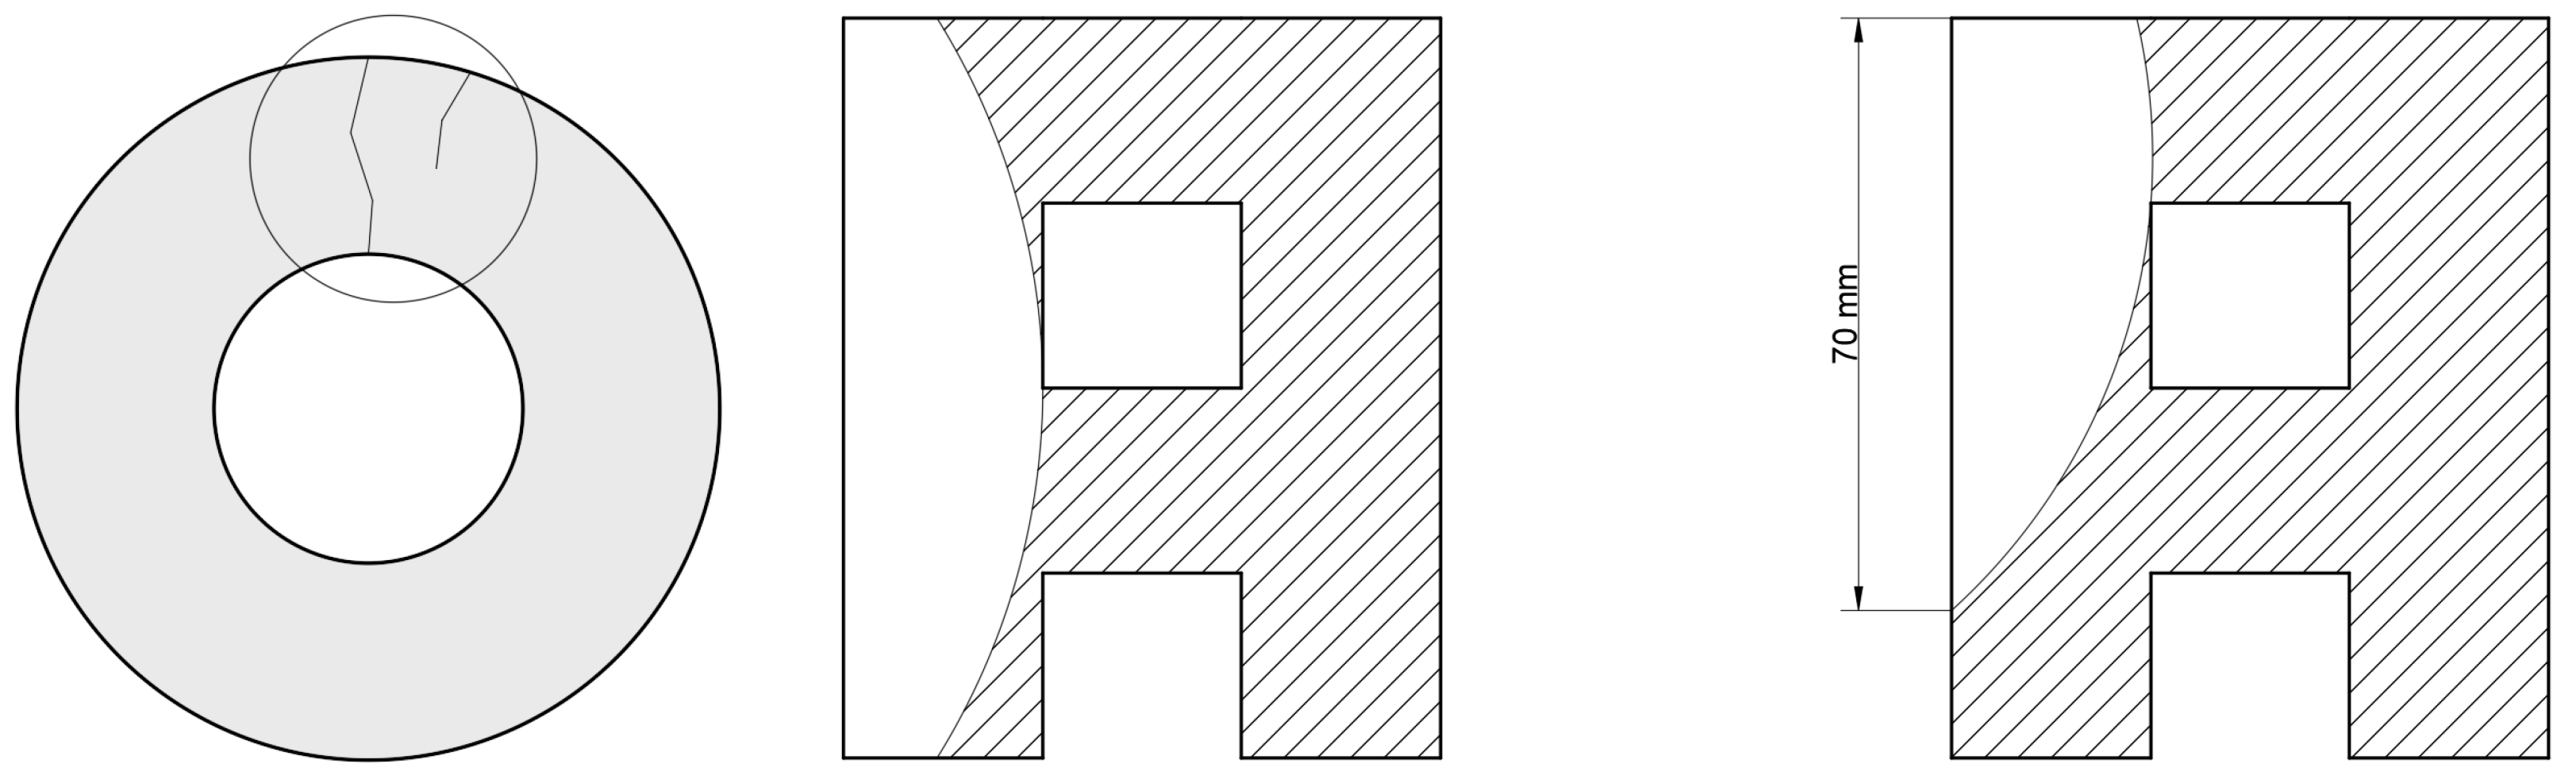
Figure 2.
Superficial cracks. Own elaboration (2025)
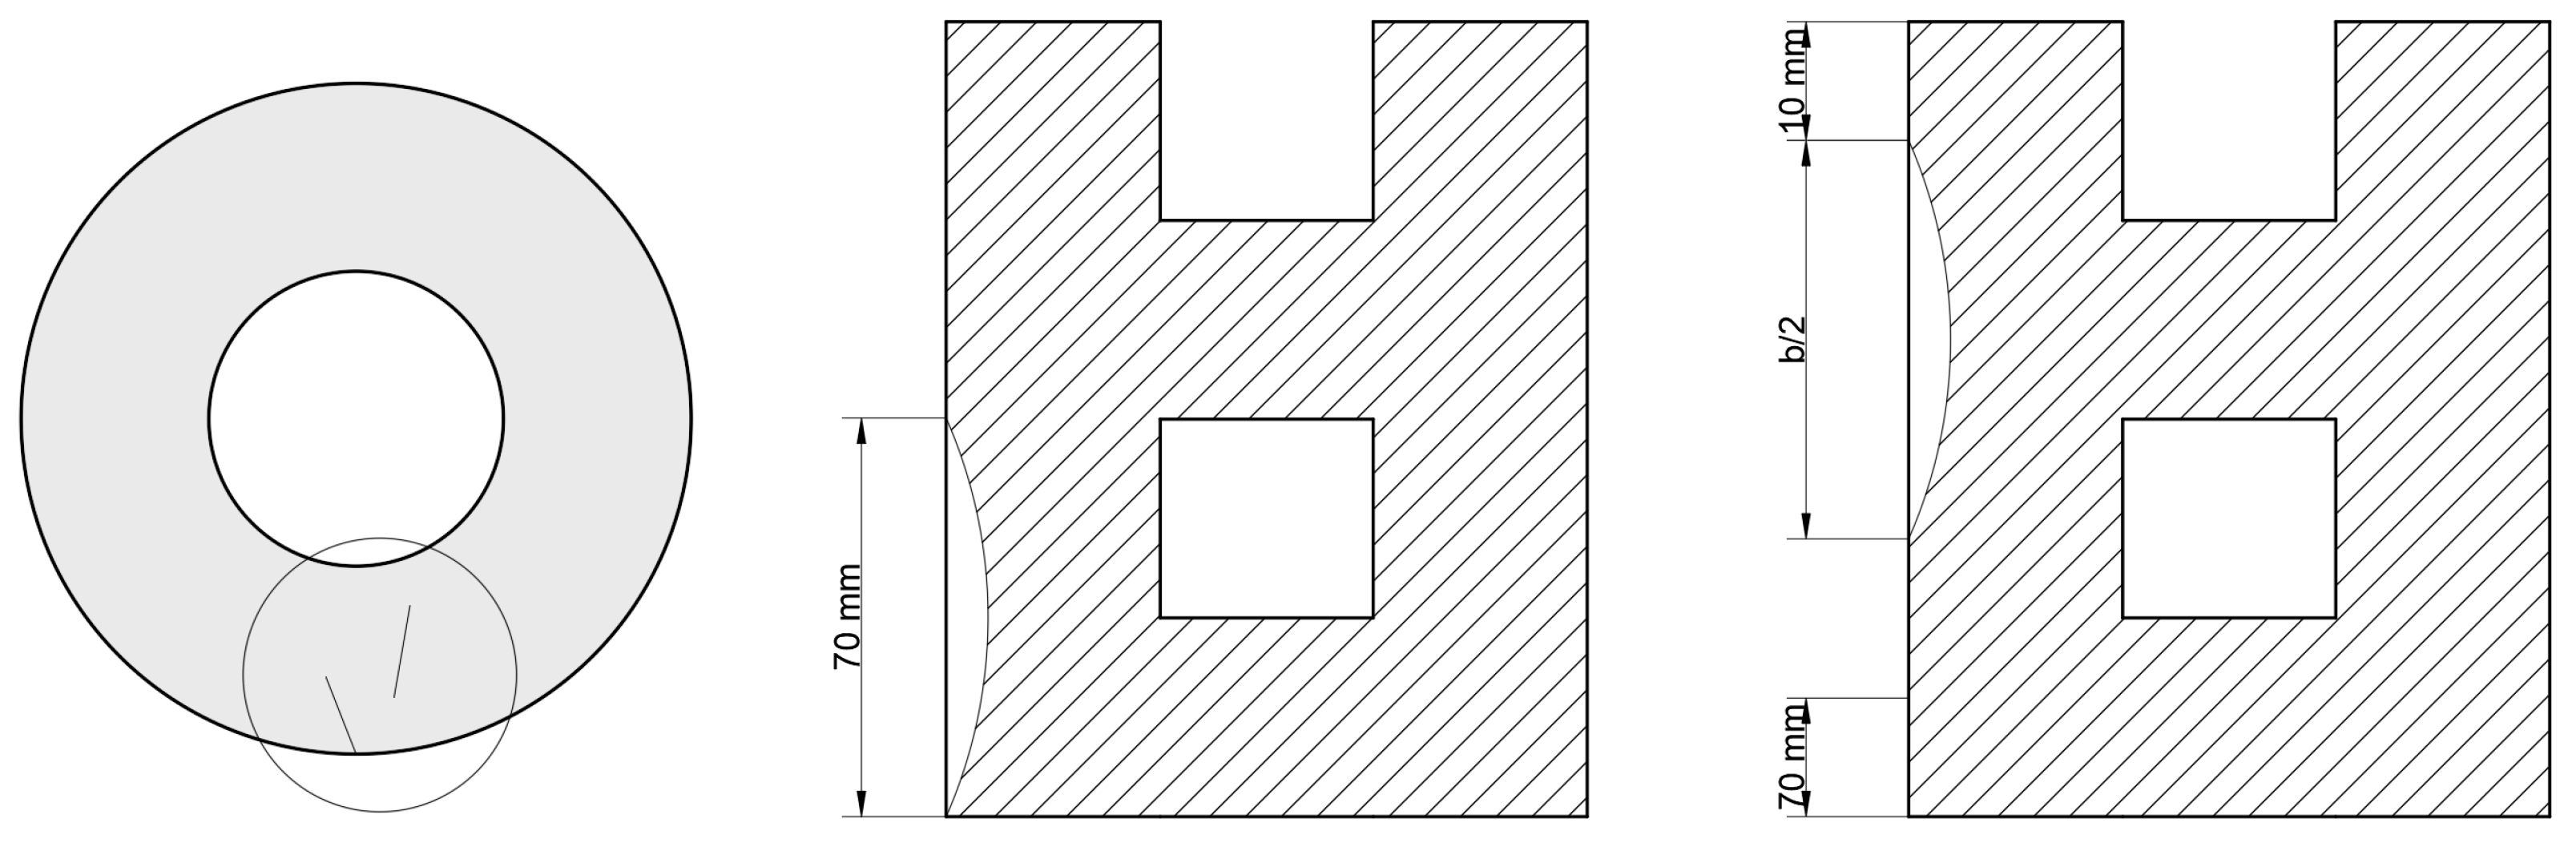
Figure 4.
Flow chart of the detection training process. Own elaboration (2025).
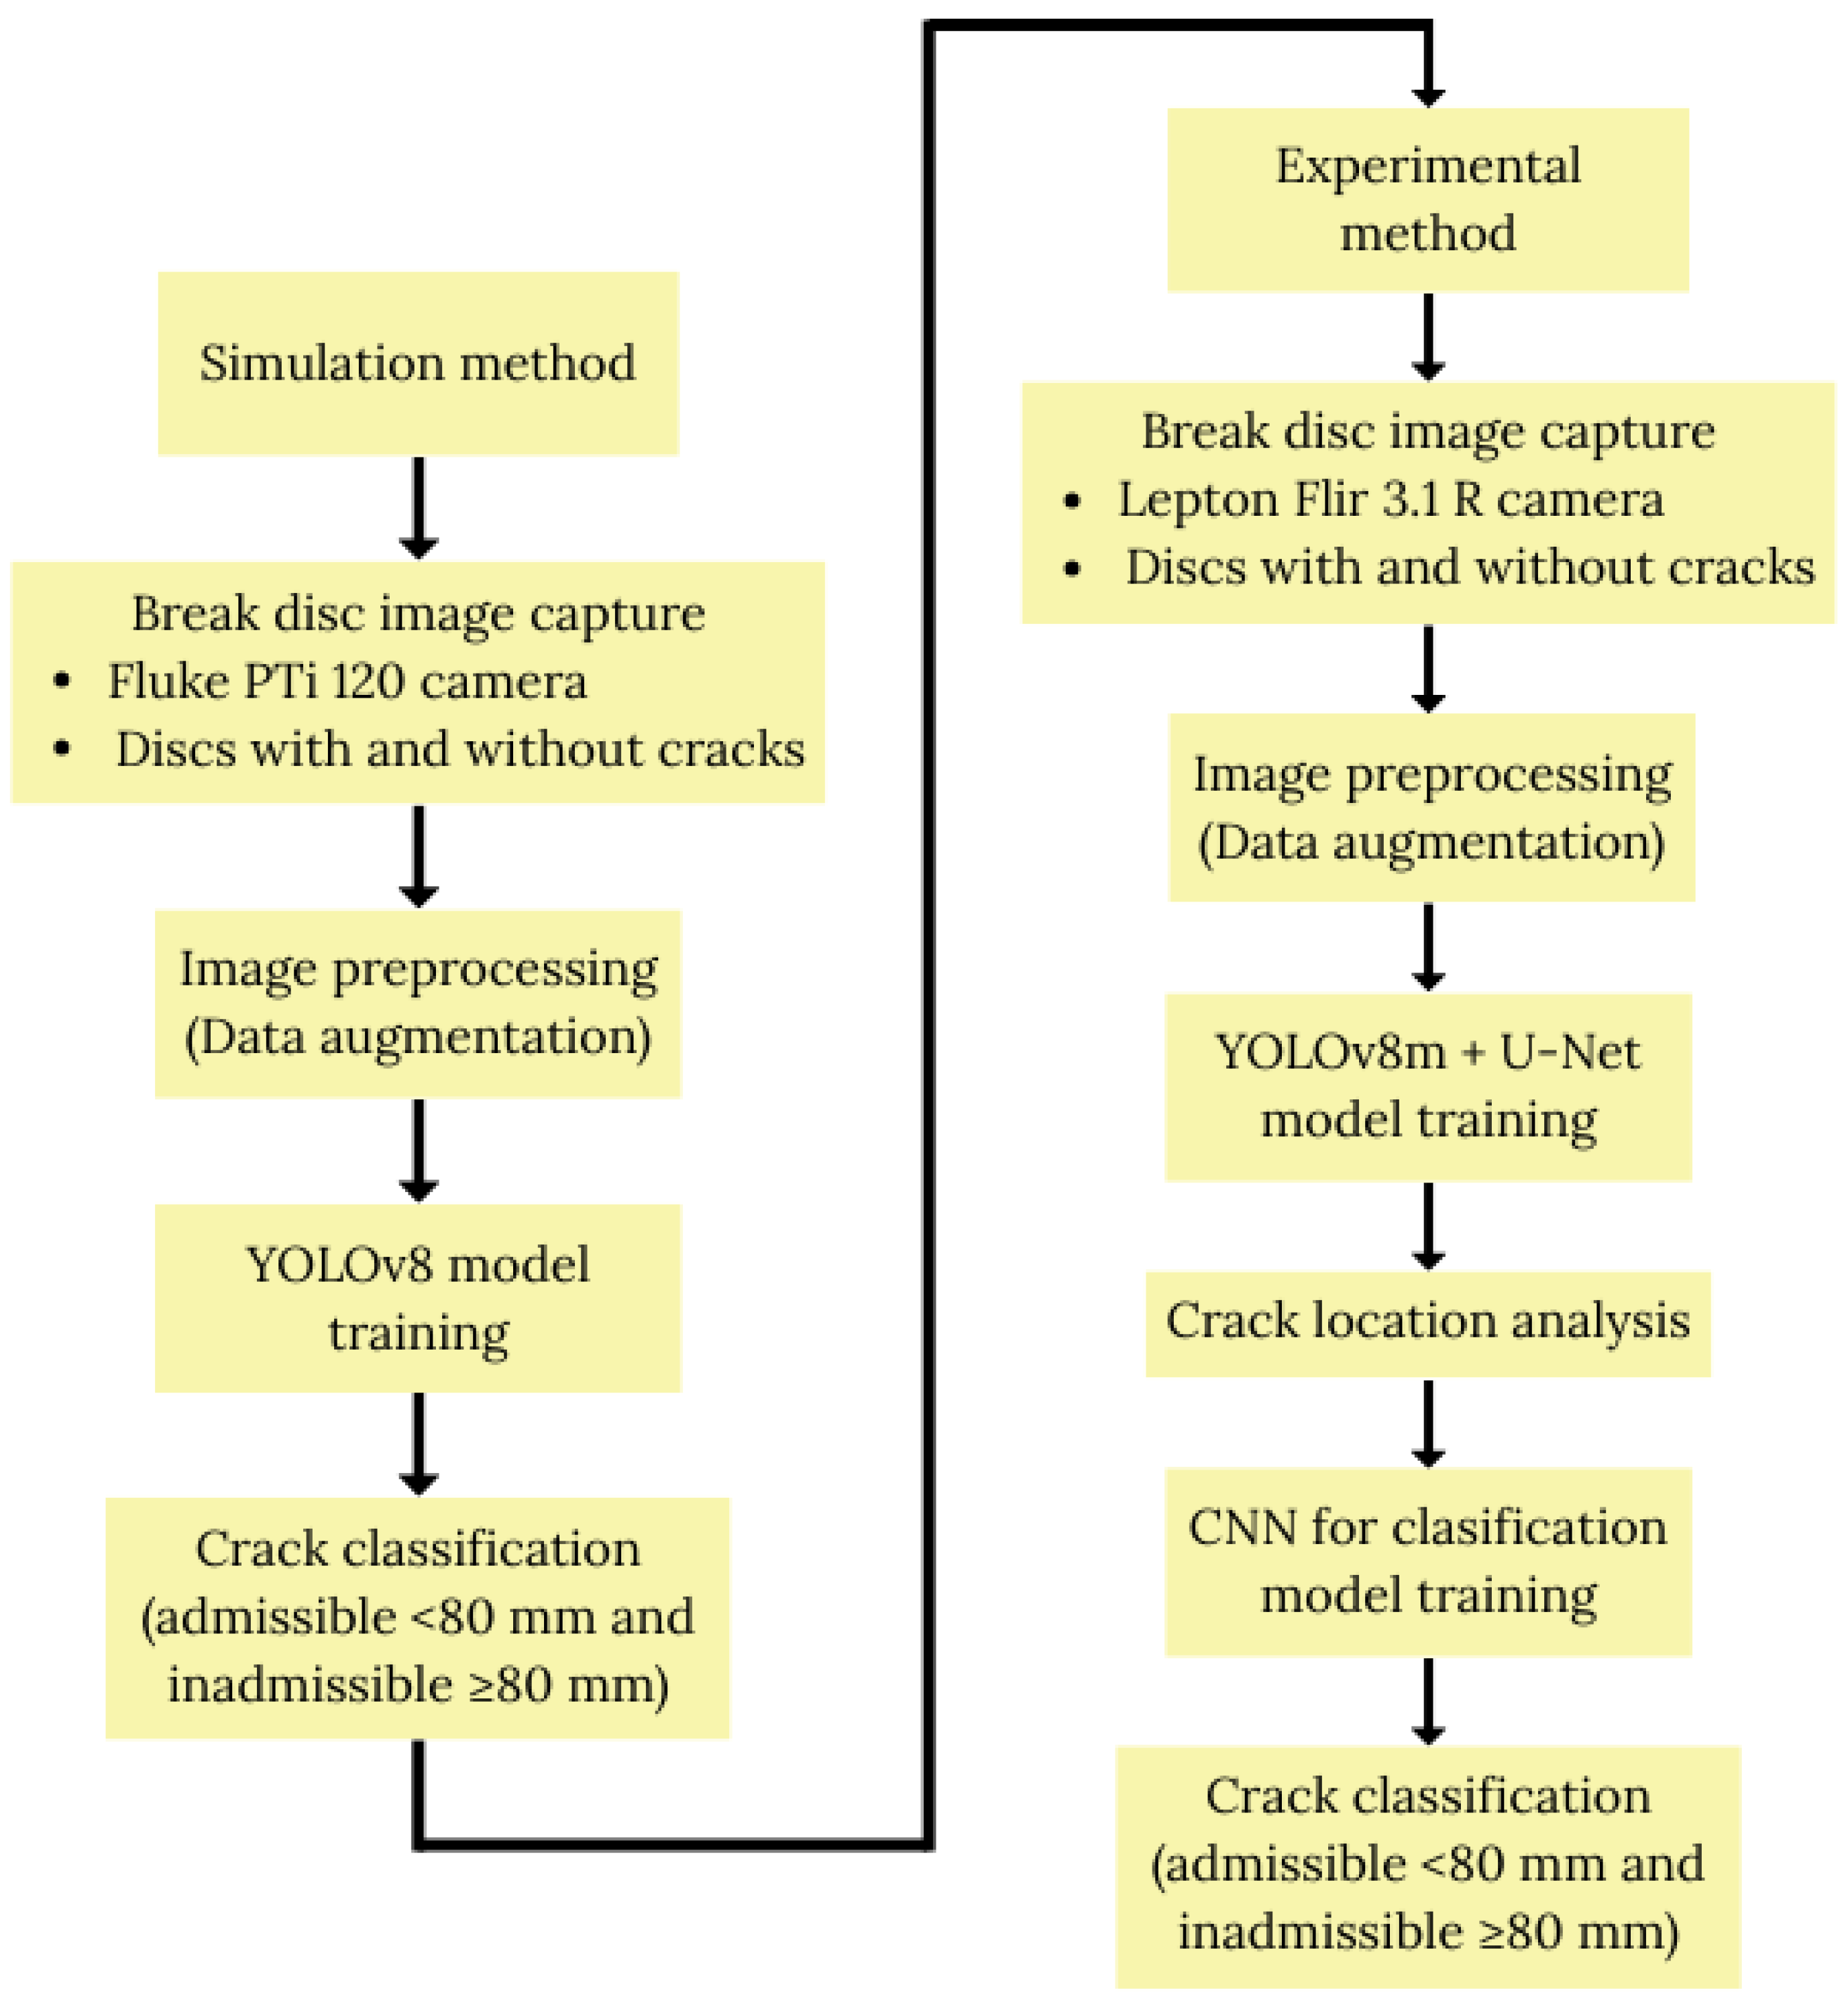
Figure 5.
Example of a crack in a carriage brake disc (120 x 90 px). Own elaboration (2025)
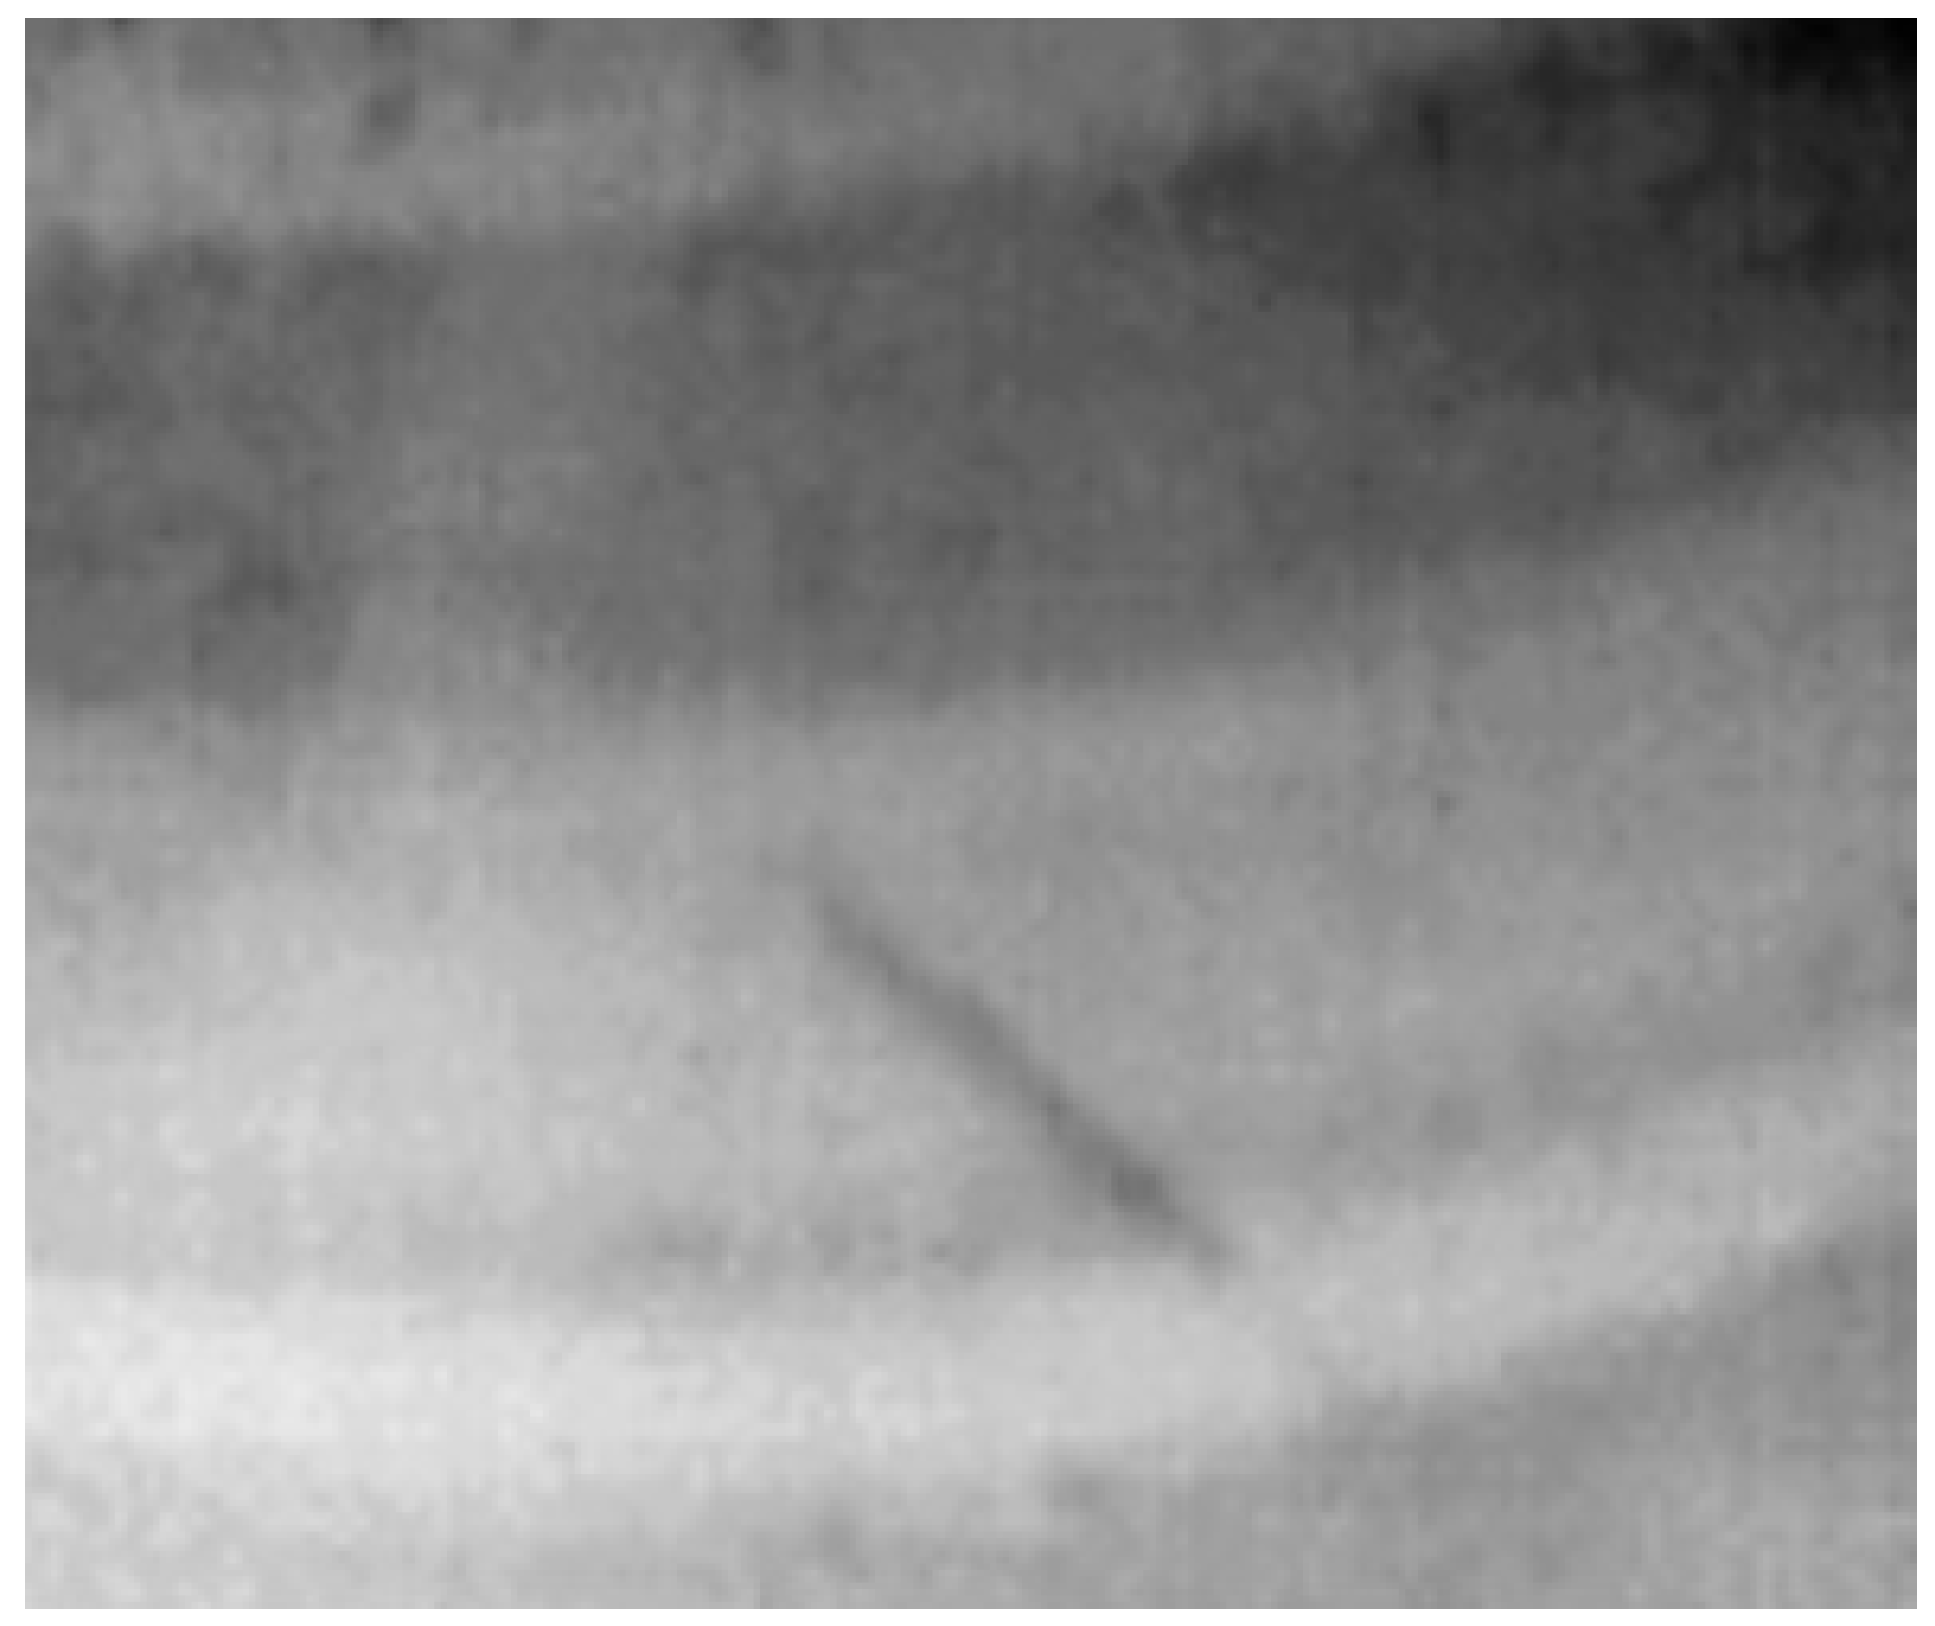
Figure 6.
Processing steps for crack detection. Own elaboration (2025). (a) Original image (120 x 90 px). (b) Equalized. (c) Binarization and edge filter combination. (d) Laplacian. (e) Negative. (f) Filtered by sized.
Figure 6.
Processing steps for crack detection. Own elaboration (2025). (a) Original image (120 x 90 px). (b) Equalized. (c) Binarization and edge filter combination. (d) Laplacian. (e) Negative. (f) Filtered by sized.
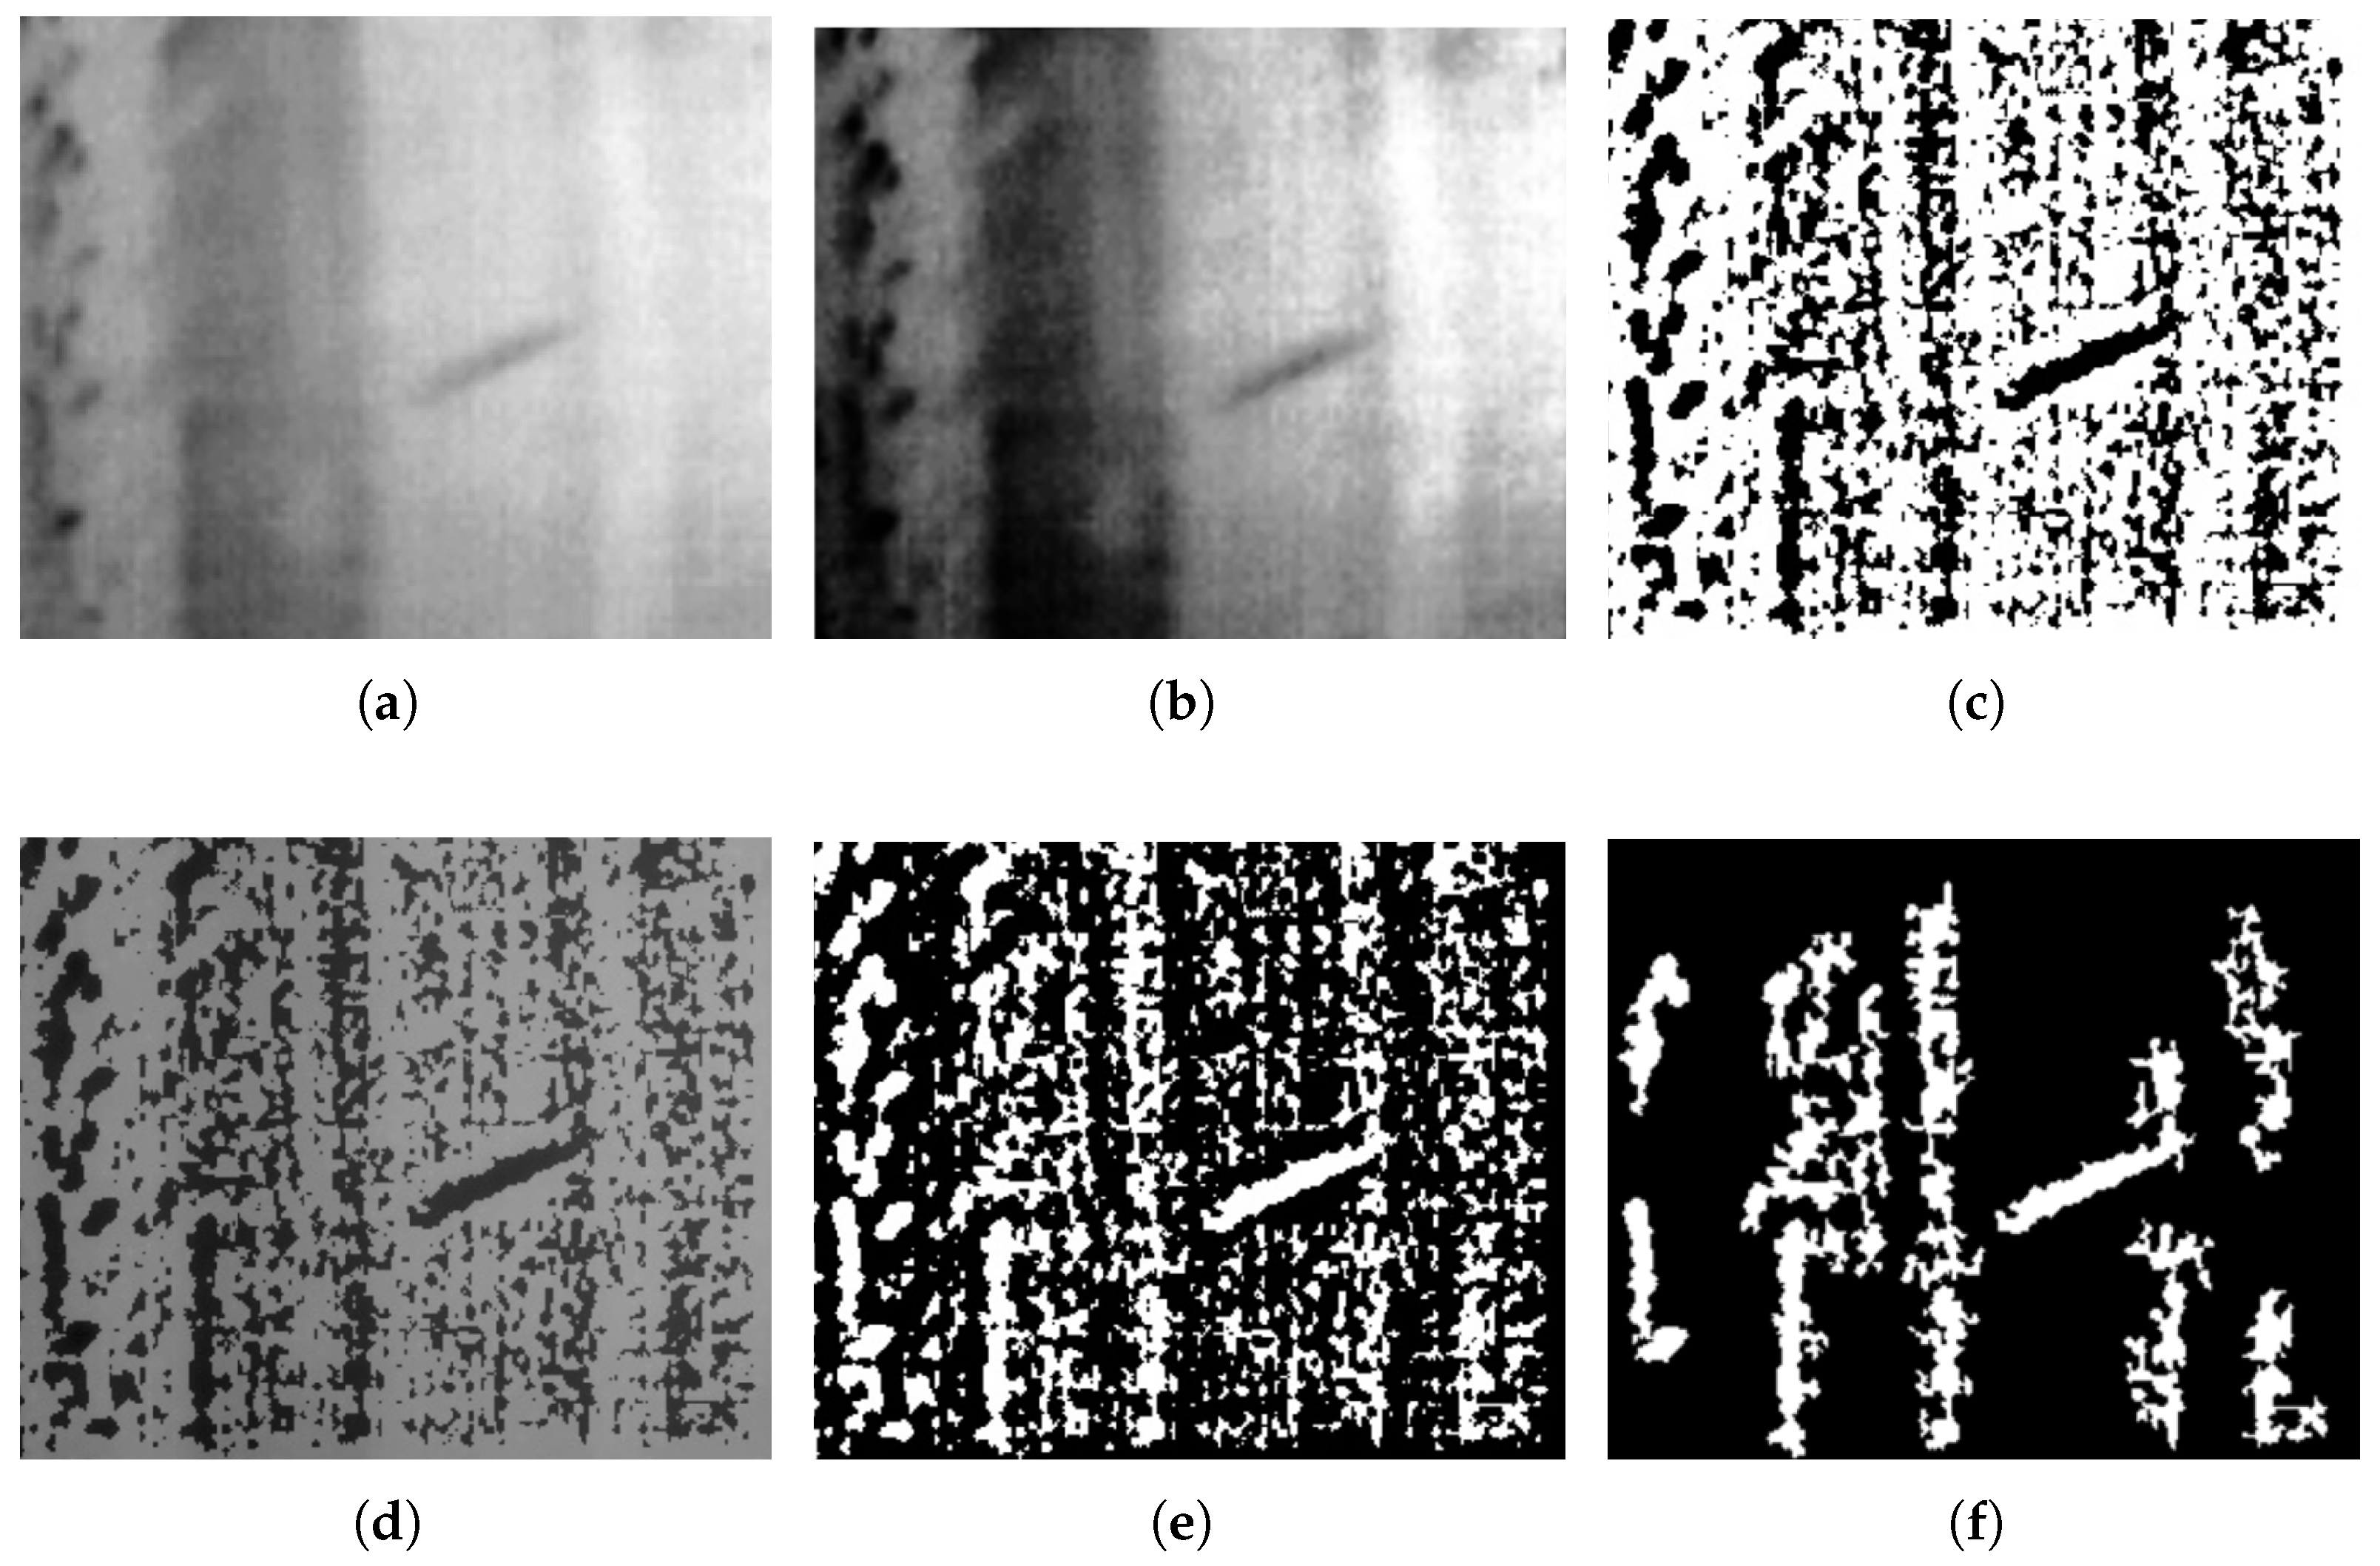
Figure 8.
Permissible disc crack detected. Own elaboration (2025)
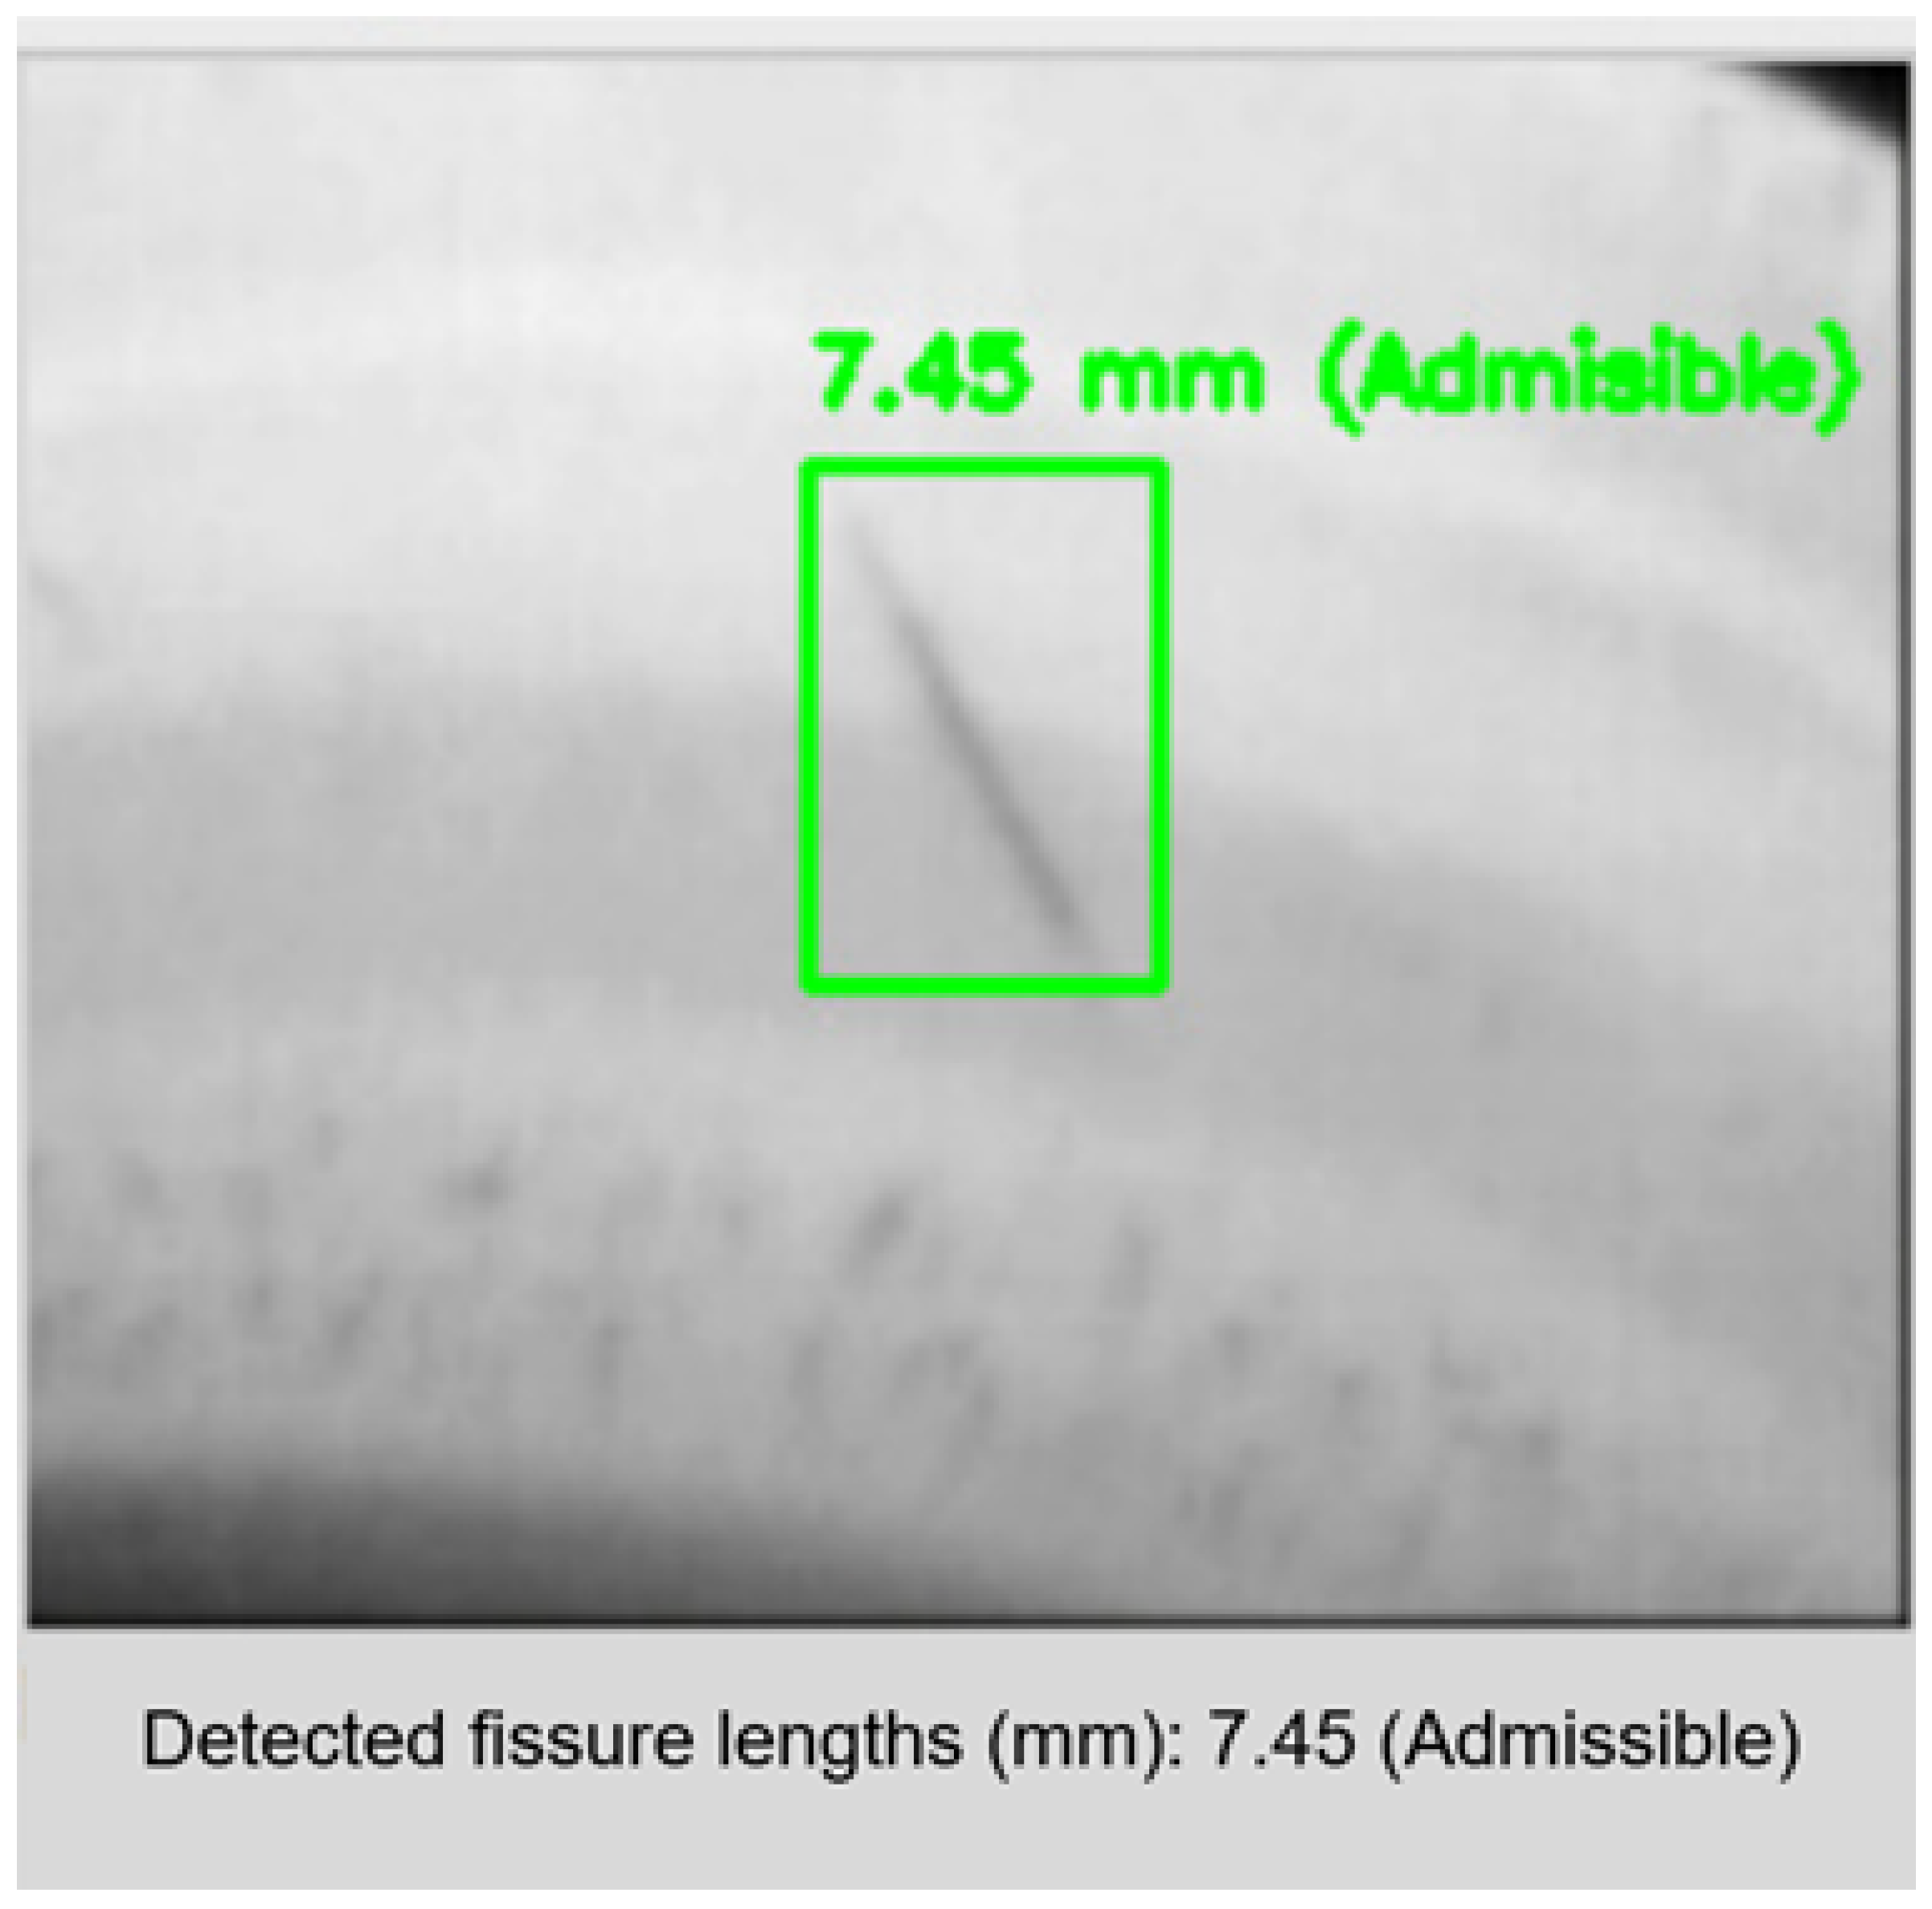
Figure 9.
Disc crack with combined vision (left) and grayscale (right). Own elaboration (2025)
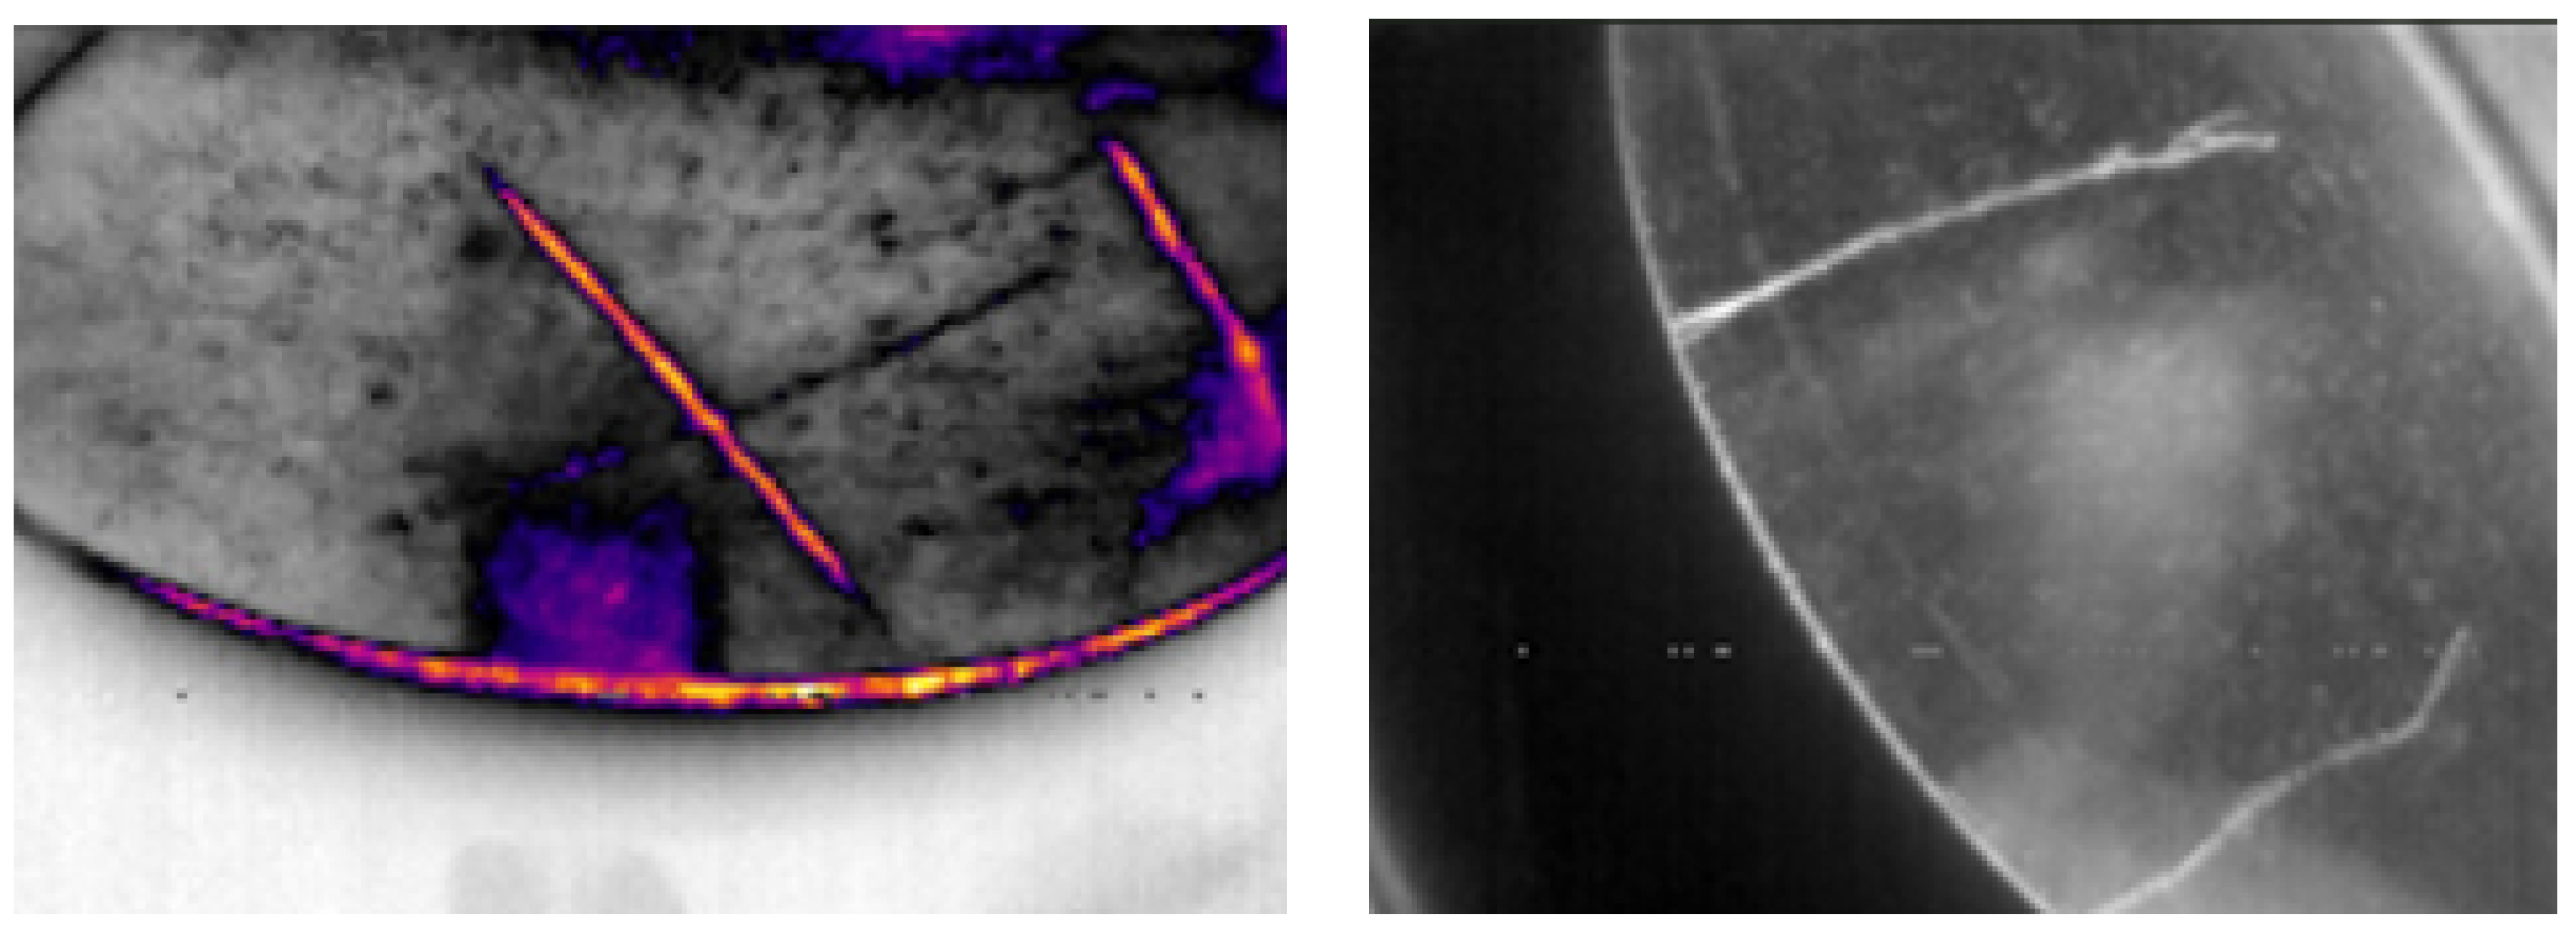
Figure 10.
Disc crack labeling with combined thermal vision. Own elaboration (2025)
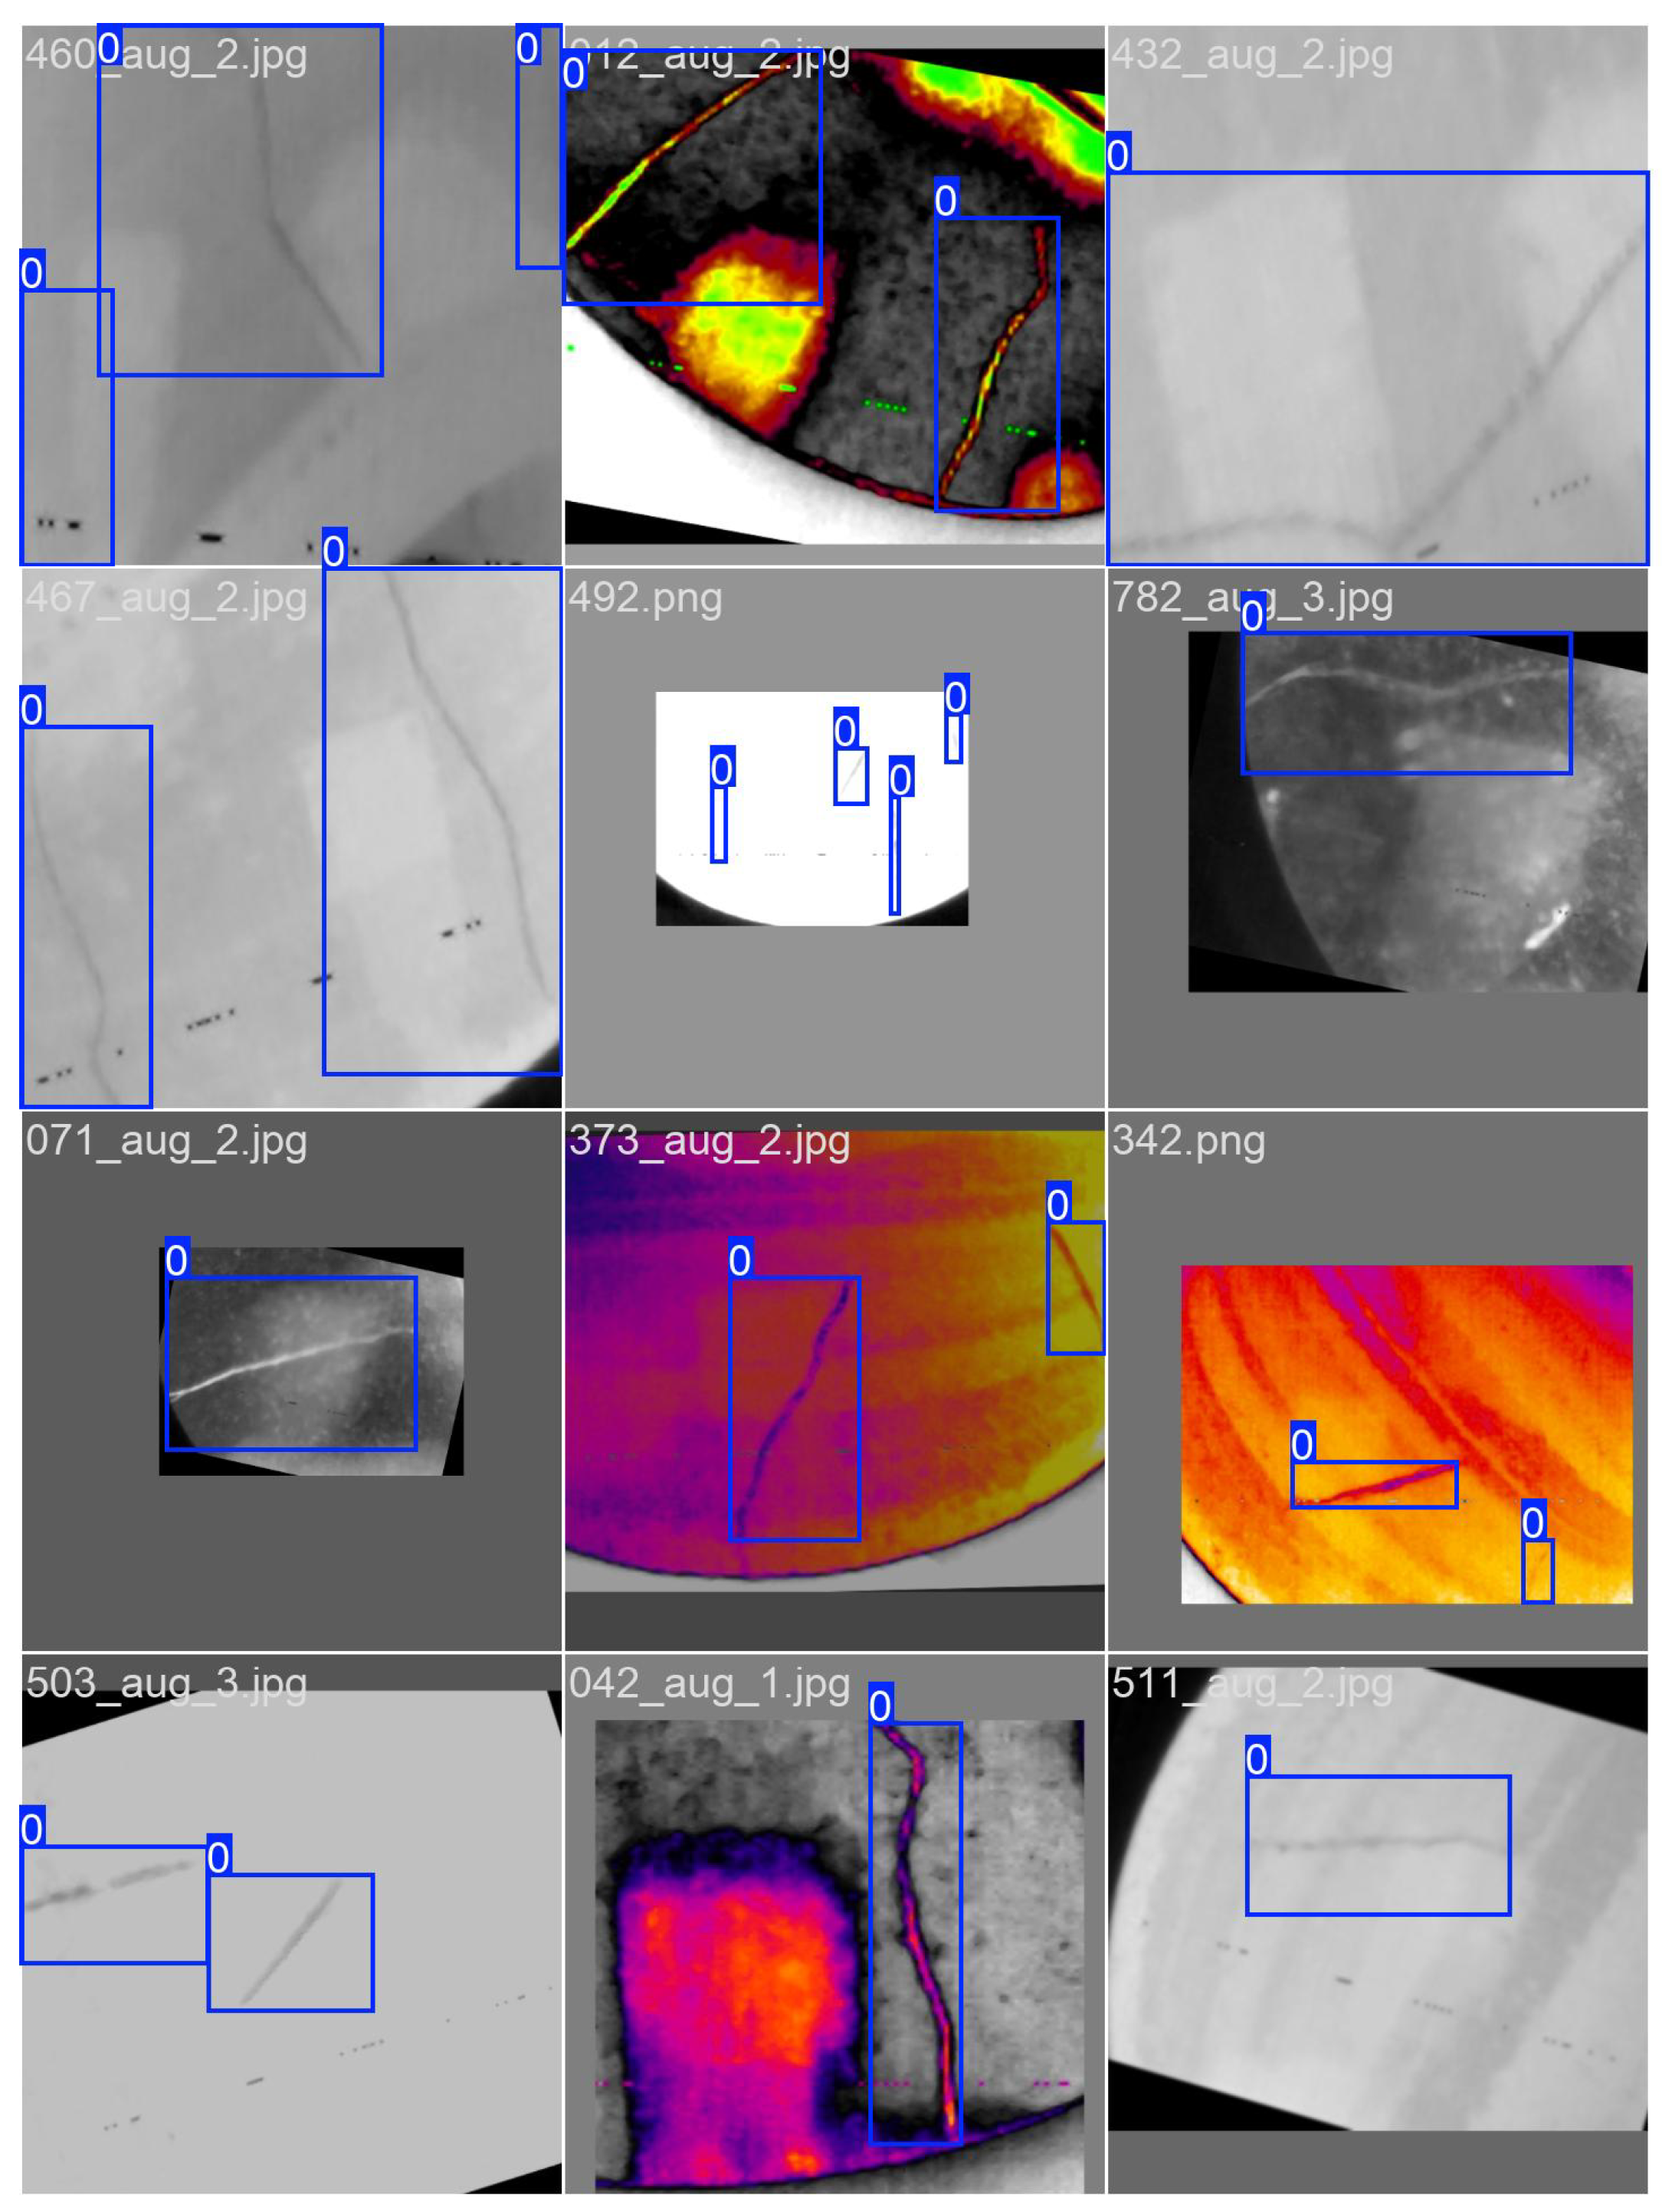
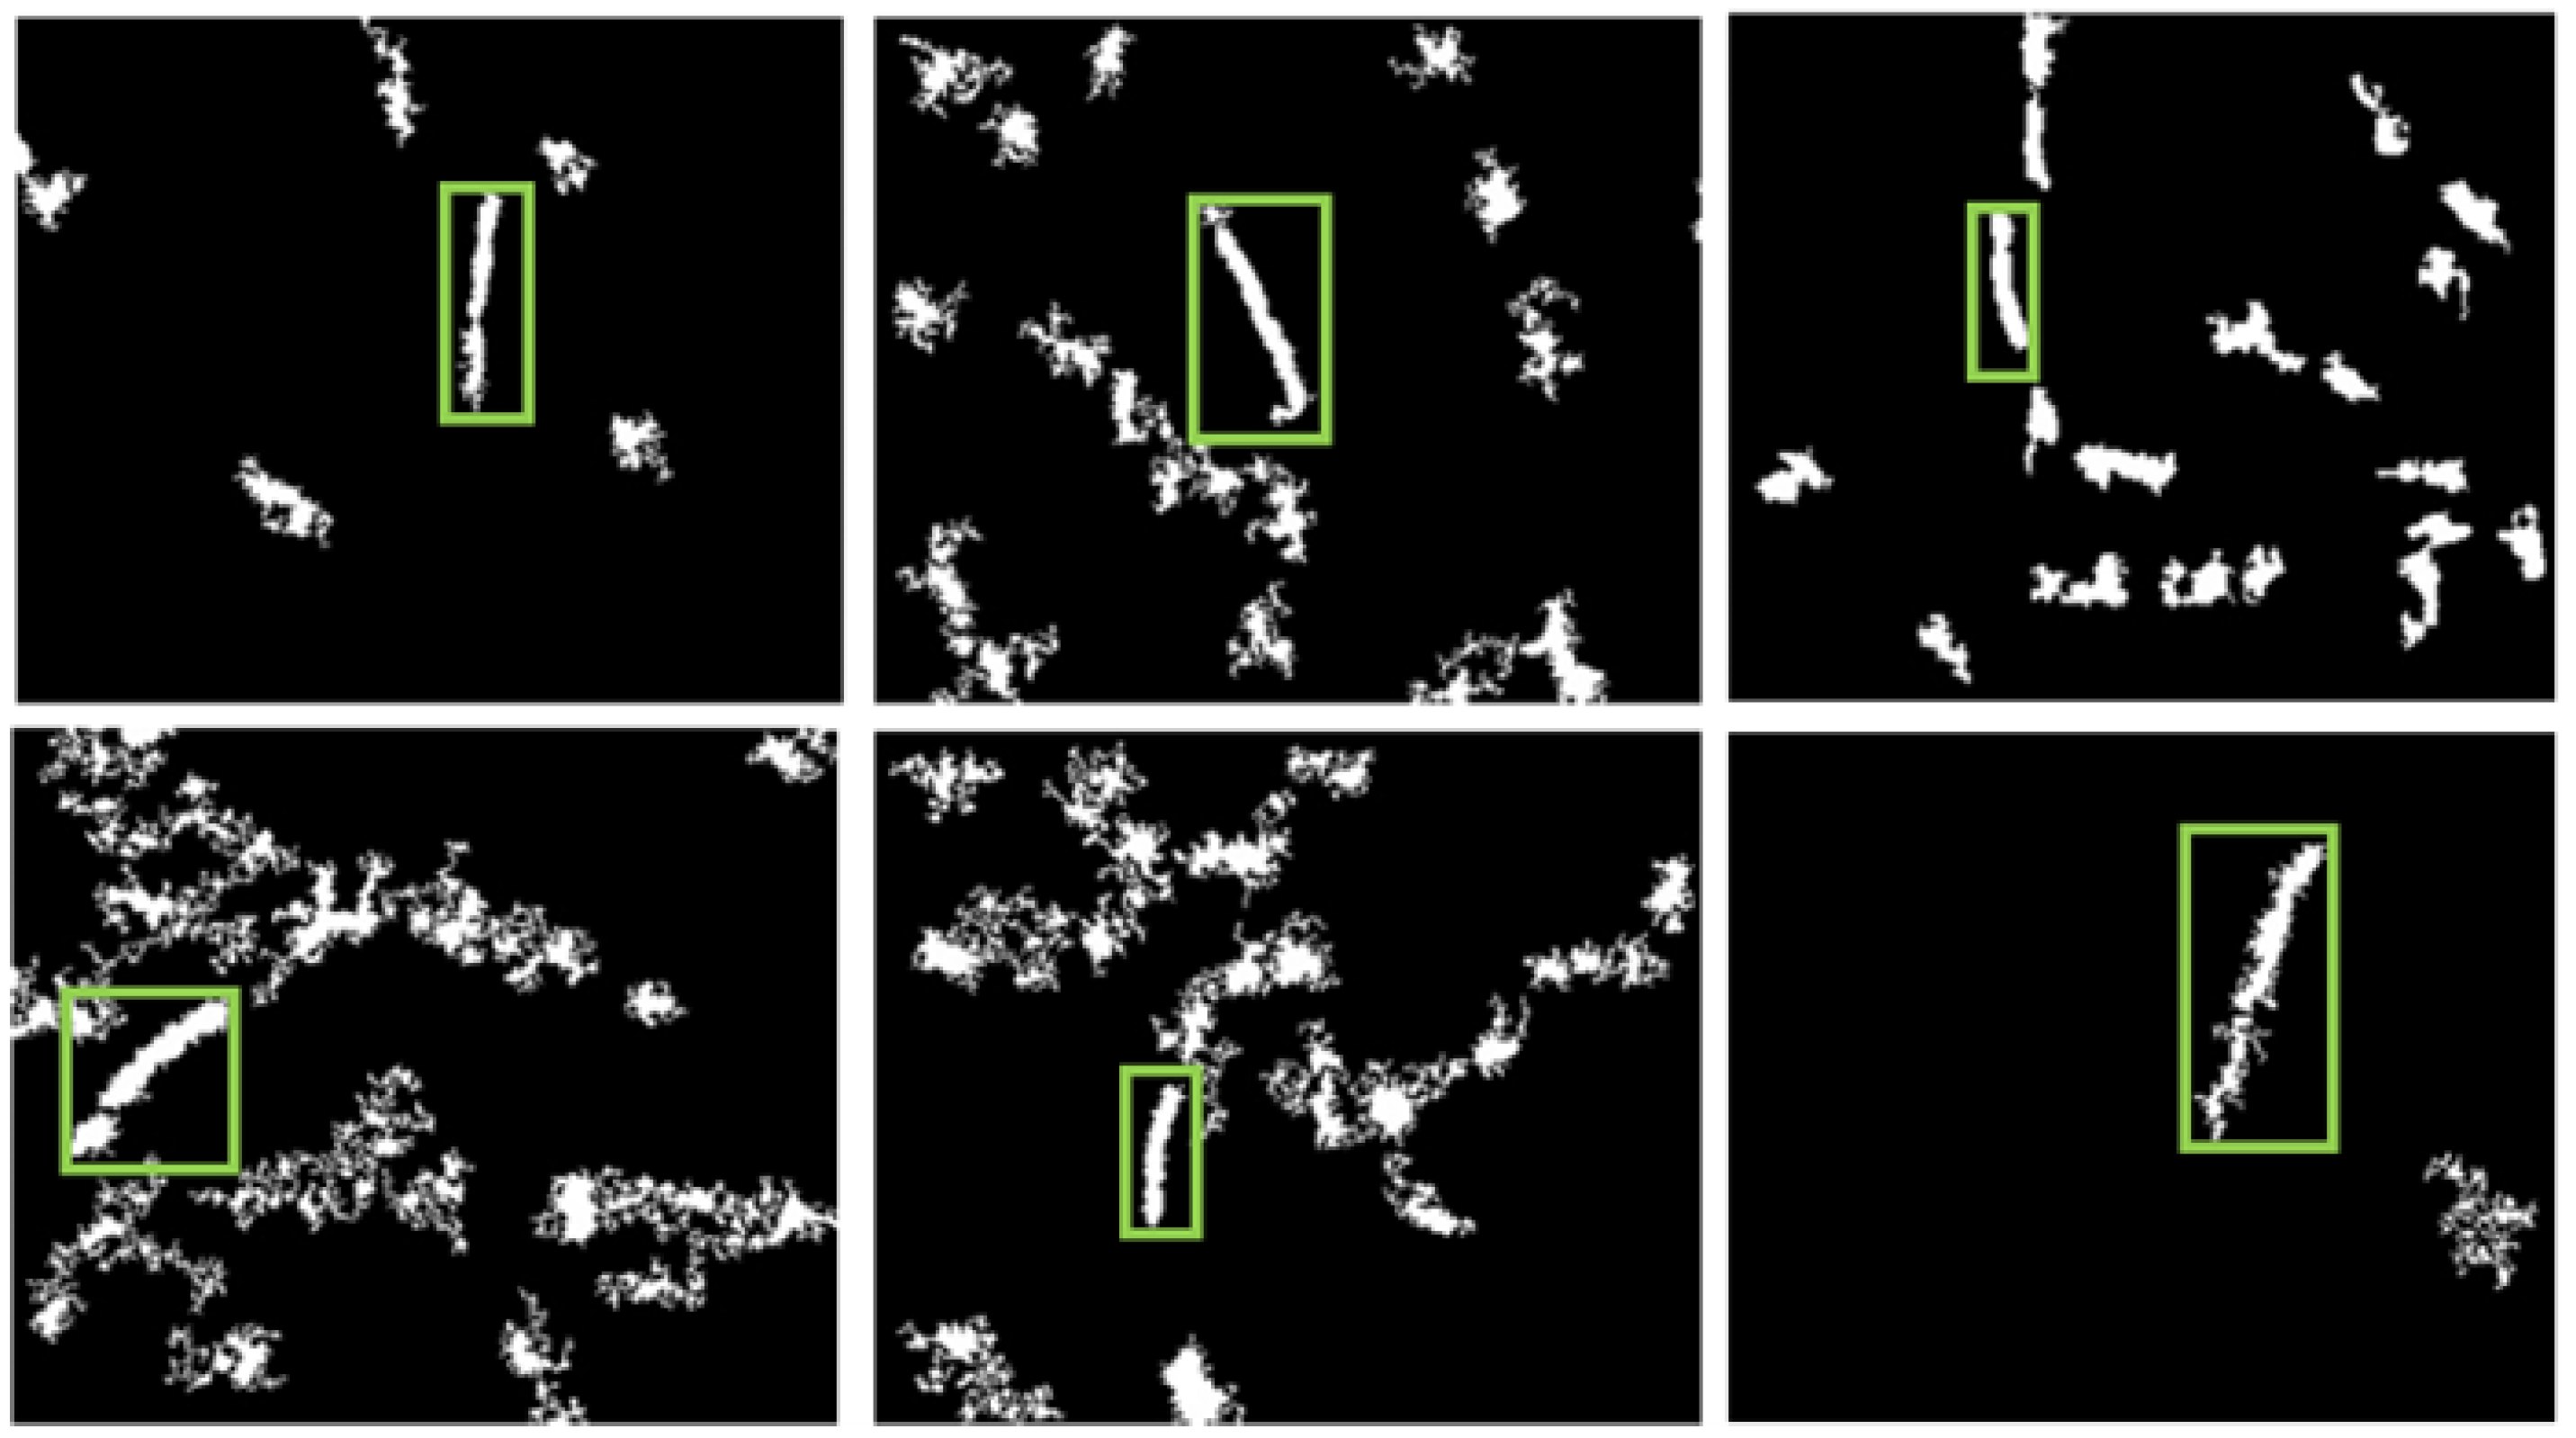
Figure 11.
Semantic segmentation mask with U-Net (ResNet50) cracks in brake disc (Left) and labeling by mask (right). Own elaboration (2025)
Figure 11.
Semantic segmentation mask with U-Net (ResNet50) cracks in brake disc (Left) and labeling by mask (right). Own elaboration (2025)
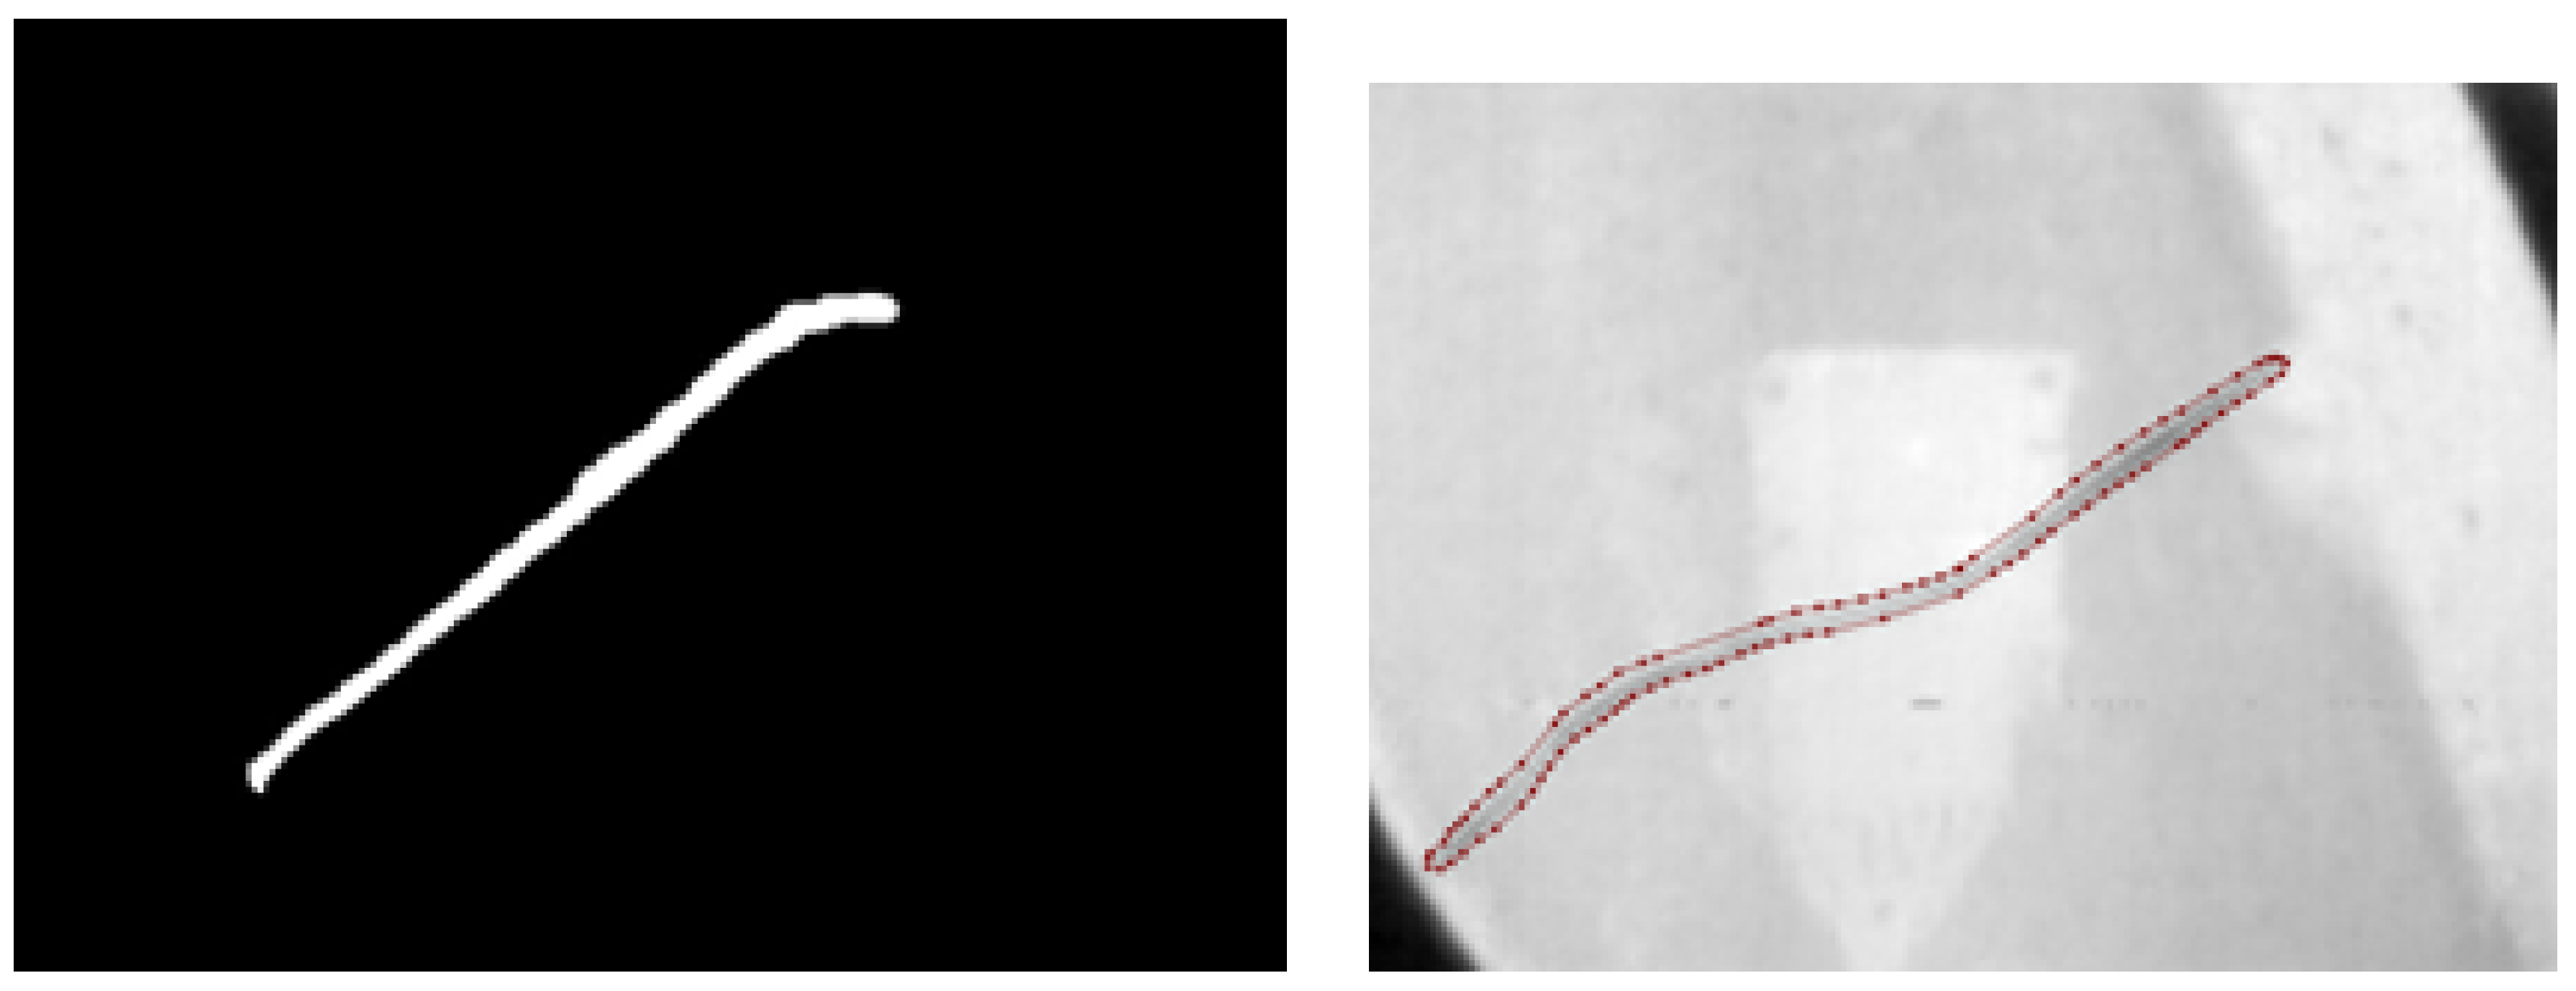
Figure 12.
U-Net Architecture Process. Own elaboration (2025)
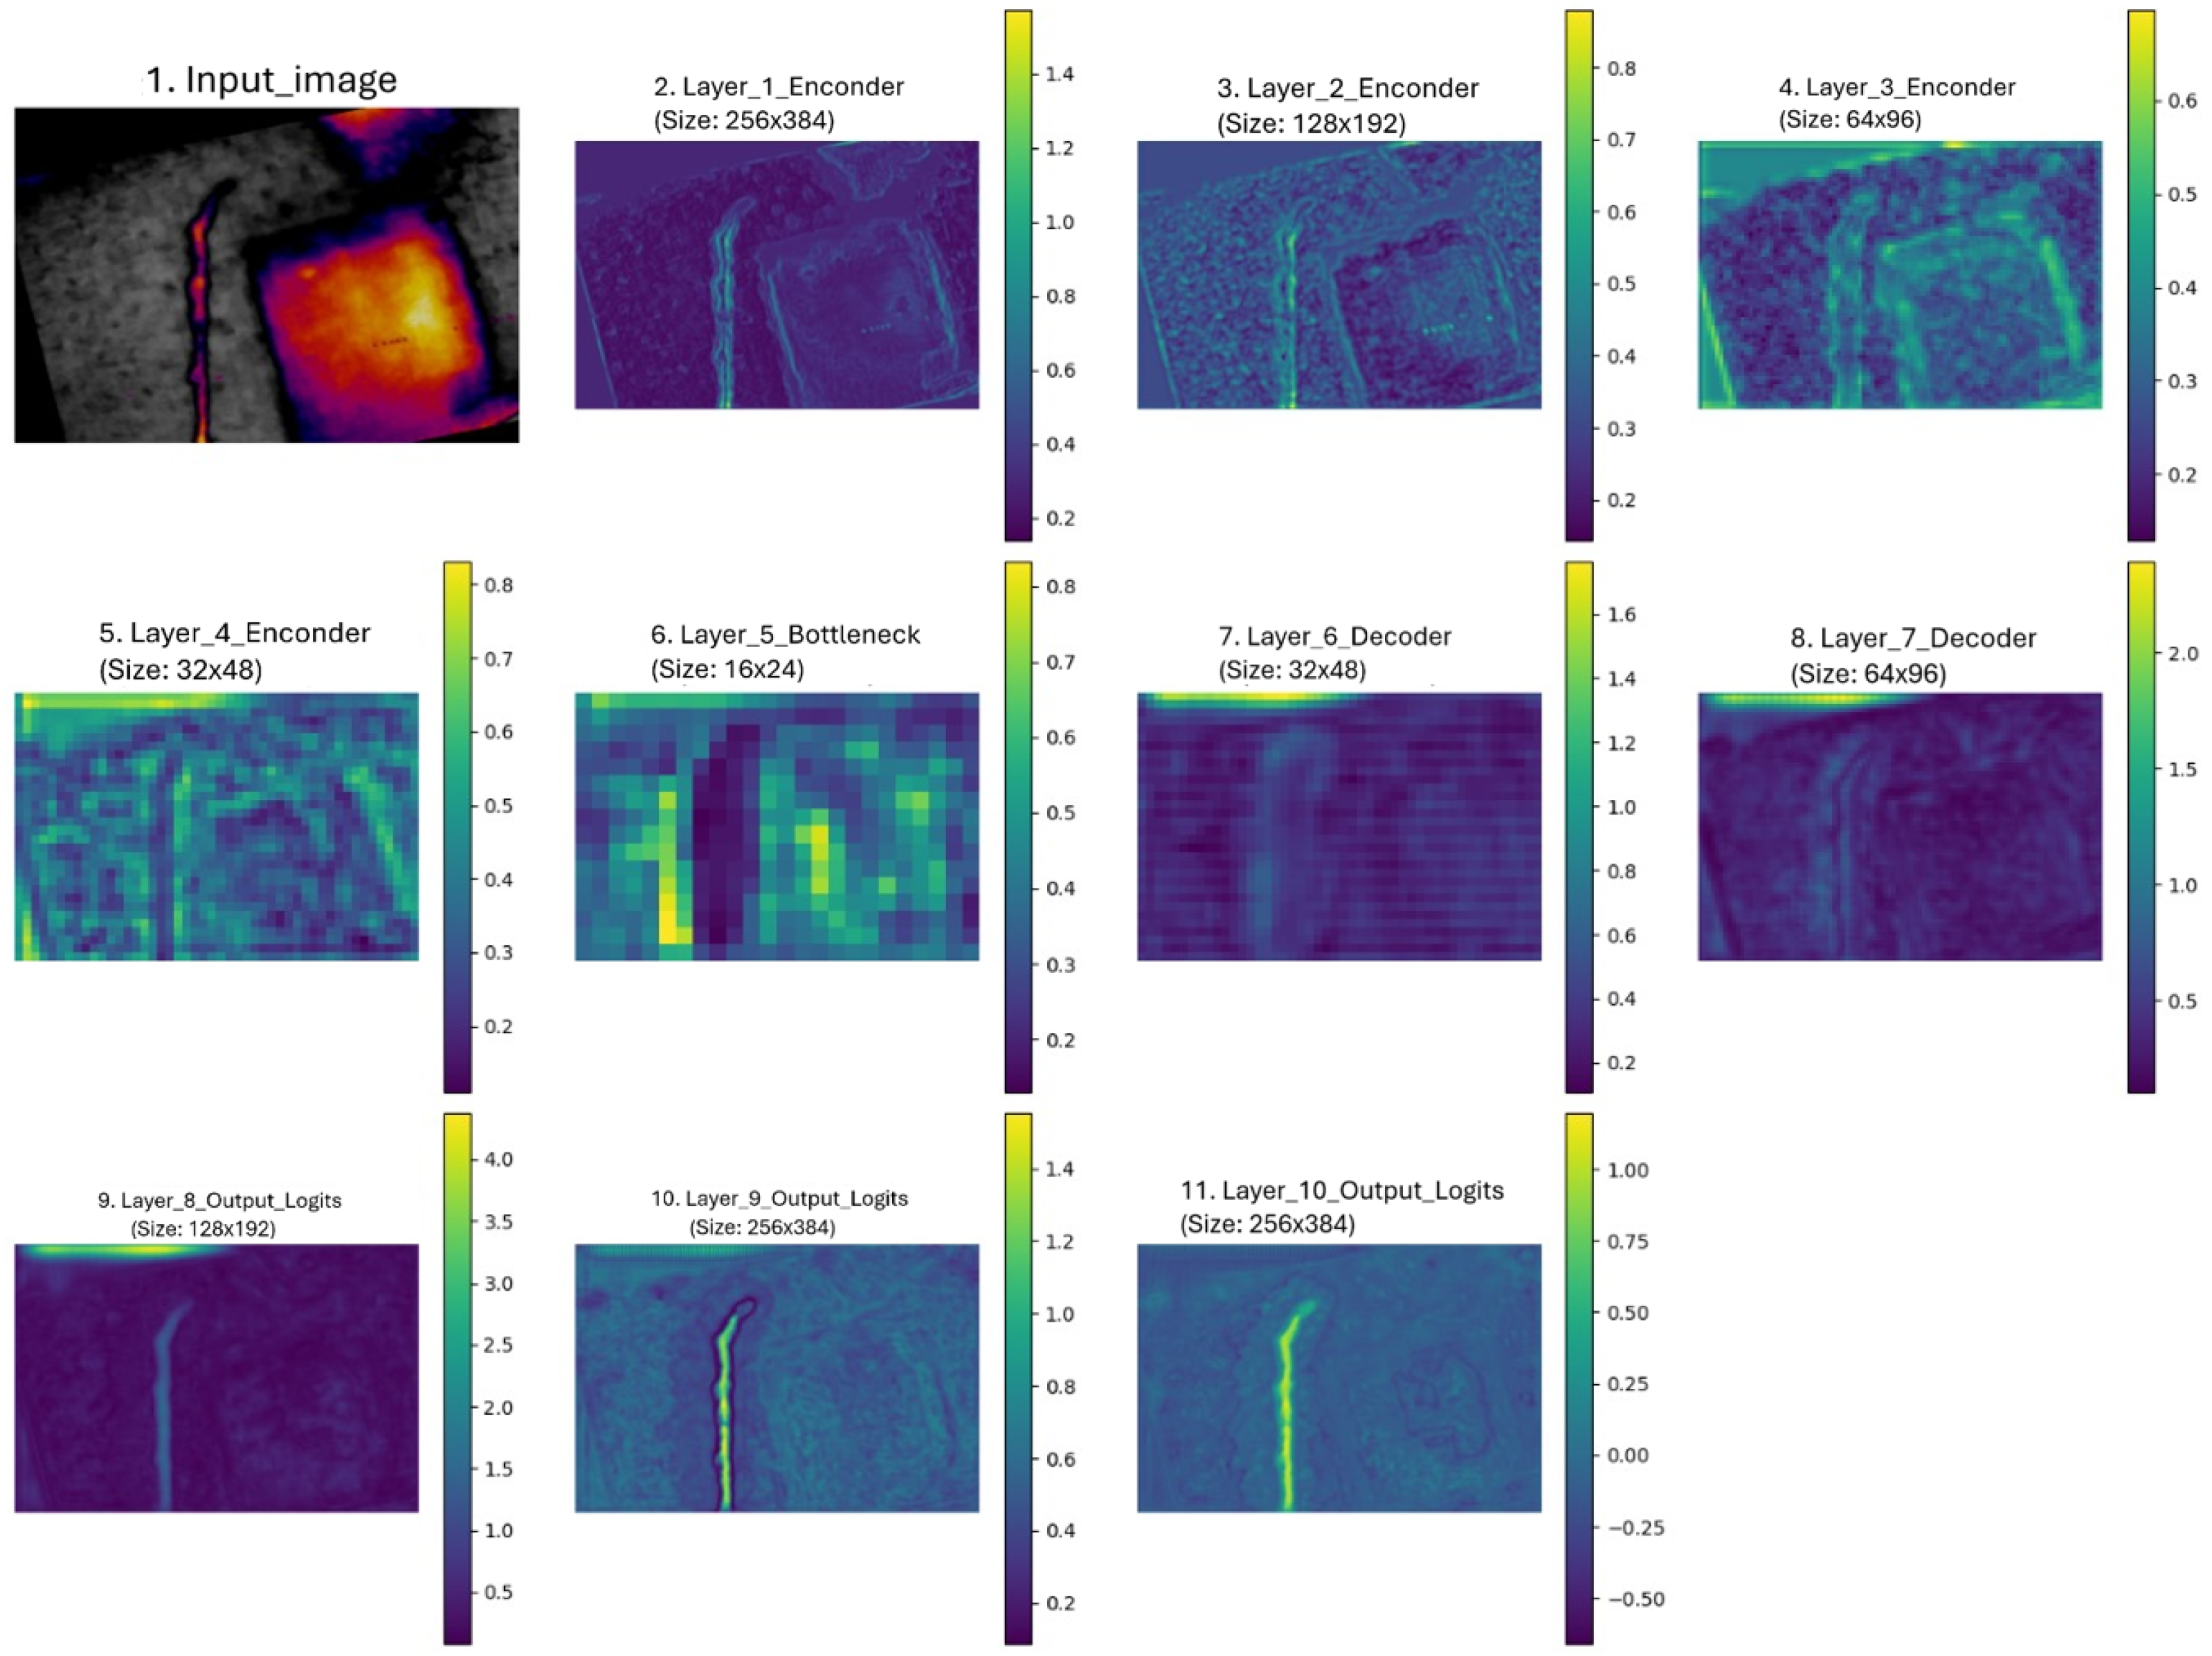
Figure 13.
U-Net ResNet50 architecture process. Own elaboration (2025).
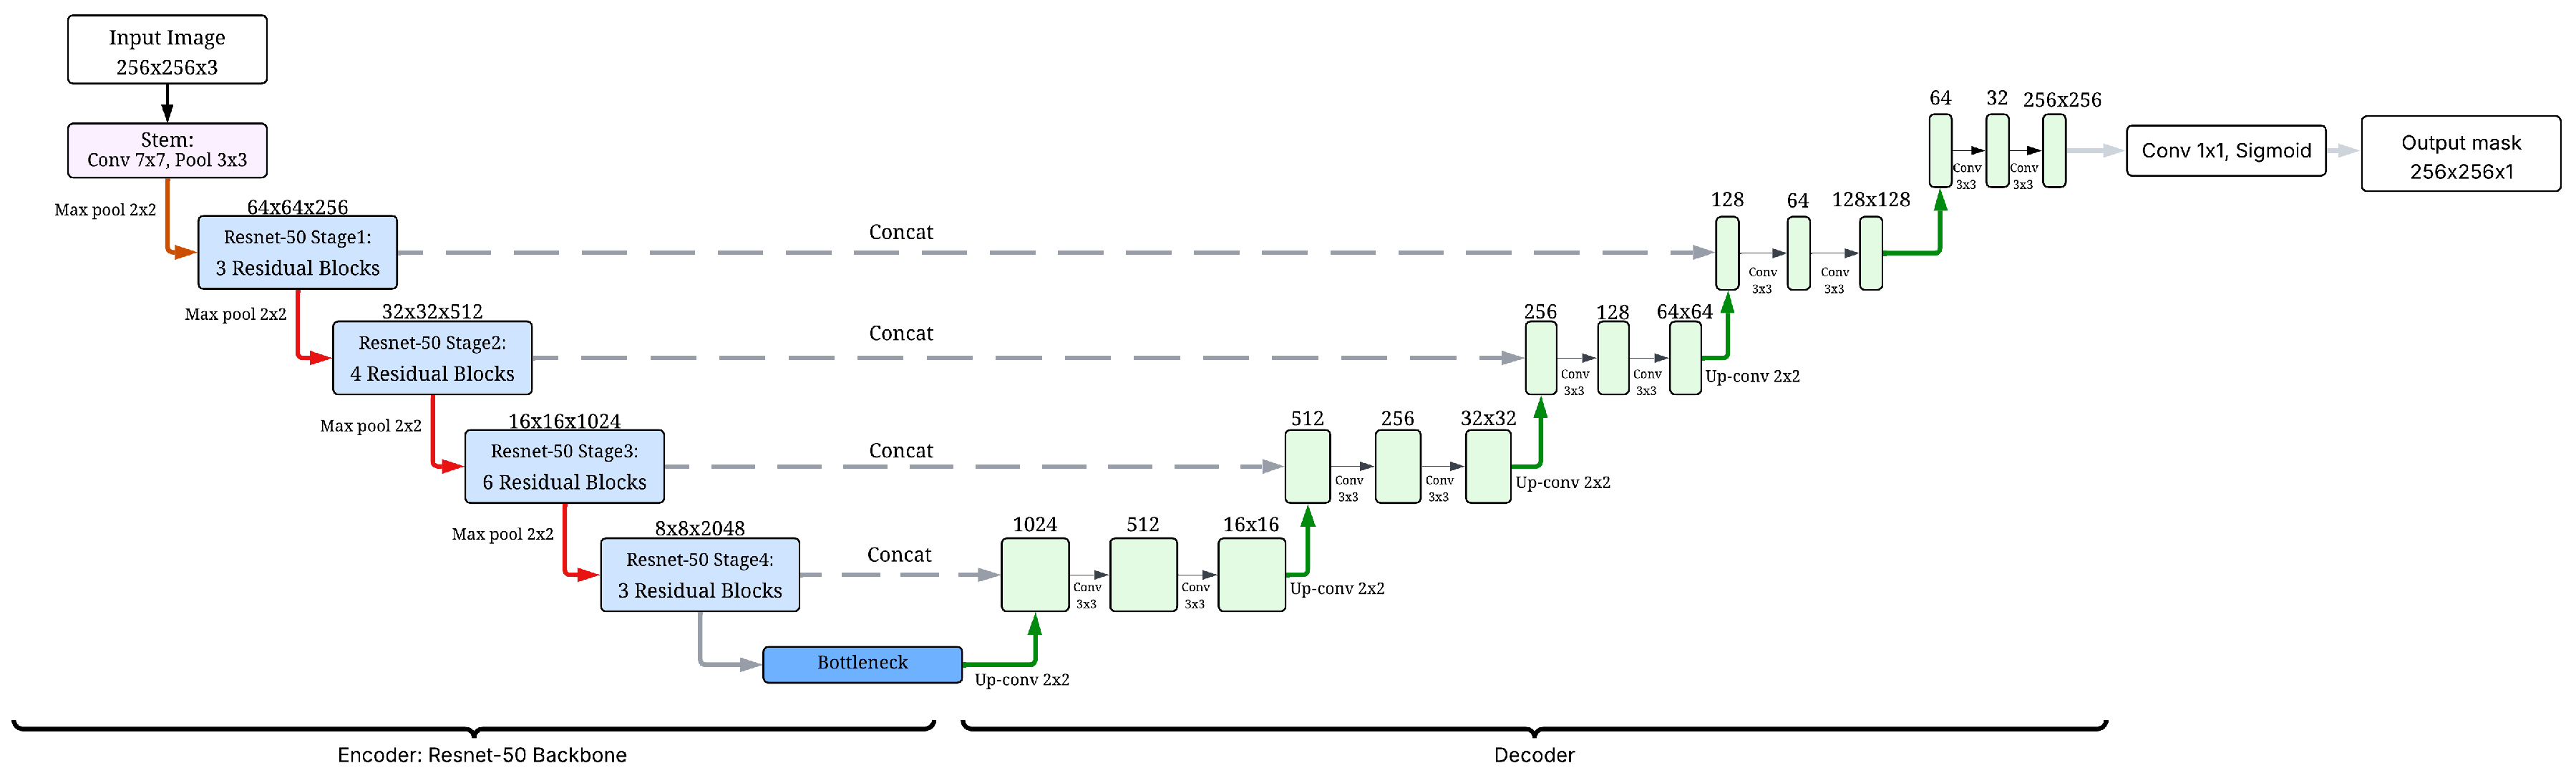
Figure 14.
Architecture of the Bottleneck block. Own elaboration (2025).

Figure 15.
Normalized confusion matrix of the Yolov8m model. Own elaboration (2025).
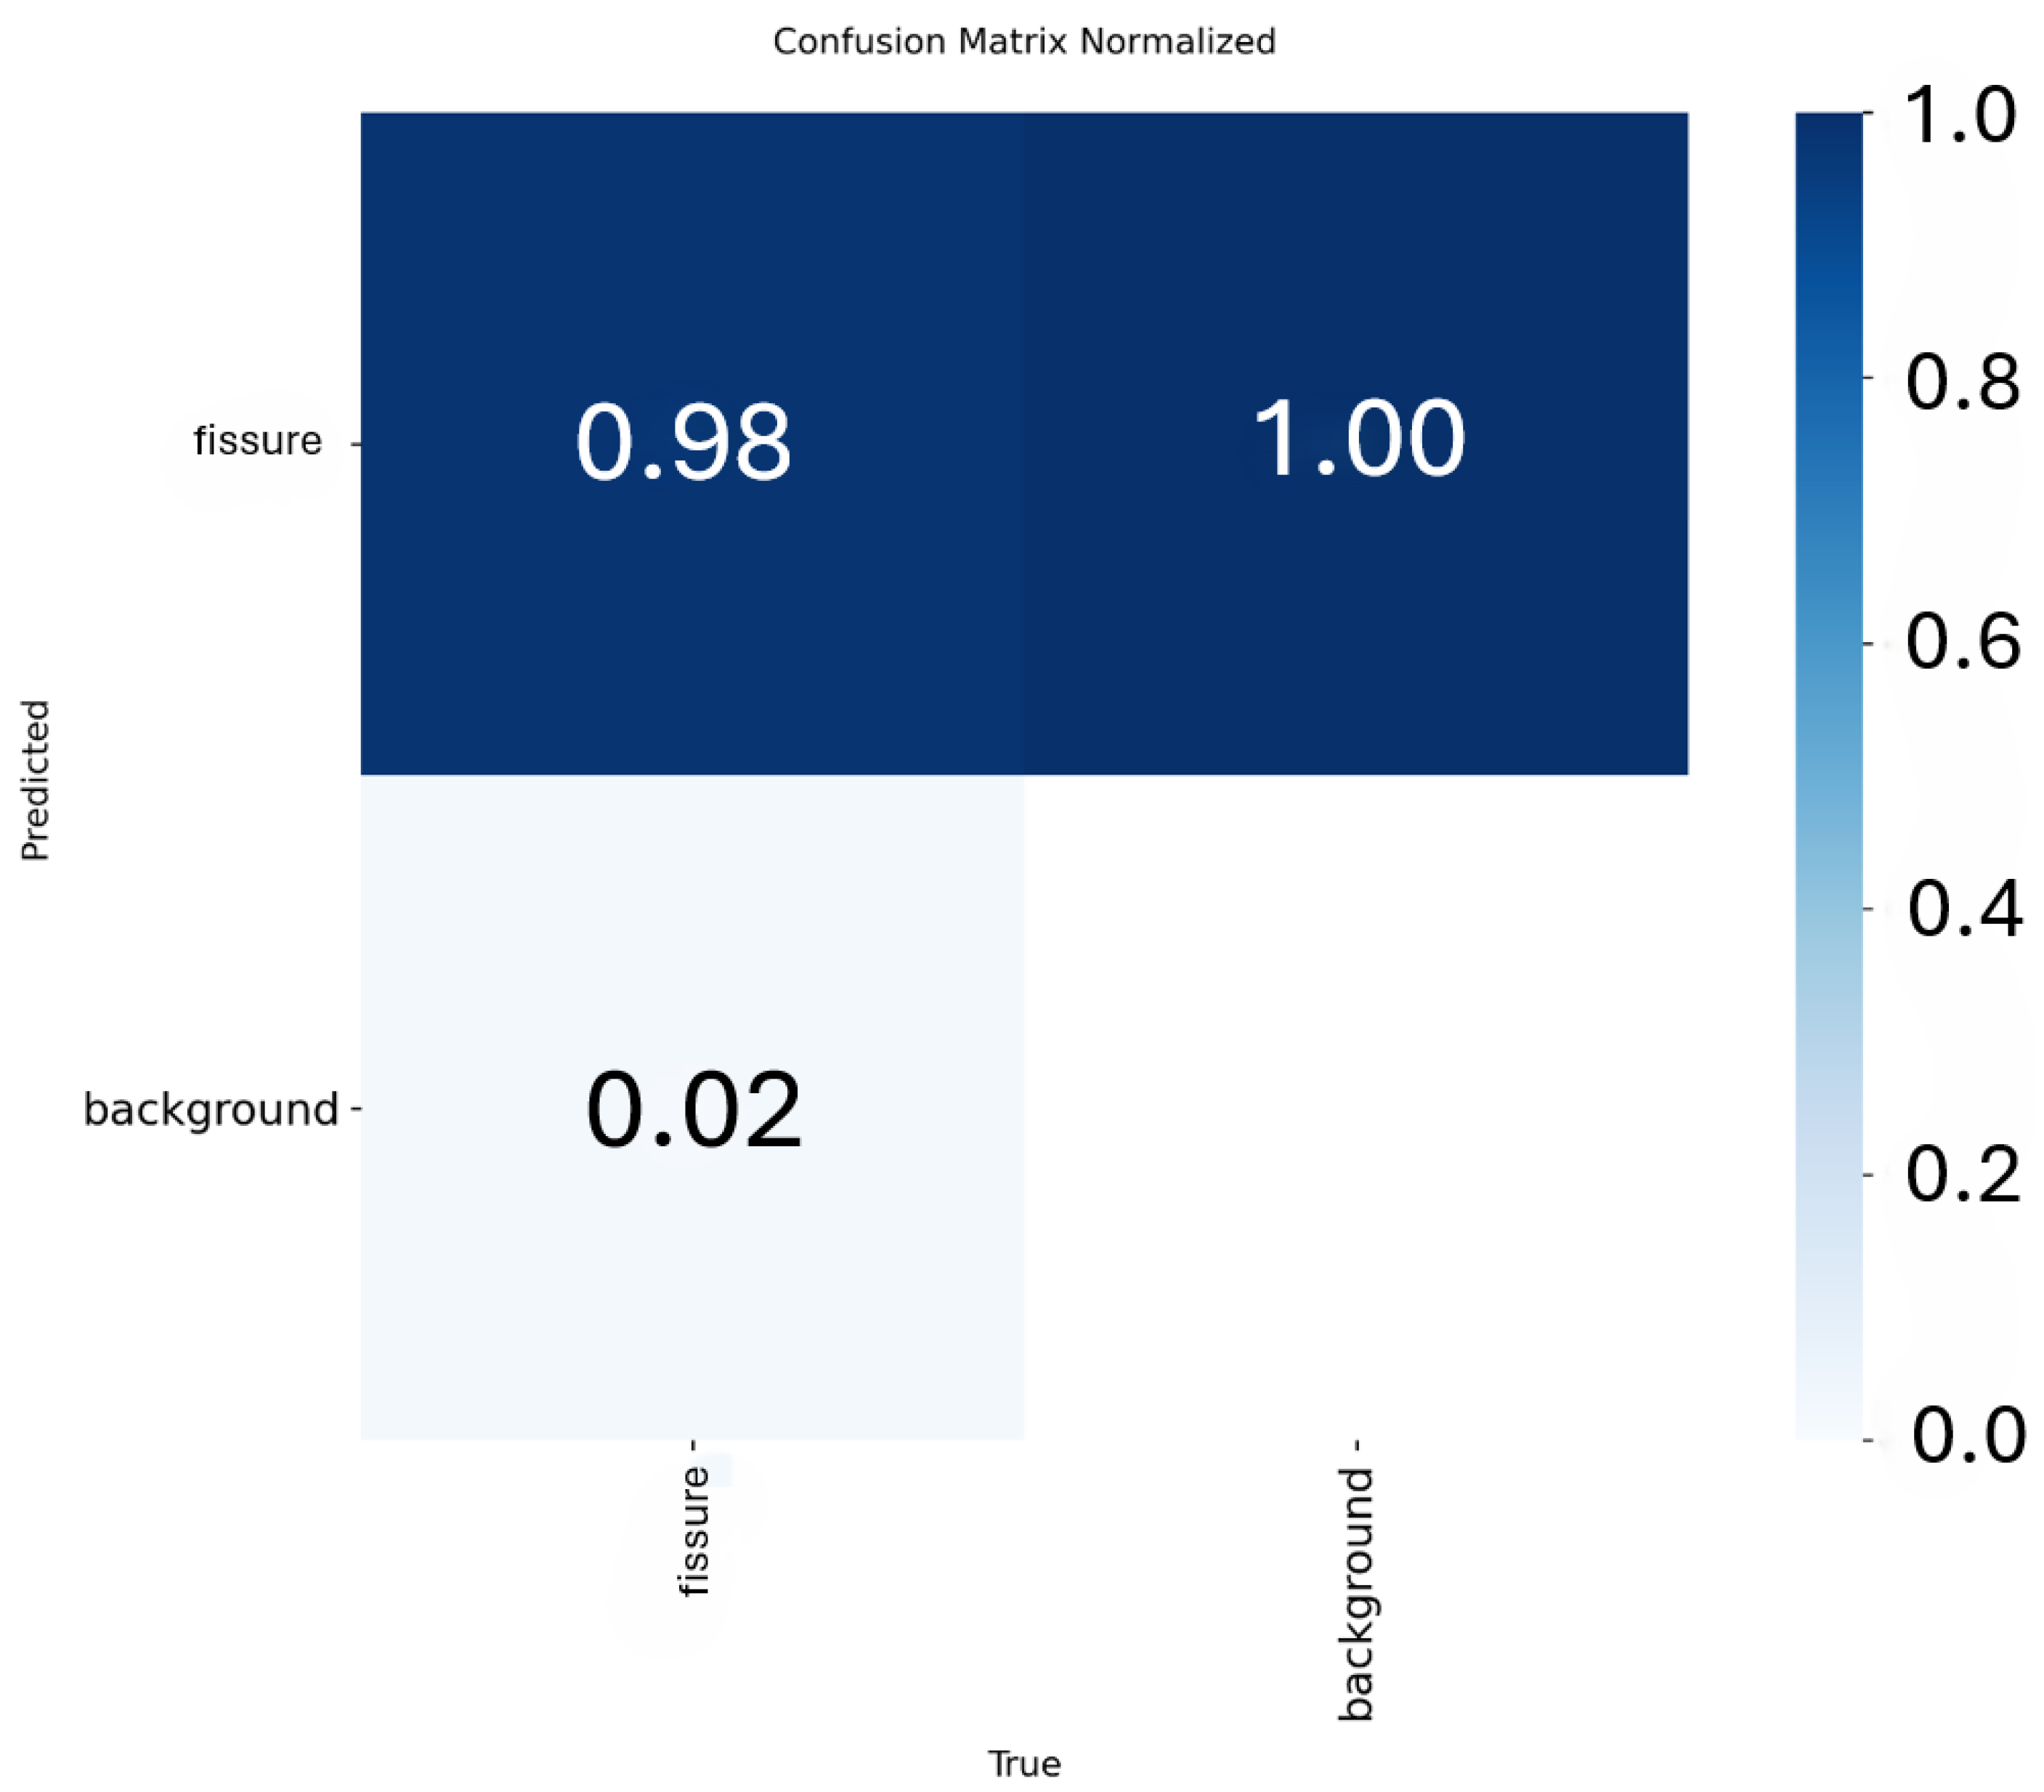
Figure 16.
F1 confidence curve of the Yolov8m model. Own elaboration (2025).
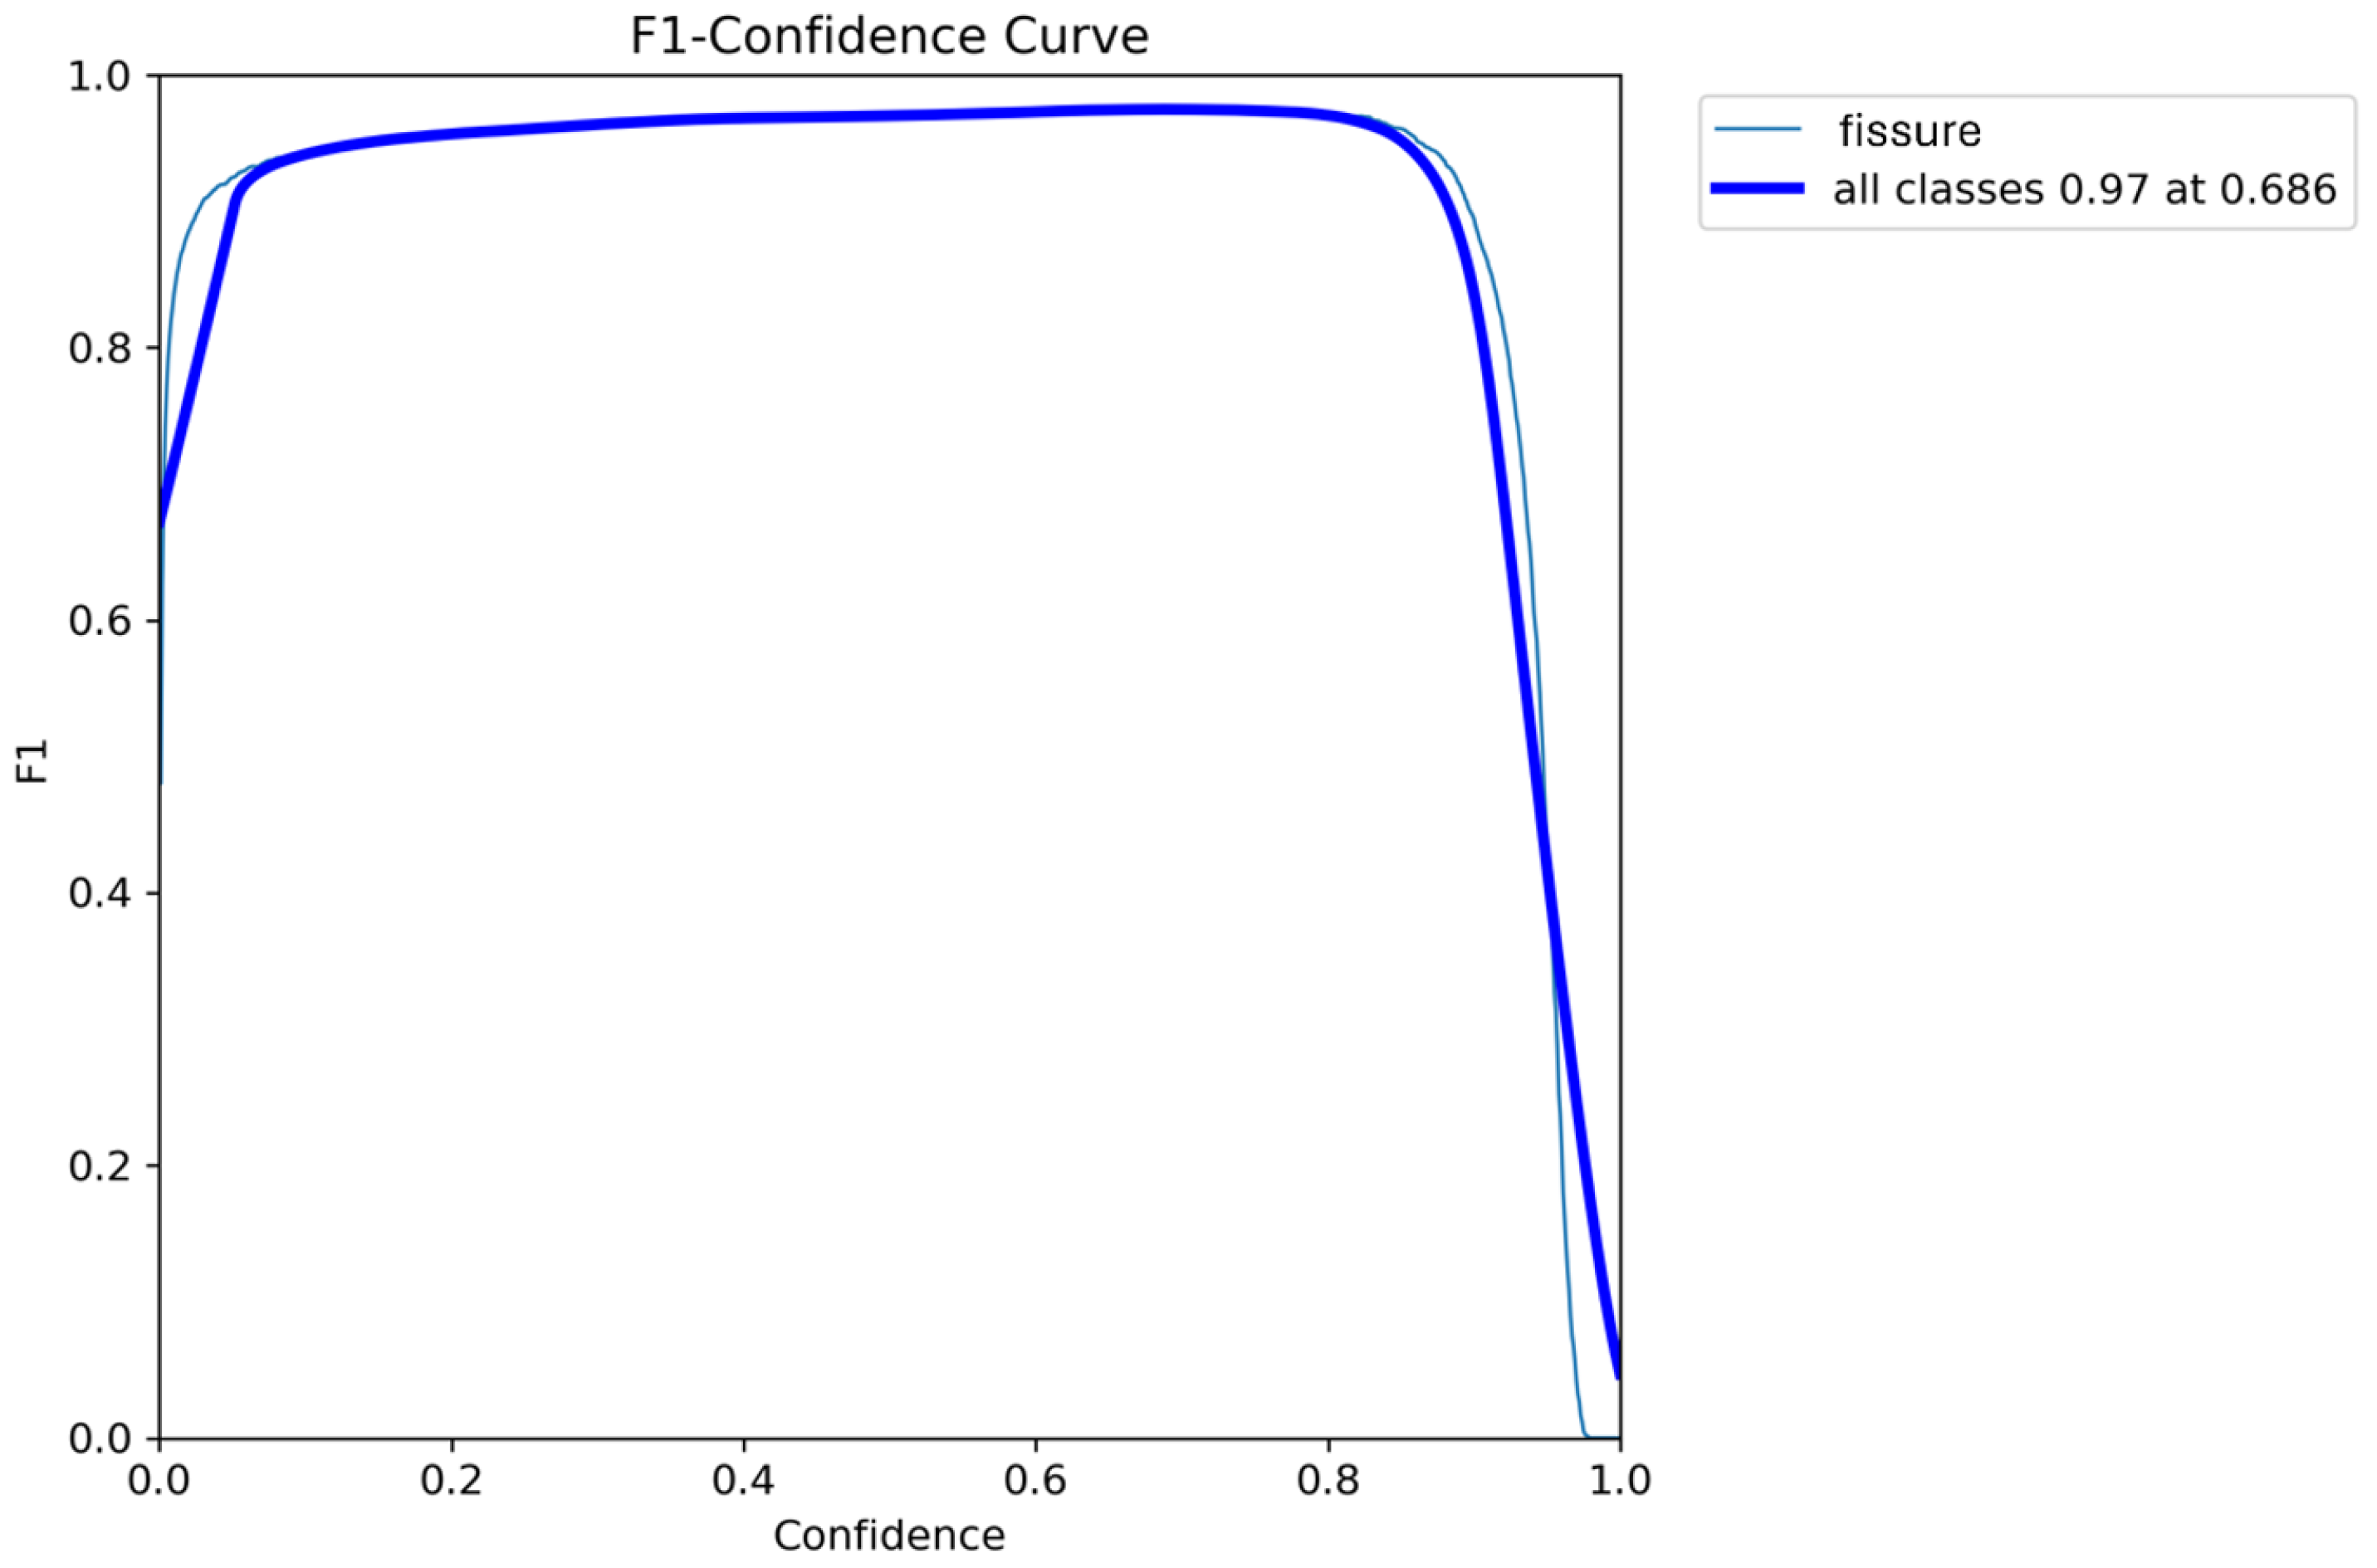
Figure 17.
Results of the metrics of the Yolov model8. Own elaboration (2025).
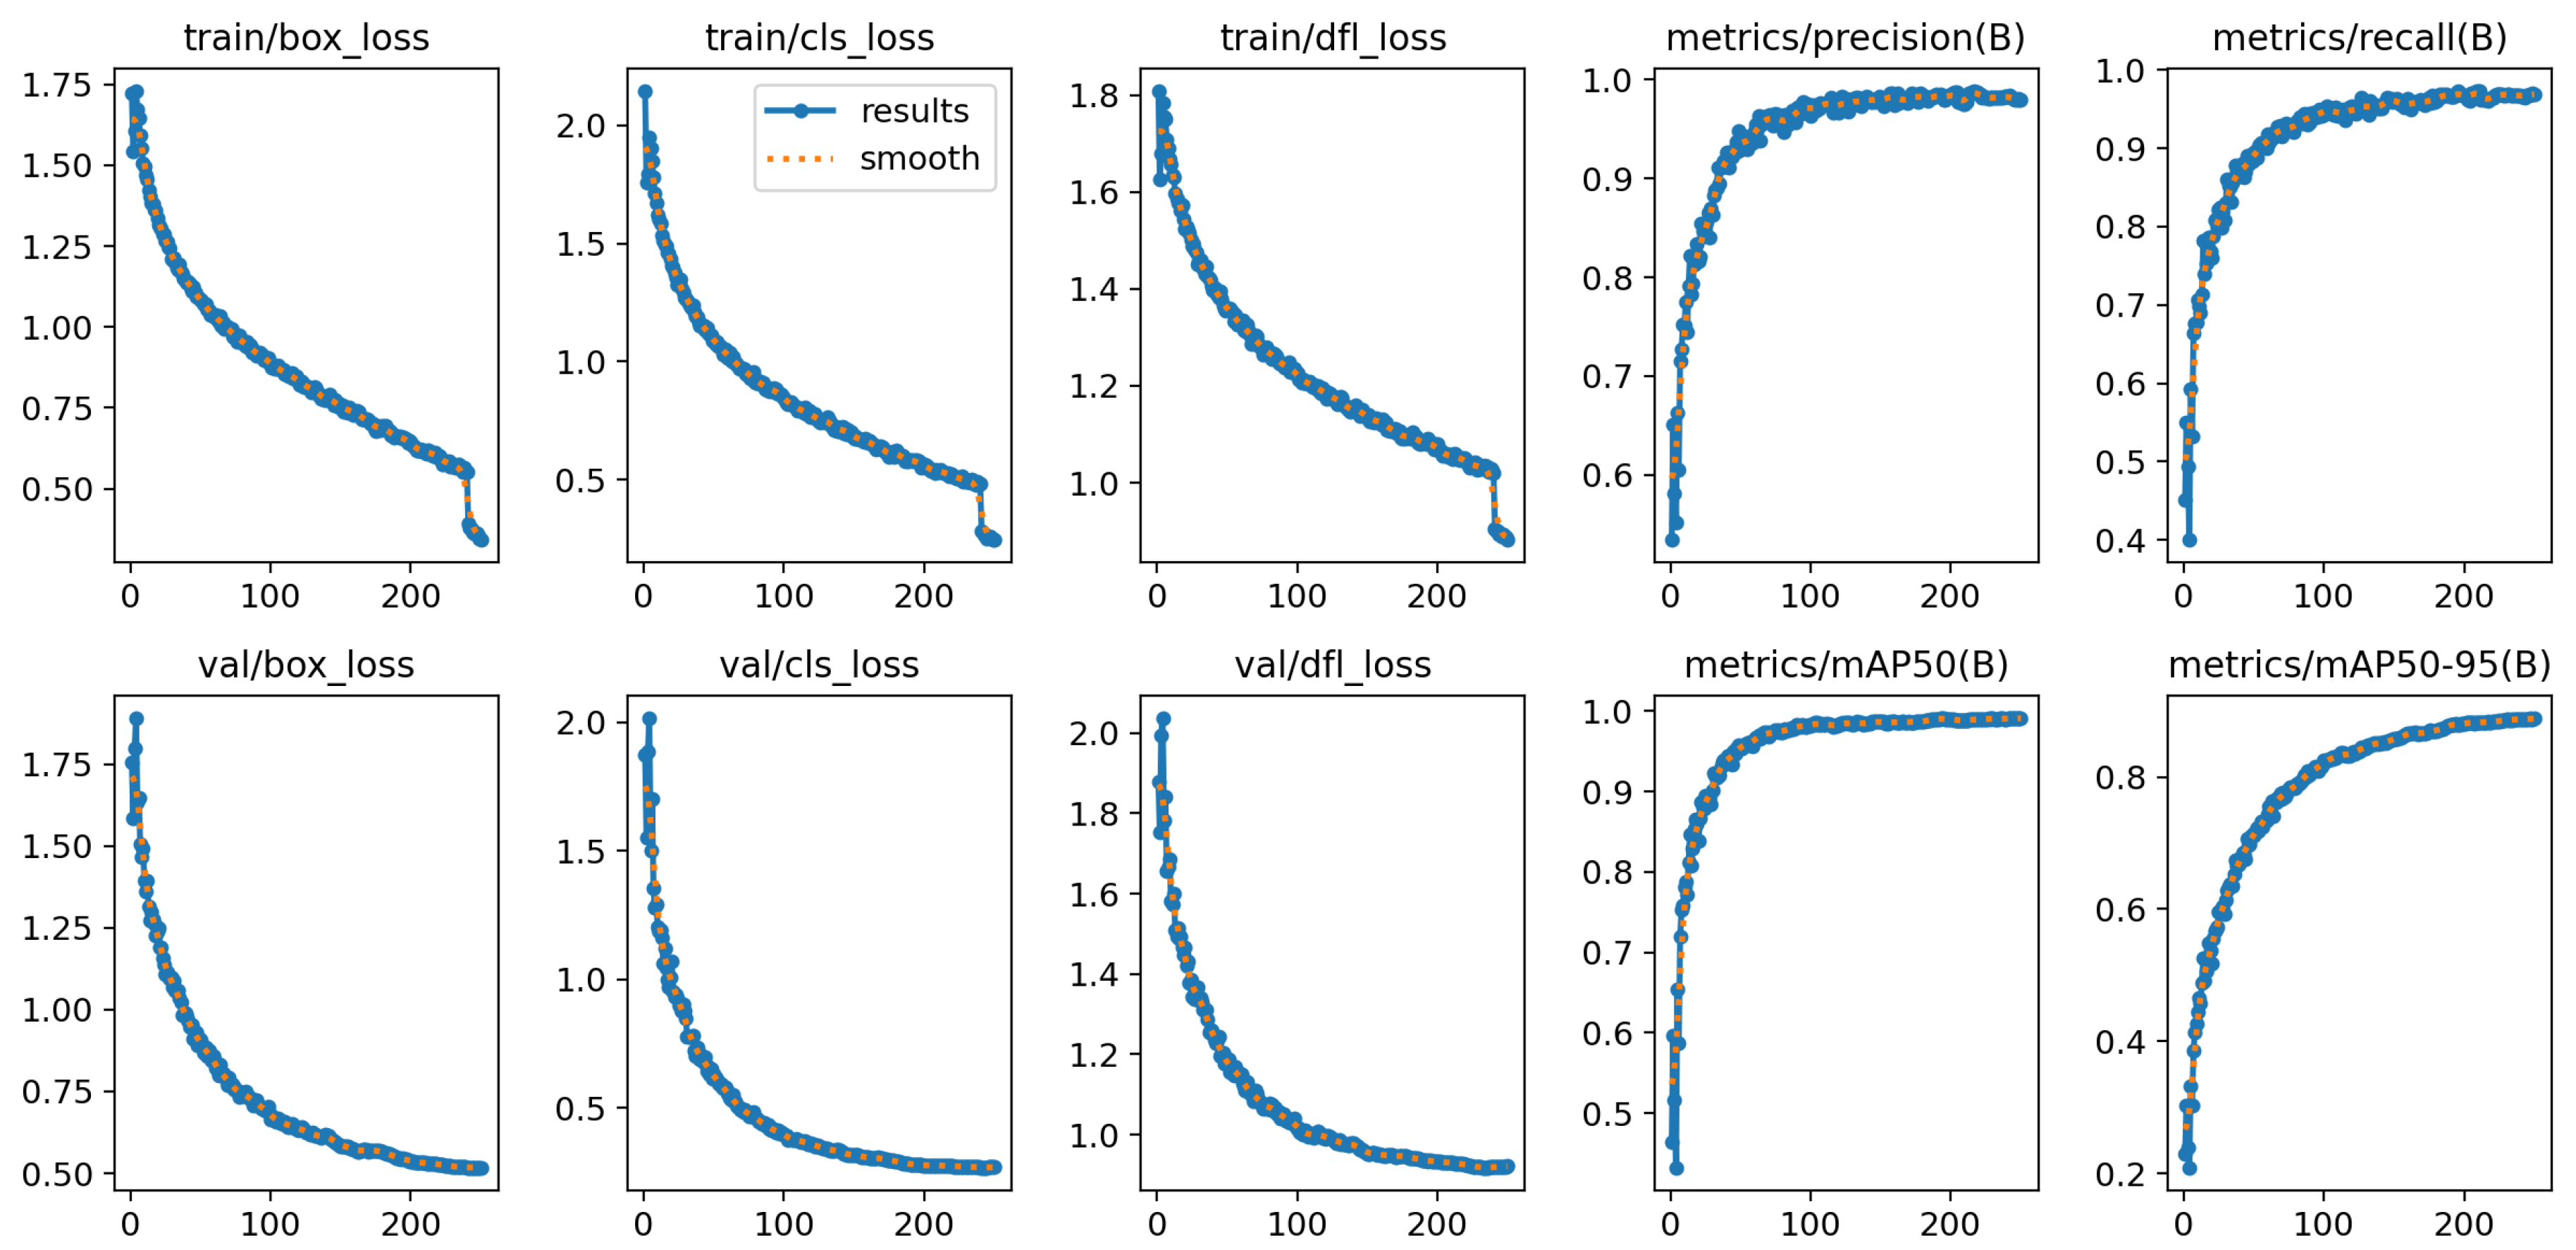
Figure 18.
Results of the metrics of the Yolov model8. Own elaboration (2025).
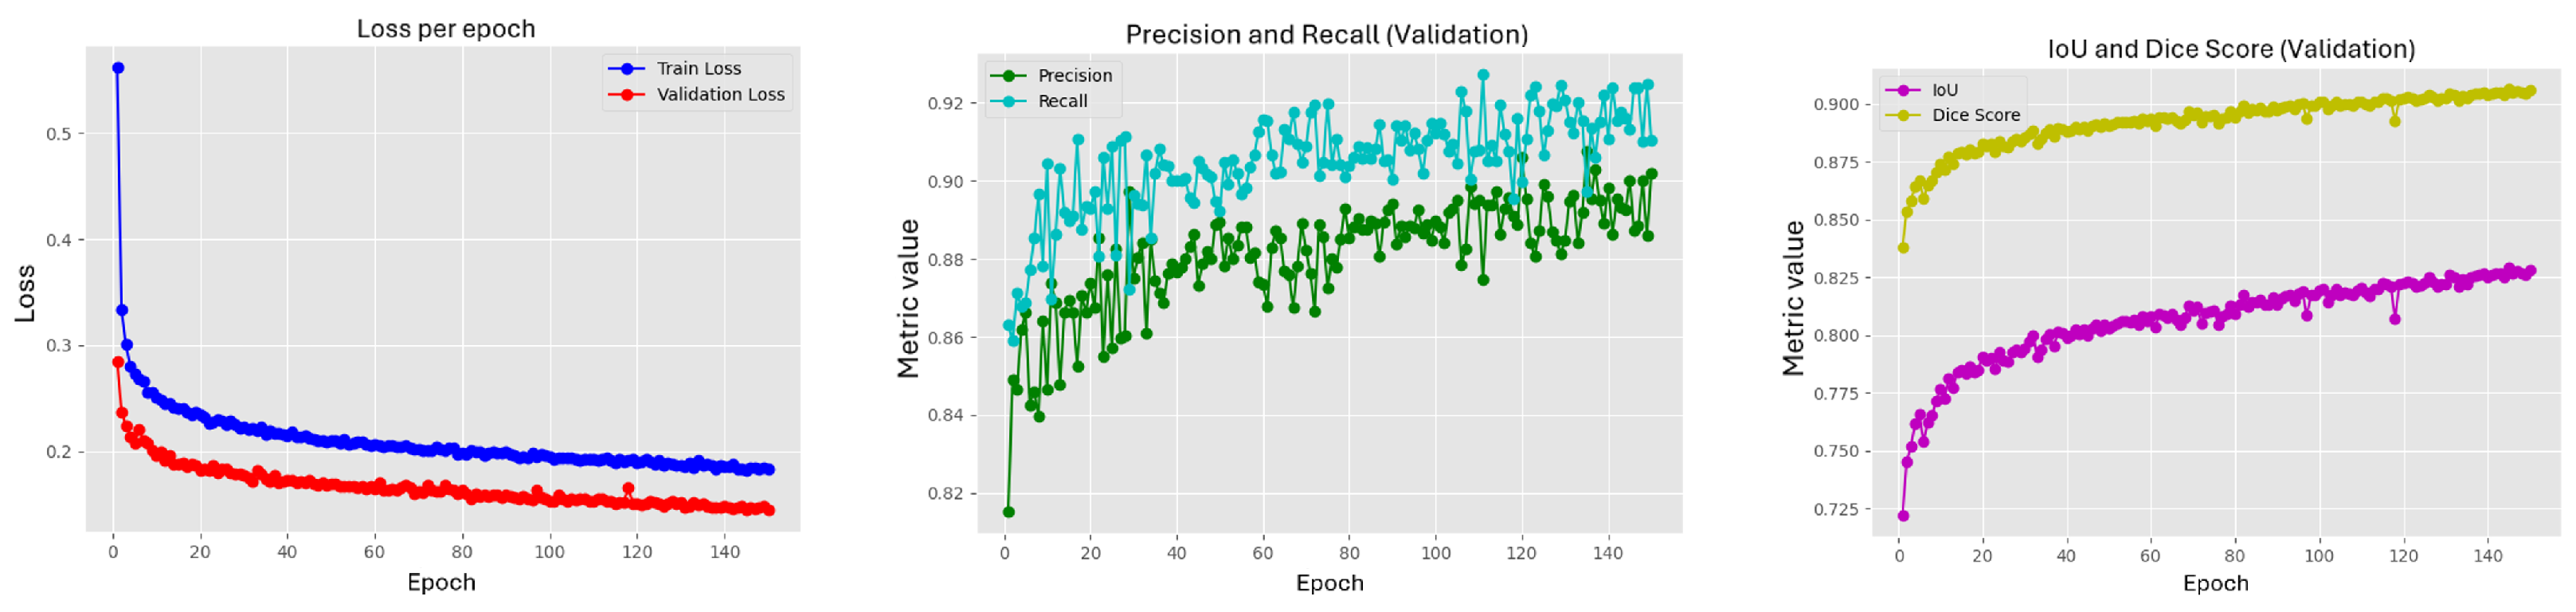
Figure 19.
Result of the combination of Yolov8m and U-Net (ResNet50) model: (a) Original image. (b) Yolov8m detection. (c) Segmentation by U-Net. (d) Detection and segmentation with U-Net (ResNet50) and Yolov8m.
Figure 19.
Result of the combination of Yolov8m and U-Net (ResNet50) model: (a) Original image. (b) Yolov8m detection. (c) Segmentation by U-Net. (d) Detection and segmentation with U-Net (ResNet50) and Yolov8m.
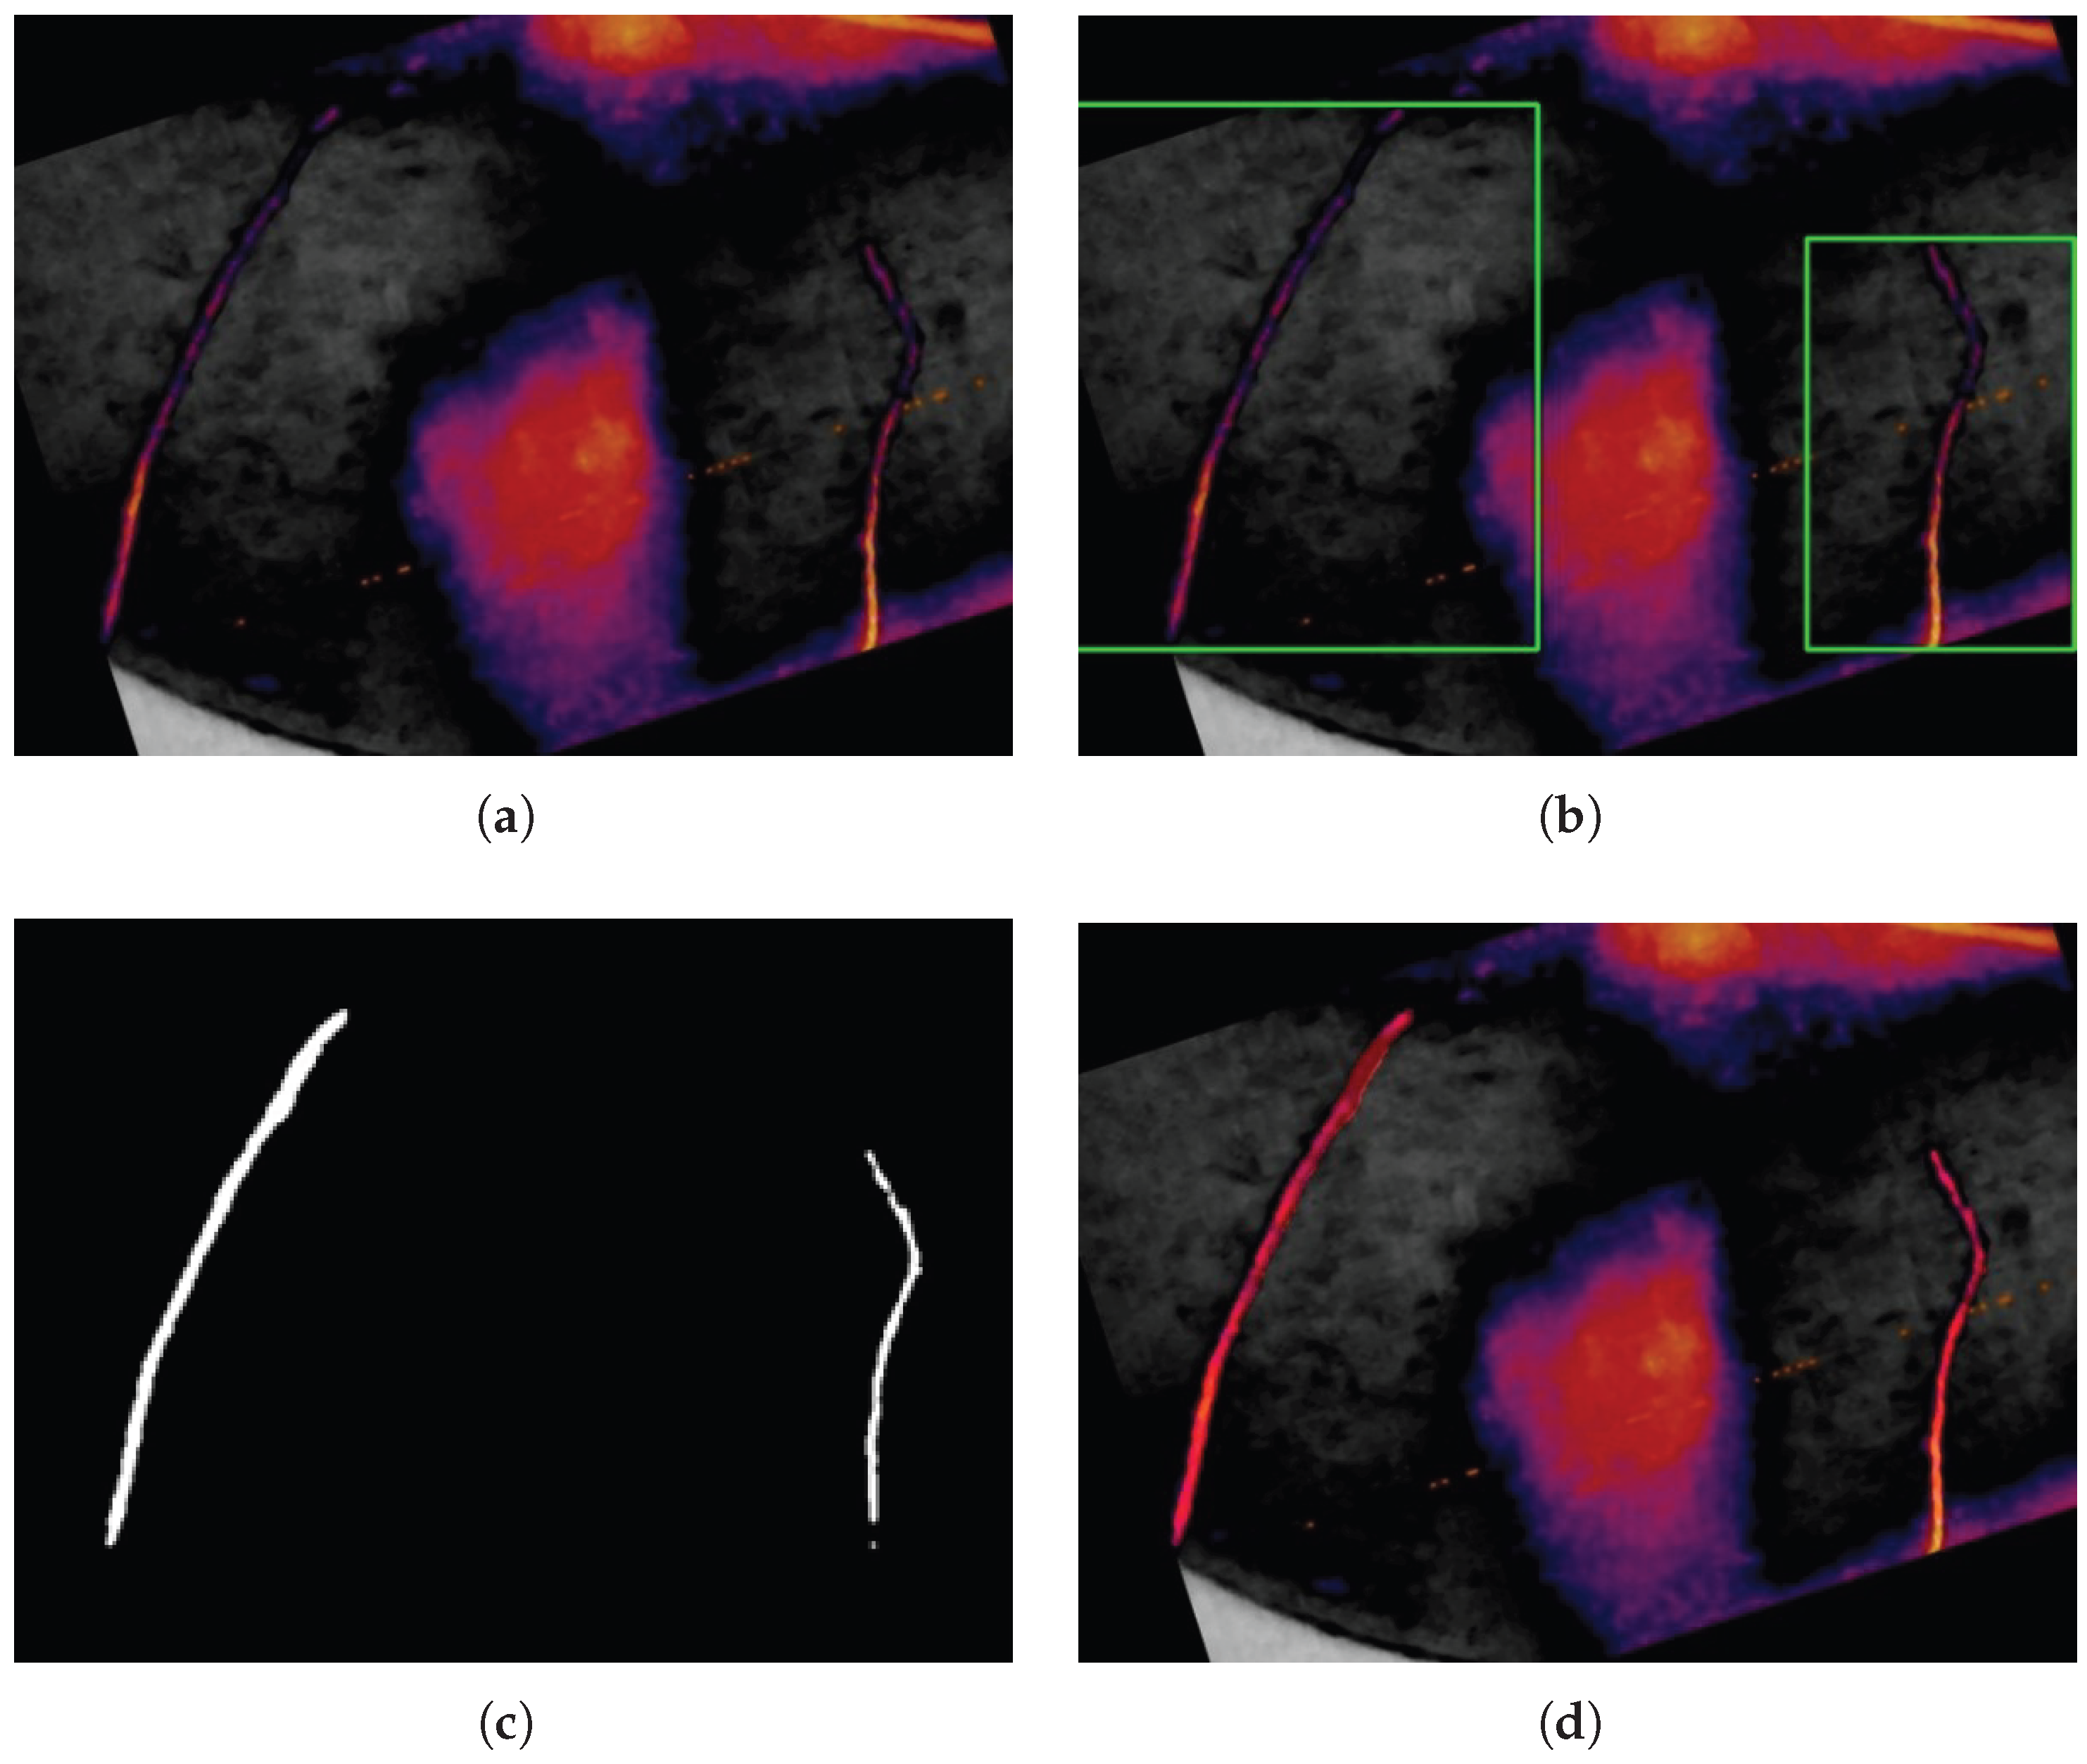
Figure 20.
Final result of the model with the lengh (L) and width (A) of the cracks. Own elaboration (2025).
Figure 20.
Final result of the model with the lengh (L) and width (A) of the cracks. Own elaboration (2025).
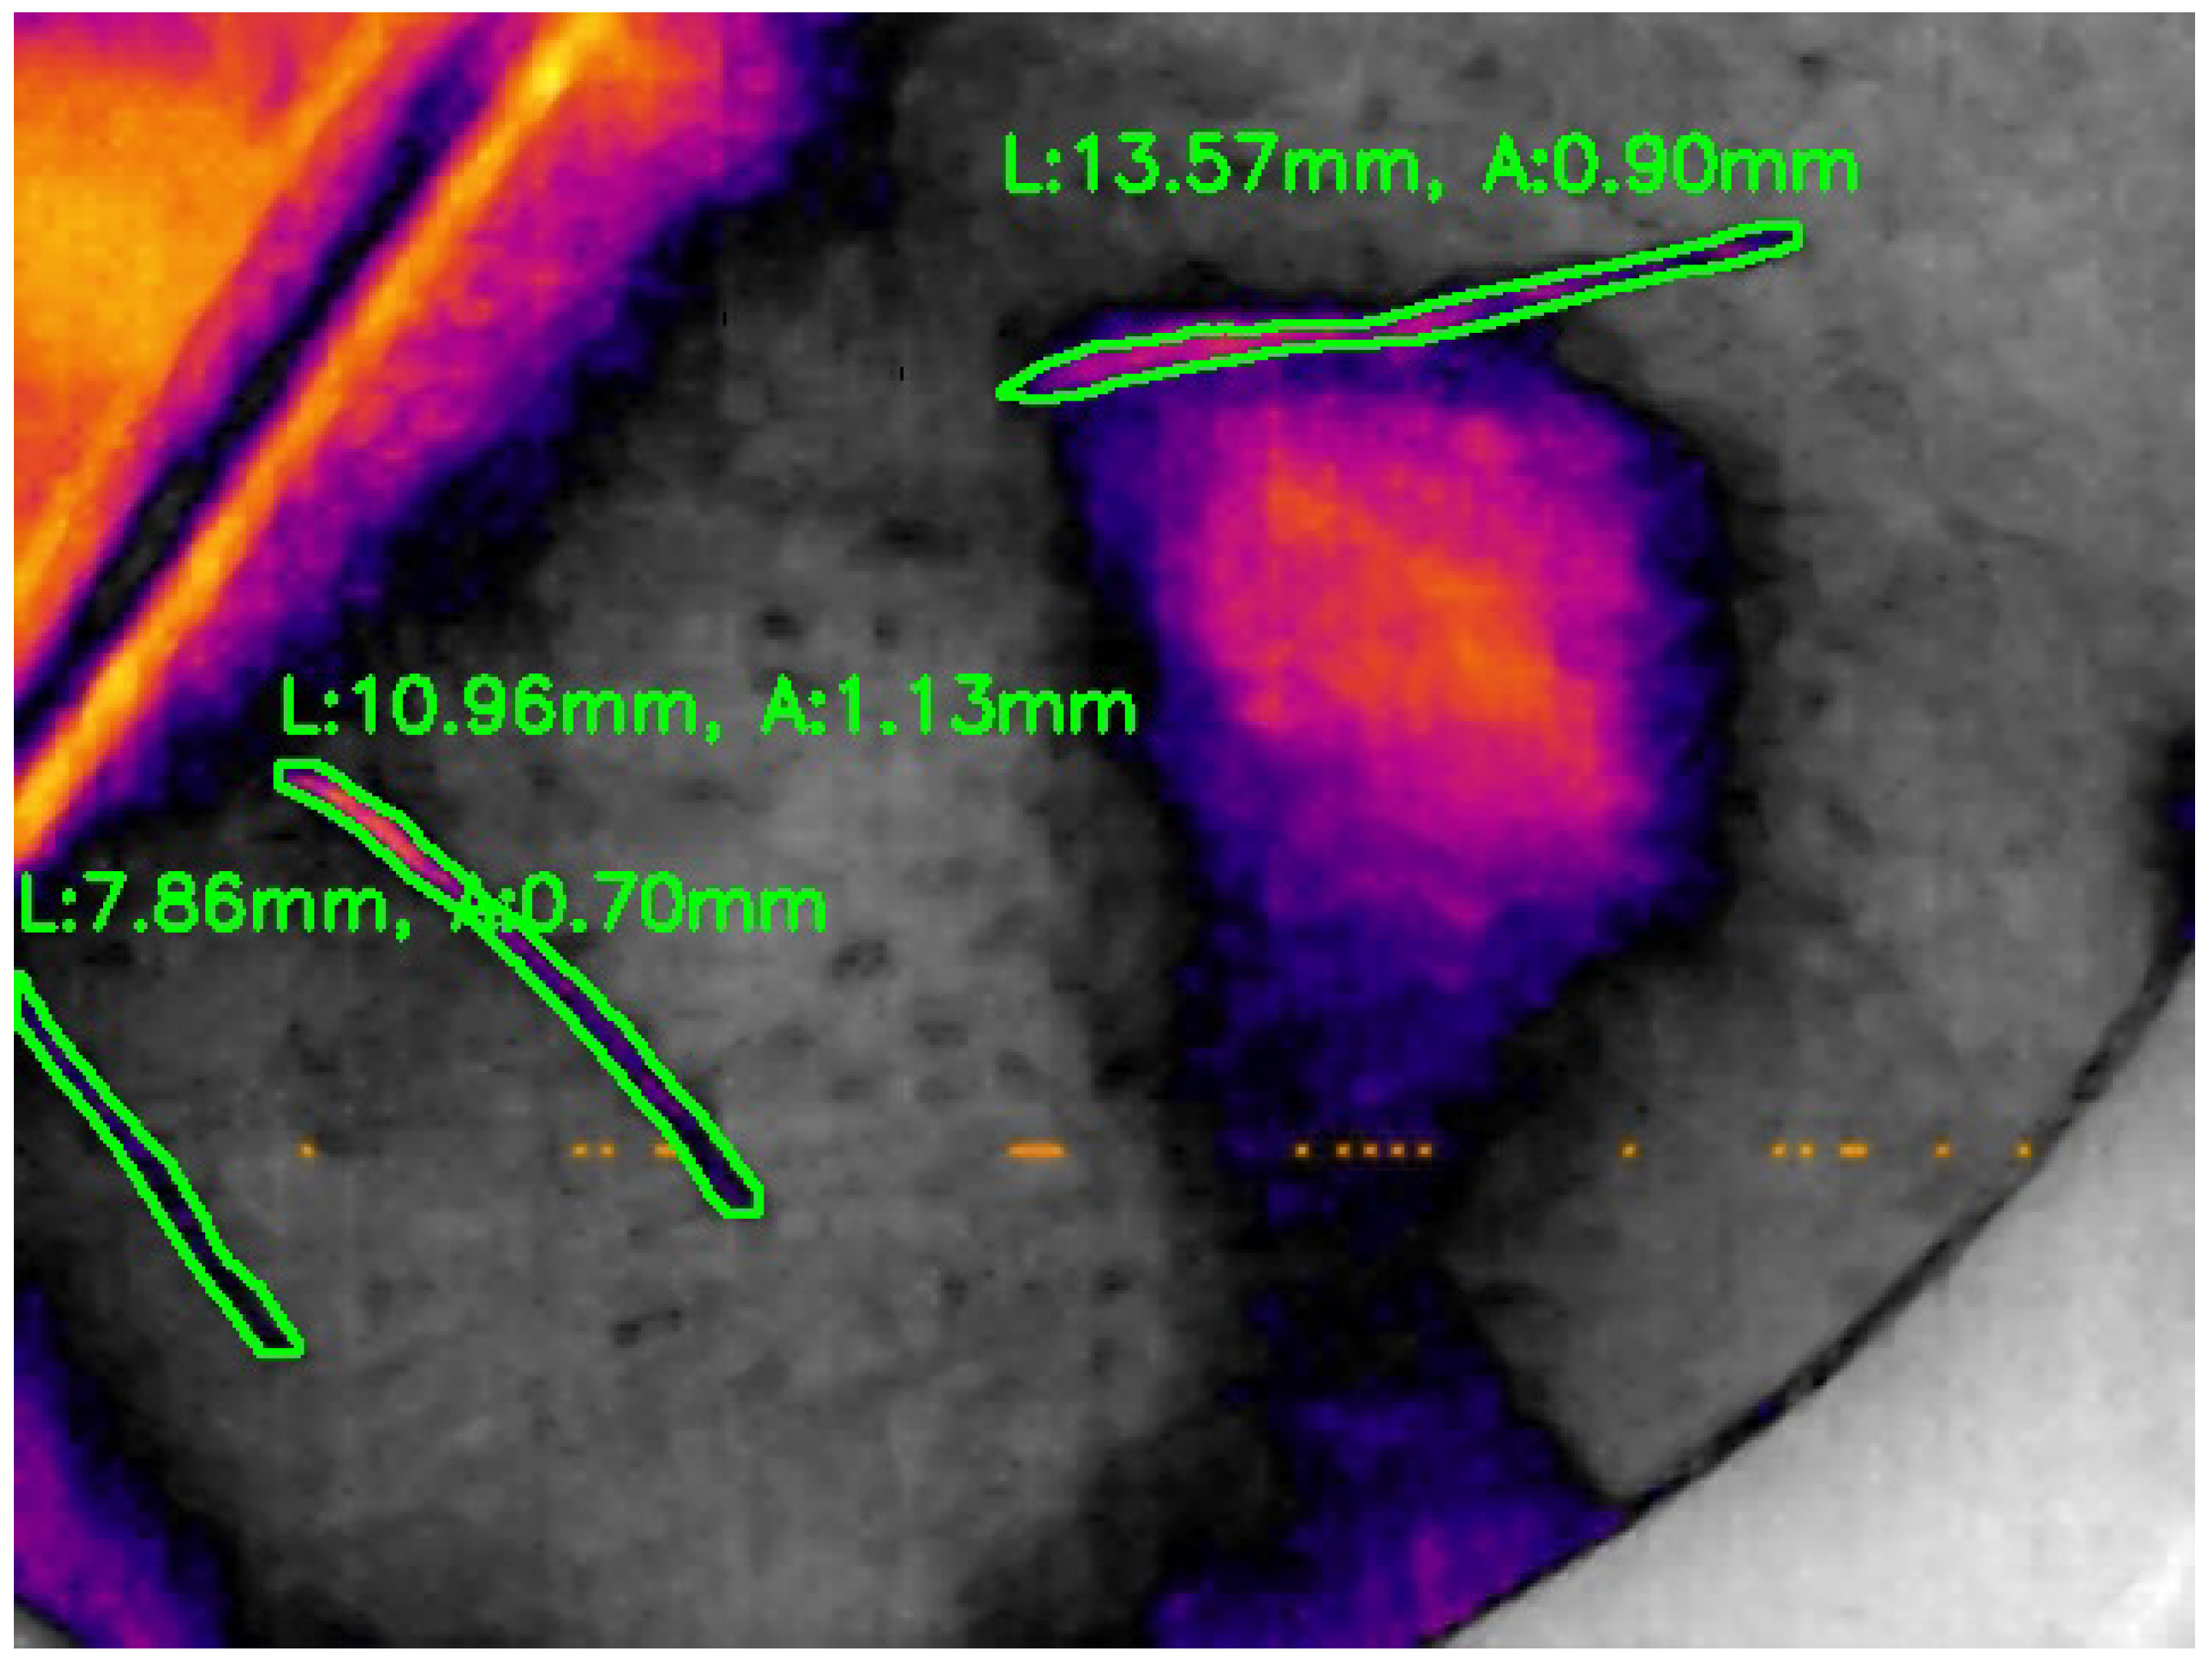
Table 1.
Distribution of the database used for the Yolov8 medium model
| Type | Original | Data augmentation | Training | Validation |
|---|---|---|---|---|
| RGB and grayscale | 1000 | 13850 | 11080 | 2770 |
| Grayscale | 1000 | 13850 | 11080 | 2770 |
Table 2.
Training Hyperparameters
| Type | Epochs | Learning Rate | Early stopping | Cost Function | Batch | Seed |
|---|---|---|---|---|---|---|
| U-Net with ResNet50 | 150 | 0.0001 | 25 | Sigmoid | 12 | – |
| Yolov8m | 250 | 0.0001 | 25 | SiLU, Sigmoid and Softmax | 12 | 0 |
Disclaimer/Publisher’s Note: The statements, opinions and data contained in all publications are solely those of the individual author(s) and contributor(s) and not of MDPI and/or the editor(s). MDPI and/or the editor(s) disclaim responsibility for any injury to people or property resulting from any ideas, methods, instructions or products referred to in the content. |
© 2025 by the authors. Licensee MDPI, Basel, Switzerland. This article is an open access article distributed under the terms and conditions of the Creative Commons Attribution (CC BY) license (http://creativecommons.org/licenses/by/4.0/).
Copyright: This open access article is published under a Creative Commons CC BY 4.0 license, which permit the free download, distribution, and reuse, provided that the author and preprint are cited in any reuse.


