Submitted:
03 September 2025
Posted:
03 September 2025
You are already at the latest version
Abstract
Train wheelsets are key components of high-speed trains and are prone to failure during long-term operation under harsh conditions. Accurate and comprehensive online inspection of defects in wheelset treads are difficult because of their variety and position uncertainty. Accurate detection and location of small targets are highly challenging. This study developed an improved YOLOv7 model with better accuracy and lower power computation. The model was applied to the inspection of various wheelset-tread defects. GSConv was used to reduce the model volume, while a small target enhancement module addressed low pixels and difficulty in distinguishing small targets. This improved the classification accuracy for damage feature recognition. The captured images of the wheelset tread were preprocessed using StyleGAN3 to augment small samples and address non-uniformities. The experimental results showed that the proposed model exhibited a remarkably better overall performance than conventional models, particularly in terms of mean average precision. The public RSDDs dataset of small rail defects was selected to verify the robustness of the proposed algorithm. Compared with the traditional network model, the improved model proposed herein showed good performance for small target defects in different samples, highlighting its potential applicability in online inspection of wheel tread defects.
Keywords:
deep learning
; small target detection
; STE (small target enhancement)
; wheelset-tread defect
; defect detection
1. Introduction
Train wheelsets, which are critical components of high-speed trains, are susceptible to failure under long-term operation in harsh environments [1,2]. The defects in wheelset treads typically include peels, wear, bruises, and pits. The efficient detection of wheelset-tread defects is necessary for safe operation of trains [3,4]. Traditional methods primarily adopt manual measurements; however, most inspection information is not used appropriately for efficient detection [5]. Machine vision technology is frequently employed in tedious inspection tasks to reduce labor waste [6,7,8]. In complex environments, traditional machine vision inspection faces challenges such as vibration, noise, and light variation, which seriously influence measurement accuracy and efficiency. Numerous defect detection studies have focused on convolutional neural networks (CNNs) because of their superior ability to overcome various disturbances [9]. The most common models mainly include two-stage models, such as faster region-based CNN (Faster R-CNN) models, for their accuracy [10,11], and two-stage models, such as You Only Look Once (YOLO), for their efficiency [12,13]. YOLO-based algorithms have been widely applied in numerous online and complex detection areas owing to their high efficiency [14,15,16,17].
Accurate and comprehensive online inspection of defects in wheelset treads are difficult because of their variety and position uncertainty; in particular, the accurate detection and location of small targets poses greater challenges. Compared to common targets, small targets usually have a low pixel count with a smaller portion and are easily overlapped; they are therefore difficult to recognize. Ren et al. [18] improved YOLOv4 to solve the problem of small target recognition by using a lightweight backbone and a shallow feature enhancement network. Tian et al. [19] proposed multiscale dense YOLO (MD-YOLO), which incorporates a feature extraction path and feature aggregation path. A deep network, which leverages spatial location information from a shallower network, results in enhanced accuracy of small target detection. Wei et al. [20] modified YOLOv3 model to rectify the shortcomings of small target detection. Huang et al. [21] addressed the problem of poor small target detection and optimized k-means clustering algorithms with an added small target detection layer. Lin et al. [22] reported an enhancement in target localization ability of a network with the use of the coordinate attention (CA) mechanism within the feature aggregation process design. Cai et al. [23] achieved a more precise and efficient detection method that utilizes channel attention and spatial attention modules to suppress insignificant features in datasets. Kang et al. [24] proposed ASF-YOLO, which combines spatial and scale features for accurate and fast cell-instance segmentation. Li et al. [25] proposed a new lightweight convolution technique (GSConv) to reduce the model size while maintaining accuracy.
This paper proposed an improved, YOLOv7-based model that realizes efficient detection of defects in the wheelset tread of high-speed trains. The captured images of the wheelset tread are preprocessed for small and nonuniform samples. First, the image dataset of the wheelset tread are expanded using traditional data augmentation and Copy–Paste [26] to address data scarcity. Second, the new dataset is trained using the StyleGAN3 network [27]. Third, the defects are labeled using the LabelImg software. Then, the dataset is divided into training, validation, and test sets. Finally, lightweight convolution in the Neck module is used to reduce the computational parameters of the model, and a small target enhancement (STE) module is added to address the issue of small sample detection. A comparison of the experimental results indicates that YOLOv7-STE exhibits better detection accuracy. A publicly available rail surface defect dataset (RSDDs) dataset with similar small target defects was used to verify the robustness of the proposed model. As compared to the traditional network model, the proposed model shows good performance in detecting small target defects in different samples. The experimental results confirm that YOLOv7-STE can be applied for the online inspection of wheel tread defects.
2. Materials and Methods
2.1. Dataset, Environment, and Parameters
The representational ability of deep models is highly dependent on the diversity of training data. However, fully publicly available wheelset damage target datasets are not available. Therefore, deep learning-based wheelset damage-detection methods necessitates the creation and expansion of datasets.
The required images of various types of defects are captured in the field; however, the number of useful defect images obtained is limited and typically unbalanced. The acquired data images generally present three types of defects, namely peels, pits, and bruises, as shown in Figure 1. Given the insufficient volume of the dataset, it was preprocessed to expand the samples. It was first expanded using traditional data augmentation and Copy–Paste; the results are shown in Figure 2. A dataset comprising 654 images was obtained; however, it was insufficient. Subsequently, StyleGAN3 network was trained. Figure 3 shows a generative image of wheelset-tread defects by using StyleGAN3. To address this imbalance in the dataset, StyleGAN3 was used to selectively generate the corresponding defective images for dataset expansion, and a new dataset comprising 1200 images was obtained. The defects were labelled using LabelImg software, and the dataset was divided into training, validation, and test sets in an 8, 1, 1 ratio. The training set was further expanded to 2160 images by splicing and blending the augmented data with Gaussian blur, affine transform, luminance transform, descending pixel transform, and flip transform [28,29]. The statistical information for the dataset is presented in Table 1. Figure 4 shows significant dimensional differences among the different defects.
The hardware environment and software versions of the experiments are listed in Table 2. In this study, stochastic gradient descent (SGD) method was used to optimize the learning rate, and the epochs were determined by comparing the loss functions of training and validation sets. The parameters of the training network are listed in Table 3.
2.2. Loss Function and Model Evaluation Metrics
To verify the superior performance of improved YOLOv7 model, we determined the mean average precision (mAP), frames per second (FPS), and model volume. The commonly used metrics of precision (P), recall (R), and mAP were selected to evaluate model performance [30]; these metrics are defined as follows:
Here, TP denotes positive samples predicted to be correct (i.e., true positives), FP denotes negative samples predicted to be incorrect (i.e., false positives), FN denotes positive samples predicted to be incorrect (i.e., false negatives), and N denotes the number of sample categories.
The loss function of YOLOv7 comprises the following three components: confidence, bounding-box regression, and classification losses. The YOLOv7 loss function can be expressed as follows:
, , and denote confidence, bounding-box regression, and classification losses, respectively. Furthermore, , , and are weight coefficients for the three losses; changing these coefficients can adjust the emphasis on the three losses. In YOLOv7, is calculated using the complete intersection over union (CIoU) loss, [31], which improves the speed and accuracy of bounding box regression. The expression for is as follows:
Here, and denote the predicted box and ground truth box, respectively; , , , and denote the width and height of the ground truth box and predicted box, respectively; represents the distance between the centers of the two boxes; represents the maximum distance between the boundaries of the two boxes; and denotes a weight coefficient.
2.3. Improved YOLOv7 Network Architecture
2.3.1. YOLOv7 Network Architecture
YOLOv7 is a widely used detection network. The network structure comprises Head, Neck, and Backbone modules as shown in Figure 5. YOLOv7 typically comprises three common models: YOLOv7, YOLOv7x, and YOLOv7tiny. Specifically, YOLOv7tiny is the smallest model with a fast detection speed and relatively low accuracy, and it is mainly applied to scenes with high speed requirements or limited computational resources. Furthermore, YOLOv7 is suitable for scenes requiring high detection accuracy. In this study, YOLOv7 was used as the base model, and a few parameters were adjusted to improve the model performance.
2.3.2. YOLOv7-STE
The Neck module of YOLOv7 was improved to enhance the correction of the detection and classification of different types of wheelset-tread defects. GSConv was introduced instead of Conv, and it can guarantee detection accuracy, reduce the network volume and computation amount, and obtain a lightweight design of the model. To detect and recognize small pits in the defect images, an STE module was added, which performed feature fusion of three different scales of feature maps (p3, p4, and p5) in the Backbone module to capture multiscale features. The structure of the YOLOv7-STE network is illustrated in Figure 6.
The main function of the multiscale module involves the fusion of features from different scales in the Backbone module via 3D convolution and pooling; in particular, it provides better feature representation for the detection of small targets. Furthermore, channel-attention and spatial-attention modules are introduced for multiscale features to fully use cross-channel information and achieve improved performance without increasing network complexity, as shown in Figure 7. Noise and irrelevant information were suppressed, whereas critical information was retained.
2.3.3. Loss Function
The CIoU is sensitive to the aspect ratio; thus, aspect ratio matching can be overemphasized at the expense of other factors such as the overall positional relationship of the target. Enhanced intersection over union (EIoU) [32] is mainly used in target detection to evaluate the difference between predicted and real bounding boxes. The expression for is presented in Equation (11).
Given that the distance from the center is , the center of the prediction box is , true box center is , width difference is , and height difference is . Hence,
where, and are hyperparameters that regulate the effects of center distance and width-height differences; and , , and are constants used for normalization, and they are related to the size of the target in the dataset.
The utilization of EIoU provides several advantages. First, the comprehensive consideration of multiple geometric information of the bounding box, including overlapping area, center distance, and width–height difference, enables the model to more accurately learn the position and shape information of the target. This improves the accuracy of target detection, particularly when in complex situations such as deformation and occlusion of the target. Second, compared to some traditional loss functions, the width and height loss of EIoU directly minimizes the difference between the width and height of the target and prediction frames; this can guide the model to quickly learn the appropriate bounding box parameters, accelerating the convergence speed of the model. Third, the EIoU loss function enhances the small target bounding box.
3. Experimental Results and Discussion
3.1. Comparative Experimental Results Analysis
The experimental results of the proposed model and the mainstream detection algorithms are compared in Table 4. The mAP of the proposed model was higher by 1.6%, 10.7%, 48.63%, and 37.97% as compared to those of YOLOv7, YOLOv5, single shot multibox detector (SSD), and Faster R-CNN models, respectively. The model parameter size was lower by 73.91 MB, 94.69 MB, 122.11 MB, and 154.91 MB, respectively, when compared to those of the aforementioned detection models. The proposed model exhibited better detection accuracy than did the other models. Table 4 highlights the significantly better overall performance of the proposed model.
3.2. Ablation Experiment
The ablation experiment explored the impact of the improved methods on the network model. The plotted data are presented in Table 5 and Table 6. We conducted eight groups of experiments, adding different modules, and compared them with the original YOLOv7 model, using the mAP@0.5, model volume, mAP@0.5, 0.95, and FPS as indicators. Of the five different loss functions used on the original YOLOv7 model, EIoU loss yielded the best performance (Table 5). mAP@0.5 increased by 1.8% and mAP@0.5, 0.95 increased by 1.44% as compared to the original YOLOv7 model (with CIoU loss). The EIoU loss function therefore improves the effect of small-object bounding boxes.
Table 6 shows that the model volume of the GSConv module in the Neck module reduced by 84 MB, whereas the FPS increased to 87.1. As regards the small target (the pit) detection, mAP@0.5 reduced by 10.2%. The introduction of the STE module improved the small-target detection mAP by 4.4%, while the model volume increased by 14 MB. The detection speed decreased, and the mAP was lower for the rest of the target sizes, with a 2.6% reduction in mAP@0.5 for the peel and a 1.3% reduction in mAP@0.5 for the bruise. When both the STE module and GSConv were used, compared to YOLOv7 (EIoU), the model volume was reduced by 73.91 MB. The mAP@0.5 (all classes) improved by 1.6%, with a 4.2% improvement in the mAP of the pit, 0.1% in the mAP of the peel, 0.3% in the mAP of the bruise, and 1.9% in FPS. In summary, the improved strategy based on YOLOv7 proposed herein leads to significant improvement in for wheelset-tread damage detection.
3.3. Comparison of Different Models
To verify the superiority of the proposed YOLOv7-STE model for wheelset-tread damage detection, we compared the results with the outcomes from YOLOv7, YOLOv5, SSD, and Faster R-CNN models. The relevant parameters of the experiments were strictly controlled using a uniform image size as the input and a uniform training and test set for experimental testing. A comparison of the recognition of pits using the different models is shown in Figure 8. The confidence levels of detection results of YOLOv7-STE, YOLOv7, YOLOv5, SSD, and Faster R-CNN are 0.96, 0.86, 0.77, 0.69, and 0.58, respectively. The recognition of bruises using the different models is shown in Figure 9. The confidence levels of YOLOv7-STE, YOLOv7, and YOLOv5, and SSD, and Faster R-CNN detection results were 0.95, 0.91, 0.92, 0.85, and 0.77, respectively. Figure 10 shows a comparison of the recognition results of the peels by using different models. The confidence levels of YOLOv7-STE, YOLOv7, YOLOv5, SSD, and Faster R-CNN detection results were 0.97, 0.95, 0.95, 0.90, and 0.89, respectively. The experimental results indicate that the proposed method was more adaptable to complex backgrounds than the comparison methods and achieved better inspection performance.
A publicly available RSDDs dataset with similarly small target defects was used for verifying the robustness of the model. The experimental results are presented in Figure 11. The confidence level of YOLOv7-STE is remarkably high, at 0.97. Furthermore, the confidence levels of YOLOv7, YOLOv5, SSD, and Faster-RCNN are 0.90, 0.88, 0.52, and 0.49, respectively.
Images detection results showed that, for large-size defects (peel and bruise), the five models were effective, with YOLOv7-STE exhibiting the highest correct classification rate. For small defects (pit), YOLOv7-STE exhibited the highest recognition rate and correct classification rate. In summary, the experimental results confirm that the YOLOv7-STE model outperformed the other four models. When tested on RSDDs dataset, YOLOv7-STE demonstrated superior performances compared to traditional deep neural networks. The proposed model showed remarkable robustness to small target defects in different samples.
4. Conclusions
This study developed an improved YOLOv7 model was developed for the inspection of wheelset-tread defects, offering improved accuracy and reduced power computation. GSConv, a lightweight convolution in the Neck module, was adopted to reduce the model volume. The STE module addressed the challenge of low pixels and difficulty in distinguishing small targets, and improving the classification accuracy for damage feature recognition. The captured images of the wheelset tread were preprocessed to augment small and nonuniform samples through Copy–Paste, followed by training with the StyleGAN3 network. A comparison of the experimental results showed that the mAP of the proposed model improved by 1.6%, 10.7%, 48.63%, and 37.97% as compared to those of YOLOv7, YOLOv5, SSD, and Faster R-CNN models, respectively. The model parameter size decreased by 73.91 MB, 94.69 MB, 122.11 MB, and 154.91 MB as compared to the aforementioned detection models, respectively. The YOLOv7-STE model exhibited a significantly better overall performance than the traditional models. Its robustness was verified using a publicly available RSDDs dataset with similar small target defects. Compared to the traditional models, YOLOv7-STE showed better performance for small target defects in different samples. The experimental results confirmed that the YOLOv7-STE model can satisfy the requirements of online inspection of wheelset-tread defects.
However, in this study, owing to the limited collection of defect data, only three common types of damage (pit, bruise, and peel) were identified and classified. In real scenarios, owing to the influence of a variety of complex factors (including differences in temperature and light intensity), similar defects (or even the same defects in different spatial and temporal) can lead to differences in manifestation. Hence, it is necessary to further expand the data and conduct different types of classification and identification.
Author Contributions
Conceptualization: P.Y., Z. ZH. and C.W.; Methodology, P.Y., X.Y.and H. Y.; Writing–original draft F.G.,X.Y. and H. Y.; writing-review and editing, F.G., C.W. and H.Y.; validation P.Y. and Z.ZH. All authors have read and agreed to the published version of the manuscript.
Funding
This research was funded by the Department of Science and Technology of Henan Province (242102211064), Key Research Projects of Higher Education Institutions in Henan Province (23B416001), Key Research and Development Special Projects in Henan Province (241111230300), Henan Major Science and Technology Project (221100230100), and the Henan Natural Science Foundation (242300420294).
References
- Yang, H.; He, J.; Liu, Z.; Zhang, C. LLD-MFCOS: A Multiscale anchor-free detector based on label localization distillation for wheelset tread defect detection. EEE Trans. Instrum. Meas. 2024, 73, 5003815–1–15. [Google Scholar] [CrossRef]
- Song, Y.; Ji, Z.; Guo, X.; et al. A comprehensive laser image dataset for real-time measurement of wheelset geometric parameters. Scientific Data 2024, 11, 1. [Google Scholar] [CrossRef] [PubMed]
- Liu, J.; Jiang, S.; Wang, Z.; et al. Detection of Train Wheelset Tread Defects with Small Samples Based on Local Inference Constraint Network. Electronics 2024, 13, 11. [Google Scholar] [CrossRef]
- Zhang, C.; Xu, Y.; Yin, H.L. Deformable residual attention network for defect detection of train wheelset tread. Vis. Comput. 2024, 40, 1775–1785. [Google Scholar] [CrossRef]
- Xiangyang, Z.; Jiangping, L. Integrated intelligent system for rail flaw detection vehicle. Electric Drive for Locomotives 2021, 133–137. [Google Scholar]
- Jiangping, L.; Xizhuo, Y.; Jingwei, C.; et al. Intelligent rail flaw detection system based on deep learning and sup- port vector machine. Electric Drive for Locomotives 2021, 100–107. [Google Scholar]
- Xue, W.; Zhenbo, F. A new method of wavelet and sup- port vector machine for detection of the train wheel bruise. China Mech. Eng. 2004, 15, 1641–1643. [Google Scholar]
- Zhijun, X.; Jianzheng, C.. Tread profile of wheel detec- tion method based image processing and Hough transform . Electron. Meas. Technol. 2017, 40, 117–121.
- Zhenwen, S.; Guiyun, W.. Fast method of detect- ing packaging bottle defects based on ECA-EfficientDet. J. Sens. 2022, 2022, 9518910.
- Palazzetti, L.; Rangarajan, A.K.; Dinca, A.; et al. The hawk eye scan: Halyomorpha halys detection relying on aerial tele photos and neural networks. Comput. Electron. Agric. 2024, 226, 109365. [Google Scholar] [CrossRef]
- Shi, C.; Yang, H.; Cai, J.; et al. A Survey of Galaxy Pairs in the SDSS Photometric Images based on Faster-RCNN. Astron. J. 2024, 168, 90. [Google Scholar] [CrossRef]
- Guo, H.; Wu, T.; Gao, G.; et al. Lightweight safflower cluster detection based on YOLOv5. Sci. Rep. 2024, 14, 18579. [Google Scholar] [CrossRef]
- Li, Z.; Zhu, Y.; Sui, S.; et al. Real-time detection and counting of wheat ears based on improved YOLOv7. Comput. Electron. Agric. 2024, 218, 108670. [Google Scholar] [CrossRef]
- Changfan, Z.; Xinliang, H.; Jing, H.; et al. Yolov4 high-speed train wheelset tread defect detection system based on multiscale feature fusion. J. Adv. Transp. 2022, 2022, 1172654. [Google Scholar] [CrossRef]
- Bowen, Z.; Huacai, L.; Shengbo, Z.; et al. Night target detection algorithm based on improved YOLOv7. Sci. Rep. 2024, 14, 15771. [Google Scholar] [CrossRef] [PubMed]
- Wang, D.; Qian, Y.; Lu, J.; et al. Fs-yolo: fire-smoke detection based on improved YOLOv7. Multimed. Syst. 2024, 30, 215. [Google Scholar] [CrossRef]
- Liu, Y.; Jiang, B.; He, H.; et al. Helmet wearing detection algorithm based on improved YOLOv5. Sci. Rep. 2024, 14, 8768. [Google Scholar] [CrossRef] [PubMed]
- Ren, Y.; Zhang, H.; Sun, H.; et al. LightRay: Lightweight network for prohibited items detection in X-ray images during security inspection. Comput. Electr. Eng. 2022, 103, 108283. [Google Scholar] [CrossRef]
- Tian, Y.; Wang, S.; Li, E.; et al. MD-YOLO: Multi-scale Dense YOLO for small target pest detection. Comput. Electron. Agric. 2023, 213, 108233. [Google Scholar] [CrossRef]
- Wei, W.; Wei, P.; Yi, L. . Application of Improved YOLOv3 in Aerial Target Detection. Application of Improved YOLOv3 in Aerial Target Detection. Computer Engineering and Applications 2020, 56, 17–23. [Google Scholar]
- Kaiqi, H.; Xiaorong, L.; Maoyun, H. Research onsmall target detection method based on improved YOLOv3. Transducer and Microsystem Technologies 2022, 41, 52–55.
- Lin, Z.; Huang, M.; Zhou, Q. Infrared small target detection based on YOLO v4. Journal of Physics: Conference Series. IOP Publ. 2023, 2450, 012019.
- Cai, Y.; Yao, Z.; Jiang, H. ,et al.Rapid detection of fish with SVC symptoms based on machine vision combined with a NAM-YOLO v7 hybrid model. Aquaculture 2024, 582. [CrossRef]
- Kang, M.; Ting, C.M.; Ting, F.F.; et al. ASF-YOLO: A novel YOLO model with attentional scale sequence fusion for cell instance segmentation. Image Vis. Comput. 2024, 147, 105057. [Google Scholar] [CrossRef]
- Li, H.; Li, J.; Wei, H.; et al. Slim-neck by GSConv: A better design paradigm of detector architectures for autonomous vehicles. arxiv 2206, arXiv:2206.02424. [Google Scholar]
- Ghiasi, G.; Cui, Y.; Srinivas, A.; et al. Simple copy-paste is a strong data augmentation method for instance segmentation. Proceedings of the IEEE/CVF conference on computer vision and pattern recognition. 2021, 2918-2928.
- Karras, T.; Aittala, M.; Laine, S.; et al. Alias-free generative adversarial networks. Adv. Neural Inf. Process. Syst. 2021, 34, 852–863. [Google Scholar]
- Abayomi-Alli, O.O.; Damaševičius, R.; Misra, S.; et al. Cassava disease recognition from low-quality images using enhanced data augmentation model and deep learning. Expert Syst. 2021, 38, e12746. [Google Scholar] [CrossRef]
- Ye, Y.; Li, Y.; Ouyang, R.; et al. Improving machine learning based phase and hardness prediction of high-entropy alloys by using Gaussian noise augmented data. Comput. Mater. Sci. 2023, 223, 112140. [Google Scholar] [CrossRef]
- Yang, J.; Zhang, X.; Song, C. Research on a small target object detection method for aerial photography based on improved YOLOv7. Vis. Comput. 2024, 1–15. [Google Scholar] [CrossRef]
- Zheng, Z.; Wang, P.; Liu, W.; et al. Distance-IoU loss: Faster and better learning for bounding box regression. Proc. AAAI Conf. Artif. Intell. 2020, 34, 12993–13000. [Google Scholar] [CrossRef]
- Zhang, Y.F.; Ren, W.; Zhang, Z.; et al. Focal and efficient IOU loss for accurate bounding box regression. Neurocomputing 2022, 506, 146–157. [Google Scholar] [CrossRef]
Figure 1.
Three main types of defects on the wheel tread (pit, bruise, and peel).
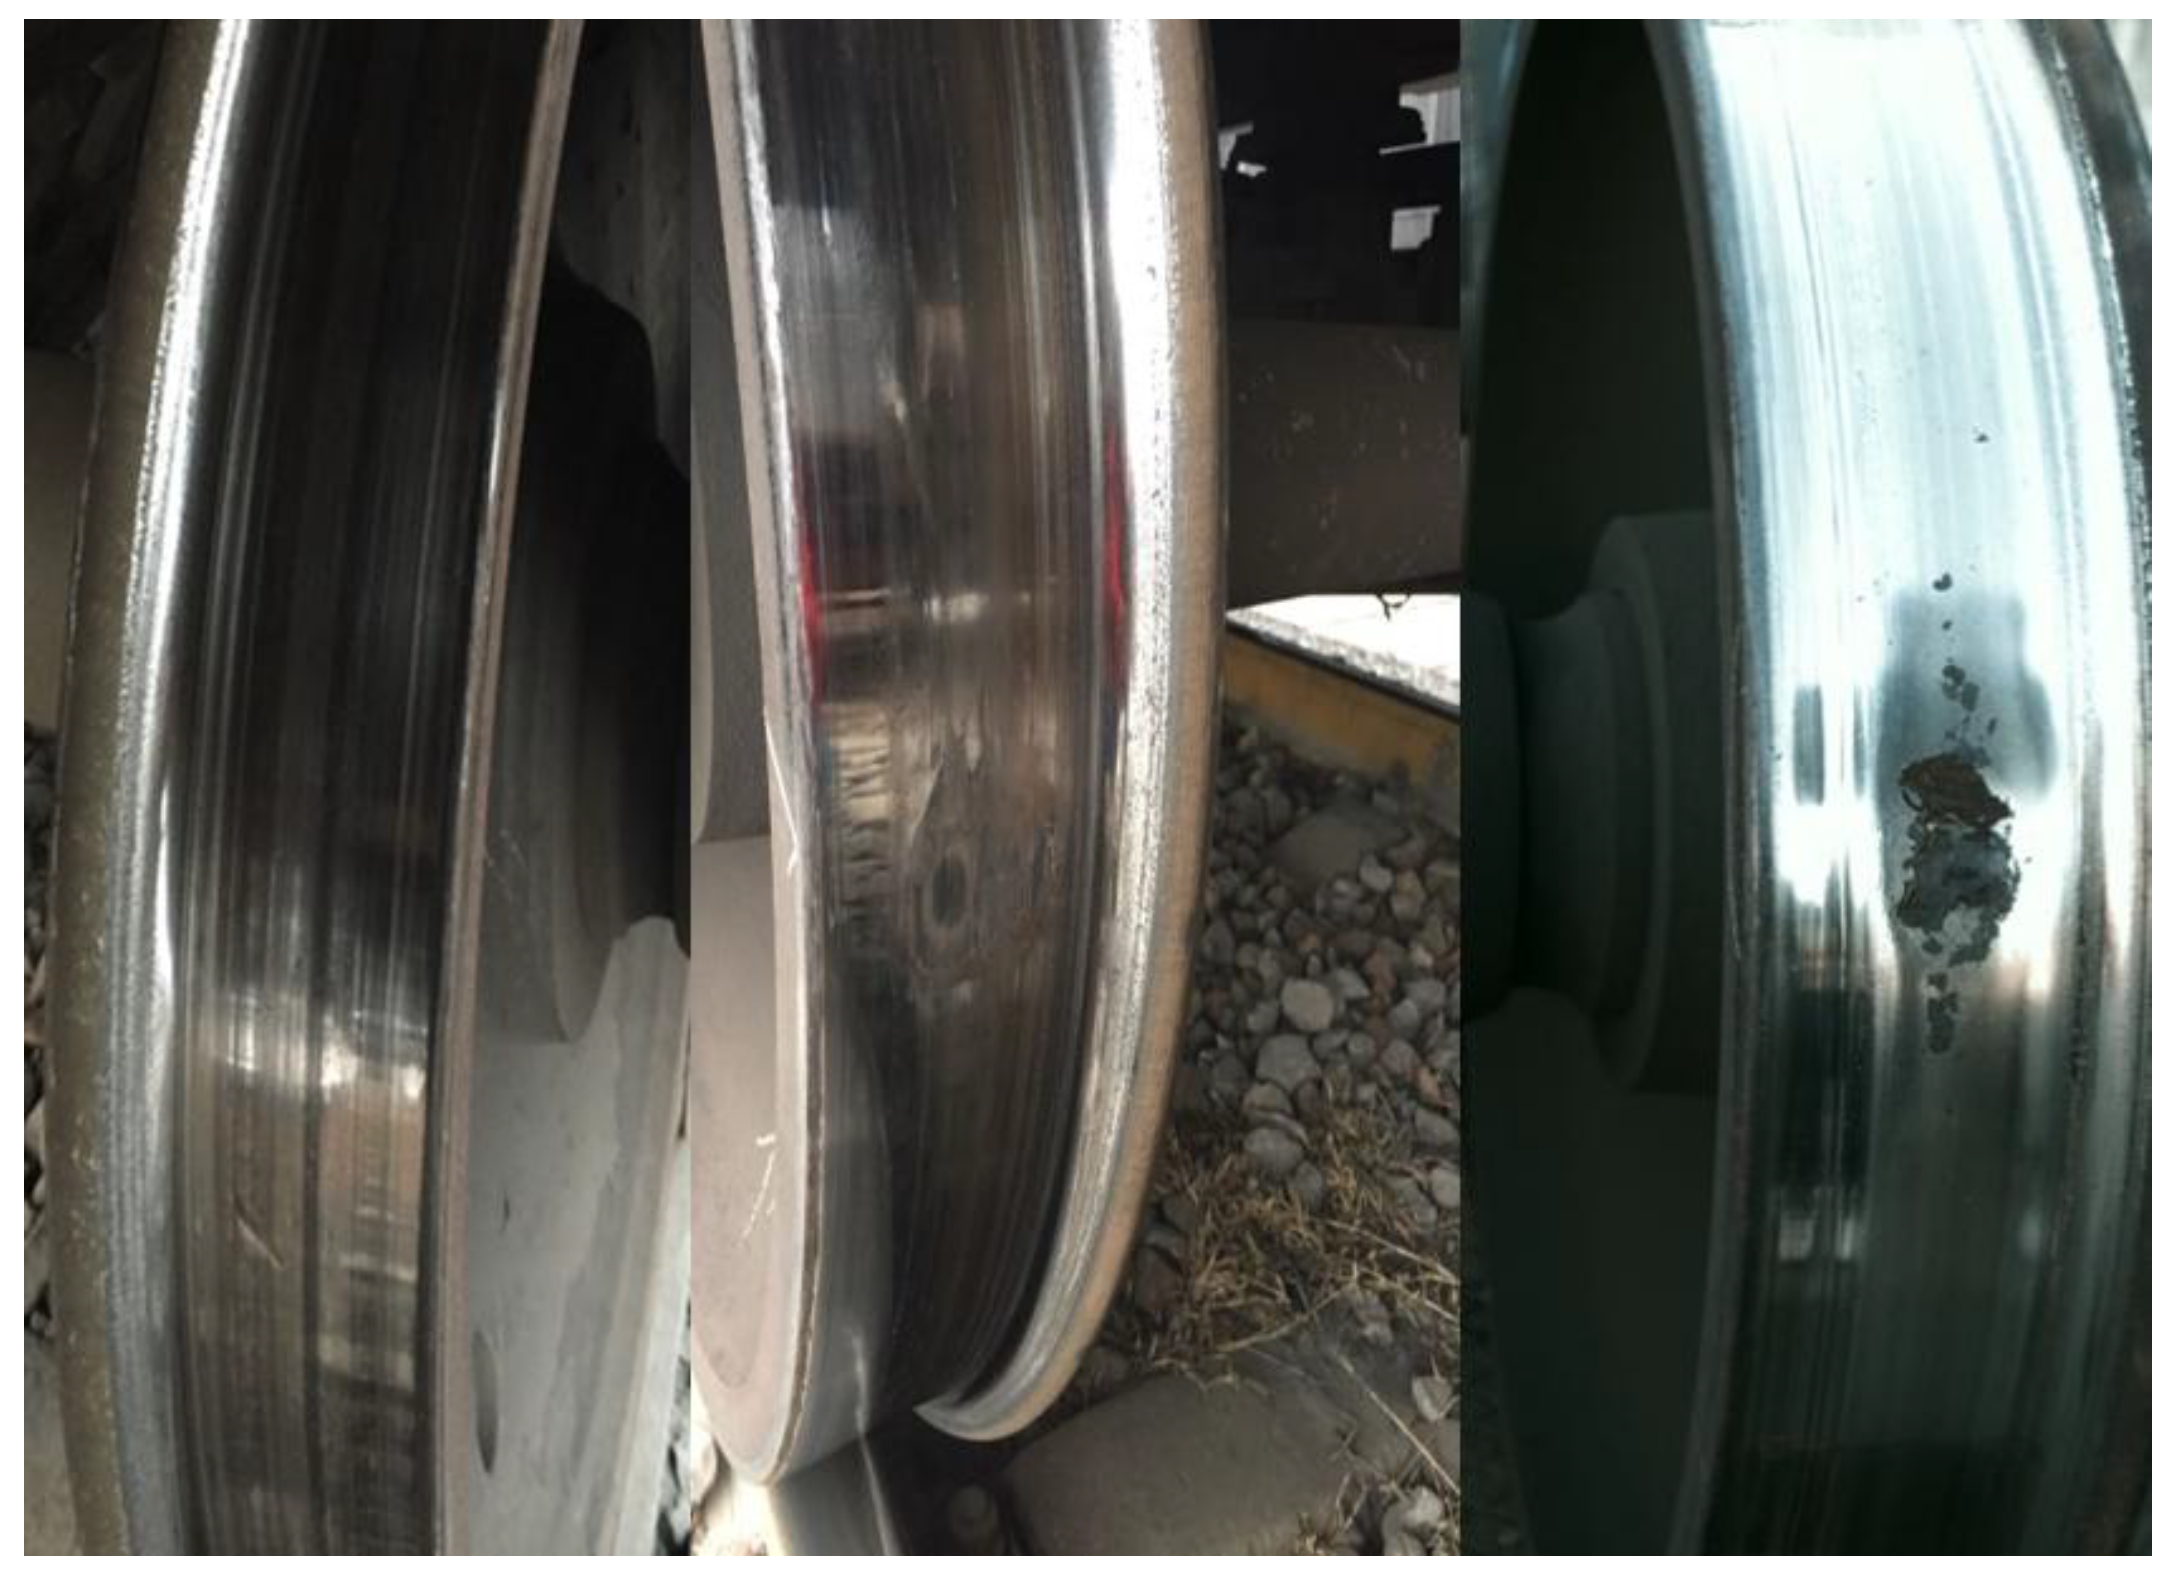
Figure 2.
Methods of extended dataset.
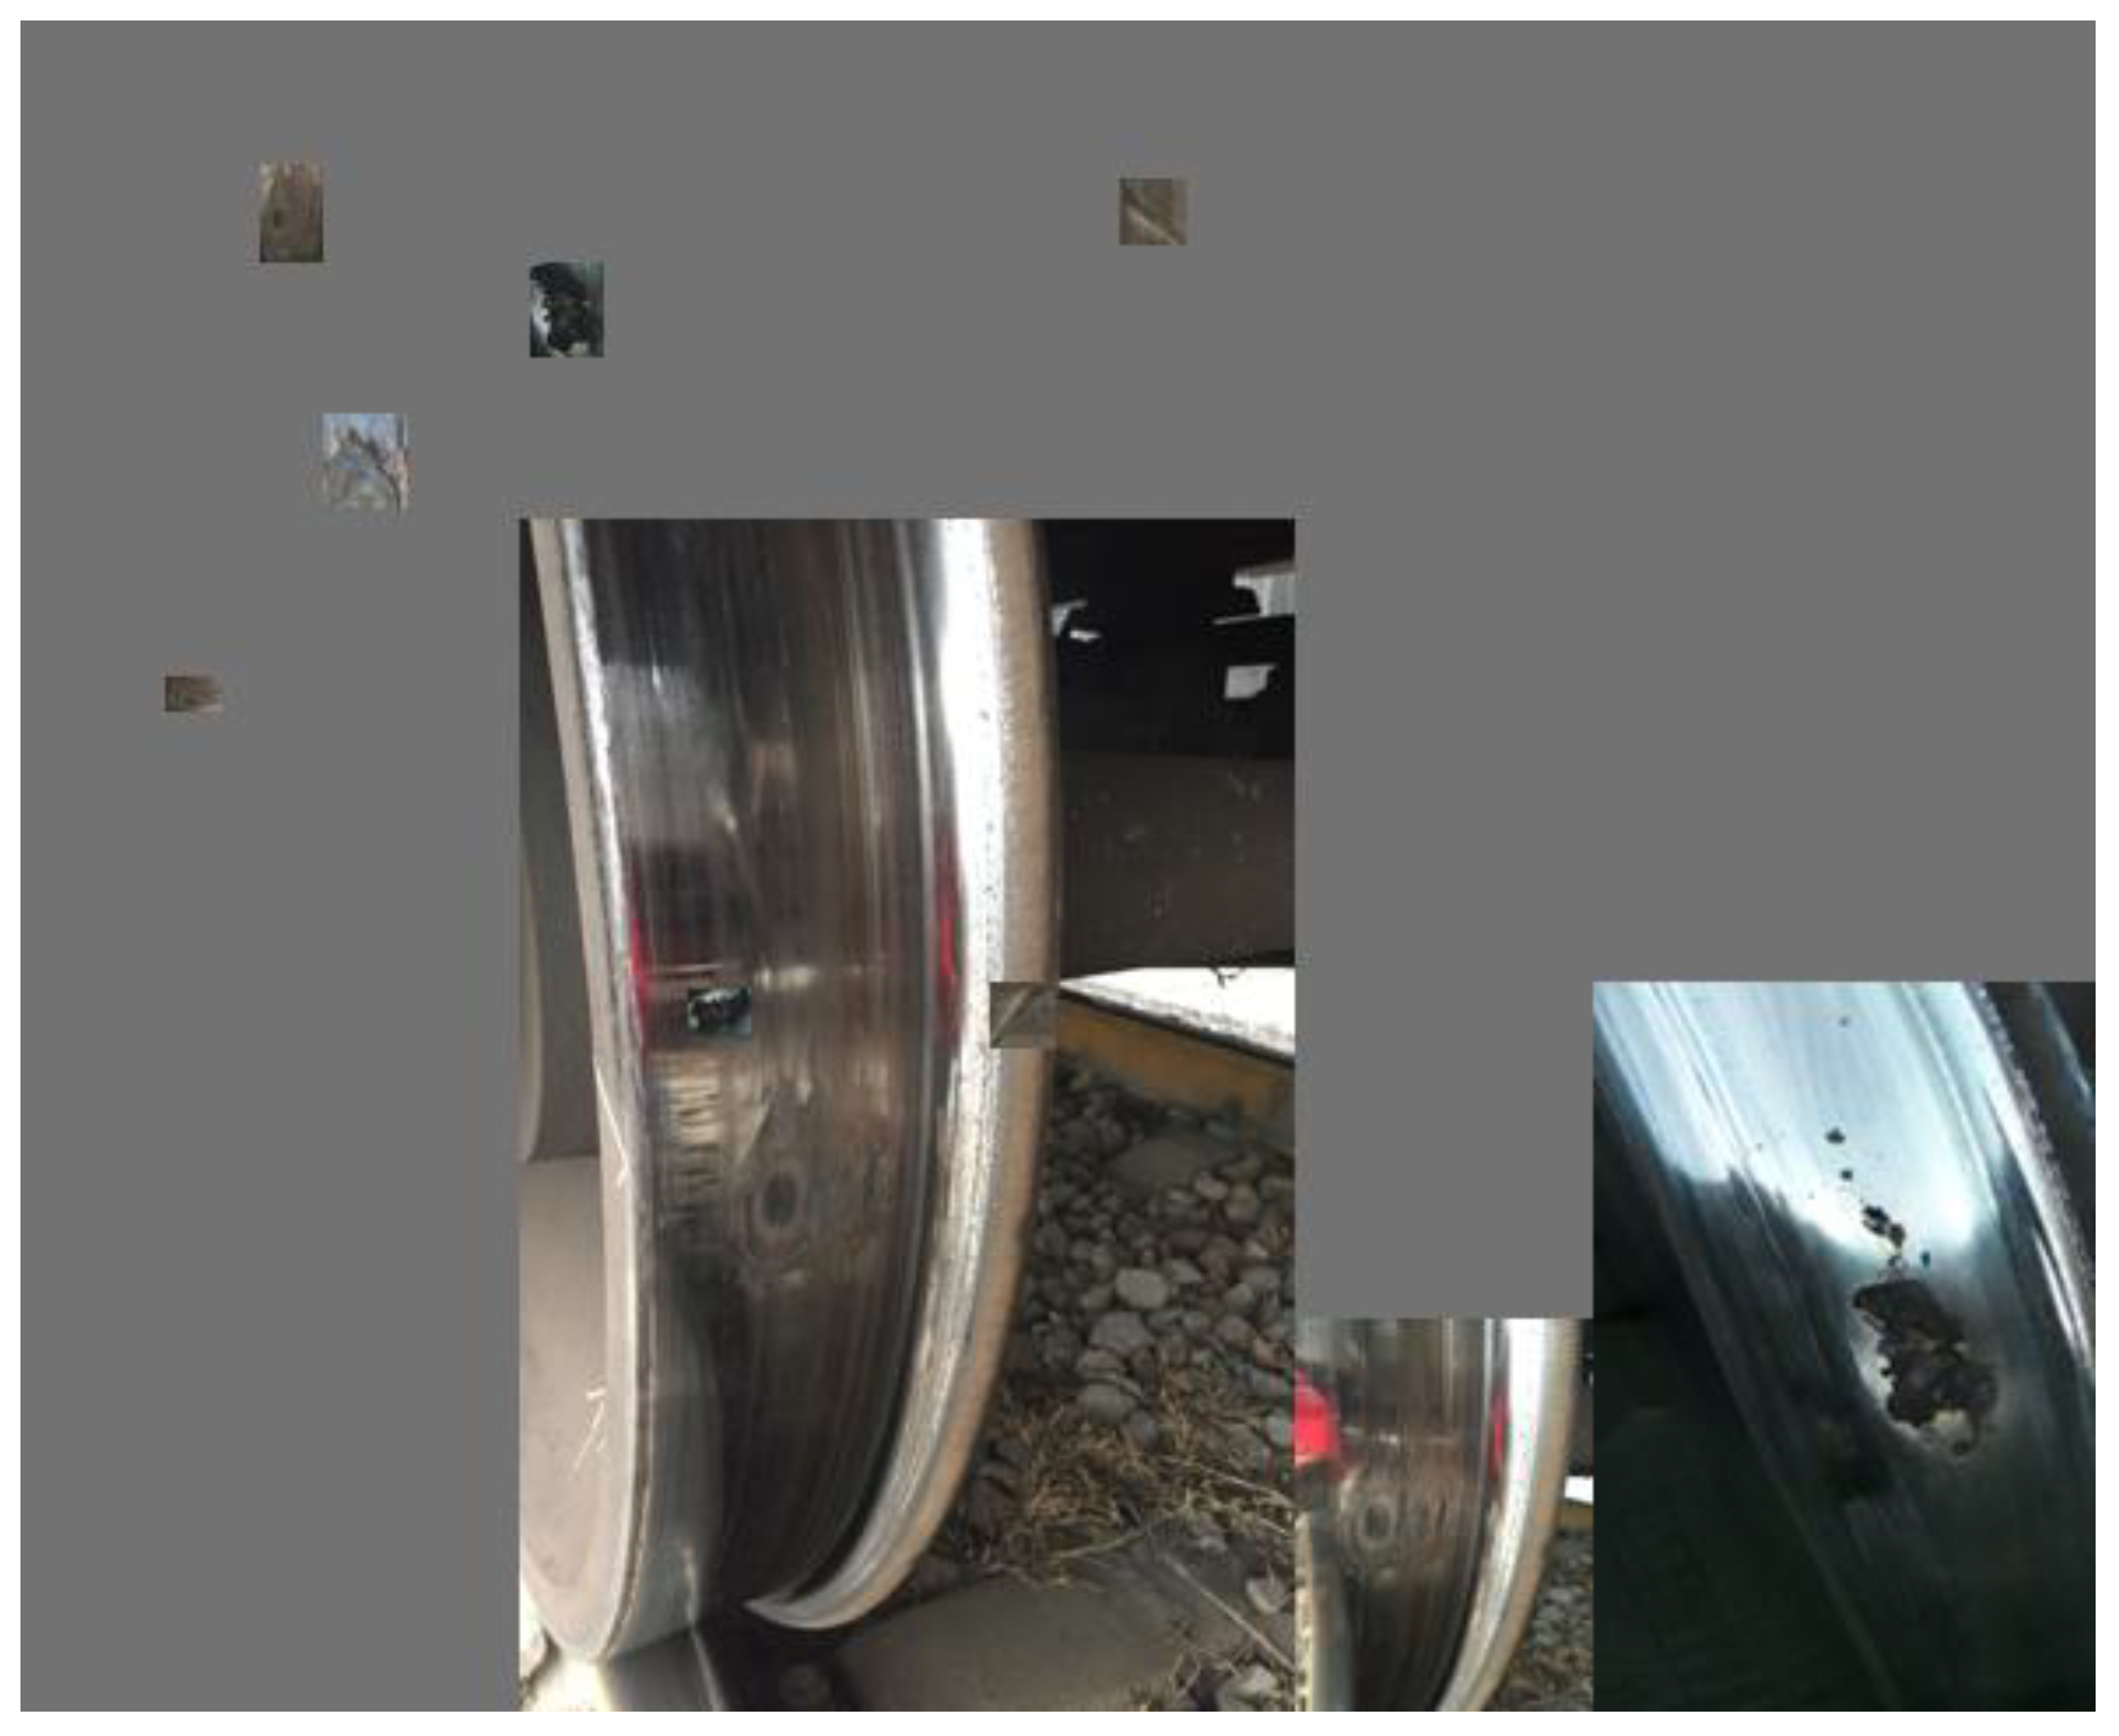
Figure 3.
Defect images of wheel treads generated by StyleGAN3.
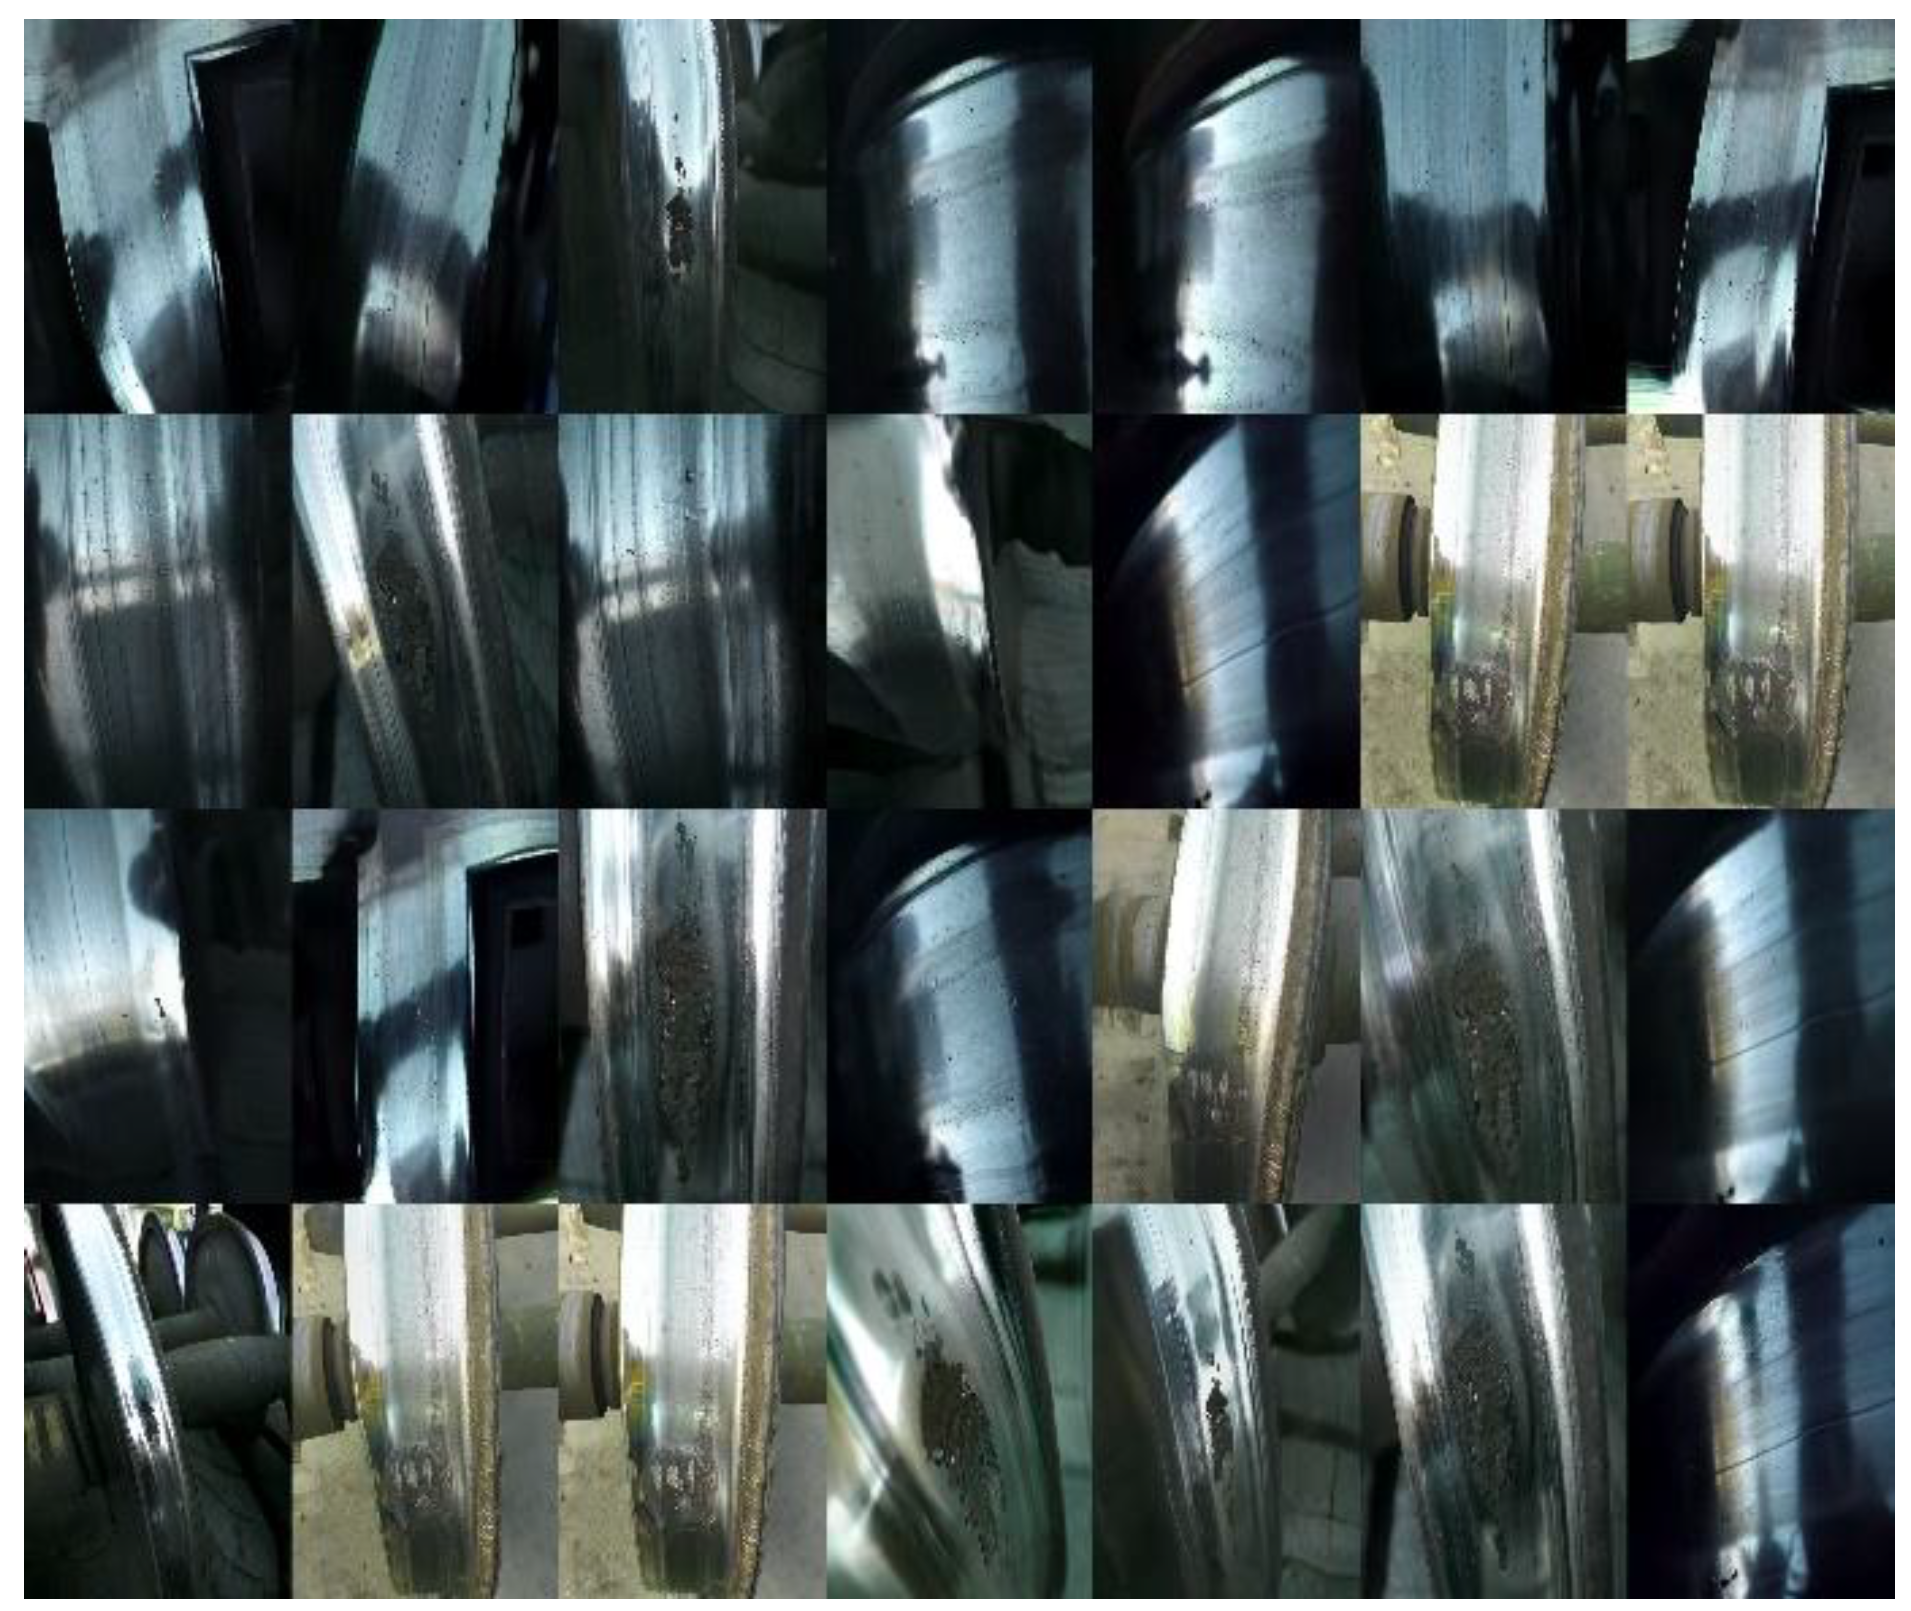
Figure 4.
Size of each type of defect in the annotation box (blue-pit, green-bruise, and yellow-peel).
Figure 4.
Size of each type of defect in the annotation box (blue-pit, green-bruise, and yellow-peel).
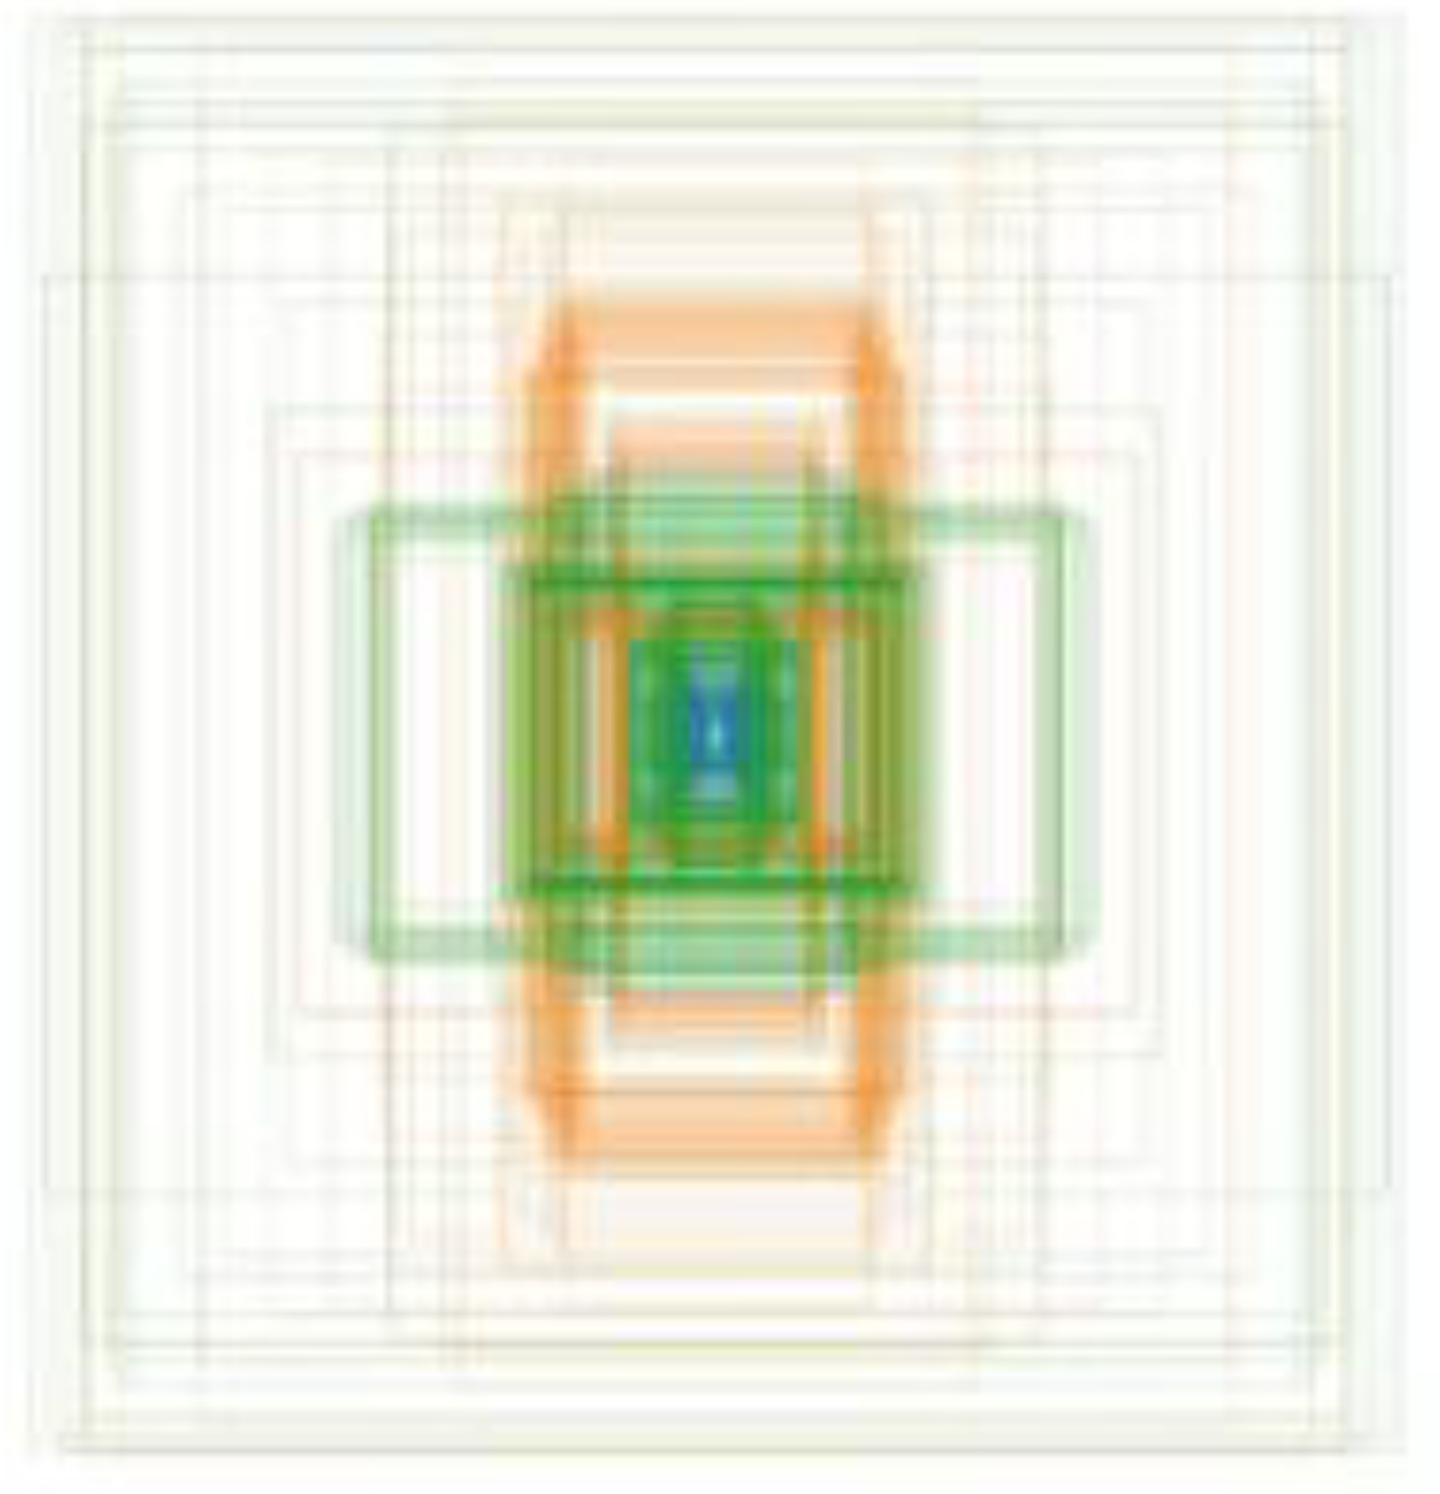
Figure 5.
YOLOv7-based model.
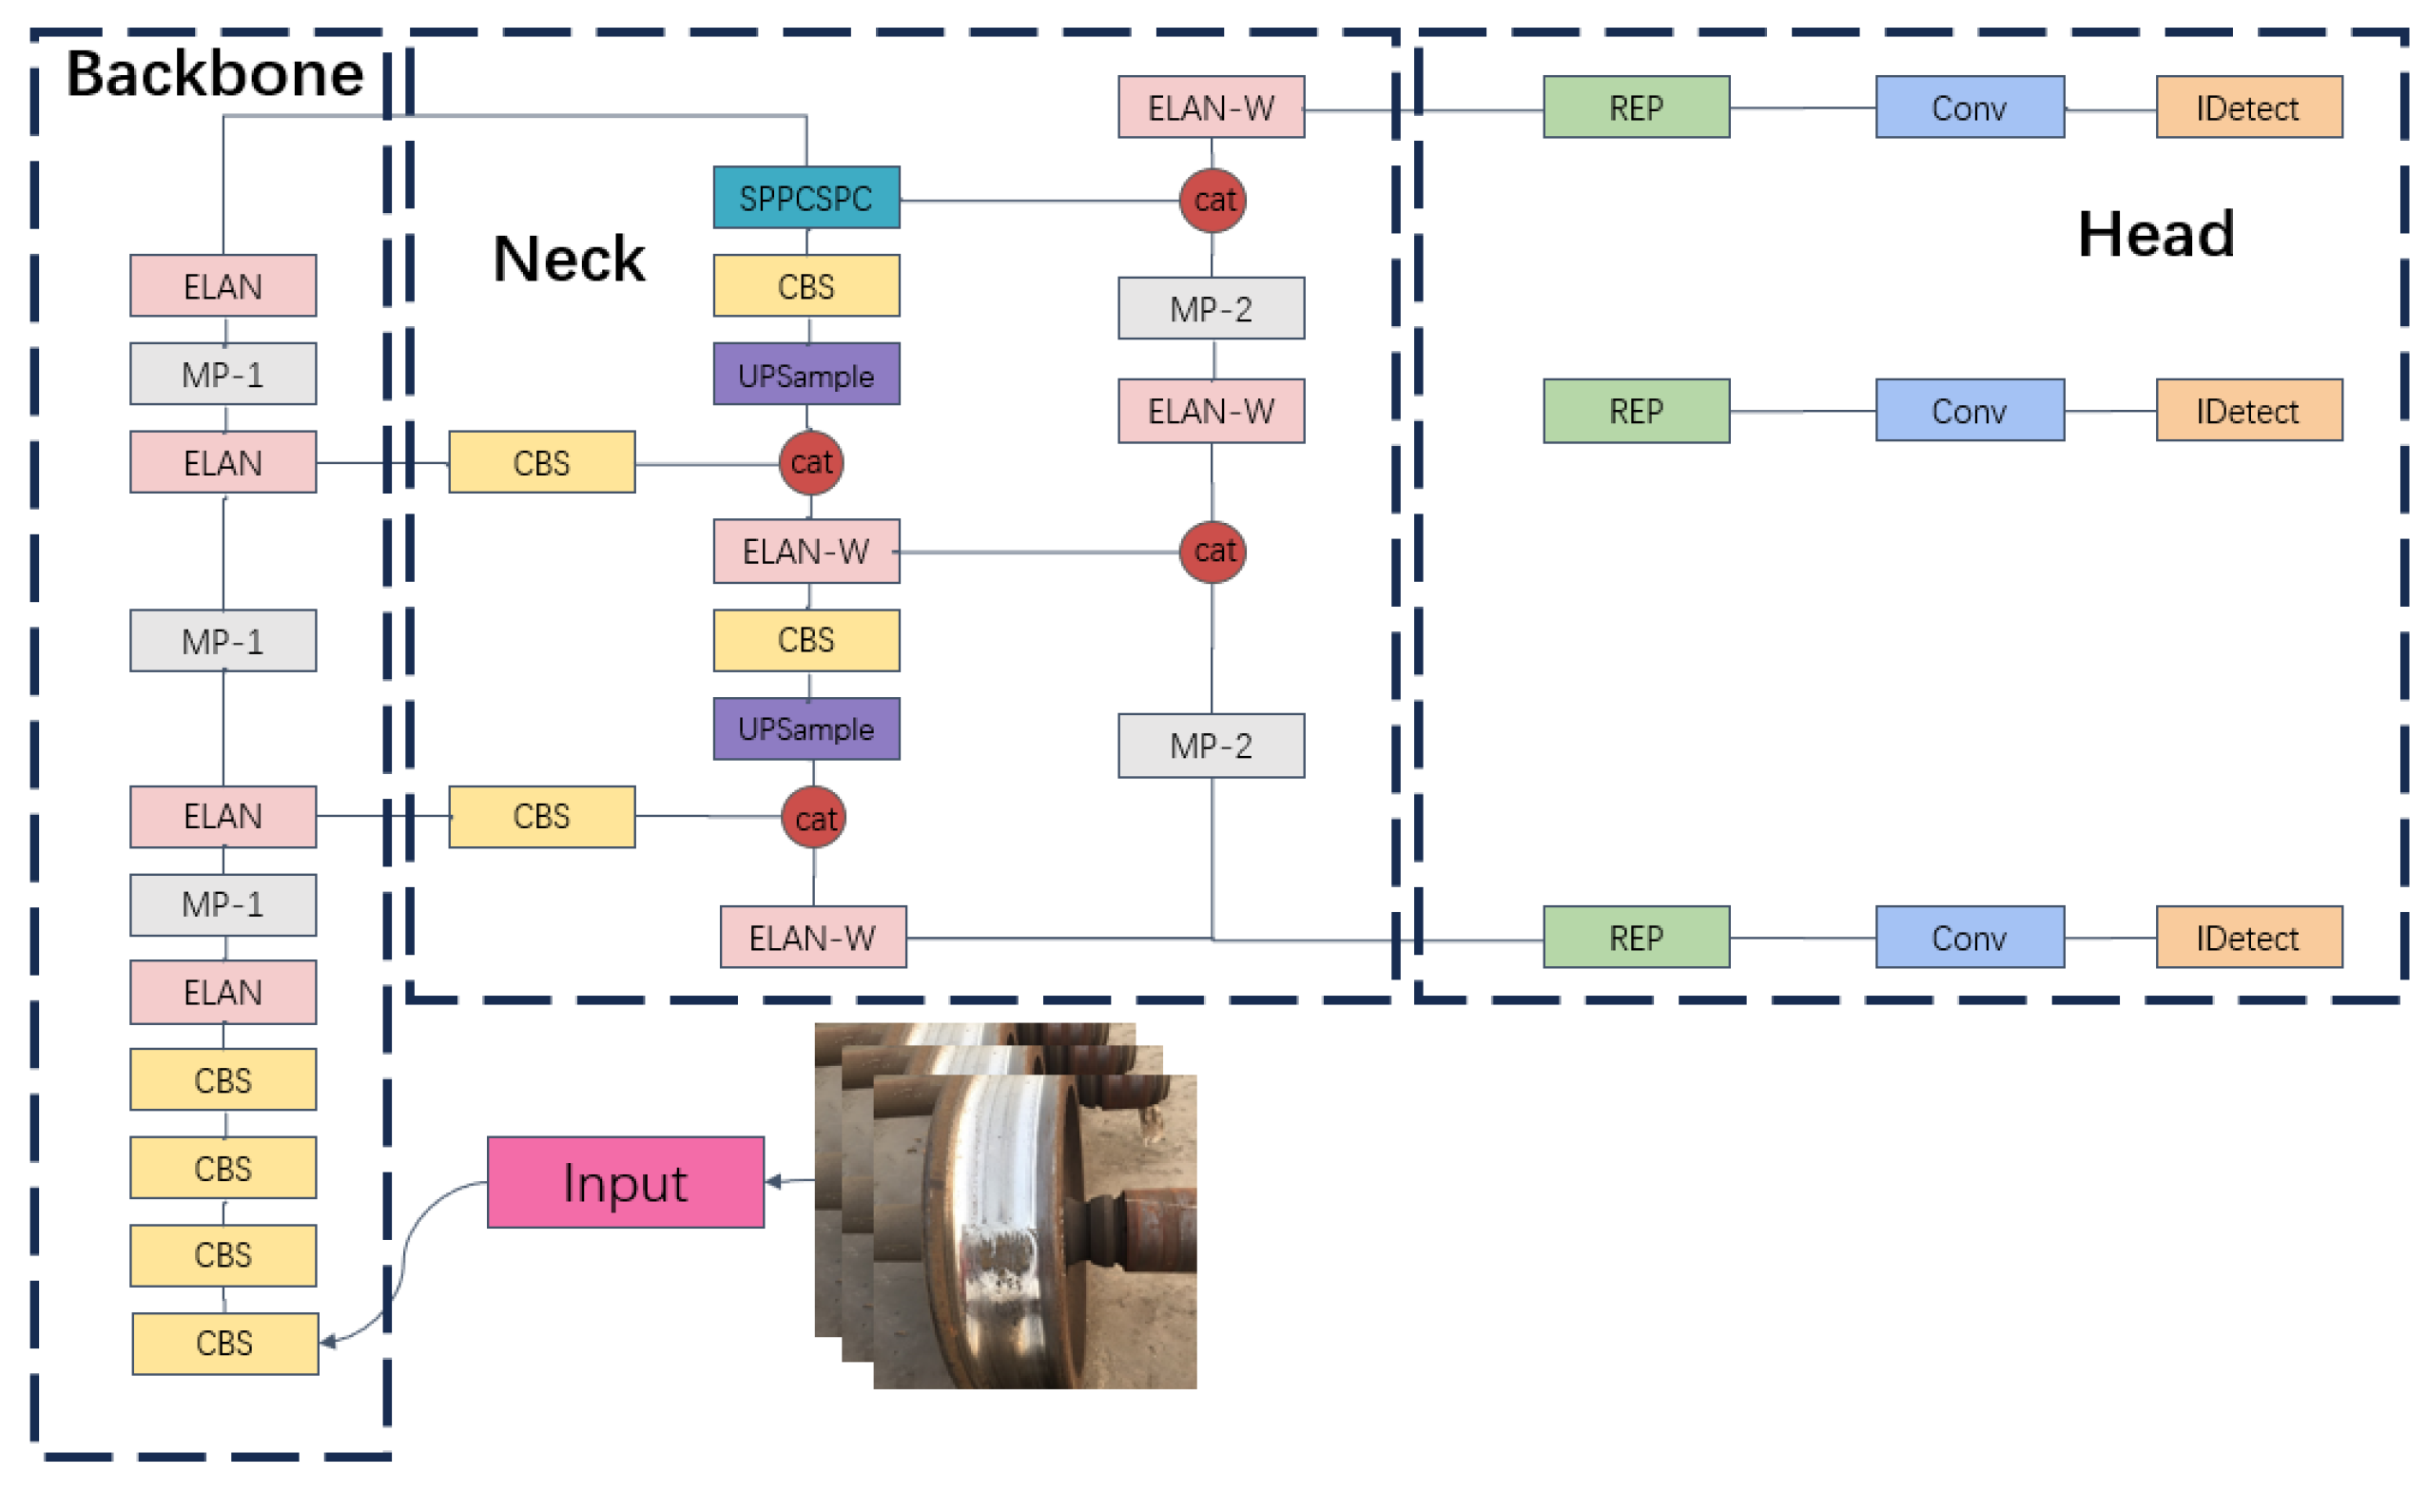
Figure 6.
Improved YOLOv7 algorithm.
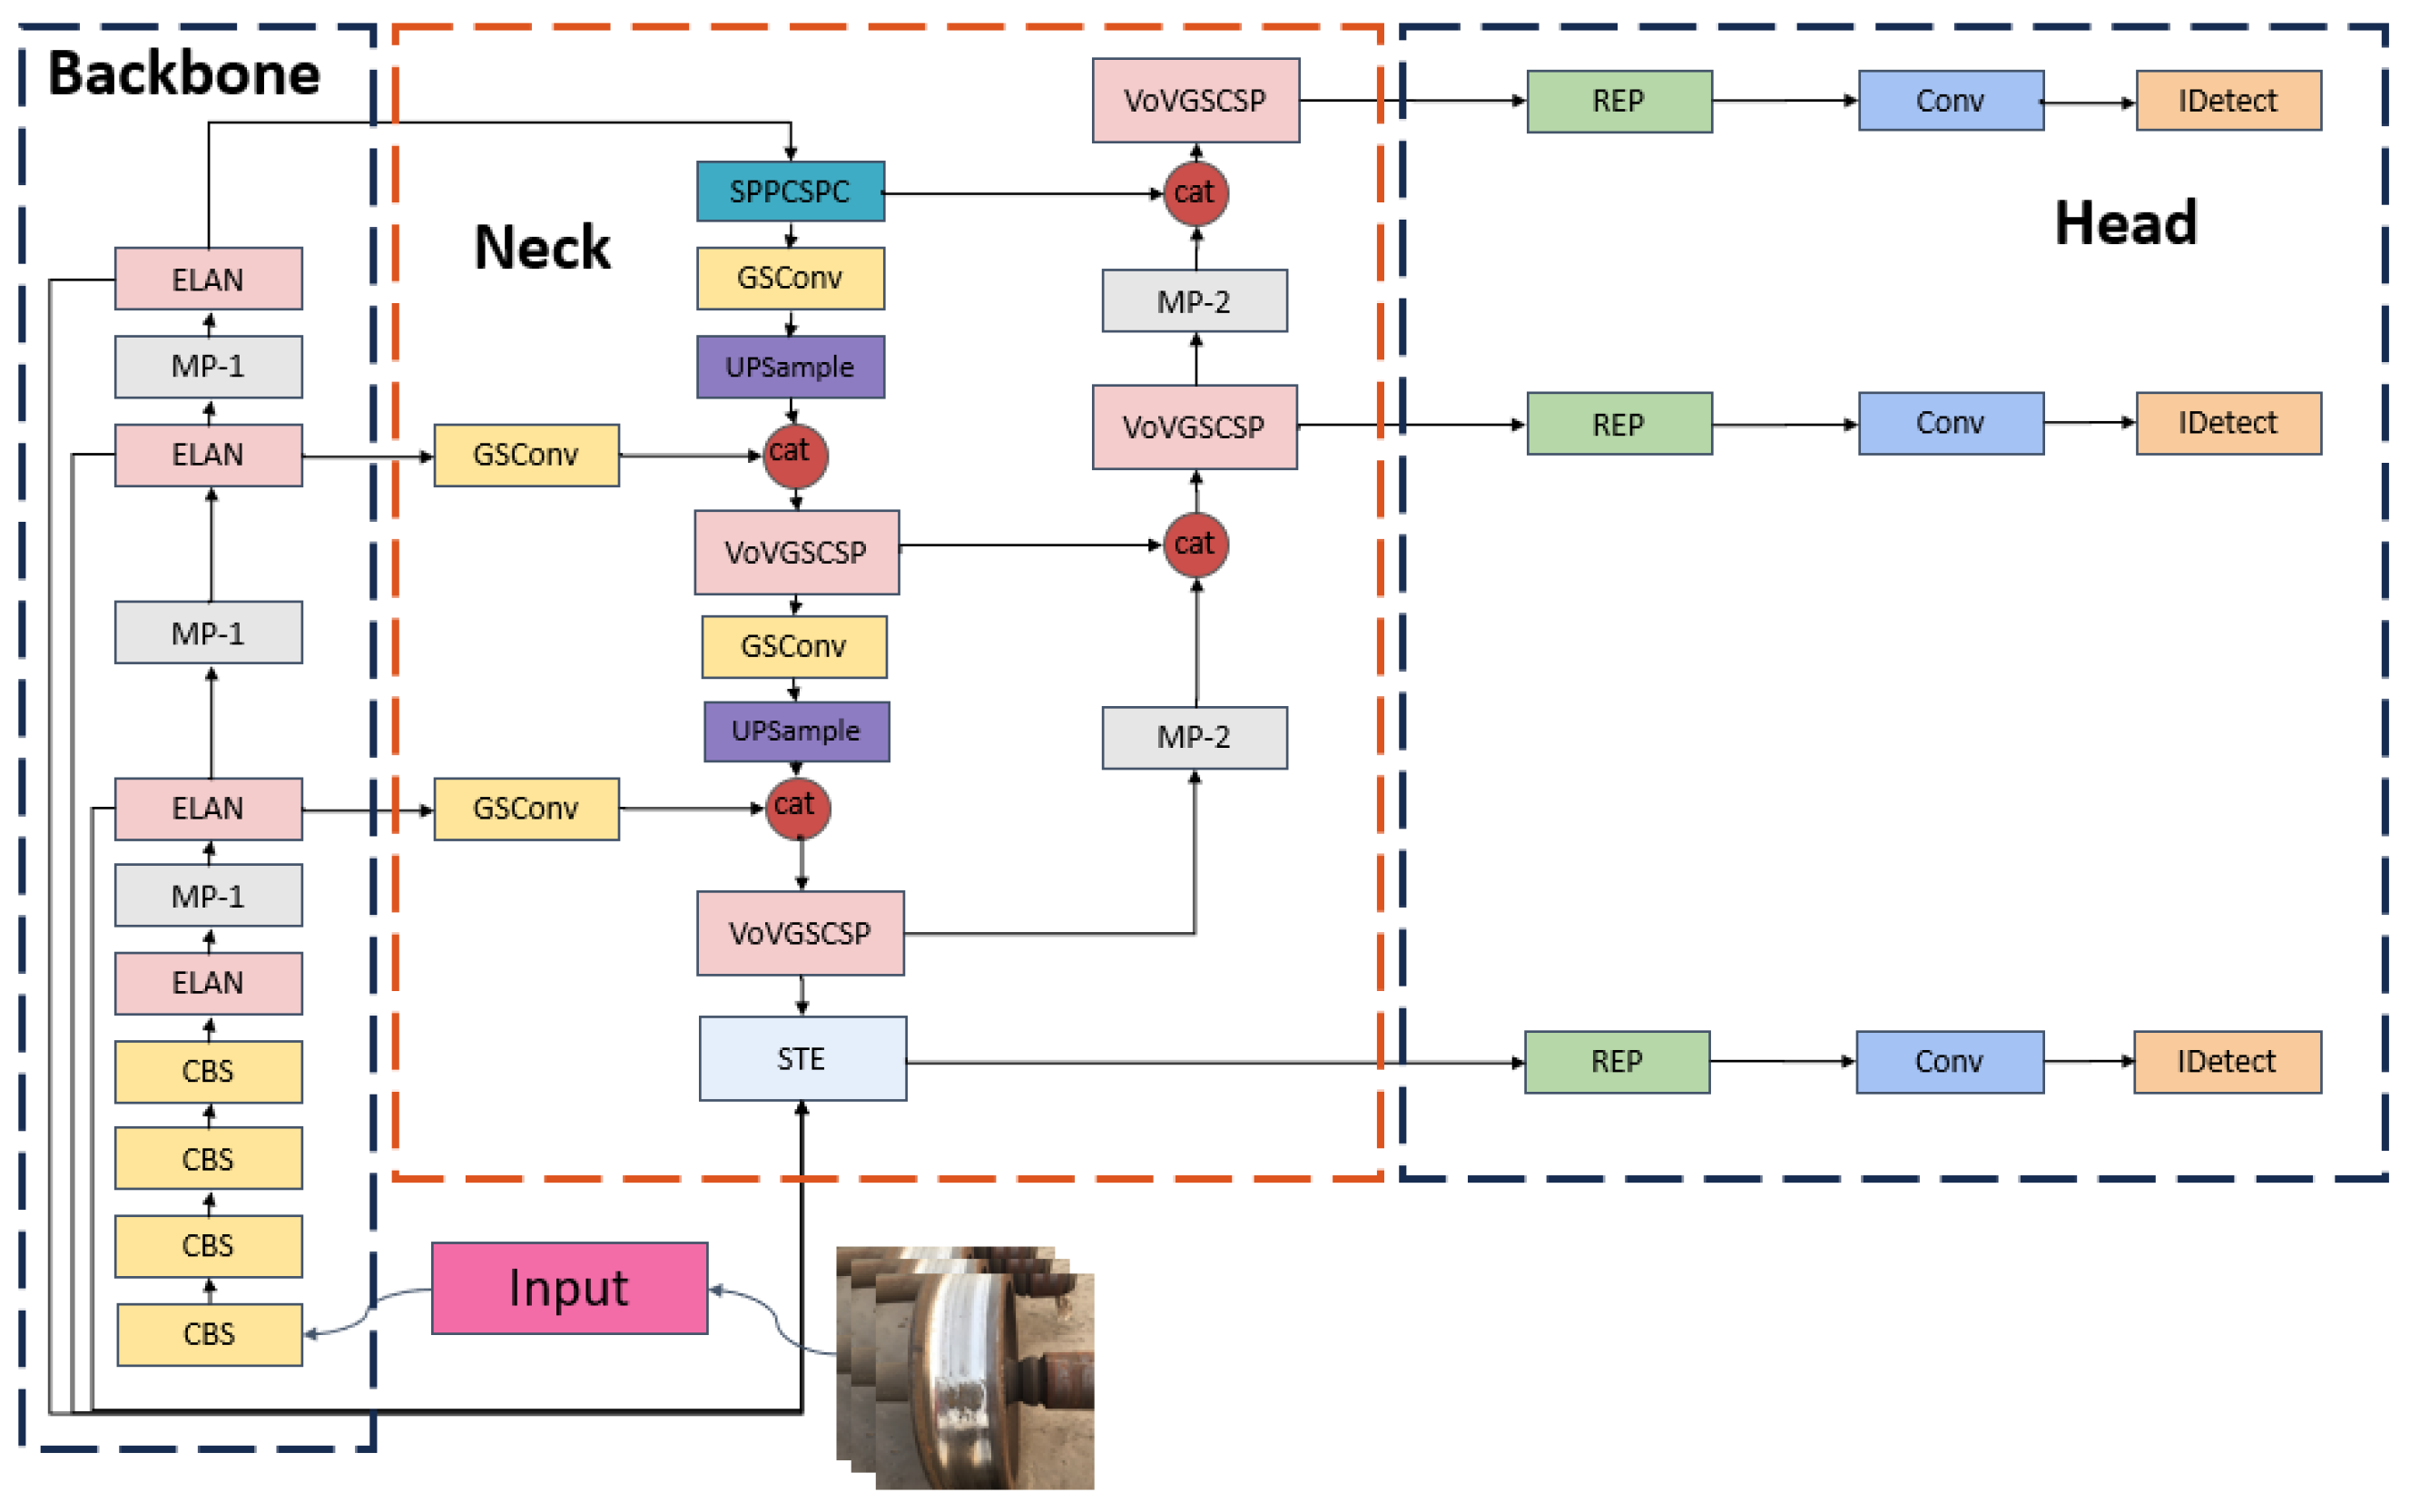
Figure 7.
Small target enhancement module.
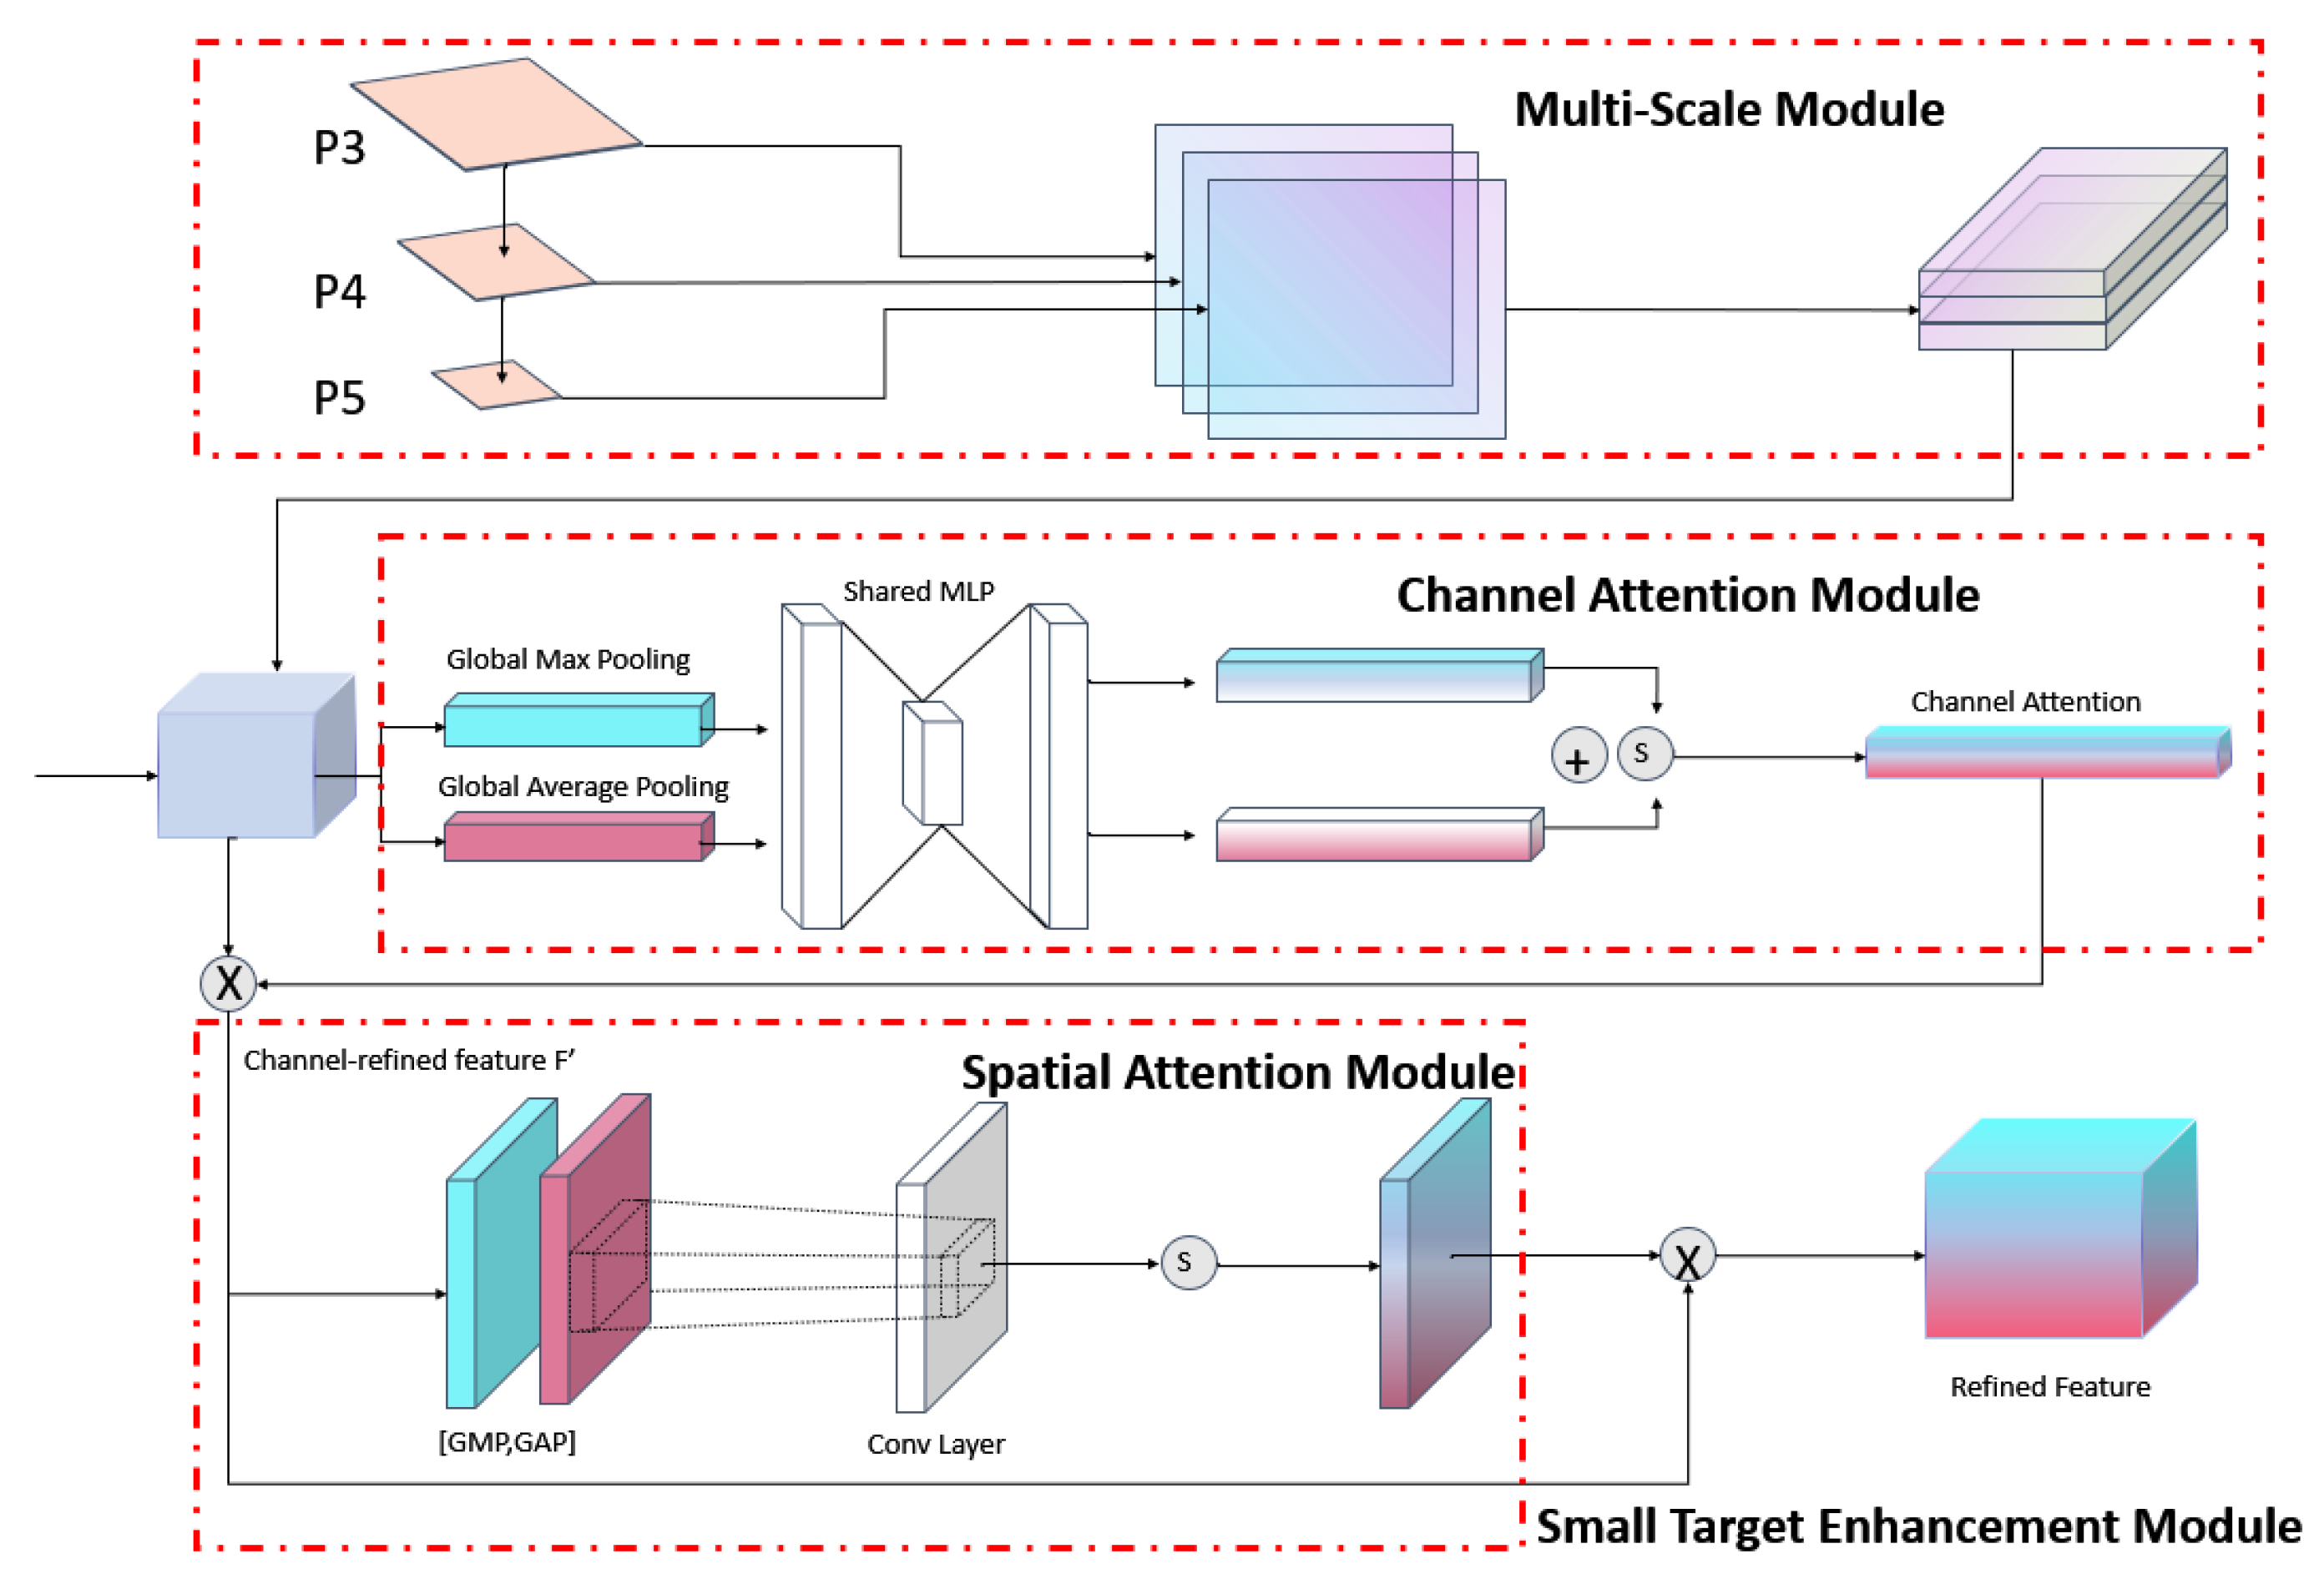
Figure 8.
Comparison of the recognition of pits using different models. (a) Confidence level of YOLOv7-STE detection results. (b) YOLOv7 detection results. (c) YOLOv5 detection results. (d) SSD detection results. (e) Faster R-CNN detection results.
Figure 8.
Comparison of the recognition of pits using different models. (a) Confidence level of YOLOv7-STE detection results. (b) YOLOv7 detection results. (c) YOLOv5 detection results. (d) SSD detection results. (e) Faster R-CNN detection results.
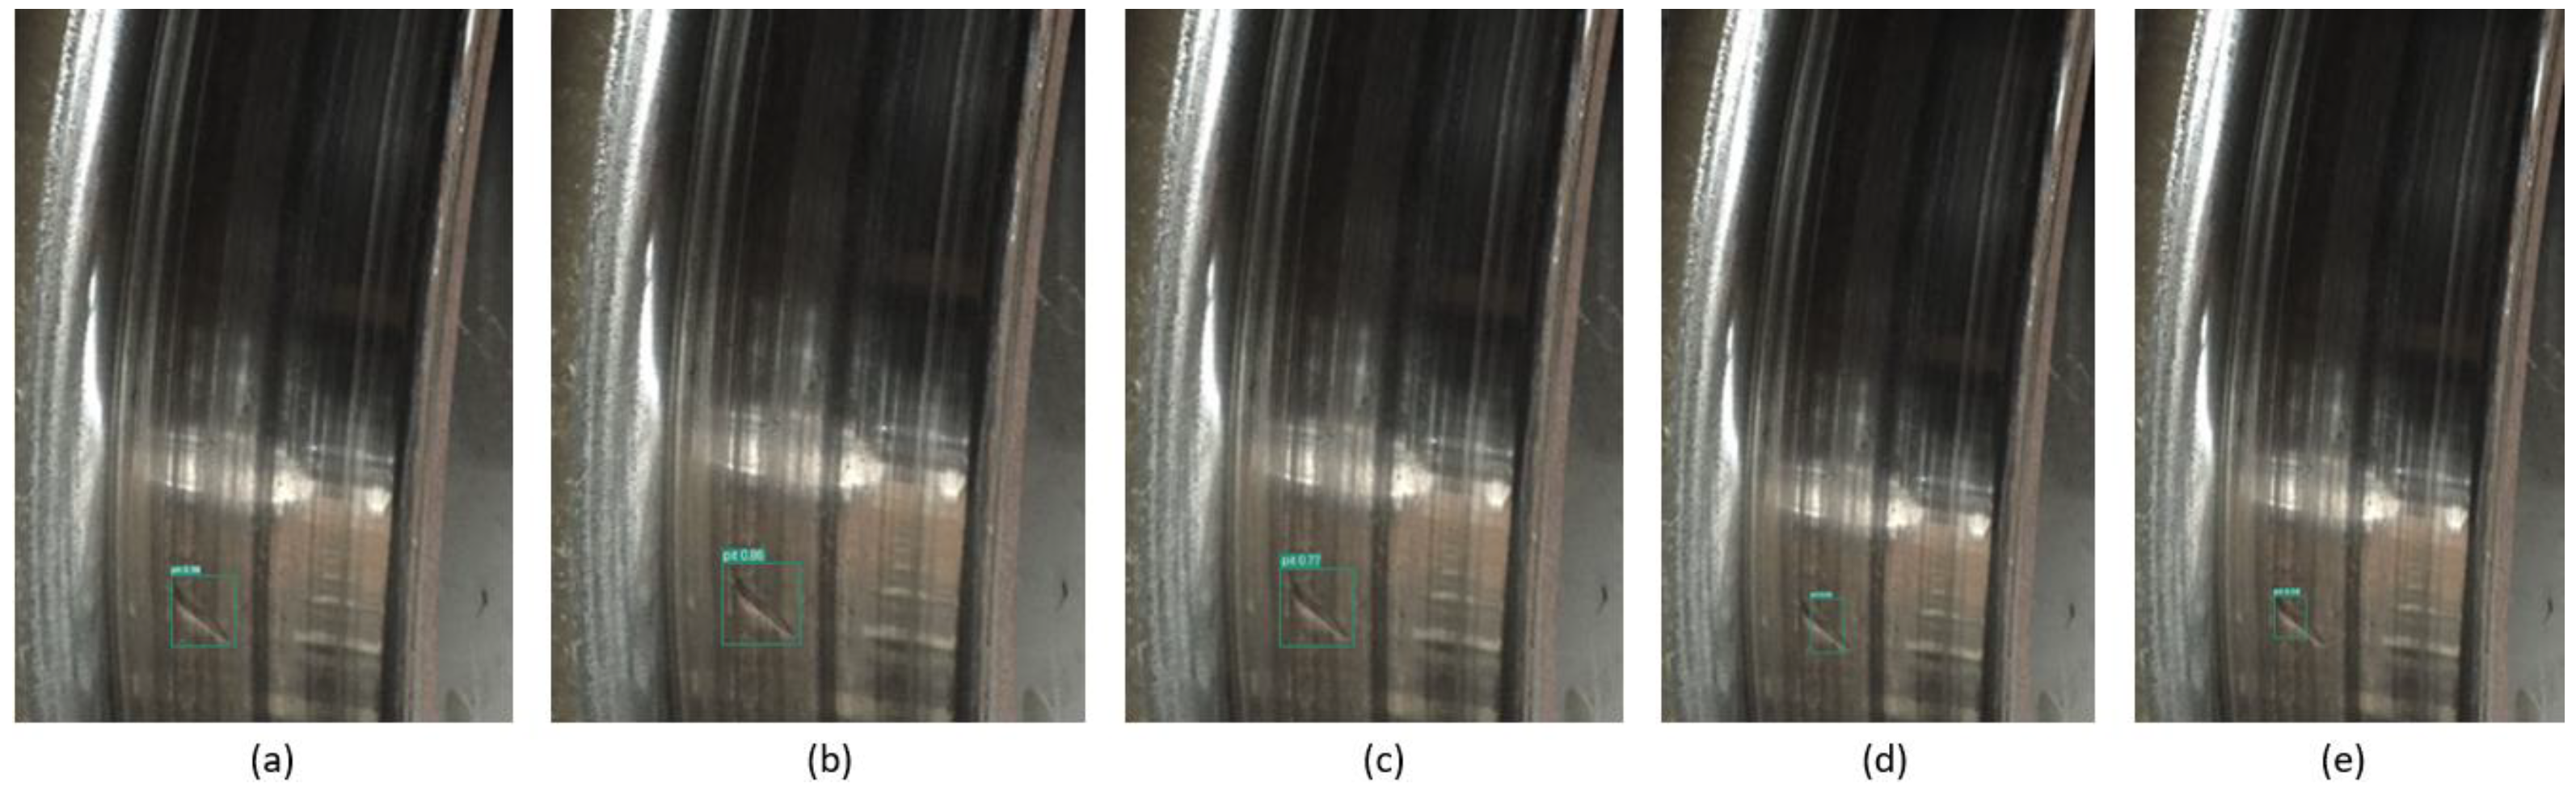
Figure 9.
Comparison of the recognition of bruise using different models. (a) Confidence level of YOLOv7-STE detection results. (b) YOLOv7 detection results. (c) YOLOv5 detection results. (d) SSD detection results. (e) Faster R-CNN detection results.
Figure 9.
Comparison of the recognition of bruise using different models. (a) Confidence level of YOLOv7-STE detection results. (b) YOLOv7 detection results. (c) YOLOv5 detection results. (d) SSD detection results. (e) Faster R-CNN detection results.
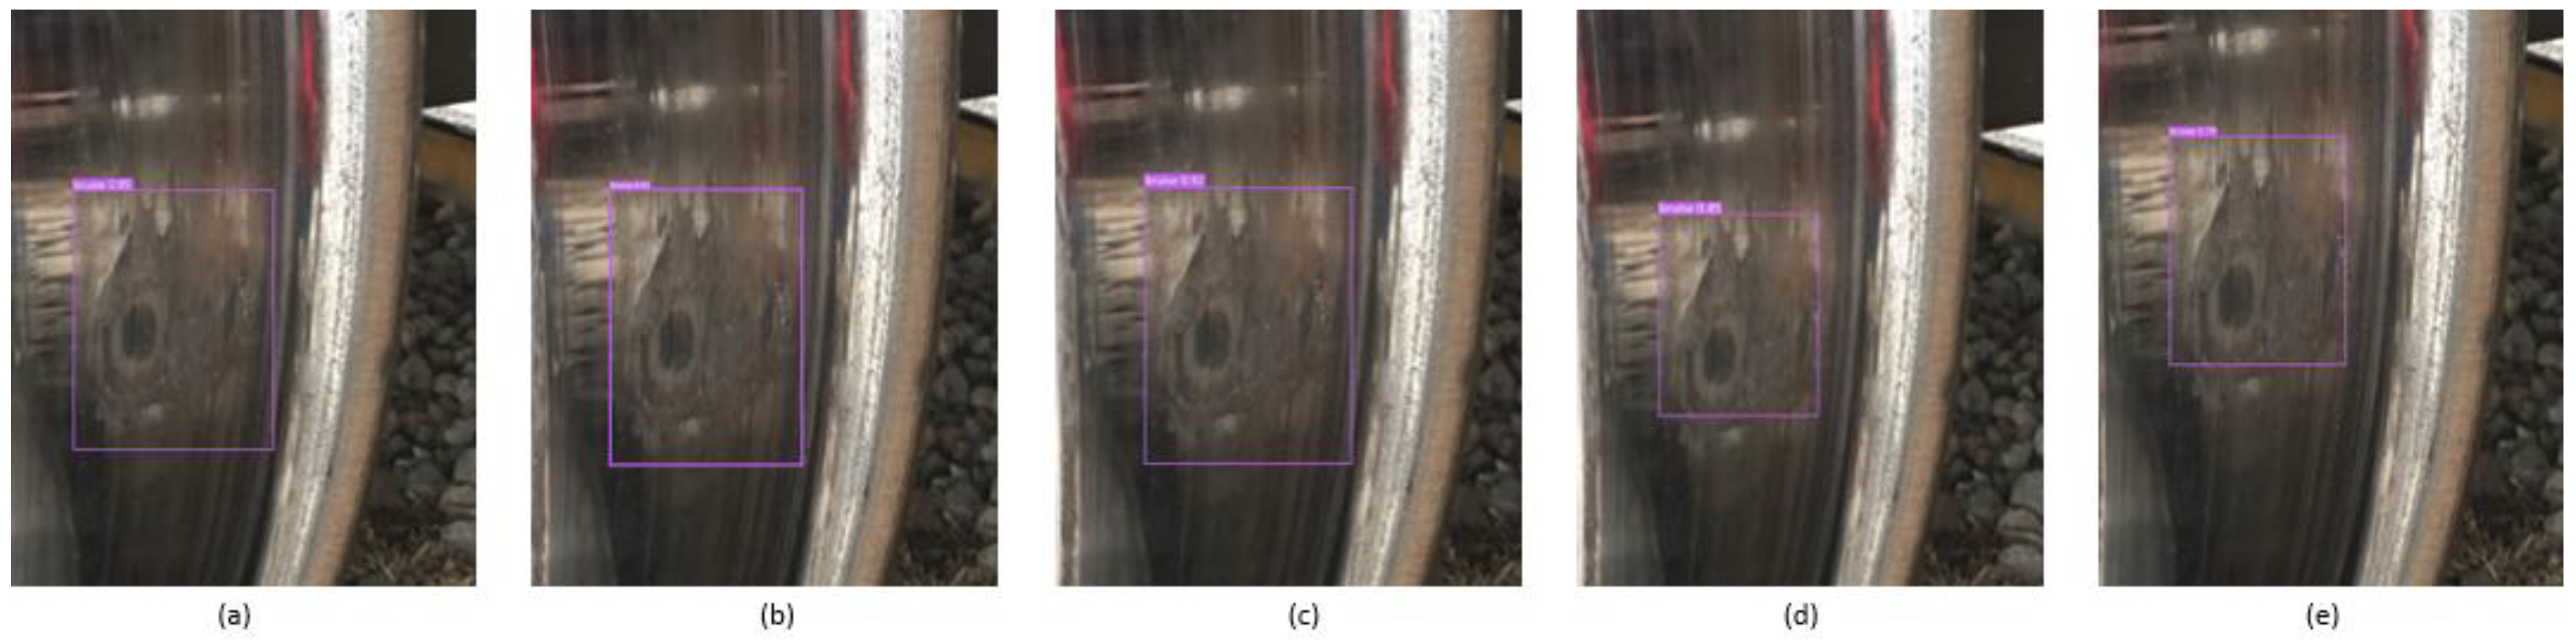
Figure 10.
Comparison of the recognition of peel using different models. (a) Confidence level of YOLOv7-STE detection results. (b) YOLOv7 detection results. (c) YOLOv5 detection results. (d) SSD detection results. (e) Faster R-CNN detection results.
Figure 10.
Comparison of the recognition of peel using different models. (a) Confidence level of YOLOv7-STE detection results. (b) YOLOv7 detection results. (c) YOLOv5 detection results. (d) SSD detection results. (e) Faster R-CNN detection results.
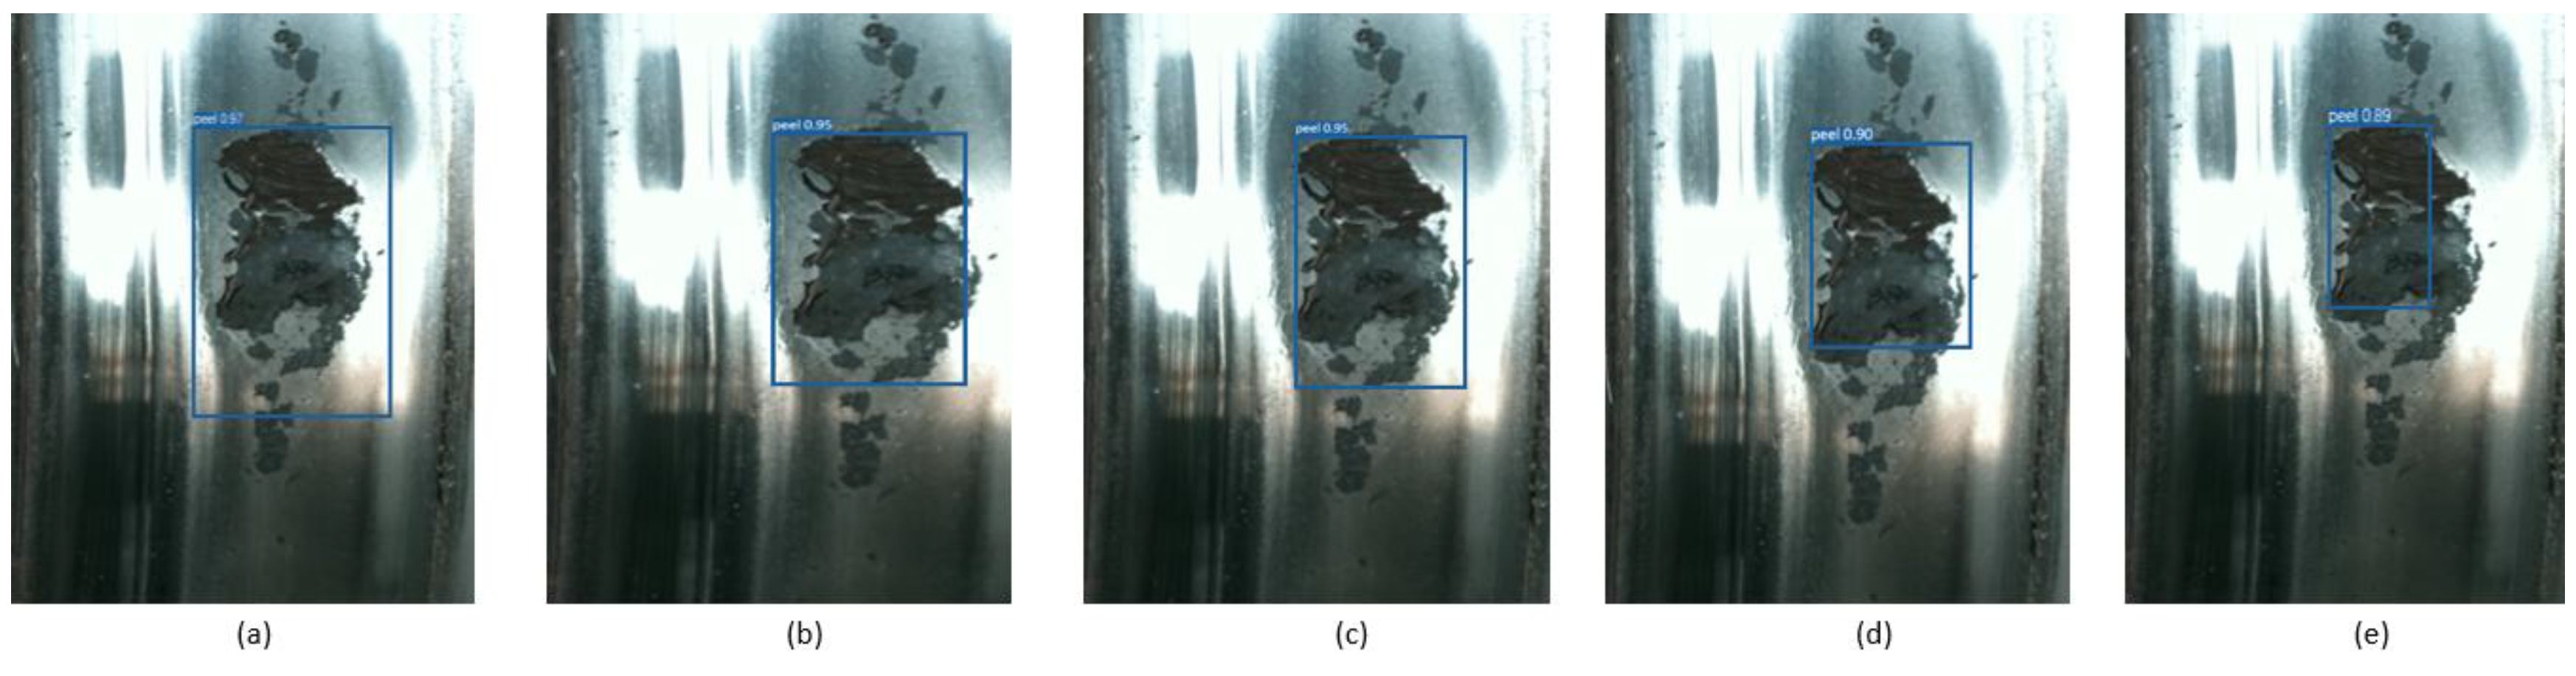
Figure 11.
Different models are used to detect RSDDs datasets. (a) Confidence level of YOLOv7-STE detection results. (b) YOLOv7 detection results. (c) YOLOv5 detection results. (d) SSD detection results. (e) Faster-RCNN detection results.
Figure 11.
Different models are used to detect RSDDs datasets. (a) Confidence level of YOLOv7-STE detection results. (b) YOLOv7 detection results. (c) YOLOv5 detection results. (d) SSD detection results. (e) Faster-RCNN detection results.
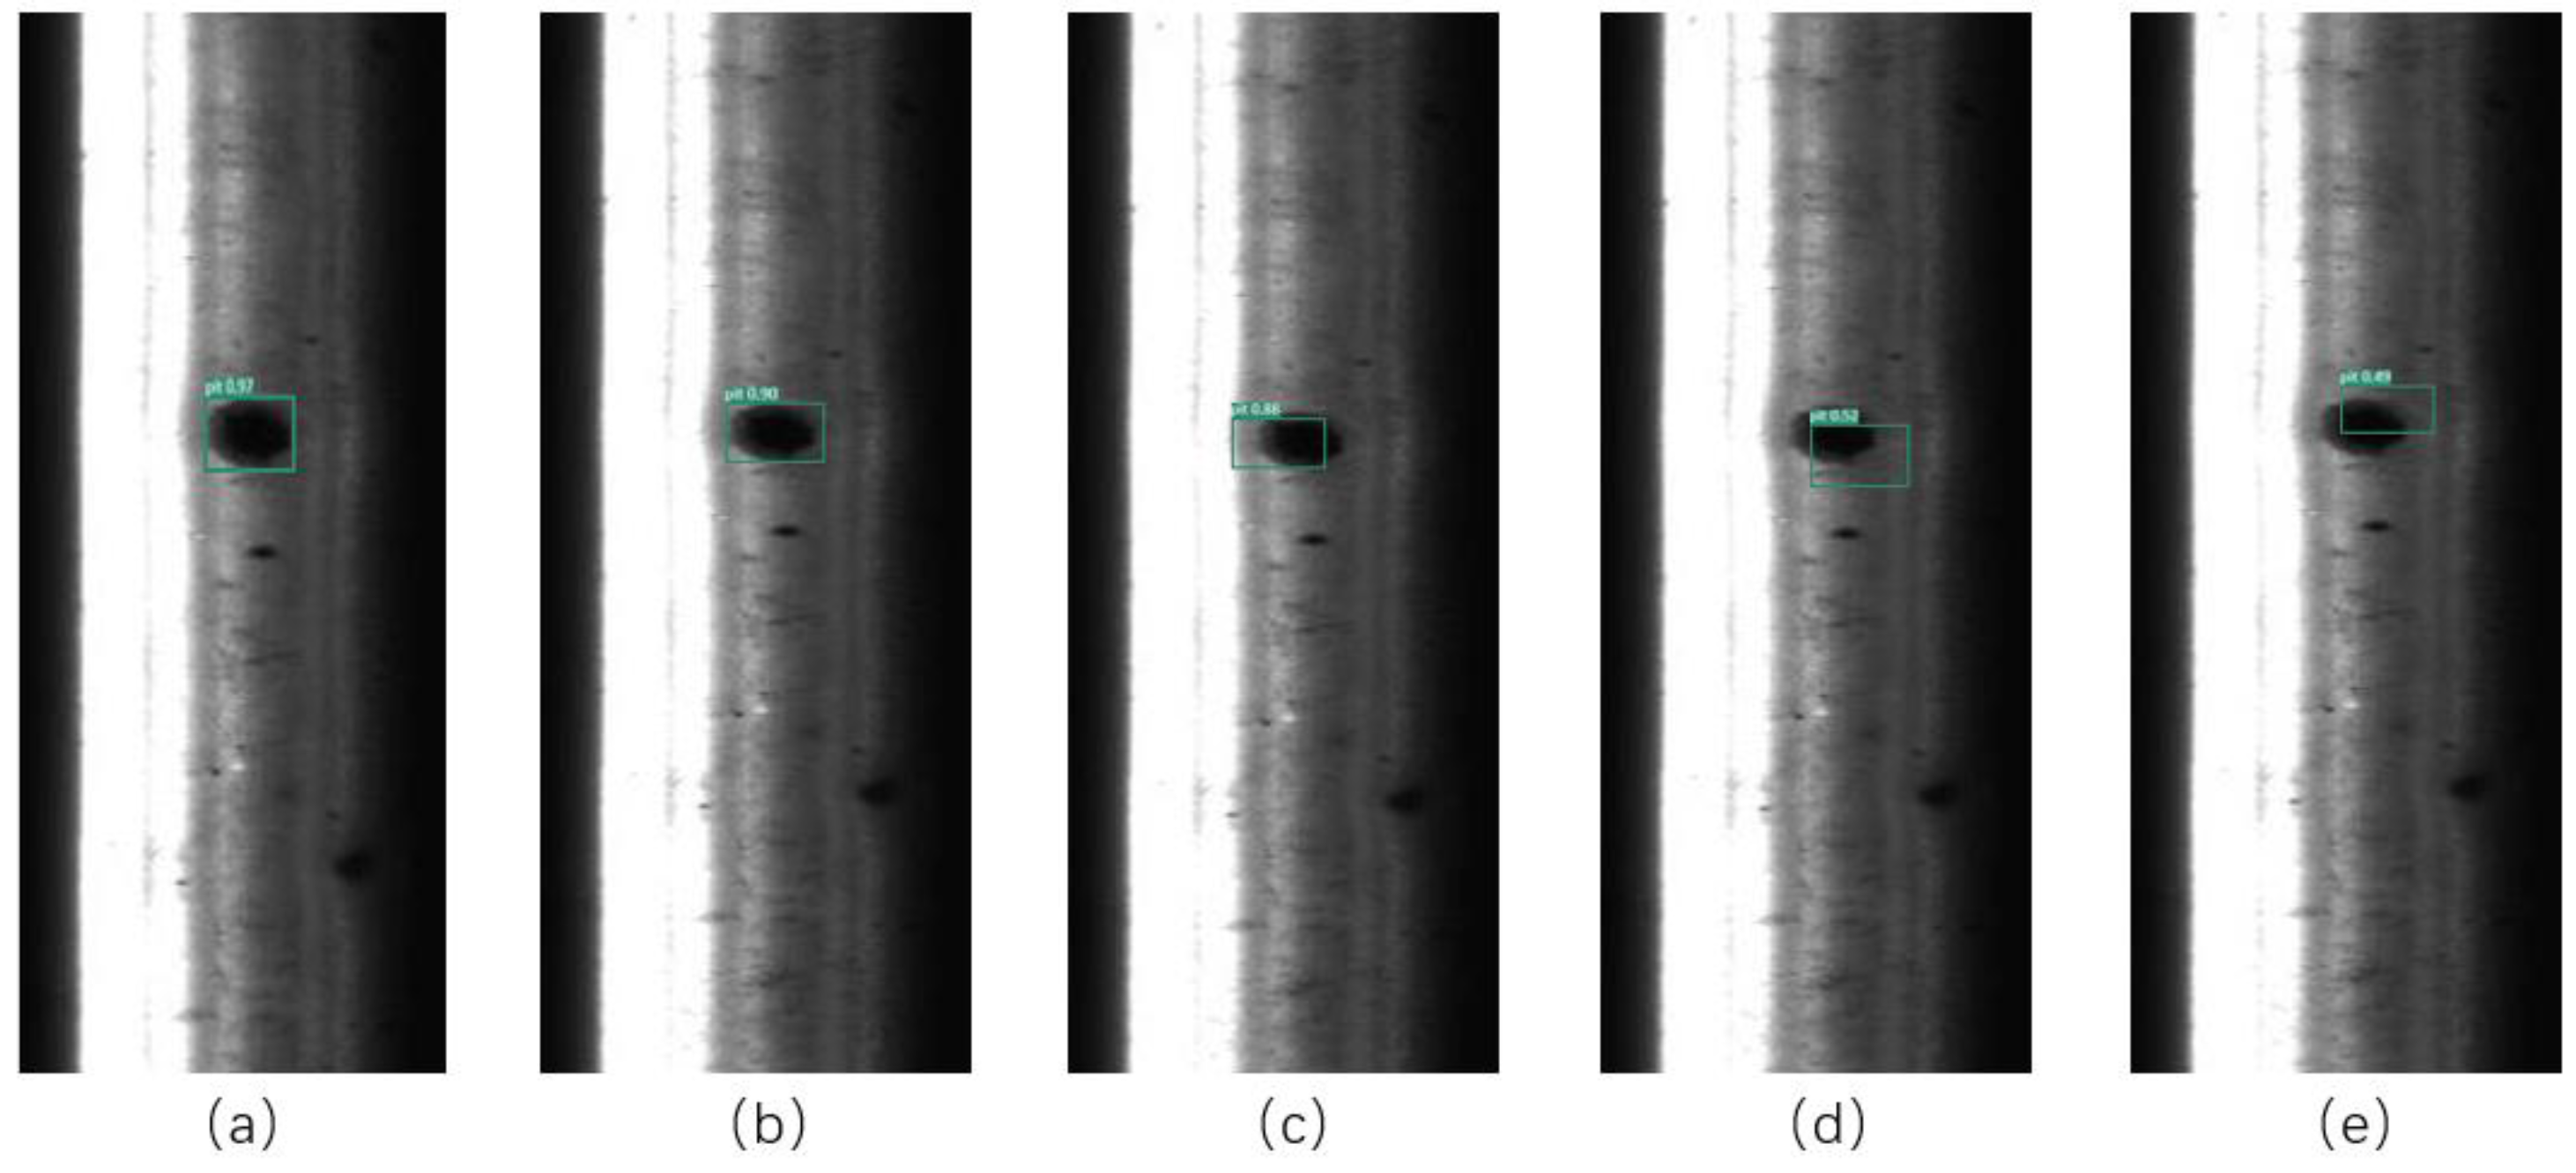

Table 1.
Target statistics of wheelset defects.
| Categories | Number of targets | |||
|---|---|---|---|---|
| Training set | Validation set | Test set | ||
| pit | 720 | 40 | 40 | |
| bruise | 720 | 40 | 40 | |
| peel | 720 | 40 | 40 | |
| total | 2160 | 120 | 120 | |
Table 2.
Experimental environment configuration.
| Hardware and Software | Configuration Parameter |
| Computer | Operating System: Windows10 |
| CPU: Intel(R) Core (TM) i9-9900K CPU@3.60GHz | |
| GPU: NVIDIA GeForce RTX 3090 | |
| RAM: 16 GB | |
| Video memory: 24 GB | |
| Software version | Python3.9.12 + PyTorch1.9.1 + CUDA11.7 + cuDNN8.2.1 + Opencv4.5.5+Visual Studio Code2022 (1.69.1) |
Table 3.
Training network parameters.
| Parameter | Value |
|---|---|
| Batch size | 64 |
| Learning rate | 0.01 |
| Warm-up epochs | 3 |
| Number of iterations | 120 |
| Momentum parameter | 0.937 |
| Image size | 640 × 640 |
| Optimizer | SGD |
Table 4.
Comparison of various detection models.
| Model | Parameter size (MB) | mAP@0.5 (%) | mAP@0.5, 0.95(%) | FPS |
|---|---|---|---|---|
| YOLOv7-STE | 61.09 | 97.3 | 62.9 | 76.3 |
| YOLOv7 | 135 | 95.7 | 52.77 | 74.4 |
| YOLOv5 | 155.78 | 86.6 | 49.5 | 72.3 |
| SSD | 183.2 | 48.67 | 39.06 | 35.4 |
| Faster R-CNN | 216 | 59.33 | 33.6 | 8.64 |
Table 5.
Comparison of different IoUs.
| Loss function | Model volume | mAP@0.5, 0.95 | mAP@0.5(%) | |||
|---|---|---|---|---|---|---|
| (MB) | (%) | all classes | pit | peel | bruise | |
| CIoU | 135 | 51.33 | 93.9 | 91.6 | 97.3 | 92.9 |
| WIoU | 135 | 51.44 | 94.1 | 90 | 99.5 | 93 |
| SIoU | 135 | 51.34 | 93.9 | 91.5 | 97.3 | 93 |
| DIoU | 135 | 51.69 | 94.6 | 91.1 | 99.2 | 93.6 |
| EIoU | 135 | 52.77 | 95.7 | 92.6 | 99.5 | 95.1 |
Table 6.
Ablation experiments.
| GSConv | STE | EIoU | Model Volume | mAP@0.5, 0.95 | mAP@0.5(%) | FPS | |||
|---|---|---|---|---|---|---|---|---|---|
| (MB) | (%) | all classes | pit | peel | bruise | ||||
| √ | 135 | 52.77 | 95.7 | 92.6 | 99.5 | 95.1 | 74.4 | ||
| √ | √ | 51 | 49.9 | 92.3 | 82.4 | 99.5 | 95.2 | 87.1 | |
| √ | √ | 149 | 51.12 | 95.9 | 97 | 96.9 | 93.8 | 61.3 | |
| √ | √ | √ | 61.09 | 54.9 | 97.3 | 96.8 | 99.6 | 95.4 | 76.3 |
Disclaimer/Publisher’s Note: The statements, opinions and data contained in all publications are solely those of the individual author(s) and contributor(s) and not of MDPI and/or the editor(s). MDPI and/or the editor(s) disclaim responsibility for any injury to people or property resulting from any ideas, methods, instructions or products referred to in the content. |
© 2025 by the authors. Licensee MDPI, Basel, Switzerland. This article is an open access article distributed under the terms and conditions of the Creative Commons Attribution (CC BY) license (http://creativecommons.org/licenses/by/4.0/).
Copyright: This open access article is published under a Creative Commons CC BY 4.0 license, which permit the free download, distribution, and reuse, provided that the author and preprint are cited in any reuse.


